As filed with the Securities and Exchange Commission on January 7, 2013
UNITED STATES
SECURITIES AND EXCHANGE COMMISSION
Washington, D.C. 20549
FORM N-CSR
CERTIFIED SHAREHOLDER REPORT OF REGISTERED
MANAGEMENT INVESTMENT COMPANIES
Investment Company Act file number 811-08348
LORD ASSET MANAGEMENT TRUST
(Exact name of Registrant as specified in charter)
440 South LaSalle Street
Chicago, Illinois 60605-1028
(Address of principal executive offices) (Zip code)
Thomas S. White
Thomas White International, Ltd.
440 South LaSalle Street
Chicago, Illinois 60605-1028
(Name and address of agent for service)
(312) 663-8300
Registrant’s telephone number, including area code
Date of fiscal year end: 10/31
Date of reporting period: 11/01/11 – 10/31/12
Item 1. Reports to Stockholders.


ANNUAL REPORT
OCTOBER 31, 2012
THE INTERNATIONAL FUND
THE EMERGING MARKETS FUND
THE AMERICAN OPPORTUNITIES FUND
| | |
 | | Thomas White International Fund
Best International Multi-Cap Core Fund 10-Years ended 11/30/2011 Among 26 funds for risk adjusted performance |

Visit our websites, and travel country to country as we chronicle the world’s transformation into an exciting global marketplace.
www.thomaswhite.com
Experience the enhanced features of our Thomas White Global Investing website, and explore the panorama of trends, economic indicators and policy changes shaping our ever-changing global marketplace.
www.thomaswhitefunds.com
Please visit the Thomas White Funds website, designed to provide you with easy access to important information on our three fund offerings including performance, rankings and commentaries.
www.thomaswhite.com/for-financial-professionals/
The Thomas White Financial Professional website serves the financial advisor community with exclusive insights, such as emerging market white papers, and in-depth product information on all of our strategies.
A Lipper Fund Award is awarded to one fund in each Lipper classification for achieving the strongest trend of consistent risk-adjusted performance against its classification peers over a three, five or ten-year period. Although Lipper makes reasonable efforts to ensure the accuracy and reliability of the data contained herein, the accuracy is not guaranteed by Lipper. Users acknowledge that they have not relied upon any warranty, condition, guarantee, or representation made by Lipper. Any use of the data for analyzing, managing, or trading financial instruments is at the user’s own risk. This is not an offer to buy or sell securities. Lipper Analytical Services, Inc. is an independent mutual fund research and rating service.
(This page is not part of the Annual Report.)

CONTENTS
THOMAS S. WHITE, JR.
The Funds’ Chairman and Portfolio Manager

ThomasWhite is the Funds’ Chairman of the Board of Trustees and Portfolio Manager. He has 46 years of investment experience, dating back to 1966 when he began his career at Goldman Sachs. Tom’s interests have always been global. As a boy he grew up around the world, living and traveling throughout Europe, North America and the Far East before graduating from Duke University with an economics degree in 1965. Over his forty-six years as an investment manager, he has been with Lehman Brothers, Blyth Eastman Dillon and Morgan Stanley, where he spent
14 years as a Managing Director. While at Morgan Stanley, Tom served as Chief Investment Officer for the firm’s U.S. value-style equity group.Thomas White International, Ltd. was founded in 1992. It was initially named Lord Asset Management until 1997. Mr. White directs the management of portfolios in Europe, Africa, North America, Latin America, Japan and Asia. He is the senior professional in a team of seasoned security analysts who have been with the firm for many years. The firm’s research division produces monthly valuations covering over 3,000 companies in 45 countries.
www.thomaswhitefunds.com
Message to Shareholders
December 28, 2012
Dear Shareholders and Friends,
We are delighted to welcome all of our many new shareholders and their investment advisors. You have joined a growing number of individuals and organizations who have entrusted Thomas White International to manage a portion of their investments. Given our growth in assets under management, we continue to expand the number of our professionals, including adding analysts to our research team located in Chicago and Bangalore, India. These well-trained individuals search around the clock to discover the undervalued investment opportunities that drive our performance.
Thomas White International is just as committed to supporting the investment advisors who work closely with our shareholders. We recognize their need to have access to our professionals and stay aware of our market strategy and stock selection. To keep our shareholders aware of significant world trends, we publish numerous reports analyzing the countries and industries our analysts cover. Their emerging
market reports regularly feature powerful business leaders, describing how they’ve overcome the challenges in these countries to build successful businesses. The reports are available to read and subscribe to on our popular website “Thomas White Global Investing” at www.thomaswhite.com.
Economic Outlook: Developed Country Policies Have Only Produced Slow Growth.
While growth in most of the emerging market countries quickly recovered after 2008, policy efforts over the last four years to stimulate a normal economic recovery in the developed countries have not been successful. In the United States, the Federal Reserve (Fed), having early on lowered the federal funds rate to near 0%, now has a program buying $40B agency mortgage-backed securities monthly and the monthly purchases of $45B Treasury securities with longer maturities. Moreover, the Fed has adopted full employment as a second official mission objective, stating that its current aggressive stance will continue until U.S. unemployment falls to 6.5%.
| | |
| 2 | | www.thomaswhitefunds.com |
| | | | | | | | | | | | | | | | | | | | | | | | | | | | | | | | | | |
| | | | | | | | Developed Markets | | | Emerging Markets | |
| | | | | World | | | USA | | | Europe# | | | Japan | | | China | | | India | | | Brazil | | | Russia | |
| Country | | 2012* | | | 100% | | | | 21.80% | | | | 21.00% | | | | 6.40% | | | | 16.40% | | | | 6.40% | | | | 2.90% | | | | 3.50% | |
GDP Weight
(% of World) | | Rank | | | - | | | | 1 | | | | 2 | | | | 4 | | | | 3 | | | | 5 | | | | 9 | | | | 7 | |
| World Population | | Rank | | | - | | | | 4 | | | | 3 | | | | 12 | | | | 1 | | | | 2 | | | | 6 | | | | 10 | |
| World Land Mass | | Rank | | | - | | | | 3 | | | | 7 | | | | 64 | | | | 4 | | | | 8 | | | | 5 | | | | 1 | |
| Economic Growth | | 2008 | | | 2.80% | | | | -0.30% | | | | 0.40% | | | | -1.00% | | | | 9.60% | | | | 6.90% | | | | 5.20% | | | | 5.20% | |
| (Annual Rate) | | 2009 | | | -0.60% | | | | -3.10% | | | | -4.40% | | | | -5.50% | | | | 9.20% | | | | 5.90% | | | | -0.30% | | | | -7.80% | |
| | | 2010 | | | 5.10% | | | | 2.40% | | | | 2.00% | | | | 4.50% | | | | 10.40% | | | | 10.10% | | | | 7.50% | | | | 4.30% | |
| | | 2011 | | | 3.80% | | | | 1.80% | | | | 1.40% | | | | -0.80% | | | | 9.20% | | | | 6.80% | | | | 2.70% | | | | 4.30% | |
| | | 2012 | | | 3.30% | | | | 2.20% | | | | -0.40% | | | | 2.20% | | | | 7.80% | | | | 4.90% | | | | 1.50% | | | | 3.70% | |
| | | 2013 | | | 3.60% | | | | 2.10% | | | | 0.20% | | | | 1.20% | | | | 8.20% | | | | 6.00% | | | | 4.00% | | | | 3.80% | |
| Govt Fiscal | | 2008 | | | -2.20% | | | | -6.70% | | | | -2.10% | | | | -4.10% | | | | -0.70% | | | | -8.70% | | | | -1.30% | | | | 4.90% | |
| Surplus/Deficit | | 2009 | | | -7.40% | | | | -13.30% | | | | -6.40% | | | | -10.40% | | | | -3.10% | | | | -10.00% | | | | -3.00% | | | | -6.30% | |
| (Annual Rate) | | 2010 | | | -6.00% | | | | -11.20% | | | | -6.20% | | | | -9.40% | | | | -1.50% | | | | -9.40% | | | | -2.70% | | | | -3.50% | |
| | | 2011 | | | -4.60% | | | | -10.10% | | | | -4.10% | | | | -9.80% | | | | -1.20% | | | | -9.00% | | | | -2.60% | | | | 1.60% | |
| | | 2012 | | | -4.20% | | | | -8.70% | | | | -3.30% | | | | -10.00% | | | | -1.30% | | | | -9.50% | | | | -2.10% | | | | 0.50% | |
| | | 2013 | | | -3.50% | | | | -7.30% | | | | -2.60% | | | | -9.10% | | | | -1.00% | | | | -9.10% | | | | -1.60% | | | | 0.20% | |
| Govt Debt to GDP | | 2008 | | | 66% | | | | 76% | | | | 70% | | | | 192% | | | | 17% | | | | 74% | | | | 64% | | | | 8% | |
(% of GDP) | | 2009 | | | 76% | | | | 90% | | | | 80% | | | | 210% | | | | 18% | | | | 74% | | | | 77% | | | | 11% | |
| | | 2010 | | | 80% | | | | 99% | | | | 85% | | | | 215% | | | | 34% | | | | 68% | | | | 65% | | | | 12% | |
| | | 2011 | | | 80% | | | | 103% | | | | 88% | | | | 230% | | | | 26% | | | | 67% | | | | 65% | | | | 12% | |
| | | 2012 | | | 81% | | | | 107% | | | | 94% | | | | 237% | | | | 22% | | | | 68% | | | | 64% | | | | 11% | |
| | | 2013 | | | 81% | | | | 112% | | | | 95% | | | | 245% | | | | 20% | | | | 67% | | | | 61% | | | | 10% | |
*A country’s weight within the world economy is based on 2012 Purchasing Power Parity (source International Monetary Fund).
#Euro Area
2012-13 are Oct 2012 IMF projections.
Will the Aggressive Central Bank Actions Now in Place in Europe, Japan and by the Federal Reserve Eventually Stimulate Growth?
Since their peak on March 31, 2008, Federal Reserve data shows U.S. mortgage debt has
declined every quarter and is now down 11% to $1.140 trillion. Total consumer debt, which also includes auto loans, student debt and credit cards, is up $176 billion, so combined consumer debt is down 7% to $955B. As consumption represents 70% of
| | | | |
| www.thomaswhitefunds.com | | | 3 | |
U.S. Gross Domestic Product (GDP) growth, this shows consumer spending is the main reason for the slow recovery.
Debt levels over the same period at state and local governments are up 5% to $156B and business debt rose 9% to $998B. The Federal government’s debt increased a record $6.313 trillion dollars over last 18 quarters! This represents what the Treasury had to borrow from the Fed to fund its deficit spending over this period. The U.S. Treasury had no choice but to have the Fed buy these bonds since foreign holdings of U.S. debt only rose $96B. This explains why the Federal Reserve’s ownership of Treasury securities has risen so sharply since 2008.
We Feel the Government’s Aggressive Deficit Spending, Which Has Been Financed by Expanding the Leverage at the Federal Reserve Bank, Will Produce a Decade of Below Average Growth with Low Inflation.
Why has such a massive amount of government spending over the last 4 years only resulted in a disappointing 1-2% GDP growth? The primary reason is that 95% of the spending went into supporting an excessive level of consumption promised by the politicians even though the country’s revenues could not justify these expenditures. We believe this money should have been spent as investments in the country’s infrastructure, in scientific research and in improving educational standards. Without investing in the nation’s future, as is done in Asia and the Scandinavian countries, the U.S. standard of living will likely continue to fall.
Given we do not see any immediate changes in the government’s priorities, we project sluggish U.S. growth will continue in 2013 and inflation will remain under 2%. Moreover, our intuition tells us that the enormous amount of debt created over this period may eventually produce a number of unintended consequences involving either deflation or high inflation. A more prudent strategy would be to face reality and convince the country’s citizens that they would be better off in the long-run to endure the short-term pain of cutting consumer support and the ensuing mounting debt, and in turn, invest some of that money saved in areas that would generate growth and employment.
Our Portfolio Strategy
Most of the central banks in the developed countries are now aggressively attempting to stimulate their economies. Using quantitative easing, they are pushing down longer-term interest rates as the shorter maturities are already near zero. With limited capital gains potential left in investment grade fixed income, we feel that a certain amount of the growing liquidity generated by the central banks’ actions will find its way into the global stock markets.
We feel that investors will be well served owning sound companies doing business globally. While equities are the most volatile asset class, history shows they have produced superior, inflation-adjusted returns over the long term. Well-run companies with prudent balance sheets have demonstrated the ability to survive a wide range of economic and business storms and come back more valuable than before. By being
| | |
| 4 | | www.thomaswhitefunds.com |
able to handle these challenging times better than their weaker competitors, these companies should be able to use their advantages in scale, lower costs and greater access to capital to increase market share in their industries and acquire valuable companies or divisions at fire sale prices. Like us, company managers with long-term horizons recognize that difficult environments can offer exceptional buying opportunities.
Your Portfolio Manager and Many Members of Our Research Team Are Fellow Fund Shareholders.
As do many in our firm, I have 100% of my stock market exposure in the Thomas White Funds, including the International Fund, the Emerging Markets Fund and the American Opportunities Fund.
All of us at Thomas White International wish you a happy holiday season and a prosperous New Year.

Thomas S. White, Jr.
Chairman and Portfolio Manager
| | | | |
| www.thomaswhitefunds.com | | | 5 | |
Past performance is not a guarantee of future results.
Opinions expressed are subject to change, are not guaranteed and should not be considered recommendations to buy or sell any security.
Must be preceded or accompanied by a prospectus.
Mutual fund investing involves risk. Principal loss is possible.
Diversification does not assure a profit nor protect against loss in a declining market.
Earnings growth for a Fund holding does not guarantee a corresponding increase in the market value of the holding of the Fund.
The Thomas White Funds are distributed by Quasar Distributors, LLC.
The MSCI World Index is a free float-adjusted market capitalization weighted index that is designed to measure the equity market performance of developed markets. The MSCI All Country World Index is a free float-adjusted market capitalization weighted index that is designed to measure the equity market performance of developed and emerging markets. One cannot invest directly in an index.
Cash flow: Measures the cash generating capability of a company by adding non-cash charges (e.g. depreciation) and interest expense to pretax income.
Investment grade: Bonds that are judged by a registered nationally recognized statistical rating organization rating agency as having a relatively low risk of default.
| | |
| 6 | | www.thomaswhitefunds.com |
INTERNATIONAL STOCK MARKET PERFORMANCE
The MSCI World Index has had a more consistent performance pattern over the last 40 years than any of its regional sub-indices.
| | | | | | | | | | | | | | | | | | | | | | | | | | | | |
MSCI
INDICES
(US$) | | The regional performance order in each 5-year period is
shown as rank #1 (best) to #5 (worst) as of October 31, 2012. | |
5-YEAR
RETURN
PERIODS | | MSCI
WORLD | | | MSCI AC
WORLD1 | | | EUROPE* | | | USA | | | JAPAN | | | PACIFIC
EX-JAPAN* | | | EMERGING1 | |
| 1970-1974 | | | -1.3% | | | | | | | | -0.9% (#2) | | | | -3.4% (#3) | | | | 16.0% (#1) | | | | -6.2% (#4) | | | | | |
| | | | | | | | |
| 1975-1979 | | | 16.0% | | | | | | | | 18.9% (#2) | | | | 13.3% (#4) | | | | 18.8% (#3) | | | | 27.5% (#1) | | | | | |
| | | | | | | | |
| 1980-1984 | | | 12.4% | | | | | | | | 6.1% (#3) | | | | 14.5% (#2) | | | | 17.0% (#1) | | | | 4.1% (#4) | | | | | |
| | | | | | | | |
| 1985-1989 | | | 28.0% | | | | 28.1% | | | | 32.3% (#3) | | | | 19.8% (#5) | | | | 41.4% (#2) | | | | 22.4% (#4) | | | | 52.2% (#1) | |
| | | | | | | | |
| 1990-1994 | | | 4.2% | | | | 4.7% | | | | 7.0% (#4) | | | | 9.2% (#3) | | | | -3.4% (#5) | | | | 15.3% (#2) | | | | 20.9% (#1) | |
| | | | | | | | |
| 1995-1999 | | | 20.2% | | | | 19.2% | | | | 22.5% (#2) | | | | 29.7% (#1) | | | | 2.1% (#5) | | | | 5.0% (#3) | | | | 2.0% (#4) | |
| | | | | | | | |
| 2000-2004 | | | -2.0% | | | | -1.8% | | | | 0.4% (#3) | | | | -3.2% (#4) | | | | -6.3% (#5) | | | | 6.6% (#1) | | | | 4.6% (#2) | |
| | | | | | | | |
| 2005-2009 | | | 2.6% | | | | 3.6% | | | | 4.5% (#3) | | | | 0.7% (#4) | | | | -0.7% (#5) | | | | 11.7% (#2) | | | | 15.9% (#1) | |
| | | | | | | | |
| 2010-20122 | | | 6.8% | | | | 6.3% | | | | 2.2% (#4) | | | | 11.1% (#1) | | | | -0.1% (#5) | | | | 7.4% (#2) | | | | 3.1% (#3) | |
| 1970-20122 | | | 9.3% | | | | | | | | 10.2% | | | | 9.6% | | | | 9.0% | | | | 10.1% | | | | | |
| | | | | | | | |
| 1988-20122 | | | 7.1% | | | | 7.3% | | | | 8.7% | | | | 9.8% | | | | -0.4% | | | | 10.4% | | | | 12.6% | |
Source: MSCI
*Developed Markets
1Data beginning January 1, 1988
2Returns through October 31, 2012
Past performance is not a guarantee of future results
History shows that regional returns are random in their timing, with no area holding a monopoly on performance. Note the 1970-2012 regional return range of 9.0% to 10.2% are all close to the 9.3% MSCI World Index return.
Observe that the MSCI World Index has enjoyed a more consistent pattern of returns over this period than most of its sub-indices. This is because regional bull and bear markets have tended to offset one another. The MSCI AC World Index, started in 1988, has outperformed the World Index due to the new added emerging markets stocks, but retained the
latter’s pattern of more consistent returns due to its even broader diversification.
Investors who invest globally by owning Thomas White’s American Opportunities, International and Emerging Markets Funds could benefit from the potential for smoother performance inherent in the Funds’ portfolios as they are diversified across industries, countries and currencies.
In falling market environments, less volatile performance can encourage investors to stay the course. This should help promotes success in reaching one’s long-term investment goals.
Diversification does not assure a profit nor protect against loss in a declining market.
| | | | |
| www.thomaswhitefunds.com | | | 7 | |
THE WORLD HAS CHANGED
The number of stocks in the world has surged 109% since the end of the Cold War in 1989. As of October 2012, America’s 4,977 exchange-traded stocks now only represent 10.77% of the 46,231 stocks on the world’s 52 exchanges.1
| | | | | | | | | | | | |
| The Growth of World Stock Markets: Regional Weights |
| 1960 to October 31, 20122 | | 1960 | | 1970 | | 1980 | | 1990 | | 2000 | | 2012 |
| Developed Markets | | 99.9% | | 99.8% | | 99.2% | | 97% | | 96% | | 77% |
| | | | | | | |
United States | | 72% | | 66% | | 57% | | 43% | | 51% | | 38% |
| | | | | | | |
Canada | | 3% | | 2% | | 3% | | 2% | | 2% | | 4% |
| | | | | | | |
Europe | | 22% | | 22% | | 23% | | 25% | | 28% | | 23% |
| | | | | | | |
Asia Pacific | | 3% | | 8% | | 16% | | 27% | | 15% | | 12% |
| | | | | | | |
| Emerging Markets | | 0.1% | | 0.2% | | 0.8% | | 3% | | 4% | | 23% |
| The World Market | | 100% | | 100% | | 100% | | 100% | | 100% | | 100% |
Market Value ($ trillions) | | $0.5 | | $2.0 | | $4.1 | | $8.2 | | $26.9 | | $40.0 |
1World Federation of Exchanges, Focus-October 2012
2Source: Thomas White International, Ltd.
Globalization has spurred growth in every region of the world. International stocks now represent over half of the total world stock market value, including, for example, Sony, Nokia, Toyota, BMW, L’Oreal, Unilever, Heineken, Volvo, Nestle, UBS, Volkswagen, Honda and Royal Dutch Shell. Emerging market companies include Samsung, LG and Hyundai.
Given their quality, diversity and long-term growth potential, it only makes common sense that investors search for opportunities worldwide. The Thomas
White American Opportunities, International and Emerging Markets Funds are managed by the same portfolio manager and analysts who adhere to an identical valuation-oriented investment style. The three portfolios complement one another in that, when combined, they seek to have the profile of the MSCI All-Country World Index.
Shareholders who want to adopt a global investment strategy for their savings and investment program should consider owning all three Thomas White Funds.
Fund holdings are subject to change and should not be considered a recommendation to buy or sell any securities. For a complete list of fund holdings, please refer to the Schedule of Investments section of this report.
| | |
| 8 | | www.thomaswhitefunds.com |
| | |
| THOMAS WHITE INTERNATIONAL FUND | | |
| | | | | | | | | | | | | | | | | | | | | | | | | | | | | | | | |
| | | |
| Average Annual Returns as of October 31, 2012 (Unaudited) | | | | | | | |
| Class | | Sales Charge | | | | 6 month | | | YTD | | | 1 Yr | | | 3 Yrs | | | 5 Yrs | | | 10 Yrs | | | Since
Inception (6/28/1994)* | |
| Investor Class shares (TWWDX) | | No sales charge | | | | | 2.15% | | | | 13.05% | | | | 8.25% | | | | 6.17% | | | | -4.40% | | | | 10.53% | | | | 7.71% | |
| Class I shares1 (TWWIX) | | No sales charge | | | | | 2.25% | | | | 13.17% | | | | 8.37% | | | | 6.21% | | | | -4.38% | | | | 10.54% | | | | 7.72% | |
| Class A shares2 (TWWAX) | | Maximum 5.75% initial sales charge | | With sales charge | | | -3.68% | | | | 6.62% | | | | 2.10% | | | | 4.13% | | | | -5.51% | | | | 9.88% | | | | 7.37% | |
| | | | | Excluding sales charge | | | 2.22% | | | | 13.14% | | | | 8.34% | | | | 6.20% | | | | -4.39% | | | | 10.54% | | | | 7.72% | |
| Class C shares3 (TWWCX) | | Maximum 1% deferred sales charge | | With sales charge | | | 1.11% | | | | 12.01% | | | | 7.22% | | | | 6.16% | | | | -4.41% | | | | 10.52% | | | | 7.71% | |
| | | | | Excluding sales charge | | | 2.11% | | | | 13.01% | | | | 8.22% | | | | 6.16% | | | | -4.41% | | | | 10.52% | | | | 7.71% | |
| MSCI All Country World ex US Index4 | | N/A | | | | | 1.21% | | | | 10.81% | | | | 3.98% | | | | 3.74% | | | | -5.08% | | | | 9.31% | | | | 5.06% | |
* The inception date of the Investor Class Shares.
1 Performance figures for Class I shares, first offered on August 31, 2012, include the historical performance of Investor Class shares through August 30, 2012.
2 Performance figures for Class A shares, first offered on August 31, 2012, include the historical performance of Investor Class shares through August 30, 2012.
3 Performance figures for Class C shares, first offered on August 31, 2012, include the historical performance of Investor Class shares through August 30, 2012.
4 The MSCI All Country World ex US Index is a free float-adjusted market capitalization-weighted index of 44 countries, which includes developed and emerging markets. The index is unmanaged and returns assume the reinvestment of dividends. It is not possible to invest directly in an index.
Returns reflect differences in sales charges and expenses, which are primarily differences in distribution and service fees.
Performance data is based upon past performance, which is no guarantee of future results. The investment return and principal value of an investment will fluctuate so that an investor’s shares, when redeemed, may be worth more or less than their original cost. Current performance may be higher or lower than the performance data quoted. Please call 1-800-811-0535 to obtain performance data as of the most recent month-end. The Fund imposes a 2% redemption fee on shares held less than 60 days. Performance data does not reflect the redemption fee. If reflected, total returns would be lower. Investment performance reflects any fee waivers that were in effect. In the absence of such waivers, total return would have been reduced.
Mutual fund investing involves risk. Principal loss is possible. Investing in international markets may involve additional risks such as social and political instability, market illiquidity, exchange-rate fluctuations, a high level of volatility and limited regulation. These risks are greater for emerging markets.
| | | | |
| www.thomaswhitefunds.com | | | 9 | |
| | |
| THOMAS WHITE INTERNATIONAL FUND | | |
| | | | | | | | | | | | | | |
| | | | | | | | |
| | | Sales
Charge | | Deferred
Sales
Charge | | Administrative
Services
Fee | | 12b-1 Fees | | Operating
Expenses
(annualized) 1 | | Prospectus
Gross
Annual
Operating
Expense2 | | Prospectus
Net Annual
Operating
Expense2,3 |
| Investor Class | | N/A | | N/A | | Up to 0.25% | | N/A | | 1.31% (Year ended Oct 31, 2012) | | 1.43% | | 1.24% |
| Class I | | N/A | | N/A | | N/A | | N/A | | 0.99% (Aug 31, 2012 through Oct 31, 2012) | | 1.18% | | 0.99% |
| Class A | | 5.75% | | N/A | | Up to 0.25% | | 0.25% | | 1.49% (Aug 31, 2012 through Oct 31, 2012) | | 1.68% | | 1.49% |
| Class C | | N/A | | 1.00% within 15 months | | N/A | | 1.00% | | 1.99% (Aug 31, 2012 through Oct 31, 2012) | | 2.18% | | 1.99% |
1In the absence of the expense reimbursement for the International Fund, the ratio of expenses to average net assets would have been 1.37% for Investor Class shares, 1.45% for Class I shares, 1.66% for Class A shares and 2.16% for Class C shares.
2Gross Annual Operating Expense and Net Annual Operating Expense are based on the most recent prospectus and may differ from other expense ratios appearing in this report.
3The Advisor has agreed to defer its fees and/or reimburse the Fund to the extent that the operating expenses for Investor Class, Class I, Class A and Class C shares exceed (as a percentage of average daily net assets) 1.24%, 0.99%, 1.49% and 1.99%, respectively. The fee deferral/expense reimbursement agreement expires February 28, 2014. The Fund has agreed to repay the Advisor for amounts deferred or reimbursed by the Advisor pursuant to the agreement provided that such repayment does not cause the Fund to exceed the above limits and the repayment is made within three years after the year in which the Advisor incurred the expense. The fee deferral/expense reimbursement agreement may only be amended or terminated by the Fund’s Board of Trustees.
| | | | | | | | |
| | | | | |
| | | NAV | | Net Assets | | Redemption Fee | | Portfolio Turnover (Year ended October 31, 2012) |
| Investor Class | | $16.55 | | $540.1 million | | 2.00% within 60 days | | 66% |
| Class I | | $16.56 | | $106.6 million | | |
| Class A | | $16.56 | | $519 | | |
| Class C | | $16.56 | | $518 | | |
| | |
| 10 | | www.thomaswhitefunds.com |
OCTOBER 31, 2012
GROWTH OF A $10,000 INVESTMENT WITH DIVIDENDS REINVESTED
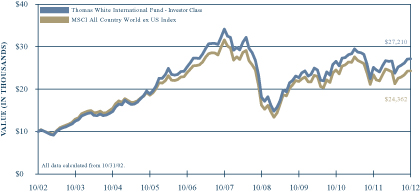
This chart illustrates the performance of a hypothetical $10,000 investment made in the Fund’s Investor Class shares and its benchmark, the MSCI All Country World ex US Index, for the past 10 years through October 31, 2012. It assumes reinvestment of dividends and capital gains, but does not reflect the effect of any applicable redemption fees. This chart does not imply future performance. Past performance does not guarantee future results. The cumulative ten year return was +172.10% for the Fund’s Investor Class shares and +143.62% for the benchmark. The one-year return for the Fund’s Investor Class shares was +8.25%. The Fund’s Investor Class shares average annual total return since inception was +7.71%. The MSCI All Country World ex US Index is a free float-adjusted market capitalization-weighted index of 44 countries, which includes developed and emerging markets. The index is unmanaged and returns assume the reinvestment of dividends. It is not possible to invest directly in an index. During the periods shown, the Fund’s manager reimbursed certain Fund expenses. Absent this reimbursement, performance would have been lower.
| | | | |
| www.thomaswhitefunds.com | | | 11 | |
| | |
| THOMAS WHITE INTERNATIONAL FUND | | |
Portfolio Manager: Thomas S. White, Jr.
The Thomas White International Fund primarily invests in equity securities of companies located in the world’s developed countries outside of the U.S. There may also be a portion of the Fund’s assets invested in companies from emerging market countries.
Performance Review
The Thomas White International Fund Investor Class shares returned +2.15% for the six-month period ended October 31, 2012, compared to +1.21% for the Fund’s benchmark, the MSCI All Country World ex US Index. The Fund’s Investor Class shares returned +8.25%, +6.17%, -4.40%, and +10.53% for the 1-, 3-, 5-, and 10-year periods ended October 31, 2012 against +3.98%, +3.74%, -5.08%, and +9.31%, respectively, for the benchmark. Since its inception on June 28, 1994, the Fund’s Investor Class shares have returned +7.71% annualized while the benchmark index returned +5.06% for the same period.
Aggressive Monetary Policy Steps Help Revive Sentiment
A healthy recovery in September helped international equities offset the steep decline during the month of May, and record moderate returns for the six-month review period ended October 31, 2012. Investor sentiment at the beginning of the review period was negatively affected by the unrelenting fears about the fiscal crisis and a deeper recession in Europe, as well as a slowdown in economic growth rates across the globe. However, extraordinary policy steps by the U.S. Federal Reserve, the European Central Bank (ECB), the Bank of Japan, and other central banks, as well as moderate recovery in economic signals, helped revive investor confidence towards the end of the review period.
More than two years after the problems surfaced, the European fiscal crisis still lingers on in the absence of a comprehensive solution. As a result, several countries in the region remain in a recession, dragging down the pace of global economic growth. The political consensus of last year to solve the crisis appeared fragile as political parties opposed to austerity measures gained in popularity and rose to power in select countries earlier this year. However, both sides have become more accommodative in recent months and have rekindled expectations of an agreement that will be broadly acceptable. Proposals to forge a closer fiscal union and to entrust the supervision of the region’s largest banks to the ECB have gained wide acceptance.
Growth rates and most other economic data fell short of forecasts during the first few months of the review period as consumer sentiment turned more subdued across major economies, including the large emerging markets. Industrial output declined in most developed countries as manufacturers reacted to weaker demand, both domestic and overseas. Economic conditions weakened across emerging markets as well, mostly due to the appreciable decline in exports to Europe. Nevertheless, global factory output saw a moderate recovery towards the end of the review period while exports from countries such as China and Korea appear to have stabilized. Further, corporate earnings and cash flows have remained relatively healthy so far.
| | |
| 12 | | www.thomaswhitefunds.com |
OCTOBER 31, 2012
Portfolio Review
During the six-month review period, the International Fund outperformed its benchmark index every month except August and September. Emerging markets underperformed in August and restricted Fund’s relative returns, as the Fund usually maintains a higher exposure to emerging market equities when compared to the benchmark. In September, the gains in emerging markets were led by select countries such as India where the Fund has a lower exposure. Healthcare and financial sectors outperformed during the review period, while energy and materials sectors lagged as oil and commodity prices corrected.
Hong Kong based manufacturer of home appliances and power tools Techtronic Industries Company Limited (+59.88%), which derives the bulk of its revenues from the developed countries, contributed the most to Fund returns during the review period, on signs of improving demand in major markets such as the U.S. Finnish lender Pohjola Bank Plc (+26.44%) benefited as the Nordic countries have been relatively less affected by the European crisis, and the bank reiterated that earnings for the fiscal year 2012 will be substantially higher than the previous year. Hong Kong based diversified conglomerate Jardine Strategic Holdings Ltd (+13.35%) benefited from the positive trends in the company’s key automobile business in Indonesia as well as sustained demand in the Hong Kong property market. German manufacturer of pharmaceuticals and chemicals Merck KGaA (+16.30%) outperformed as the company sustained its earnings growth and lifted guidance for the full year. The company has announced a cost
restructuring exercise and also issued healthy revenue and earnings guidance for the year 2014. French manufacturer of stationery and shaving products Societe BIC S.A. (+16.44%) added value as the company announced a digital education solution for schools, in partnership with Intel Corp., and maintained its earnings guidance for the current year. European reinsurer Hannover Re (+21.91%) outperformed as the company reported strong earnings growth for the third quarter and issued guidance for the current year and 2013 that were above expectations.
ALS Limited (-46.12%), an Australian company that provides technical testing and inspection services to the mining sector detracted the most from Fund returns during the review period on concerns of a slowdown in mining activity as global demand for materials has become more subdued. Indonesian distributor of heavy equipment PT United Tractors Tbk (-29.89%) declined as the sales outlook for mining equipment in that country has been negatively affected by slower global demand for coal. Chinese car manufacturer Dongfeng Motor Group Co. Ltd. (-32.63%) was negatively affected over concerns of slower demand growth in its domestic market. German luxury car manufacturer BMW AG (-13.15%) underperformed due to concerns about a slowdown in demand in key markets such as China, even as its home market in Europe remains weak. Brazilian miner Vale S.A. (-17.96%) and Chinese oil and gas producer and refiner China Petroleum & Chemical Corporation (-10.08%) underperformed as energy and materials prices corrected on a subdued global demand outlook.
| | | | |
| www.thomaswhitefunds.com | | | 13 | |
THOMAS WHITE INTERNATIONAL FUND
While Global Outlook Has Stabilized, Significant Risks Remain
The readiness of leading central banks to expand the scope of monetary policy interventions has been the most significant factor driving the revival in investor sentiment since September. While the U.S. Federal Reserve has committed to keeping its benchmark rate at the current record low until mid-2015 as well as restarting its program to buy mortgage backed securities, the ECB has offered unlimited purchase of bonds issued by the troubled countries in the region. The Bank of Japan and the Bank of England have also expanded their quantitative easing programs. As well, central banks in emerging market countries, such as China, Brazil, and Korea, have pursued interest rate cuts, while rates are on hold in most others. Until economic signals turn more robust, it is expected that most central banks are likely to maintain their current policy stances that favor expansion.
The relatively healthy U.S. consumer demand, helped by a moderate revival in the housing sector and labor market, has also helped lift some of the dark clouds over the global economy. While this is not likely to fully offset the slump in European demand, countries that export manufactured goods are expected to see better stability in their overseas shipments. However, resource exporters appear unlikely to benefit as commodity prices have corrected. Nevertheless, lower energy and commodity prices could offer further support to consumer sentiment in the developed countries, though higher food prices are likely to cause concerns in emerging economies.
While global economic trends appear to be stabilizing, the European fiscal and banking crises as well as the prospect of a ‘fiscal cliff’ in the U.S. remain significant risks, in our opinion. Though fears about a collapse of the euro have been somewhat mitigated by the ECB’s extraordinary policy measures, the region remains in a recession. Unless a deeper banking union is established and a framework for closer fiscal integration is accepted by all the Euro-zone countries, a recovery from the recession will likely be delayed and Europe will possibly remain vulnerable to further financial shocks. In the U.S., lawmakers are under pressure to come up with an agreement that will avoid the tax increases and government spending cuts expected early next year. Failure to do so would likely invite significant negative economic consequences, not just for the U.S. but also for the rest of the world.
While we have no ability to foresee the choices policymakers might make, we are encouraged by the earnings and cash flow stability of prudently managed companies that have conservative balance sheets. These businesses have been relatively less affected by the subdued economic trends, and some of them are taking advantage of the downturn to strengthen their market share and expand into new segments and geographies. Our diligent research process continues to focus on identifying and keeping track of these businesses, which we believe will offer attractive long-term investment opportunities. Thank you for your confidence in the Thomas White International Fund.
| | |
| 14 | | www.thomaswhitefunds.com |
OCTOBER 31, 2012
| | | | |
| www.thomaswhitefunds.com | | | 15 | |
Portfolio Country and Industry Allocation as of October 31, 2012 (Unaudited)
| | | | |
| | |
| Country Allocation | | % of TNA | |
| Australia | | | 4.1% | |
| Belgium | | | 0.8% | |
| Brazil | | | 2.3% | |
| Canada | | | 4.6% | |
| China | | | 3.5% | |
| Czech Republic | | | 0.3% | |
| Denmark | | | 1.3% | |
| Finland | | | 2.3% | |
| France | | | 3.8% | |
| Germany | | | 12.1% | |
| Hong Kong | | | 5.7% | |
| India | | | 0.4% | |
| Indonesia | | | 1.4% | |
| Israel | | | 0.5% | |
| Italy | | | 0.7% | |
| Japan | | | 11.1% | |
| Malaysia | | | 1.0% | |
| Mexico | | | 2.5% | |
| Netherlands | | | 1.3% | |
| Norway | | | 3.6% | |
| Philippines | | | 0.5% | |
| Russia | | | 2.2% | |
| Singapore | | | 3.1% | |
| South Africa | | | 4.8% | |
| South Korea | | | 5.4% | |
| Sweden | | | 2.7% | |
| | | | |
| | |
| Country Allocation | | % of TNA | |
| Switzerland | | | 0.4% | |
| Taiwan | | | 0.8% | |
| Thailand | | | 2.4% | |
| Turkey | | | 0.7% | |
| United Kingdom | | | 11.4% | |
| United States | | | 0.3% | |
| Cash & Other | | | 2.0% | |
| | | | |
| | |
| Industry Allocation | | % of TNA | |
| Automobiles & Components | | | 4.8% | |
| Banks | | | 12.6% | |
| Capital Goods | | | 9.2% | |
| Commercial & Professional Services | | | 1.6% | |
| Consumer Durables & Apparel | | | 3.6% | |
| Consumer Services | | | 2.6% | |
| Diversified Financials | | | 2.9% | |
| Energy | | | 9.5% | |
| Food & Staples Retailing | | | 0.4% | |
| Food, Beverage & Tobacco | | | 6.2% | |
| Health Care Equipment & Services | | | 3.1% | |
| Household & Personal Products | | | 1.8% | |
| Insurance | | | 6.1% | |
| Materials | | | 4.9% | |
| Pharmaceuticals, Biotechnology & Life Sciences | | | 3.7% | |
| Real Estate | | | 2.5% | |
| Retailing | | | 4.5% | |
| Semiconductors & Semiconductor Equipment | | | 4.7% | |
| Software & Services | | | 1.3% | |
| Technology Hardware & Equipment | | | 1.0% | |
| Telecommunication Services | | | 5.5% | |
| Transportation | | | 2.3% | |
| Utilities | | | 3.2% | |
| Cash & Other | | | 2.0% | |
TNA - Total Net Assets
Fund holdings and industry allocations are subject to change and should not be considered a recommendation to buy or sell any securities. For a complete list of fund holdings, please refer to the Schedule of Investments section of this report.
| | |
| Thomas White International Fund | | |
| | | | | | | | | | | | |
| Country | | Issue | | Industry | | Shares | | | Value (US$) | |
| | | | | | | | | | | |
COMMON
STOCKS (96.7%) | | | | | | | | | | |
|
| |
| AUSTRALIA (4.1%) | | | | | | | | | | | | |
| | Australia and New Zealand Banking Group Limited + | | Banks | | | 423,500 | | | | $11,165,770 | |
| | Coca-Cola Amatil Limited + | | Food, Beverage & Tobacco | | | 260,700 | | | | 3,633,893 | |
| | Insurance Australia Group Limited + | | Insurance | | | 753,000 | | | | 3,581,606 | |
| | Sonic Healthcare Limited + | | Health Care Equipment & Services | | | 300,000 | | | | 4,033,946 | |
| | Telstra Corporation Limited + | | Telecommunication Services | | | 872,400 | | | | 3,750,474 | |
| | | | | | | | | | | | |
| | | | | | | | | | | 26,165,689 | |
|
| |
| BELGIUM (0.8%) | | | | | | | | | | | | |
| | UCB S.A. + | | Pharmaceuticals, Biotechnology & Life Sciences | | | 84,000 | | | | 4,899,507 | |
|
| |
| BRAZIL (2.0%) | | | | | | | | | | | | |
| | Cia de Saneamento Basico do Estado de Sao Paulo | | Utilities | | | 244,500 | | | | 10,350,365 | |
| | Cia de Saneamento de Minas Gerais-COPASA | | Utilities | | | 120,100 | | | | 2,834,787 | |
| | | | | | | | | | | | |
| | | | | | | | | | | 13,185,152 | |
|
| |
| CANADA (4.6%) | | | | | | | | | | | | |
| | Alimentation Couche-Tard Inc. | | Retailing | | | 62,300 | | | | 3,060,263 | |
| | BCE Inc. | | Telecommunication Services | | | 84,400 | | | | 3,689,516 | |
| | Canadian National Railway Company | | Transportation | | | 68,000 | | | | 5,871,660 | |
| | Canadian Pacific Railway Limited | | Transportation | | | 35,500 | | | | 3,265,822 | |
| | Husky Energy Inc. | | Energy | | | 111,700 | | | | 3,025,267 | |
| | Pacific Rubiales Energy Corp. | | Energy | | | 108,000 | | | | 2,540,095 | |
| | Royal Bank of Canada | | Banks | | | 148,700 | | | | 8,477,575 | |
| | | | | | | | | | | | |
| | | | | | | | | | | 29,930,198 | |
|
| |
| CHINA (3.5%) | | | | | | | | | | | | |
| | Bank of China Limited + | | Banks | | | 6,310,000 | | | | 2,595,123 | |
| | China Minsheng Banking Corp., Ltd. # + | | Banks | | | 5,702,000 | | | | 5,179,187 | |
| | China Overseas Land & Investment Ltd. + | | Real Estate | | | 1,782,000 | | | | 4,663,613 | |
| | Dongyue Group Limited # + | | Materials | | | 3,068,000 | | | | 1,742,179 | |
| | Lenovo Group Limited # + | | Technology Hardware & Equipment | | | 7,710,000 | | | | 6,193,133 | |
| | PICC Property and Casualty Company Limited * + | | Insurance | | | 1,965,400 | | | | 2,606,591 | |
| | | | | | | | | | | | |
| | | | | | | | | | | 22,979,826 | |
|
| |
| CZECH REPUBLIC (0.3%) | | | | | | | | | | |
| | Philip Morris CR a.s. + | | Food, Beverage & Tobacco | | | 4,100 | | | | 2,196,537 | |
|
| |
The accompanying notes are an integral part of these financial statements
| | |
| 16 | | www.thomaswhitefunds.com |
| | |
| Investment Portfolio | | October 31, 2012 |
| | | | | | | | | | | | |
| Country | | Issue | | Industry | | Shares | | | Value (US$) | |
| | | | | | | | | | | |
| DENMARK (1.3%) | | | | | | | | | | | | |
| | DSV A/S + | | Transportation | | | 116,800 | | | | $2,624,623 | |
| | Topdanmark A/S * + | | Insurance | | | 28,200 | | | | 5,728,630 | |
| | | | | | | | | | | | |
| | | | | | | | | | | 8,353,253 | |
|
| |
| FINLAND (2.3%) | | | | | | | | | | | | |
| | Nokian Renkaat Oyj + | | Automobiles & Components | | | 64,800 | | | | 2,695,008 | |
| | Pohjola Bank PLC + | | Diversified Financials | | | 573,400 | | | | 7,821,572 | |
| | Sampo Oyj + | | Insurance | | | 146,900 | | | | 4,604,078 | |
| | | | | | | | | | | | |
| | | | | | | | | | | 15,120,658 | |
|
| |
| FRANCE (3.8%) | | | | | | | | | | | | |
| | Christian Dior + | | Consumer Durables & Apparel | | | 52,750 | | | | 7,572,412 | |
| | Compagnie Generale des Etablissements Michelin + | | Automobiles & Components | | | 43,000 | | | | 3,704,259 | |
| | Societe B I C + | | Commercial & Professional Services | | | 82,000 | | | | 10,009,290 | |
| | Sodexo + | | Consumer Services | | | 45,500 | | | | 3,509,172 | |
| | | | | | | | | | | | |
| | | | | | | | | | | 24,795,133 | |
|
| |
| GERMANY (11.1%) | | | | | | | | | | | | |
| | adidas AG + | | Consumer Durables & Apparel | | | 74,100 | | | | 6,312,838 | |
| | BASF SE + | | Materials | | | 98,050 | | | | 8,124,447 | |
| | Bayer Aktiengesellschaft + | | Materials | | | 82,600 | | | | 7,193,318 | |
| | Bayerische Motoren Werke Aktiengesellschaft + | | Automobiles & Components | | | 57,500 | | | | 4,579,635 | |
| | Brenntag AG + | | Capital Goods | | | 24,800 | | | | 3,125,672 | |
| | Fresenius SE & Co KGaA + | | Health Care Equipment & Services | | | 87,600 | | | | 9,991,575 | |
| | Hannover Ruckversicherung AG + | | Insurance | | | 114,400 | | | | 8,046,941 | |
| | Merck KGaA + | | Pharmaceuticals, Biotechnology & Life Sciences | | | 70,800 | | | | 9,047,963 | |
| | Munich Re Group + | | Insurance | | | 24,800 | | | | 3,985,870 | |
| | SAP AG + | | Software & Services | | | 112,900 | | | | 8,224,575 | |
| | Volkswagen Aktiengesellschaft + | | Automobiles & Components | | | 17,000 | | | | 3,313,944 | |
| | | | | | | | | | | | |
| | | | | | | | | | | 71,946,778 | |
|
| |
| HONG KONG (5.7%) | | | | | | | | | | |
| | Cheung Kong (Holdings) Limited + | | Real Estate | | | 577,000 | | | | 8,535,055 | |
| | Cheung Kong Infrastructure Holdings Limited + | | Utilities | | | 824,000 | | | | 4,826,140 | |
| | Jardine Strategic Holdings Limited + | | Capital Goods | | | 400,000 | | | | 14,543,970 | |
| | SJM Holdings Limited + | | Consumer Services | | | 1,682,000 | | | | 3,655,901 | |
| | Techtronic Industries Company Limited + | | Consumer Durables & Apparel | | | 2,653,000 | | | | 5,022,141 | |
| | | | | | | | | | | | |
| | | | | | | | | | | 36,583,207 | |
|
| |
| INDIA (0.4%) | | | | | | | | | | | | |
| | Tata Motors Limited ADR # | | Automobiles & Components | | | 97,800 | | | | 2,361,870 | |
|
| |
The accompanying notes are an integral part of these financial statements
| | | | |
| www.thomaswhitefunds.com | | | 17 | |
| | |
| Thomas White International Fund | | |
| | | | | | | | | | | | |
| Country | | Issue | | Industry | | Shares | | | Value (US$) | |
| | | | | | | | | | | |
| INDONESIA (1.4%) | | | | | | | | | | |
| | Indo Tambangraya Megah Tbk PT + | | Energy | | | 499,500 | | | | $2,110,399 | |
| | PT Bank Mandiri (Persero) Tbk. + | | Banks | | | 2,654,000 | | | | 2,273,134 | |
| | PT Bank Negara Indonesia (Persero) Tbk + | | Banks | | | 4,782,000 | | | | 1,916,796 | |
| | PT United Tractors Tbk + | | Capital Goods | | | 1,298,000 | | | | 2,830,199 | |
| | | | | | | | | | | | |
| | | | | | | | | | | 9,130,528 | |
|
| |
| ISRAEL (0.5%) | | | | | | | | | | | | |
| | Teva Pharmaceutical Industries Limited ADR | | Pharmaceuticals, Biotechnology & Life Sciences | | | 76,500 | | | | 3,092,130 | |
|
| |
| ITALY (0.7%) | | | | | | | | | | | | |
| | Eni S.p.A. + | | Energy | | | 193,000 | | | | 4,423,924 | |
|
| |
| JAPAN (11.1%) | | | | | | | | | | | | |
| | Aisin Seiki Co., Ltd. + | | Automobiles & Components | | | 74,500 | | | | 2,169,158 | |
| | Asahi Group Holdings, Ltd. + | | Food, Beverage & Tobacco | | | 154,100 | | | | 3,512,613 | |
| | Dainippon Sumitomo Pharma Co., Ltd. + | | Pharmaceuticals, Biotechnology & Life Sciences | | | 259,200 | | | | 2,975,689 | |
| | Daito Trust Construction Co., Ltd. + | | Real Estate | | | 32,300 | | | | 3,261,719 | |
| | East Japan Railway Company + | | Transportation | | | 47,800 | | | | 3,280,502 | |
| | ITOCHU Corporation + | | Capital Goods | | | 603,700 | | | | 6,027,411 | |
| | Japan Tobacco Inc. + | | Food, Beverage & Tobacco | | | 103,000 | | | | 2,845,095 | |
| | JGC Corporation + | | Capital Goods | | | 102,000 | | | | 3,509,783 | |
| | Miraca Holdings Inc. + | | Health Care Equipment & Services | | | 75,000 | | | | 3,171,203 | |
| | Mitsubishi Corporation + | | Capital Goods | | | 203,000 | | | | 3,626,703 | |
| | Mizuho Financial Group, Inc. + | | Banks | | | 3,347,000 | | | | 5,228,388 | |
| | Nippon Telegraph and Telephone Corporation + | | Telecommunication Services | | | 149,100 | | | | 6,806,396 | |
| | Osaka Gas Co., Ltd. + | | Utilities | | | 649,000 | | | | 2,673,295 | |
| | Seven & I Holdings Co., Ltd. + | | Food & Staples Retailing | | | 82,800 | | | | 2,552,833 | |
| | Shimano, Inc. + | | Consumer Durables & Apparel | | | 68,400 | | | | 4,306,658 | |
| | Sumitomo Corporation + | | Capital Goods | | | 310,200 | | | | 4,217,748 | |
| | Taisei Corporation + | | Capital Goods | | | 1,174,000 | | | | 3,236,653 | |
| | Toyota Industries Corporation + | | Automobiles & Components | | | 111,000 | | | | 3,172,931 | |
| | Unicharm Corporation + | | Household & Personal Products | | | 93,000 | | | | 5,033,404 | |
| | | | | | | | | | | | |
| | | | | | | | | | | 71,608,182 | |
|
| |
| MALAYSIA (1.0%) | | | | | | | | | | |
| | AMMB Holdings Berhad + | | Diversified Financials | | | 1,225,000 | | | | 2,565,842 | |
| | Axiata Group Berhad + | | Telecommunication Services | | | 1,917,500 | | | | 4,105,729 | |
| | | | | | | | | | | | |
| | | | | | | | | | | 6,671,571 | |
|
| |
The accompanying notes are an integral part of these financial statements
| | |
| 18 | | www.thomaswhitefunds.com |
| | |
| Investment Portfolio | | October 31, 2012 |
| | | | | | | | | | | | |
| Country | | Issue | | Industry | | Shares | | | Value (US$) | |
| | | | | | | | | | | |
| MEXICO (2.5%) | | | | | | | | | | | | |
| | Alfa, S.A.B. de C.V. | | Capital Goods | | | 1,750,000 | | | | $3,215,595 | |
| | America Movil, S.A.B. de C.V. | | Telecommunication Services | | | 2,650,000 | | | | 3,361,578 | |
| | Grupo Financiero Banorte, S.A.B. de C.V. | | Banks | | | 763,700 | | | | 4,246,018 | |
| | Grupo Mexico, S.A.B. de C.V. | | Materials | | | 808,259 | | | | 2,592,552 | |
| | Mexichem, S.A.B. de C.V. | | Materials | | | 568,400 | | | | 2,817,257 | |
| | | | | | | | | | | | |
| | | | | | | | | | | 16,233,000 | |
|
| |
| NETHERLANDS (1.3%) | | | | | | | | | | |
| | ASML Holding N.V. + | | Semiconductors & Semiconductor Equipment | | | 109,200 | | | | 6,010,334 | |
| | Tenaris S.A. + | | Energy | | | 141,700 | | | | 2,662,041 | |
| | | | | | | | | | | | |
| | | | | | | | | | | 8,672,375 | |
|
| |
| NORWAY (3.6%) | | | | | | | | | | | | |
| | Seadrill Limited # + | | Energy | | | 154,800 | | | | 6,271,632 | |
| | Statoil ASA + | | Energy | | | 469,000 | | | | 11,587,984 | |
| | Telenor ASA + | | Telecommunication Services | | | 272,500 | | | | 5,350,845 | |
| | | | | | | | | | | | |
| | | | | | | | | | | 23,210,461 | |
|
| |
| PHILIPPINES (0.5%) | | | | | | | | | | |
| | Universal Robina Corporation + | | Food, Beverage & Tobacco | | | 1,668,000 | | | | 2,909,326 | |
|
| |
| RUSSIA (2.2%) | | | | | | | | | | | | |
| | Lukoil OAO GDR + | | Energy | | | 112,200 | | | | 6,801,969 | |
| | OAO Tatneft GDR + | | Energy | | | 139,333 | | | | 5,418,143 | |
| | Otkrytoe aktsionernoe obschestvo Gazprom neft GDR # + | | Energy | | | 89,700 | | | | 2,219,454 | |
| | | | | | | | | | | | |
| | | | | | | | | | | 14,439,566 | |
|
| |
| SINGAPORE (3.1%) | | | | | | | | | | | | |
| | Jardine Cycle & Carriage Limited + | | Retailing | | | 225,000 | | | | 9,045,062 | |
| | Keppel Corporation Limited + | | Capital Goods | | | 286,000 | | | | 2,487,471 | |
| | Singapore Telecommunications Limited + | | Telecommunication Services | | | 1,197,000 | | | | 3,148,697 | |
| | United Overseas Bank Limited + | | Banks | | | 340,000 | | | | 5,071,702 | |
| | | | | | | | | | | | |
| | | | | | | | | | | 19,752,932 | |
|
| |
| SOUTH AFRICA (4.8%) | | | | | | | | | | |
| | Aspen Pharmacare Holdings Ltd. + | | Pharmaceuticals, Biotechnology & Life Sciences | | | 210,000 | | | | 3,826,224 | |
| | Foschini Group Ltd. + | | Retailing | | | 155,600 | | | | 2,261,539 | |
| | Imperial Holdings Limited + | | Retailing | | | 158,300 | | | | 3,594,091 | |
| | Life Healthcare Group Holdings Ltd + | | Health Care Equipment & Services | | | 787,400 | | | | 2,977,157 | |
| | MTN Group Limited + | | Telecommunication Services | | | 87,600 | | | | 1,578,511 | |
| | Remgro Limited + | | Diversified Financials | | | 376,400 | | | | 6,444,682 | |
| | Sasol Limited + | | Energy | | | 41,600 | | | | 1,773,519 | |
The accompanying notes are an integral part of these financial statements
| | | | |
| www.thomaswhitefunds.com | | | 19 | |
| | |
| Thomas White International Fund | | |
| | | | | | | | | | | | |
| Country | | Issue | | Industry | | Shares | | | Value (US$) | |
| | | | | | | | | | | |
| SOUTH AFRICA (CONT.) | | | | | | | | | | |
| | Tiger Brands Limited + | | Food, Beverage & Tobacco | | | 116,500 | | | | $3,705,886 | |
| | Woolworths Holdings Limited + | | Retailing | | | 652,000 | | | | 4,915,885 | |
| | | | | | | | | | | | |
| | | | | | | | | | | 31,077,494 | |
|
| |
| SOUTH KOREA (5.4%) | | | | | | | | | | |
| | Daelim Industrial Co., Ltd. + | | Capital Goods | | | 37,500 | | | | 2,601,649 | |
| | Hyundai Marine & Fire Insurance Co., Ltd. + | | Insurance | | | 125,600 | | | | 4,054,672 | |
| | Hyundai Motor Company + | | Automobiles & Components | | | 22,100 | | | | 4,536,802 | |
| | KIA Motors Corp. + | | Automobiles & Components | | | 36,000 | | | | 1,995,928 | |
| | Samsung Electronics Co., Ltd. + | | Semiconductors & Semiconductor Equipment | | | 17,825 | | | | 21,441,495 | |
| | | | | | | | | | | | |
| | | | | | | | | | | 34,630,546 | |
|
| |
| SWEDEN (2.7%) | | | | | | | | | | | | |
| | SKF AB + | | Capital Goods | | | 223,300 | | | | 5,040,363 | |
| | Svenska Handelsbanken AB + | | Banks | | | 154,900 | | | | 5,314,780 | |
| | Swedbank AB + | | Banks | | | 379,100 | | | | 7,030,262 | |
| | | | | | | | | | | | |
| | | | | | | | | | | 17,385,405 | |
|
| |
| SWITZERLAND (0.4%) | | | | | | | | | | |
| | ABB Ltd. + | | Capital Goods | | | 158,900 | | | | 2,871,553 | |
|
| |
| TAIWAN (0.8%) | | | | | | | | | | | | |
| | Cheng Shin Rubber Industry Co Ltd + | | Automobiles & Components | | | 1,003,200 | | | | 2,507,838 | |
| | Taiwan Semiconductor Manufacturing Co Ltd ADR # | | Semiconductors & Semiconductor Equipment | | | 182,000 | | | | 2,893,800 | |
| | | | | | | | | | | | |
| | | | | | | | | | | 5,401,638 | |
|
| |
| THAILAND (2.4%) | | | | | | | | | | | | |
| | Advanced Info Service Public Company Limited + | | Telecommunication Services | | | 540,000 | | | | 3,461,261 | |
| | Bangkok Bank Public Company Limited + | | Banks | | | 351,800 | | | | 2,021,692 | |
| | Krung Thai Bank Public Company Limited + | | Banks | | | 975,000 | | | | 572,456 | |
| | PTT Exploration and Production Public Company Limited + | | Energy | | | 1,171,100 | | | | 6,342,751 | |
| | The Siam Commercial Bank Public Company Limited + | | Banks | | | 623,700 | | | | 3,276,238 | |
| | | | | | | | | | | | |
| | | | | | | | | | | 15,674,398 | |
|
| |
| TURKEY (0.7%) | | | | | | | | | | | | |
| | Haci omer Sabanci Holding A.S. + | | Diversified Financials | | | 414,800 | | | | 2,188,782 | |
| | Koc Holding A.S. + | | Capital Goods | | | 480,165 | | | | 2,254,996 | |
| | | | | | | | | | | | |
| | | | | | | | | | | 4,443,778 | |
|
| |
| UNITED KINGDOM (11.4%) | | | | | | | | | | |
| | BHP Billiton Plc + | | Materials | | | 293,300 | | | | 9,385,152 | |
| | BP P.L.C. + | | Energy | | | 909,800 | | | | 6,499,442 | |
| | British American Tobacco p.l.c. + | | Food, Beverage & Tobacco | | | 262,800 | | | | 13,039,557 | |
The accompanying notes are an integral part of these financial statements
| | |
| 20 | | www.thomaswhitefunds.com |
| | |
| Investment Portfolio | | October 31, 2012 |
| | | | | | | | | | | | |
| Country | | Issue | | Industry | | Shares | | | Value (US$) | |
| | | | | | | | | | | |
| UNITED KINGDOM (CONT.) | | | | | | | | | | |
| | Compass Group PLC + | | Consumer Services | | | 239,900 | | | | $2,636,180 | |
| | HSBC Holdings PLC + | | Banks | | | 583,900 | | | | 5,749,092 | |
| | Imperial Tobacco Group PLC + | | Food, Beverage & Tobacco | | | 166,400 | | | | 6,291,840 | |
| | Prudential Public Limited Company + | | Insurance | | | 515,100 | | | | 7,078,164 | |
| | Standard Chartered PLC + | | Banks | | | 406,675 | | | | 9,647,139 | |
| | WH Smith PLC # + | | Retailing | | | 628,800 | | | | 6,321,641 | |
| | Whitbread PLC + | | Consumer Services | | | 73,900 | | | | 2,808,154 | |
| | William Hill PLC + | | Consumer Services | | | 750,200 | | | | 4,097,858 | |
| | | | | | | | | | | | |
| | | | | | | | | | | 73,554,219 | |
|
| |
| UNITED STATES (0.3%) | | | | | | | | | | |
| | Philip Morris International Inc. | | Food, Beverage & Tobacco | | | 21,600 | | | | 1,912,896 | |
|
| |
| Total Common Stocks | | | | (Cost $538,032,195) | | | | | | | 625,613,730 | |
| | | | | | | | | | | | |
|
| |
| PREFERRED STOCKS (1.3%) | | | | | | | | | | | | |
|
| |
| BRAZIL (0.3%) | | | | | | | | | | | | |
| | Banco Bradesco S.A. | | Banks | | | 122,900 | | | | 1,936,338 | |
|
| |
| GERMANY (1.0%) | | | | | | | | | | | | |
| | Henkel AG & Co. KGaA + | | Household & Personal Products | | | 81,800 | | | | 6,532,135 | |
|
| |
| Total Preferred Stocks | | | | (Cost $8,284,759) | | | | | | | 8,468,473 | |
| | | | | | | | | | | | |
|
| |
SHORT TERM
INVESTMENT (3.0%) | | | | | | | | | | |
| | | | |
| HELD AS COLLATERAL FOR SECURITIES LENDING | | Northern Institutional Liquid Asset Portfolio | | | | | 19,382,904 | | | | $19,382,904 | |
|
| |
| Total Short Term Investment | | | | (Cost $19,382,904) | | | | | | | 19,382,904 | |
|
| |
| Total Investments | | 101.0% | | (Cost $565,699,858) | | | | | | | $653,465,107 | |
Other Assets,
Less Liabilities | | (1.0)% | | | | | | | | | (6,745,168 | ) |
| Total Net Assets: | | 100.0% | | | | | | | | | $646,719,939 | |
|
| |
| * | Non-Income Producing Securities |
| # | All or a portion of securities on loan at October 31, 2012 - See Note 1 (g) to Financial Statements |
| + | Fair Valued Security - See Note 1(a) to Financial statements |
ADR - American Depository Receipt
GDR - Global Depositary Receipt
Industry classifications shown in the Schedule of Investments are based off of the Global Industry Classification Standard (GICS®). GICS was developed by and/or is the exclusive property of MSCI, Inc. and Standard & Poor Financial Services LLC (“S&P”). GICS is a service mark of MSCI and S&P and has been licensed for use by U.S. Bancorp Fund Services, LLC.
The accompanying notes are an integral part of these financial statements
| | | | |
| www.thomaswhitefunds.com | | | 21 | |
| | |
| Thomas White International Fund | | |
The following table summarizes the inputs used, as of October 31, 2012, in valuing the Fund’s assets:
| | | | | | | | | | | | | | | | |
| | | Level 1 | | | Level 2 | | | Level 3 | | | Total | |
| Common Stocks | | | | | | | | | | | | | | | | |
| Australia | | | $------- | | | | $26,165,689 | | | | $------- | | | | $26,165,689 | |
| Belgium | | | ------- | | | | 4,899,507 | | | | ------- | | | | 4,899,507 | |
| Brazil | | | 13,185,152 | | | | ------- | | | | ------- | | | | 13,185,152 | |
| Canada | | | 29,930,198 | | | | ------- | | | | ------- | | | | 29,930,198 | |
| China | | | ------- | | | | 22,979,826 | | | | ------- | | | | 22,979,826 | |
| Czech Republic | | | ------- | | | | 2,196,537 | | | | ------- | | | | 2,196,537 | |
| Denmark | | | ------- | | | | 8,353,253 | | | | ------- | | | | 8,353,253 | |
| Finland | | | ------- | | | | 15,120,658 | | | | ------- | | | | 15,120,658 | |
| France | | | ------- | | | | 24,795,133 | | | | ------- | | | | 24,795,133 | |
| Germany | | | ------- | | | | 71,946,778 | | | | ------- | | | | 71,946,778 | |
| Hong Kong | | | ------- | | | | 36,583,207 | | | | ------- | | | | 36,583,207 | |
| India | | | 2,361,870 | | | | ------- | | | | ------- | | | | 2,361,870 | |
| Indonesia | | | ------- | | | | 9,130,528 | | | | ------- | | | | 9,130,528 | |
| Israel | | | 3,092,130 | | | | ------- | | | | ------- | | | | 3,092,130 | |
| Italy | | | ------- | | | | 4,423,924 | | | | ------- | | | | 4,423,924 | |
| Japan | | | ------- | | | | 71,608,182 | | | | ------- | | | | 71,608,182 | |
| Malaysia | | | ------- | | | | 6,671,571 | | | | ------- | | | | 6,671,571 | |
| Mexico | | | 16,233,000 | | | | ------- | | | | ------- | | | | 16,233,000 | |
| Netherlands | | | ------- | | | | 8,672,375 | | | | ------- | | | | 8,672,375 | |
| Norway | | | ------- | | | | 23,210,461 | | | | ------- | | | | 23,210,461 | |
| Philippines | | | ------- | | | | 2,909,326 | | | | ------- | | | | 2,909,326 | |
| Russia | | | ------- | | | | 14,439,566 | | | | ------- | | | | 14,439,566 | |
| Singapore | | | ------- | | | | 19,752,932 | | | | ------- | | | | 19,752,932 | |
| South Africa | | | ------- | | | | 31,077,494 | | | | ------- | | | | 31,077,494 | |
| South Korea | | | ------- | | | | 34,630,546 | | | | ------- | | | | 34,630,546 | |
| Sweden | | | ------- | | �� | | 17,385,405 | | | | ------- | | | | 17,385,405 | |
| Switzerland | | | ------- | | | | 2,871,553 | | | | ------- | | | | 2,871,553 | |
| Taiwan | | | 2,893,800 | | | | 2,507,838 | | | | ------- | | | | 5,401,638 | |
| Thailand | | | ------- | | | | 15,674,398 | | | | ------- | | | | 15,674,398 | |
| Turkey | | | ------- | | | | 4,443,778 | | | | ------- | | | | 4,443,778 | |
| United Kingdom | | | ------- | | | | 73,554,219 | | | | ------- | | | | 73,554,219 | |
| United States | | | 1,912,896 | | | | ------- | | | | ------- | | | | 1,912,896 | |
| Total Common Stocks | | | $69,609,046 | | | | $556,004,684 | | | | $------- | | | | $625,613,730 | |
| Preferred Stocks | | | | | | | | | | | | | | | | |
| Brazil | | | $1,936,338 | | | | $------- | | | | $------- | | | | $1,936,338 | |
| Germany | | | ------- | | | | 6,532,135 | | | | ------- | | | | 6,532,135 | |
| Total Preferred | | | 1,936,338 | | | | 6,532,135 | | | | ------- | | | | 8,468,473 | |
| Short Term Investments | |
| 19,382,904
|
| | | ------- | | | | ------- | | | | 19,382,904 | |
| Total Investments | | | $90,928,288 | | | | $562,536,819 | | | | $------- | | | | $653,465,107 | |
For more information on valuation inputs, please refer to the accompanying Notes to Financial Statements.
The Fund’s assets assigned to Level 2 include certain foreign securities for which a third party statistical pricing service may be employed for purposes of fair market valuation. In addition, no transfers in and/or out between Levels 1, 2 or 3 were observed.
The accompanying notes are an integral part of these financial statements
| | |
| 22 | | www.thomaswhitefunds.com |
| | |
| THOMAS WHITE EMERGING MARKETS FUND | | |
| | | | | | | | | | | | | | | | | | | | |
| |
| Average Annual Returns as of October 31, 2012 (Unaudited) | |
| Class | | Sales Charge | | | | 6 month | | | YTD | | | 1 Yr | | | Since Inception (6/28/2010)* | |
| Investor Class shares (TWEMX) | | No sales charge | | | | | -0.04% | | | | 11.95% | | | | 7.21% | | | | 6.59% | |
Class I shares1
(TWIIX) | | No sales charge | | | | | 0.01% | | | | 12.00% | | | | 7.26% | | | | 6.61% | |
Class A shares2
(TWIAX) | | Maximum 5.75% initial sales charge | | With sales charge | | | -5.81% | | | | 5.45% | | | | 0.96% | | | | 3.90% | |
| | | | | Excluding sales charge | | | -0.11% | | | | 11.88% | | | | 7.14% | | | | 6.56% | |
Class C shares3
(TWICX) | | Maximum 1% deferred sales charge | | With sales charge | | | -1.12% | | | | 10.84% | | | | 6.10% | | | | 6.55% | |
| | | | | Excluding sales charge | | | -0.14% | | | | 11.84% | | | | 7.10% | | | | 6.55% | |
| MSCI Emerging Markets Index4 | | N/A | | | | | -1.25% | | | | 11.30% | | | | 2.63% | | | | 4.56% | |
* The inception date of the Investor Class Shares.
1 Performance figures for Class I shares, first offered on August 31, 2012, include the historical performance of Investor Class shares through August 30, 2012.
2 Performance figures for Class I shares, first offered on August 31, 2012, include the historical performance of Investor Class shares through August 30, 2012.
3 Performance figures for Class I shares, first offered on August 31, 2012, include the historical performance of Investor Class shares through August 30, 2012.
4 The MSCI Emerging Markets Index is a free float-adjusted market capitalization index that is designed to measure equity market performance of emerging markets. The index is unmanaged and returns assume the reinvestment of dividends. It is not possible to invest directly in an index.
Returns reflect differences in sales charges and expenses, which are primarily differences in distribution and service fees.
Performance data is based upon past performance, which is no guarantee of future results. The investment return and principal value of an investment will fluctuate so that an investor’s shares, when redeemed, may be worth more or less than their original cost. Current performance may be higher or lower than the performance data quoted. Please call 1-800-811-0535 to obtain performance data as of the most recent month-end. The Fund imposes a 2% redemption fee on shares held less than 60 days. Performance data does not reflect the redemption fee. If reflected, total returns would be lower. Investment performance reflects any fee waivers that were in effect. In the absence of such waivers, total return would have been reduced.
Mutual fund investing involves risk. Principal loss is possible. Investing in international markets may involve additional risks such as social and political instability, market illiquidity, exchange-rate fluctuations, a high level of volatility and limited regulation. These risks are greater for emerging markets.
| | | | |
| www.thomaswhitefunds.com | | | 23 | |
| | |
| THOMAS WHITE EMERGING MARKETS FUND | | |
| | | | | | | | | | | | | | |
| | | | | | | | |
| | | Sales
Charge | | Deferred
Sales
Charge | | Administrative
Services
Fee | | 12b-1 Fees | | Operating
Expenses
(annualized) 1 | | Prospectus
Gross
Annual
Operating
Expense2 | | Prospectus
Net Annual
Operating
Expense2,3 |
| Investor Class | | N/A | | N/A | | Up to 0.25% | | N/A | | 1.46% (Year ended Oct 31, 2012) | | 1.95% | | 1.34% |
| Class I | | N/A | | N/A | | N/A | | N/A | | 1.09% (Aug 31, 2012 through Oct 31, 2012) | | 1.70% | | 1.09% |
| Class A | | 5.75% | | N/A | | Up to 0.25% | | 0.25% | | 1.59% (Aug 31, 2012 through Oct 31, 2012) | | 2.20% | | 1.59% |
| Class C | | N/A | | 1.00%
within 15
months | | N/A | | 1.00% | | 2.09% (Aug 31, 2012 through Oct 31, 2012) | | 2.70% | | 2.09% |
1 In the absence of the expense reimbursement for the Emerging Markets Fund, the ratio of expenses to average net assets would have been 1.96% for Investor Class shares, 3.31% for Class I shares, 2.32% for Class A shares and 2.85% for Class C shares.
2 Gross Annual Operating Expense and Net Annual Operating Expense are based on the most recent prospectus and may differ from other expense ratios appearing in this report.
3 The Advisor has agreed to defer its fees and/or reimburse the Fund to the extent that the operating expenses for Investor Class, Class I, Class A and Class C shares exceed (as a percentage of average daily net assets) 1.34%, 1.09%, 1.59% and 2.09%, respectively. The fee deferral/expense reimbursement agreement expires February 28, 2014. The Fund has agreed to repay the Advisor for amounts deferred or reimbursed by the Advisor pursuant to the agreement provided that such repayment does not cause the Fund to exceed the above limits and the repayment is made within three years after the year in which the Advisor incurred the expense. The fee deferral/expense reimbursement agreement may only be amended or terminated by the Fund’s Board of Trustees.
| | | | | | | | |
| | | | | |
| | | NAV | | Net Assets | | Redemption Fee | | Portfolio Turnover (Year ended October 31, 2012) |
| Investor Class | | $11.21 | | $29.6 million | | 2.00% within 60 days | | 54% |
| Class I | | $11.21 | | $956 thousand | | |
| Class A | | $11.20 | | $527 | | |
| Class C | | $11.21 | | $526 | | |
| | |
| 24 | | www.thomaswhitefunds.com |
OCTOBER 31, 2012
GROWTH OF A $10,000 INVESTMENT WITH DIVIDENDS REINVESTED
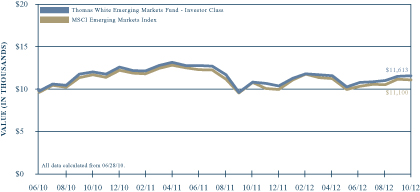
This chart illustrates the performance of a hypothetical $10,000 investment made in the Fund’s Investor Class shares and its benchmark, the MSCI Emerging Markets Index, since inception on June 28, 2010 through October 31, 2012. It assumes reinvestment of dividends and capital gains, but does not reflect the effect of any applicable redemption fees. This chart does not imply future performance. Past performance does not guarantee future results. The cumulative return since inception was +16.13% for the Fund’s Investor Class shares and +11.00% for the benchmark. The one-year return for the Fund’s Investor Class shares was +7.21%. The Fund’s Investor Class shares average annual total return since inception was +6.59%. The MSCI Emerging Markets Index is a free float-adjusted market capitalization index that is designed to measure equity market performance of emerging markets. The index is unmanaged and returns assume the reinvestment of dividends. It is not possible to invest directly in an index. During the periods shown, the Fund’s manager reimbursed certain Fund expenses. Absent this reimbursement, performance would have been lower.
| | | | |
| www.thomaswhitefunds.com | | | 25 | |
| | |
| THOMAS WHITE EMERGING MARKETS FUND | | |
Portfolio Manager: Thomas S. White, Jr.
The Thomas White Emerging Markets Fund invests primarily in securities of companies located in or whose businesses are closely associated with the world’s emerging markets countries.
Performance Review
During the trailing six-month period ended October 31, 2012, the Thomas White Emerging Markets Fund Investor Class shares returned -0.04%, compared to -1.25% for its benchmark, the MSCI Emerging Markets Index. The Fund’s Investor Class shares returned +7.21% during the trailing 1-year period, outperforming the benchmark which returned +2.63%. Since its inception on June 28, 2010, the Fund’s Investor Class shares have returned +6.59% annualized, against +4.56% for the benchmark index.
Policy Actions Help Ease Economic Growth Concerns
Emerging market equities started the review period with a significant price correction in May, on heightened concerns over a substantial decline in economic growth rates in these countries. Until the first quarter of this year, the downside risks to emerging market economic growth were considered relatively low. It was expected that domestic demand, boosted by favorable fiscal and monetary measures, would help these countries to mostly offset the weak external environment. However, as recessionary conditions persisted in Europe, several emerging market countries have been facing weaker than expected economic trends. The slowdown has been most severe among resource exporting countries such as Brazil, as a weaker global demand outlook led to a correction in commodity prices.
Expectations of more aggressive fiscal and monetary measures helped revive optimism in June. Several emerging countries have announced tax breaks and other fiscal measures to support industrial manufacturers as well as exporters. In addition, central banks in these countries have lowered interest rates or have held their rates steady, with the notable exception of Russia where interest rates were hiked in September on inflation concerns. The Brazilian central bank has been the most aggressive, cutting its benchmark to a record low. In countries such as India, where persistent inflation risks have restricted policy options, the central bank has repeatedly lowered the reserve requirements of banks to boost credit demand.
Monetary policy actions by the U.S. Federal Reserve and the European Central Bank helped emerging market equities recover further in September, though the gains were not sufficient to fully erase the decline in May. An extended period of record low interest rates and extraordinarily large liquidity infusions in the developed world are expected to drive increased capital inflows into emerging market assets. Despite the recent cuts, interest rate differentials between emerging markets and the developed countries remain sizeable, and continue to attract investment flows into emerging market debt. In addition, companies in emerging countries continue to see healthy
| | |
| 26 | | www.thomaswhitefunds.com |
OCTOBER 31, 2012
earnings growth and relatively stable cash flows, though the pace of growth has moderated.
Portfolio Review
Strong relative returns during the months of June, August, and October helped the Emerging Markets Fund outperform its benchmark during the six-month review period. The Fund lagged the index marginally in May, when the markets saw a sharp decline. In September, the gains in emerging markets were led by select countries such as India where the Fund has a lower exposure than its benchmark. The industrial and healthcare sectors outperformed the most during the review period, while the materials and energy sectors lagged.
Mexican industrial conglomerate Alfa SAB de CV (+29.06%), which manufactures automobile parts, petrochemicals, and food products, contributed the most to Fund returns during the review period, as demand growth in its domestic market remains buoyant and automobile exports from the country continue to rise. Hong Kong based manufacturer of home appliances and power tools Techtronic Industries Company Limited (+49.77%) outperformed on signs of improving demand in major developed markets such as the U.S. Diversified Turkish industrial conglomerates Koc Holdings AS (+32.91%) and Haci Omer Sabanci Holding AS (+28.87%) gained as economic trends have turned healthier. Koc Holdings announced significantly large capital investment plans for the next year to expand existing capacity and to seek possible acquisitions. Mexican bank Grupo Financiero Banorte SAB de CV (+15.17%)
benefited from expectations of sustained credit growth, especially in consumer credit, which the country’s banking regulator expects to be around 15% for the current year. A pension fund co-owned by Banorte has acquired the Mexican pension fund assets of a Spanish bank to emerge as the country’s leading retirement assets manager. Korean insurer Hyundai Marine and Fire Insurance Co. (+25.96%) , expected to benefit from a government proposal to allow low cost health indemnity policies, also added value during the review period.
Indonesian distributor of heavy equipment PT United Tractors Tbk (-29.89%) detracted the most from Fund returns during the period as the sales outlook for mining equipment in that country has been negatively affected by slower global demand for coal. Chinese car manufacturer Dongfeng Motor Group Co. Ltd. (-36.06%) was negatively affected by concerns of slower demand growth in its domestic market. Korean automaker Kia Motors Corp (-24.70%) lost value towards the end of the review period after the company and its parent Hyundai Motor admitted to overstating the fuel economy of select models, and offered financial compensation to customers. Nevertheless, both companies continue to see market share gains across most regions. Indian automobile manufacturer Tata Motors Ltd (-17.51%) lost value as the company ceded domestic market share, and also on concerns that its luxury unit Jaguar Land Rover will see slower demand in markets such as Europe and China. Russian natural gas producer and pipeline operator OAO Gazprom (-17.13%) and Brazilian miner Vale S.A. (-15.13%)
| | | | |
| www.thomaswhitefunds.com | | | 27 | |
THOMAS WHITE EMERGING MARKETS FUND
underperformed as energy and materials prices corrected on subdued global demand outlook.
Healthy Investment Flows and Better Policy Flexibility to Help Emerging Economies
While growth rates have moderated, recent economic data from leading emerging countries suggest improvement. Export trends have turned positive for China and Korea, as better than expected U.S. consumer demand has partly offset the continuing slump in Europe. The decline in industrial output has been reversed in China as manufacturers have become less pessimistic about external demand. Mexico is another beneficiary as exports of manufactured goods such as automobiles from the country are growing at a robust pace. Unless the recession in Europe worsens and the U.S. fails to avoid the spending cuts and tax hikes next year, we believe these positive trends are expected to sustain. However, output continues to decline in resource exporting countries such as Brazil, as well as South Africa, where the mining sector has been buffeted by labor agitations.
Domestic demand continues to be stable in most emerging countries and policy measures by central banks have supported credit expansion. The Chinese central bank has offered additional liquidity support to the banking system in recent months, as credit growth trends have fluctuated. After the correction triggered by restrictive government policies, Chinese property market prices are showing signs of stability. Third quarter economic growth in Indonesia was markedly supported by domestic
consumption. Benign inflation trends, capped by relatively subdued energy and commodity prices, are expected to help central banks in most emerging countries bring down the benchmark rates further.
In addition, industrial investment inflows into emerging countries are expected to rise further in 2013. Of the more than $1 trillion in total investment flows, industrial investments are forecast to account for more than half. These inflows are typically less volatile and often bring better technology and practices, which help improve competitiveness and support long term growth.
Even though emerging countries have become more exposed to weaknesses in the global environment, established businesses in these countries are showing increased capability to take advantage of growth prospects, both in their domestic markets as well as overseas. Our disciplined research process helps us identify and closely follow these businesses, which we believe will offer long-term investment opportunities. We thank you for investing in the Thomas White Emerging Markets Fund.
| | |
| 28 | | www.thomaswhitefunds.com |
OCTOBER 31, 2012
| | | | |
| www.thomaswhitefunds.com | | | 29 | |
Portfolio Country and Industry Allocation as of October 31, 2012 (Unaudited)
| | | | |
| | |
| Country Allocation | | % of TNA | |
Brazil | | | 12.0% | |
Canada | | | 0.8% | |
China | | | 13.8% | |
Czech Republic | | | 1.1% | |
Hong Kong | | | 3.0% | |
India | | | 3.6% | |
Indonesia | | | 7.0% | |
Malaysia | | | 3.0% | |
Mexico | | | 8.6% | |
Peru | | | 0.3% | |
Philippines | | | 1.3% | |
Poland | | | 1.7% | |
Republic of Korea | | | 1.2% | |
Russia | | | 5.2% | |
South Africa | | | 9.8% | |
South Korea | | | 11.0% | |
Taiwan | | | 6.4% | |
Thailand | | | 5.8% | |
Turkey | | | 3.5% | |
Cash & Other | | | 0.9% | |
| | | | |
| | |
| Industry Allocation | | % of TNA | |
| Automobiles & Components | | | 4.9% | |
| Banks | | | 14.5% | |
| Capital Goods | | | 5.8% | |
| Consumer Durables & Apparel | | | 1.2% | |
| Diversified Financials | | | 4.1% | |
| Energy | | | 9.8% | |
| Food & Staples Retailing | | | 0.9% | |
| Food, Beverage & Tobacco | | | 12.4% | |
| Health Care Equipment & Services | | | 0.5% | |
| Household & Personal Products | | | 1.0% | |
| Insurance | | | 4.3% | |
| Materials | | | 8.1% | |
| Pharmaceuticals, Biotechnology & Life Sciences | | | 2.3% | |
| Real Estate | | | 1.7% | |
| Retailing | | | 3.3% | |
| Semiconductors & Semiconductor Equipment | | | 5.9% | |
| Software & Services | | | 1.1% | |
| Technology Hardware & Equipment | | | 4.2% | |
| Telecommunication Services | | | 5.8% | |
| Transportation | | | 1.6% | |
| Utilities | | | 5.7% | |
| Cash & Other | | | 0.9% | |
TNA - Total Net Assets
Fund holdings and industry allocations are subject to change and should not be considered a recommendation to buy or sell any securities. For a complete list of fund holdings, please refer to the Schedule of Investments section of this report.
| | |
| Thomas White Emerging Markets Fund | | |
| | | | | | | | | | | | |
| Country | | Issue | | Industry | | Shares | | | Value (US$) | |
| | | | | | | | | | | |
COMMON
STOCKS (96.7%) | | | | | | | | | | |
|
| |
| BRAZIL (9.6%) | | | | | | | | | | | | |
| | CCR S.A. | | Transportation | | | 17,700 | | | | $155,645 | |
| | Cia de Saneamento Basico do Estado de Sao Paulo ADR | | Utilities | | | 8,900 | | | | 747,689 | |
| | Cia de Saneamento de Minas Gerais-COPASA | | Utilities | | | 15,600 | | | | 368,215 | |
| | Localiza Rent a Car S.A. | | Transportation | | | 12,000 | | | | 210,335 | |
| | M. Dias Branco S.A. Industria e Comercio de Alimentos | | Food, Beverage & Tobacco | | | 7,900 | | | | 265,272 | |
| | Obrascon Huarte Lain Brasil S.A. | | Transportation | | | 13,000 | | | | 122,252 | |
| | Souza Cruz S.A. | | Food, Beverage & Tobacco | | | 24,000 | | | | 313,138 | |
| | Sul America S.A. | | Insurance | | | 17,295 | | | | 136,245 | |
| | TOTVS S/A | | Software & Services | | | 5,000 | | | | 101,672 | |
| | Tractebel Energia S.A. | | Utilities | | | 7,900 | | | | 136,136 | |
| | Vale S.A. ADR # | | Materials | | | 21,200 | | | | 388,384 | |
| | | | | | | | | | | | |
| | | | | | | | | | | 2,944,983 | |
|
| |
| CANADA (0.8%) | | | | | | | | | | | | |
| | Pacific Rubiales Energy Corp. | | Energy | | | 10,100 | | | | 237,546 | |
|
| |
| CHINA (13.8%) | | | | | | | | | | | | |
| | Anhui Conch Cement Company Limited + | | Materials | | | 123,000 | | | | 424,752 | |
| | Bank of China Limited + | | Banks | | | 461,100 | | | | 189,637 | |
| | China Minsheng Banking Corp., Ltd. + | | Banks | | | 627,000 | | | | 569,511 | |
| | China Overseas Land & Investment Ltd. + | | Real Estate | | | 100,000 | | | | 261,707 | |
| | China Petroleum & Chemical Corporation + | | Energy | | | 302,000 | | | | 317,661 | |
| | Dongfeng Motor Group Co., Ltd. # + | | Automobiles & Components | | | 194,000 | | | | 239,372 | |
| | Dongyue Group Limited + | | Materials | | | 218,000 | | | | 123,792 | |
| | Franshion Properties (China) Limited + | | Real Estate | | | 844,000 | | | | 258,037 | |
| | Guangdong Investment Limited + | | Utilities | | | 486,000 | | | | 396,706 | |
| | Hengan International Group Company Limited + | | Household & Personal Products | | | 14,500 | | | | 131,670 | |
| | Jiangxi Copper Company Limited + | | Materials | | | 72,000 | | | | 185,177 | |
| | Lenovo Group Limited # + | | Technology Hardware & Equipment | | | 394,000 | | | | 316,484 | |
| | PICC Property and Casualty Company Limited * + | | Insurance | | | 231,000 | | | | 306,361 | |
| | Shenguan Holdings (Group) Limited + | | Food, Beverage & Tobacco | | | 250,000 | | | | 137,401 | |
| | Tencent Holdings Limited + | | Software & Services | | | 6,400 | | | | 226,013 | |
| | Tsingtao Brewery Co., Ltd. + | | Food, Beverage & Tobacco | | | 22,000 | | | | 118,881 | |
| | | | | | | | | | | | |
| | | | | | | | | | | 4,203,162 | |
|
| |
| CZECH REPUBLIC (1.1%) | | | | | | | | | | |
| | Philip Morris CR a.s. + | | Food, Beverage & Tobacco | | | 600 | | | | 321,444 | |
|
| |
| HONG KONG (3.0%) | | | | | | | | | | |
| | Belle International Holdings Limited # + | | Retailing | | | 77,000 | | | | 143,279 | |
| | China Mengniu Dairy Company Limited + | | Food, Beverage & Tobacco | | | 47,000 | | | | 142,481 | |
The accompanying notes are an integral part of these financial statements
| | |
| 30 | | www.thomaswhitefunds.com |
| | |
| Investment Portfolio | | October 31, 2012 |
| | | | | | | | | | | | |
| Country | | Issue | | Industry | | Shares | | | Value (US$) | |
| | | | | | | | | | | |
| HONG KONG (CONT.) | | | | | | | | | | |
| | Dairy Farm International Holdings Limited + | | Retailing | | | 26,100 | | | | $290,993 | |
| | Techtronic Industries Company Limited + | | Consumer Durables & Apparel | | | 186,000 | | | | 352,099 | |
| | | | | | | | | | | | |
| | | | | | | | | | | 928,852 | |
|
| |
| INDIA (3.6%) | | | | | | | | | | | | |
| | Dr. Reddy’s Laboratories Limited ADR # | | Pharmaceuticals, Biotechnology & Life Sciences | | | 9,200 | | | | 299,368 | |
| | HDFC Bank Limited ADR # | | Banks | | | 13,100 | | | | 489,809 | |
| | Tata Motors Limited ADR # | | Automobiles & Components | | | 12,800 | | | | 309,120 | |
| | | | | | | | | | | | |
| | | | | | | | | | | 1,098,297 | |
|
| |
| INDONESIA (7.0%) | | | | | | | | | | | | |
| | Astra Agro Lestari Tbk PT + | | Food, Beverage & Tobacco | | | 54,000 | | | | 117,228 | |
| | Bank Rakyat Indonesia (Persero) Tbk PT + | | Banks | | | 440,000 | | | | 338,996 | |
| | Gudang Garam Tbk PT + | | Food, Beverage & Tobacco | | | 45,000 | | | | 230,272 | |
| | Indo Tambangraya Megah Tbk PT + | | Energy | | | 81,000 | | | | 342,227 | |
| | Indofood Sukses Makmur Tbk PT + | | Food, Beverage & Tobacco | | | 247,000 | | | | 146,582 | |
| | PT Astra International Tbk + | | Automobiles & Components | | | 220,000 | | | | 184,386 | |
| | PT Bank Mandiri (Persero) Tbk. + | | Banks | | | 510,000 | | | | 436,812 | |
| | PT United Tractors Tbk + | | Capital Goods | | | 161,000 | | | | 351,049 | |
| | | | | | | | | | | | |
| | | | | | | | | | | 2,147,552 | |
|
| |
| MALAYSIA (3.0%) | | | | | | | | | | | | |
| | AMMB Holdings Berhad + | | Diversified Financials | | | 148,000 | | | | 309,996 | |
| | Axiata Group Berhad + | | Telecommunication Services | | | 145,000 | | | | 310,472 | |
| | RHB Capital Bhd + | | Banks | | | 115,000 | | | | 283,094 | |
| | | | | | | | | | | | |
| | | | | | | | | | | 903,562 | |
|
| |
| MEXICO (8.6%) | | | | | | | | | | | | |
| | Alfa, S.A.B. de C.V. | | Capital Goods | | | 256,000 | | | | 470,395 | |
| | America Movil, S.A.B. de C.V. | | Telecommunication Services | | | 208,000 | | | | 263,852 | |
| | Coca-Cola FEMSA, S.A.B. de C.V. | | Food, Beverage & Tobacco | | | 12,000 | | | | 153,872 | |
| | Fomento Economico Mexicano SAB de C.V. | | Food Beverage & Tobacco | | | 22,500 | | | | 202,593 | |
| | Grupo Financiero Banorte, S.A.B. de C.V. | | Banks | | | 103,000 | | | | 572,659 | |
| | Grupo Mexico, S.A.B. de C.V. | | Materials | | | 90,332 | | | | 289,747 | |
| | Industrias Penoles, S.A.B. de C.V. | | Materials | | | 4,800 | | | | 240,110 | |
| | Mexichem, S.A.B. de C.V. | | Materials | | | 33,003 | | | | 163,578 | |
| | Wal-Mart de Mexico, S.A.B. de C.V. | | Food & Staples Retailing | | | 96,000 | | | | 282,487 | |
| | | | | | | | | | | | |
| | | | | | | | | | | 2,639,293 | |
|
| |
The accompanying notes are an integral part of these financial statements
| | | | |
| www.thomaswhitefunds.com | | | 31 | |
| | |
| Thomas White Emerging Markets Fund | | |
| | | | | | | | | | | | |
| Country | | Issue | | Industry | | Shares | | | Value (US$) | |
| | | | | | | | | | | |
| PERU (0.3%) | | | | | | | | | | |
| | Credicorp Ltd. | | Banks | | | 700 | | | | $90,538 | |
|
| |
| PHILIPPINES (1.3%) | | | | | | | | | | |
| | Philippine Long Distance Telephone Company + | | Telecommunication Services | | | 3,400 | | | | 218,534 | |
| | Universal Robina Corporation + | | Food, Beverage & Tobacco | | | 98,000 | | | | 170,931 | |
| | | | | | | | | | | | |
| | | | | | | | | | | 389,465 | |
|
| |
| POLAND (1.7%) | | | | | | | | | | |
| | KGHM Polska Miedz S.A. + | | Materials | | | 5,700 | | | | 287,986 | |
| | Synthos S.A. + | | Materials | | | 140,000 | | | | 232,700 | |
| | | | | | | | | | | | |
| | | | | | | | | | | 520,686 | |
|
| |
| REPUBLIC OF KOREA (1.2%) | | | | | | | | | | |
| | KT&G Corporation + | | Food, Beverage & Tobacco | | | 4,875 | | | | 370,735 | |
|
| |
| RUSSIA (5.2%) | | | | | | | | | | |
| | Lukoil OAO GDR + | | Energy | | | 8,500 | | | | 515,301 | |
| | OAO Tatneft GDR + | | Energy | | | 13,900 | | | | 540,519 | |
| | Otkrytoe aktsionernoe obschestvo Gazprom neft GDR + | | Energy | | | 10,800 | | | | 267,225 | |
| | Sberbank of Russia GDR + | | Banks | | | 22,000 | | | | 259,890 | |
| | | | | | | | | | | | |
| | | | | | | | | | | 1,582,935 | |
|
| |
| SOUTH AFRICA (9.8%) | | | | | | | | | | |
| | African Rainbow Minerals Limited + | | Materials | | | 6,200 | | | | 129,653 | |
| | Aspen Pharmacare Holdings Ltd. + | | Pharmaceuticals, Biotechnology & Life Sciences | | | 22,400 | | | | 408,131 | |
| | The Bidvest Group Limited + | | Capital Goods | | | 5,100 | | | | 121,722 | |
| | Exxaro Resources Limited + | | Energy | | | 8,300 | | | | 165,935 | |
| | Imperial Holdings Limited + | | Retailing | | | 7,000 | | | | 158,930 | |
| | Life Healthcare Group Holdings Ltd + | | Health Care Equipment & Services | | | 40,000 | | | | 151,240 | |
| | MMI Holdings Limited + | | Insurance | | | 102,000 | | | | 247,559 | |
| | MTN Group Limited + | | Telecommunication Services | | | 16,300 | | | | 293,718 | |
| | Remgro Limited + | | Diversified Financials | | | 34,800 | | | | 595,842 | |
| | Tiger Brands Limited + | | Food, Beverage & Tobacco | | | 5,300 | | | | 168,594 | |
| | Vodacom Group Limited + | | Telecommunication Services | | | 11,400 | | | | 143,650 | |
| | Woolworths Holdings Limited + | | Retailing | | | 53,700 | | | | 404,882 | |
| | | | | | | | | | | | |
| | | | | | | | | | | 2,989,856 | |
|
| |
| SOUTH KOREA (11.0%) | | | | | | | | | | |
| | CJ CheilJedang Corporation + | | Food, Beverage & Tobacco | | | 475 | | | | 148,895 | |
| | Daelim Industrial Co., Ltd. + | | Capital Goods | | | 2,175 | | | | 150,896 | |
| | Dongbu Insurance Co., Ltd. + | | Insurance | | | 2,500 | | | | 113,408 | |
| | Hyundai Engineering & Construction Co., Ltd. + | | Capital Goods | | | 2,250 | | | | 135,159 | |
The accompanying notes are an integral part of these financial statements
| | |
| 32 | | www.thomaswhitefunds.com |
| | |
| Investment Portfolio | | October 31, 2012 |
| | | | | | | | | | | | |
| Country | | Issue | | Industry | | Shares | | | Value (US$) | |
| | | | | | | | | | | |
| SOUTH KOREA (CONT.) | | | | | | | | | | |
| | Hyundai Marine & Fire Insurance Co., Ltd. + | | Insurance | | | 15,800 | | | | $510,062 | |
| | Hyundai Motor Company + | | Automobiles & Components | | | 1,500 | | | | 307,928 | |
| | KIA Motors Corp. + | | Automobiles & Components | | | 5,150 | | | | 285,529 | |
| | LG Household & Health Care Ltd. + | | Household & Personal Products | | | 275 | | | | 161,264 | |
| | Samsung Electronics Co., Ltd. GDR * + | | Semiconductors & Semiconductor Equipment | | | 2,105 | | | | 1,274,486 | |
| | SK Innovation Co., Ltd. + | | Energy | | | 800 | | | | 117,306 | |
| | S-Oil Corporation + | | Energy | | | 1,700 | | | | 155,226 | |
| | | | | | | | | | | | |
| | | | | | | | | | | 3,360,159 | |
|
| |
| TAIWAN (6.4%) | | | | | | | | | | |
| | Cheng Shin Rubber Industry Co Ltd + | | Automobiles & Components | | | 68,400 | | | | 170,989 | |
| | Far EasTone Telecommunications Co., Ltd. + | | Telecommunication Services | | | 62,000 | | | | 143,327 | |
| | Hon Hai Precision Industry Co., Ltd. + | | Technology Hardware & Equipment | | | 143,000 | | | | 429,633 | |
| | Mega Financial Holding Co Ltd + | | Banks | | | 217,210 | | | | 157,790 | |
| | Quanta Computer Inc. + | | Technology Hardware & Equipment | | | 134,000 | | | | 305,562 | |
| | Synnex Technology International Corp. + | | Technology Hardware & Equipment | | | 115,000 | | | | 242,882 | |
| | Taiwan Semiconductor Manufacturing Co Ltd + | | Semiconductors & Semiconductor Equipment | | | 171,000 | | | | 519,185 | |
| | | | | | | | | | | | |
| | | | | | | | | | | 1,969,368 | |
|
| |
| THAILAND (5.8%) | | | | | | | | | | |
| | Advanced Info Service Public Company Limited + | | Telecommunication Services | | | 60,000 | | | | 384,584 | |
| | Bangkok Bank Public Company Limited + | | Banks | | | 52,300 | | | | 307,133 | |
| | Charoen Pokphand Foods Public Company Limited + | | Food, Beverage & Tobacco | | | 117,100 | | | | 134,422 | |
| | Krung Thai Bank Public Company Limited + | | Banks | | | 706,250 | | | | 414,664 | |
| | PTT Exploration and Production Public Company Limited + | | Energy | | | 70,300 | | | | 380,749 | |
| | Thai Union Frozen Products Public Company Limited + | | Food, Beverage & Tobacco | | | 58,300 | | | | 136,742 | |
| | | | | | | | | | | | |
| | | | | | | | | | | 1,758,294 | |
|
| |
| TURKEY (3.5%) | | | | | | | | | | |
| | Coca-Cola Icecek A.S. + | | Food, Beverage & Tobacco | | | 10,200 | | | | 198,019 | |
| | Haci omer Sabanci Holding A.S. + | | Diversified Financials | | | 66,900 | | | | 353,012 | |
| | Koc Holding A.S. + | | Capital Goods | | | 113,150 | | | | 531,386 | |
| | | | | | | | | | | | |
| | | | | | | | | | | 1,082,417 | |
|
| |
| Total Common Stocks | | | | (Cost $25,912,635) | | | | | | | 29,539,144 | |
| | | | | | | | | | | | |
|
| |
The accompanying notes are an integral part of these financial statements
| | | | |
| www.thomaswhitefunds.com | | | 33 | |
| | |
| Thomas White Emerging Markets Fund | | |
| | | | | | | | | | | | |
| Country | | Issue | | Industry | | Shares | | | Value (US$) | |
| | | | | | | | | | | |
| PREFERRED STOCKS (2.4%) | | | | | | | | | | |
|
| |
| BRAZIL (2.4%) | | | | | | | | | | |
| | Banco Bradesco S.A. | | Banks | | | 20,100 | | | | $316,683 | |
| | Companhia de Bebidas das Americas - AMBEV ADR # | | Food, Beverage & Tobacco | | | 8,000 | | | | 326,320 | |
| | Companhia Energetica de Minas Gerais | | Utilities | | | 7,400 | | | | 88,536 | |
| | | | | | | | | | | | |
| | | | | | | | | | | 731,539 | |
|
| |
| Total Preferred Stocks | | | | (Cost $693,977) | | | | | | | 731,539 | |
| | | | | | | | | | | | |
|
| |
SHORT TERM
INVESTMENTS (9.4%) | | | | | | | | | | |
| | Northern Institutional Treasury Portfolio | | | | | 290,251 | | | | 290,251 | |
| | | | |
| HELD AS COLLATERAL FOR SECURITIES LENDING | | Northern Institutional Liquid Asset Portfolio | | | | | 2,587,510 | | | | 2,587,510 | |
|
| |
| Total Short Term Investments | | | | (Cost $2,877,761) | | | | | | | 2,877,761 | |
|
| |
| Total Investments | | 108.5% | | (Cost $29,484,373) | | | | | | | $33,148,444 | |
Other Assets,
Less Liabilities | | (8.5)% | | | | | | | | | (2,589,568 | ) |
| Total Net Assets: | | 100.0% | | | | | | | | | $30,558,876 | |
|
| |
| * | Non-Income Producing Securities |
| # | All or a portion of securities on loan at October 31, 2012 - See Note 1 (g) to Financial Statements |
| + | Fair Valued Security - See Note 1 (a) to Financial Statements |
ADR - American Depository Receipt
GDR - Global Depositary Receipt
Industry classifications shown in the Schedule of Investments are based off of the Global Industry Classification Standard (GICS®). GICS was developed by and/or is the exclusive property of MSCI, Inc. and Standard & Poor Financial Services LLC (“S&P”). GICS is a service mark of MSCI and S&P and has been licensed for use by U.S. Bancorp Fund Services, LLC.
The accompanying notes are an integral part of these financial statements
| | |
| 34 | | www.thomaswhitefunds.com |
| | |
| Investment Portfolio | | October 31, 2012 |
The following table summarizes the inputs used, as of October 31, 2012, in valuing the Fund’s assets:
| | | | | | | | | | | | | | | | |
| | | Level 1 | | | Level 2 | | | Level 3 | | | Total | |
| Common Stocks | | | | | | | | | | | | | | | | |
| Brazil | | | $2,944,983 | | | | $------- | | | | $------- | | | | $2,944,983 | |
| Canada | | | 237,546 | | | | ------- | | | | ------- | | | | 237,546 | |
| China | | | ------- | | | | 4,203,162 | | | | ------- | | | | 4,203,162 | |
| Czech Republic | | | ------- | | | | 321,444 | | | | ------- | | | | 321,444 | |
| Hong Kong | | | ------- | | | | 928,852 | | | | ------- | | | | 928,852 | |
| India | | | 1,098,297 | | | | ------- | | | | ------- | | | | 1,098,297 | |
| Indonesia | | | ------- | | | | 2,147,552 | | | | ------- | | | | 2,147,552 | |
| Malaysia | | | ------- | | | | 903,562 | | | | ------- | | | | 903,562 | |
| Mexico | | | 2,639,293 | | | | ------- | | | | ------- | | | | 2,639,293 | |
| Peru | | | 90,538 | | | | ------- | | | | ------- | | | | 90,538 | |
| Philippines | | | ------- | | | | 389,465 | | | | ------- | | | | 389,465 | |
| Poland | | | ------- | | | | 520,686 | | | | ------- | | | | 520,686 | |
| Republic of Korea | | | ------- | | | | 370,735 | | | | ------- | | | | 370,735 | |
| Russia | | | ------- | | | | 1,582,935 | | | | ------- | | | | 1,582,935 | |
| South Africa | | | ------- | | | | 2,989,856 | | | | ------- | | | | 2,989,856 | |
| South Korea | | | ------- | | | | 3,360,159 | | | | ------- | | | | 3,360,159 | |
| Taiwan | | | ------- | | | | 1,969,368 | | | | ------- | | | | 1,969,368 | |
| Thailand | | | ------- | | | | 1,758,294 | | | | ------- | | | | 1,758,294 | |
| Turkey | | | ------- | | | | 1,082,417 | | | | ------- | | | | 1,082,417 | |
| Total Common Stocks | | | $7,010,657 | | | | $22,528,487 | | | | $------- | | | | $29,539,144 | |
| Preferred Stocks | | | | | | | | | | | | | | | | |
| Brazil | | | $731,539 | | | | $------- | | | | $------- | | | | $731,539 | |
| Total Preferred | | | 731,539 | | | | ------- | | | | ------- | | | | 731,539 | |
| Short Term Investments | |
| 2,877,761
|
| | | ------- | | | | ------- | | | | 2,877,761 | |
| Total Investments | | | $10,619,957 | | | | $22,528,487 | | | | $------- | | | | $33,148,444 | |
For more information on valuation inputs, please refer to the accompanying Notes to Financial Statements.
The Fund’s assets assigned to Level 2 include certain foreign securities for which a third party statistical pricing service may be employed for purposes of fair market valuation. In addition, no transfers in and/or out between Levels 1, 2 or 3 were observed.
The accompanying notes are an integral part of these financial statements
| | | | |
| www.thomaswhitefunds.com | | | 35 | |
| | |
| THOMAS WHITE AMERICAN OPPORTUNITIES FUND | | |
| | | | | | | | | | | | | | | | | | | | | | | | | | | | |
| |
| Average Annual Returns as of October 31, 2012 (Unaudited) | |
| Class | | 6 month | | | YTD | | | 1 Yr | | | 3 Yrs | | | 5 Yrs | | | 10 Yrs | | | Since Inception (3/4/1999) | |
| Investor Class shares (TWAOX) | | | -2.80% | | | | 6.05% | | | | 8.21% | | | | 12.67% | | | | -0.68% | | | | 7.57% | | | | 6.32% | |
| Russell Midcap Index1 | | | 0.25% | | | | 12.85% | | | | 12.15% | | | | 15.59% | | | | 1.70% | | | | 10.52% | | | | 7.69% | |
| S&P 500 Index1 | | | 2.16% | | | | 14.29% | | | | 15.21% | | | | 13.21% | | | | 0.36% | | | | 6.91% | | | | 2.77% | |
1 The Russell Midcap Index measures the performance of the 800 smallest companies in the Russell 1000 Index. These represent approximately 25% of the total market capitalization of the Russell 1000 Index. The S&P 500 Index measures the performance of 500 leading companies in leading industries of the U.S. economy, capturing 75% coverage of U.S. equities. Both indices are unmanaged and returns assume the reinvestment of dividends. It is not possible to invest directly in an index.
Performance data is based upon past performance, which is no guarantee of future results. The investment return and principal value of an investment will fluctuate so that an investor’s shares, when redeemed, may be worth more or less than their original cost. Current performance may be higher or lower than the performance data quoted. Please call 1-800-811-0535 to obtain performance data as of the most recent month-end. The Fund imposes a 2% redemption fee on shares held less than 60 days. Performance data does not reflect the redemption fee. If reflected, total returns would be lower. Investment performance reflects any fee waivers that were in effect. In the absence of such waivers, total return would have been reduced.
Mutual fund investing involves risk. Principal loss is possible. Investing in international markets may involve additional risks such as social and political instability, market illiquidity, exchange-rate fluctuations, a high level of volatility and limited regulation. These risks are greater for emerging markets.
| | |
| 36 | | www.thomaswhitefunds.com |
| | |
| THOMAS WHITE AMERICAN OPPORTUNITIES FUND | | |
| | | | | | | | | | | | | | |
| | | | | | | | |
| | | Sales
Charge | | Deferred
Sales
Charge | | Administrative
Services
Fee | | 12b-1 Fees | | Operating
Expenses
(annualized) 1 | | Prospectus
Gross
Annual
Operating
Expense2 | | Prospectus
Net Annual
Operating
Expense2,3 |
| Investor Class | | N/A | | N/A | | Up to 0.25% | | N/A | | 1.35% (Year ended Oct 31, 2012) | | 1.70% | | 1.34% |
1In the absence of the expense reimbursement for the American Opportunities Fund, the ratio of expenses to average net assets would have been 1.50% for Investor Class shares.
2Gross Annual Operating Expense and Net Annual Operating Expense are based on the most recent prospectus and may differ from other expense ratios appearing in this report.
3The Advisor has agreed to defer its fees and/or reimburse the Fund to the extent that the operating expenses for Investor Class shares exceed 1.34% of its average daily net assets. The fee deferral/expense reimbursement agreement expires February 28, 2014. The Fund has agreed to repay the Advisor for amounts deferred or reimbursed by the Advisor pursuant to the agreement provided that such repayment does not cause the Fund to exceed the above limits and the repayment is made within three years after the year in which the Advisor incurred the expense. The fee deferral/expense reimbursement agreement may only be amended or terminated by the Fund’s Board of Trustees.
| | | | | | | | |
| | | | | |
| | | NAV | | Net Assets | | Redemption Fee | | Portfolio Turnover (Year ended October 31, 2012) |
| Investor Class | | $13.28 | | $22.9 million | | 2.00% within 60 days | | 44% |
| | | | |
| www.thomaswhitefunds.com | | | 37 | |
THOMAS WHITE AMERICAN OPPORTUNITIES FUND
GROWTH OF A $10,000 INVESTMENT WITH DIVIDENDS REINVESTED
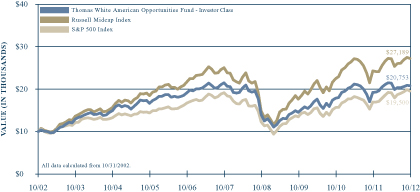
This chart illustrates the performance of a hypothetical $10,000 investment made in the Fund’s Investor Class shares, its primary benchmark, the Russell Midcap Index, and its secondary benchmark, the S&P 500 Index, for the past 10 years through October 31, 2012. It assumes reinvestment of dividends and capital gains, but does not reflect the effect of any applicable redemption fees. This chart does not imply future performance. Past performance does not guarantee future results. The cumulative ten year return was 107.53% for the Fund’s Investor Class shares, 171.89% for the primary benchmark, and 95.00% for the secondary benchmark. The one-year return for the Fund’s Investor Class shares was +8.21%. The Fund’s Investor Class shares average annual total return was +6.32%. The Russell Midcap Index measures the performance of the 800 smallest companies in the Russell 1000 Index. These represent approximately 25% of the total market capitalization of the Russell 1000 Index. The S&P 500 Index measures the performance of 500 leading companies in leading industries of the U.S. economy, capturing 75% coverage of U.S. equities. Both indices are unmanaged and returns assume the reinvestment of dividends. It is not possible to invest directly in an index. During the periods shown, the Fund’s manager reimbursed certain Fund expenses. Absent this reimbursement, performance would have been lower.
| | |
| 38 | | www.thomaswhitefunds.com |
| | |
| THOMAS WHITE AMERICAN OPPORTUNITIES FUND | | |
Portfolio Manager: Thomas S. White, Jr.
The Thomas White American Opportunities Fund primarily invests in equity securities of mid-size U.S. companies. The Fund may also invest in equity securities of smaller and larger size U.S. companies.
Performance Review
The Thomas White American Opportunities Fund Investor Class shares returned -2.80% during the six-month period ended October 31, 2012 while the Fund’s primary benchmark, the Russell Midcap Index, returned +0.25% and the secondary benchmark S&P 500 Index returned +2.16% during the same period. The Fund’s Investor Class shares returned +8.21%, +12.67%, -0.68%, and +7.57% for the trailing 1-, 3-, 5-, and 10-year periods, against +12.15%, +15.59%, +1.70%, and +10.52%, respectively, for the primary benchmark and +15.21%, +13.21%, +0.36% and +6.91%, respectively, for the secondary benchmark. Since its inception in 1999, the Fund’s Investor Class shares annualized returns are +6.32%, compared to +7.69% for the Russell Midcap Index and +2.77% for the S&P 500 Index.
Economic Outlook Shows Moderate Signs of Improvement
U.S. domestic equities started the review period with a significant correction in May, on heightened concerns over further deceleration in economic growth rates. While domestic economic signals, especially from the labor market, remained uncertain, the external environment darkened as the European fiscal crisis appeared to be worsening. Growth in emerging markets also slowed down, drawing apprehensions about the sustainability of growth in exports of manufactured goods
from the U.S. Though the monthly employment data showed consistent job gains, they were not large enough for a meaningful reduction in the unemployment numbers. The growth rate for the second quarter was revised lower as manufacturing output declined and consumer spending growth was weaker than earlier estimates.
Nevertheless, positive trends in the housing sector and signs of stability in the labor market helped revive investor sentiment in subsequent months. As well, consumer confidence, which was subdued during the early part of the review period, recovered. The external environment also improved as European policymakers appeared to be more accommodative in their negotiations to put together an agreement.
The Federal Reserve’s announcement in September that it will buy mortgage backed securities worth $50 billion every month helped the equity market erase the May decline. The Fed also said it is prepared to keep the target fed rate at the current record low until mid-2015 to support economic growth and bring down the unemployment rate.
Portfolio Review
During the six-month review period ended October 31, 2012, the Thomas White American Opportunities Fund lagged both its primary and secondary benchmarks. Fund holdings in utilities, financials, consumer
| | | | |
| www.thomaswhitefunds.com | | | 39 | |
THOMAS WHITE AMERICAN OPPORTUNITIES FUND
discretionary, and the consumer staples sectors outperformed. Industrials, technology, energy, materials, and healthcare holdings in the Fund portfolio lost value during this period.
Virgin Media, Inc. (+33.51%), which provides broadband internet, telephone, and cable television services, contributed to Fund returns as the company maintained robust gains in new customers and was also able to moderately increase prices for its services. Automobile retailer Autonation, Inc. (+28.40%) benefited from the sustained buoyancy in demand for passenger vehicles in the U.S. market, as better fuel efficiency and low financing costs encourage consumers to trade in their older vehicles. Cable television operator and media services provider Liberty Media Corporation (+27.71%) advanced as steady growth in its customer base helped the company report better than expected earnings. Liberty Media, which won a lawsuit claiming nearly $1 billion in damages from French entertainment company Vivendi, is expected to spin off its Starz cable television business and is awaiting regulatory approval to take control of satellite radio services provider Sirius. Credit card issuer and payment system operator Discover Financial Services (+21.60%) outperformed on expectations of sustained growth in credit card advances and consumer loans, as U.S. consumer sentiment showed signs of improvement. Mylan, Inc. (+16.83%), third largest generic drugs manufacturer globally, added value as its generic drugs pipeline continued to be strong and the company reported better than expected earnings growth. Rating agencies S&P and Moody’s
have both raised Mylan’s credit rating to investment grade, on expectations that the company will be able to sustain its operating performance. Specialty insurer and reinsurer Allied World Assurance Company Holdings AG (+12.68%) also outperformed as it sustained healthy earnings growth and announced an acquisition to expand its asset management business.
Retailer Macy’s, Inc. (-17.52%) detracted the most from Fund returns during the review period on concerns that disruptions due to the storm that hit the U.S. east coast in late October could restrict sales during the holiday season. Bearings and power transmissions manufacturer The Timken Company (-29.42%) underperformed on concerns over weaker industrial demand from across the world. Timken closed a manufacturing unit in Canada in May and has lowered its revenue and earnings guidance for the current year. Business consulting services provider FTI Consulting, Inc. (-27.74%) declined on concerns over slower revenue growth in the coming years as global economic growth remains subdued. Engineering, procurement and construction services provider KBR, Inc. (-30.43%) was also negatively affected by the prospect of weaker industrial investments across the globe. The U.S. government has sued KBR, accusing the company for inflating the cost of trailers for U.S. military troops in Iraq. Cypress Semiconductor Corporation (-34.88%), which provides technology solutions for touch screens, USB controllers, and programmable timing devices, declined as the company’s fourth quarter earnings guidance was below expectations. During the period, Cypress entered into a firm agreement
| | |
| 40 | | www.thomaswhitefunds.com |
OCTOBER 31, 2012
to acquire Ramtron International. Semiconductor fabrication equipment manufacturer Novellus Systems, Inc. (-13.70%) also underperformed as Lam Research Corporation completed the acquisition of the company.
Fiscal Cliff Risk Looms, Despite the Fed’s Supportive Measures
The anticipated ‘fiscal cliff’, or the concurrent government spending cuts and tax hikes that are set to kick in early next year, remains the biggest risk to the U.S. economic outlook, in our view. While consumer sentiment has revived in recent months, it is not considered robust enough to weather a decline in average net incomes due to the scheduled tax increases. In addition, further cuts in government spending could upset the modest ongoing recovery in the labor markets. If the federal and state governments shed more jobs due to budget cuts, this may partly negate the private sector job gains and push up the unemployment rate. Lower government spending could also cloud the outlook for select sectors and discourage hiring and new investments.
Even after President Obama’s reelection, political divisions over ways to solve the fiscal crisis facing the country remain. While both sides have expressed their readiness to compromise and seek common ground on key issues, the time available to put together a broadly acceptable deal is short. Failing to avoid the fiscal cliff is expected to result in significant costs, not just for the domestic economy, but for the global economy as well. Institutions such as the Organization for Economic Cooperation and Development (OECD) have urged policymakers to delay
efforts at fiscal consolidation until economic conditions turn more robust.
The budding recovery in the housing sector could potentially help sustain the recent positive economic trends. Home prices have stabilized across major cities and existing home sales have seen healthy gains. Encouraged by the low mortgage rates and signs of stability in the labor market, potential home buyers are gradually entering the market. The Fed’s purchases of mortgage securities are likely to keep lending rates low, further supporting the housing sector recovery.
Our diligent research process continues to emphasize identifying well managed companies with strong balance sheets that have the potential to weather economic uncertainties. We thank you for investing in the Thomas White American Opportunities Fund.
| | | | |
| www.thomaswhitefunds.com | | | 41 | |
THOMAS WHITE AMERICAN OPPORTUNITIES FUND
| | | | |
| | |
(Unaudited) Industry Allocation | | % of TNA | |
Materials | | | 4.6% | |
Media | | | 2.7% | |
Pharmeceuticals, Biotechnology & Life Sciences | | | 5.3% | |
REITs | | | 7.9% | |
Retailing | | | 10.7% | |
| Semiconductors & Semiconductor Equipment | | | 2.9% | |
| Software & Services | | | 9.1% | |
| Technology Hardware & Equipment | | | 2.0% | |
| Utilities | | | 6.4% | |
| Cash & Other | | | 1.5% | |
| | | | |
| | |
(Unaudited) Industry Allocation | | % of TNA | |
Automobiles & Components | | | 0.8% | |
Banks | | | 3.5% | |
Capital Goods | | | 10.2% | |
Commercial & Professional Services | | | 1.1% | |
Consumer Durables & Apparel | | | 1.4% | |
Consumer Services | | | 2.3% | |
Diversified Financials | | | 4.2% | |
Energy | | | 7.5% | |
Food, Beverage & Tobacco | | | 5.5% | |
Healthcare Equipment & Services | | | 5.0% | |
Insurance | | | 5.4% | |
| | | | |
| | |
(Unaudited) Portfolio Market Cap Mix | | % of TNA | |
| Large Cap (over $15.2 billion) | | | 14.8% | |
| Mid Cap ($2.3-$15.2 billion) | | | 76.9% | |
| Small Cap (under $2.3 billion) | | | 6.8% | |
| Cash & Other | | | 1.5% | |
TNA - Total Net Assets
Fund holdings and industry allocations are subject to change and should not be considered a recommendation to buy or sell any securities. For a complete list of fund holdings, please refer to the Schedule of Investments section of this report.
| | |
| 42 | | www.thomaswhitefunds.com |
| | |
| Investment Portfolio | | October 31, 2012 |
| | | | | | | | | | |
| Industry | | Issue | | Shares | | | Value | |
| | | | | | | | | |
| COMMON STOCKS (98.5%) | |
|
| |
| AUTOMOBILES & COMPONENTS (0.8%) | | | | | | | | |
| | Thor Industries, Inc. | | | 4,800 | | | | $182,544 | |
|
| |
| BANKS (3.5%) | | | | | | | | | | |
| | BB&T Corporation | | | 5,950 | | | | 172,253 | |
| | Fifth Third Bancorp | | | 11,850 | | | | 172,180 | |
| | Regions Financial Corporation | | | 33,300 | | | | 217,116 | |
| | Washington Federal, Inc. | | | 14,500 | | | | 243,310 | |
| | | | | | | | | | |
| | | | | | | | | 804,859 | |
|
| |
| CAPITAL GOODS (10.2%) | | | | | | | | | | |
| | AGCO Corporation * | | | 6,100 | | | | 277,611 | |
| | Chicago Bridge & Iron Company N.V. | | | 3,850 | | | | 144,567 | |
| | CNH Global N.V. * | | | 5,250 | | | | 235,200 | |
| | Eaton Corporation | | | 9,900 | | | | 467,478 | |
| | Owens Corning * | | | 3,100 | | | | 104,129 | |
| | The Timken Company | | | 11,200 | | | | 442,288 | |
| | Triumph Group, Inc. | | | 2,850 | | | | 186,447 | |
| | W. W. Grainger, Inc. | | | 2,400 | | | | 483,384 | |
| | | | | | | | | | |
| | | | | | | | | 2,341,104 | |
|
| |
| COMMERCIAL & PROFESSIONAL SERVICES (1.1%) | |
| | Iron Mountain Incorporated | | | 7,000 | | | | 242,200 | |
|
| |
| CONSUMER DURABLES & APPAREL (1.4%) | |
| | NVR, Inc. * | | | 225 | | | | 203,341 | |
| | Tupperware Brands Corporation | | | 2,000 | | | | 118,200 | |
| | | | | | | | | | |
| | | | | | | | | 321,541 | |
|
| |
| CONSUMER SERVICES (2.3%) | | | | | | | | | | |
| | Brinker International, Inc. | | | 5,100 | | | | 157,080 | |
| | Wyndham Worldwide Corporation | | | 7,500 | | | | 378,000 | |
| | | | | | | | | | |
| | | | | | | | | 535,080 | |
|
| |
| DIVERSIFIED FINANCIALS (4.2%) | | | | | | | | | | |
| | American Capital Ltd. * | | | 13,700 | | | | 161,523 | |
| | Ameriprise Financial, Inc. | | | 6,900 | | | | 402,753 | |
| | Discover Financial Services | | | 9,750 | | | | 399,750 | |
| | | | | | | | | | |
| | | | | | | | | 964,026 | |
|
| |
| ENERGY (7.5%) | | | | | | | | | | |
| | Apache Corporation | | | 1,300 | | | | 107,575 | |
| | Cameron International Corporation * | | | 3,850 | | | | 194,964 | |
| | Energen Corporation | | | 5,400 | | | | 251,910 | |
| | McDermott International, Inc. * | | | 17,050 | | | | 182,606 | |
| | Murphy Oil Corporation | | | 5,400 | | | | 324,000 | |
| | Plains Exploration & Production Company * | | | 8,050 | | | | 287,063 | |
| | SEACOR Holdings Inc. * | | | 2,250 | | | | 197,347 | |
| | Unit Corporation * | | | 4,100 | | | | 165,435 | |
| | | | | | | | | | |
| | | | | | | | | 1,710,900 | |
|
| |
The accompanying notes are an integral part of these financial statements
| | | | |
| www.thomaswhitefunds.com | | | 43 | |
| | |
| Thomas White American Opportunities Fund | | |
| | | | | | | | | | |
| Industry | | Issue | | Shares | | | Value | |
| | | | | | | | | |
| FOOD, BEVERAGE & TOBACCO (5.5%) | | | | | | | | |
| | ConAgra Foods Inc. | | | 7,650 | | | | $212,976 | |
| | Dr Pepper Snapple Group, Inc. | | | 6,150 | | | | 263,527 | |
| | Lorillard, Inc. | | | 2,400 | | | | 278,424 | |
| | Molson Coors Brewing Company | | | 2,400 | | | | 103,536 | |
| | Reynolds American Inc. | | | 9,650 | | | | 401,826 | |
| | | | | | | | | | |
| | | | | | | | | 1,260,289 | |
|
| |
| HEALTH CARE EQUIPMENT & SERVICES (5.0%) | | | | | | | | |
| | AmerisourceBergen Corporation | | | 5,600 | | | | 220,864 | |
| | Catamaran Corporation * | | | 4,400 | | | | 207,504 | |
| | Omnicare, Inc. | | | 6,900 | | | | 238,257 | |
| | St. Jude Medical, Inc. | | | 4,500 | | | | 172,170 | |
| | Zimmer Holdings, Inc. | | | 4,850 | | | | 311,419 | |
| | | | | | | | | | |
| | | | | | | | | 1,150,214 | |
|
| |
| INSURANCE (5.4%) | | | | | | | | | | |
| | Allied World Assurance Company Holdings, AG | | | 4,850 | | | | 389,455 | |
| | Reinsurance Group of America, Incorporated | | | 5,350 | | | | 283,122 | |
| | Torchmark Corporation | | | 6,525 | | | | 330,100 | |
| | Unum Group | | | 11,500 | | | | 233,220 | |
| | | | | | | | | | |
| | | | | | | | | 1,235,897 | |
|
| |
| MATERIALS (4.6%) | | | | | | | | | | |
| | CF Industries Holdings, Inc. | | | 2,400 | | | | 492,456 | |
| | Cliffs Natural Resources Inc. | | | 2,200 | | | | 79,794 | |
| | Cytec Industries Inc. | | | 3,650 | | | | 251,193 | |
| | Reliance Steel & Aluminum Co. | | | 4,000 | | | | 217,360 | |
| | | | | | | | | | |
| | | | | | | | | 1,040,803 | |
|
| |
| MEDIA (2.7%) | | | | | | | | | | |
| | Liberty Media Corporation * | | | 2,350 | | | | 262,424 | |
| | Virgin Media Inc. | | | 10,550 | | | | 345,407 | |
| | | | | | | | | | |
| | | | | | | | | 607,831 | |
|
| |
| PHARMACEUTICALS, BIOTECHNOLOGY & LIFE SCIENCES (5.3%) | | | | | |
| | Bio-Rad Laboratories, Inc. * | | | 1,625 | | | | 164,694 | |
| | Celgene Corporation * | | | 3,800 | | | | 278,616 | |
| | Mylan Inc. * | | | 16,150 | | | | 409,241 | |
| | Myriad Genetics, Inc. * | | | 7,700 | | | | 201,509 | |
| | PerkinElmer, Inc. | | | 5,350 | | | | 165,475 | |
| | | | | | | | | | |
| | | | | | | | | 1,219,535 | |
|
| |
| REITS (7.9%) | | | | | | | | | | |
| | Alexandria Real Estate Equities, Inc. | | | 6,000 | | | | 422,580 | |
| | Federal Realty Investment Trust | | | 2,150 | | | | 231,834 | |
| | HCP, Inc. | | | 7,700 | | | | 341,110 | |
| | Rayonier Inc. | | | 5,700 | | | | 279,357 | |
| | Realty Income Corporation | | | 13,850 | | | | 543,890 | |
| | | | | | | | | | |
| | | | | | | | | 1,818,771 | |
|
| |
The accompanying notes are an integral part of these financial statements
| | |
| 44 | | www.thomaswhitefunds.com |
| | |
| Investment Portfolio | | October 31, 2012 |
| | | | | | | | | | |
| Industry | | Issue | | Shares | | | Value | |
| | | | | | | | | |
| RETAILING (10.7%) | | | | | | | | | | |
| | Aaron’s, Inc. | | | 9,350 | | | | $288,261 | |
| | AutoNation, Inc. * | | | 6,950 | | | | 308,580 | |
| | AutoZone, Inc. * | | | 700 | | | | 262,500 | |
| | Dollar General Corporation * | | | 5,050 | | | | 245,531 | |
| | Dollar Tree Inc * | | | 5,250 | | | | 209,317 | |
| | Foot Locker, Inc. | | | 5,350 | | | | 179,225 | |
| | Genuine Parts Company | | | 7,350 | | | | 459,963 | |
| | Ross Stores, Inc. | | | 8,100 | | | | 493,695 | |
| | | | | | | | | | |
| | | | | | | | | 2,447,072 | |
|
| |
| SEMICONDUCTORS & SEMICONDUCTOR EQUIPMENT (2.9%) | | | | | |
| | Cypress Semiconductor Corporation | | | 18,950 | | | | 187,795 | |
| | Lam Research Corporation * | | | 11,231 | | | | 397,577 | |
| | Marvell Technology Group Ltd. | | | 11,250 | | | | 88,763 | |
| | | | | | | | | | |
| | | | | | | | | 674,135 | |
|
| |
| SOFTWARE & SERVICES (9.1%) | | | | | | | | | | |
| | Accenture plc | | | 6,750 | | | | 455,018 | |
| | Adobe Systems Incorporated * | | | 15,500 | | | | 527,000 | |
| | BMC Software, Inc. * | | | 5,400 | | | | 219,780 | |
| | DST Systems, Inc. | | | 8,350 | | | | 476,284 | |
| | Fiserv, Inc. * | | | 5,300 | | | | 397,182 | |
| | | | | | | | | | |
| | | | | | | | | 2,075,264 | |
|
| |
| TECHNOLOGY HARDWARE & EQUIPMENT (2.0%) | | | | | | | | |
| | Avnet, Inc. * | | | 7,750 | | | | 222,038 | |
| | Zebra Technologies Corporation * | | | 6,350 | | | | 228,155 | |
| | | | | | | | | | |
| | | | | | | | | 450,193 | |
|
| |
| UTILITIES (6.4%) | | | | | | | | | | |
| | CMS Energy Corporation | | | 25,350 | | | | 616,512 | |
| | DTE Energy Company | | | 7,000 | | | | 434,700 | |
| | Great Plains Energy Incorporated | | | 17,950 | | | | 402,798 | |
| | | | | | | | | | |
| | | | | | | | | 1,454,010 | |
|
| |
| Total Common Stocks | | | | | (Cost $19,003,625 | ) | | | 22,536,268 | |
| | | | | | | | | | |
|
| |
| Total Investments | | 98.5% | | | (Cost $19,003,625 | ) | | | $22,536,268 | |
| Other Assets, Less Liabilities: | | 1.5% | | | | | | | 333,451 | |
| Total Net Assets: | | 100.0% | | | | | | | $22,869,719 | |
|
| |
| * | Non-Income Producing Securities |
Industry classifications shown in the Schedule of Investments are based off of the Global Industry Classification Standard (GICS®). GICS was developed by and/or is the exclusive property of MSCI, Inc. and Standard & Poor Financial Services LLC (“S&P”). GICS is a service mark of MSCI and S&P and has been licensed for use by U.S. Bancorp Fund Services, LLC.
The accompanying notes are an integral part of these financial statements
| | | | |
| www.thomaswhitefunds.com | | | 45 | |
| | |
| Thomas White American Opportunities Fund | | |
The following table summarizes the inputs used, as of October 31, 2012, in valuing the Fund’s assets:
| | | | | | | | | | | | | | | | |
| | | Level 1 | | | Level 2 | | | Level 3 | | | Total | |
| Common Stocks | | | | | | | | | | | | | | | | |
| Automobiles & Components | | | $182,544 | | | | $------- | | | | $------- | | | | $182,544 | |
| Banks | | | 804,859 | | | | ------- | | | | ------- | | | | 804,859 | |
| Capital Goods | | | 2,341,104 | | | | ------- | | | | ------- | | | | 2,341,104 | |
| Commercial & Professional Services | | | 242,200 | | | | ------- | | | | ------- | | | | 242,200 | |
| Consumer Durables & Apperal | | | 321,541 | | | | ------- | | | | ------- | | | | 321,541 | |
| Consumer Services | | | 535,080 | | | | ------- | | | | ------- | | | | 535,080 | |
| Diversified Financials | | | 964,026 | | | | ------- | | | | ------- | | | | 964,026 | |
| Energy | | | 1,710,900 | | | | ------- | | | | ------- | | | | 1,710,900 | |
| Food, Beverage & Tobacco | | | 1,260,289 | | | | ------- | | | | ------- | | | | 1,260,289 | |
| Healthcare Equipment & Services | | | 1,150,214 | | | | ------- | | | | ------- | | | | 1,150,214 | |
| Insurance | | | 1,235,897 | | | | ------- | | | | ------- | | | | 1,235,897 | |
| Materials | | | 1,040,803 | | | | ------- | | | | ------- | | | | 1,040,803 | |
| Media | | | 607,831 | | | | ------- | | | | ------- | | | | 607,831 | |
| Pharmeceuticals, Biotechnology & Life Sciences | | | 1,219,535 | | | | ------- | | | | ------- | | | | 1,219,535 | |
| REITs | | | 1,818,771 | | | | ------- | | | | ------- | | | | 1,818,771 | |
| Retailing | | | 2,447,072 | | | | ------- | | | | ------- | | | | 2,447,072 | |
| Semiconductors & Semiconductor Equipment | | | 674,135 | | | | ------- | | | | ------- | | | | 674,135 | |
| Software & Services | | | 2,075,264 | | | | ------- | | | | ------- | | | | 2,075,264 | |
| Technology Hardware & Equipment | | | 450,193 | | | | ------- | | | | ------- | | | | 450,193 | |
| Utilities | | | 1,454,010 | | | | ------- | | | | ------- | | | | 1,454,010 | |
| Total Common Stocks | | | $22,536,268 | | | | $------- | | | | $------- | | | | $22,536,268 | |
| Total Investments | | | $22,536,268 | | | | $------- | | | | $------- | | | | $22,536,268 | |
For more information on valuation inputs, please refer to the accompanying Notes to Financial Statements.
No transfers in and/or out between Levels 1, 2 or 3 were observed.
The accompanying notes are an integral part of these financial statements
| | |
| 46 | | www.thomaswhitefunds.com |
THOMAS WHITE FUNDS
Statements of Assets and Liabilities
October 31, 2012
| | | | | | | | | | | | | | | | | | | | | | | | |
| | | | | | International
Fund | | | | | | Emerging
Markets Fund | | | American
Opportunities
Fund | |
| ASSETS | | | | | | | | | | | | | | | | | | |
| Investments in securities at market value 1 | | $ | | | | | 653,465,107 | | | $ | | | | | 33,148,444 | | | $ | | | | | 22,536,268 | |
| Foreign currency 2 | | | | | | | 109,964 | | | | | | | | 10,694 | | | | | | | | ------- | |
| Cash | | | | | | | 10,480,470 | | | | | | | | 4,934 | | | | | | | | 361,478 | |
| Receivables: | | | | | | | | | | | | | | | | | | | | | | | | |
Dividends and interest | | | | | | | 1,335,546 | | | | | | | | 57,516 | | | | | | | | 51,591 | |
Reclaims | | | | | | | 1,008,011 | | | | | | | | 4,862 | | | | | | | | ------- | |
Fund shares sold | | | | | | | 1,886,423 | | | | | | | | 195 | | | | | | | | ------- | |
Due from manager | | | | | | | 422,903 | | | | | | | | 79,412 | | | | | | | | 35,068 | |
| Prepaid expenses | | | | | | | 28,898 | | | | | | | | 10,696 | | | | | | | | 418 | |
| Total assets | | | | | | | 668,737,322 | | | | | | | | 33,316,753 | | | | | | | | 22,984,823 | |
| | | | | | | | | | | | | | | | | | | |
| LIABILITIES | | | | | | | | | | | | | | | | | | |
| Management and administrative fees payable | | | | | | | 784,239 | | | | | | | | 54,304 | | | | | | | | 31,526 | |
| Accrued expenses | | | | | | | 543,231 | | | | | | | | 101,453 | | | | | | | | 67,339 | |
| Payable for fund shares redeemed | | | | | | | 1,190,807 | | | | | | | | ------- | | | | | | | | 5,446 | |
| Distribution fees (See Note 5) | | | | | | | 1 | | | | | | | | 1 | | | | | | | | ------- | |
| Other liabilities | | | | | | | 116,201 | | | | | | | | 14,609 | | | | | | | | 10,793 | |
| Collateral on loaned securities (See Note 1) 3 | | | | | | | 19,382,904 | | | | | | | | 2,587,510 | | | | | | | | ------- | |
| Total liabilities | | | | | | | 22,017,383 | | | | | | | | 2,757,877 | | | | | | | | 115,104 | |
| | | | | | | | | | | | | | | | | | | |
| NET ASSETS | | | | | | | | | | | | | | | | | | |
| Source of Net Assets: | | | | | | | | | | | | | | | | | | | | | | | | |
| Net capital paid in on shares of beneficial interest | | | | | | | 599,302,293 | | | | | | | | 28,068,872 | | | | | | | | 19,298,714 | |
| Undistributed (Over-distribution of) net investment income | | | | | | | 151,142 | | | | | | | | (4,276 | ) | | | | | | | 38,362 | |
| Accumulated net realized gain/(loss) | | | | | | | (40,474,904 | ) | | | | | | | (1,170,307 | ) | | | | | | | ------- | |
| Net unrealized appreciation/depreciation on: | | | | | | | | | | | | | | | | | | | | | | | | |
Investments and foreign currency translations | | | | | | | 87,765,430 | | | | | | | | 3,664,085 | | | | | | | | 3,532,643 | |
Other assets and liabilities denominated in foreign currency | | | | | | | (24,022 | ) | | | | | | | 502 | | | | | | | | ------- | |
| Net assets | | $ | | | | | 646,719,939 | | | $ | | | | | 30,558,876 | | | $ | | | | | 22,869,719 | |
| The accompanying notes are an integral part of these financial statements. | | | | | | | | | | | | | |
| | | | |
| www.thomaswhitefunds.com | | | 47 | |
THOMAS WHITE FUNDS
Statements of Assets and Liabilities
October 31, 2012
| | | | | | | | | | | | | | | | | | | | | | | | |
| | | | | | International
Fund | | | | | | Emerging
Markets Fund | | | American
Opportunities
Fund | |
| INVESTOR CLASS SHARES | | | | | | | | | | | | | | | | | | |
| Net assets | | $ | | | | | 540,118,161 | | | $ | | | | | 29,601,878 | | | $ | | | | | 22,869,719 | |
| Shares outstanding 4 | | | | | | | 32,635,475 | | | | | | | | 2,640,551 | | | | | | | | 1,721,893 | |
| Net asset value and offering price per share | | $ | | | | | 16.55 | | | $ | | | | | 11.21 | | | $ | | | | | 13.28 | |
| | | | | | | | | | | | | | | | | | | |
| CLASS I SHARES | | | | | | | | | | | | | | | | | | |
| Net assets | | $ | | | | | 106,600,741 | | | $ | | | | | 955,945 | | | | | | | | | |
| Shares outstanding 4 | | | | | | | 6,438,738 | | | | | | | | 85,291 | | | | | | | | | |
| Net asset value and offering price per share | | $ | | | | | 16.56 | | | $ | | | | | 11.21 | | | | | | | | | |
| | | | | | | | | | | | | | | | | | | |
| CLASS A SHARES | | | | | | | | | | | | | | | | | | |
| Net assets | | $ | | | | | 519 | | | $ | | | | | 527 | | | | | | | | | |
| Shares outstanding 4 | | | | | | | 31.34 | | | | | | | | 47.05 | | | | | | | | | |
| Net asset value and offering price per share | | $ | | | | | 16.56 | | | $ | | | | | 11.20 | | | | | | | | | |
| Maximum offering price per share | | $ | | | | | 17.57 | | | $ | | | | | 11.88 | | | | | | | | | |
| | | | | | | | | | | | | | | | | | | |
| CLASS C SHARES | | | | | | | | | | | | | | | | | | |
| Net assets | | $ | | | | | 518 | | | $ | | | | | 526 | | | | | | | | | |
| Shares outstanding 4 | | | | | | | 31.28 | | | | | | | | 46.92 | | | | | | | | | |
| Net asset value and offering (may be subject to contingent deferred sales charge) price per share | | $ | | | | | 16.56 | | | $ | | | | | 11.21 | | | | | | | | | |
1 Cost Basis of Investments: International Fund: $565,699,858 Emerging Markets Fund: $29,484,373 American Opportunities Fund: $19,003,625 | | | | | | | | | | | | | | | | | | | | | | | | |
2 Cost Basis of Cash denominated in foreign currencies: International Fund: $109,783 Emerging Markets Fund: $10,680 | | | | | | | | | | | | | | | | | | | | | | | | |
3 Value of securities out on loan at 10/31/2012: International Fund: $18,497,897 Emerging Markets Fund: $2,513,500 | | | | | | | | | | | | | | | | | | | | | | | | |
| 4 There are an unlimited number of $.01 par value shares of beneficial interest authorized. | | | | | | | | | | | | | | | | | | | | | | | | |
| The accompanying notes are an integral part of these financial statements. | | | | | | | | | | | | | |
| | |
| 48 | | www.thomaswhitefunds.com |
THOMAS WHITE FUNDS
Statements of Operations
Year Ended October 31, 2012
| | | | | | | | | | | | | | | | | | | | | | | | |
International Fund | | | Emerging
Markets Fund | | | American
Opportunities
Fund | |
| INVESTMENT INCOME | | | | | | | | | | | | | | | | | | |
| Income: | | | | | | | | | | | | | | | | | | | | | | | | |
Dividends | | $ | | | | | 18,400,461 | 1 | | $ | | | | | 887,743 | 1 | | $ | | | | | 464,343 | 1 |
Interest | | | | | | | 67,566 | | | | | | | | 7,724 | | | | | | | | 324 | |
Securities lending income (Note 1) | | | | | | | 21,939 | | | | | | | | 726 | | | | | | | | ------- | |
| Total investment income | | | | | | | 18,489,966 | | | | | | | | 896,193 | | | | | | | | 464,667 | |
| Expenses: | | | | | | | | | | | | | | | | | | | | | | | | |
Investment management fees | | | | | | | 5,512,186 | | | | | | | | 283,276 | | | | | | | | 218,298 | |
Business management fees | | | | | | | 38,756 | | | | | | | | 1,786 | | | | | | | | 1,359 | |
Accounting, administration and compliance fees | | | | 574,161 | | | | | | | | 44,955 | | | | | | | | 25,734 | |
Custodian fees | | | | | | | 461,644 | | | | | | | | 60,409 | | | | | | | | 5,989 | |
Transfer agent fees | | | | | | | 189,426 | | | | | | | | 25,097 | | | | | | | | 11,980 | |
Trustees' fees and expenses | | | | | | | 68,302 | | | | | | | | 3,922 | | | | | | | | 2,597 | |
Audit fees and expenses | | | | | | | 43,880 | | | | | | | | 38,395 | | | | | | | | 27,425 | |
Registration fees | | | | | | | 102,604 | | | | | | | | 68,525 | | | | | | | | 20,286 | |
Printing expenses | | | | | | | 142,976 | | | | | | | | 7,485 | | | | | | | | 5,079 | |
Legal fees and expenses | | | | | | | 280,862 | | | | | | | | 13,700 | | | | | | | | 9,314 | |
Distribution expense (Note 5)— | | | | | | | | | | | | | | | | | | | | | | | | |
Class A Shares | | | | | | | ------- | | | | | | | | ------- | | | | | | | | ------- | |
Class C Shares | | | | | | | 1 | | | | | | | | 1 | | | | | | | | ------- | |
Administrative Service Fee— | | | | | | | | | | | | | | | | | | | | | | | | |
Investor Class Shares | | | | | | | 241,579 | | | | | | | | 1,519 | | | | | | | | 388 | |
Class A Shares | | | | | | | ------- | | | | | | | | ------- | | | | | | | | ------- | |
Other expenses | | | | | | | 161,545 | | | | | | | | 24,584 | | | | | | | | 7,910 | |
| Total expenses | | | | | | | 7,817,922 | | | | | | | | 573,654 | | | | | | | | 336,359 | |
Reimbursement from Investment
Manager (Note 4) | | | | | | | (422,903 | ) | | | | | | | (145,520 | ) | | | | | | | (34,182 | ) |
| Net expenses | | | | | | | 7,395,019 | | | | | | | | 428,134 | | | | | | | | 302,177 | |
| Net Investment income | | | | | | | 11,094,947 | | | | | | | | 468,059 | | | | | | | | 162,490 | |
| REALIZED AND UNREALIZED GAIN/(LOSS) ON INVESTMENTS | | | | | | | |
| Net realized gain (loss) on investments & foreign currency transactions | | | | | | | (28,937,504 | ) | | | | | | | (1,170,958 | ) | | | | | | | 786,794 | |
| Net change in unrealized appreciation on investments and foreign currency transactions | | | | | | | 62,827,096 | | | | | | | | 2,753,473 | | | | | | | | 790,707 | |
| Net gain on investments | | | | | | | 33,889,592 | | | | | | | | 1,582,515 | | | | | | | | 1,577,501 | |
| Net increase in net assets from operations | | $ | | | | | 44,984,539 | | | $ | | | | | 2,050,574 | | | $ | | | | | 1,739,991 | |
1 Net of foreign taxes withheld of:
International Fund: $2,025,041
Emerging Markets Fund: $92,153
American Opportunities Fund: $29 | | | | | | | | | | | | | | | | | | | | | | | | |
| The accompanying notes are an integral part of these financial statements. | | | | | | | | | |
| | | | |
| www.thomaswhitefunds.com | | | 49 | |
THOMAS WHITE FUNDS
Statements of Changes in Net Assets
| | | | | | | | | | | | | | | | | | | | | | | | | | | | | | | | |
| | | International Fund | | | Emerging Markets Fund | |
| | | | | | Year Ended
October 31,
2012 | | | | | | Year Ended
October 31,
2011 | | | | | | Year Ended
October 31,
2012 | | | | | | Year Ended
October 31,
2011 | |
| Change in net assets from operations: | | | | | | | | | | | | | | | | | | | | | | | | | | | | | | | | |
Net investment income | | $ | | | | | 11,094,947 | | | $ | | | | | 8,808,783 | | | $ | | | | | 468,059 | | | $ | | | | | 441,461 | |
Net realized gain (loss) on investments | | | | | | | (28,937,504 | ) | | | | | | | 20,582,344 | | | | | | | | (1,170,958 | ) | | | | | | | 69,487 | |
Net unrealized appreciation/depreciation on investments and foreign currency transactions | | | | | | | 62,827,096 | | | | | | | | (58,452,389 | ) | | | | | | | 2,753,473 | | | | | | | | (3,804,371 | ) |
Net increase (decrease) in net assets from operations | | | | | | | 44,984,539 | | | | | | | | (29,061,262 | ) | | | | | | | 2,050,574 | | | | | | | | (3,293,423 | ) |
| Distribution to Investor Class Shareholders: | | | | | | | | | | | | | | | | | | | | | | | | | | | | | | | | |
From net investment income | | | | | | | (9,120,154 | ) | | | | | | | (8,819,119 | ) | | | | | | | (451,792 | ) | | | | | | | (447,129 | ) |
From return of capital | | | | | | | ------- | | | | | | | | ------- | | | | | | | | (2,110 | ) | | | | | | | ------- | |
From realized gains | | | | | | | ------- | | | | | | | | ------- | | | | | | | | ------- | | | | | | | | (57,237 | ) |
| Distribution to Class I Shareholders: | | | | | | | | | | | | | | | | | | | | | | | | | | | | | | | | |
From net investment income | | | | | | | (1,865,908 | ) | | | | | | | ------- | | | | | | | | (15,263 | ) | | | | | | | ------- | |
From return of capital | | | | | | | ------- | | | | | | | | ------- | | | | | | | | (71 | ) | | | | | | | ------- | |
| Distribution to Class A Shareholders: | | | | | | | | | | | | | | | | | | | | | | | | | | | | | | | | |
From net investment income | | | | | | | (9 | ) | | | | | | | ------- | | | | | | | | (8 | ) | | | | | | | ------- | |
From return of capital | | | | | | | ------- | | | | | | | | ------- | | | | | | | | 0 | 1 | | | | | | | ------- | |
| Distribution to Class C Shareholders: | | | | | | | | | | | | | | | | | | | | | | | | | | | | | | | | |
From net investment income | | | | | | | (8 | ) | | | | | | | ------- | | | | | | | | (8 | ) | | | | | | | ------- | |
From return of capital | | | | | | | ------- | | | | | | | | ------- | | | | | | | | 0 | 1 | | | | | | | ------- | |
| Total distributions | | | | | | | (10,986,079 | ) | | | | | | | (8,819,119 | ) | | | | | | | (469,252 | ) | | | | | | | (504,366 | ) |
| Fund share transactions (Note 3) | | | | | | | 134,466,411 | | | | | | | | 30,954,617 | | | | | | | | 600,467 | | | | | | | | 3,976,222 | |
| Total increase (decrease) | | | | | | | 168,464,871 | | | | | | | | (6,925,764 | ) | | | | | | | 2,181,789 | | | | | | | | 178,433 | |
| Net assets: | | | | | | | | | | | | | | | | | | | | | | | | | | | | | | | | |
| Beginning of period | | | | | | | 478,255,068 | | | | | | | | 485,180,832 | | | | | | | | 28,377,087 | | | | | | | | 28,198,654 | |
| End of period | | $ | | | | | 646,719,939 | | | $ | | | | | 478,255,068 | | | $ | | | | | 30,558,876 | | | $ | | | | | 28,377,087 | |
| Undistributed (over-distribution of) net investment income | | $ | | | | | 151,142 | | | $ | | | | | ------- | | | $ | | | | | (4,276 | ) | | $ | | | | | (5,192 | ) |
| The accompanying notes are an integral part of these financial statements. | | | | | |
| | |
| 50 | | www.thomaswhitefunds.com |
THOMAS WHITE FUNDS
Statements of Changes in Net Assets
| | | | | | | | | | | | | | | | | | | | | | | | |
| American Opportunities Fund | | | | | | | | | |
| | | | | | Year Ended
October 31,
2012 | | | | | | Year Ended
October 31,
2011 | | | | | | | | | |
| Change in net assets from operations: | | | | | | | | | | | | | | | | | | | | | | | | |
Net investment income | | $ | | | | | 162,490 | | | $ | | | | | 227,937 | | | | | | | | | |
Net realized gain on investments | | | | | | | 786,794 | | | | | | | | 2,771,186 | | | | | | | | | |
Change in unrealized appreciation/depreciation on investments | | | | | | | 790,707 | | | | | | | | (1,318,436 | ) | | | | | | | | |
Net increase in net assets from operations | | | | | | | 1,739,991 | | | | | | | | 1,680,687 | | | | | | | | | |
| Distribution to Investor Class Shareholders: | | | | | | | | | | | | | | | | | | | | | | | | |
From net investment income | | | | | | | (141,212 | ) | | | | | | | (209,820 | ) | | | | | | | | |
From return of capital | | | | | | | (10,264 | ) | | | | | | | ------- | | | | | | | | | |
From realized gain | | | | | | | (802,679 | ) | | | | | | | (788,667 | ) | | | | | | | | |
| Total distributions | | | | | | | (954,155 | ) | | | | | | | (998,487 | ) | | | | | | | | |
| Fund share transactions (Note 3) | | | | | | | 1,011,863 | | | | | | | | (1,157,190 | ) | | | | | | | | |
| Total increase (decrease) | | | | | | | 1,797,699 | | | | | | | | (474,990 | ) | | | | | | | | |
| Net assets: | | | | | | | | | | | | | | | | | | | | | | | | |
| Beginning of period | | | | | | | 21,072,020 | | | | | | | | 21,547,010 | | | | | | | | | |
| End of period | | $ | | | | | 22,869,719 | | | $ | | | | | 21,072,020 | | | | | | | | | |
| Undistributed net investment income | | $ | | | | | 38,362 | | | $ | | | | | 15,365 | | | | | | | | | |
| 1 Less than $1.00 | | | | | | | | | | | | | | | | | | | | | | | | |
The accompanying notes are an integral part of these financial statements | | | | | | | | | |
| | | | | | | | | | | | | | | | | | | | | |
| | | | |
| www.thomaswhitefunds.com | | | 51 | |
Notes to Financial Statements Year Ended October 31, 2012
NOTE 1. SUMMARY OF ACCOUNTING POLICIES
Lord Asset Management Trust (the “Trust”) was organized as a Delaware business trust on February 9, 1994, as an open-end diversified management investment company. The Trust currently has three series of shares (collectively referred to as the “Funds”) - the Thomas White International Fund (the “International Fund”), which commenced operations with the sale of Investor Class shares on June 28, 1994 and the sale of Class I shares, Class A shares and Class C shares on August 31, 2012; the Thomas White Emerging Markets Fund (the “Emerging Markets Fund”), which commenced operations with the sale of Investor Class shares on June 28, 2010 and the sale of Class I shares, Class A shares and Class C shares on August 31, 2012; and the Thomas White American Opportunities Fund (the “American Opportunities Fund”), which commenced operations with the sale of Investor Class shares on March 4, 1999. The Class A shares and Class C shares are subject to a distribution and service (12b-1) fee of 0.25% and 1.00%, respectively. The investment objective of each Fund is to seek long-term capital growth. The International Fund will primarily invest in equity securities of companies located in the world’s developed countries outside of the U.S. The Emerging Markets Fund will primarily invest in securities of companies located in or whose businesses are closely associated with the world’s emerging markets countries. The American Opportunities Fund primarily invests in U.S. equity securities, with a focus on mid-size and small companies. The following is a summary of significant accounting policies followed in the preparation of the Trust’s financial statements.
(A) VALUATION OF SECURITIES
Securities listed or traded on a recognized national or foreign stock exchange or NASDAQ are valued at the last reported sales prices on the principal exchange on which the securities are traded. NASDAQ National Market securities are valued at the NASDAQ official closing price. Over-the-counter securities and listed securities for which no closing sale price is reported are valued at the mean between the last current bid and asked price. Securities for which market quotations are not readily available are valued at fair value as determined by management and approved in good faith by the Board of Trustees. As of October 31, 2012 all securities within the Fund’s portfolio were valued at the last reported sales price on the principal exchange on which the securities are traded and adjusted by a fair value factor when necessary and as further described below. The Trust has retained an independent statistical fair value pricing service to assist in the fair valuation process for securities principally traded in a foreign market in order to adjust for changes in value that may occur between the close of the foreign exchange and the time at which Fund shares are priced. Short term investments are valued at original cost, which combined with accrued interest, approximates market value.
Fair value is defined as the price that would be received to sell an asset or paid to transfer a liability (i.e., the “exit price”) in an orderly transaction between market participants at the measurement date. In determining fair value, the Fund uses various valuation approaches. A three-tiered fair value hierarchy for inputs is used in measuring fair value that maximizes the use
| | |
| 52 | | www.thomaswhitefunds.com |
Notes to Financial Statements Year Ended October 31, 2012
of observable inputs and minimizes the use of unobservable inputs by generally requiring that the most observable inputs be used when available. Observable inputs are those that market participants would use in pricing the asset or liability based on market data obtained from sources independent of a Fund. Unobservable inputs reflect the Fund’s assumptions about the inputs market participants would use in pricing the asset or liability developed based on the best information available in the circumstances. The inputs or methodologies used for valuing securities are not necessarily an indication of the risks associated with investing in those securities.
The fair value hierarchy is categorized into three levels based on the inputs as follows:
Level 1 - Valuations based on unadjusted quoted prices in active markets for identical assets.
Level 2 - Valuations based on quoted prices for similar securities or in markets that are not active or for which all significant inputs are observable, either directly or indirectly.
Level 3 - Valuations based on inputs that are unobservable and significant to the overall fair value measurement.
The following table summarizes the Funds’ investments as of October 31, 2012, based on the inputs used to value them:
| | | | | | | | | | | | |
| | | International
Fund | | | Emerging
Markets
Fund | | | American
Opportunities
Fund | |
| Level 1 - Common Stocks | | | $69,609,046 | | | | $7,010,657 | | | | $22,536,268 | |
| | | | |
| Preferred Stocks | | | 1,936,338 | | | | 731,539 | | | | ------- | |
| | | | |
| Money Market Funds | | | 19,382,904 | | | | 2,877,761 | | | | ------- | |
| | | | |
| Total Level 1 | | | 90,928,288 | | | | 10,619,957 | | | | 22,536,268 | |
| | | | |
| Level 2 - Common Stocks | | | 556,004,684 | | | | 22,528,487 | | | | ------- | |
| | | | |
| Preferred Stocks | | | 6,532,135 | | | | ------- | | | | ------- | |
| | | | |
| Total Level 2 | | | 562,536,819 | | | | 22,528,487 | | | | ------- | |
| | | | |
| Level 3 | | | ------- | | | | ------- | | | | ------- | |
| | | | |
| Total* | | | 653,465,107 | | | | 33,148,444 | | | | 22,536,268 | |
| | * | Additional information regarding the industry and/or geographical classifications of these investments is disclosed in the Schedule of Investments. |
The Fund’s assets assigned to Level 2 are due to certain foreign securities for which a third party statistical pricing service being employed for purposes of fair market valuation. In addition, there were no transfers in and/or out between levels during the reporting period.
| | | | |
| www.thomaswhitefunds.com | | | 53 | |
Notes to Financial Statements Year Ended October 31, 2012
(B) MULTICLASS OPERATIONS AND ALLOCATIONS
Expenses of the Funds that are not directly attributable to a specific class of shares are prorated among the classes based on the relative net assets of each class. Expenses directly attributable to a class of shares, which presently only include 12b-1 distribution fees and administrative services fees, are recorded to the specific class.
Income, realized and unrealized capital gains and losses of the Funds are prorated among the classes based on the relative net assets of each class.
(C) MARKET RISK
Investing in securities of foreign companies and foreign governments involves special risks and considerations not typically associated with investing in U.S. companies and securities of the U.S. government. These risks include revaluation of currencies and future adverse political and economic developments. Moreover, securities of many foreign companies and foreign governments and their markets may be less liquid and their prices more volatile than those of securities of comparable U.S. companies and securities of the U.S. government.
(D) FOREIGN CURRENCY TRANSLATION
Portfolio securities and other assets and liabilities denominated in foreign currencies are translated into U.S. dollar amounts at date of valuation. Purchases and sales of portfolio securities and income items denominated in foreign currencies are translated into U.S. dollar amounts on the respective dates of such transactions. When the Fund purchases or sells a foreign security, it will customarily enter into a foreign exchange contract to minimize foreign exchange risk from the trade date to the settlement date of such transaction.
The Fund does not isolate the portion of the results of operations resulting from changes in foreign exchange rates on investments from the fluctuations arising from changes in market prices of securities held. Such fluctuations are included with the net realized and unrealized gain or loss from investments.
Net realized gain (loss) on investments and foreign currency transactions include those gains and losses arising from the sale of foreign currencies, currency gains or losses realized between the trade and settlement dates on securities transactions, the differences between the amounts of dividends, and foreign withholding taxes recorded on the Fund’s books, and the U.S. dollar equivalent of the amounts actually received or paid. Net unrealized appreciation (depreciation) on investments and foreign currency translations include the changes in the value of assets and liabilities other than investments in securities at the end of the fiscal year, resulting from changes in the exchange rates.
(E) INCOME TAXES
Each Fund is a separate taxpayer for federal income tax purposes. Each Fund intends to distribute substantially all of its net investment income and net capital gains to its shareholders and to
| | |
| 54 | | www.thomaswhitefunds.com |
Notes to Financial Statements Year Ended October 31, 2012
otherwise comply with the requirements of Subchapter M of the Internal Revenue Code applicable to regulated investment companies. Therefore, no federal income tax provision is required.
The Funds have reviewed all open tax years and major jurisdictions and concluded that there are no significant uncertain tax positions that would require recognition in the financial statements. Open tax years are those that are open for exam by taxing authorities and, as of October 31, 2012, open Federal tax years include the tax years ended October 31, 2009 through 2012. The Funds have no examinations in progress and are also not aware of any tax positions for which it is reasonably possible that the total amounts of unrecognized tax benefits will significantly change in the next twelve months.
Realized gains in foreign countries may be subject to taxes at the Fund level, at rates ranging from approximately 10% to 15%. The Funds accrue for such foreign taxes on net realized and unrealized gains at the appropriate rate for each country.
(F) USE OF ESTIMATES
The preparation of financial statements in conformity with generally accepted accounting principles requires management to make estimates and assumptions that affect the reported amounts of assets and liabilities and disclosure of contingent liabilities at the date of the financial statements and the reported amounts of increases and decreases in net assets from operations during the year. Actual results could differ from these estimates.
(G) SECURITY TRANSACTIONS AND INVESTMENT INCOME
Security transactions are accounted for on a trade date basis. Interest is accrued on a daily basis and dividend income is recorded on the ex-dividend date, except that certain dividends from foreign securities are recorded when the information is available to the Fund. Realized gains and losses are determined using specific identification.
(H) DISTRIBUTIONS TO SHAREHOLDERS
The Funds usually declare and pay dividends from net investment income annually, but may do so more frequently to avoid excise tax. Distributions of net realized capital gains, if any, will be distributed at least annually.
(I) SECURITIES LENDING
The Funds may lend investment securities to investors who borrow securities in order to complete certain transactions. By lending investment securities, a Fund attempts to increase its net investment income through the receipt of interest earned on loan collateral. Any increase or decline in the market price of the securities loaned that might occur and any interest earned or dividends declared during the term of the loan would be for the account of the Fund. Risks of delay in recovery of the securities or even loss of rights in the collateral may occur should the borrower of the securities fail financially. Risk may also arise to the extent that the value of the securities loaned increases above the value of the collateral received. It is each Fund’s policy to
| | | | |
| www.thomaswhitefunds.com | | | 55 | |
Notes to Financial Statements Year Ended October 31, 2012
obtain additional collateral from or return excess collateral to the borrower by the end of the next business day. Therefore, the value of the collateral may be temporarily less than the value of the securities on loan.
Funds that lend securities receive cash, cash equivalents, or other securities as collateral. Initial collateral levels shall not be less than 102% of the market value of the borrowed securities (105% if the collateral and the borrowed securities are denominated in different currencies). Marking to market is performed every business day (subject to de minimis rules of change in market value) for each Fund and each borrower is required to deliver additional collateral when necessary so that the total collateral held in the account for all loans of the Fund to the borrower will not be less than 100% of the market value of all the borrowed securities loaned to the borrower by the Fund. Any cash, cash equivalents, or other securities received as collateral is invested by the securities lending agent in accordance with pre-established guidelines as set forth in the securities lending agreement. The collateral is invested in the Northern Institutional Liquid Asset Portfolio (an open-end regulated investment company) and is shown on the schedules of investments for the International Fund and Emerging Markets Fund. The collateral is reflected in the Funds’ statements of assets and liabilities in the line item labeled “Investments in securities at market value.” A portion of the interest received on the loan collateral is retained by the Fund and the remainder is rebated to the borrower of the securities. From the interest retained by the Funds, 50% is paid to the securities lending agent for the International Fund and Emerging Markets Fund for its services. The net amount of interest earned, after the interest rebate and the allocation to the securities lending agent, is included in the statement of operations as securities lending income. The value of loaned securities and related collateral outstanding at October 31, 2012, are as follows:
| | | | | | | | |
| Fund | | Value of Loaned Securities | | | Value of Collateral | |
| Thomas White International Fund | | | $18,497,897 | | | | $19,382,904 | |
| | | |
| Thomas White Emerging Markets Fund | | | $2,513,500 | | | | $2,587,510 | |
The International Fund and the Emerging Markets Fund have earned interest income on securities lending (after rebates to borrowers and allocation to the securities lending agent) as follows:
| | | | |
| Fund | | Net Interest Earned | |
| Thomas White International Fund | | | $21,939 | |
| | |
| Thomas White Emerging Markets Fund | | | 726 | |
(J) REDEMPTION FEE
The Funds assess a 2% fee on redemptions (including exchanges) of Fund shares held for less than sixty days. Redemption fees are paid to each Fund to help offset transaction costs and to protect the Fund’s long-term shareholders. Each Fund will use the “first-in, first-out” (FIFO) method to determine the sixty-day holding period. Under this method, the date of the
| | |
| 56 | | www.thomaswhitefunds.com |
Notes to Financial Statements Year Ended October 31, 2012
redemption or exchange will be compared to the earliest purchase date of shares held in the account. If this holding period is less than sixty days, the fee will be charged. The International Fund charged $87,714 in redemption fees for the period ended October 31, 2012, which were included in net capital paid.
NOTE 2. SIGNIFICANT SHAREHOLDER
At October 31, 2012, the following table indicates individual shareholders who held significant shares of each Class’s outstanding shares. Investment activities of these shareholders could have a material effect on each Fund.
| | | | | | | | | | |
| Fund | | Share Class | | Number of
Shareholders | | | % Held | |
| International Fund | | Class A | | | 1 | | | | 100.0% | * |
| | | | |
| International Fund | | Class C | | | 1 | | | | 100.0% | * |
| | | | |
| Emerging Markets Fund | | Investor Class | | | 2 | | | | 78.5% | |
| | | | |
| Emerging Markets Fund | | Class A | | | 1 | | | | 100.0% | * |
| | | | |
| Emerging Markets Fund | | Class C | | | 1 | | | | 100.0% | * |
| | | | |
| American Opportunities Fund | | Investor Class | | | 2 | | | | 60.7% | |
| | * | Percentage is held by the Advisor, Thomas White International, Ltd. |
NOTE 3. TRANSACTIONS IN SHARES OF BENEFICIAL INTEREST
As of October 31, 2012, there were an unlimited number of $0.01 par value shares of beneficial interest authorized. Transactions are summarized as follows:
| | | | | | | | | | | | | | | | | | | | | | | | |
| International Fund | |
| | | Year Ended October 31, 2012 | | | Year Ended October 31, 2011 | |
| | | Investor Class | | | Investor Class | |
| | | Shares | | | | | | Amount | | | Shares | | | | | | Amount | |
| Shares sold | | | 17,053,785 | | | $ | | | | | 272,833,336 | | | | 7,995,363 | | | $ | | | | | 136,427,018 | |
| Shares issued on reinvestment of dividends & distributions | | | 425,823 | | | | | | | | 7,034,570 | | | | 552,981 | | | | | | | | 8,548,470 | |
| Shares redeemed | | | (15,598,816 | ) | | | | | | | (251,917,292 | ) | | | (6,762,468 | ) | | | | | | | (114,020,871 | ) |
| Net increase | | | 1,880,792 | | | $ | | | | | 27,950,614 | | | | 1,785,876 | | | $ | | | | | 30,954,617 | |
| Shares outstanding: | | | | | | | | | | | | | | | | | | | | | | | | |
| Beginning of year | | | 30,754,683 | | | | | | | | | | | | 28,968,807 | | | | | | | | | |
| End of year | | | 32,635,475 | | | | | | | | | | | | 30,754,683 | | | | | | | | | |
| | | | |
| www.thomaswhitefunds.com | | | 57 | |
Notes to Financial Statements Year Ended October 31, 2012
| | | | | | | | | | | | | | | | | | |
| | | Period Ended August 31, 2012 Through October 31, 2012 | | | | | | | |
| | | Class I | | | | | | | |
| | | Shares | | | | | | Amount | | | | | | | |
| Shares sold | | | 6,483,904 | | | $ | | | | | 107,274,843 | | | | | | | |
| Shares issued on reinvestment of dividends & distributions | | | 108,627 | | | | | | | | 1,795,599 | | | | | | | |
| Shares redeemed | | | (153,793 | ) | | | | | | | (2,555,662 | ) | | | | | | |
| Net increase | | | 6,438,738 | | | $ | | | | | 106,514,780 | | | | | | | |
| Shares outstanding: | | | | | | | | | | | | | | | | | | |
| Beginning of period | | | ------- | | | | | | | | | | | | | | | |
| End of period | | | 6,438,738 | | | | | | | | | | | | | | | |
| | | Period Ended August 31, 2012
Through October 31, 2012 | | | |
| | | Class A | | | | | | | |
| | | Shares | | | | | | Amount | | | | | | | |
| Shares sold | | | 31 | | | $ | | | | | 500 | | | | | | | |
| Shares issued on reinvestment of dividends & distributions | | | ------- | | | | | | | | 9 | | | | | | | |
| Shares redeemed | | | ------- | | | | | | | | ------- | | | | | | | |
| Net increase | | | 31 | | | $ | | | | | 509 | | | | | | | |
| Shares outstanding: | | | | | | | | | | | | | | | | | | |
| Beginning of period | | | ------- | | | | | | | | | | | | | | | |
| End of period | | | 31 | | | | | | | | | | | | | | | |
| | | Period Ended August 31, 2012
Through October 31, 2012 | | | |
| | | Class C | | | |
| | | Shares | | | | | | Amount | | | | | | | |
| Shares sold | | | 31 | | | $ | | | | | 500 | | | | | | | |
| Shares issued on reinvestment of dividends & distributions | | | ------- | | | | | | | | 8 | | | | | | | |
| Shares redeemed | | | ------- | | | | | | | | ------- | | | | | | | |
| Net increase | | | 31 | | | $ | | | | | 508 | | | | | | | |
| Shares outstanding: | | | | | | | | | | | | | | | | | | |
| Beginning of period | | | ------- | | | | | | | | | | | | | | | |
| End of period | | | 31 | | | | | | | | | | | | | | | |
| | |
| 58 | | www.thomaswhitefunds.com |
Notes to Financial Statements Year Ended October 31, 2012
| | | | | | | | | | | | | | | | | | | | | | | | |
| Emerging Markets Fund | |
| | | Year Ended October 31, 2012 | | | Year Ended October 31, 2011 | |
| | | Investor Class | | | Investor Class | |
| | | Shares | | | | | | Amount | | | Shares | | | | | | Amount | |
| Shares sold | | | 16,330 | | | $ | | | | | 180,348 | | | | 287,693 | | | $ | | | | | 3,503,765 | |
| Shares issued on reinvestment of dividends & distributions | | | 40,672 | | | | | | | | 453,902 | | | | 47,853 | | | | | | | | 504,368 | |
| Shares redeemed | | | (88,692 | ) | | | | | | | (1,005,382 | ) | | | (2,986 | ) | | | | | | | (31,911 | ) |
| Net increase (decrease) | | | (31,690 | ) | | $ | | | | | (371,132 | ) | | | 332,560 | | | $ | | | | | 3,976,222 | |
| Shares outstanding: | | | | | | | | | | | | | | | | | | | | | | | | |
| Beginning of year | | | 2,672,241 | | | | | | | | | | | | 2,339,681 | | | | | | | | | |
| End of year | | | 2,640,551 | | | | | | | | | | | | 2,672,241 | | | | | | | | | |
| | | Period Ended August 31, 2012 Through October 31, 2012 | | | | | | | | | | |
| | | Class I | | | | | | | | | | |
| | | Shares | | | | | | Amount | | | | | | | | | | |
| Shares sold | | | 85,290 | | | $ | | | | | 970,575 | | | | | | | | | | | | | |
| Shares issued on reinvestment of dividends & distributions | | | 1,374 | | | | | | | | 15,334 | | | | | | | | | | | | | |
| Shares redeemed | | | (1,373 | ) | | | | | | | (15,326 | ) | | | | | | | | | | | | |
| Net increase | | | 85,291 | | | $ | | | | | 970,583 | | | | | | | | | | | | | |
| Shares outstanding: | | | | | | | | | | | | | | | | | | | | | | | | |
| Beginning of period | | | ------- | | | | | | | | | | | | | | | | | | | | | |
| End of period | | | 85,291 | | | | | | | | | | | | | | | | | | | | | |
| | | Period Ended August 31, 2012 Through October 31, 2012 | | | | |
| | | Class A | | | | |
| | | Shares | | | | | | Amount | | | | | | | | | | |
| Shares sold | | | 46 | | | $ | | | | | 500 | | | | | | | | | | | | | |
| Shares issued on reinvestment of dividends & distributions | | | 1 | | | | | | | | 8 | | | | | | | | | | | | | |
| Shares redeemed | | | ------- | | | | | | | | ------- | | | | | | | | | | | | | |
| Net increase | | | 47 | | | $ | | | | | 508 | | | | | | | | | | | | | |
| Shares outstanding: | | | | | | | | | | | | | | | | | | | | | | | | |
| Beginning of period | | | ------- | | | | | | | | | | | | | | | | | | | | | |
| End of period | | | 47 | | | | | | | | | | | | | | | | | | | | | |
| | | | |
| www.thomaswhitefunds.com | | | 59 | |
Notes to Financial Statements Year Ended October 31, 2012
| | | | | | | | | | | | | | | | | | |
| | | Period Ended August 31, 2012 Through October 31, 2012 | | | |
| | | Class C | | | |
| | | Shares | | | | | | Amount | | | | | | | |
| Shares sold | | | 46 | | | $ | | | | | 500 | | | | | | | |
| Shares issued on reinvestment of dividends & distributions | | | 1 | | | | | | | | 8 | | | | | | | |
| Shares redeemed | | | ------- | | | | | | | | ------- | | | | | | | |
| Net increase | | | 47 | | | $ | | | | | 508 | | | | | | | |
| Shares outstanding: | | | | | | | | | | | | | | | | | | |
| Beginning of period | | | ------- | | | | | | | | | | | | | | | |
| End of period | | | 47 | | | | | | | | | | | | | | | |
| | | | | | | | | | | | | | | | | | | | | | | | |
| American Opportunities Fund | |
| | | Year Ended October 31, 2012 | | | Year Ended October 31, 2011 | |
| | | Shares | | | | | | Amount | | | Shares | | | | | | Amount | |
| Shares sold | | | 19,077 | | | $ | | | | | 259,999 | | | | 14,435 | | | $ | | | | | 195,650 | |
| Shares issued on reinvestment of dividends & distributions | | | 72,013 | | | | | | | | 951,287 | | | | 78,341 | | | | | | | | 994,926 | |
| Shares redeemed | | | (14,722 | ) | | | | | | | (199,423 | ) | | | (166,963 | ) | | | | | | | (2,347,766 | ) |
| Net increase/ (decrease) | | | 76,368 | | | $ | | | | | 1,011,863 | | | | (74,187 | ) | | $ | | | | | (1,157,190 | ) |
NOTE 4. INVESTMENT MANAGEMENT FEES AND OTHER TRANSACTIONS WITH AFFILIATES
During the period November 1, 2011 to August 30, 2012, each Fund paid a monthly investment management fee to Thomas White International, Ltd. (the “Advisor”) at the rate of 1/12% of the Fund’s average daily net assets, which is equivalent to 1% of the Fund’s average daily net assets annually. During this period, the Advisor had contractually agreed to reimburse its management fee for the International Fund, the Emerging Markets Fund and the American Opportunities Fund to the extent that the total operating fees exceeded 1.40%, 1.50% and 1.35% of the respective Fund’s average daily net assets. Effective August 31, 2012, each Fund pays a monthly investment management fee to the Advisor at the rate of 0.85% of the Fund’s average daily net assets annually. During the period August 31, 2012 to the fiscal year ended October 31, 2012, the Advisor has contractually agreed to reimburse its management fee and/or reimburse the Funds’ operating expenses to the extent necessary to ensure that each Fund’s annual operating expenses do not exceed the following percentages of average daily net assets:
| | |
| 60 | | www.thomaswhitefunds.com |
Notes to Financial Statements Year Ended October 31, 2012
| | | | | | | | | | | | | | | | |
| | | Investor Class | | | Class I | | | Class A | | | Class C | |
| International Fund | | | 1.24% | | | | 0.99% | | | | 1.49% | | | | 1.99% | |
| | | | | |
| Emerging Markets Fund | | | 1.34% | | | | 1.09% | | | | 1.59% | | | | 2.09% | |
| | | | | |
| American Opportunities Fund | | | 1.34% | | | | n/a | | | | n/a | | | | n/a | |
These agreements to reimburse fees renew automatically unless the Advisor gives written notice to end them.
The Advisor may recoup any waived amount from a Fund pursuant to the expense limitation agreements if such reimbursement does not cause the Fund to exceed existing expense limitations or the expense limitation in effect at the time the expense was waived and the reimbursement is made within three years after the year in which the Advisor incurred the expense. As of October 31, 2012, the International, Emerging Markets and American Opportunities Funds had the following amounts (and year of expiration) subject to repayment to the Advisor:
| | | | | | | | | | | | | | |
| Fund | | Share Class | | Year Fees Waived | | | Repayment Expires | | | Balance | |
| International Fund | | Investor Class | | | 2012 | | | | 2015 | | | | $352,201 | |
| | | | | |
| International Fund | | Class I | | | 2012 | | | | 2015 | | | | $70,702 | |
| | | | | |
| Emerging Markets Fund | | Investor Class | | | 2010 | * | | | 2013 | | | | $19,096 | |
| | | | | |
| Emerging Markets Fund | | Investor Class | | | 2011 | | | | 2014 | | | | $102,297 | |
| | | | | |
| Emerging Markets Fund | | Investor Class | | | 2012 | | | | 2015 | | | | $144,622 | |
| | | | | |
| Emerging Markets Fund | | Class I | | | 2012 | | | | 2015 | | | | $896 | |
| | | | | |
| Emerging Markets Fund | | Class A | | | 2012 | | | | 2015 | | | | $1 | |
| | | | | |
| Emerging Markets Fund | | Class C | | | 2012 | | | | 2015 | | | | $1 | |
| | | | | |
| American Opportunities Fund | | Investor Class | | | 2011 | ** | | | 2014 | | | | $5,348 | |
| | | | | |
| American Opportunities Fund | | Investor Class | | | 2012 | | | | 2015 | | | | $34,182 | |
| | * | For the period June 28, 2010, the initial date of the agreement, through October 31, 2010. |
| | ** | For the period March 1, 2011, the initial date of the agreement, through October 31, 2011. |
For the period November 1, 2011 to August 30, 2012, each Fund paid a fee to the Advisor for certain fund accounting, administration and compliance services. For accounting services, the Funds paid a combined $75,000 fee that is prorated based on each Fund’s assets for the first $75,000,000 in individual assets. The International Fund paid 0.0225% of average daily net assets over the next $175 million in assets and 0.0125% of average daily net assets on the remaining balance. The Emerging Markets Fund paid 0.0225% of average daily net assets over the next $175 million in assets and 0.0125% of average daily net assets on the remaining balance. The American Opportunities Fund paid 0.015% of average daily net assets over the next $175 million in assets and 0.01% of average daily net assets on the remaining balance.
For the period November 1, 2011 to August 30, 2012, for fund administration, the Funds paid to the Advisor a combined $75,000 minimum fee that is prorated based on each Fund’s assets for
| | | | |
| www.thomaswhitefunds.com | | | 61 | |
Notes to Financial Statements Year Ended October 31, 2012
the first $75,000,000 in individual assets. The International Fund and Emerging Markets Fund then paid each 0.09% of average daily net assets over the next $150 million in assets, 0.08% of average daily net assets over the next $300 million in assets, 0.06% of average daily net assets over the next $500 million in assets and 0.04% of average daily net assets on the remaining balance. The American Opportunities Fund paid 0.08% of average daily net assets over the next $150 million in assets, 0.07% of average daily net assets over the next $300 million in assets, 0.06% of average daily net assets over the next $500 million in assets and 0.04% of average daily net assets on the remaining balance.
For the period November 1, 2011 to August 30, 2012, each Fund also paid to the Advisor an annual fee of 0.01% of each Fund’s average daily net assets for compliance and legal administration services.
For the period November 1, 2011 to August 30, 2012, for the fund accounting, administration and compliance services provided under the previous agreement, the International Fund, Emerging Markets Fund and American Opportunities Fund paid the Advisor $503,404, $29,456 and $25,168, respectively.
Effective August 31, 2012, the Funds and U.S. Bancorp Fund Services, LLC (the “Administrator”) are parties to a Fund Administration Servicing Agreement. The Administrator provides administrative and fund accounting services pursuant to this agreement and, in consideration of these services, receives a fee computed daily and paid monthly at an annual rate equal to 0.04% of the first $500 million of the average daily net assets of the Funds, 0.035% on the next $500 million of the average daily net assets of the Funds, and 0.03% of the average daily net assets of the Funds in excess of $1 billion, with a minimum annual fee of $108,000. The Administrator will also be compensated for any out of pocket expenses that are reasonably incurred by the Administrator in carrying out its duties under the Administration Agreement.
Effective August 31, 2012, the Advisor and the Funds have adopted a Business Management Agreement under which the Advisor provides certain business management services to the Funds, including, without limitation, monitoring of the Funds’ relationships with third-party service providers and assisting with necessary and appropriate services to the Board of the Trust. For these services, the Advisor is entitled to receive a fee from each Fund at a rate of 0.035% of the Fund’s average daily net assets. For the period August 31, 2012 to October 31, 2012, for the services provided under the Business Management Agreement, the International Fund, Emerging Markets Fund, and American Opportunities Fund paid the Advisor $38,756, $1,786, and $1,359, respectively.
Effective August 31, 2012, the International and Emerging Market Funds have adopted a distribution and shareholder service plan (the “Plan”) pursuant to Rule 12b-1 under the Investment Company Act of 1940. The Plan allows the Funds to compensate Quasar Distributors, LLC for the costs incurred in the distributing the Funds’ Class A or Class C shares at an annual rate of 0.25% and 1.00%, respectively. See Note 5.
| | |
| 62 | | www.thomaswhitefunds.com |
Notes to Financial Statements Year Ended October 31, 2012
Effective August 31, 2012, the Funds have adopted an Administrative Services Plan pursuant to which the Class A shares and Investor Class shares are authorized to make payments to certain entities, which may include banks, broker-dealers and other types of service providers, for providing administrative services with respect to shares of the Funds attributable to or held in the name of the service provider for its clients or customers with whom they have a servicing relationship. Under the terms of the Administrative Services Plan, Class A shares and Investor Class shares are authorized to make payments up to a maximum rate of 0.25% of the average daily net assets of the shares attributable to or held in the name of the service provider for providing the types of applicable administrative services covered under the terms of the Plan.
NOTE 5. SHAREHOLDER SERVICING AND DISTRIBUTION PLANS
The International Fund and Emerging Markets Fund have adopted a distribution and shareholder service plan (the “Plan”) pursuant to Rule 12b-1 under the Investment Company Act of 1940. The Plan allows the International Fund and Emerging Markets Funds to compensate the Distributor for the costs incurred in distributing the Funds’ Class A shares and Class C shares, including amounts paid to brokers or dealers, at an annual rate of 0.25% and 1.00%, respectively, of the average daily net assets of each share Class. The International Fund Class C shares and Emerging Markets Fund Class C shares incurred $1 and $1, respectively, in fees pursuant to the Plan during the time period August 31, 2012 to October 31, 2012.
| | | | |
| www.thomaswhitefunds.com | | | 63 | |
Notes to Financial Statements Year Ended October 31, 2012
NOTE 6. CUSTODIAN AND TRANSFER AGENT FEES
Custodian Fees - Northern Trust is the custodian for the International Fund and Emerging Markets Funds. U.S. Bank is the custodian for the American Opportunities Fund. Northern Trust bills the International Fund and the Emerging Markets Fund quarterly based on the value of their holdings as of the previous quarter end plus transaction fees. U.S. Bank bills the American Opportunities Fund monthly based on the ending value of its holdings plus transaction fees.
Transfer Agent - U.S. Bancorp also serves as the Funds’ transfer agent. Under the terms of the transfer agent agreement, U.S. Bancorp is entitled to $21,000 per year for the International Fund and $10,000 per year for the Emerging Markets Fund and the American Opportunities Fund. In addition, U.S. Bancorp is entitled to account-based fees along with reimbursement of out-of-pocket expenses incurred in providing transfer agent services.
NOTE 7. INVESTMENT TRANSACTIONS
During the year ended October 31, 2012, the cost of purchases and the proceeds from sales of investment securities, other than short-term investments, were as follows:
| | | | | | | | |
| Fund | | Purchases | | | Sales | |
| International Fund | | | $496,010,106 | | | | $364,636,094 | |
| | | |
| Emerging Markets Fund | | | 16,612,405 | | | | 15,414,196 | |
| | | |
| American Opportunities Fund | | | 9,818,321 | | | | 9,635,451 | |
At October 31, 2012, the aggregate gross unrealized appreciation and depreciation of portfolio securities, based upon cost for federal income tax purposes, were as follows:
| | | | | | | | | | | | | | | | |
| Fund | | Tax Cost | | | Unrealized
Appreciation | | | Unrealized
Depreciation | | | Net Unrealized
Appreciation | |
| International Fund | | | $565,826,243 | | | | $98,447,978 | | | | $(10,809,114) | | | | $87,638,864 | |
| | | | | |
| Emerging Markets Fund | | | 29,484,373 | | | | 4,965,588 | | | | (1,301,517) | | | | 3,664,071 | |
| | | | | |
| American Opportunities Fund | | | 18,965,263 | | | | 4,139,125 | | | | (568,120) | | | | 3,571,005 | |
Distributions to Shareholders
The Funds will distribute net investment income and net realized gains, if any, at least once a year. The amount of distributions from net investment income and net realized gains are determined in accordance with federal income tax regulations, which may differ from generally accepted accounting principles. These “book/tax” differences are either temporary or permanent in nature and are primarily due to differing treatments for futures and option transactions, foreign currency transactions, passive foreign investment companies and losses deferred due to wash sales. Permanent differences, primarily due to reclassification of REIT income, resulted in reclassifications among the Funds’ components of net assets at October 31, 2012, the Funds’ tax
| | |
| 64 | | www.thomaswhitefunds.com |
Notes to Financial Statements Year Ended October 31, 2012
year-end. For the Thomas White International Fund, permanent differences resulted in reclassification of $42,274 in undistributed net investment income and ($42,274) in accumulated net realized loss. For the Thomas White Emerging Markets Fund, permanent differences resulted in reclassification of $2,109 in undistributed net investment income, $651 in accumulated net realized gain, and ($2,760) in paid in capital. For the Thomas White American Opportunities Fund, permanent differences resulted in reclassification of $12,282 in undistributed net investment income, $9,637 in accumulated net realized gain, and ($21,919) in paid in capital.
| | | | | | | | | | | | | | | | | | | | |
| Fund | | Undistributed
Ordinary
Income | | | Undistributed
Long-term
Gains | | | Unrealized
Appreciation | | | Capital
Loss
Carryforwards | | | Total
Distributable
Earnings | |
| International Fund | | | $233,948 | | | | $------- | | | | $87,638,864 | | | | $(40,431,325) | | | | $47,441,487 | |
| | | | | | |
| Emerging Markets Fund | | | ------- | | | | ------- | | | | 3,664,071 | | | | (1,170,307) | | | | $2,493,764 | |
| | | | | | |
| American Opportunities Fund | | | ------- | | | | ------- | | | | 3,571,005 | | | | ------- | | | | $3,571,005 | |
As of October 31, 2012, the Funds had tax basis capital losses, which may be carried forward up to eight years to offset future capital gains. Such losses expire as follows:
| | | | | | | | | | | | |
| Fund | | Capital
Loss
Carryforwards | | | Term | | | Expires | |
| International Fund | | | $(11,495,126) | | | | | | | | 10/31/2017 | |
| | | | |
| | | | (21,219,829) | | | | Short-Term | | | | No Expiration | |
| | | | |
| | | | (7,716,370) | | | | Long-Term | | | | No Expiration | |
| | | | |
| Emerging Markets Fund | | | $(1,170,307) | | | | Short-Term | | | | No Expiration | |
Under the Regulated Investment Company Modernization Act of 2010, the Funds are permitted to carry forward capital losses incurred in taxable years beginning after December 22, 2010 for an unlimited period. However, any losses incurred during those future taxable years will be required to be utilized prior to the losses incurred in pre-enactment taxable years. As a result of this, pre-enactment capital loss carryforwards may be more likely to expire unused. Additionally, post-enactment capital losses that are carried forward will retain their character as either short-term or long-term capital losses rather than being considered all short-term as under previous law.
| | | | |
| www.thomaswhitefunds.com | | | 65 | |
Notes to Financial Statements Year Ended October 31, 2012
The tax character of distributions paid during the year ended October 31, 2012 were as follows:
| | | | | | | | | | | | | | | | |
| | | Ordinary
Income | | | Return of
Capital | | | Long-term
Capital Gains | | | Total
Distributions | |
| International Fund - Investor Class | | | $9,120,154 | | | | $------- | | | | $------- | | | | $9,120,154 | |
| | | | | |
| International Fund - Class I | | | 1,865,908 | | | | ------- | | | | ------- | | | | 1,865,908 | |
| | | | | |
| International Fund - Class A | | | 9 | | | | ------- | | | | ------- | | | | 9 | |
| International Fund - Class C | | | 8 | | | | ------- | | | | ------- | | | | 8 | |
| | | | | |
| Emerging Markets Fund - Investor Class | | | 451,792 | | | | 2,110 | | | | ------- | | | | 453,902 | |
| | | | | |
| Emerging Markets Fund - Class I | | | 15,263 | | | | 71 | | | | ------- | | | | 15,334 | |
| | | | | |
| Emerging Markets Fund - Class A | | | 8 | | | | ------- | | | | ------- | | | | 8 | |
| | | | | |
| Emerging Markets Fund - Class C | | | 8 | | | | ------- | | | | ------- | | | | 8 | |
| | | | | |
American Opportunities Fund – Investor Class | | | 141,212 | | | | 10,264 | | | | 802,679 | | | | 954,155 | |
NOTE 8. SUBSEQUENT EVENTS
In preparing these financial statements, the Trust has evaluated events after October 31, 2012 and determined that there were no significant subsequent events that would require adjustment to or additional disclosure in these financial statements.
| | |
| 66 | | www.thomaswhitefunds.com |
Tax Information (Unaudited)
The Funds have elected to pass through to their shareholders the foreign taxes paid for the year ended October 31, 2012 as follows:
| | | | | | | | | | | | |
| | | Foreign Dividend
Income | | | Foreign Taxes
Paid | | | Foreign Taxes Paid
per share | |
| International Fund | | | $19,550,441 | | | | $2,025,041 | | | | $0.0524 | |
| | | | |
| Emerging Markets Fund | | | 942,061 | | | | 92,153 | | | | 0.0343 | |
QUALIFYING DIVIDEND INCOME
For the Thomas White International Fund 67% of the income dividend is qualified. For the Thomas White Emerging Markets Fund 78% of the income dividend is qualified. For the Thomas White American Opportunities Fund 100% of the income dividend is qualified.
ORDINARY INCOME DIVIDEND AND FOREIGN TAX CREDIT
The Thomas White International Fund and the Thomas White Emerging Markets Fund have made an election under Section 853 of the Internal Revenue Code to provide to their shareholders the benefit of foreign tax credits in the per share amount designated below. Therefore, shareholders who must file at U.S. Federal Income tax return will be entitled to a foreign tax credit or itemized deduction in an amount equal to $0.0516 per share of the International Fund and $0.0343 per share of the Emerging Markets Fund for each share owned on October 26, 2012, in computing their tax liability. It is generally more advantageous to claim a credit than a deduction.
| | | | |
| www.thomaswhitefunds.com | | | 67 | |
Year Ended October 31, 2012
FINANCIAL HIGHLIGHTS
| | | | | | | | | | | | | | | | | | | | | | | | | | | | | | | | | | | | | | | | |
| Thomas White International Fund - Investor Class | |
| | | | | | Year
Ended
October 31,
2012^ | | | | | | Year
Ended
October 31,
2011 | | | | | | Year Ended
October 31,
2010 | | | | | | Year
Ended
October 31,
2009 | | | | | | Year
Ended
October 31,
2008 | |
| |
| Per share operating performance (For a share outstanding throughout the year) | |
| Net asset value, beginning of year | | | $ | | | | 15.55 | | | | $ | | | | 16.75 | | | | $ | | | | 14.50 | | | | $ | | | | 11.74 | | | | $ | | | | 22.51 | |
| | | | | | | | | |
| | | | | | | | | | | | | | | | | | | | | | | | | | | | | | | | | | |
| | | | | | | | | | | |
| Income from investment operations: | | | | | | | | | | | | | | | | | | | | | | | | | | | | | | | | | | | | | | | | |
Net investment income 1 | | | | | | | 0.31 | | | | | | | | 0.29 | | | | | | | | 0.20 | | | | | | | | 0.19 | | | | | | | | 0.27 | |
Net realized and unrealized gains/(losses) | | | | | | | 0.97 | | | | | | | | (1.20 | ) | | | | | | | 2.25 | | | | | | | | 2.76 | | | | | | | | (10.79 | ) |
| Total from investment operations | | | | | | | 1.28 | | | | | | | | (0.91 | ) | | | | | | | 2.45 | | | | | | | | 2.95 | | | | | | | | (10.52 | ) |
| | | | | | | | | | | |
| Distributions: | | | | | | | | | | | | | | | | | | | | | | | | | | | | | | | | | | | | | | | | |
From net investment income | | | | | | | (0.28 | ) | | | | | | | (0.29 | ) | | | | | | | (0.20 | ) | | | | | | | (0.19 | ) | | | | | | | (0.25 | ) |
| Change in net asset value for the year | | | | | | | 1.00 | | | | | | | | (1.20 | ) | | | | | | | 2.25 | | | | | | | | 2.76 | | | | | | | | (10.77 | ) |
| Net asset value, end of year | | | $ | | | | 16.55 | | | | $ | | | | 15.55 | | | | $ | | | | 16.75 | | | | $ | | | | 14.50 | | | | $ | | | | 11.74 | |
| Total Return | | | | | | | 8.25% | | | | | | | | (5.42)% | | | | | | | | 16.88% | | | | | | | | 25.15% | | | | | | | | (46.69)% | |
| | | | | | | | | | | |
| Ratios/supplemental data | | | | | | | | | | | | | | | | | | | | | | | | | | | | | | | | | | | | | | | | |
| Net assets, end of year (000) | | | $ | | | | 540,118 | | | | $ | | | | 478,255 | | | | $ | | | | 484,822 | | | | $ | | | | 359,704 | | | | $ | | | | 187,998 | |
| | | | | | | | | | | |
| Ratio to average net assets: | | | | | | | | | | | | | | | | | | | | | | | | | | | | | | | | | | | | | | | | |
| Expenses (net of reimbursement) | | | | | | | 1.31% | 2 | | | | | | | 1.34% | | | | | | | | 1.38% | | | | | | | | 1.46% | | | | | | | | 1.47% | |
| Expenses (prior to reimbursement) | | | | | | | 1.37% | 2 | | | | | | | 1.34% | | | | | | | | 1.38% | | | | | | | | 1.46% | | | | | | | | 1.47% | |
| Net investment income (net of reimbursement) | | | | | | | 1.94% | 2 | | | | | | | 1.70% | | | | | | | | 1.31% | | | | | | | | 1.80% | | | | | | | | 1.49% | |
| Net investment income (prior to reimbursement) | | | | | | | 1.88% | 2 | | | | | | | 1.70% | | | | | | | | 1.31% | | | | | | | | 1.80% | | | | | | | | 1.49% | |
| Portfolio turnover rate 3 | | | | | | | 66% | | | | | | | | 41% | | | | | | | | 44% | | | | | | | | 59% | | | | | | | | 54% | |
| ^ | On August 31, 2012, the initial class of shares was renamed the Investor Class. |
| (1) | Net investment income per share represents net investment income divided by the average shares outstanding throughout the period. |
| (2) | Effective August 31, 2012, the expense cap was decreased from 1.40% to 1.24%. |
| (3) | Portfolio turnover is calculated on the basis of the Fund as a whole without distinguishing between the classes of shares issued. |
| | |
| 68 | | www.thomaswhitefunds.com |
Year Ended October 31, 2012
| | | | | | | | |
| Thomas White International Fund - Class I | |
| | | August 31, 2012^
through October 31, 2012 | |
| Per share operating performance (For a share outstanding throughout the period) | |
| Net asset value, beginning of period | | | $ | | | | 16.23 | |
| | | |
| Income from investment operations: | | | | | | | | |
Net investment income 1 | | | | | | | 0.07 | |
Net realized and unrealized gains | | | | | | | 0.55 | |
| Total from investment operations | | | | | | | 0.62 | |
| | | |
| Distributions from net investment income | | | | | | | (0.29 | ) |
| Change in net asset value for the period | | | | | | | 0.33 | |
| Net asset value, end of period | | | $ | | | | 16.56 | |
| Total return | | | | | | | 3.83% | 2 |
| | | |
| Ratios/supplemental data | | | | | | | | |
| Net assets, end of period (000) | | | $ | | | | 106,601 | |
| | | |
| Ratio to average net assets: | | | | | | | | |
| Expenses (net of reimbursement) | | | | | | | 0.99% | 3 |
| Expenses (prior to reimbursement) | | | | | | | 1.45% | 3 |
| Net investment income (net of reimbursement) | | | | | | | 2.47% | 3 |
| Net investment income (prior to reimbursement) | | | | | | | 2.01% | 3 |
| Portfolio turnover rate 4 | | | | | | | 66% | |
| ^ | On August 31, 2012, Class I shares became effective. |
| (1) | Net investment income per share represents net investment income divided by the average shares outstanding throughout the period. |
| (4) | Portfolio turnover is calculated on the basis of the Fund as a whole without distinguishing between the classes of shares issued. |
| | | | |
| www.thomaswhitefunds.com | | | 69 | |
Year Ended October 31, 2012
FINANCIAL HIGHLIGHTS
| | | | | | | | |
| Thomas White International Fund - Class A | |
| | | August 31, 2012^
through
October 31, 2012 | |
| |
| Per share operating performance (For a share outstanding throughout the period) | |
| Net asset value, beginning of period | | | $ | | | | 16.23 | |
| | | |
| Income from investment operations: | | | | | | | | |
Net investment income 1 | | | | | | | 0.06 | |
Net realized and unrealized gains | | | | | | | 0.56 | |
| Total from investment operations | | | | | | | 0.62 | |
| | | |
| Distributions from net investment income | | | | | | | (0.29 | ) |
| Change in net asset value for the period | | | | | | | 0.33 | |
| Net asset value, end of period | | | $ | | | | 16.56 | |
| Total Return + | | | | | | | 3.80% | 2 |
| | | |
| Ratios/supplemental data | | | | | | | | |
| Net assets, end of period | | | $ | | | | 519 | |
| | | |
| Ratio to average net assets: | | | | | | | | |
| Expenses (net of reimbursement) | | | | | | | 1.49% | 3 |
| Expenses (prior to reimbursement) | | | | | | | 1.66% | 3 |
| Net investment income (net of reimbursement) | | | | | | | 1.99% | 3 |
| Net investment income (prior to reimbursement) | | | | | | | 1.82% | 3 |
| Portfolio turnover rate 4 | | | | | | | 66% | |
| ^ | On August 31, 2012, Class A shares became effective. |
| + | Total return does not reflect any sales charge for Class A Shares. |
| (1) | Net investment income per share represents net investment income divided by the average shares outstanding throughout the period. |
| (4) | Portfolio turnover is calculated on the basis of the Fund as a whole without distinguishing between the classes of shares issued. |
| | |
| 70 | | www.thomaswhitefunds.com |
Year Ended October 31, 2012
| | | | | | | | |
| Thomas White International Fund - Class C | |
| | | August 31, 2012^
through
October 31, 2012 | |
| |
| Per share operating performance (For a share outstanding throughout the period) | |
| Net asset value, beginning of period | | | $ | | | | 16.23 | |
| | | |
| Income from investment operations: | | | | | | | | |
Net investment income 1 | | | | | | | 0.06 | |
Net realized and unrealized gains | | | | | | | 0.54 | |
| Total from investment operations | | | | | | | 0.60 | |
| | | |
| Distributions from net investment income | | | | | | | (0.27 | ) |
| Change in net asset value for the period | | | | | | | 0.33 | |
| Net asset value, end of period | | | $ | | | | 16.56 | |
| Total Return + | | | | | | | 3.68% | 2 |
| | | |
| Ratios/supplemental data | | | | | | | | |
| Net assets, end of period | | | $ | | | | 518 | |
| | | |
| Ratio to average net assets: | | | | | | | | |
| Expenses (net of reimbursement) | | | | | | | 1.99% | 3 |
| Expenses (prior to reimbursement) | | | | | | | 2.16% | 3 |
| Net investment income (net of reimbursement) | | | | | | | 1.47% | 3 |
| Net investment income (prior to reimbursement) | | | | | | | 1.30% | 3 |
| Portfolio turnover rate 4 | | | | | | | 66% | |
| ^ | On August 31, 2012, Class C shares became effective. |
| + | Total return does not reflect any deferred sales charge for Class C Shares. |
| (1) | Net investment income per share represents net investment income divided by the average shares outstanding throughout the period. |
| (4) | Portfolio turnover is calculated on the basis of the Fund as a whole without distinguishing between the classes of shares issued. |
| | | | |
| www.thomaswhitefunds.com | | | 71 | |
Year Ended October 31, 2012
FINANCIAL HIGHLIGHTS
| | | | | | | | | | | | | | | | | | | | | | | | |
| Thomas White Emerging Markets Fund - Investor Class | | | | |
| | | Year Ended
October 31, 2012^ | | | Year Ended
October 31, 2011 | | | June 28,
2010
through
October 31,
2010* | |
| Per share operating performance (For a share outstanding throughout the period) | | | | | | | | | | | | | | | | | |
| Net asset value, beginning of period | | | $ | | | | 10.62 | | | | $ | | | | 12.05 | | | | $ | | | | 10.00 | |
| | | | | | | |
| Income from investment operations: | | | | | | | | | | | | | | | | | | | | | | | | |
Net investment income 1 | | | | | | | 0.18 | | | | | | | | 0.17 | | | | | | | | 0.02 | |
Net realized and unrealized gains (losses) | | | | | | | 0.58 | | | | | | | | (1.41 | ) | | | | | | | 2.05 | |
| Total from investment operations | | | | | | | 0.76 | | | | | | | | (1.24 | ) | | | | | | | 2.07 | |
| | | | | | | |
| Distributions: | | | | | | | | | | | | | | | | | | | | | | | | |
From net investment income | | | | | | | (0.17 | ) | | | | | | | (0.17 | ) | | | | | | | (0.02 | ) |
From net realized gains | | | | | | | ------- | | | | | | | | (0.02 | ) | | | | | | | ------- | |
| Total Distributions | | | | | | | (0.17 | ) | | | | | | | (0.19 | ) | | | | | | | (0.02 | ) |
| Change in net asset value for the year | | | | | | | 0.59 | | | | | | | | (1.43 | ) | | | | | | | 2.05 | |
| Net asset value, end of year | | | $ | | | | 11.21 | | | | $ | | | | 10.62 | | | | $ | | | | 12.05 | |
| Total Return | | | | | | | 7.21% | | | | | | | | (10.26)% | | | | | | | | 20.71% | 2 |
| | | | | | | |
| Ratios/supplemental data | | | | | | | | | | | | | | | | | | | | | | | | |
| Net assets, end of year (000) | | | $ | | | | 29,602 | | | | $ | | | | 28,377 | | | | $ | | | | 28,199 | |
| | | | | | | |
| Ratio to average net assets: | | | | | | | | | | | | | | | | | | | | | | | | |
| Expenses (net of reimbursement) | | | | | | | 1.46% | 3 | | | | | | | 1.50% | | | | | | | | 1.50% | 5 |
| Expenses (prior to reimbursement) | | | | | | | 1.96% | 3 | | | | | | | 1.84% | | | | | | | | 1.72% | 5 |
| Net investment income (net of reimbursement) | | | | | | | 1.61% | 3 | | | | | | | 1.43% | | | | | | | | 0.57% | 5 |
| Net investment income (prior to reimbursement) | | | | | | | 1.11% | 3 | | | | | | | 1.10% | | | | | | | | 0.36% | 5 |
| Portfolio turnover rate 4 | | | | | | | 54% | | | | | | | | 33% | | | | | | | | 4% | |
| ^ | On August 31, 2012, the initial class of shares was renamed the Investor Class. |
| * | Commencement of operations. |
| (1) | Net investment income per share represents net investment income divided by the average shares outstanding throughout the period. |
| (3) | Effective August 31, 2012, the expense cap was decreased from 1.50% to 1.34%. |
| (4) | Portfolio turnover is calculated on the basis of the Fund as a whole without distinguishing between the classes of shares issued. |
| | |
| 72 | | www.thomaswhitefunds.com |
Year Ended October 31, 2012
| | | | | | | | |
| Thomas White Emerging Markets Fund - Class I | |
| | | | | | August 31, 2012^
through
October 31, 2012 | |
| | | |
| Per share operating performance (For a share outstanding throughout the period) | | | | | | | | |
| Net asset value, beginning of period | | | $ | | | | 10.80 | |
| | | |
| Income from investment operations: | | | | | | | | |
Net investment income 1 | | | | | | | 0.04 | |
Net realized and unrealized gains | | | | | | | 0.55 | |
| Total from investment operations | | | | | | | 0.59 | |
| | | |
| Distributions from net investment income | | | | | | | (0.18 | ) |
| Change in net asset value for the period | | | | | | | 0.41 | |
| Net asset value, end of period | | | $ | | | | 11.21 | |
| Total Return | | | | | | | 5.47% | 2 |
| | | |
| Ratios/supplemental data | | | | | | | | |
| Net assets, end of period (000) | | | $ | | | | 956 | |
| | | |
| Ratio to average net assets: | | | | | | | | |
| Expenses (net of reimbursement) | | | | | | | 1.09% 3 | |
| Expenses (prior to reimbursement) | | | | | | | 3.31% 3 | |
| Net investment income (net of reimbursement) | | | | | | | 1.68% 3 | |
| Net investment loss (prior to reimbursement) | | | | | | | (0.54)% 3 | |
| Portfolio turnover rate 4 | | | | | | | 54% | |
| ^ | On August 31, 2012, Class I shares became effective. |
| (1) | Net investment income per share represents net investment income divided by the average shares outstanding throughout the period. |
| (4) | Portfolio turnover is calculated on the basis of the Fund as a whole without distinguishing between the classes of shares issued. |
| | | | |
| www.thomaswhitefunds.com | | | 73 | |
Year Ended October 31, 2012
FINANCIAL HIGHLIGHTS
| | | | | | | | |
| Thomas White Emerging Markets Fund - Class A | |
| | | | | | August 31, 2012^
through
October 31, 2012 | |
| |
| Per share operating performance (For a share outstanding throughout the period) | |
| Net asset value, beginning of period | | | $ | | | | 10.80 | |
| | | |
| Income from investment operations: | | | | | | | | |
Net investment income 1 | | | | | | | 0.03 | |
Net realized and unrealized gains | | | | | | | 0.55 | |
| Total from investment operations | | | | | | | 0.58 | |
| | | |
| Distributions from net investment income | | | | | | | (0.18 | ) |
| Change in net asset value for the period | | | | | | | 0.40 | |
| Net asset value, end of period | | | $ | | | | 11.20 | |
| Total Return + | | | | | | | 5.35% | 2 |
| | | |
| Ratios/supplemental data | | | | | | | | |
| Net assets, end of period | | | $ | | | | 527 | |
| | | |
| Ratio to average net assets: | | | | | | | | |
| Expenses (net of reimbursement) | | | | | | | 1.59% | 3 |
| Expenses (prior to reimbursement) | | | | | | | 2.32% | 3 |
| Net investment income (net of reimbursement) | | | | | | | 1.19% | 3 |
| Net investment income (prior to reimbursement) | | | | | | | 0.46% | 3 |
| Portfolio turnover rate 4 | | | | | | | 54% | |
| ^ | On August 31, 2012, Class A shares became effective. |
| + | Total return does not reflect any sales charge for Class A Shares. |
| (1) | Net investment income per share represents net investment income divided by the average shares outstanding throughout the period. |
| (4) | Portfolio turnover is calculated on the basis of the Fund as a whole without distinguishing between the classes of shares issued. |
| | |
| 74 | | www.thomaswhitefunds.com |
Year Ended October 31, 2012
| | | | | | | | |
| Thomas White Emerging Markets Fund - Class C | |
| | | | | | August 31, 2012^
through
October 31, 2012 | |
| | | |
| Per share operating performance (For a share outstanding throughout the period) | | | | | | | | |
| Net asset value, beginning of period | | | $ | | | | 10.80 | |
| | | |
| Income from investment operations: | | | | | | | | |
Net investment income 1 | | | | | | | 0.02 | |
Net realized and unrealized gains | | | | | | | 0.55 | |
| Total from investment operations | | | | | | | 0.57 | |
| | | |
| Distributions from net investment income | | | | | | | (0.16 | ) |
| Change in net asset value for the period | | | | | | | 0.41 | |
| Net asset value, end of period | | | $ | | | | 11.21 | |
| Total Return + | | | | | | | 5.32% | 2 |
| | | |
| Ratios/supplemental data | | | | | | | | |
| Net assets, end of period | | | $ | | | | 526 | |
| | | |
| Ratio to average net assets: | | | | | | | | |
| Expenses (net of reimbursement) | | | | | | | 2.09% | 3 |
| Expenses (prior to reimbursement) | | | | | | | 2.85% | 3 |
| Net investment income (net of reimbursement) | | | | | | | 0.67% | 3 |
| Net investment loss (prior to reimbursement) | | | | | | | (0.09 | )% 3 |
| Portfolio turnover rate 4 | | | | | | | 54% | |
| ^ | On August 31, 2012, Class C shares became effective. |
| + | Total return does not reflect any deferred sales charge for Class C Shares. |
| (1) | Net investment income per share represents net investment income divided by the average shares outstanding throughout the period. |
| (4) | Portfolio turnover is calculated on the basis of the Fund as a whole without distinguishing between the classes of shares issued. |
| | | | |
| www.thomaswhitefunds.com | | | 75 | |
Year Ended October 31, 2012
FINANCIAL HIGHLIGHTS
| | | | | | | | | | | | | | | | | | | | | | | | | | | | | | | | | | | | | | | | |
Thomas White American Opportunities Fund - Investor Class | |
| | | Year Ended
October 31, 2012^ | | | Year
Ended
October 31, 2011 | | | Year
Ended
October 31, 2010 | | | Year
Ended
October 31, 2009 | | | Year
Ended
October 31, 2008 | |
| Per share operating performance (For a share outstanding throughout the year) | | | | | | | | | |
| Net asset value, beginning of year | | | $ | | | | 12.81 | | | | $ | | | | 12.53 | | | | $ | | | | 10.25 | | | | $ | | | | 10.01 | | | | $ | | | | 15.44 | |
| | | | | | | | | |
| Income from investment operations: | | | | | | | | | | | | | | | | | | | | | | | | | | | | | | | | | |
Net investment income | | | | | | | 0.11 | | | | | | | | 0.13 | | | | | | | | 0.09 | | | | | | | | 0.08 | | | | | | | | 0.05 | |
Net realized and unrealized gains (losses) | | | | | | | 0.94 | | | | | | | | 0.78 | | | | | | | | 2.28 | | | | | | | | 0.28 | | | | | | | | (5.43 | ) |
| Total from investment operations | | | | | | | 1.05 | | | | | | | | 0.91 | | | | | | | | 2.37 | | | | | | | | 0.36 | | | | | | | | (5.38 | ) |
| | | | | | | | | | | |
| Distributions: | | | | | | | | | | | | | | | | | | | | | | | | | | | | | | | | | | | | | | | | |
From net investment income | | | | | | | (0.09 | ) | | | | | | | (0.13 | ) | | | | | | | (0.09 | ) | | | | | | | (0.08 | ) | | | | | | | (0.05 | ) |
From net realized gains | | | | | | | (0.49 | ) | | | | | | | (0.50 | ) | | | | | | | ------- | | | | | | | | ------- | | | | | | | | ------- | |
Tax return of capital | | | | | | | ------- | | | | | | | | ------- | | | | | | | | ------- | | | | | | | | (0.04 | ) | | | | | | | ------- | |
| Total Distributions | | | | | | | (0.58 | ) | | | | | | | (0.63 | ) | | | | | | | (0.09 | ) | | | | | | | (0.12 | ) | | | | | | | (0.05 | ) |
| Change in net asset value for the year | | | | | | | 0.47 | | | | | | | | 0.28 | | | | | | | | 2.28 | | | | | | | | 0.24 | | | | | | | | (5.43 | ) |
| Net asset value, end of year | | | $ | | | | 13.28 | | | | $ | | | | 12.81 | | | | $ | | | | 12.53 | | | | $ | | | | 10.25 | | | | $ | | | | 10.01 | |
| Total Return | | | | | | | 8.21% | | | | | | | | 7.36% | | | | | | | | 23.13% | | | | | | | | 3.62% | 1 | | | | | | | (34.79)% | |
| | | | | | | | | | | |
| Ratios/supplemental data | | | | | | | | | | | | | | | | | | | | | | | | | | | | | | | | | | | | | | | | |
| Net assets, end of year (000) | | | $ | | | | 22,870 | | | | $ | | | | 21,072 | | | | $ | | | | 21,547 | | | | $ | | | | 17,713 | | | | $ | | | | 15,835 | |
| | | | | | | | | | | |
| Ratio to average net assets: | | | | | | | | | | | | | | | | | | | | | | | | | | | | | | | | | | | | | | | | |
| Expenses (net of reimbursement) | | | | | | | 1.35% | 2 | | | | | | | 1.35% | | | | | | | | 1.35% | | | | | | | | 1.35% | | | | | | | | 1.35% | |
| Expenses (prior to reimbursement) | | | | | | | 1.50% | 2 | | | | | | | 1.39% | | | | | | | | 1.57% | | | | | | | | 1.74% | | | | | | | | 1.51% | |
Net investment income
(net of reimbursement) | | | | | | | 0.73% | 2 | | | | | | | 1.02% | | | | | | | | 0.75% | | | | | | | | 1.16% | | | | | | | | 0.38% | |
Net investment income
(prior to reimbursement) | | | | | | | 0.58% | 2 | | | | | | | 0.97% | | | | | | | | 0.53% | | | | | | | | 0.90% | | | | | | | | 0.22% | |
| Portfolio turnover rate | | | | | | | 44% | | | | | | | | 66% | | | | | | | | 53% | | | | | | | | 83% | | | | | | | | 40% | |
| ^ | On August 31, 2012, the initial class of shares was renamed the Investor Class. |
| (1) | Total return includes a voluntary reimbursement by the Advisor for a realized investment loss due to a trading error. This reimbursement increased total return and net asset value per share by 0.056% and $0.01, respectively. |
| (2) | Effective August 31, 2012, the expense cap was decreased from 1.35% to 1.34%. |
| | |
| 76 | | www.thomaswhitefunds.com |
Report of Independent Registered Public Accounting Firm
To the Shareholders and Board of Trustees of Lord Asset Management Trust:
In our opinion, the accompanying statement of assets and liabilities, including the investment portfolios, and the related statements of operations and of changes in net assets and the financial highlights present fairly, in all material respects, the financial position of Thomas White International Fund, Thomas White Emerging Markets Fund and Thomas White American Opportunities Fund (separate portfolios constituting Lord Asset Management Trust, hereafter referred to as the “Funds”) at October 31, 2012, the results of its operations for the year then ended, the changes in its net assets for each of the two years in the period then ended and the financial highlights for each of the periods indicated, in conformity with accounting principles generally accepted in the United States of America. These financial statements and financial highlights (hereafter referred to as “financial statements”) are the responsibility of the Funds’ management; our responsibility is to express an opinion on these financial statements based on our audits. We conducted our audits of these financial statements in accordance with the standards of the Public Company Accounting Oversight Board (United States). Those standards require that we plan and perform the audit to obtain reasonable assurance about whether the financial statements are free of material misstatement. An audit includes examining, on a test basis, evidence supporting the amounts and disclosures in the financial statements, assessing the accounting principles used and significant estimates made by management, and evaluating the overall financial statement presentation. We believe that our audits, which included confirmation of securities at October 31, 2012 by correspondence with the custodian and brokers, provide a reasonable basis for our opinion.
PricewaterhouseCoopers LLP

December 28, 2012
| | | | |
| www.thomaswhitefunds.com | | | 77 | |
THOMAS WHITE FUNDS
DISCLOSURE OF FUND EXPENSES (Unaudited)
As a shareholder of the Funds you incur two types of costs : (1) transaction costs, including sales charges (loads) on purchase payments or contingent deferred sales charges on redemptions, if any, or redemption fees; and (2) ongoing costs, including management fees; distribution fees (12b-1); and other Fund expenses. This example is intended to help you understand your ongoing costs (in dollars) of investing in the Funds and to compare these costs with the ongoing costs of investing in other mutual funds.
The example is based on an investment of $1,000 invested at the beginning of the period and held for the entire period, May 1, 2012 through October 31, 2012 for the Funds’ Investor Class shares, and August 31, 2012 through October 31, 2012 for a Fund’s Class A, Class C and Class I shares.
ACTUAL EXPENSES
The third and fourth columns of the table below provides information about actual account values and actual expenses. You may use the information in this line together with the amount you invested to estimate the expenses you paid over the period. Simply divided your account value by $1,000 (for example, an $8,600 account value divided by $1,000=8.6), then multiply the result by the number in the fourth column under the heading entitled “Expenses Paid During Period” to estimate the expenses you paid on your own account during this period. IRA accounts are charged a $15.00 annual fee each year in September that is not reflected in the actual expense example. If you hold your Fund shares through an IRA account, you should add this cost to the expenses paid shown below.
HYPOTHETICAL EXAMPLE FOR COMPARISON PURPOSES
The fifth and sixth columns of the table below provides information about hypothetical account values and hypothetical expenses based on each Fund’s actual expense ratio and an assumed rate of return of 5% per year before expenses, which is not the Fund’s actual return. The hypothetical account values and expenses may not be used to estimate the actual ending account balance or expenses you paid for the period. You may use this information to compare the ongoing costs of investing in the Funds and other funds. To do so, compare this 5% hypothetical example with the 5% hypothetical examples that appear in the shareholder reports of the other funds. IRA accounts are charged a $15.00 annual fee each year in September that is not reflected in the hypothetical expense example. If you hold your Fund shares through an IRA account, you should separately compare the Funds’ IRA fees to the IRA fees of other funds.
Please note that the expenses shown in the table are meant to highlight your ongoing costs only and do not reflect any transactional costs such as sales charges (loads) or purchase payments or contingent deferred sales charges on redemptions, if any, or redemption fees. Therefore the sixth column of the table is useful in comparing ongoing costs only, and will not help you determine the relative costs of owning different funds. In addition, if these transactional costs were included, your costs may have been higher.
| | |
| 78 | | www.thomaswhitefunds.com |
THOMAS WHITE FUNDS
| | | | | | | | | | | | | | | | | | | | | | | | |
| | | | | | | | | Actual | | | Hypothetical (5% return
before expenses) | |
| | | Fund’s
Annualized
Expense
Ratio* | | | Beginning
Account
Value
May 1,
2012 | | | Ending
Account
Value
Oct. 31,
2012 | | | Expenses
Paid
During
Period | | | Ending
Account
Value
Oct. 31,
2012 | | | Expenses
Paid
During
Period | |
| International Fund | | | | | | | | | | | | | | | | |
| Investor Class | | | 1.27% | | | | $1,000.00 | | | | $1,021.50 | | | | $6.45 | | | | $1,018.75 | | | | $6.44 | |
| Class I | | | 0.99% | | | | $1,000.00 | | | | $1,038.30 | | | | $5.07 | | | | $1,006.68 | | | | $1.66 | |
| Class A | | | 1.49% | | | | $1,000.00 | | | | $1,038.00 | | | | $7.63 | | | | $1,005.85 | | | | $2.49 | |
| Class C | | | 1.99% | | | | $1,000.00 | | | | $1,036.80 | | | | $10.19 | | | | $1,005.02 | | | | $3.32 | |
| Emerging Markets Fund | | | | | | | | | | | | | |
| Investor Class | | | 1.44% | | | | $1,000.00 | | | | $999.60 | | | | $7.24 | | | | $1,017.90 | | | | $7.30 | |
| Class I | | | 1.09% | | | | $1,000.00 | | | | $1,054.70 | | | | $5.63 | | | | $1,006.52 | | | | $1.82 | |
| Class A | | | 1.59% | | | | $1,000.00 | | | | $1,053.50 | | | | $8.21 | | | | $1,005.68 | | | | $2.66 | |
| Class C | | | 2.09% | | | | $1,000.00 | | | | $1,053.20 | | | | $10.79 | | | | $1,004.85 | | | | $3.49 | |
| American Opportunities Fund | | | | | | | | | | | | | |
| Investor Class | | | 1.35% | | | | $1,000.00 | | | | $972.00 | | | | $6.69 | | | | $1,018.35 | | | | $6.85 | |
| | * | Expenses for the International, Emerging Markets and American Opportunities Funds’ annualized expense ratio (after waiver and reimbursements), multiplied by the average account value over the period, multiplied by 184/366 (to reflect the one-half year period) for the Investor Class shares and 61/366 for Class A, Class C and Class I shares (to relect the period since the inception of those classes on 8/31/12). |
QUARTERLY FORM N-Q PORTFOLIO SCHEDULE
The Funds file their complete schedule of portfolio holdings with the Securities and Exchange Commission (“SEC”) for the first and third quarters of each fiscal year on Form N-Q. Each Fund’s Form N-Q is available on the SEC’s website at http://www.sec.gov. The Funds’ Forms N-Q may be reviewed and copied at the SEC’s Public Reference Room in Washington, D.C. Information on the operation of the SEC’s Public reference Room may be obtained by calling 1-800-SEC-0330. Additionally, you may obtain copies of Forms N-Q from the Funds upon request by calling 1-800-811-0535.
PROXY VOTING POLICIES, PROCEDURES AND RECORD
You may obtain a description of the Funds’ (1) proxy voting policies, (2) proxy voting procedures and (3) information regarding how the Funds voted any proxies related to portfolio securities during the most recent 12 month period ended June 30 for which an SEC filing has been made, without charge, upon request by calling the Funds at 1-800-811-0535 or on the EDGAR database on the SEC’s website (http://www.sec.gov).
| | | | |
| www.thomaswhitefunds.com | | | 79 | |
TRUSTEE AND OFFICER DISCLOSURE OCTOBER 31, 2012
| | | | | | | | | | |
| | | | | | |
Name, Address and Age | | Positions held with
Funds | | Length
of Time
Served | | Principal Occupation During Past Five Years | | Number of
Portfolios
overseen
by Trustee | | Other
Directorships
Held by Trustee |
| | | | | | |
Thomas S. White, Jr. 440 S. LaSalle St. Suite 3900 Chicago, IL 60605, 69 | | Trustee | | 18 years | | Chairman of Thomas White International, Ltd. | | 3 | | None |
| | | | | | |
Stathy M. White 440 S. LaSalle St. Suite 3900 Chicago, IL 60605, 55 | | President | | 1 year | | Exec. Vice President of Thomas White International, Ltd; | | N/A | | N/A |
| | | | | | |
David M. Sullivan II 440 S. LaSalle St. Suite 3900 Chicago, IL 60605, 40 | | Vice President and Treasurer | | 12 years | | Treasurer of the Thomas White Funds; Senior Vice President of Thomas White International, Ltd. | | N/A | | N/A |
| | | | | | |
J. Ryan Conner 440 S. LaSalle St. Suite 3900 Chicago, IL 60605, 32 | | Secretary and Chief Compliance Officer | | 1 year | | Vice President of Thomas White International, Ltd.; Business Analyst, Computershare Inc. | | N/A | | N/A |
| | | | | | |
| Independent Trustees | | | | | | | | | | |
| | | | | | |
James N. Bay 440 S. LaSalle St. Suite 3900 Chicago, IL 60605, 62 | | Trustee | | 6 years | | Corporate officer – Bay Foods, Inc., Bays Corporation, Bays English Muffin Corp., Bays Michigan Corp., John Marshall Marketing Corp. (food services) (since 1972). | | 3 | | None |
| | | | | | |
Elizabeth G. Montgomery 440 S. LaSalle St. Suite 3900 Chicago, IL 60605, 68 | | Trustee | | 11 years | | Retired; former President, Graham Group (management consulting). | | 3 | | None |
| | | | | | |
Robert W. Thomas 440 S. LaSalle St. Suite 3900 Chicago, IL 60605, 68 | | Trustee | | 6 years | | President of Thomas Laboratories, Inc. (pharmaceutical company) (since 1992). | | 3 | | None |
| | | | | | |
John N. Venson 440 S. LaSalle St. Suite 3900 Chicago, IL 60605, 65 | | Trustee | | 18 years | | Dean of the California School of Podiatric Medicine (since 2008); Doctor of Podiatric Medicine | | 3 | | None |
ADDITIONAL INFORMATION
The Statement of Additional Information contains additional information regarding the Funds and Trustees, and is available upon request without charge by calling 1-800-811-0535.
| | |
| 80 | | www.thomaswhitefunds.com |
Approval of Investment Advisory Agreements (Unaudited)
At a meeting of the Board of Trustees (the “Board” or the “Trustees”) held on June 18, 2012, the Board reviewed and considered certain newly proposed Amended and Restated Investment Advisory Agreements (the “Amended Agreements”) between Lord Asset Management Trust (the “Trust”), on behalf of the Thomas White American Opportunities Fund (the “American Opportunities Fund”), the Thomas White International Fund (the “International Fund”) and the Thomas White Emerging Markets Fund (the “Emerging Markets Fund” and together with the American Opportunities Fund and the International Fund, the “Funds”), and Thomas White International, Ltd. (“TWI” or the “Advisor”), to determine whether the Amended Agreements should be approved. In particular, the Board reviewed and considered the terms of the Amended Agreements, pursuant to which TWI would provide the Funds with the same level of services as TWI provided to the Funds under the Funds’ previous Investment Advisory Agreements (the “Previous Agreements”), except for the fees, which TWI had proposed to reduce from 1.00% to 0.85% of each Fund’s average daily net assets. In connection with this reduction in the investment advisory fees, the Board also reviewed and considered a reduction to the expense caps under the Expense Limitation Agreements and certain changes to the service arrangements for the Funds. In addition, in connection with these matters, the Board considered that the Trust was implementing a new multi-class share structure for the Funds which involved the adoption of new service and distribution arrangements for the Funds including new fees relating to a new Rule 12b-1 distribution and service plan for certain of the new classes of shares and a new non-distribution administrative services plan for certain of the new classes of shares, and a new Business Management Agreement with the Advisor, which replaced a previous Accounting and Administration Agreement between the Funds and the Advisor.
Following their review and consideration of these matters, the Trustees determined that each Amended Agreement would enable shareholders of the Fund to which it applies to obtain high quality services at a cost that is appropriate, reasonable, and in the best interests of its shareholders. Accordingly, the Board, including the Independent Trustees of the Board, unanimously approved the Amended Agreements. In reaching their decisions, the Trustees requested and obtained from the Advisor such information as they deemed reasonably necessary to evaluate the Amended Agreements. The Trustees also carefully considered the information that they had received throughout the year from the Advisor as part of their regular oversight of the Funds, including information that the Board had most recently considered as part of the renewal of the Previous Agreements at its meeting held on February 27, 2012 (the “February 2012 Meeting”), which included profitability data and comparative fee, expense and performance information prepared by Trust management. In considering the Amended Agreements, the Trustees evaluated a number of considerations that they believed, in light of the legal advice furnished to them by Trust counsel and their own business judgment, to be relevant. They based their decisions on the following considerations, among others, although they did not
| | | | |
| www.thomaswhitefunds.com | | | 81 | |
Approval of Investment Advisory Agreements (Unaudited)
identify any one specific consideration or particular information that was controlling of their decisions:
| | • | | The nature, extent and quality of the advisory services to be provided. The Trustees concluded that TWI is capable of providing high quality services to each Fund, as indicated by the nature and quality of services provided in the past, TWI’s management capabilities demonstrated with respect to the Funds, the professional qualifications and experience of Thomas White as the Funds’ portfolio manager, TWI’s investment and management oversight processes, and the competitive investment performance of the Funds. The Trustees also determined that TWI proposed to provide investment advisory services that were of the same quality under the Amended Agreements as the services it provided to the Funds in the past under the Previous Agreements, and that these services are appropriate in scope and extent in light of the Funds’ operations, the competitive landscape of the investment company business and investor needs. |
| | • | | The investment performance of the Funds. With respect to each Fund, the Trustees had concluded at their February 2012 Meeting on the basis of information derived from the performance data that TWI had achieved investment performance that was competitive relative to comparable funds over trailing periods. With respect to the International Fund, the Trustees took note of the fact that the Fund outperformed its peer group (based on the category average) for the trailing one-, three-, five- and ten-year periods and had outperformed its benchmark index, the MSCI All Country World ex US Index, for the trailing one-, five- and ten-year periods. The Trustees noted that the Emerging Markets Fund had outperformed its peer group (based on the category average) and benchmark index, the MSCI Emerging Markets Index, over the trailing one-year period. The Trustees noted that the American Opportunities Fund had underperformed its peer group (based on the category average) and its primary benchmark index, the Russell Midcap Index, over the trailing three- and five-year periods. The Board took into consideration the Fund’s strong performance over the trailing one-year period against its peer group and benchmark index as well as the Fund’s outperformance of its peer group over the trailing ten-year period. On the basis of the Trustees’ assessment of the nature, extent and quality of advisory services to be provided by TWI under the Amended Agreements, the Trustees concluded that TWI is capable of generating a level of long-term investment performance that is appropriate in light of the Funds’ investment objectives, policies and strategies and competitive with many other investment companies. |
| | • | | The cost of advisory services provided and the level of profitability. On the basis of comparative information derived from the expense data, the Trustees had determined at their February 2012 Meeting that the overall expense ratio of each Fund, on a net basis, was competitive with industry averages, particularly with respect to mutual funds of comparable asset size. The Trustees also noted that, as part of a proposal to establish the |
| | |
| 82 | | www.thomaswhitefunds.com |
Approval of Investment Advisory Agreements (Unaudited)
| | new multi-class structure, TWI had proposed to reduce its contractual investment advisory fee from 1.00% to 0.85% of each Fund’s average daily net assets. The Trustees also noted that TWI had also proposed to contractually reduce the operating expenses (as a percentage of average daily net assets) of: (i) the Class I shares of the International Fund to 0.994%; (ii) the Class I shares of the Emerging Markets Fund to 1.094%; and (iii) the Investor Class shares of the American Opportunity Fund to 1.344%. With respect to the International Fund, the Board noted that, at its February 2012 Meeting, it had taken into consideration information regarding the fees that TWI charges another investment company client for similar sub-investment advisory services and the Trustees had noted that the fees were comparable based on the relevant circumstances of the types of accounts involved. The Board also had considered at its February 2012 Meeting the fees that TWI charges to its non-investment company clients, noting the reasons for the differences in the fees. At its February 2012 Meeting, the Board also had focused on TWI’s current level of profitability with respect to the Funds, and noted that TWI’s profitability was acceptable and consistent with applicable industry averages and that TWI is committed to using its own resources to help grow the Funds. The Trustees then noted TWI’s commitment to establishing a multi-class structure, increasing the exposure of the Web site and implementing other marketing initiatives to help promote the Funds and that the costs of the Web site are being borne by TWI, which provides an additional benefit to the Funds. The Board particularly took note of the fact that the Amended Agreements were being amended for the sole purpose of reducing the investment advisory fee without any reduction to the level or quality of services provided as a result of the reduction in the fees. Accordingly, on the basis of the Board’s review of the fees to be charged by TWI for investment advisory services, the investment advisory and other services provided to the Funds by TWI, and the estimated profitability of TWI’s relationship with each Fund, the Board concluded that the level of investment advisory fees and TWI’s profitability are appropriate in light of the investment advisory fees, overall expense ratios and investment performance of comparable investment companies and the historical profitability of the relationship between each Fund and TWI. The Trustees considered the profitability of the Advisor both before and after the impact of the marketing related expenses that the Advisor incurs out of its own resources in connection with its management of the Funds. |
| | • | | The extent to which economies of scale will be realized as the Funds grow and whether the advisory fees reflect economies of scale. While the Funds’ investment advisory fees under the Amended Agreements do not decrease as Fund assets grow because the Funds are not subject to investment advisory fee breakpoints, the Trustees concluded that the investment advisory fees under the Amended Agreements, as revised, are appropriate in light of the current size of the Funds, and appropriately reflect the current economic environment for TWI and the competitive nature of the mutual fund market. The Trustees noted that TWI will limit the Funds’ total annual operating |
| | | | |
| www.thomaswhitefunds.com | | | 83 | |
Approval of Investment Advisory Agreements (Unaudited)
| | expenses by waiving fees and/or reimbursing certain Fund expenses and, in this regard, took note of the fact that TWI had agreed to lower the expense caps under the Expense Limitation Agreements. The Trustees then noted that they will have the opportunity to periodically re-examine whether a Fund has achieved economies of scale, and the appropriateness of investment advisory fees payable to TWI, in the future. |
| | • | | Benefits to TWI from its relationship with the Funds (and any corresponding benefits to the Funds). The Trustees concluded that other benefits derived by TWI from its relationship with the Funds, including “soft dollar” benefits in connection with Fund brokerage transactions and use of the Funds’ performance track records in advertising materials, are reasonable and fair, and consistent with industry practice and the best interests of the Funds and their shareholders. In addition, the Trustees determined that the Funds would benefit from their relationship to TWI by virtue of TWI’s provision of business management services, in addition to investment advisory services, at a cost to the Funds that is generally comparable to the cost of an outside service provider, which the Trustees determined to be reasonable, fair and in the best interests of Fund shareholders in light of the nature and quality of the services provided and the necessity of the services for the Funds’ operations. In considering information regarding the business management fees payable by the Funds to the Advisor under the terms of the newly implemented Business Management Agreement, which replaced a previous Accounting and Administration Agreement between the Funds and the Advisor, the Board members indicated that they had considered various factors with respect to the proposed business management fees, including the level and amount of these fees and the services to be provided by the Advisor in connection with the Business Management Agreement, in determining the reasonableness of the total fees payable by the Funds to the Advisor for the overall level of services that the Advisor provides to the Funds and their shareholders. In considering the nature and extent of these non-advisory business management services that are to be provided to the Funds by the Advisor, the Board took into consideration: (i) whether the Business Management Agreement is in the best interest of the Funds and their shareholders; (ii) whether the services to be performed under the Business Management Agreement are required for the operation of the Funds; (iii) whether the services provided are of a nature and quality at least equal to the same or similar services provided by independent third parties; and (iv) whether the fees for the services are fair and reasonable in light of the usual and customary charges made by others for services of the same nature and quality. |
| | • | | Other Considerations. In approving the Amended Agreements, the Trustees determined that TWI has made a substantial commitment to the recruitment and retention of high quality personnel, and maintains the financial, compliance and operational resources reasonably necessary to manage the Funds in a professional manner that is consistent with the best interests of the Funds and their shareholders. The Trustees also concluded that TWI has made a significant entrepreneurial commitment to |
| | |
| 84 | | www.thomaswhitefunds.com |
Approval of Investment Advisory Agreements (Unaudited)
| | the management and success of the Funds, which entails a substantial financial and professional commitment, including the Expense Limitation Agreements with respect to each Fund under which TWI has undertaken to waive a portion of its fees to the benefit of Fund shareholders to the extent necessary in accordance with the terms of the Expense Limitation Agreements. The Board also considered matters with respect to the brokerage practices of TWI, including its soft dollar arrangements and its best-execution procedures, and noted that these were reasonable and consistent with standard industry practice. |
| | | | |
| www.thomaswhitefunds.com | | | 85 | |
Privacy Policy
LORD ASSET MANAGEMENT TRUST
THOMAS WHITE INTERNATIONAL, LTD.
I. Commitment to Consumer* Privacy
The Thomas White Funds Family and Thomas White International, Ltd. (collectively, “we” or “us”) are committed to handling consumer information responsibly. We recognize and respect the privacy expectations of our consumers, and we believe that the confidentiality and security of consumers’ personal financial information is one of our fundamental responsibilities.
II. Collection of Consumer Information
We collect, retain and use consumer information only where we reasonably believe it would be useful to the consumer and allowed by law. Consumer information collected by us generally comes from the following sources:
| | • | | Information we receive on applications or other forms; |
| | • | | Information about consumers’ transactions with us, our affiliates, or others. |
III. Disclosure of Consumer Information
We may disclose all of the consumer information we collect to affiliated financial institutions and to third parties who are not our affiliates:
| | • | | to perform marketing services on our behalf or pursuant to a joint marketing agreement between us and another party; and |
| | • | | as otherwise permitted by law. |
We do not disclose any consumer information about our former customers* to anyone except as permitted by law.
IV. Security of Customer Information
We are committed to, and also require our service providers to:
| | • | | maintain policies and procedures designed to assure only appropriate access to, and use of information about our customers; and |
| | • | | maintain physical, electronic and procedural safeguards that comply with federal standards to guard non-public personal information of our customers. |
* As defined in Regulation S-P
| | |
| 86 | | www.thomaswhitefunds.com |
OFFICERS AND TRUSTEES
Thomas S. White, Jr.
Chairman of the Board
James N. Bay
Trustee
Elizabeth G. Montgomery
Trustee
Robert W. Thomas
Trustee
John N. Venson, D.P.M.
Trustee
Stathy M. White
President
David M. Sullivan II
Vice President, Treasurer and
Assistant Secretary
J. Ryan Conner
Secretary and Chief Compliance Officer
INVESTMENT ADVISER AND OTHER SERVICE PROVIDERS
Thomas White International, Ltd.
440 S. LaSalle Street, Suite 3900
Chicago, Illinois 60605-1028
CUSTODIANS
The Northern Trust Company
Chicago, Illinois
U.S. Bank, N.A.
Milwaukee, Wisconsin
LEGAL COUNSEL
Dechert LLP
Washington, DC
INDEPENDENT REGISTERED PUBLIC ACCOUNTING FIRM
PricewaterhouseCoopers LLP
Chicago, Illinois
ADMINISTRATOR and TRANSFER AGENT
U.S. Bancorp Fund Services, LLC
Milwaukee, Wisconsin
DISTRIBUTOR
Quasar Distributors, LLC
FOR CURRENT PERFORMANCE, NET ASSET VALUE OR FOR ASSISTANCE WITH YOUR ACCOUNT, PLEASE CONTACT THE THOMAS WHITE FUNDS AT 800-811-0535 OR VISIT OUR WEB SITE AT WWW.THOMASWHITEFUNDS.COM

www.thomaswhitefunds.com
COVER PICTURE: Angel of Independence statue in front of the National Palace in Mexico City.
Item 2. Code of Ethics.
As of the end of the period covered by this report, the Registrant has adopted a code of ethics that applies to the principal executive officer, chief financial officer and chief accounting officer, or persons performing similar functions of the Registrant. The Registrant has not made any amendments to its code of ethics during the period covered by this report. The Registrant has not granted any waivers from any provisions of the code of ethics during the period covered by this report.
A copy of the code is filed hereto as an exhibit. A copy of the Code of Ethics may be requested free of charge by calling toll free on 1-800-811-0535.
Item 3. Audit Committee Financial Expert.
Registrant’s Board of Trustees has determined that its Audit Committee does not currently have any member that qualifies as an “audit committee financial expert” as defined under rules adopted by the Securities and Exchange Commission. Upon careful review of the background and qualifications of each member of the Audit Committee, the Board was satisfied that each Audit Committee member has sufficient knowledge, experience, and skills to perform the functions required of him or her under the Funds’ Audit Committee Charter adopted by the Board of Trustees and to carry out such functions with the duty of care required of such member. In addition, the Board of Trustees also noted that the Audit Committee Charter provides that the Audit Committee is authorized to retain, at the Registrant’s expense, special counsel and such other experts or consultants as may be necessary to assist the Committee in discharging its responsibilities.
Item 4. Principal Accountant Fees and Services.
The Registrant has engaged its principal accountant, PricewaterhouseCoopers LLC (“PWC”), to perform audit services, audit-related services, tax services and other services during the past two fiscal years. “Audit services” refer to performing an audit of the registrant’s annual financial statements or services that are normally provided by the accountant in connection with statutory and regulatory filings or engagements for those fiscal years. “Audit-related services” refer to the assurance and related services by the principal accountant that are reasonably related to the performance of the audit. “Tax services” refer to professional services rendered by the principal accountant for tax compliance, tax advice, and tax planning. “Other services” are other services provided by the principal accountant. The following table details the aggregate fees billed or expected to be billed for each of the last two fiscal years for audit fees, audit-related fees, tax fees and other fees by the principal accountant.
| | | | |
| | | FYE 10/31/2012 | | FYE 10/31/2011 |
Audit Fees | | $93,500 | | $72,000 |
Audit-Related Fees | | - | | - |
Tax Fees | | $17,300 | | $16,950 |
All Other Fees | | - | | - |
1
The Audit Committee has adopted pre-approval policies and procedures that require the Audit Committee to pre-approve all audit and non-audit services of the Registrant, including services provided to any entity affiliated with the Registrant.
The percentage of fees billed by PWC applicable to non-audit services pursuant to waiver of pre-approval requirement were as follows:
| | | | |
| | | FYE 10/31/2012 | | FYE 10/31/2011 |
Audit-Related Fees | | 0% | | 0% |
Tax Fees | | 0% | | 0% |
All Other Fees | | 0% | | 0% |
All of the principal accountant’s hours spent on auditing the Registrant’s financial statements were attributed to work performed by full-time permanent employees of the principal accountant. There were no non-audit fees billed or expected to be billed by the Registrant’s accountant for services to the Registrant and to the Registrant’s investment adviser (and any other controlling entity, etc.—not sub-adviser) for the last two years.
Item 5. Audit Committee of Listed Registrants.
Not applicable to Registrants who are not listed issuers (as defined in Rule 10A-3 under the Securities Exchange Act of 1934).
Item 6. Investments.
The Schedules of Investments are included as part of the reports to shareholders filed under Item 1 of this Form N-CSR.
Item 7. Disclosure of Proxy Voting Policies and Procedures for Closed-End Management Investment Companies.
Not applicable because the Registrant is not a closed-end management investment company.
Item 8. Portfolio Managers of Closed-End Management Investment Companies.
Not applicable because the Registrant is not a closed-end management investment company.
Item 9. Purchases of Equity Securities by Closed-End Management Investment Company and Affiliated Purchasers.
Not applicable because the Registrant is not a closed-end management investment company.
Item 10. Submission of Matters to a Vote of Security Holders.
There have been no material changes to the procedures by which shareholders may recommend nominees to the Registrant’s Board of Trustees.
2
Item 11. Controls and Procedures.
| (a) | Based on an evaluation of Registrant’s Disclosure Controls and Procedures (as defined in Rule 30a-3(c) under the Investment Company Act of 1940) (the “Disclosure Controls”), as of a date within 90 days prior to the filing date (the “Filing Date”) of this Form N-CSR (the “Report”), the Registrant’s principal executive officer and principal financial officer have concluded that the Disclosure Controls are effectively designed to ensure that information required to be disclosed by the Registrant in the Report is recorded, processed, summarized and reported by the Filing Date, including ensuring that information required to be disclosed in the Report is accumulated and communicated to the Registrant’s management, including the Registrant’s principal executive officer and principal financial officer, as appropriate, to allow timely decisions regarding required disclosure. |
| (b) | There were no changes in the Registrant’s internal control over financial reporting (as defined in Rule 30a-3(d) under the Act) that occurred during the second fiscal quarter of the period covered by this report that has materially affected, or is reasonably likely to materially affect, the Registrant’s internal control over financial reporting. |
Item 12. Exhibits.
(a) (1) Code of ethics. Filed herewith.
(2) Certifications pursuant to Section 302 of the Sarbanes-Oxley Act of 2002. Filed herewith.
(3) Any written solicitation to purchase securities under Rule 23c-1 under the Act sent or given during the period covered by the report by or on behalf of the Registrant to 10 or more persons. Not applicable because the Registrant is not a closed-end management investment company.
| (b) | Certification pursuant to Section 906 of the Sarbanes-Oxley Act of 2002. Filed herewith. |
3
SIGNATURES
Pursuant to the requirements of the Securities Exchange Act of 1934 and the Investment Company Act of 1940, the Registrant has duly caused this report to be signed on its behalf by the undersigned, thereunto duly authorized.
| | |
| (Registrant) LORD ASSET MANAGEMENT TRUST |
| | |
| |
| By (Signature and Title)* | | /s/ Stathy M. White |
| | Stathy M. White |
| | President (Principal Executive Officer) |
Pursuant to the requirements of the Securities Exchange Act of 1934 and the Investment Company Act of 1940, this report has been signed below by the following persons on behalf of the Registrant and in the capacities and on the dates indicated.
| | |
| By (Signature and Title)* | | /s/ Stathy M. White |
| | Stathy M. White |
| | President (Principal Executive Officer) |
| | |
| By (Signature and Title)* | | /s/ David M. Sullivan II |
| | David M. Sullivan II |
| | Treasurer (Principal Financial Officer) |
4
