Exhibit 99.2
| December 5, 2006 Orlando, FL Bank of America 2006 Credit Conference This presentation has been prepared by the management of J.B. POINDEXTER & CO., INC. and is based on or derived from information generally available to the public. No representation is made that it is accurate and complete. This presentation was made on the date hereof and J.B. POINDEXTER & CO., INC. does not assume any obligation to advise you of any material developments or to update the presentation to reflect such developments. This presentation has been prepared solely for information purposes and is not a solicitation or an offer to buy or sell any security or instrument. Caution Concerning Forward-Looking Statements. Forward-looking statements in this presentation, including without limitation, statements relating to the Company’s plans, strategies, objectives, expectations, intentions and adequacy of resources, are made pursuant to the safe harbor provisions of the Private Securities Litigation Reform Act of 1995. Investors are cautioned that such forward-looking statements involve risks and uncertainties including without limitation the Company’s plans, strategies, objectives, expectations and intentions that are subject to change at any time at the discretion of the Company. J. B. P O I N D E X T E R & C O., I N C. |
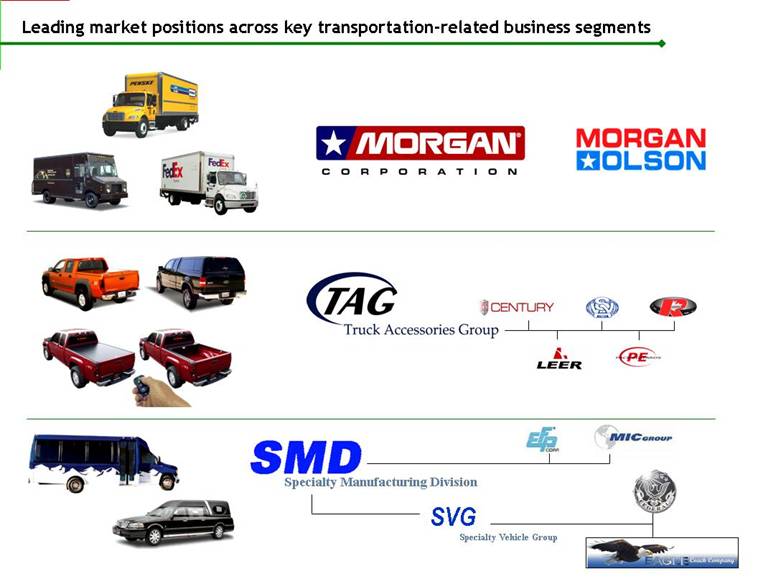
| Leading market positions across key transportation-related business segmentsSpecialty Manufacturing Division SVG Specialty Vehicle Group |
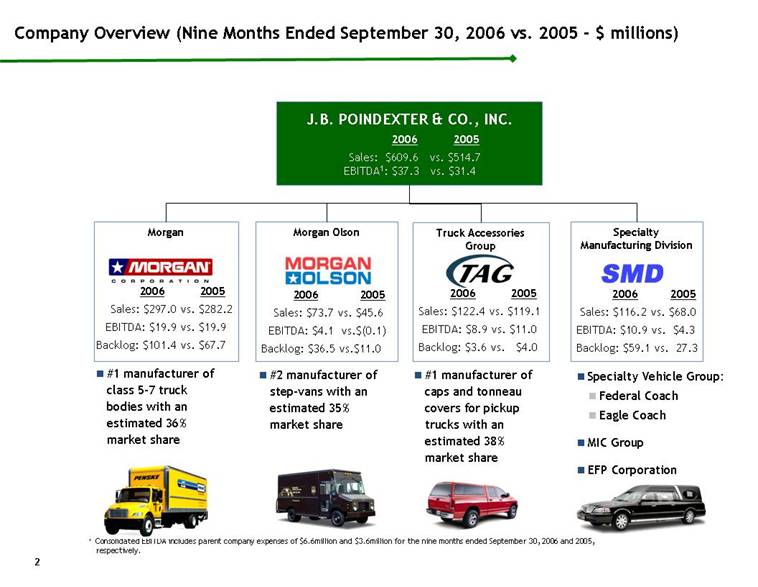
| Company Overview (Nine Months Ended September 30, 2006 vs. 2005 - $ millions) J.B. POINDEXTER & CO., INC. 2006 2005 Sales: $609.6 vs. $514.7 EBITDA1: $37.3 vs. $31.4 #1 manufacturer of class 5-7 truck bodies with an estimated 36% market share Specialty Vehicle Group: Federal Coach Eagle Coach MIC Group EFP Corporation Morgan 2006 2005 Sales: $297.0 vs. $282.2 EBITDA: $19.9 vs. $19.9 Backlog: $101.4 vs. $67.7 Specialty Manufacturing Division 2006 2005 Sales: $116.2 vs. $68.0 EBITDA: $10.9 vs. $4.3 Backlog: $59.1 vs. 27.3 #2 manufacturer of step-vans with an estimated 35% market share Morgan Olson 2006 2005 Sales: $73.7 vs. $45.6EBITDA: $4.1 vs.$(0.1) Backlog: $36.5 vs.$11.0 #1 manufacturer of caps and tonneau covers for pickup trucks with an estimated 38% market share Truck Accessories Group 2006 2005 Sales: $122.4 vs. $119.1 EBITDA: $8.9 vs. $11.0 Backlog: $3.6 vs. $4.0 1 Consolidated EBITDA includes parent company expenses of $6.6million and $3.6million for the nine months ended September 30, 2006 and 2005, respectively.2 |
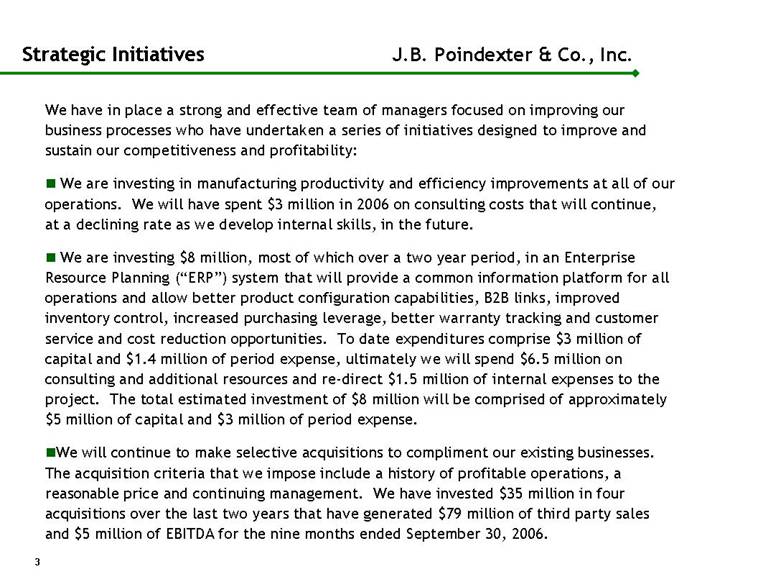
| Strategic Initiatives We have in place a strong and effective team of managers focused on improving our business processes who have undertaken a series of initiatives designed to improve and sustain our competitiveness and profitability: We are investing in manufacturing productivity and efficiency improvements at all of our operations. We will have spent $3 million in 2006 on consulting costs that will continue, at a declining rate as we develop internal skills, in the future. We are investing $8 million, most of which over a two year period, in an Enterprise Resource Planning (“ERP”) system that will provide a common information platform for all operations and allow better product configuration capabilities, B2B links, improved inventory control, increased purchasing leverage, better warranty tracking and customer service and cost reduction opportunities. To date expenditures comprise $3 million of capital and $1.4 million of period expense, ultimately we will spend $6.5 million on consulting and additional resources and re-direct $1.5 million of internal expenses to the project. The total estimated investment of $8 million will be comprised of approximately $5 million of capital and $3 million of period expense. We will continue to make selective acquisitions to compliment our existing businesses. The acquisition criteria that we impose include a history of profitable operations, a reasonable price and continuing management. We have invested $35 million in four acquisitions over the last two years that have generated $79 million of third party sales and $5 million of EBITDA for the nine months ended September 30, 2006. 3 J.B. Poindexter & Co., Inc. |
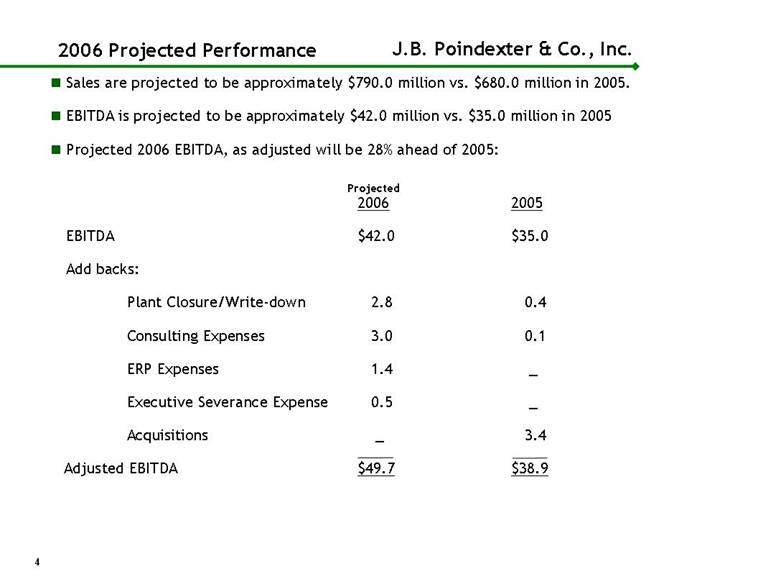
| 2006 Projected Performance Sales are projected to be approximately $790.0 million vs. $680.0 million in 2005. EBITDA is projected to be approximately $42.0 million vs. $35.0 million in 2005 Projected 2006 EBITDA, as adjusted will be 28% ahead of 2005: 2006 2005 EBITDA $42.0 $35.0 Add backs: Plant Closure/Write-down 2.8 0.4 Consulting Expenses 3.0 0.1 ERP Expenses 1.4 _ Executive Severance Expense 0.5 _ Acquisitions _ 3.4 Adjusted EBITDA $49.7 $38.9 4 J.B. Poindexter & Co., Inc. Projected |
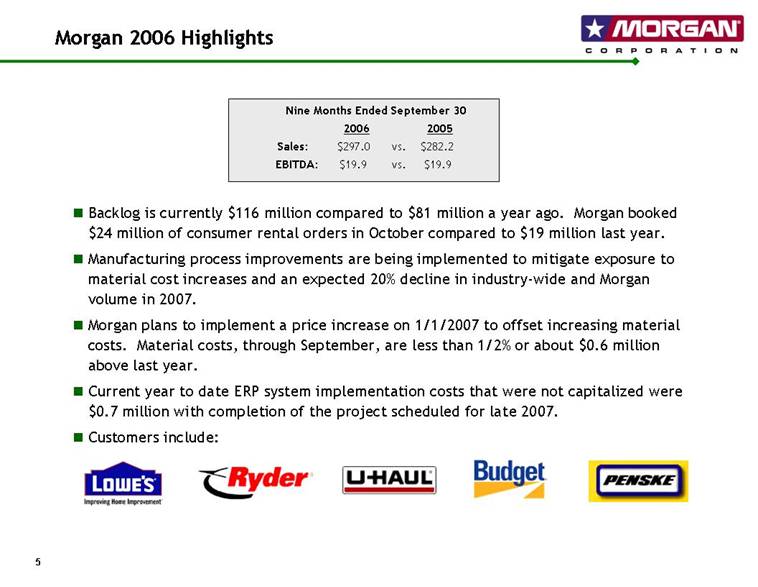
| Morgan 2006 Highlights Backlog is currently $116 million compared to $81 million a year ago. Morgan booked $24 million of consumer rental orders in October compared to $19 million last year. Manufacturing process improvements are being implemented to mitigate exposure to material cost increases and an expected 20% decline in industry-wide and Morgan volume in 2007. Morgan plans to implement a price increase on 1/1/2007 to offset increasing material costs. Material costs, through September, are less than 1/2% or about $0.6 million above last year. Current year to date ERP system implementation costs that were not capitalized were $0.7 million with completion of the project scheduled for late 2007. Customers include: 5 Nine Months Ended September 30 2006 2005 Sales: $297.0 vs. $282.2 EBITDA: $19.9 vs. $19.9 |
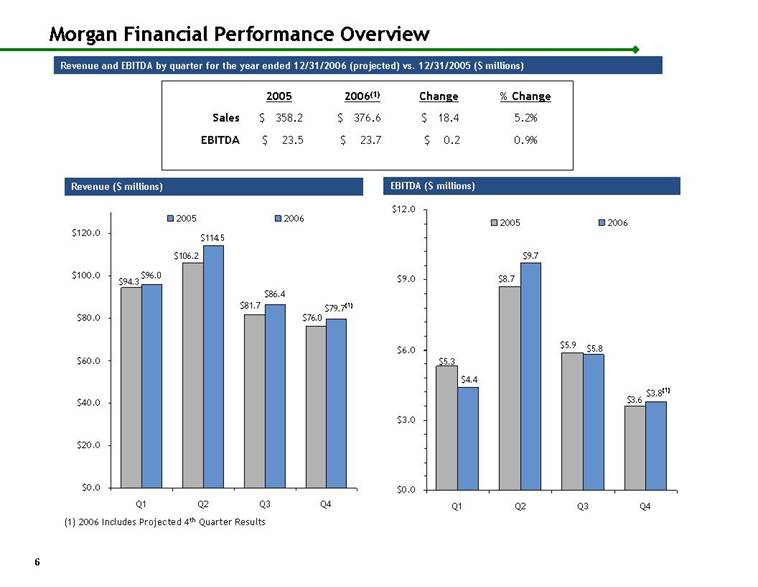
| Morgan Financial Performance Overview Revenue and EBITDA by quarter for the year ended 12/31/2006 (projected) vs. 12/31/2005 ($ millions) Revenue ($ millions) EBITDA ($ millions) 0.9% $ 0.2 $ 23.7 $ 23.5 EBITDA 5.2% $ 18.4 $ 376.6 $ 358.2 Sales % ChangeChange2006 (1)2005 6 (1) 2006 Includes Projected 4th Quarter Results $94.3$81.7$106.2$96.0$79.7(1)$114.5$86.4$0.0$20.0$40.0$60.0$80.0$100.0$120.0Q1Q2Q3Q420052006$76.0$5.3$8.7$5.9$3.6$5.8$9.7$4.4$3.8(1)$0.0$3.0$6.0$9.0$12.0Q1Q2Q3Q420052006 |
| Morgan Olson 2006 Highlights Dramatic turnaround in performance compared to 2005. Rebound in orders from UPS and other customers. Sales to UPS increased 193% or 1,790 units and retail sales increased 15% compared to 2005. Backlog currently $29 million vs. $8 million a year ago. with additional UPS and FEDEX fleet orders and increased retail market penetration. Emphasis on improved manufacturing procedures to reduce costs and inventory. Over $2 million of cost improvements on an annualized basis so far realized. Customers include: 7 Nine Months Ended September 30 2006 2005 Sales: $73.7 vs. $45.6 EBITDA: $4.1 vs. $(0.1) |

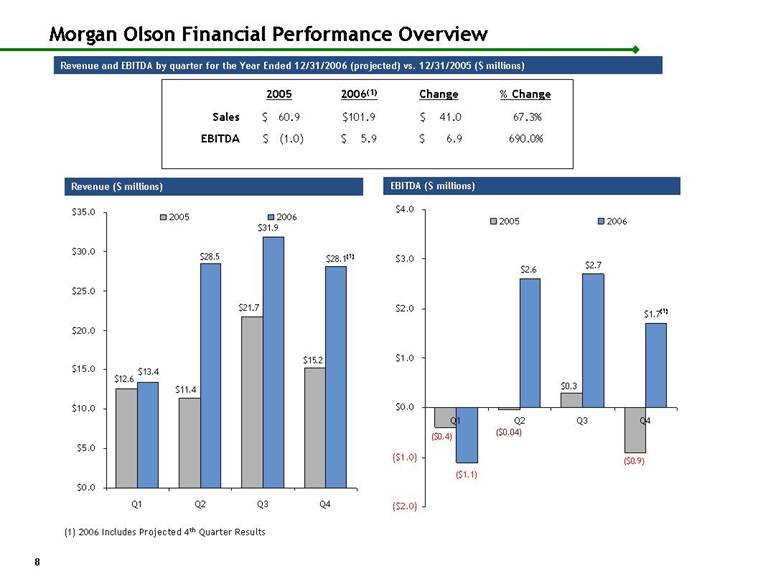
| Morgan Olson Financial Performance Overview Revenue ($ millions) EBITDA ($ millions) 690.0% $ 6.9 $ 5.9 $ (1.0) EBITDA 67.3% $ 41.0 $101.9 $ 60.9 Sales% ChangeChange2006 (1)2005 8 Revenue and EBITDA by quarter for the Year Ended 12/31/2006 (projected) vs. 12/31/2005 ($ millions) (1) 2006 Includes Projected 4th Quarter Results $21.7$11.4$12.6$15.2$28.1(1)$13.4$28.5$31.9$0.0$5.0$1 0.0$15.0$20.0$25.0$30.0$35.0Q1Q2Q3Q420052006($1.1)($0.9)($0.4)($0.04)$0.3$2.6$2.7$1.7(1) ($2.0)($1.0)$0.0$1.0$2.0$3.0$4.0Q1Q2Q3Q420052006 |
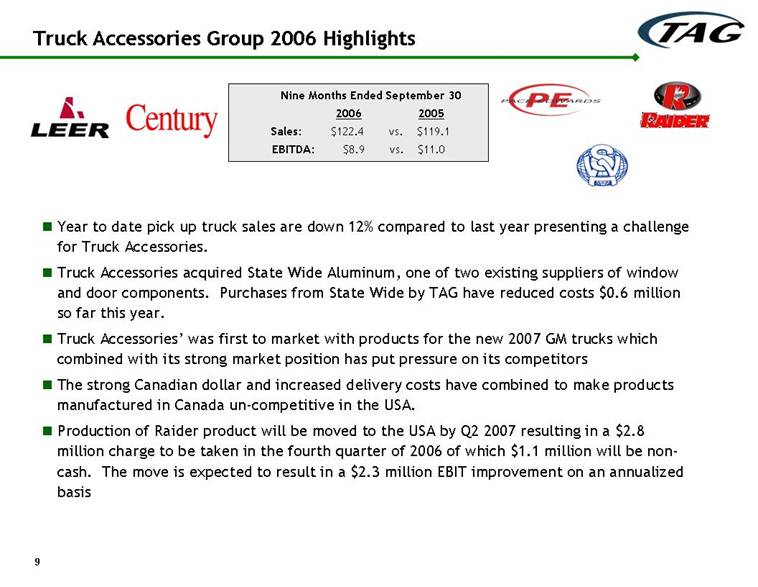
| Truck Accessories Group 2006 Highlights Year to date pick up truck sales are down 12% compared to last year presenting a challenge for Truck Accessories. Truck Accessories acquired State Wide Aluminum, one of two existing suppliers of window and door components. Purchases from State Wide by TAG have reduced costs $0.6 million so far this year. Truck Accessories’ was first to market with products for the new 2007 GM trucks which combined with its strong market position has put pressure on its competitors The strong Canadian dollar and increased delivery costs have combined to make products manufactured in Canada un-competitive in the USA. Production of Raider product will be moved to the USA by Q2 2007 resulting in a $2.8 million charge to be taken in the fourth quarter of 2006 of which $1.1 million will be non-cash. The move is expected to result in a $2.3 million EBIT improvement on an annualized basis 9 Nine Months Ended September 30 2006 2005 Sales: $122.4 vs. $119.1 EBITDA: $8.9 vs. $11.0 |
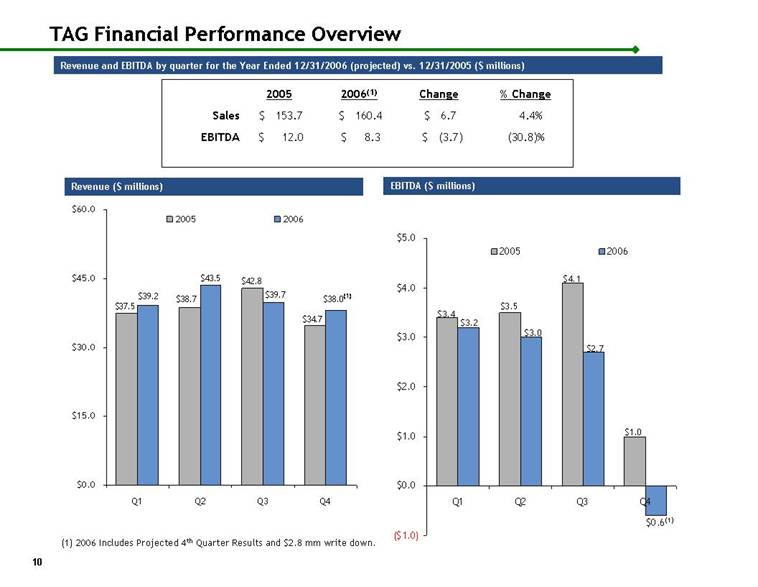
| TAG Financial Performance Overview Revenue ($ millions) EBITDA ($ millions) 10 Revenue and EBITDA by quarter for the Year Ended 12/31/2006 (projected) vs. 12/31/2005 ($ millions) (1) 2006 Includes Projected 4th Quarter Results and $2.8 mm write down. $38.7$42.8$37.5$34.7$39.7$43.5$38.0(1)$39.2$0.0$15.0$30.0$45.0$60.0Q1Q2Q3Q420052006$4.1$3.5$3.4$1.0$2.7$3.0$3.2$0.6(1)($1.0)$0.0$1.0$2.0$3.0$4.0$5.0Q1Q2Q3Q420052006 2005 2006(1) Change % Change Sales $153.7 $160.4 $6.7 4.4% EBITDA $12.0 $8.3 $(3.7) (30.8)% |
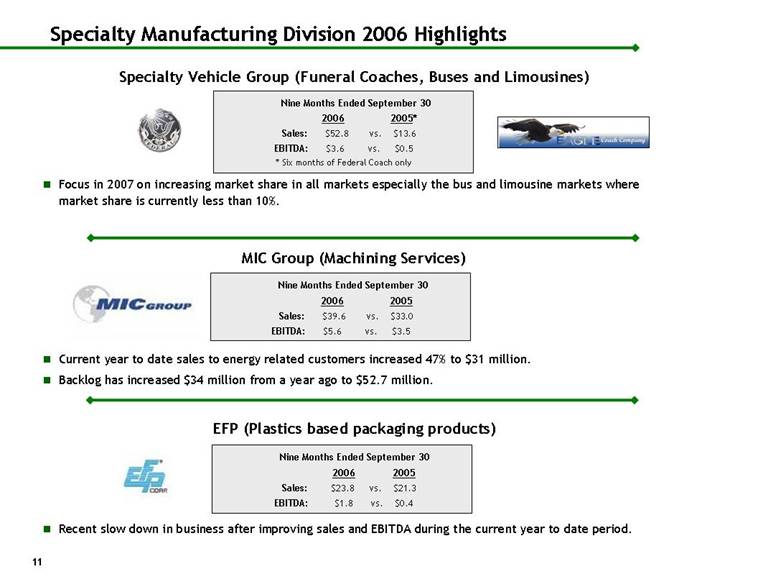
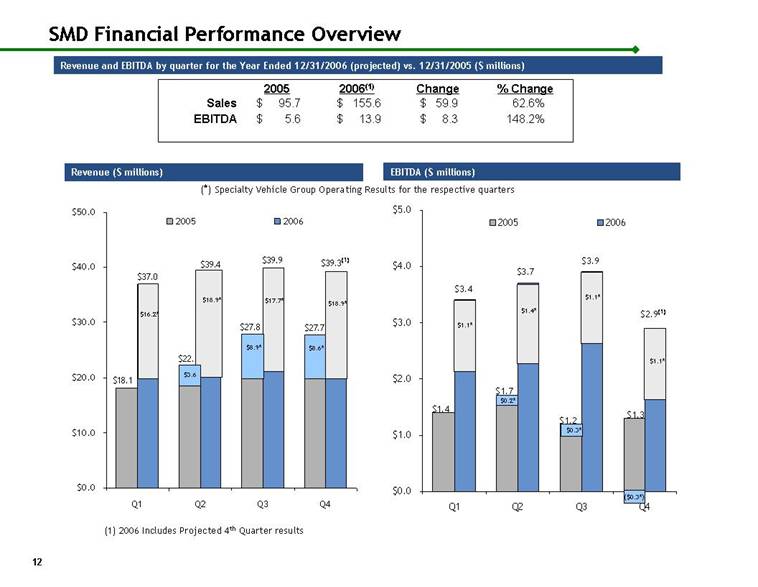
| Specialty Manufacturing Division 2006 Highlights Specialty Vehicle Group (Funeral Coaches, Buses and Limousines) Focus in 2007 on increasing market share in all markets especially the bus and limousine markets where market share is currently less than 10%. MIC Group (Machining Services) Current year to date sales to energy related customers increased 47% to $31 million. Backlog has increased $34 million from a year ago to $52.7 million. EFP (Plastics based packaging products) Recent slow down in business after improving sales and EBITDA during the current year to date period. 11 Nine Months Ended September 30 2006 2005 Sales: $23.8 vs. $21.3 EBITDA: $1.8 vs. $0.4 Nine Months Ended September 30 2006 2005* Sales: $52.8 vs. $13.6 EBITDA: $3.6 vs. $0.5 * Six months of Federal Coach only Nine Months Ended September 30 2006 2005 Sales: $39.6 vs. $33.0 EBITDA: $5.6 vs. $3.5 |
| SMD Financial Performance Overview Revenue ($ millions) EBITDA ($ millions) 148.2% $ 8.3 $ 13.9 $ 5.6 EBITDA 62.6% $ 59.9 $ 155.6 $ 95.7 Sales % ChangeChange2006(1)2005 12 Revenue and EBITDA by quarter for the Year Ended 12/31/2006 (projected) vs. 12/31/2005 ($ millions) (1) 2006 Includes Projected 4th Quarter results $16.2* $18.9* $17.7* $1.1* $1.4* $1.1* $1.1* $18.9* (*) Specialty Vehicle Group Operating Results for the respective quarters $0.2* $0.3* ($0.3*) $3.6 $8.9* $8.6* $22.1$27.8$18.1$27.7$39.9$39.4$39.3(1)$37.0$0.0$10.0$20.0$30.0$40.0$50.0Q1Q2Q3Q420052006$1.7$1.4$1.2$1.3$2.9(1)$3.4$3.7$3.9$0.0$1.0$2.0$3.0$4.0$5.0Q1Q2Q3Q420052006 |
| Consolidated Financial Overview 13 |

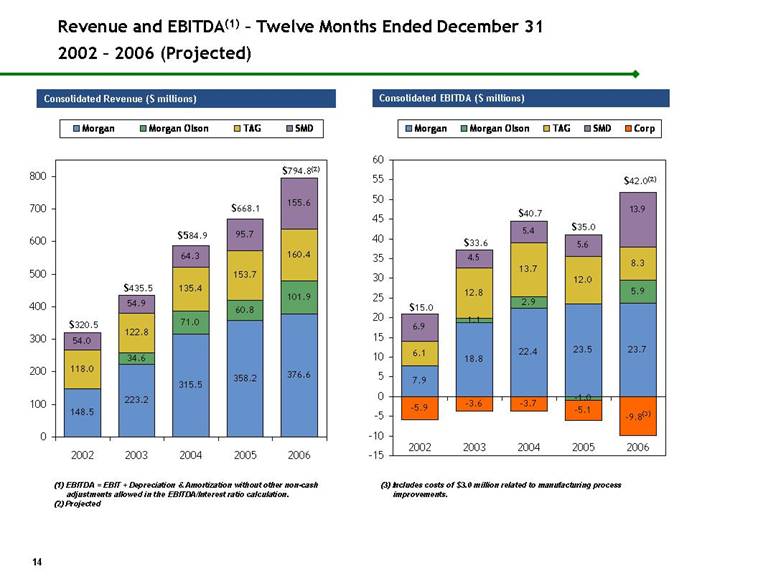
| Revenue and EBITDA(1) - Twelve Months Ended December 31 2002 - 2006 (Projected) Consolidated Revenue ($ millions) Consolidated EBITDA ($ millions) 14 $320.5 $435.5 $584.9 $668.1 $794.8(2)$15.0 $33.6 $40.7 $35.0 $42.0(2)(3) Includes costs of $3.0 million related to manufacturing process improvements. (1) EBITDA = EBIT + Depreciation & Amortization without other non-cash adjustments allowed in the EBITDA/Interest ratio calculation. (2) Projected 148.5223.2358.2376.660.8101.9135.4153.7160.454.964.395.7155.6315.571.034.6118.0122.854.0010020030040050060070080020022003200420052006MorganMorgan OlsonTAGSMD7.918.822.423.523.71.12.95.96.112.813.78.36.94.55.45.6-5.9-3.6-3.7-5.1-1.012.013.9-9.8(3)-15-10-50510152025303540455055602002200320042005200 6MorganMorgan OlsonTAGSMDCorp |
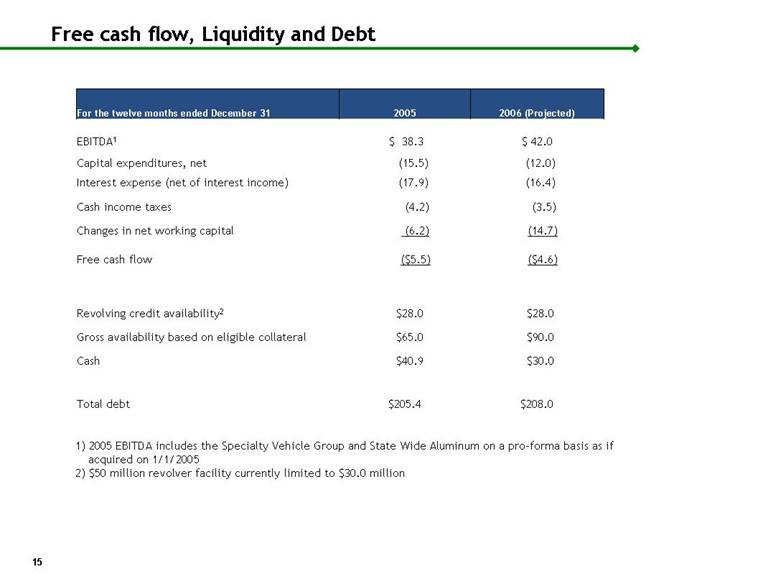
| Free cash flow, Liquidity and Debt 1) 2005 EBITDA includes the Specialty Vehicle Group and State Wide Aluminum on a pro-forma basis as if acquired on 1/1/2005 2) $50 million revolver facility currently limited to $30.0 million 15 $208.0 $205.4 Total debt $30.0 $40.9 Cash $28.0 $28.0 Revolving credit availability2 $90.0 $65.0 Gross availability based on eligible collateral ($4.6) ($5.5) Free cash flow (14.7) (6.2) Changes in net working capital (3.5) (4.2) Cash income taxes (16.4) (17.9) Interest expense (net of interest income) (12.0) (15.5) Capital expenditures, net $ 42.0 $ 38.3 EBITDA1 2006 (Projected)2005For the twelve months ended December 31 |
| Cash Outflow Overview Cash Outflow for the years ended ($ millions): (1) Projected 16 $4.3 $28.1 $28.2 $34.3 $32.3 4.34.54.54.55.111.47.518.512.315.015.03.03.04.31.94.57.90.05.010.015.020.025.030.035.040.02003200420052006(1)2007(1)Maintenance Level Cap ExExpansion Cap ExAcquisitionsMfg Process Imp.ERP |

| Conclusion and Questions www.jbpoindexter.com J. B. P O I N D E X T E R & C O., I N C. |