Exhibit 99.1
| Miami, FL This presentation has been prepared by the management of J.B. POINDEXTER & CO., INC. and is based on or derived from information generally available to the public. No representation is made that it is accurate and complete. This presentation was made on the date hereof and J.B. POINDEXTER & CO., INC. does not assume any obligation to advise you of any material developments or to update the presentation to reflect such developments. This presentation has been prepared solely for information purposes and is not a solicitation or an offer to buy or sell any security or instrument. Caution Concerning Forward-Looking Statements. Forward-looking statements in this presentation, including without limitation, statements relating to the Company’s plans, strategies, objectives, expectations, intentions and adequacy of resources, are made pursuant to the safe harbor provisions of the Private Securities Litigation Reform Act of 1995. Investors are cautioned that such forward-looking statements involve risks and uncertainties including without limitation the Company’s plans, strategies, objectives, expectations and intentions that are subject to change at any time at the discretion of the Company. JP Morgan Annual High Yield Conference 2007 J. B. P O I N D E X T E R & C O ., I N C . J. B. P O I N D E X T E R & C O ., I N C . January 24 |
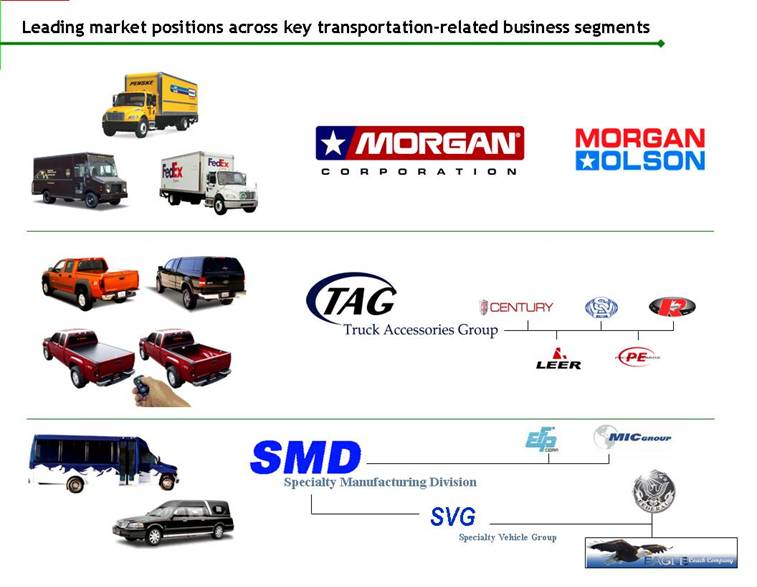
| Leading market positions across key transportation-related business segments Specialty Manufacturing Division SVG Specialty Vehicle Group |
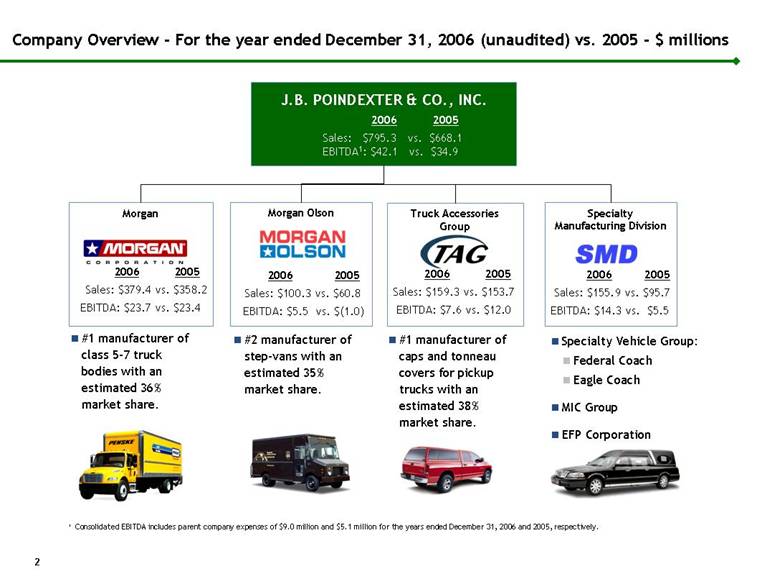
| Company Overview - For the year ended December 31, 2006 (unaudited) vs. 2005 - $ millions J.B. POINDEXTER & CO., INC. 2006 2005 Sales: $795.3 vs. $668.1 EBITDA1: $42.1 vs. $34.9 #1 manufacturer of class 5-7 truck bodies with an estimated 36% market share. Specialty Vehicle Group: Federal Coach Eagle Coach MIC Group EFP Corporation Morgan 2006 2005 Sales: $379.4 vs. $358.2 EBITDA: $23.7 vs. $23.4 Specialty Manufacturing Division 2006 2005 Sales: $155.9 vs. $95.7 EBITDA: $14.3 vs. $5.5 #2 manufacturer of step-vans with an estimated 35% market share. Morgan Olson 2006 2005 Sales: $100.3 vs. $60.8 EBITDA: $5.5 vs. $(1.0) #1 manufacturer of caps and tonneau covers for pickup trucks with an estimated 38% market share. Truck Accessories Group 2006 2005 Sales: $159.3 vs. $153.7 EBITDA: $7.6 vs. $12.0 1 Consolidated EBITDA includes parent company expenses of $9.0 million and $5.1 million for the years ended December 31, 2006 and 2005, respectively. 2 |
| Strategic Initiatives Management initiatives are reducing the cost structure and positioning the Company for growth: We have in place a strong and effective team of managers focused on improving our business processes. Structural changes are driving permanent cost reductions and positioning the Company to remain highly competitive on price, quality and delivery: Manufacturing productivity and efficiency improvements being put in place at all operations. An Enterprise Resource Planning (“ERP”) system was implemented initially at Morgan Olson in 2006 that will provide a common information platform across all operations when complete. Streamline Truck Accessories operations by closing unprofitable plant in Canada. We will continue to make selective acquisitions to complement our existing businesses. The acquisition criteria that we impose include a history of profitable operations, a reasonable price and continuing management. We have invested $45.0 million in five acquisitions over the last three years that have generated $125.0 million of third party sales and $7.5 million of EBITDA for 2006. 3 J.B. Poindexter & Co., Inc. |
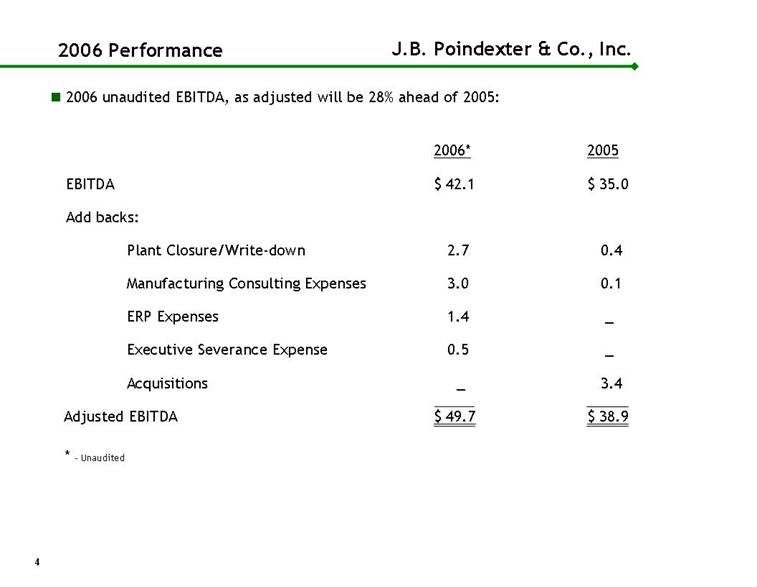
| 2006 Performance 2006 unaudited EBITDA, as adjusted will be 28% ahead of 2005: 2006* 2005 EBITDA $ 42.1 $ 35.0 Add backs: Plant Closure/Write-down 2.7 0.4 Manufacturing Consulting Expenses 3.0 0.1 ERP Expenses 1.4 _ Executive Severance Expense 0.5 _ Acquisitions _ 3.4 Adjusted EBITDA $ 49.7 $ 38.9 4 J.B. Poindexter & Co., Inc. * - Unaudited |
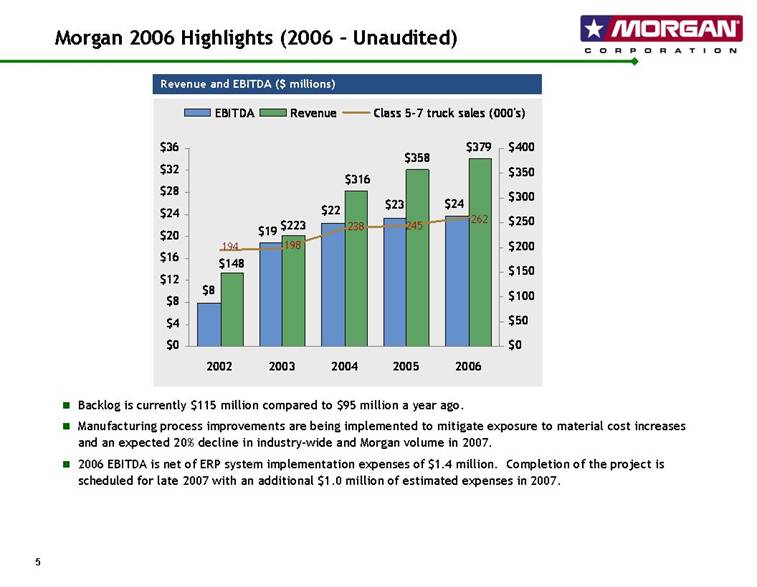
| Morgan 2006 Highlights (2006 – Unaudited) Backlog is currently $115 million compared to $95 million a year ago. Manufacturing process improvements are being implemented to mitigate exposure to material cost increases and an expected 20% decline in industry-wide and Morgan volume in 2007. 2006 EBITDA is net of ERP system implementation expenses of $1.4 million. Completion of the project is scheduled for late 2007 with an additional $1.0 million of estimated expenses in 2007. 5 Revenue and EBITDA ($ millions) $8 $22 $24 $19 $23 $379 $316 $223 $148 $358 262 245 238 198 194 $0 $4 $8 $12 $16 $20 $24 $28 $32 $36 2002 2003 2004 2005 2006 $0 $50 $100 $150 $200 $250 $300 $350 $400 EBITDA Revenue Class 5-7 truck sales (000's) |
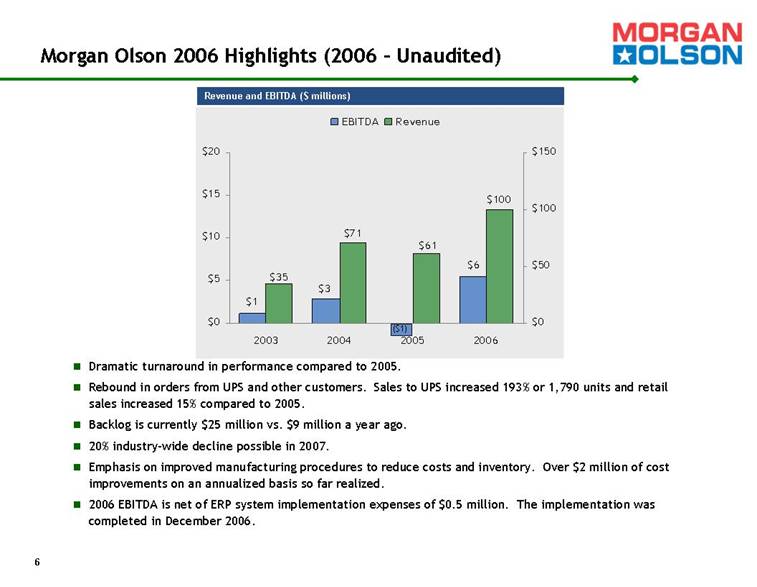
| Morgan Olson 2006 Highlights (2006 – Unaudited) Dramatic turnaround in performance compared to 2005. Rebound in orders from UPS and other customers. Sales to UPS increased 193% or 1,790 units and retail sales increased 15% compared to 2005. Backlog is currently $25 million vs. $9 million a year ago. 20% industry-wide decline possible in 2007. Emphasis on improved manufacturing procedures to reduce costs and inventory. Over $2 million of cost improvements on an annualized basis so far realized. 2006 EBITDA is net of ERP system implementation expenses of $0.5 million. The implementation was completed in December 2006. 6 Revenue and EBITDA ($ millions) ($1) $1 $3 $6 $61 $71 $35 $100 $0 $5 $10 $15 $20 2003 2004 2005 2006 $0 $50 $100 $150 EBITDA Revenue |
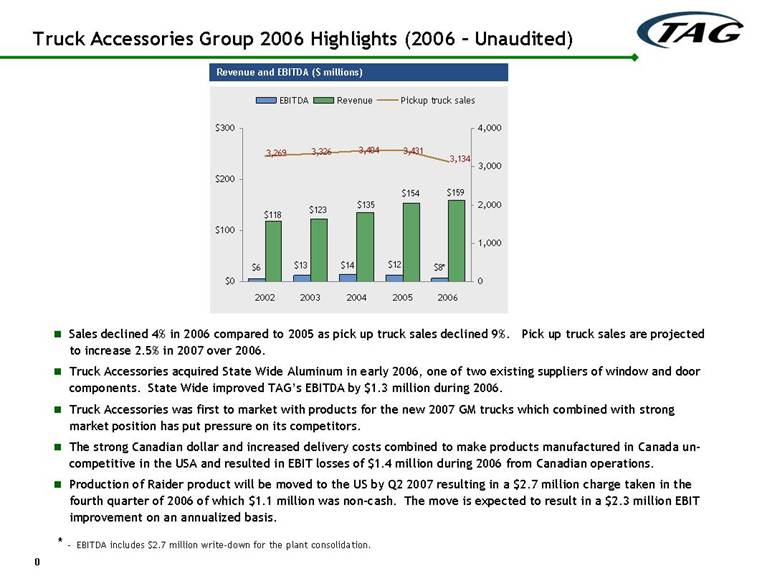
| Truck Accessories Group 2006 Highlights (2006 – Unaudited) Sales declined 4% in 2006 compared to 2005 as pick up truck sales declined 9%. Pick up truck sales are projected to increase 2.5% in 2007 over 2006. Truck Accessories acquired State Wide Aluminum in early 2006, one of two existing suppliers of window and door components. State Wide improved TAG’s EBITDA by $1.3 million during 2006. Truck Accessories was first to market with products for the new 2007 GM trucks which combined with strong market position has put pressure on its competitors. The strong Canadian dollar and increased delivery costs combined to make products manufactured in Canada un-competitive in the USA and resulted in EBIT losses of $1.4 million during 2006 from Canadian operations. Production of Raider product will be moved to the US by Q2 2007 resulting in a $2.7 million charge taken in the fourth quarter of 2006 of which $1.1 million was non-cash. The move is expected to result in a $2.3 million EBIT improvement on an annualized basis. 0 Revenue and EBITDA ($ millions) * - EBITDA includes $2.7 million write-down for the plant consolidation. $12 $13 $8* $14 $6 $154 $118 $123 $135 $159 3,269 3,326 3,404 3,431 3,134 $0 $100 $200 $300 2002 2003 2004 2005 2006 0 1,000 2,000 3,000 4,000 EBITDA Revenue Pickup truck sales |
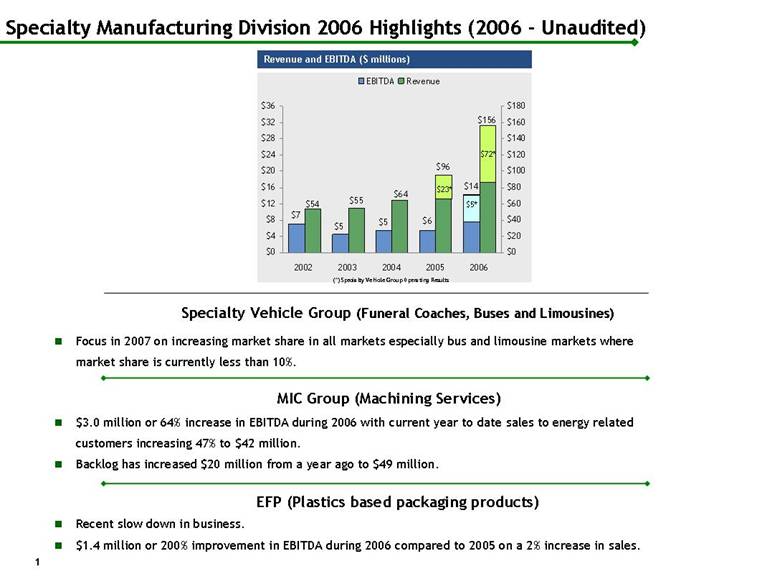
| Specialty Manufacturing Division 2006 Highlights (2006 - Unaudited) 1 Specialty Vehicle Group (Funeral Coaches, Buses and Limousines) Focus in 2007 on increasing market share in all markets especially bus and limousine markets where market share is currently less than 10%. MIC Group (Machining Services) $3.0 million or 64% increase in EBITDA during 2006 with current year to date sales to energy related customers increasing 47% to $42 million. Backlog has increased $20 million from a year ago to $49 million. EFP (Plastics based packaging products) Recent slow down in business. $1.4 million or 200% improvement in EBITDA during 2006 compared to 2005 on a 2% increase in sales. Revenue and EBITDA ($ millions) $5* $72* (*) Specialty Vehicle Group Operating Results $23* $7 $5 $14 $5 $6 $156 $64 $55 $54 $96 $0 $4 $8 $12 $16 $20 $24 $28 $32 $36 2002 2003 2004 2005 2006 $0 $20 $40 $60 $80 $100 $120 $140 $160 $180 EBITDA Revenue |
| Consolidated Financial Overview 2 |

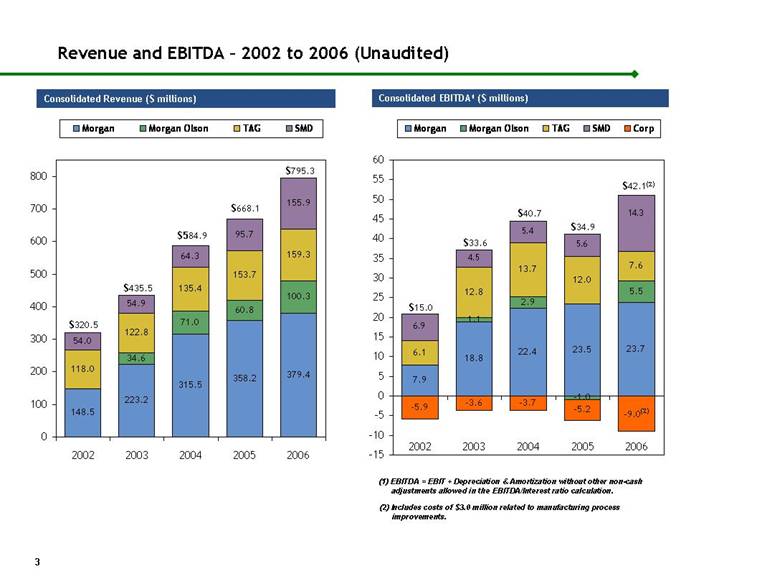
| Revenue and EBITDA – 2002 to 2006 (Unaudited) Consolidated Revenue ($ millions) Consolidated EBITDA1 ($ millions) 3 $320.5 $435.5 $584.9 $668.1 $795.3 $15.0 $33.6 $40.7 $34.9 $42.1(2) (2) Includes costs of $3.0 million related to manufacturing process improvements. (1) EBITDA = EBIT + Depreciation & Amortization without other non-cash adjustments allowed in the EBITDA/Interest ratio calculation. 148.5 223.2 358.2 379.4 60.8 100.3 135.4 153.7 159.3 54.9 64.3 95.7 155.9 315.5 71.0 34.6 118.0 122.8 54.0 0 100 200 300 400 500 600 700 800 2002 2003 2004 2005 2006 Morgan Morgan Olson TAG SMD 7.9 18.8 22.4 23.5 23.7 1.1 2.9 5.5 6.1 12.8 13.7 7.6 6.9 4.5 5.4 5.6 -5.9 -3.6 -3.7 -5.2 -1.0 12.0 14.3 -9.0 (2) -15 -10 -5 0 5 10 15 20 25 30 35 40 45 50 55 60 2002 2003 2004 2005 2006 Morgan Morgan Olson TAG SMD Corp |
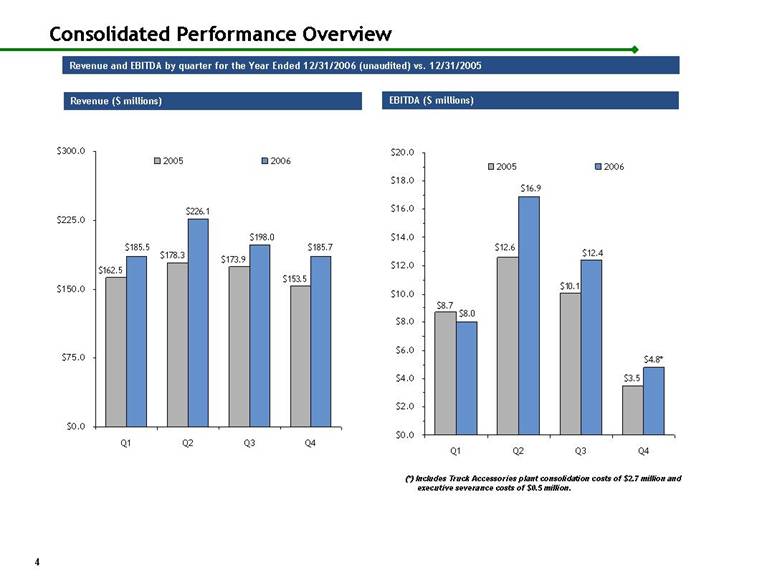
| Consolidated Performance Overview Revenue ($ millions) EBITDA ($ millions) 4 Revenue and EBITDA by quarter for the Year Ended 12/31/2006 (unaudited) vs. 12/31/2005 (*) Includes Truck Accessories plant consolidation costs of $2.7 million and executive severance costs of $0.5 million. $178.3 $173.9 $162.5 $153.5 $198.0 $226.1 $185.7 $185.5 $0.0 $75.0 $150.0 $225.0 $300.0 Q1 Q2 Q3 Q4 2005 2006 $3.5 $8.7 $12.6 $10.1 $4.8* $8.0 $16.9 $12.4 $0.0 $2.0 $4.0 $6.0 $8.0 $10.0 $12.0 $14.0 $16.0 $18.0 $20.0 Q1 Q2 Q3 Q4 2005 2006 |
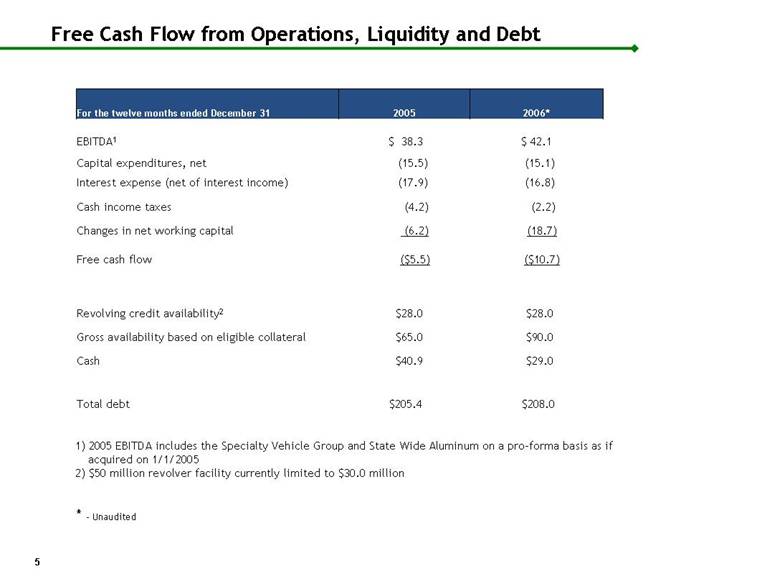
| Free Cash Flow from Operations, Liquidity and Debt 1) 2005 EBITDA includes the Specialty Vehicle Group and State Wide Aluminum on a pro-forma basis as if acquired on 1/1/2005 2) $50 million revolver facility currently limited to $30.0 million 5 $208.0 $205.4 Total debt Cash Revolving credit availability2 Gross availability based on eligible collateral Free cash flow Changes in net working capital Cash income taxes Interest expense (net of interest income) Capital expenditures, net $ 42.1 $ 38.3 EBITDA1 2006* 2005 For the twelve months ended December 31 * - Unaudited (15.5) (15.1) (17.9) (16.8) (4.2) (2.2) (6.2) (18.7) ($5.5) ($10.7) $65.0 $90.0 $28.0 $28.0 $40.9 $29.0 |
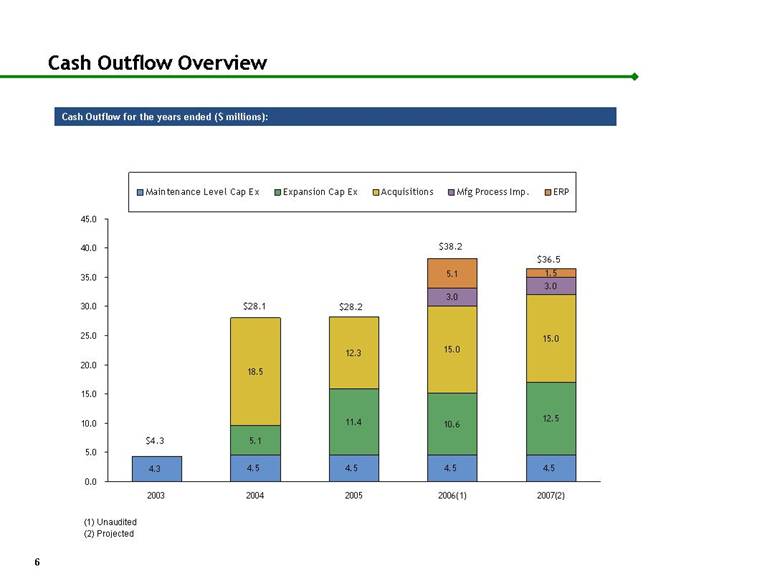
| Cash Outflow Overview Cash Outflow for the years ended ($ millions): (1) Unaudited 6 $4.3 $28.1 $28.2 $38.2 $36.5 (2) Projected 4.3 4.5 4.5 4.5 5.1 11.4 10.6 18.5 12.3 15.0 15.0 3.0 3.0 5.1 1.5 4.5 12.5 0.0 5.0 10.0 15.0 20.0 25.0 30.0 35.0 40.0 45.0 2003 2004 2005 2006(1) 2007(2) Maintenance Level Cap Ex Expansion Cap Ex Acquisitions Mfg Process Imp. ERP |
| Conclusion and Questions www.jbpoindexter.com J. B. P O I N D E X T E R & C O ., I N C . J. B. P O I N D E X T E R & C O ., I N C . |