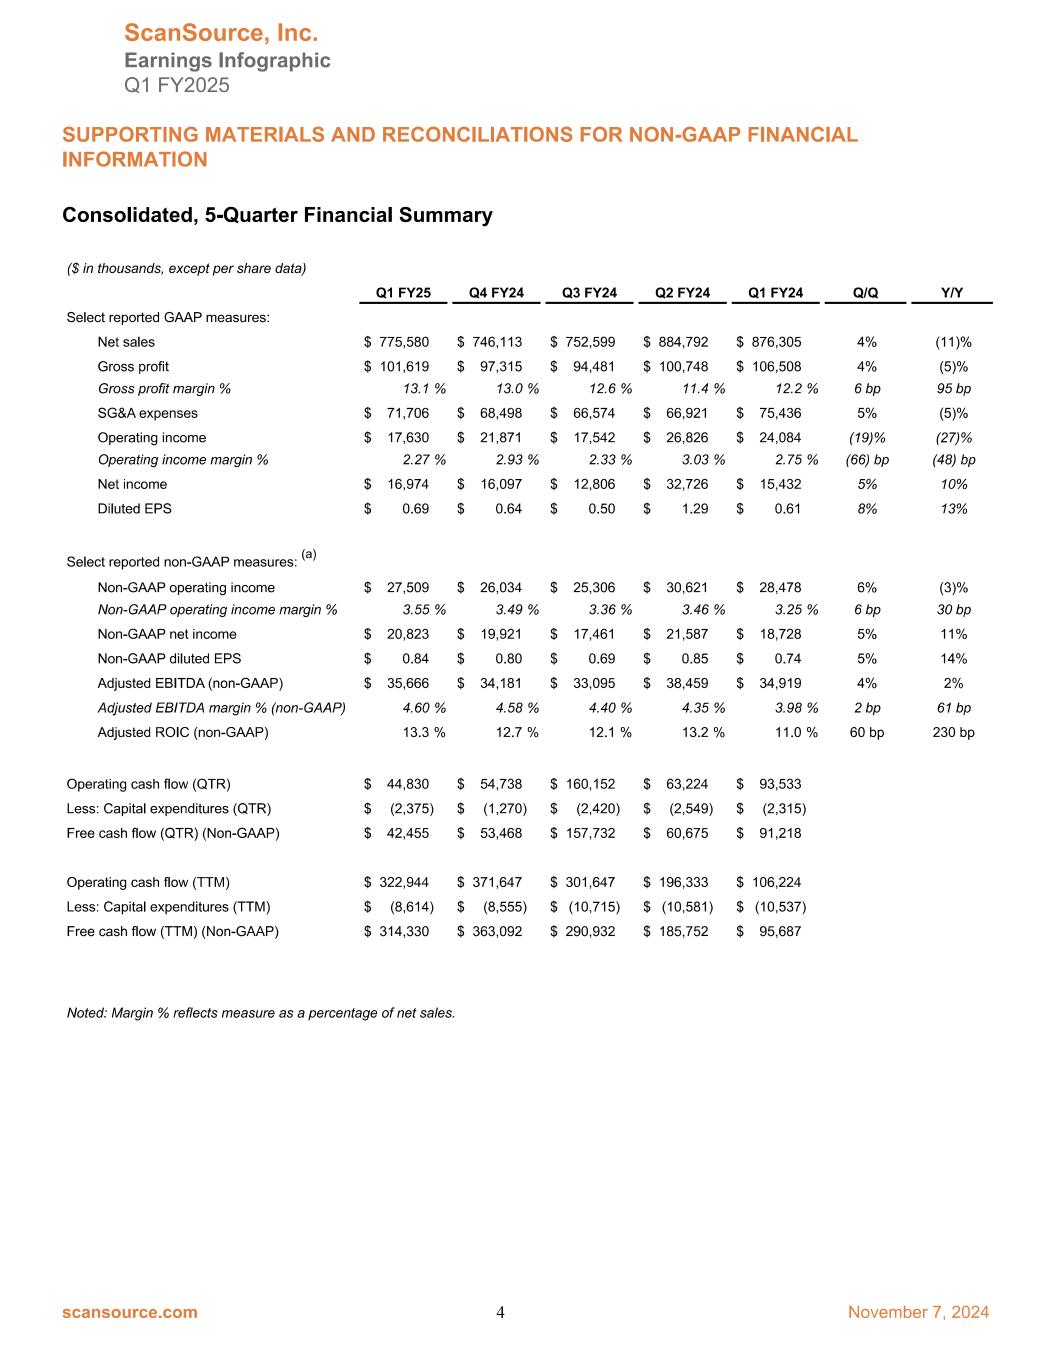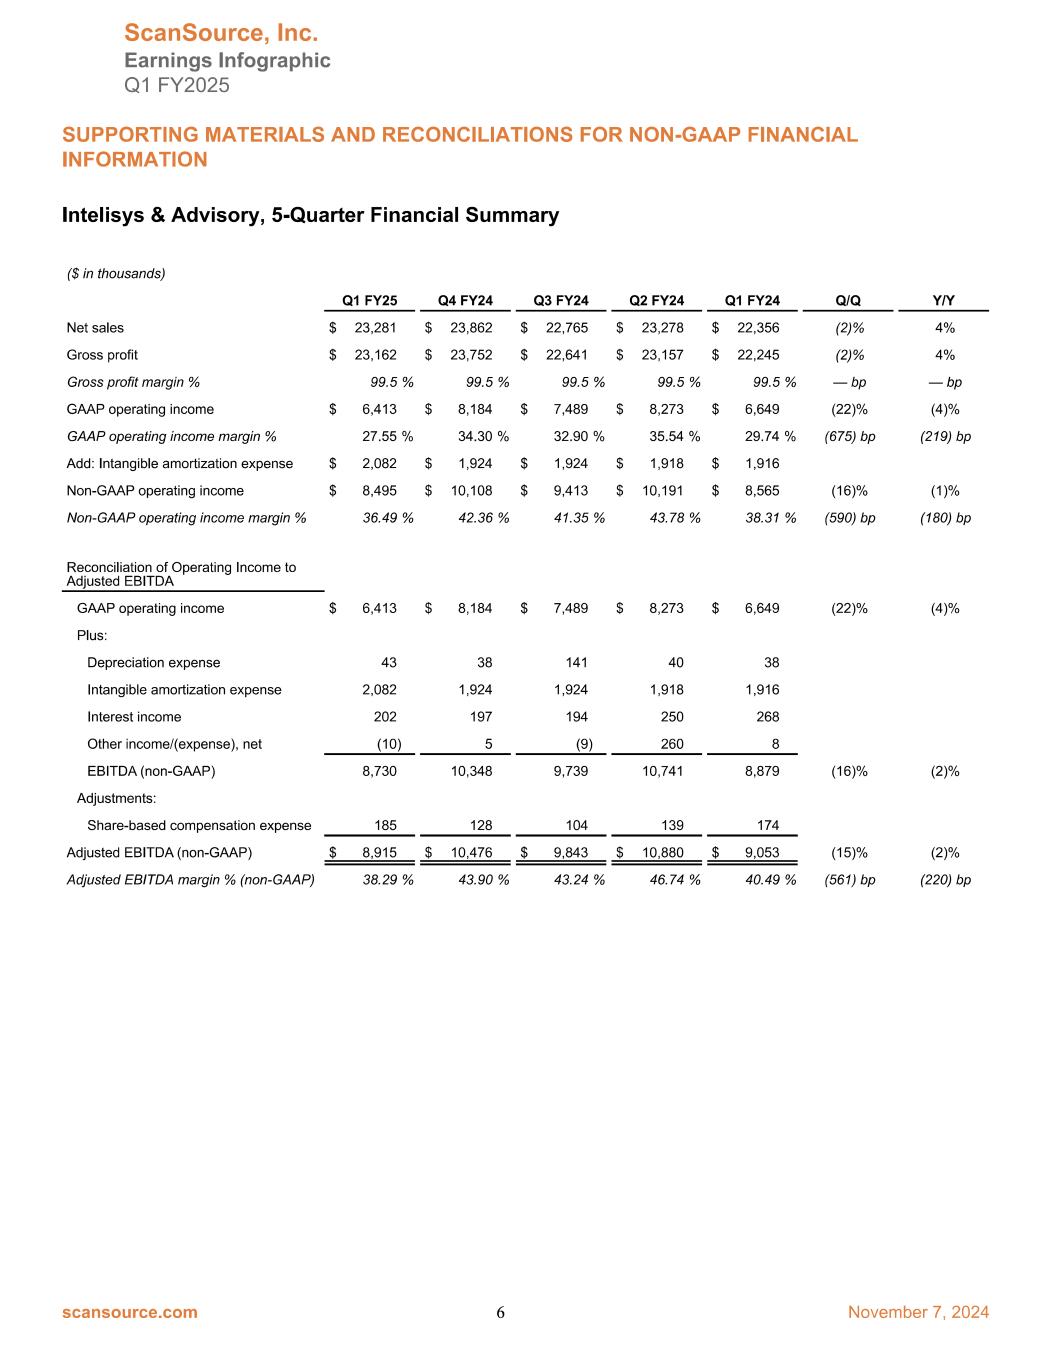
Fiscal First Quarter 2025 Earnings In the first quarter, our team delivered strong free cash flow and EPS growth in a soft demand environment. Our results demonstrate our hybrid distribution success with our focus on specialty technologies and Intelisys & advisory recurring revenue.” Mike Baur Chair and CEO, ScanSource, Inc. Key Highlights Soft Demand with Higher Gross Profit Margins Completed Acquisitions of High Margin, Recurring Revenue Businesses Higher Margins Reflect Strength of Business Fundamentals and Recurring Revenue Net Sales -11% Y/Y $776M Reaffirmed FY25 Annual Outlook; Achieved Strong Q1 Cash Flow © ScanSource 2025 Consolidated Specialty Technology Solutions Segment Gross Profit -5% Y/Y $102M, 13.1% margin Intelisys & Advisory Segment STS, Net Sales -12% Y/Y $752M I&A, Net Sales +4% Y/Y $23M STS, Gross Profit -7% Y/Y $78M, 10.4% margin I&A, Gross Profit +4% Y/Y $23M, 99.5% margin

* Non GAAPmeasure For further financial data, non GAAP financial disclosures and cautionary language regarding forward looking statements, please refer to the following pages and ScanSource’s first quarter fiscal year 2025 news release issued on November 7, 2024, which accompanies this presentation and is available at www.scansource.com in the Investor Relations section [click here]. First Quarter Operating Metrics Mid-Term Goals Mid-term: 3-to-4-year time frame Fiscal Year 2025 Annual Outlook reaffirmed as of November 7, 2024 © ScanSource 2025 2 Net Sales $3.1 billion to $3.5 billion Adjusted EBITDA* $140 million to $160 million Free Cash Flow* At least $70 million Recurring Revenue as % of Gross Profits Adjusted ROIC* Adjusted EBITDA Margin* Net Sales Growth per year Building to 30%+ Mid Teens4.5%-5%5%-7.5% Focus on Working Capital Efficiency Improvements $0.69 per share GAAP Diluted EPS +13% Y/Y $35.7M, +2%Y/Y Adjusted EBITDA* 4.60% Adjusted EBITDA Margin* $45M QTR Operating Cash Flow $42M QTR Free Cash Flow* $0.84 per share Non-GAAP Diluted EPS* +14% Y/Y (0.0)x Net Debt* to TTM Adjusted EBITDA* 13.3% Adjusted ROIC* $28M in share repurchases

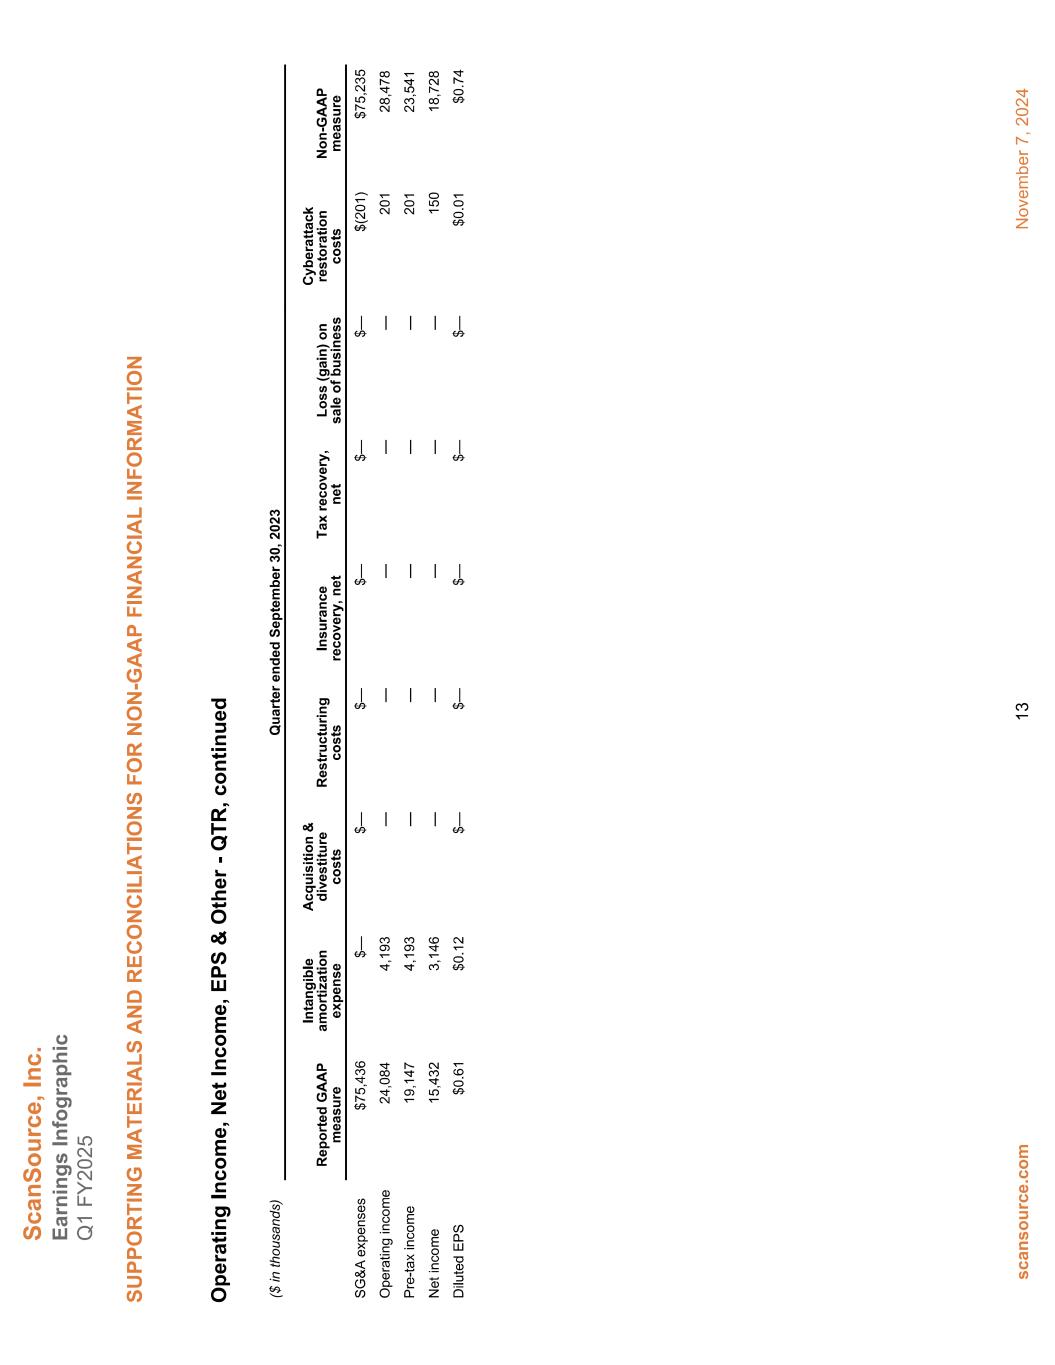
Forward-Looking Statements This Earnings Infographic and supporting materials contain “forward-looking” statements, including ScanSource's FY25 annual outlook and mid-term goals, which involve risks and uncertainties, many of which are beyond ScanSource’s control. No undue reliance should be placed on such statements, as any number of factors could cause actual results to differ materially from anticipated or forecasted results, including, but not limited to, the following factors, which are neither presented in order of importance nor weighted: macroeconomic conditions, including potential prolonged economic weakness, inflation, the failure to manage and implement ScanSource's growth strategy, credit risks involving ScanSource's larger customers and suppliers, changes in interest and exchange rates and regulatory regimes impacting ScanSource's international operations, risk to the business from a cyberattack, a failure of IT systems, failure to hire and retain quality employees, loss of ScanSource's major customers, relationships with key suppliers and customers or a termination or a modification of the terms under which it operates with these key suppliers and customers, changes in ScanSource's operating strategy, and other factors set forth in the "Risk Factors" contained in ScanSource's annual report on Form 10-K for the year ended June 30, 2024, and subsequent reports on Form 10-Q, filed with the Securities and Exchange Commission. Except as may be required by law, ScanSource expressly disclaims any obligation to update these forward-looking statements to reflect events or circumstances after the date of this Earnings Infographic or otherwise. Non-GAAP Financial Information In addition to disclosing results that are determined in accordance with United States Generally Accepted Accounting Principles (“GAAP”), ScanSource also discloses certain non-GAAP measures, including non-GAAP SG&A expenses, non-GAAP operating income, non-GAAP operating income margin, non-GAAP pre-tax income, non-GAAP net income, non-GAAP diluted EPS, adjusted EBITDA, adjusted EBITDA margin, net debt, adjusted ROIC, free cash flow and net sales in constant currency excluding acquisitions and divestitures (organic growth). A reconciliation of the Company's non-GAAP financial information to GAAP financial information is provided in the following supporting materials and in the Company’s Form 8-K, filed with the SEC, with the quarterly earnings press release for the period indicated. Please see the “Non-GAAP Financial Information” section in the quarterly earnings press release for additional description of ScanSource’s non-GAAP measures. ScanSource discloses forward-looking information that is not presented in accordance with GAAP with respect to adjusted EBITDA, adjusted EBITDA margin, adjusted ROIC, and free cash flow. ScanSource believes that a quantitative reconciliation of such forward-looking information to the most directly comparable GAAP financial measure cannot be made without unreasonable efforts, because a reconciliation of these non-GAAP financial measures would require an estimate of future non-operating items such as acquisitions and divestitures, restructuring costs, impairment charges and other unusual or non-recurring items. Neither the timing nor likelihood of these events, nor their probable significance, can be quantified with a reasonable degree of accuracy. Accordingly, a reconciliation of such forward- looking information to the most directly comparable GAAP financial measure is not provided. 3


