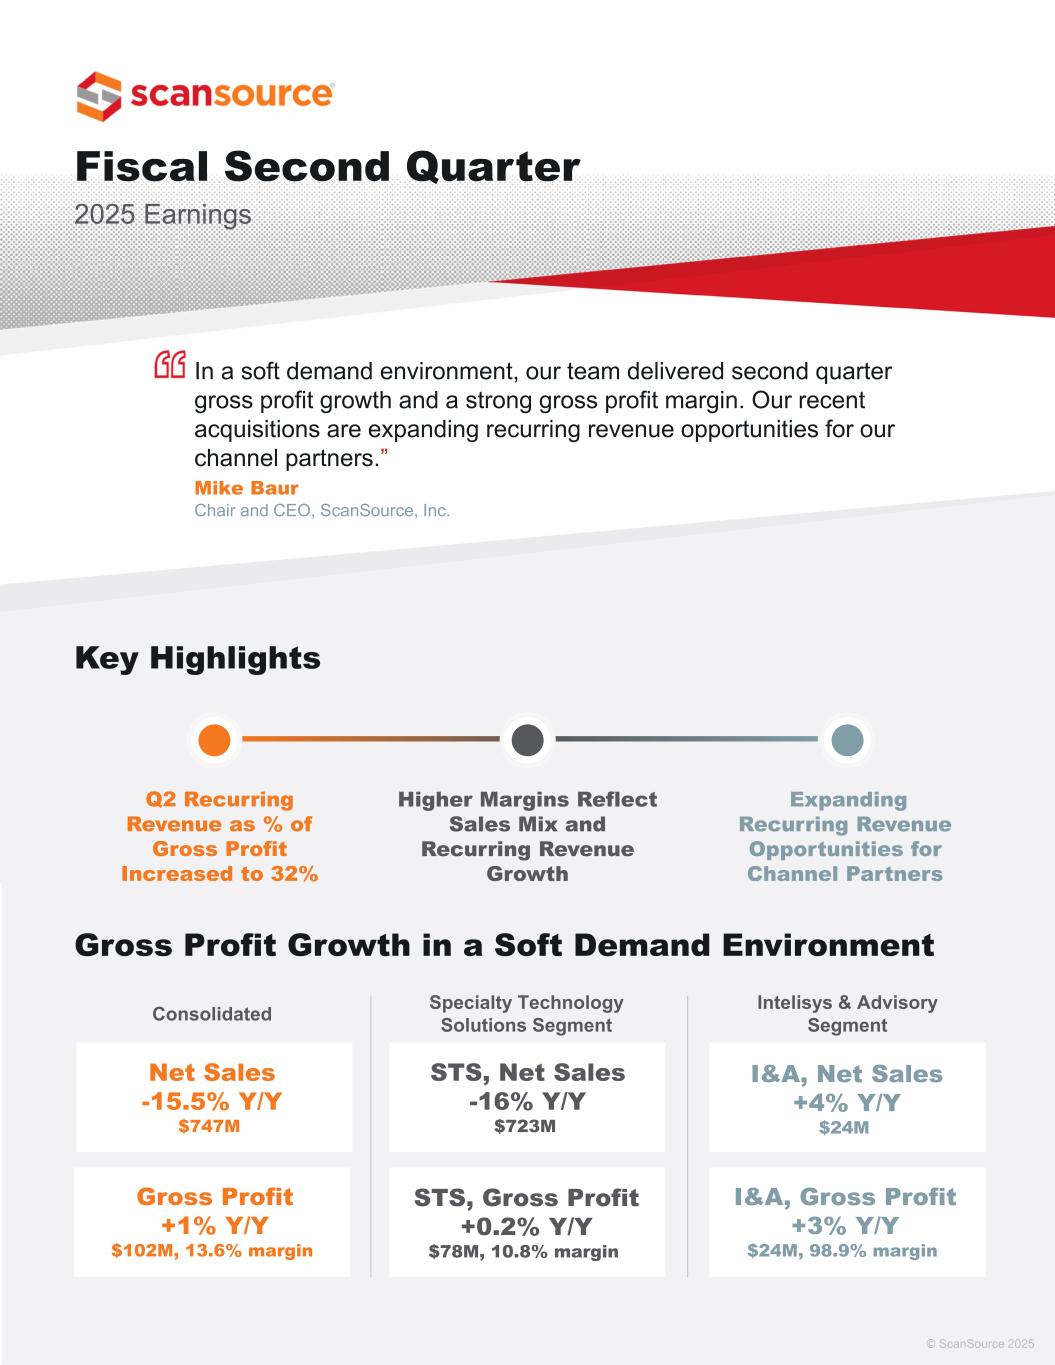
Fiscal Second Quarter 2025 Earnings Key Highlights © ScanSource 2025 Consolidated In a soft demand environment, our team delivered second quarter gross profit growth and a strong gross profit margin. Our recent acquisitions are expanding recurring revenue opportunities for our channel partners.” Mike Baur Chair and CEO, ScanSource, Inc. Q2 Recurring Revenue as % of Gross Profit Increased to 32% Higher Margins Reflect Sales Mix and Recurring Revenue Growth Expanding Recurring Revenue Opportunities for Channel Partners Gross Profit Growth in a Soft Demand Environment Specialty Technology Solutions Segment Intelisys & Advisory Segment Net Sales -15.5% Y/Y $747M Gross Profit +1% Y/Y $102M, 13.6% margin STS, Net Sales -16% Y/Y $723M STS, Gross Profit +0.2% Y/Y $78M, 10.8% margin I&A, Net Sales +4% Y/Y $24M I&A, Gross Profit +3% Y/Y $24M, 98.9% margin

* Non-GAAP measure For further financial data, non-GAAP financial disclosures and cautionary language regarding forward-looking statements, please refer to the following pages and ScanSource’s second quarter fiscal year 2025 news release issued on January 30, 2025, which accompanies this presentation and is available at www.scansource.com in the Investor Relations section [click here]. Second Quarter Operating Metrics Mid-Term Goals Mid-term: 3-to-4-year time frame Fiscal Year 2025 Annual Outlook reaffirmed as of January 30, 2025 © ScanSource 2025 2 Net Sales $3.1 billion to $3.5 billion Adjusted EBITDA* $140 million to $160 million Free Cash Flow* At least $70 million Recurring Revenue as % of Gross Profit Adjusted ROIC* Adjusted EBITDA Margin* Net Sales Growth per year Building to 30%+ Mid Teens4.5%-5%5%-7.5% Focus on Working Capital Efficiency Improvements $0.70 per share GAAP Diluted EPS -46% Y/Y $35.3M, -8%Y/Y Adjusted EBITDA* 4.72% Adjusted EBITDA Margin* $39M YTD Operating Cash Flow $34M YTD Free Cash Flow* $0.85 per share Non-GAAP Diluted EPS* Unchanged Y/Y 0.2x Net Debt* to TTM Adjusted EBITDA* 13.3% Adjusted ROIC* $24M in Q2 share repurchases

Forward-Looking Statements This Earnings Infographic and supporting materials contain “forward-looking” statements, including ScanSource's FY25 annual outlook and mid-term goals, which involve risks and uncertainties, many of which are beyond ScanSource’s control. No undue reliance should be placed on such statements, as any number of factors could cause actual results to differ materially from anticipated or forecasted results, including, but not limited to, the following factors, which are neither presented in order of importance nor weighted: macroeconomic conditions, including potential prolonged economic weakness, inflation, the failure to manage and implement ScanSource's growth strategy, the ability for ScanSource to realize the synergies or other benefits from acquisitions, credit risks involving ScanSource's larger customers and suppliers, changes in interest and exchange rates and regulatory regimes impacting ScanSource's international operations, risk to the business from a cyberattack, a failure of IT systems, failure to hire and retain quality employees, loss of ScanSource's major customers, relationships with key suppliers and customers or a termination or a modification of the terms under which it operates with these key suppliers and customers, changes in ScanSource's operating strategy, and other factors set forth in the "Risk Factors" contained in ScanSource's annual report on Form 10-K for the year ended June 30, 2024, and subsequent reports on Form 10-Q, filed with the Securities and Exchange Commission. Except as may be required by law, ScanSource expressly disclaims any obligation to update these forward-looking statements to reflect events or circumstances after the date of this Earnings Infographic or otherwise. Non-GAAP Financial Information In addition to disclosing results that are determined in accordance with United States Generally Accepted Accounting Principles (“GAAP”), ScanSource also discloses certain non-GAAP measures, including non-GAAP SG&A expenses, non-GAAP operating income, non-GAAP operating income margin, non-GAAP pre-tax income, non-GAAP net income, non-GAAP diluted EPS, adjusted EBITDA, adjusted EBITDA margin, net debt, adjusted ROIC, free cash flow and net sales in constant currency excluding acquisitions and divestitures (organic growth). A reconciliation of the Company's non-GAAP financial information to GAAP financial information is provided in the following supporting materials and in the Company’s Form 8-K, filed with the SEC, with the quarterly earnings press release for the period indicated. Please see the “Non-GAAP Financial Information” section in the quarterly earnings press release for additional description of ScanSource’s non-GAAP measures. ScanSource discloses forward-looking information that is not presented in accordance with GAAP with respect to adjusted EBITDA, adjusted EBITDA margin, adjusted ROIC, and free cash flow. ScanSource believes that a quantitative reconciliation of such forward-looking information to the most directly comparable GAAP financial measure cannot be made without unreasonable efforts, because a reconciliation of these non-GAAP financial measures would require an estimate of future non-operating items such as acquisitions and divestitures, restructuring costs, impairment charges and other unusual or non-recurring items. Neither the timing nor likelihood of these events, nor their probable significance, can be quantified with a reasonable degree of accuracy. Accordingly, a reconciliation of such forward- looking information to the most directly comparable GAAP financial measure is not provided. 3
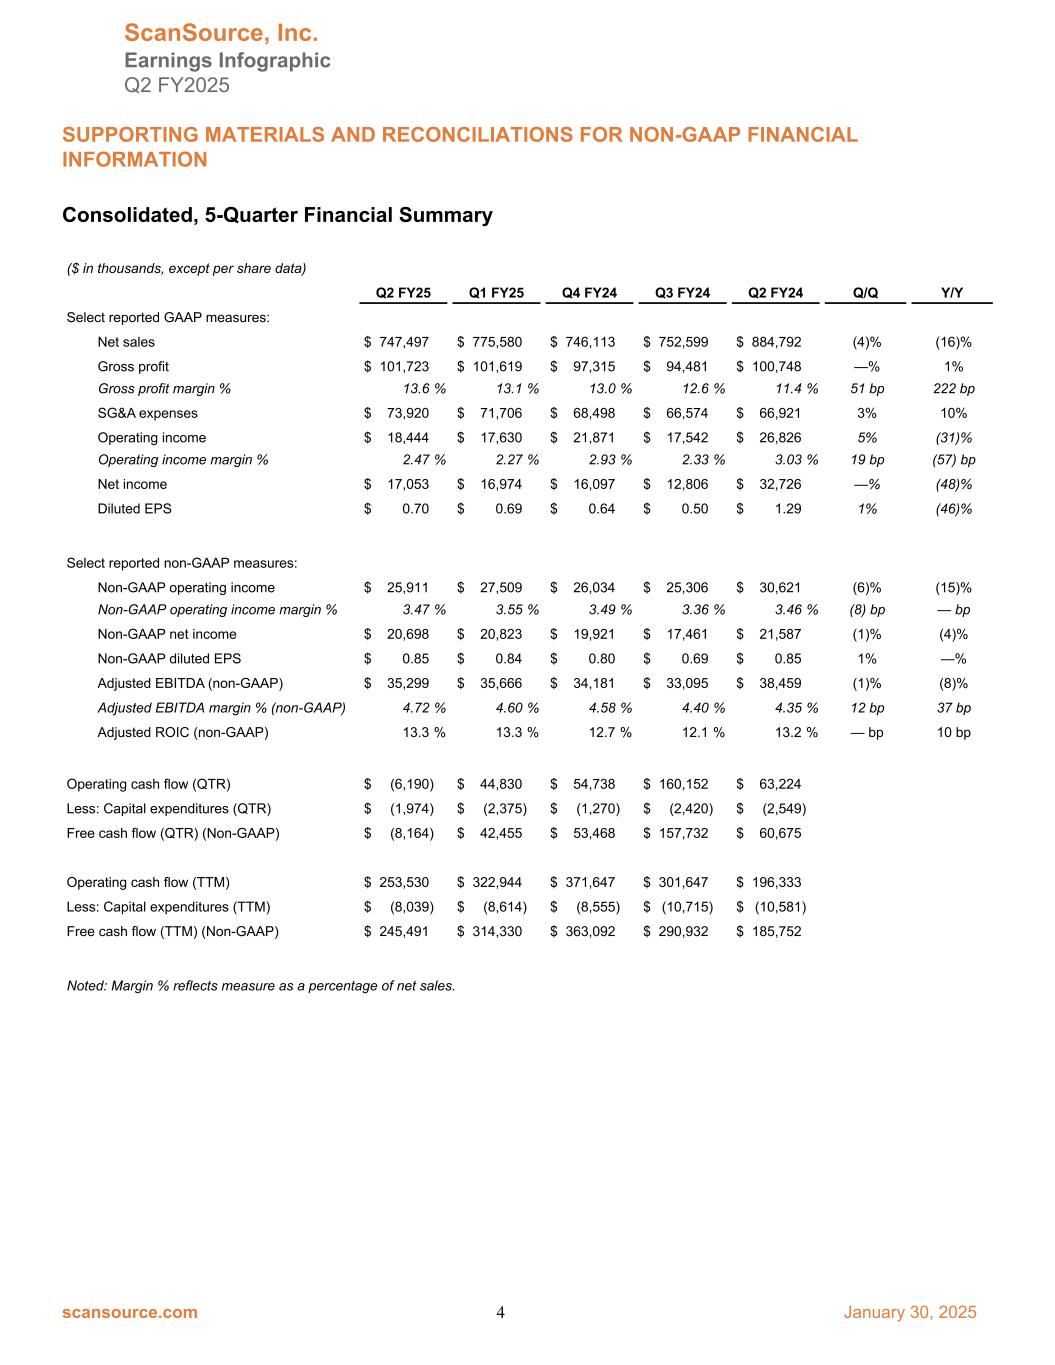
Consolidated, 5-Quarter Financial Summary ($ in thousands, except per share data) Q2 FY25 Q1 FY25 Q4 FY24 Q3 FY24 Q2 FY24 Q/Q Y/Y Select reported GAAP measures: Net sales $ 747,497 $ 775,580 $ 746,113 $ 752,599 $ 884,792 (4)% (16)% Gross profit $ 101,723 $ 101,619 $ 97,315 $ 94,481 $ 100,748 —% 1% Gross profit margin % 13.6 % 13.1 % 13.0 % 12.6 % 11.4 % 51 bp 222 bp SG&A expenses $ 73,920 $ 71,706 $ 68,498 $ 66,574 $ 66,921 3% 10% Operating income $ 18,444 $ 17,630 $ 21,871 $ 17,542 $ 26,826 5% (31)% Operating income margin % 2.47 % 2.27 % 2.93 % 2.33 % 3.03 % 19 bp (57) bp Net income $ 17,053 $ 16,974 $ 16,097 $ 12,806 $ 32,726 —% (48)% Diluted EPS $ 0.70 $ 0.69 $ 0.64 $ 0.50 $ 1.29 1% (46)% Select reported non-GAAP measures: Non-GAAP operating income $ 25,911 $ 27,509 $ 26,034 $ 25,306 $ 30,621 (6)% (15)% Non-GAAP operating income margin % 3.47 % 3.55 % 3.49 % 3.36 % 3.46 % (8) bp — bp Non-GAAP net income $ 20,698 $ 20,823 $ 19,921 $ 17,461 $ 21,587 (1)% (4)% Non-GAAP diluted EPS $ 0.85 $ 0.84 $ 0.80 $ 0.69 $ 0.85 1% —% Adjusted EBITDA (non-GAAP) $ 35,299 $ 35,666 $ 34,181 $ 33,095 $ 38,459 (1)% (8)% Adjusted EBITDA margin % (non-GAAP) 4.72 % 4.60 % 4.58 % 4.40 % 4.35 % 12 bp 37 bp Adjusted ROIC (non-GAAP) 13.3 % 13.3 % 12.7 % 12.1 % 13.2 % — bp 10 bp Operating cash flow (QTR) $ (6,190) $ 44,830 $ 54,738 $ 160,152 $ 63,224 Less: Capital expenditures (QTR) $ (1,974) $ (2,375) $ (1,270) $ (2,420) $ (2,549) Free cash flow (QTR) (Non-GAAP) $ (8,164) $ 42,455 $ 53,468 $ 157,732 $ 60,675 Operating cash flow (TTM) $ 253,530 $ 322,944 $ 371,647 $ 301,647 $ 196,333 Less: Capital expenditures (TTM) $ (8,039) $ (8,614) $ (8,555) $ (10,715) $ (10,581) Free cash flow (TTM) (Non-GAAP) $ 245,491 $ 314,330 $ 363,092 $ 290,932 $ 185,752 Noted: Margin % reflects measure as a percentage of net sales. ScanSource, Inc. Earnings Infographic Q2 FY2025 SUPPORTING MATERIALS AND RECONCILIATIONS FOR NON-GAAP FINANCIAL INFORMATION scansource.com 4 January 30, 2025
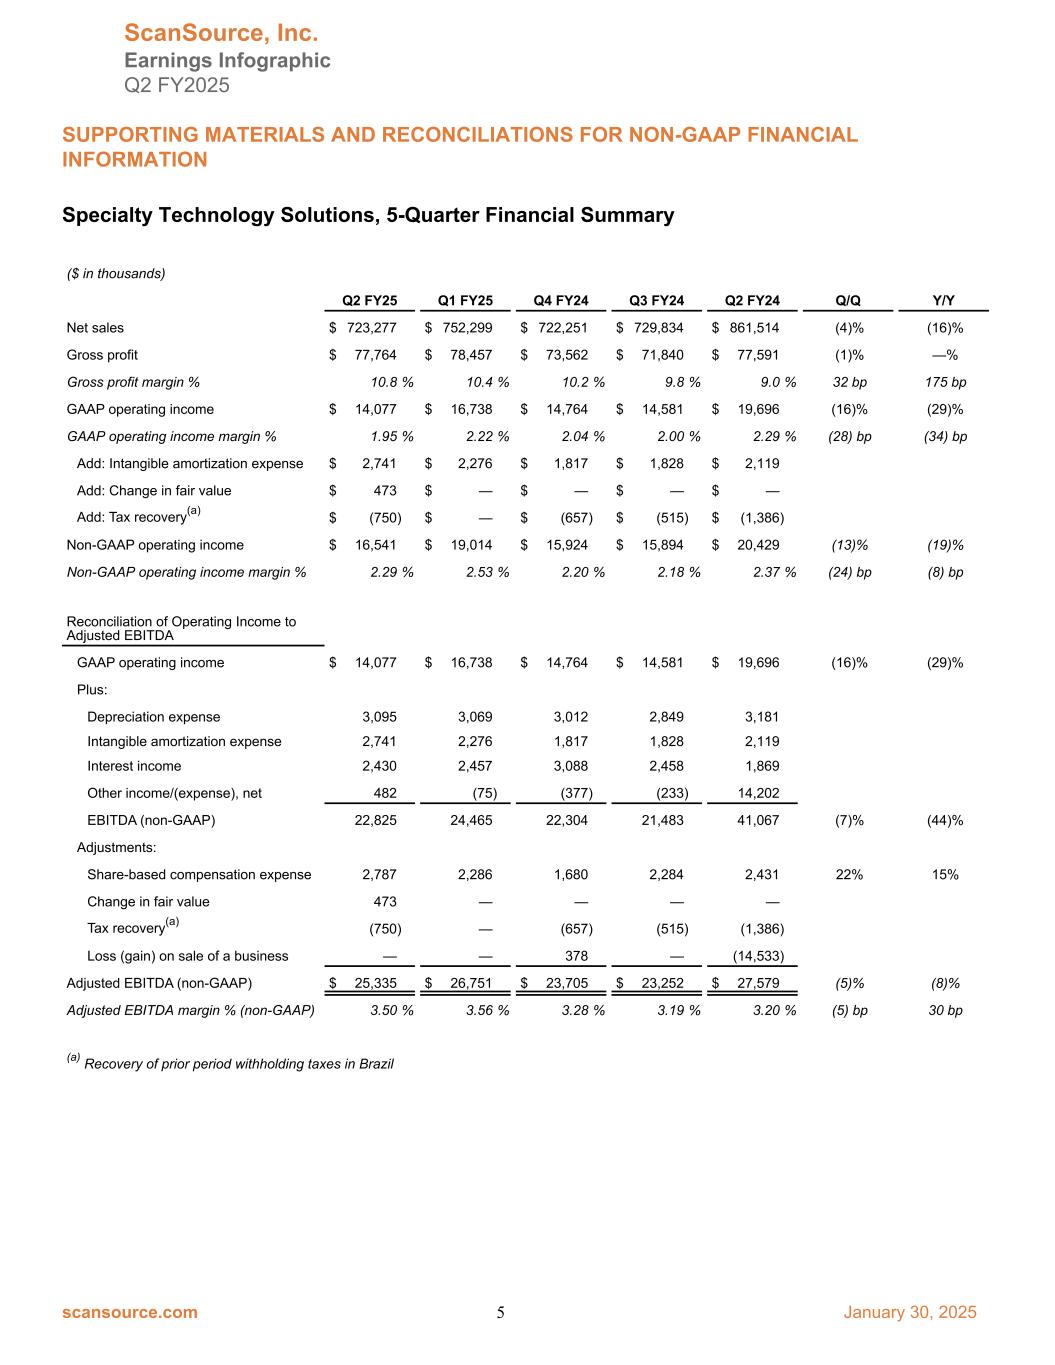
Specialty Technology Solutions, 5-Quarter Financial Summary ($ in thousands) Q2 FY25 Q1 FY25 Q4 FY24 Q3 FY24 Q2 FY24 Q/Q Y/Y Net sales $ 723,277 $ 752,299 $ 722,251 $ 729,834 $ 861,514 (4)% (16)% Gross profit $ 77,764 $ 78,457 $ 73,562 $ 71,840 $ 77,591 (1)% —% Gross profit margin % 10.8 % 10.4 % 10.2 % 9.8 % 9.0 % 32 bp 175 bp GAAP operating income $ 14,077 $ 16,738 $ 14,764 $ 14,581 $ 19,696 (16)% (29)% GAAP operating income margin % 1.95 % 2.22 % 2.04 % 2.00 % 2.29 % (28) bp (34) bp Add: Intangible amortization expense $ 2,741 $ 2,276 $ 1,817 $ 1,828 $ 2,119 Add: Change in fair value $ 473 $ — $ — $ — $ — Add: Tax recovery(a) $ (750) $ — $ (657) $ (515) $ (1,386) Non-GAAP operating income $ 16,541 $ 19,014 $ 15,924 $ 15,894 $ 20,429 (13)% (19)% Non-GAAP operating income margin % 2.29 % 2.53 % 2.20 % 2.18 % 2.37 % (24) bp (8) bp Reconciliation of Operating Income to Adjusted EBITDA GAAP operating income $ 14,077 $ 16,738 $ 14,764 $ 14,581 $ 19,696 (16)% (29)% Plus: Depreciation expense 3,095 3,069 3,012 2,849 3,181 Intangible amortization expense 2,741 2,276 1,817 1,828 2,119 Interest income 2,430 2,457 3,088 2,458 1,869 Other income/(expense), net 482 (75) (377) (233) 14,202 EBITDA (non-GAAP) 22,825 24,465 22,304 21,483 41,067 (7)% (44)% Adjustments: Share-based compensation expense 2,787 2,286 1,680 2,284 2,431 22% 15% Change in fair value 473 — — — — Tax recovery(a) (750) — (657) (515) (1,386) Loss (gain) on sale of a business — — 378 — (14,533) Adjusted EBITDA (non-GAAP) $ 25,335 $ 26,751 $ 23,705 $ 23,252 $ 27,579 (5)% (8)% Adjusted EBITDA margin % (non-GAAP) 3.50 % 3.56 % 3.28 % 3.19 % 3.20 % (5) bp 30 bp (a) Recovery of prior period withholding taxes in Brazil ScanSource, Inc. Earnings Infographic Q2 FY2025 SUPPORTING MATERIALS AND RECONCILIATIONS FOR NON-GAAP FINANCIAL INFORMATION scansource.com 5 January 30, 2025

Intelisys & Advisory, 5-Quarter Financial Summary ($ in thousands) Q2 FY25 Q1 FY25 Q4 FY24 Q3 FY24 Q2 FY24 Q/Q Y/Y Net sales $ 24,220 $ 23,281 $ 23,862 $ 22,765 $ 23,278 4% 4% Gross profit $ 23,959 $ 23,162 $ 23,752 $ 22,641 $ 23,157 3% 3% Gross profit margin % 98.9 % 99.5 % 99.5 % 99.5 % 99.5 % (60) bp (60) bp GAAP operating income $ 6,440 $ 6,413 $ 8,184 $ 7,489 $ 8,273 —% (22)% GAAP operating income margin % 26.59 % 27.55 % 34.30 % 32.90 % 35.54 % (96) bp (895) bp Add: Intangible amortization expense $ 2,260 $ 2,082 $ 1,924 $ 1,924 $ 1,918 Add: Change in fair value $ 670 $ — $ — $ — $ — Non-GAAP operating income $ 9,370 $ 8,495 $ 10,108 $ 9,413 $ 10,191 10% (8)% Non-GAAP operating income margin % 38.69 % 36.49 % 42.36 % 41.35 % 43.78 % 220 bp (510) bp Reconciliation of Operating Income to Adjusted EBITDA GAAP operating income $ 6,440 $ 6,413 $ 8,184 $ 7,489 $ 8,273 —% (22)% Plus: Depreciation expense 36 43 38 141 40 Intangible amortization expense 2,260 2,082 1,924 1,924 1,918 Interest income 263 202 197 194 250 Other income/(expense), net 61 (10) 5 (9) 260 EBITDA (non-GAAP) 9,060 8,730 10,348 9,739 10,741 4% (16)% Adjustments: Share-based compensation expense 234 185 128 104 139 Change in fair value 670 — — — — Adjusted EBITDA (non-GAAP) $ 9,964 $ 8,915 $ 10,476 $ 9,843 $ 10,880 12% (8)% Adjusted EBITDA margin % (non-GAAP) 41.14 % 38.29 % 43.90 % 43.24 % 46.74 % 285 bp (560) bp ScanSource, Inc. Earnings Infographic Q2 FY2025 SUPPORTING MATERIALS AND RECONCILIATIONS FOR NON-GAAP FINANCIAL INFORMATION scansource.com 6 January 30, 2025

Net Sales, Constant Currency Excluding Acquisitions and Divestitures (Organic Growth) - QTR ($ in thousands) Net Sales by Segment: Q2 FY25 Q2 FY24 % Change Specialty Technology Solutions: Net sales, as reported $ 723,277 $ 861,514 (16.0) % Foreign exchange impact (a) 10,723 — Less: Acquisitions (6,888) — Less: Divestitures — (1,737) Non-GAAP net sales $ 727,112 $ 859,777 (15.4) % Intelisys & Advisory: Net sales, as reported $ 24,220 $ 23,278 4.0 % Foreign exchange impact (a) (5) — Less: Acquisitions (1,685) — Non-GAAP net sales $ 22,530 $ 23,278 (3.2) % Consolidated: Net sales, as reported $ 747,497 $ 884,792 (15.5) % Foreign exchange impact (a) 10,718 — Less: Acquisitions (8,573) — Less: Divestitures — (1,737) Non-GAAP net sales $ 749,642 $ 883,055 (15.1) % Net Sales by Geography: Q2 FY25 Q2 FY24 % Change United States and Canada: Net sales, as reported $ 687,111 $ 795,382 (13.6) % Less: Acquisitions (8,573) — Non-GAAP net sales $ 678,538 $ 795,382 (14.7) % Brazil: Net sales, as reported (b) $ 60,386 $ 89,410 (32.5) % Foreign exchange impact (a) 10,718 — Less: Divestitures — (1,737) Non-GAAP net sales $ 71,104 $ 87,673 (18.9) % Consolidated: Net sales, as reported $ 747,497 $ 884,792 (15.5) % Foreign exchange impact (a) 10,718 — Less: Acquisitions (8,573) — Less: Divestitures — (1,737) Non-GAAP net sales $ 749,642 $ 883,055 (15.1) % (a) Year-over-year sales growth excluding the translation impact of changes in foreign currency rates. Calculated by translating net sales for the quarter ended December 31, 2024 into U.S. dollars using the weighted-average foreign exchange rates for the quarter ended December 31, 2023. (b) Countries outside of the United States, Canada and Brazil represent $0.1 million, or 0.2% of sales, for the quarter ended December 31, 2024 and $1.8 million, or 2.0% of sales, for the quarter ended December 31, 2023. ScanSource, Inc. Earnings Infographic Q2 FY2025 SUPPORTING MATERIALS AND RECONCILIATIONS FOR NON-GAAP FINANCIAL INFORMATION scansource.com 7 January 30, 2025
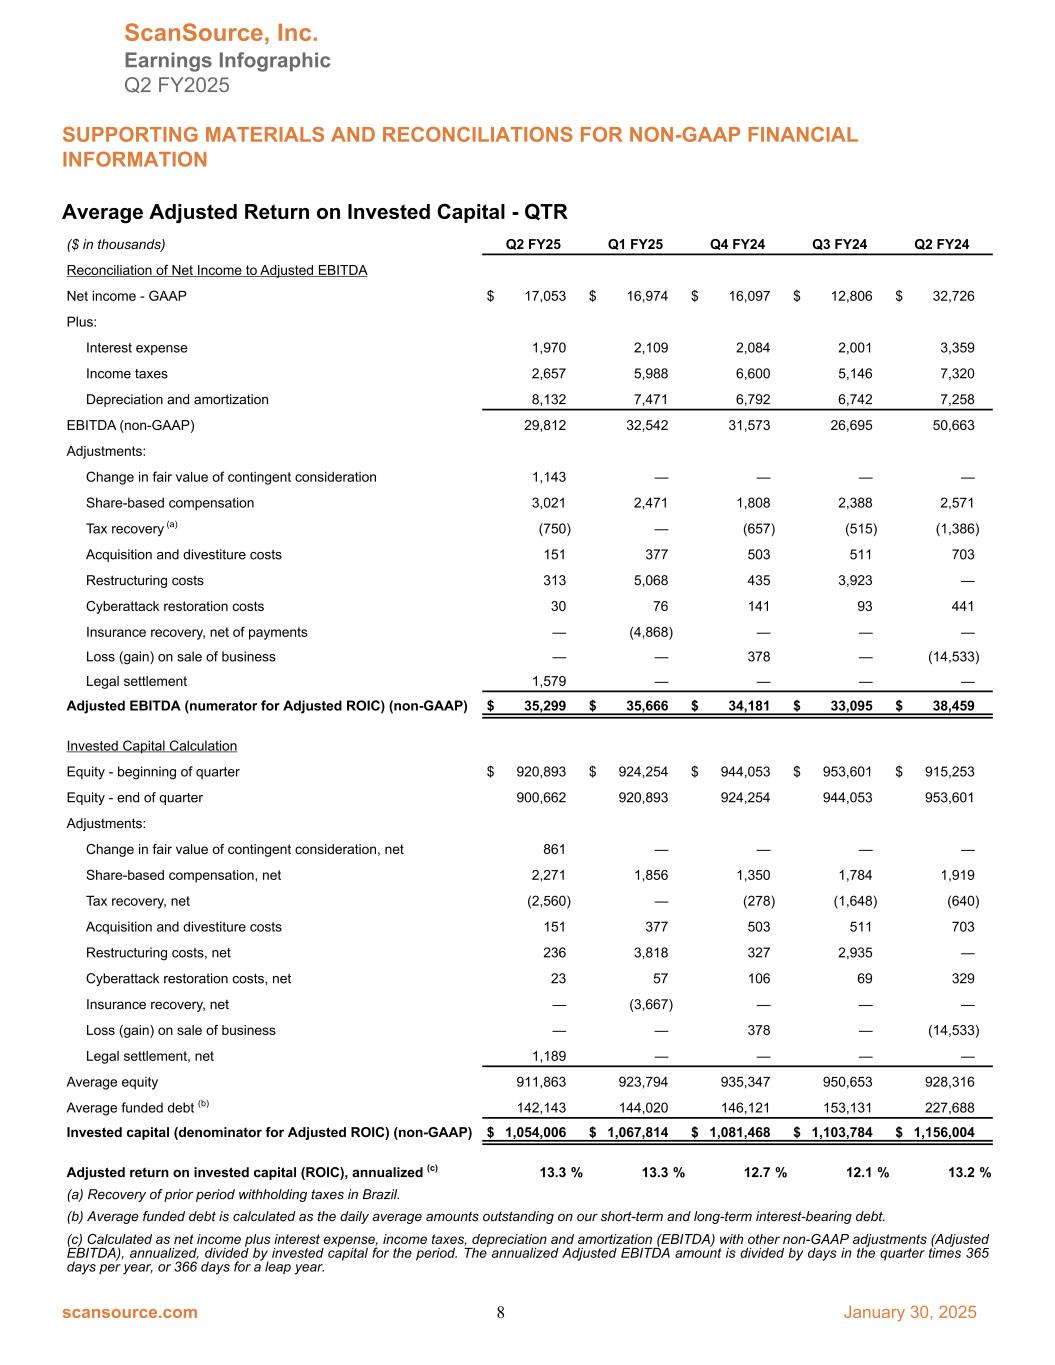
Average Adjusted Return on Invested Capital - QTR ($ in thousands) Q2 FY25 Q1 FY25 Q4 FY24 Q3 FY24 Q2 FY24 Reconciliation of Net Income to Adjusted EBITDA Net income - GAAP $ 17,053 $ 16,974 $ 16,097 $ 12,806 $ 32,726 Plus: Interest expense 1,970 2,109 2,084 2,001 3,359 Income taxes 2,657 5,988 6,600 5,146 7,320 Depreciation and amortization 8,132 7,471 6,792 6,742 7,258 EBITDA (non-GAAP) 29,812 32,542 31,573 26,695 50,663 Adjustments: Change in fair value of contingent consideration 1,143 — — — — Share-based compensation 3,021 2,471 1,808 2,388 2,571 Tax recovery (a) (750) — (657) (515) (1,386) Acquisition and divestiture costs 151 377 503 511 703 Restructuring costs 313 5,068 435 3,923 — Cyberattack restoration costs 30 76 141 93 441 Insurance recovery, net of payments — (4,868) — — — Loss (gain) on sale of business — — 378 — (14,533) Legal settlement 1,579 — — — — Adjusted EBITDA (numerator for Adjusted ROIC) (non-GAAP) $ 35,299 $ 35,666 $ 34,181 $ 33,095 $ 38,459 Invested Capital Calculation Equity - beginning of quarter $ 920,893 $ 924,254 $ 944,053 $ 953,601 $ 915,253 Equity - end of quarter 900,662 920,893 924,254 944,053 953,601 Adjustments: Change in fair value of contingent consideration, net 861 — — — — Share-based compensation, net 2,271 1,856 1,350 1,784 1,919 Tax recovery, net (2,560) — (278) (1,648) (640) Acquisition and divestiture costs 151 377 503 511 703 Restructuring costs, net 236 3,818 327 2,935 — Cyberattack restoration costs, net 23 57 106 69 329 Insurance recovery, net — (3,667) — — — Loss (gain) on sale of business — — 378 — (14,533) Legal settlement, net 1,189 — — — — Average equity 911,863 923,794 935,347 950,653 928,316 Average funded debt (b) 142,143 144,020 146,121 153,131 227,688 Invested capital (denominator for Adjusted ROIC) (non-GAAP) $ 1,054,006 $ 1,067,814 $ 1,081,468 $ 1,103,784 $ 1,156,004 Adjusted return on invested capital (ROIC), annualized (c) 13.3 % 13.3 % 12.7 % 12.1 % 13.2 % (a) Recovery of prior period withholding taxes in Brazil. (b) Average funded debt is calculated as the daily average amounts outstanding on our short-term and long-term interest-bearing debt. (c) Calculated as net income plus interest expense, income taxes, depreciation and amortization (EBITDA) with other non-GAAP adjustments (Adjusted EBITDA), annualized, divided by invested capital for the period. The annualized Adjusted EBITDA amount is divided by days in the quarter times 365 days per year, or 366 days for a leap year. ScanSource, Inc. Earnings Infographic Q2 FY2025 SUPPORTING MATERIALS AND RECONCILIATIONS FOR NON-GAAP FINANCIAL INFORMATION scansource.com 8 January 30, 2025

Net Debt and Adjusted EBITDA Metrics ($ in thousands) Q2 FY25 Q1 FY25 Q4 FY24 Q3 FY24 Q2 FY24 Consolidated debt (Q/E) $ 139,899 $ 143,649 $ 144,056 $ 145,881 $ 168,634 Less: Cash and cash equivalents of continuing operations (Q/E) (110,520) (145,044) (185,460) (159,050) (44,987) Net debt (Q/E) (non-GAAP) $ 29,379 $ (1,395) $ (41,404) $ (13,169) $ 123,647 Reconciliation of Net Income to Adjusted EBITDA Net income - GAAP $ 17,053 $ 16,974 $ 16,097 $ 12,806 $ 32,726 Plus: Interest expense 1,970 2,109 2,084 2,001 3,359 Income taxes 2,657 5,988 6,600 5,146 7,320 Depreciation and amortization 8,132 7,471 6,792 6,742 7,258 EBITDA (non-GAAP) 29,812 32,542 31,573 26,695 50,663 Adjustments: Share-based compensation 3,021 2,471 1,808 2,388 2,571 Change in fair value of contingent consideration 1,143 — — — — Tax recovery (a) (750) — (657) (515) (1,386) Acquisition and divestiture costs 151 377 503 511 703 Restructuring costs 313 5,068 435 3,923 — Cyberattack restoration costs 30 76 141 93 441 Insurance recovery, net of payments — (4,868) — — — Loss (gain) on sale of business — — 378 — (14,533) Legal settlement 1,579 — — — — Adjusted EBITDA (non-GAAP) $ 35,299 $ 35,666 $ 34,181 $ 33,095 $ 38,459 Adjusted EBITDA, TTM (non-GAAP) (b) $ 138,241 Net Debt / Adjusted EBITDA, TTM (non-GAAP) 0.2 x (a) Recovery of prior period withholding taxes in Brazil (b) Adjusted EBITDA for the trailing 12-month period ScanSource, Inc. Earnings Infographic Q2 FY2025 SUPPORTING MATERIALS AND RECONCILIATIONS FOR NON-GAAP FINANCIAL INFORMATION scansource.com 9 January 30, 2025

Working Capital, 5-Quarter Summary ($ in thousands) Q2 FY25 Q1 FY25 Q4 FY24 Q3 FY24 Q2 FY24 Accounts receivable (Q/E) $ 549,112 $ 567,127 $ 581,523 $ 589,847 $ 662,799 Days sales outstanding in receivables 66 66 71 71 68 Inventory (Q/E) $ 491,978 $ 504,078 $ 512,634 $ 529,163 $ 575,137 Inventory turns 5.2 5.3 5.0 4.8 5.1 Accounts payable (Q/E) $ 520,408 $ 578,657 $ 587,984 $ 555,733 $ 540,642 Paid for inventory days* 11.1 4.4 4.2 11.2 15.7 Working capital (Q/E) (AR+INV-AP) $ 520,682 $ 492,548 $ 506,173 $ 563,277 $ 697,294 Cash conversion cycle 77 70 75 82 84 *Paid for inventory days represent Q/E inventory days less Q/E accounts payable days ScanSource, Inc. Earnings Infographic Q2 FY2025 SUPPORTING MATERIALS AND RECONCILIATIONS FOR NON-GAAP FINANCIAL INFORMATION scansource.com 10 January 30, 2025
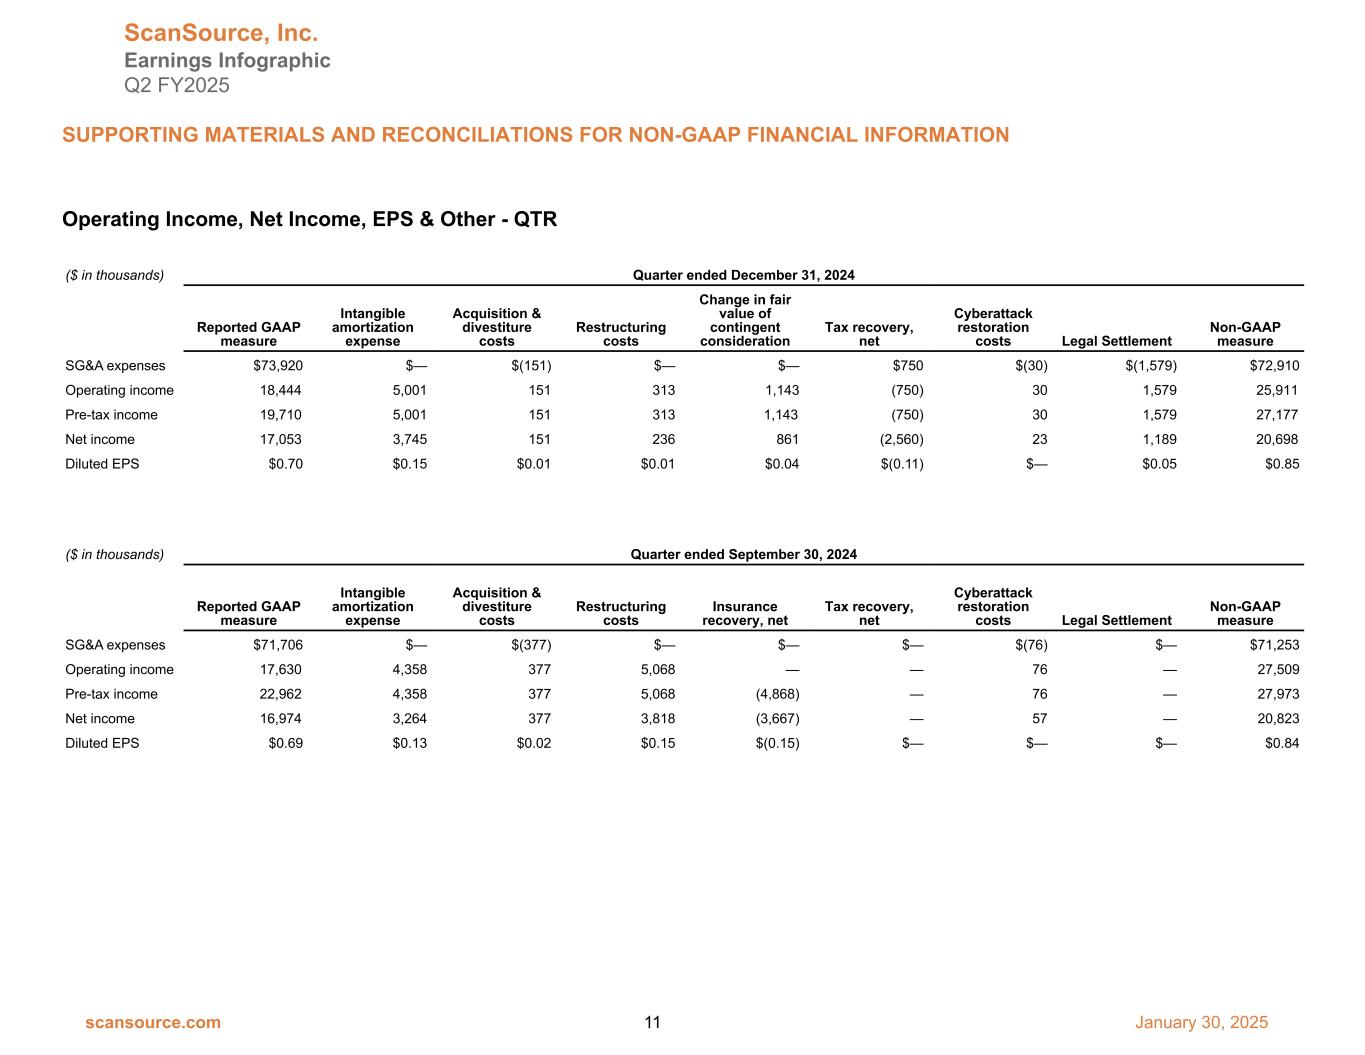
Operating Income, Net Income, EPS & Other - QTR ($ in thousands) Quarter ended December 31, 2024 Reported GAAP measure Intangible amortization expense Acquisition & divestiture costs Restructuring costs Change in fair value of contingent consideration Tax recovery, net Cyberattack restoration costs Legal Settlement Non-GAAP measure SG&A expenses $73,920 $— $(151) $— $— $750 $(30) $(1,579) $72,910 Operating income 18,444 5,001 151 313 1,143 (750) 30 1,579 25,911 Pre-tax income 19,710 5,001 151 313 1,143 (750) 30 1,579 27,177 Net income 17,053 3,745 151 236 861 (2,560) 23 1,189 20,698 Diluted EPS $0.70 $0.15 $0.01 $0.01 $0.04 $(0.11) $— $0.05 $0.85 ($ in thousands) Quarter ended September 30, 2024 Reported GAAP measure Intangible amortization expense Acquisition & divestiture costs Restructuring costs Insurance recovery, net Tax recovery, net Cyberattack restoration costs Legal Settlement Non-GAAP measure SG&A expenses $71,706 $— $(377) $— $— $— $(76) $— $71,253 Operating income 17,630 4,358 377 5,068 — — 76 — 27,509 Pre-tax income 22,962 4,358 377 5,068 (4,868) — 76 — 27,973 Net income 16,974 3,264 377 3,818 (3,667) — 57 — 20,823 Diluted EPS $0.69 $0.13 $0.02 $0.15 $(0.15) $— $— $— $0.84 (a) Reflects adjustment to the gain on the sale of the UK-based intY business. ScanSource, Inc. Earnings Infographic Q2 FY2025 SUPPORTING MATERIALS AND RECONCILIATIONS FOR NON-GAAP FINANCIAL INFORMATION scansource.com 11 January 30, 2025
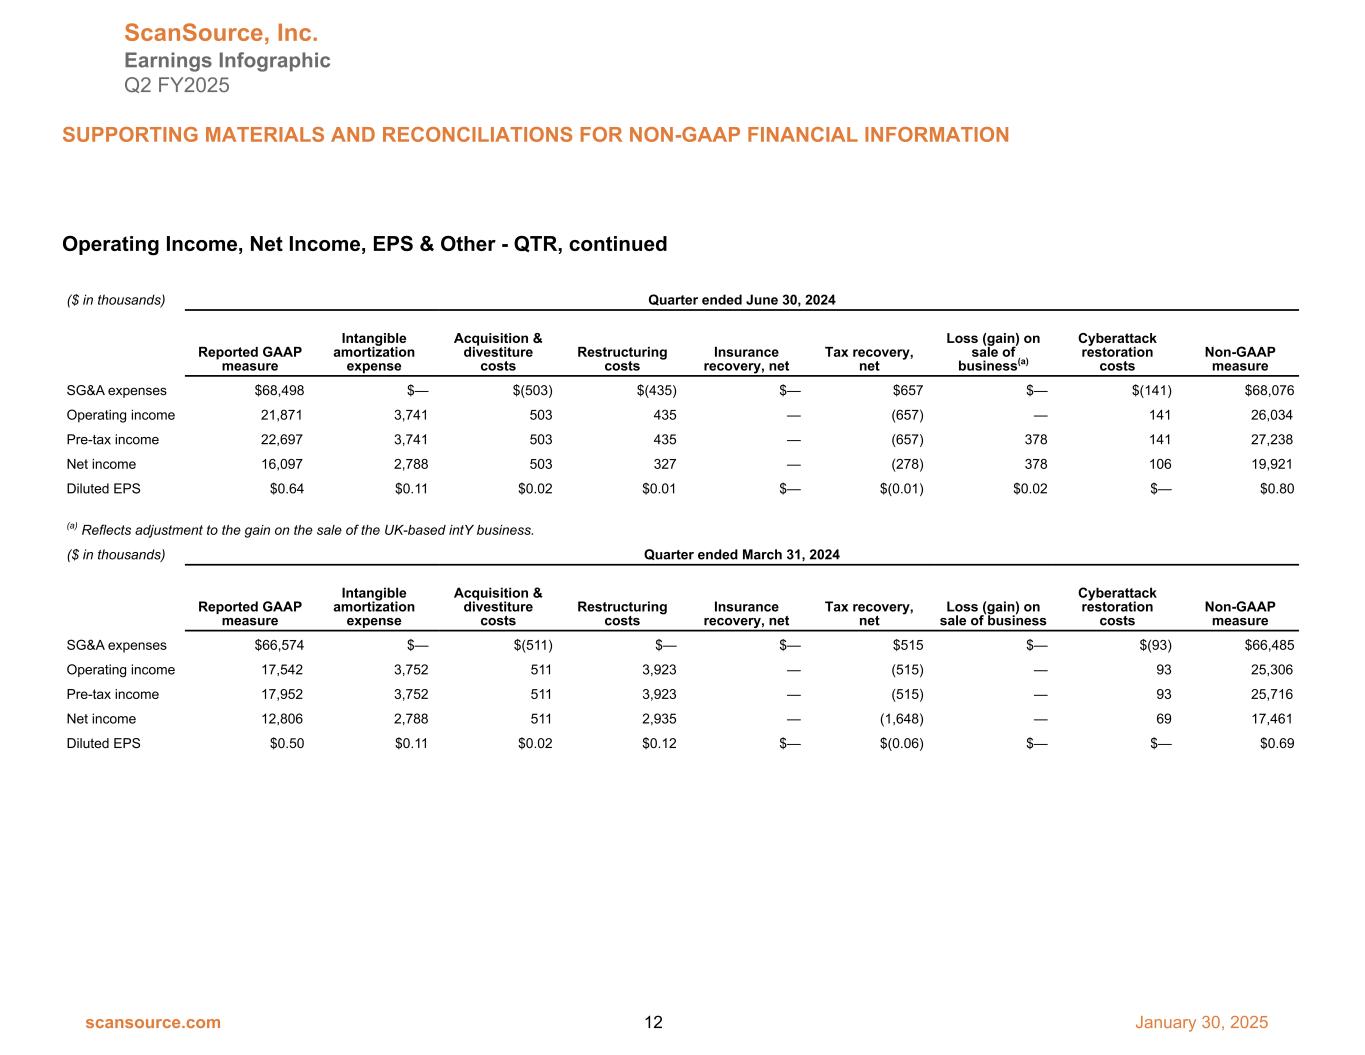
Operating Income, Net Income, EPS & Other - QTR, continued ($ in thousands) Quarter ended June 30, 2024 Reported GAAP measure Intangible amortization expense Acquisition & divestiture costs Restructuring costs Insurance recovery, net Tax recovery, net Loss (gain) on sale of business(a) Cyberattack restoration costs Non-GAAP measure SG&A expenses $68,498 $— $(503) $(435) $— $657 $— $(141) $68,076 Operating income 21,871 3,741 503 435 — (657) — 141 26,034 Pre-tax income 22,697 3,741 503 435 — (657) 378 141 27,238 Net income 16,097 2,788 503 327 — (278) 378 106 19,921 Diluted EPS $0.64 $0.11 $0.02 $0.01 $— $(0.01) $0.02 $— $0.80 (a) Reflects adjustment to the gain on the sale of the UK-based intY business. ($ in thousands) Quarter ended March 31, 2024 Reported GAAP measure Intangible amortization expense Acquisition & divestiture costs Restructuring costs Insurance recovery, net Tax recovery, net Loss (gain) on sale of business Cyberattack restoration costs Non-GAAP measure SG&A expenses $66,574 $— $(511) $— $— $515 $— $(93) $66,485 Operating income 17,542 3,752 511 3,923 — (515) — 93 25,306 Pre-tax income 17,952 3,752 511 3,923 — (515) — 93 25,716 Net income 12,806 2,788 511 2,935 — (1,648) — 69 17,461 Diluted EPS $0.50 $0.11 $0.02 $0.12 $— $(0.06) $— $— $0.69 ScanSource, Inc. Earnings Infographic Q2 FY2025 SUPPORTING MATERIALS AND RECONCILIATIONS FOR NON-GAAP FINANCIAL INFORMATION scansource.com 12 January 30, 2025
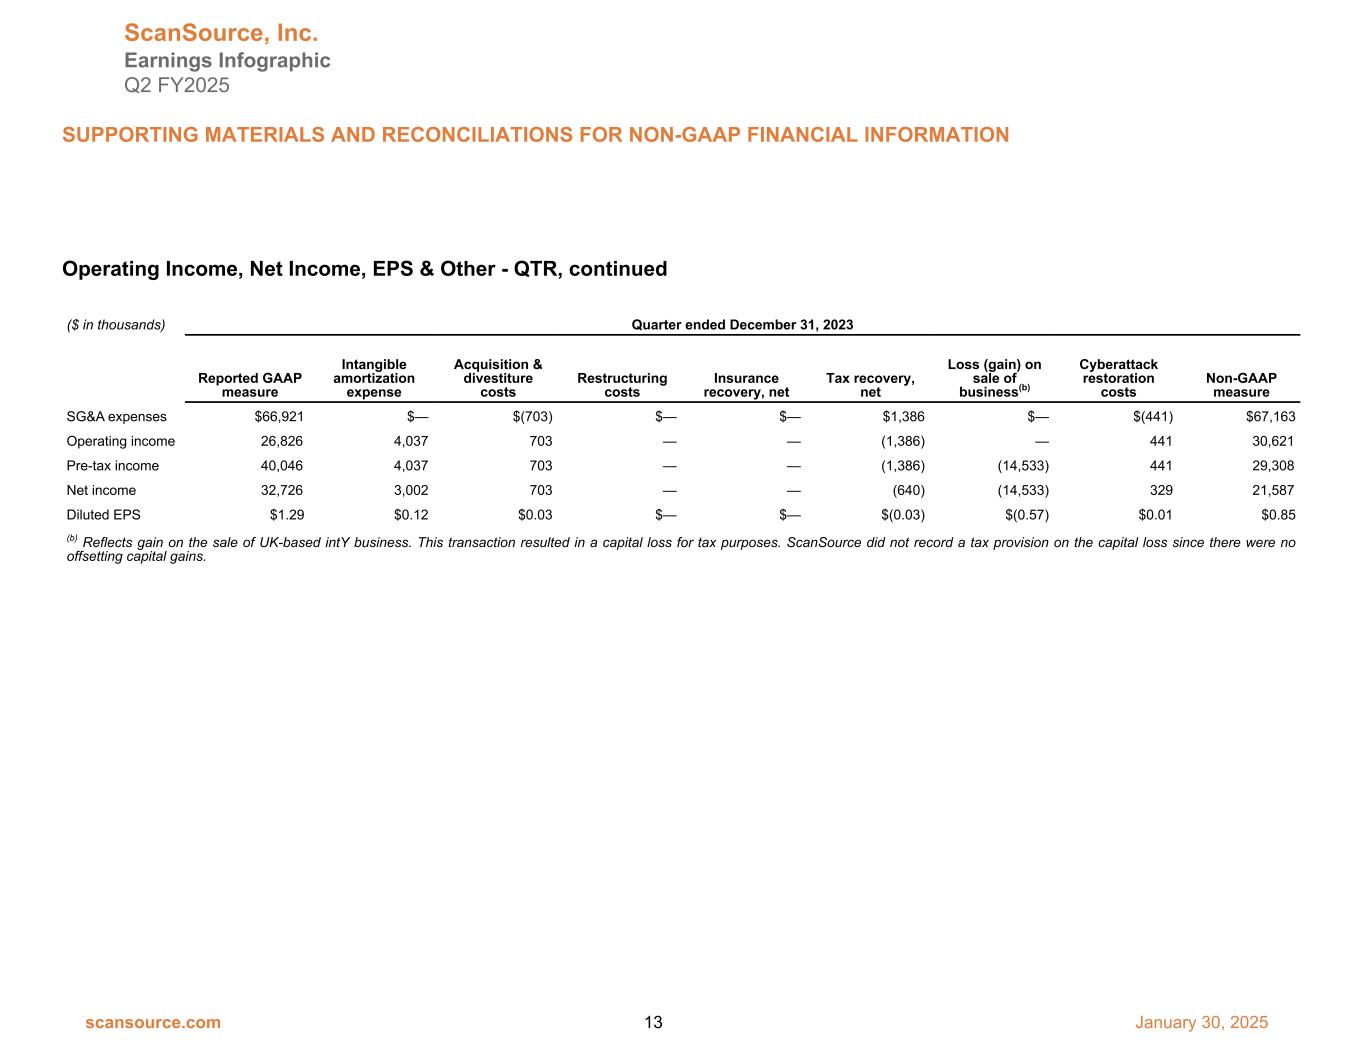
Operating Income, Net Income, EPS & Other - QTR, continued ($ in thousands) Quarter ended December 31, 2023 Reported GAAP measure Intangible amortization expense Acquisition & divestiture costs Restructuring costs Insurance recovery, net Tax recovery, net Loss (gain) on sale of business(b) Cyberattack restoration costs Non-GAAP measure SG&A expenses $66,921 $— $(703) $— $— $1,386 $— $(441) $67,163 Operating income 26,826 4,037 703 — — (1,386) — 441 30,621 Pre-tax income 40,046 4,037 703 — — (1,386) (14,533) 441 29,308 Net income 32,726 3,002 703 — — (640) (14,533) 329 21,587 Diluted EPS $1.29 $0.12 $0.03 $— $— $(0.03) $(0.57) $0.01 $0.85 (b) Reflects gain on the sale of UK-based intY business. This transaction resulted in a capital loss for tax purposes. ScanSource did not record a tax provision on the capital loss since there were no offsetting capital gains. ScanSource, Inc. Earnings Infographic Q2 FY2025 SUPPORTING MATERIALS AND RECONCILIATIONS FOR NON-GAAP FINANCIAL INFORMATION scansource.com 13 January 30, 2025


