Exhibit 13.1
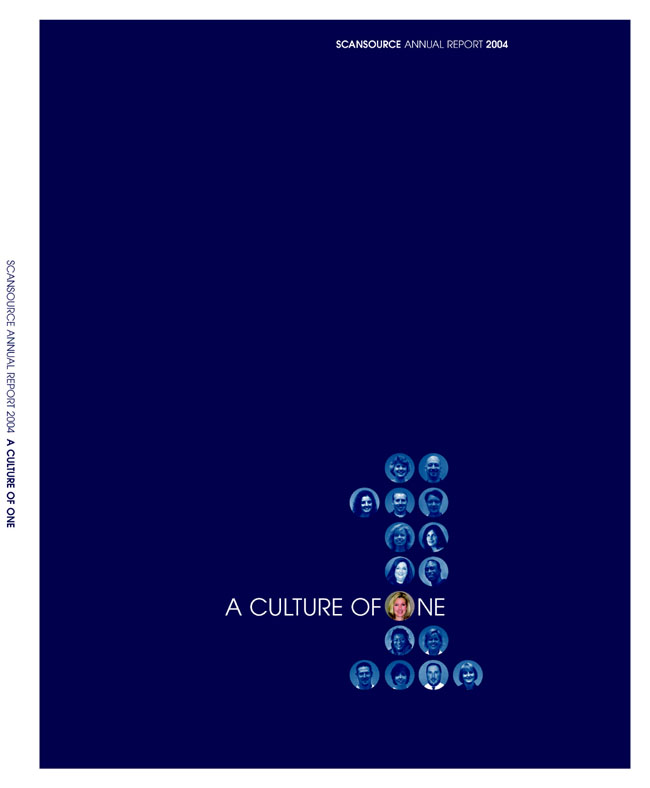
SCANSOURCE ANNUAL REPORT 2004
A CULTURE OF ONE
SCANSOURCE ANNUAL REPORT 2004 A CULTURE OF ONE

Core Value 1:
We believe in honesty and integrity in everything that we do. There is no alternative.
“As a distributor, we’re in the credibility business. Because our business model hinges on successful partnerships with resellers and manufacturers, it’s critical that our partners know they can always count on our integrity. For us, honesty isn’t just the best policy. It’s the only policy.”
Emmanuel Kongolo
SCANSOURCE EUROPE
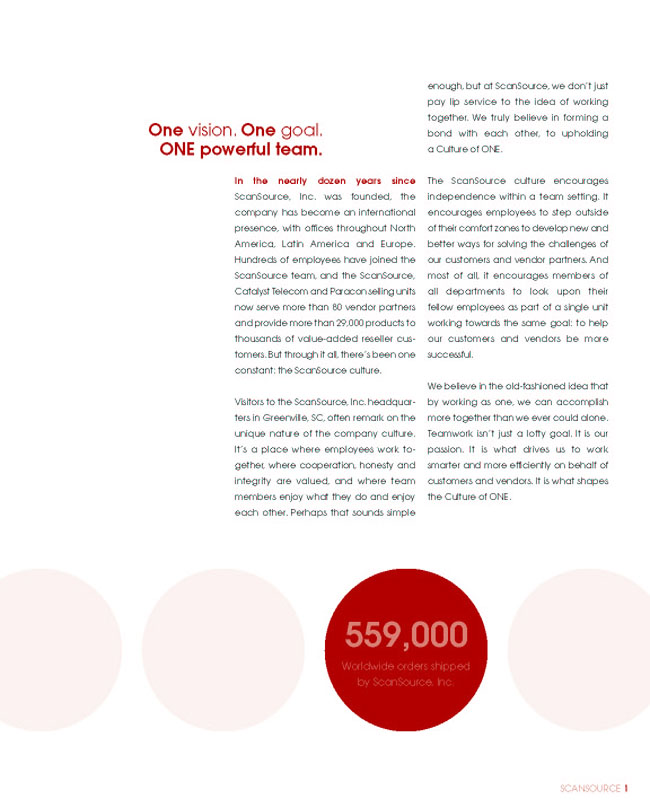
One vision. One goal.
ONE powerful team.
In the nearly dozen years since ScanSource, Inc. was founded, the company has become an international presence, with offices throughout North America, Latin America and Europe. Hundreds of employees have joined the ScanSource team, and the ScanSource, Catalyst Telecom and Paracon selling units now serve more than 80 vendor partners and provide more than 29,000 products to thousands of value-added reseller customers. But through it all, there’s been one constant: the ScanSource culture.
Visitors to the ScanSource, Inc. headquarters in Greenville, SC, often remark on the unique nature of the company culture. It’s a place where employees work together, where cooperation, honesty and integrity are valued, and where team members enjoy what they do and enjoy each other. Perhaps that sounds simple enough, but at ScanSource, we don’t just pay lip service to the idea of working together. We truly believe in forming a bond with each other, to upholding a Culture of ONE.
The ScanSource culture encourages independence within a team setting. It encourages employees to step outside of their comfort zones to develop new and better ways for solving the challenges of our customers and vendor partners. And most of all, it encourages members of all departments to look upon their fellow employees as part of a single unit working towards the same goal: to help our customers and vendors be more successful.
We believe in the old-fashioned idea that by working as one, we can accomplish more together than we ever could alone. Teamwork isn’t just a lofty goal. It is our passion. It is what drives us to work smarter and more efficiently on behalf of customers and vendors. It is what shapes the Culture of ONE.
559,000
Worldwide orders shipped
by ScanSource, Inc.
SCANSOURCE 1
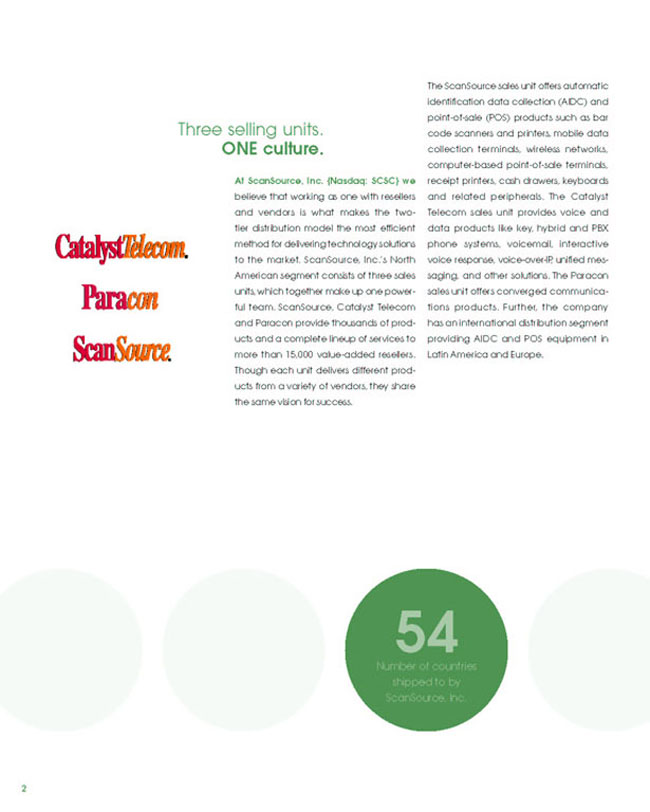
Three selling units.
ONE culture.
At ScanSource, Inc. {Nasdaq: SCSC} we believe that working as one with resellers and vendors is what makes the two-tier distribution model the most efficient method for delivering technology solutions to the market. ScanSource, Inc.’s North American segment consists of three sales units, which together make up one powerful team. ScanSource, Catalyst Telecom and Paracon provide thousands of products and a complete lineup of services to more than 15,000 value-added resellers. Though each unit delivers different products from a variety of vendors, they share the same vision for success.
The ScanSource sales unit offers automatic identification data collection (AIDC) and point-of-sale (POS) products such as bar code scanners and printers, mobile data collection terminals, wireless networks, computer-based point-of-sale terminals, receipt printers, cash drawers, keyboards and related peripherals. The Catalyst Telecom sales unit provides voice and data products like key, hybrid and PBX phone systems, voicemail, interactive voice response, voice-over-IP, unified messaging, and other solutions. The Paracon sales unit offers converged communications products. Further, the company has an international distribution segment providing AIDC and POS equipment in Latin America and Europe.
54 Number of countries
shipped to by
ScanSource, Inc.
2

Core Value 2:
We highly value our customers and vendors and are committed to meeting their needs quickly and fairly.
“When we assist customers with issues, our task isn’t complete unless we’ve helped to make sure that they are the hero. No matter our contributions on a project, we’re happiest when our vendors and customers get the credit, because it means we’ve done our job well.”
Betty Benson
MEMPHIS DISTRIBUTION CENTER

Core Value 3:
We believe each employee’s opinion counts and deserves respect.
“At ScanSource, we believe there is no single right way to solve a problem. Instead, we trust that we’ll find the best way to answer any challenge by listening to and learning from each other.”
Anna Cerna
SCANSOURCE LATIN AMERICA
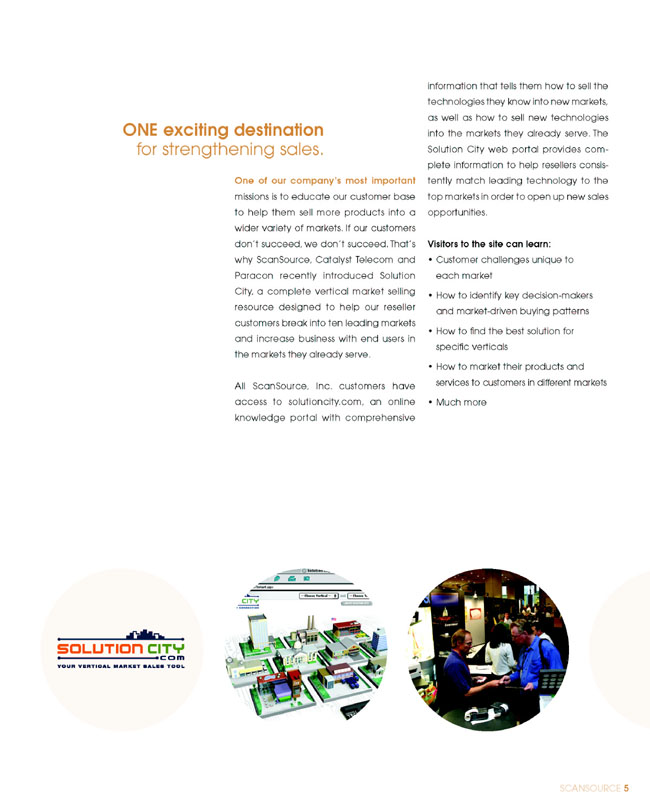
ONE exciting destination for strengthening sales.
One of our company’s most important missions is to educate our customer base to help them sell more products into a wider variety of markets. If our customers don’t succeed, we don’t succeed. That’s why ScanSource, Catalyst Telecom and Paracon recently introduced Solution City, a complete vertical market selling resource designed to help our reseller customers break into ten leading markets and increase business with end users in the markets they already serve.
All ScanSource, Inc. customers have access to solutioncity.com, an online knowledge portal with comprehensive information that tells them how to sell the technologies they know into new markets, as well as how to sell new technologies into the markets they already serve. The Solution City web portal provides complete information to help resellers consistently match leading technology to the top markets in order to open up new sales opportunities.
Visitors to the site can learn:
• | Customer challenges unique to each market |
• | How to identify key decision-makers and market-driven buying patterns |
• | How to find the best solution for specific verticals |
• | How to market their products and services to customers in different markets |
SCANSOURCE 5
Ten leading markets. ONE powerful tool for reaching them all.
At solutioncity.com, our customers can learn how to successfully apply their products and services to customers in ten markets that provide strong opportunities for growth. The site provides a complete overview of distribution, education, field mobile, financial services, food, government, healthcare, hospitality, manufacturing and retail.
Further, the site is organized around “VerTechs”– the intersection of a particular type of technology with a specific vertical market, demonstrating how a product works in a certain market. In addition to helping resellers break into new markets, Solution City helps them expand their technology product offerings to better serve customers in the markets they’re already working in. The site provides information on selling the following technologies in top markets:
• | Bar Code Scanning/Data Collection |
• | LAN & WAN infrastructure |
• | Kiosk/Touch Screen/Self-Service |
• | Business Communications Systems |
• | Converged Voice/Data/Video – Voice over IP |
• | Telephony Communication Applications |
• | Specialty Technology and Services |
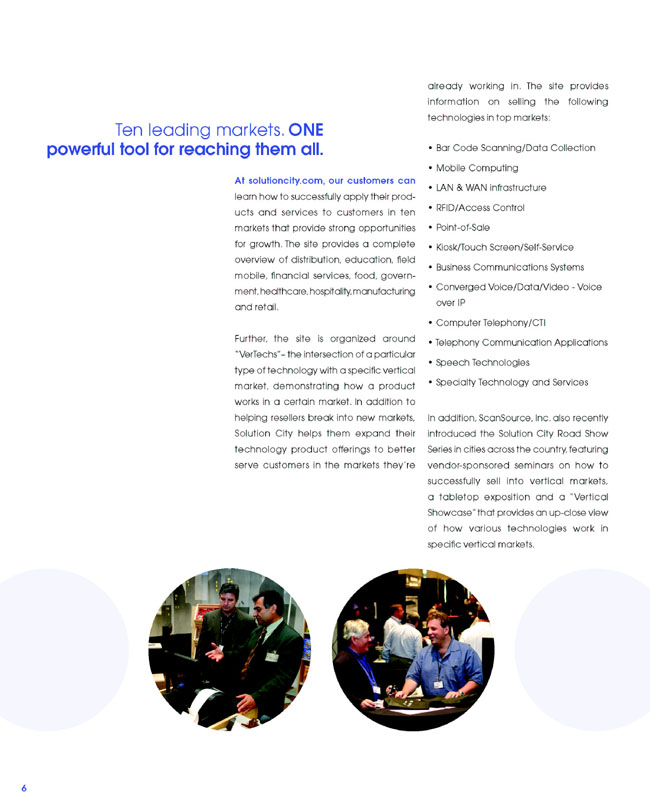
In addition, ScanSource, Inc. also recently introduced the Solution City Road Show Series in cities across the country, featuring vendor-sponsored seminars on how to successfully sell into vertical markets, a tabletop exposition and a “Vertical Showcase” that provides an up-close view of how various technologies work in specific vertical markets.
6

Core Value 4:
We encourage innovation and creativity from every employee, in every department. Mistakes that arise from good intentions and hard work are distinguished from those arising from lack of effort or carelessness.
“I come to work everyday knowing that I’m empowered to do my job with imagination and creativity. There are no limits on the ways in which we can approach the issues and challenges we face.”
Jeanne Gotfred
CATALYST TELECOM

Michael L. Baur
PRESIDENT & CHIEF EXECUTIVE OFFICER
To Our Shareholders:
Since our inception in 1992, ScanSource employees have made a deeply important and lasting contribution to our company’s success. That contribution is the ScanSource culture, and without it, we could not be the company that we are today or the company that we hope to be tomorrow. One by one for more than a decade, ScanSource employees have enhanced, strengthened and shaped our company’s culture, creating an environment that values teamwork, integrity, honesty, commitment and, just as importantly, fun. Put simply, we believe that by enjoying what we do and cherishing the people with whom we work, our company has a much better chance to continue its strong legacy of growth.
Together, our team has built what we call “A Culture of ONE” – a culture in which hundreds of ScanSource employees in offices around the world work together as one to meet the needs of our customers and our vendor partners. While the simple concept of “teamwork” may sound like just another word on a list of company core values, to us it is more than that. It is what defines us, what differentiates us as we strive to work more efficiently than ever on behalf of our customers and vendors.
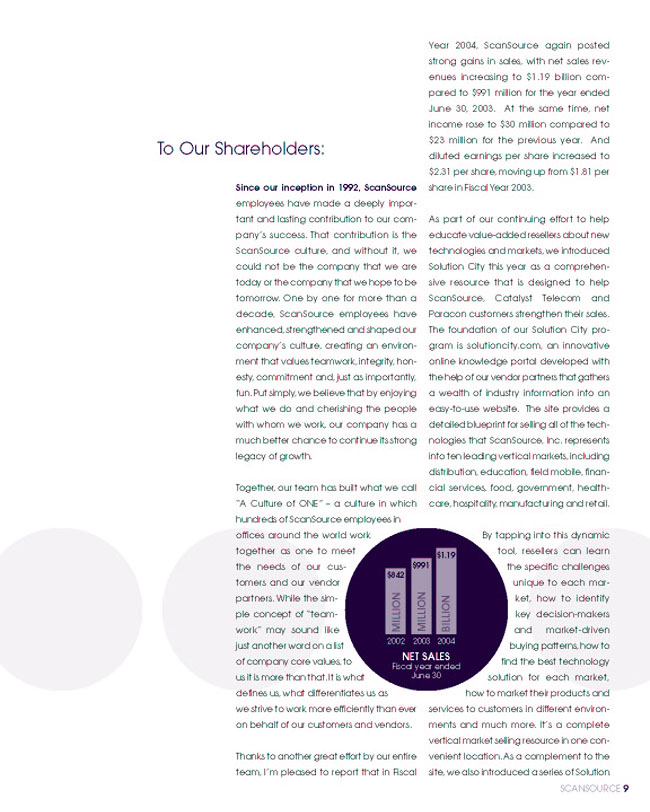
Thanks to another great effort by our entire team, I’m pleased to report that in Fiscal Year 2004, ScanSource again posted strong gains in sales, with net sales revenues increasing to $1.19 billion compared to $991 million for the year ended June 30, 2003. At the same time, net income rose to $30 million compared to $23 million for the previous year. And diluted earnings per share increased to $2.31 per share, moving up from $1.81 per share in Fiscal Year 2003.
As part of our continuing effort to help educate value-added resellers about new technologies and markets, we introduced Solution City this year as a comprehensive resource that is designed to help ScanSource, Catalyst Telecom and Paracon customers strengthen their sales. The foundation of our Solution City program is solutioncity.com, an innovative online knowledge portal developed with the help of our vendor partners that gathers a wealth of industry information into an easy-to-use website. The site provides a detailed blueprint for selling all of the technologies that ScanSource, Inc. represents into ten leading vertical markets, including distribution, education, field mobile, financial services, food, government, healthcare, hospitality, manufacturing and retail.
By tapping into this dynamic tool, resellers can learn the specific challenges unique to each market, how to identify key decision-makers and market-driven buying patterns, how to find the best technology solution for each market, how to market their products and services to customers in different environments and much more. It’s a complete vertical market selling resource in one convenient location. As a complement to the site, we also introduced a series of Solution
SCANSOURCE 9

City Road Shows to provide customers and prospects with an up-close view of how various technologies work in vertical markets, plus vendor-sponsored seminars and exhibitions. Hundreds of resellers attended shows in Anaheim, New York City and Chicago with upcoming shows planned for Atlanta and other cities throughout North America.
In addition to helping our customers succeed in new markets with technologies that they may already be familiar with, we are also stepping up our efforts to assist resellers in seizing future opportunities with emerging technologies. Due to recent shipping mandates by organizations including Wal-Mart, Metro AG and the U.S. Department of Defense, the acceptance of and demand for radio frequency identification (RFID) technology is developing more quickly than ever. Bar coding and mobile computing resellers stand to gain tremendous benefits from the emergence of RFID, and ScanSource and our vendor partners are poised to help them take advantage of this exciting technology. Similarly, converged communications dealers are increasingly finding new enthusiasm for Voice-over-IP products among end users, and our Catalyst Telecom and Paracon sales units continue to provide education and assistance for helping them tap into the power of VoIP. Rather than treading familiar, comfortable ground, we continue to believe it is important to help push our customers toward newer and profitable territory for the future.
We continued to strengthen and enhance the Partner Services that we offer to help our customers save time, money and resources. As part of our ongoing commitment to delivering the most comprehensive value-added services in the industry, we established a Partner Services group to provide an even greater level of executive focus and oversight to our service offerings. In addition to services like marketing tools, education and training, e-commerce and system integration, we also formed strategic partnerships this year to help us provide a deeper pool of services to our customers. Working with Rollouts Inc., we now offer end-user systems installations on behalf of our customers, including scheduling, deployment and management of field service technicians, to help resellers complete installations more quickly at a lower cost. Further, we joined forces with Corporate Business Solutions (CBS) to give our customers—many of whom operate small-to-medium-sized businesses—access to Fortune 100-level administrative operations. CBS assumes duties such as benefits administration, payroll management, government compliance, personnel administration, risk management and human resource functions at best-value pricing.
Our ScanSource sales unit, offering automatic identification data collection (AIDC) and point-of-sale (POS) products, continues to form a solid base for our company’s success. ScanSource strengthened its product offering this year by forming alliances with some of the technology industry’s most important vendors—Microsoft and HP—to provide our customers with a world-class solution for the retail market. Combining the HP rp5000 point-of-sale device and the Microsoft Business Solutions Retail Management System, this hardware and software solution is available exclusively through ScanSource and enables resellers to help their end-user customers reduce their IT budgets and upgrade their POS systems at a low cost by harnessing the power of desktop automation for a retail setting.
9 Number of languages
used by ScanSource Inc.
(Dutch, English, French, German,
Italian, Norwegian, Portuguese,
Spanish, Swedish)

Core Value 5:
We are committed to an environment that respects and values the diverse backgrounds, interests and talents of our employees.
“Diversity makes us a better company. Having a team that draws on diverse backgrounds and opinions leads to better, more informed decisions about doing what’s right for ScanSource, our customers and our vendors.”
Jill Bass
HUMAN RESOURCES

Core Value 6:
We protect our company resources to benefit those who depend on us, such as our employees and shareholders.
“We’re fanatical in protecting our company resources because we know that they aren’t abstract numbers on a balance sheet. Those resources represent the future of our company for employees and shareholders, and nothing is more important than protecting the future.”
Bob Thompson
MIS
The ScanSource unit also experienced continued growth in international markets during Fiscal Year 2004. Our ScanSource Europe and ScanSource Latin America offices continue to add customers and vendor partners, and now represent 10% of our overall business, up from seven percent the previous year. Our successes in Europe and Latin America will provide a solid foundation for us as ScanSource, Inc. continues to develop as a truly international company.
The Catalyst Telecom communications unit—providing Avaya-focused voice, data and converged communications equipment—delivered another strong performance this year. Catalyst added new vendors, including Extreme Networks, to our list of best-of-breed partners, and continued to work with Avaya to provide our customers with an enhanced level of professional services, training, maintenance and much more. And the Paracon unit, which offers converged communications products, benefited from a strengthened relationship with leading vendors like Intel and NEC. With a deeper product line than ever before and the strengthening of an experienced executive team, Paracon’s recent growth continued this year.
As in years past, our company’s growth did not go unnoticed by national media outlets. For the fourth time in five years, ScanSource was named one of the nation’s “100 Hot Growth Companies” by BusinessWeek magazine based on an increase in sales, earnings and return on capital over the past three years. ScanSource was also named one of the 100 fastest growing technology companies in the country by Business 2.0 magazine as part of its “B2 100” rankings. In recent years, ScanSource’s growth has also been recognized by such organizations as Fortune and Forbes.
In the end, we believe that our company’s long track record of growth has only been strengthened by an unswerving dedication to a culture of teamwork and integrity—A Culture of ONE. As we look to the future, we do so with an eye towards applying our two-tiered distribution business model to new technologies that can provide us with more opportunities than ever. But no matter what the future holds, our commitment to A Culture of ONE will never waver.
At ScanSource, Inc., we love what we do and we cherish those with whom we work. And as our numbers grow, we remain one team with one goal: to help our customers and our vendors be more successful than they could be without us. I hope you’ll join me in looking to our company’s future with excitement for what lies ahead.
Sincerely,
Mike Baur
President and CEO
ScanSource, Inc.
165,000
Number of tech support
calls answered
SCANSOURCE 13

ScanSource proudly partners with these leading manufacturers:
14

Core Value 7:
We are committed to helping those less fortunate in our communities by giving our time, talents and resources.
“Sharing time and resources with our local communities does more than provide assistance to people in need. It also gives our employees a higher sense of purpose and the deep satisfaction that comes from giving back.”
John Rodgers
TECHNICAL SUPPORT
SELECTED FINANCIAL DATA
The selected financial data below should be read in conjunction with “Management’s Discussion and Analysis” and ScanSource, Inc.’s (the “Company”) consolidated financial statements and related notes thereto included elsewhere in this annual report.
The following statement of income data and balance sheet data were derived from the Company’s consolidated financial statements.
| | | | | | | | | | | | | | | | | |
| | | Fiscal Year Ended June 30,
|
| | | 2004
| | | 2003
| | 2002
| | | 2001
| | 2000
|
| | | (In thousands, except per share data) |
Statement of income data: | | | | | | | | | | | | | | | | | |
Net sales | | $ | 1,192,090 | | | $ | 991,194 | | $ | 841,887 | | | $ | 630,744 | | $ | 497,421 |
Cost of goods sold | | | 1,060,310 | | | | 879,311 | | | 750,310 | | | | 556,919 | | | 443,716 |
| | |
|
|
| |
|
| �� |
|
|
| |
|
| |
|
|
Gross profit | | | 131,780 | | | | 111,883 | | | 91,577 | | | | 73,825 | | | 53,705 |
Selling, general and administrative expenses | | | 82,524 | | | | 71,359 | | | 59,767 | | | | 45,027 | | | 30,832 |
| | |
|
|
| |
|
| |
|
|
| |
|
| |
|
|
Operating income | | | 49,256 | | | | 40,524 | | | 31,810 | | | | 28,798 | | | 22,873 |
Interest expense (income), net | | | 601 | | | | 869 | | | 1,557 | | | | 2,034 | | | 639 |
Other expense (income), net | | | (164 | ) | | | 501 | | | (184 | ) | | | 207 | | | — |
| | |
|
|
| |
|
| |
|
|
| |
|
| |
|
|
Total other expense | | | 437 | | | | 1,370 | | | 1,373 | | | | 2,241 | | | 639 |
| | |
|
|
| |
|
| |
|
|
| |
|
| |
|
|
Income before income taxes, minority interest and extraordinary gain | | | 48,819 | | | | 39,154 | | | 30,437 | | | | 26,557 | | | 22,234 |
Provision for income taxes | | | 18,700 | | | | 16,050 | | | 11,268 | | | | 10,093 | | | 8,449 |
Minority interest in income of consolidated subsidiaries, net of taxes | | | 137 | | | | 530 | | | 56 | | | | — | | | — |
| | |
|
|
| |
|
| |
|
|
| |
|
| |
|
|
Income before extraordinary gain | | | 29,982 | | | | 22,574 | | | 19,113 | | | | 16,464 | | | 13,785 |
Extraordinary gain, net of income taxes | | | — | | | | — | | | 829 | | | | — | | | — |
| | |
|
|
| |
|
| |
|
|
| |
|
| |
|
|
Net income | | $ | 29,982 | | | $ | 22,574 | | $ | 19,942 | | | $ | 16,464 | | $ | 13,785 |
| | |
|
|
| |
|
| |
|
|
| |
|
| |
|
|
Net income per common share, basic | | $ | 2.40 | | | $ | 1.88 | | $ | 1.73 | | | $ | 1.45 | | $ | 1.24 |
| | |
|
|
| |
|
| |
|
|
| |
|
| |
|
|
Weighted-average shares outstanding, basic | | | 12,485 | | | | 12,013 | | | 11,524 | | | | 11,366 | | | 11,112 |
| | |
|
|
| |
|
| |
|
|
| |
|
| |
|
|
Net income per share, assuming dilution | | $ | 2.31 | | | $ | 1.81 | | $ | 1.60 | | | $ | 1.34 | | $ | 1.16 |
| | |
|
|
| |
|
| |
|
|
| |
|
| |
|
|
Weighted-average shares outstanding, assuming dilution | | | 12,952 | | | | 12,349 | | | 12,432 | | | | 12,248 | | | 11,938 |
| | |
|
|
| |
|
| |
|
|
| |
|
| |
|
|
| | | | | | | | | | | | | | | |
| |
| | | As of June 30,
|
| | | 2004
| | 2003
| | 2002
| | 2001
| | 2000
|
| | | (In thousands) |
Balance sheet data: | | | | | | | | | | | | | | | |
Working capital [A] | | $ | 188,096 | | $ | 116,859 | | $ | 91,723 | | $ | 78,513 | | $ | 55,625 |
Total assets | | | 413,192 | | | 344,347 | | | 359,032 | | | 283,885 | | | 205,880 |
Total long-term obligations (including current portion) [A] | | | 40,007 | | | 8,299 | | | 9,088 | | | 9,310 | | | 1,673 |
Total shareholders’ equity | | | 186,644 | | | 150,887 | | | 118,049 | | | 93,362 | | | 74,466 |
| [A] | The June 30, 2003, 2002, 2001 and 2000 balance sheets have been restated to reclassify borrowings under the revolving credit facility, which were previously reported as long-term debt, to a current liability pursuant to Emerging Issues Task Force (“EITF”) Issue No. 95-22. See Note 4 of Notes to Consolidated Financial Statements. |
16
MANAGEMENT’S DISCUSSION AND ANALYSIS
Certain statements within this annual report to shareholders and the documents incorporated by reference herein that are not historical facts are “forward-looking statements” as described in the “safe harbor” provision of the Private Securities Litigation Reform Act of 1995. These statements involve a number of risks and uncertainties and actual results could differ materially from those projected. Factors that could cause actual results to differ materially include the following: intense competition both domestically and internationally; narrow profit margins; inventory risks due to shifts in market demand; dependence on information systems; credit exposure due to the deterioration in the financial condition of our customers; a downturn in the general economy; the inability to obtain required capital; potential adverse effects of acquisitions; fluctuations in interest rates, foreign currency exchange rates and exposure to foreign markets [the imposition of governmental controls, currency devaluations, export license requirements, restrictions on the export of certain technology, political instability, trade restrictions, tariff changes, difficulties in staffing and managing international operations, changes in the interpretation and enforcement of laws (in particular related to items such as duty and taxation), difficulties in collecting accounts receivable, longer collection periods and the impact of local economic conditions and practices]; the impact of changes in income tax legislation; product supply and availability; dependence on independent shipping companies; changes in vendor terms and conditions; acts of war or terrorism; exposure to natural disasters; potential impact of labor strikes; volatility of common stock; and the accuracy of forecast data. Additional discussion of these and other factors affecting our business and prospects is contained in our periodic filings with the SEC, copies of which can be obtained at our Investor Relations website at www.scansource.com. Please refer to the cautionary statements and important factors discussed in Exhibit 99.1 of the Company’s Annual Report on Form 10-K for the year ended June 30, 2004 for further information. This discussion and analysis should be read in conjunction with “Selected Financial Data” and the Financial Statements and the Notes thereto included elsewhere in this Annual Report.
Overview
ScanSource, Inc. is a leading distributor of specialty technology products, providing value-added distribution sales to resellers in the specialty technology markets. The Company distributes more than 29,000 products worldwide. The Company has two geographic distribution segments: one serving North America from the Memphis distribution center, and an international segment currently serving Latin America (including Mexico) and Europe. The North American distribution segment markets automatic identification and data capture (“AIDC”) and point-of-sale (“POS”) products through the ScanSource sales unit; voice, data and converged communications equipment through its CatalystTelecom sales unit; and voice, data and converged communications products through its Paraconsales unit. The international distribution segment markets AIDC and POS products through its ScanSource sales unit.
The Company was incorporated in December 1992 and is headquartered in Greenville, South Carolina. The Company serves North America from a single, centrally located distribution center located near the FedEx hub in Memphis, Tennessee. The single warehouse and strong management information system form the cornerstone of the Company’s cost-driven operational strategy that, along with our growth through acquisitions, has caused operating income to grow at an average annual growth rate of 34.5% over the past
SCANSOURCE 17
five years, while sales have grown at an average annual rate of 33.1% to $1.2 billion over the same period. This strategy is being expanded to Latin America and Europe, with distribution centers located in Florida and Mexico, and in Belgium, respectively.
North American Distribution Segment
The Company’s North American distribution segment sells products exclusively to resellers and integrators in large and growing technology markets. Key AIDC vendors include Symbol, Intermec and Zebra, and some leading POS lines include IBM, NCR and Epson. Avaya is the Company’s most significant voice, data and converged communications partner, while Intel supplies key components for the converged communications market. Growth in net sales has been principally driven by intensive marketing efforts to recruit new reseller customers, competitive product pricing, selective expansion of the Company’s product line, and strategic acquisitions.
On January 1, 2003, ScanSource, Inc. sold its Mexico operations to Netpoint International, Inc. (“Netpoint”) (part of the international distribution segment), a majority-owned subsidiary of the Company, at book value with no gain or loss being recorded. Previously, the Mexico operations were reported in the North American distribution segment.
International Distribution Segment
The Company’s international distribution segment sells AIDC and POS products exclusively to resellers and integrators in the Latin American (including Mexican) and European markets principally from the same product manufacturers as those sold by the North American distribution segment. Marketing efforts to recruit new reseller customers, competitive product pricing and strategic acquisitions have driven growth in net sales.
The international distribution segment commenced operations in November 2001, when the Company acquired 52% of the common stock of Netpoint, a Miami-based distributor of AIDC and POS equipment to the Latin American market. In January 2002, the Company launched its pan-European strategy with the establishment of a distribution center and sales office in Belgium. In May 2002, the Company purchased ABC Technology Distribution (“ABC”), a distributor of AIDC and POS products based in the United Kingdom, allowing the Company to expand its European operations and make additional sales to former ABC customers in the United Kingdom. In March 2003, the Company completed its consolidation of the UK distribution center into the Belgium facility. The Company has centralized its accounting, information technology and sales management in the Belgium headquarters location.
Cost Control/Profitability
The Company’s operating income growth has been driven by increasing gross profit and disciplined control of operating expenses. The Company’s operations feature a scalable information system, streamlined management, and centralized distribution, enabling it to achieve the economies of scale necessary for cost-effective order fulfillment. From its inception, the Company has tightly managed its general and administrative expenses by maintaining strong cost controls. However, in order to continue to grow its markets, the Company has invested in new initiatives including investments in new geographic markets of Europe and Latin America, increased marketing efforts to recruit resellers, and enhancements of employee benefit plans to retain employees.
18
Results of Operations
The following table sets forth for the periods indicated certain income and expense items as a percentage of net sales:
| | | | | | | | | |
| | | Fiscal Year Ended June 30,
| |
| | | 2004
| | | 2003
| | | 2002
| |
Statement of income data: | | | | | | | | | |
Net sales | | 100.0 | % | | 100.0 | % | | 100.0 | % |
Cost of goods sold | | 88.9 | | | 88.7 | | | 89.1 | |
| | |
|
| |
|
| |
|
|
Gross profit | | 11.1 | | | 11.3 | | | 10.9 | |
Selling, general and administrative expenses | | 7.0 | | | 7.2 | | | 7.1 | |
| | |
|
| |
|
| |
|
|
Operating income | | 4.1 | | | 4.1 | | | 3.8 | |
Interest expense (income), net | | — | | | 0.1 | | | 0.2 | |
Other expense (income), net | | — | | | — | | | — | |
| | |
|
| |
|
| |
|
|
Total other expense | | 0.0 | | | 0.1 | | | 0.2 | |
| | |
|
| |
|
| |
|
|
Income before income taxes, minority interest and extraordinary gain | | 4.1 | | | 4.0 | | | 3.6 | |
Provision for income taxes | | 1.6 | | | 1.6 | | | 1.3 | |
Minority interest in income of consolidated subsidiaries, net of income taxes | | — | | | 0.1 | | | — | |
| | |
|
| |
|
| |
|
|
Income before extraordinary gain | | 2.5 | | | 2.3 | | | 2.3 | |
Extraordinary gain, net of taxes | | — | | | — | | | 0.1 | |
| | |
|
| |
|
| |
|
|
Net income | | 2.5 | % | | 2.3 | % | | 2.4 | % |
| | |
|
| |
|
| |
|
|
Comparison of Fiscal Years Ended June 30, 2004 and 2003
Net Sales.
The following tables summarize the Company’s net sales results (net of inter-segment sales):
Product Category
| | | | | | | | | | | | |
| | | 2004
| | 2003
| | Difference
| | Percentage
Change
| |
| | | (In thousands) | | | |
AIDC and POS products | | $ | 711,252 | | $ | 561,153 | | $ | 150,099 | | 26.7 | % |
Converged communications products | | | 480,838 | | | 430,041 | | | 50,797 | | 11.8 | % |
| | |
|
| |
|
| |
|
| | | |
| | | $ | 1,192,090 | | $ | 991,194 | | $ | 200,896 | | 20.3 | % |
| | |
|
| |
|
| |
|
| | | |
Geographic Segments
| | | | | | | | | | | | |
| | | 2004
| | 2003
| | Difference
| | Percentage
Change
| |
| | | (In thousands) | | | |
North American distribution | | $ | 1,075,812 | | $ | 922,641 | | $ | 153,171 | | 16.6 | % |
International distribution | | | 116,278 | | | 68,553 | | | 47,725 | | 69.6 | % |
| | |
|
| |
|
| |
|
| | | |
Net Sales | | $ | 1,192,090 | | $ | 991,194 | | $ | 200,896 | | 20.3 | % |
| | |
|
| |
|
| |
|
| | | |
SCANSOURCE 19
North American Distribution
North America distribution sales include sales to technology resellers in the United States and Canada from the Company’s Memphis, Tennessee distribution center. Sales to technology resellers in Canada account for less than 3% of total net sales for the fiscal years ended June 30, 2004 and 2003. The increase in North American distribution sales was due to increased market share resulting from a shift to the indirect channel, and from industry expansion tied to IT demands. Additional growth of net sales resulted from increased sales to existing customers through competitive product pricing and marketing efforts to reach specialty technology resellers.
Sales of the AIDC and POS product categories for the North America distribution segment increased 21% as compared to the prior year.The ScanSource selling unit benefited from stronger POS sales to larger retailers and renewed industry growth and more end user demand. The company continues to sign new resellers and gain additional market share from other two-tier distributors.
Sales of converged communications products increased 11.8% as compared to the prior year.CatalystTelecom, which distributes converged communication products, benefited from strengthened sales in the small and medium business (SMBS) products and from the enterprise (ECG) products. Additional resellers recruited earlier this year also contributed to the increase in sales. Paracon, which also distributes converged communications products, experienced an increase in sales as a result of the addition of a significant new product line.
International Distribution
The international distribution segment includes sales to Latin America (including Mexico) and Europe from the ScanSource selling unit. Sales for the overall international segment increased 70% or $47.7 million as compared to the prior year. The increase in sales for the European market was a result of increased focus on new customer recruitment and of vendor programs with the Company’s main European distributors. Latin American sales increased as a result of stable market growth in the international AIDC and POS markets and gain in market share, especially in the Mexican market.
The favorable Euro versus US Dollar exchange rate accounts for approximately $9.8 million of the increase for the year ended June 30, 2004. Without the benefit of the foreign exchange rates, the increase for the year would have been 55% or $37.9 million. Although management cannot forecast the future direction of foreign exchange rate movements, if significant unfavorable changes in exchange rates occur, net sales of the segment could be adversely affected.
Gross Profit.
The following table summarizes the Company’s gross profit:
| | | | | | | | | | | | | | | | | | |
| | | | | | | | | | | | Percentage of
Net Sales | |
| | | 2004
| | 2003
| | Difference
| | Change
| | | 2004
| | | 2003
| |
| | | (In thousands) | | | | | | | | | |
North American distribution | | $ | 117,568 | | $ | 101,636 | | $ | 15,932 | | 15.7 | % | | 10.9 | % | | 11.0 | % |
International distribution | | | 14,212 | | | 10,247 | | | 3,965 | | 38.7 | % | | 12.2 | % | | 14.9 | % |
| | |
|
| |
|
| |
|
| | | | | | | | | |
Gross Profit | | $ | 131,780 | | $ | 111,883 | | $ | 19,897 | | 17.8 | % | | 11.1 | % | | 11.3 | % |
| | |
|
| |
|
| |
|
| | | | | | | | | |
20
North American Distribution
Gross profit for the North American distribution segment increased $15.9 million for the fiscal year ended June 30, 2004 as compared to the prior fiscal year. The increase was primarily due to increased sales volume through sales to a larger reseller base and gains in existing market share.
Gross profit as a percentage of net sales for the North American distribution segment decreased to 10.9% of sales for fiscal year 2004 as compared to 11.0% of sales for the prior fiscal year. The decrease was primarily due to a $1.9 million decrease of e-logistic fee-based revenues, as customers have discontinued their use of these services. This decrease was offset by better than expected disposal of obsolete inventory during the fourth quarter and incremental vendor rebates related to several programs.
International Distribution
Gross profit for the international distribution segment increased $4.0 million for the fiscal year ended June 30, 2004 as compared to the prior fiscal year. The increase was primarily due to increased distribution sales volume as the segment gained additional resellers and market share.
Gross profit, as a percentage of net sales, which is typically greater than the North American distribution segment, decreased over the prior year. The decrease in gross margin is due to a sales mix change of lower margin products.
Operating Expenses.
The following table summarizes the Company’s operating expenses:
| | | | | | | | | | | | | | | | | |
| | | | | | | | | | | | Percentage of
Net Sales | |
| | | 2004
| | 2003
| | Difference
| | Change
| | | 2004
| | | 2003
| |
| | | (In thousands) | | | | | | | | | |
Fiscal year ended | | $82,524 | | $ | 71,359 | | $ | 11,165 | | 15.6 | % | | 6.9 | % | | 7.2 | % |
Operating expenses for the year ended June 30, 2004 included approximately $2.3 million of restructuring costs for the ChannelMax business, a discretionary profit sharing contribution to the 401(k) plan of $3.2 million, a charitable contribution of $1.1 million, a $1.4 million accrual for the disposition of a sales and use tax matter, and an impairment charge on capitalized software of $892,000.
Operating expenses for the year ended June 30, 2003 included a discretionary profit sharing contribution of $2.5 million, a charitable contribution of $970,000, and an impairment charge on capitalized software of $191,000. In addition, a $670,000 reclassification adjustment was made related to the adoption of Emerging Issues Task Force (“EITF”) Issue No. 02-16,Accounting by a Customer (Including a Reseller) for Certain Consideration Received from a Vendor. The adjustment reclassified $303,000 of excess vendor reimbursement as a reduction to cost of goods sold and $367,000 capitalized into inventory carrying costs, pending sales of the related products. These increases to operating expenses were partially offset by lower bad debt expense of $ 2.0 million.
SCANSOURCE 21
Operating Income.
The following table summarizes the Company’s operating income:
| | | | | | | | | | | | | | | | | | |
| | | | | | | | | | | | Percentage of
Net Sales | |
| | | 2004
| | 2003
| | Difference
| | Change
| | | 2004
| | | 2003
| |
| | | (In thousands) | | | | | | | | | |
Fiscal year ended | | $ | 49,256 | | $ | 40,524 | | $ | 8,732 | | 21.5 | % | | 4.1 | % | | 4.1 | % |
The increase in operating income for the fiscal year ended June 30, 2004 as compared to the prior fiscal year was due to increased gross margin as result of increased sales volume and cost controls that held operating expense growth below the rate of sales growth.
Total Other Expense (Income).
The following table summarizes the Company’s total other expense (income):
| | | | | | | | | | | | | | | | | | | | | |
| | | | | | | | | | | | | | | Percentage of
Net Sales | |
| | | 2004
| | | 2003
| | | Difference
| | | Change
| | | 2004
| | | 2003
| |
| | | (In thousands) | | | | | | | | | | |
Interest expense | | $ | 1,159 | | | $ | 2,063 | | | $ | (904 | ) | | -43.8 | % | | 0.1 | % | | 0.2 | % |
Interest income | | | (558 | ) | | | (1,194 | ) | | | 636 | | | -53.3 | % | | 0.0 | % | | -0.1 | % |
Net foreign exchange losses (gains) | | | (395 | ) | | | 453 | | | | (848 | ) | | -187.2 | % | | 0.0 | % | | 0.0 | % |
Other, net | | | 231 | | | | 48 | | | | 183 | | | 381.3 | % | | 0.0 | % | | 0.0 | % |
| | |
|
|
| |
|
|
| |
|
|
| | | | | | | | | |
Total other expense (income) | | $ | 437 | | | $ | 1,370 | | | $ | (933 | ) | | -68.1 | % | | 0.0 | % | | 0.1 | % |
| | |
|
|
| |
|
|
| |
|
|
| | | | | | | | | |
Interest expense for the years ended June 30, 2004 and 2003 was $1.2 million and $2.1 million, respectively, reflecting interest paid on borrowings on the Company’s line of credit and long-term debt. Interest expense for the year was lower due to lower interest rates in fiscal year 2004 and lower average borrowings on the Company’s line of credit over the past year.
Interest income for the years ended June 30, 2004 and 2003 was $600,000 and $1.2 million, respectively, principally representing interest collected from customers. This has decreased from the prior year as a result of decreased sales of certain programs on which the Company earned interest income.
Foreign exchange gains and losses consist of foreign currency transactional and functional currency re-measurements, offset by net foreign currency exchange contract losses. Net foreign exchange gains for the year ended June 30, 2004 were $395,000 and net foreign exchange losses for the year ended June 30, 2003 were $453,000. The change in foreign exchange gains and losses is a result of (1) the Company’s utilization of foreign exchange contracts to hedge foreign currency exposure beginning May 2003 in order to minimize foreign currency exchange gains and losses through effective hedging techniques; and (2) the unfavorable Euro vs. US Dollar currency exchange rate changes during fiscal year 2003. The Company’s foreign exchange policy prohibits entering into speculative transactions.
22
Other expense for the year ended June 30, 2004 consisted primarily of a loss on an equity investment of $209,000.
Provision For Income Taxes.
Income tax expense was $18.7 million and $16.1 million for the years ended June 30, 2004 and 2003, respectively, reflecting an effective income tax rate of 38.3% and 41.0%, respectively. The decrease in the tax rate is attributable to the effect of current year recognition of tax benefits related to foreign subsidiaries’ operating losses during the prior years and favorable earnings mix in lower rate jurisdictions.
Minority Interest in Income of Consolidated Subsidiaries.
The Company consolidates three subsidiaries that have a minority ownership interest. The Company has recorded $137,000 and $530,000, net of income tax, as of June 30, 2004 and 2003, respectively, of minority interest in Company’s majority owned subsidiaries’ net income. The decrease in minority interest income relates primarily to the purchase of the remaining 10% interest in ChannelMax effective July 1, 2003, and the increased ownership in Netpoint and OUI during fiscal year 2004.
Net Income.
The following table summarizes the Company’s net income:
| | | | | | | | | | | | | | | | | | |
| | | | | | | | | | | | Percentage of
Net Sales | |
| | | 2004
| | 2003
| | Difference
| | Change
| | | 2004
| | | 2003
| |
| | | (In thousands) | | | | | | | | | |
Fiscal year ended | | $ | 29,982 | | $ | 22,574 | | $ | 7,408 | | 32.8 | % | | 2.5 | % | | 2.3 | % |
The increases in the amount of net income and in net income as a percentage of net sales in 2004 and 2003 are attributable to the changes in operating profits and provision for income taxes discussed above.
Comparison of Fiscal Years Ended June 30, 2003 and 2002
Net Sales.
The following table summarizes the Company’s net sales results (net of inter-segment sales):
| | | | | | | | | | | | |
| | | 2003
| | 2002
| | Difference
| | Percentage
Change
| |
| | | (In thousands) | | | |
North American distribution | | $ | 922,641 | | $ | 821,303 | | $ | 101,338 | | 12.3 | % |
International distribution | | | 68,553 | | | 20,584 | | | 47,969 | | 233.0 | % |
| | |
|
| |
|
| |
|
| | | |
Net Sales | | $ | 991,194 | | $ | 841,887 | | $ | 149,307 | | 17.7 | % |
| | |
|
| |
|
| |
|
| | | |
SCANSOURCE 23
North American Distribution
North American distribution sales include sales to the United States and Canada (sales to Canada account for less than 3% of total sales) from the Company’s Memphis, Tennessee distribution center. The increase in North American distribution sales was driven by an increase in both the AIDC and POS product and converged communication product categories. The AIDC and POS product categories increased 18% as compared to the prior year. The increase in net sales was mainly driven by increase in volume in the North America markets. Sales of the converged communication product categories increased 22% as compared to the prior year. Management believes that the increase in net sales for the converged communication product categories was due to an increase in market share. Additional growth of net sales resulted from increased sales to existing customers through competitive product pricing and marketing efforts to reach specialty technology resellers. On July 1, 2003, the ChannelMax segment was consolidated into the North American distribution segment. All information presented for fiscal years 2003 and 2002 includes ChannelMax as part of the North American distribution segment. The increases discussed above were offset by the decreases in the ChannelMax business. First, in December 2001, ChannelMax renegotiated a customer’s contract, extended its term and lessened the amount of inventory and accounts receivable risk to the Company. As a result of those changes to the contract, revenue from the customer began to be recognized on a net fee basis, rather than a gross revenue basis, after December 2001. The second key factor in ChannelMax’s decreased sales was the slowed economy. Over the past year, some customers have experienced decreased sales and have maintained adequate internal capacity and, therefore, decreased their usage of ChannelMax’s services.
International Distribution
The international distribution segment commenced in November 2001 with the acquisition of Netpoint, a Miami-based distributor that exports primarily to Latin America. On January 1, 2003, ScanSource, Inc., of the North American distribution segment, sold its Mexico unit to Netpoint at book value, with no gain or loss being recorded. The Mexico unit continues to focus on sales of AIDC and POS technologies to the Mexican market.
In January 2002, the Company opened a headquarters and distribution center in Belgium, serving all of Europe. In May 2002, the Company acquired ABC, a United Kingdom-based distributor that primarily serves the United Kingdom. During the quarter ended March 31, 2003, the Company completed its consolidation of the UK distribution center into the Belgium facility. The Company also centralized its accounting, information technology and sales management in the Belgium headquarters location. Sales for the overall international segment increased 233% over the prior year. The increase was primarily due to the acquisition of ABC in May 2002 and increased market share in Europe and Latin America.
Gross Profit.
The following table summarizes the Company’s gross profit:
| | | | | | | | | | | | | | | | | | |
| | | | | | | | | | | | Percentage of
Net Sales | |
| | | 2003
| | 2002
| | Difference
| | Change
| | | 2003
| | | 2002
| |
| | | (In thousands) | | | | | | | | | |
North American distribution | | $ | 101,636 | | $ | 88,956 | | $ | 12,680 | | 14.3 | % | | 11.0 | % | | 10.8 | % |
International distribution | | | 10,247 | | | 2,621 | | | 7,626 | | 291.0 | % | | 14.9 | % | | 12.7 | % |
| | |
|
| |
|
| |
|
| | | | | | | | | |
Gross Profit | | $ | 111,883 | | $ | 91,577 | | $ | 20,306 | | 22.2 | % | | 11.3 | % | | 10.9 | % |
| | |
|
| |
|
| |
|
| | | | | | | | | |
24
North American Distribution
Gross profit as a percentage of net sales for the North American distribution segment increased during fiscal year 2003 as compared to fiscal year 2002. The increase was a result of the re-negotiation of a ChannelMax customer contract which changed revenue from a gross revenue basis to a net fee basis, as discussed above. This was partially offset by several large low-margin POS sales orders during the second quarter and a decrease in the usage of ChannelMax’s services.
International Distribution
Gross profit, which is typically greater than the North American distribution segment, as a percentage of sales increased over the prior year. The segment utilizes higher product selling prices when compared to the North American distribution segment in order to recover higher operating costs associated with serving its customers.
Operating Expenses.
The following table summarizes the Company’s operating expenses:
| | | | | | | | | | | | | | | | | | |
| | | | | | | | | | | | Percentage of
Net Sales | |
| | | 2003
| | 2002
| | Difference
| | Change
| | | 2003
| | | 2002
| |
| | | (In thousands) | | | | | | | | | |
Fiscal year ended | | $ | 71,359 | | $ | 59,767 | | $ | 11,592 | | 19.4 | % | | 7.2 | % | | 7.1 | % |
Operating expenses for the year ended June 30, 2003 increased as a result of a full year of operating expenses related to the international distribution segment of approximately $10.2 million, a discretionary profit sharing contribution of $2.5 million, a charitable contribution of $970,000, and an impairment charge on capitalized software of $191,000. In addition, a $670,000 reclassification adjustment was made related to the adoption of EITF Issue No. 02-16,Accounting by a Customer (Including a Reseller) for Certain Consideration Received from a Vendor. The adjustment reclassified $303,000 of excess vendor reimbursement as a reduction to cost of goods sold and $367,000 capitalized into inventory carrying costs, pending sales of the related products. These increases to operating expenses were partially offset by lower bad debt expense of $ 2.0 million.
Operating expenses for the year ended June 30, 2002 included approximately $1.2 million of additional direct expenses associated with the European operations, which commenced operations in January 2002. Also included was a $1.2 million higher-than-expected increase in bad debt expense due primarily to the provision for the estimated uncollectibility of approximately $1.2 million in a single account receivable, a discretionary profit sharing contribution to the 401(k) plan of $1.1 million, an impairment charge on capitalized software of $840,000, and $467,000 in tax consulting fees. During fiscal 2002, the Company also settled a claim with a former customer resulting in a $924,000 recovery of costs.
Operating Income.
The following table summarizes the Company’s operating income:
| | | | | | | | | | | | | | | | | | |
| | | | | | | | | | | | Percentage of
Net Sales | |
| | | 2003
| | 2002
| | Difference
| | Change
| | | 2003
| | | 2002
| |
| | | (In thousands) | | | | | | | | | |
Fiscal year ended | | $ | 40,524 | | $ | 31,810 | | $ | 8,714 | | 27.4 | % | | 4.1 | % | | 3.8 | % |
SCANSOURCE 25
Operating margins, as a percentage of net sales for the year ended June 30, 2003 were higher than the prior year due to the increase in gross profit, partially offset by the increase in operating expenses during the past year.
Total Other Expense (Income).
Other expense (income) consists primarily of interest expense, interest income and other expense (income). Interest expense for the years ended June 30, 2003 and 2002 was $2.1 million and $2.8 million, respectively, reflecting interest paid on borrowings on the Company’s line of credit and long-term debt. Interest expense for the year was lower due to the decline in interest rates over the past year. The reduction also resulted from lower average borrowings on the Company’s line of credit and long-term debt during the past year. Interest income for the years ended June 30, 2003 and 2002 was $1.2 million and $1.3 million, respectively, principally representing interest collected from customers.
Other expense for the year ended June 30, 2003 was $501,000. The Company realized a net foreign exchange loss of $453,000 consisting of foreign currency transactional and functional currency re-measurements and $112,000 worth of net foreign currency exchange contract losses. The fluctuation from prior year was attributable primarily to the Company’s growth in operations in the European market. The European loss can be attributed to the strengthening of the Euro, as many of our customer receivables in Europe are denominated in British Pounds. These receivables were transferred to the Company’s Euro functional Belgium facility in April 2003. The Company began utilizing foreign exchange contracts to hedge the British Pound exposure beginning May 2003. It continues to be the Company’s goal to minimize foreign currency exchange gains and losses through effective hedging techniques. The Company’s foreign exchange policy prohibits entering into speculative transactions. An additional loss of $136,000 on an equity investment was also included in other expense.
Other income for the year ended June 30, 2002 was $184,000, which includes a currency transaction gain from repatriating an advance made to the Company’s European subsidiary of $242,000 and an offsetting $105,000 loss on an equity investment.
Provision For Income Taxes.
Income tax expense was $16.1 million and $11.3 million for the years ended June 30, 2003 and 2002, respectively, reflecting an effective income tax rate of 41.0% and 37.0%, respectively. The increase in the tax rate is attributable to the effect of continued non-recognition of certain tax benefits related to the European’s units’ operating losses during the year. In addition, in fiscal 2002, the Company filed claims for various state incentive tax credits arising in the prior years and for other tax deductions.
Minority Interest in Income of Consolidated Subsidiaries.
The Company consolidates four subsidiaries that have a minority ownership interest. The Company has recorded $530,000 and $56,000, as of June 30, 2003 and 2002, respectively, of minority interest in Company’s majority owned subsidiaries’ net income. The increase in the minority interest income relates to the increased profitability of ChannelMax and Netpoint during fiscal year 2003.
26
Extraordinary Gain.
During the year ended June 30, 2002, the Company finalized its accounting for the May 2001 acquisition of Pinacor, a business converged communication product distributor. The Company collected $1.3 million in excess of the purchased accounts receivable than it had previously estimated to be collectible. As a result, the fair value of the assets acquired in the acquisition exceeded the purchase price by $1.3 million. In accordance with SFAS No. 141, this amount was recognized as an extraordinary gain, net of $508,000 in taxes, during the year ended June 30, 2002.
Net Income.
The following table summarizes the Company’s net income:
| | | | | | | | | | | | | | | | | | | | | | | | |
| | | | | | | | | | | | | | | | | | Percentage of
Net Sales | |
| | |
| |
| |
| | 2003
| | 2002
| | Difference
| | Change
| | | 2003
| | | 2002
| |
| | | | | | | | | (In thousands) | | | | | | | |
Fiscal year ended | | | | | | | | $ | 22,574 | | $ | 19,942 | | $ | 2,632 | | 13.2 | % | | 2.3 | % | | 2.4 | % |
The increase in the amount of net income and decline in net income as a percentage of net sales in 2003 are attributable to the changes in operating profits, recognition of the extraordinary gain in fiscal year 2002 and the provision for income taxes discussed above.
Quarterly Results
The following tables set forth certain unaudited quarterly financial data. The information has been derived from unaudited financial statements that, in the opinion of management, reflect all adjustments (consisting only of normal recurring adjustments) necessary for a fair presentation of such quarterly information. The operating results for any quarter are not necessarily indicative of the results to be expected for any future period.
| | | | | | | | | | | | | | | | | | | | | | | | |
| | | Three Months Ended
|
| | | Fiscal 2004
| | Fiscal 2003
|
| | | June 30
2004
| | Mar. 31
2004
| | Dec. 31
2003
| | Sept. 30
2003
| | June 30
2003
| | Mar. 31
2003
| | Dec. 31
2002
| | Sept. 30
2002
|
| | | (In thousands, except per share amounts) |
Net sales | | $ | 333,076 | | $ | 293,574 | | $ | 288,966 | | $ | 276,474 | | $ | 253,022 | | $ | 227,452 | | $ | 250,117 | | $ | 260,603 |
Cost of goods sold | | | 296,014 | | | 260,603 | | | 258,063 | | | 245,630 | | | 223,667 | | | 202,029 | | | 223,207 | | | 230,408 |
| | |
|
| |
|
| |
|
| |
|
| |
|
| |
|
| |
|
| |
|
|
Gross profit | | | 37,062 | | | 32,971 | | | 30,903 | | | 30,844 | | | 29,355 | | | 25,423 | | | 26,910 | | | 30,195 |
Net income | | | 9,014 | | | 8,221 | | | 6,667 | | | 6,080 | | | 6,212 | | | 4,549 | | | 5,822 | | | 5,991 |
| | |
|
| |
|
| |
|
| |
|
| |
|
| |
|
| |
|
| |
|
|
Weighted-average shares outstanding, basic | | | 12,561 | | | 12,603 | | | 12,508 | | | 12,265 | | | 12,273 | | | 12,171 | | | 11,947 | | | 11,698 |
| | |
|
| |
|
| |
|
| |
|
| |
|
| |
|
| |
|
| |
|
|
Weighted-average shares outstanding, assuming dilution | | | 12,997 | | | 13,095 | | | 12,942 | | | 12,681 | | | 12,496 | | | 12,500 | | | 12,646 | | | 12,408 |
| | |
|
| |
|
| |
|
| |
|
| |
|
| |
|
| |
|
| |
|
|
Net income per common share, basic | | $ | 0.72 | | $ | 0.65 | | $ | 0.53 | | $ | 0.50 | | $ | 0.51 | | $ | 0.37 | | $ | 0.49 | | $ | 0.51 |
| | |
|
| |
|
| |
|
| |
|
| |
|
| |
|
| |
|
| |
|
|
Net income per common share, assuming dilution | | $ | 0.69 | | $ | 0.63 | | $ | 0.52 | | $ | 0.48 | | $ | 0.49 | | $ | 0.36 | | $ | 0.46 | | $ | 0.48 |
| | |
|
| |
|
| |
|
| |
|
| |
|
| |
|
| |
|
| |
|
|
SCANSOURCE 27
Critical Accounting Policies and Estimates
Management’s discussion and analysis of its financial condition and results of operations are based upon the Company’s consolidated financial statements, which have been prepared in conformity with accounting principles generally accepted in the United States of America. The preparation of financial statements requires management to make estimates and assumptions that affect the reported amounts of assets and liabilities and disclosure of contingent assets and liabilities at the date of the financial statements and the reported amounts of revenues and expenses during the reporting period. On an ongoing basis management evaluates its estimates, including those related to the allowance for uncollectible accounts receivable, inventory reserves to reduce inventories to the lower of cost or market, vendor incentives, goodwill and intangible assets, deferred taxes and contingencies. Management bases its estimates on historical experience and on various other assumptions that management believes to be reasonable under the circumstances, the results of which form a basis for making judgments about the carrying value of assets and liabilities that are not readily available from other sources. Actual results may differ materially from these estimates under different assumptions or conditions, however, management believes that its estimates, including those for the above-described items are reasonable and that the actual results will not vary significantly from the estimated amounts. For further discussion of our significant accounting policies, refer to Note 2 of Notes to Consolidated Financial Statements.
Revenue Recognition
Revenue is recognized once four criteria are met: (1) the Company must have persuasive evidence that an arrangement exists; (2) delivery must occur, which happens at the point of shipment (this includes the transfer of both title and risk of loss, provided that no significant obligations remain); (3) the price must be fixed and determinable; and (4) collectibility must be reasonably assured. A provision for estimated losses on returns is recorded at the time of sale based on historical experience.
The Company has service revenue associated with configuration and marketing, which is recognized when work is complete, and all obligations are substantially met. Revenue from multiple element arrangements is allocated to the various elements based on the relative fair value of the elements, and each revenue cycle is considered a separate accounting unit with recognition of revenue based on the criteria met for the individual element of the multiple deliverables. The Company has arrangements in which it earns a service fee determined as a percentage of the value of products shipped on behalf of the manufacturer, who retains the risk of credit loss. In the event of termination of the arrangements, the Company has the right to return certain inventory to the manufacturer. Such service fees earned by the Company are included in net sales and were less than 1% of net sales for each of the three years ended June 30, 2004.
Allowances for Accounts Receivable
The Company maintains an allowance for uncollectible accounts receivable for estimated losses resulting from customers’ failures to make payments on accounts receivable due to the Company. Management determines the estimate of the allowance for uncollectible accounts receivable considering a number of factors, including: (1) historical experience, (2) aging of the accounts receivable and (3) specific information obtained by the Company on the financial condition and the current credit worthiness of its customers. If the
28
financial condition of the Company’s customers were to deteriorate and reduce the ability of the Company’s customers to make payments on their accounts, the Company may be required to increase its allowance by recording additional bad debt expense. Likewise, should the financial condition of the Company’s customers improve and result in payments or settlements of previously reserved amounts, the Company may be required to record a reduction in bad debt expense to reverse the recorded allowance. In addition, the Company maintains an allowance for credits issued to customers to be used against future purchases.
Inventory Reserves
Management determines the inventory reserves required to reduce inventories to the lower of cost or market based principally on the effects of technological changes, quantities of goods on hand, and other factors. An estimate is made of the market value, less cost to dispose, of products whose value is determined to be impaired. If these products are ultimately sold at less than estimated amounts, additional reserves may be required. Likewise, if these products are sold for more than the estimated amounts, reserves may be reduced.
Vendor Consideration
The Company receives incentives from vendors related to cooperative advertising allowances, volume rebates and other incentive agreements. These incentives are generally under quarterly, semi-annual or annual agreements with the vendors. Some of these incentives are negotiated on an ad hoc basis to support specific programs mutually developed between the Company and the vendor. Vendors generally require that we use their cooperative advertising allowances exclusively for advertising or other marketing programs. These restricted cooperative advertising allowances are recognized as a reduction of operating expenses as the related marketing expenses are incurred. EITF Issue No. 02-16, “Accounting by a Customer (Including a Reseller) for Certain Consideration Received from a Vendor” requires reclassification of a portion of certain funds received from vendors from operating expenses to gross profit.
The Company records unrestricted, volume rebates received as a reduction of inventory and recognizes the incentives as a reduction of cost of products sold when the related inventory is sold. Amounts received or receivable from vendors that are not yet earned are deferred in the consolidated balance sheet. In addition, the Company may receive early payment discounts from certain vendors. The Company records early payment discounts received as a reduction of inventory and recognizes the discount as a reduction of cost of products sold when the related inventory is sold. This pronouncement requires management to make certain estimates of the amounts of vendor incentives that will be received. Actual recognition of the vendor consideration may vary from management estimates based on actual results. For further details, see Note 2 of Notes to Consolidated Financial Statements.
Goodwill and Intangible Assets
The carrying value of goodwill is reviewed annually for impairment. Goodwill may also be reviewed more frequently if current events and circumstances indicate a possible impairment. An impairment loss is charged to expense in the period identified. As required by SFAS No. 142, the Company performed an annual test of goodwill to determine if there was impairment. This testing included the determination of each reporting unit’s
SCANSOURCE 29
fair value using market multiples and discounted cash flows modeling. These tests require management to use estimates and assumptions that may vary from actual results.
The Company reviews the carrying value of its intangible assets with finite lives, which includes customer lists and non-compete agreements, as current events and circumstances warrant determination of whether there are any impairment losses. If indicators of impairment are present in intangible assets used in operations and future cash flows are not expected to be sufficient to recover the assets’ carrying amount, an impairment loss is charged to expense in the period identified.
In fiscal year 2004, the Company recognized an impairment charge of $172,000 in operating expenses for the impairment of unamortized goodwill relating to the restructuring of the ChannelMax reporting segment into the North American distribution segment.
Long-Lived Assets
Property and equipment are recorded at cost. Depreciation is computed using the straight-line method over estimated useful lives of 2 to 5 years for furniture and equipment, 3 to 5 years for computer software, 40 years for the building and 15 years for building improvements. Leasehold improvements are amortized over the shorter of the lease term or the estimated useful life. Maintenance, repairs and minor renewals are charged to expense as incurred. Additions, major renewals and betterments to property and equipment are capitalized.
For long-lived assets other than goodwill, if the sum of the expected cash flows, undiscounted and without interest, is less than the carrying amount of the asset, an impairment loss is recognized as the amount by which the carrying amount of the asset exceeds its fair value.
The Company reviews its long-lived assets for impairment whenever events or circumstances indicate that the carrying amount of an asset may not be recoverable or may be impaired. In fiscal year 2004, 2003 and 2002 the Company recognized a charge of approximately $892,000, $191,000 and $840,000, respectively, in operating expenses for the impairment of certain capitalized software. This software was no longer functional based on current operational needs.
Deferred Taxes
The Company records valuation allowances to reduce its deferred tax assets to the amount expected to be realized. In assessing the adequacy of recorded valuation allowances, the Company considers a variety of factors including, the scheduled reversal of deferred tax liabilities, future taxable income, and prudent and feasible tax planning strategies. In the event the Company determines it would be able to use a deferred tax asset in the future in excess of its net carrying value, an adjustment to the deferred tax asset would reduce income tax expense, thereby increasing net income in the period such determination was made. Likewise, should the Company determine that it was unable to use all or part of its net deferred tax asset in the future, an adjustment to the deferred tax asset would be charged to income tax expense, thereby reducing net income in the period such determination was made.
30
Contingencies
The Company accrues for contingent obligations, including estimated legal costs, when it is probable that a liability is incurred and the amount is reasonably estimable. As facts concerning contingencies become known, management reassesses its position and makes appropriate adjustments to the financial statements. Estimates that are particularly sensitive to future changes include tax, legal, and other regulatory matters, which are subject to change as events evolve and as additional information becomes available during the administrative and litigation process.
The Company received an assessment for a sales and use tax matter for the three calendar years ended 2001. Based on this assessment, the Company has determined a probable range for the disposition of that assessment and for subsequent periods through March 2004. Although the Company is disputing the assessment, it has accrued $1.4 million during the year ended June 30, 2004. Although there can be no assurance of the ultimate outcome at this time, the Company intends to vigorously defend its position.
Liquidity and Capital Resources
The Company’s primary sources of liquidity are cash flow from operations, borrowings under the revolving credit facility, and, to a lesser extent, borrowings under the subsidiary’s line of credit, and proceeds from the exercise of stock options.
The Company’s cash balance totaled $1.0 million at June 30, 2004 compared to $2.6 million at June 30, 2003. Domestic cash is generally swept on a nightly basis to pay down the line of credit. The Company’s working capital increased from $116.9 million at June 30, 2003 to $188.1 million at June 30, 2004. The increase in working capital resulted primarily from a $46.3 million increase in accounts receivable, a $30.6 million increase in inventory, and a $18.1 million decrease in working capital on the Company’s June 30, 2003 balance sheet resulting from the reclassification from long-term to current for the Company’s primary credit line in 2003 (see Note 4 of Notes to Consolidated Financial Statements), offset by a $15.7 million increase in accounts payable. The balance sheet reclassification had no impact on the Company’s previously reported net income, liquidity or debt covenants.
The increase in the amount of accounts receivable is attributable to an increase in sales during the year. The number of days sales outstanding (DSO) in ending trade receivables remained comparable at June 30, 2004 and 2003, at 47 and 46 days, respectively. The increase in inventory was attributable to opportunistic purchases at the end of the year. Inventory turnover improved to 6.5 times in fiscal 2004 from 5.9 times in fiscal 2003. The increase in accounts payable is attributable to the purchase of inventory during the past year.
Cash used in operating activities was $16.4 million for the year ended June 30, 2004 compared to cash provided by operating activities of $31.5 million for the year ended June 30, 2003. The decrease in cash provided by operating activities was primarily attributable to the changes in current assets and liability accounts discussed in the above working capital analysis.
SCANSOURCE 31
Cash used in investing activities for the year ended June 30, 2004 was $3.0 million. Capital expenditures for the year totaled $2.5 million and consisted of software purchases, furniture, equipment, and building improvements. In addition, $540,000 of cash was used to purchase additional ownership interest in two of the company’s majority-owned subsidiaries (ChannelMax and Netpoint).
Cash used in investing activities for the year ended June 30, 2003 was $6.9 million. The main use was capital expenditures of $6.3 million for the year. The capital expenditures resulted from purchases of software as well as furniture and equipment. In addition, $561,000 of cash was used to purchase additional ownership interest in one of the company’s majority-owned subsidiaries (Netpoint).
The Company had a revolving credit facility with its bank group at June 30, 2004 with a borrowing limit of the lesser of (i) $80 million or (ii) the sum of 85% of eligible accounts receivable plus the lesser of (a) 50% of eligible inventory or (b) $40 million. The facility bore interest at the 30-day LIBOR rate of interest plus a rate varying from 1.00% to 2.50% tied to the Company’s funded debt to EBITDA ratio ranging from 2.50:1 to 4.25:1 and a fixed charge coverage ratio of not less than 2.75:1. The effective interest rate at June 30, 2004 was 2.13% and the outstanding balance was $32.6 million on a calculated borrowing base of $80 million, leaving $47.4 million available for additional borrowings. The effective interest rate at June 30, 2003 was 2.57% and the outstanding balance was $18.1 million on a calculated borrowing base of $80 million, leaving $61.9 million available for additional borrowings. The revolving credit facility was collateralized by accounts receivable and eligible inventory. The credit agreement contained various restrictive covenants, including among other things, minimum net worth requirements, capital expenditure limits, maximum funded debt to EBITDA ratio and a fixed charge coverage ratio. The Company was in compliance with its covenants at June 30, 2004.
Netpoint, doing business as ScanSource Latin America, had an asset-based line of credit agreement with a bank at June 30, 2004 that was due on demand. The borrowing limit on the line was the lesser of $600,000 or the sum of 75% of domestic accounts receivable and 50% of foreign accounts receivable, plus 10% of eligible inventory (up to $250,000). As of the August 30, 2003 renewal date, the facility bore interest at the bank’s prime rate minus one percent, which was 3.00% at June 30, 2004. Prior to the renewal, the facility bore interest at the bank’s prime rate plus one percent, which was 5.00% at June 30, 2003. All of Netpoint’s assets collateralized the line of credit. The Company had guaranteed 68% of the balance on the line, while the remaining 32% of the balance was guaranteed by Netpoint’s minority shareholder. At June 30, 2004 and 2003, there were no outstanding borrowings on the line of credit, however, outstanding standby letters of credit totaled $40,000 leaving $560,000 available for additional borrowings.
The Company entered into new credit facilities during the first quarter of fiscal year 2005 (see Note 15 to Notes of Consolidated Financial Statements).
Cash provided by financing activities for the year ended June 30, 2004 totaled $17.9 million, including cash provided by borrowings under the Company’s credit facility. Cash used in financing activities for the year ended June 30, 2003 totaled $23.0 million, including cash repaid under the Company’s credit facility.
32
Principal maturities of long-term debt and amounts due under minimum capital and operating lease payments at June 30, 2004 are as follows:
| | | | | | | | | | | | |
| | | Payments Due by Period
|
| | | Total
| | Less than 1 Year
| | 1-3 Years
| | 3-5 Years
|
Long-term debt obligations | | $ | 7,351,000 | | $ | 767,000 | | $ | 6,584,000 | | $ | — |
Capital lease obligations | | | 87,000 | | | 87,000 | | | — | | | — |
Operating lease obligations | | | 2,296,000 | | | 753,000 | | | 973,000 | | | 570,000 |
Purchase obligations | | | 515,000 | | | 515,000 | | | — | | | — |
Other long-term obligations | | | — | | | — | | | — | | | — |
| | |
|
| |
|
| |
|
| |
|
|
Total obligations | | $ | 10,249,000 | | $ | 2,122,000 | | $ | 7,557,000 | | $ | 570,000 |
| | |
|
| |
|
| |
|
| |
|
|
At June 30, 2003, the Company owned a 25% equity interest in a limited liability company for which it had guaranteed debt up to $446,000. At June 30, 2004, the Company had satisfied all obligations related to the debt.
The Company anticipates capital expenditures of $515,000 in the first half of fiscal year 2005 for the replacement of the corporate office-building roof and the purchase of financial software for Europe. Contractual obligations to purchase software amounted to approximately $175,000 at June 30, 2003.
The Company believes that it has sufficient liquidity to meet its forecasted cash requirements for at least the next year.
Backlog
The Company does not consider backlogs to be material to its business. Nearly all orders are filled within 24 hours of receipt.
Accounting Standards Recently Issued
In November 2002, the Financial Accounting Standards Board (“FASB”) issued FASB Interpretation (“FIN”) No. 45,Guarantor’s Accounting and Disclosure Requirements for Guarantees, Including Indirect Guarantees of Indebtedness of Others (an interpretation of FASB Statements of Financial Accounting Standards No. 5, 57, and 107 and rescission of FASB Interpretation No. 34). FIN No. 45 clarifies the requirements of SFAS No. 5,Accounting for Contingencies, relating to a guarantor’s accounting for, and disclosure of, the issuance of certain types of guarantees. The initial recognition and initial measurement provisions of FIN No. 45 are applicable to guarantees issued or modified after December 31, 2002 and the disclosure requirements are applicable to financial statements for periods ending after December 15, 2002. The adoption of FIN No. 45 had no effect on the Company’s financial position or results of operations.
In December 2002, the FASB issued SFAS No. 148,Accounting for Stock-Based Compensation – Transition and Disclosure. This statement amends the transition requirements of SFAS No. 123,Accounting for Stock-Based Compensation,to provide alternative, voluntary methods of transition to the fair value method of accounting
SCANSOURCE 33
for stock-based employee compensation. It also amends the disclosure provisions of SFAS No. 123 to require disclosure in the summary of significant accounting policies of the effects of an entity’s accounting policy with respect to stock-based employee compensation on reported net income and earnings per share in annual and interim financial statements. The disclosure provision is required for all companies with stock-based employee compensation, regardless of whether the Company utilizes the fair value method of accounting described in SFAS No. 123 or the intrinsic value method described in APB Opinion No. 25,Accounting for Stock Issued to Employees. The amendments to the transition and annual disclosure provisions of SFAS No. 123 were effective for the Company’s fiscal year ended June 30, 2003. The Company continues to account for stock-based employee compensation under the intrinsic value method described by APB Opinion No. 25. The adoption of SFAS No. 148 had no effect on the Company’s financial position or results of operations.
In December 2002, the FASB’s EITF issued Issue No. 02-16. This issue addresses the appropriate accounting, by a distributor, for cash consideration received from a vendor and became effective for the Company on January 1, 2003. The adoption of EITF No. 02-16 requires that cash consideration received from a vendor should be recorded as a direct reduction to cost of goods sold, unless certain criteria are met. If these criteria are met, then the cash consideration should be a reduction of the operating expense for which it is being reimbursed. The guidance is applicable to all of the Company’s vendor arrangements entered into after December 31, 2002.
In January 2003, the FASB issued Interpretation No. 46 (“FIN 46”),Consolidation of Variable Interest Entities.FIN 46 clarifies the application of Accounting Research Bulletin No. 51,Consolidated Financial Statements, to certain entities in which equity investors do not have the characteristics of a controlling financial interest or do not have sufficient equity at risk for the entity to finance its activities without additional subordinated financial support from other parties. FIN 46 applies immediately to variable interest entities (“VIEs”) created after January 31, 2003, and to VIEs in which an enterprise obtains an interest after that date. In December 2003, the FASB published a revision to FIN 46 to clarify some of the provisions and to exempt certain entities from its requirements. Under the new guidance, special effective date provisions apply to enterprises that have fully or partially applied FIN 46 prior to issuance of the revised interpretation. Otherwise, application of Interpretation 46R (“FIN 46R”) is required in financial statements of public entities that have interests in structures that are commonly referred to as special-purpose entities (“SPEs”) for periods ending after December 15, 2003. Application by public entities, other than small business issuers, for all other types of VIEs other than SPEs is required in financial statements for periods ending after March 15, 2004. The Company has completed its evaluation of all potential VIEs relationships existing prior to February 1, 2003. The Company did not create or obtain any interest in a variable interest entity during the period February 1, 2003 through June 30, 2004. However, changes in the Company’s business relationships with various entities could occur which may impact its financial statements under the requirements of FIN 46R. The Company has concluded that these relationships do not meet the requirements under the provision and therefore, there is no effect of these relationships on the Company’s consolidated financial position or results of operations.
In April 2003, the FASB issued SFAS No. 149,Amendment of Statement 133 on Derivative Instruments and Hedging Activities. SFAS No. 149 amends and clarifies financial accounting and reporting for derivative
34
instruments, including certain derivative instruments embedded in other contracts. SFAS No. 149 is effective for contracts entered into or modified after June 30, 2003 and for hedging relationships designated after June 30, 2003. The adoption of SFAS No. 149 had no effect on the Company’s financial position or results of operations.
In May 2003, the FASB issued SFAS No. 150,Accounting for Certain Financial Instruments with Characteristics of both Liabilities and Equity. SFAS No. 150 requires that certain financial instruments, which under previous guidance were accounted for as equity, must now be accounted for as liabilities. The financial instruments affected include mandatorily redeemable stock, certain financial instruments that require or may require the issuer to buy back some of its shares in exchange for cash or other assets and certain obligations that can be settled with shares of stock. SFAS No. 150 is effective for all financial instruments entered into or modified after May 31, 2003 and must be applied to the Company’s existing financial instruments effective July 1, 2003, the beginning of the first fiscal period after June 15, 2003. The Company adopted SFAS No. 150 on July 1, 2003. The adoption of this statement had no effect on the Company’s financial position or results of operations.
Impact of Inflation
The Company has not been adversely affected by inflation as technological advances and competition within specialty technology markets has generally caused prices of the products sold by the Company to decline. Management believes that any price increases could be passed on to its customers, as prices charged by the Company are not set by long-term contracts.
SCANSOURCE 35
QUANTITATIVE AND QUALITATIVE DISCLOSURES ABOUT MARKET RISKS
The Company’s principal exposure to changes in financial market conditions in the normal course of its business is a result of its selective use of bank debt and transacting business in foreign currencies in connection with its foreign operations. The Company has chosen to present this information below in a sensitivity analysis format.
The Company is exposed to changes in interest rates primarily as a result of its borrowing activities, which include revolving credit facilities with a group of banks used to maintain liquidity and fund the Company’s business operations. The nature and amount of the Company’s debt may vary as a result of future business requirements, market conditions and other factors. The definitive extent of the Company’s interest rate risk is not quantifiable or predictable because of the variability of future interest rates and business financing requirements, but the Company does not believe such risk is material. A hypothetical 100 basis point increase or decrease in interest rates on borrowings on the Company’s revolving line of credit, variable rate long term debt and subsidiary line of credit for the years ended June 30, 2004 and 2003 would have resulted in an approximately $415,000 and $470,000 decrease or increase, respectively, in pre-tax income. The Company does not currently use derivative instruments or take other actions to adjust the Company’s interest rate risk profile.
The Company is exposed to foreign currency risks that arise from its foreign operations in Canada, Mexico and Europe. These risks include the translation of local currency balances of foreign subsidiaries, inter-company loans with foreign subsidiaries and transactions denominated in non-functional currencies. Foreign exchange risk is managed by using foreign currency forward and option contracts to hedge these exposures. The Company’s Board of Directors has approved a foreign exchange hedging policy to minimize foreign currency exposure. The Company’s policy is to utilize financial instruments to reduce risks where internal netting cannot be effectively employed and not to enter into foreign currency derivative instruments for speculative or trading purposes. The Company monitors its risk associated with the volatility of certain foreign currencies against its functional currencies and enters into foreign exchange derivative contracts to minimize short-term currency risks on cash flows. The Company continually evaluates foreign exchange risk and may enter into foreign exchange transactions in accordance with its policy. Foreign currency gains and losses are included in other expense (income).
The Company has elected not to designate its foreign currency contracts as hedging instruments, and therefore, the instruments are marked to market with changes in their values recorded in the Consolidated Income Statement each period. The underlying exposures are denominated primarily in British Pounds, Euros, and Canadian Dollars. At June 30, 2004, the Company had one currency forward contract outstanding with a net liability under this contract of $21,000.
The Company does not utilize financial instruments for trading or other speculative purposes, nor does it utilize leveraged financial instruments. On the basis of the fair value of the Company’s market sensitive instruments at June 30, 2004, the Company does not consider the potential near-term losses in future earnings, fair values and cash flows from reasonably possible near-term changes in interest rates and exchange rates to be material.
36
REPORT OF INDEPENDENT REGISTERED PUBLIC ACCOUNTING FIRM
Stockholders and Board of Directors
ScanSource, Inc.
We have audited the accompanying consolidated balance sheets of ScanSource, Inc. and subsidiaries as of June 30, 2004 and 2003, and the related consolidated statements of income, shareholders’ equity, and cash flows for each of the two years in the period ended June 30, 2004. These financial statements are the responsibility of the Company’s management. Our responsibility is to express an opinion on these financial statements based on our audits.
We conducted our audits in accordance with the standards of the Public Company Accounting Oversight Board (United States). Those standards require that we plan and perform the audit to obtain reasonable assurance about whether the financial statements are free of material misstatement. An audit includes examining, on a test basis, evidence supporting the amounts and disclosures in the financial statements. An audit also includes assessing the accounting principles used and significant estimates made by management, as well as evaluating the overall financial statement presentation. We believe that our audits provide a reasonable basis for our opinion.
In our opinion, the financial statements referred to above present fairly, in all material respects, the consolidated financial position of ScanSource, Inc. and subsidiaries at June 30, 2004 and 2003, and the consolidated results of their operations and their cash flows for each of the two years in the period ended June 30, 2004, in conformity with United States generally accepted accounting principles.
As discussed in Note 4, the Company has restated the June 30, 2003 balance sheet to reclassify its borrowings outstanding under its Revolving Credit Facility from long-term to current liabilities.

Greenville, South Carolina
August 24, 2004
SCANSOURCE 37
REPORT OF INDEPENDENT REGISTERED PUBLIC ACCOUNTING FIRM
The Board of Directors
ScanSource, Inc:
We have audited the accompanying consolidated statements of income, shareholders’ equity and cash flows of ScanSource, Inc. and subsidiaries (the “Company”) for the year ended June 30, 2002. These financial statements are the responsibility of the Company’s management. Our responsibility is to express an opinion on these financial statements based on our audits.
We conducted our audit in accordance with standards of the Public Company Accounting Oversight Board (United States). Those standards require that we plan and perform the audit to obtain reasonable assurance about whether the financial statements are free of material misstatement. An audit includes examining, on a test basis, evidence supporting the amounts and disclosures in the financial statements. An audit also includes assessing the accounting principles used and significant estimates made by management, as well as evaluating the overall financial statement presentation. We believe that our audit provides a reasonable basis for our opinion.
In our opinion, the consolidated financial statements referred to above present fairly, in all material respects, the results of operations and cash flows of ScanSource, Inc. and subsidiaries for the year ended June 30, 2002, in conformity with accounting principles generally accepted in the United States of America.

Greenville, South Carolina
August 14, 2002
38
MANAGEMENT’S STATEMENT OF RESPONSIBILITY
The management of ScanSource is responsible for the information contained in the consolidated financial statements and other parts of this report. The accompanying consolidated financial statements of ScanSource, Inc. and subsidiaries have been prepared in accordance with accounting principles generally accepted in the United States of America. In preparing these statements, management has made judgments based upon available information. To ensure that this information will be as accurate and factual as possible, management has communicated to all appropriate employees the requirements for accurate recordkeeping and accounting.
The Company maintains a system of internal accounting controls designed to provide reasonable assurances for the safeguarding of assets and the reliability of financial records. The system is subject to continuous review with appropriate management follow-up action. Management believes that through the careful selection of employees, the division of responsibilities and the application of formal policies and procedures, the Company has an effective and responsible system of internal accounting controls.
The Company’s independent auditors are responsible for conducting an audit of the Company’s consolidated financial statements in accordance with auditing standards generally accepted in the United States of America and for expressing their opinion as to whether these consolidated financial statements present fairly, in all material respects, the financial position, results of operations and cash flows of the Company and its subsidiaries in conformity with accounting principles generally accepted in the United States of America. There is an Audit Committee of the Board of Directors composed of three nonemployee directors who meet regularly with management and the independent auditors to discuss specific accounting, reporting and internal control matters. The independent auditors have full and free access to the Audit Committee.
SCANSOURCE 39
SCANSOURCE, INC. AND SUBSIDIARIES
CONDENSED CONSOLIDATED BALANCE SHEETS
June 30, 2004 and 2003
(In thousands)
| | | | | | | | |
| | | 2004
| | | 2003
| |
| | | | | | (Restated) | |
| Assets | | | | | | | | |
Current assets: | | | | | | | | |
Cash | | $ | 1,047 | | | $ | 2,565 | |
Trade and notes receivable: | | | | | | | | |
Trade, less allowance of $9,725 and $9,419 at June 30, 2004 and 2003, respectively | | | 175,417 | | | | 129,105 | |
Other | | | 3,919 | | | | 4,420 | |
| | |
|
|
| |
|
|
|
| | | | 179,336 | | | | 133,525 | |
Inventories | | | 182,868 | | | | 152,261 | |
Prepaid expenses and other assets | | | 1,670 | | | | 1,739 | |
Deferred income taxes | | | 8,440 | | | | 9,498 | |
| | |
|
|
| |
|
|
|
Total current assets | | | 373,361 | | | | 299,588 | |
| | |
|
|
| |
|
|
|
Property and equipment, net: | | | | | | | | |
Land | | | 1,485 | | | | 1,485 | |
Building and improvements | | | 14,603 | | | | 14,741 | |
Software under development | | | 632 | | | | 3,055 | |
Computer software | | | 10,233 | | | | 7,700 | |
Furniture, fixtures and equipment | | | 19,722 | | | | 18,710 | |
| | |
|
|
| |
|
|
|
| | | | 46,675 | | | | 45,691 | |
Less accumulated depreciation | | | (23,012 | ) | | | (18,421 | ) |
| | |
|
|
| |
|
|
|
| | | | 23,663 | | | | 27,270 | |
| | |
Goodwill | | | 9,978 | | | | 9,841 | |
Other assets, including identifiable intangible assets | | | 6,190 | | | | 7,648 | |
| | |
|
|
| |
|
|
|
Total assets | | $ | 413,192 | | | $ | 344,347 | |
| | |
|
|
| |
|
|
|
| Liabilities and Shareholders’ Equity | | | | | | | | |
Current liabilities: | | | | | | | | |
Current portion of long-term debt | | $ | 854 | | | $ | 914 | |
Borrowings under revolving credit facility (See Note 4) | | | — | | | | 18,118 | |
Trade accounts payable | | | 167,053 | | | | 151,389 | |
Accrued expenses and other liabilities | | | 14,803 | | | | 12,246 | |
Income taxes payable | | | 2,555 | | | | 62 | |
| | |
|
|
| |
|
|
|
Total current liabilities | | | 185,265 | | | | 182,729 | |
| | |
|
|
| |
|
|
|
Deferred income taxes | | | 1,058 | | | | 1,673 | |
Long-term debt | | | 6,584 | | | | 7,385 | |
Borrowings under revolving credit facility (See Note 4) | | | 32,569 | | | | — | |
| | |
|
|
| |
|
|
|
Total liabilities | | | 225,476 | | | | 191,787 | |
| | |
|
|
| |
|
|
|
Minority interest | | | 1,072 | | | | 1,673 | |
| | |
Commitments and contingencies | | | | | | | | |
Shareholders’ equity: | | | | | | | | |
Preferred stock, no par value; 3,000,000 shares authorized, none issued | | | — | | | | — | |
Common stock, no par value; 25,000,000 shares authorized; 12,559,689 and 12,243,230 shares issued and outstanding at June 30, 2004 and 2003, respectively | | | 61,856 | | | | 56,706 | |
Retained earnings | | | 121,288 | | | | 91,306 | |
Accumulated other comprehensive income | | | 3,500 | | | | 2,875 | |
| | |
|
|
| |
|
|
|
Total shareholders’ equity | | | 186,644 | | | | 150,887 | |
| | |
|
|
| |
|
|
|
Total liabilities and shareholders’ equity | | $ | 413,192 | | | $ | 344,347 | |
| | |
|
|
| |
|
|
|
See accompanying Notes to Consolidated Financial Statements.
40
SCANSOURCE, INC. AND SUBSIDIARIES
CONDENSED CONSOLIDATED INCOME STATEMENTS
June 30, 2004, 2003 and 2002
(In thousands except per share data)
| | | | | | | | | | | | |
| | | 2004
| | | 2003
| | | 2002
| |
Net sales | | $ | 1,192,090 | | | $ | 991,194 | | | $ | 841,887 | |
Cost of goods sold | | | 1,060,310 | | | | 879,311 | | | | 750,310 | |
| | |
|
|
| |
|
|
| |
|
|
|
Gross profit | | | 131,780 | | | | 111,883 | | | | 91,577 | |
| | |
|
|
| |
|
|
| |
|
|
|
Operating expenses: | | | | | | | | | | | | |
Selling, general and administrative expenses | | | 82,524 | | | | 71,359 | | | | 59,767 | |
| | |
|
|
| |
|
|
| |
|
|
|
Operating income | | | 49,256 | | | | 40,524 | | | | 31,810 | |
Other expense (income): | | | | | | | | | | | | |
Interest expense | | | 1,159 | | | | 2,063 | | | | 2,831 | |
Interest income | | | (558 | ) | | | (1,194 | ) | | | (1,274 | ) |
Other, net | | | (164 | ) | | | 501 | | | | (184 | ) |
| | |
|
|
| |
|
|
| |
|
|
|
Total other expense | | | 437 | | | | 1,370 | | | | 1,373 | |
| | |
|
|
| |
|
|
| |
|
|
|
Income before income taxes, minority interest and extraordinary gain | | | 48,819 | | | | 39,154 | | | | 30,437 | |
Provision for income taxes | | | 18,700 | | | | 16,050 | | | | 11,268 | |
Minority interest in income of consolidated subsidiaries, net of income taxes of $75, $236 and $34, respectively | | | 137 | | | | 530 | | | | 56 | |
| | |
|
|
| |
|
|
| |
|
|
|
Income before extraordinary gain | | | 29,982 | | | | 22,574 | | | | 19,113 | |
Extraordinary gain on excess of fair value of net assets acquired over cost, net of income taxes of $508 | | | — | | | | — | | | | 829 | |
| | |
|
|
| |
|
|
| |
|
|
|
Net income | | $ | 29,982 | | | $ | 22,574 | | | $ | 19,942 | |
| | |
|
|
| |
|
|
| |
|
|
|
Per share data: | | | | | | | | | | | | |
Net income per common share, basic: | | | | | | | | | | | | |
Income before extraordinary gain | | $ | 2.40 | | | $ | 1.88 | | | $ | 1.66 | |
Extraordinary gain on excess of fair value of net assets acquired over cost | | | — | | | | — | | | | 0.07 | |
| | |
|
|
| |
|
|
| |
|
|
|
Net income | | $ | 2.40 | | | $ | 1.88 | | | $ | 1.73 | |
| | |
|
|
| |
|
|
| |
|
|
|
Weighted-average shares outstanding, basic | | | 12,485 | | | | 12,013 | | | | 11,524 | |
| | |
|
|
| |
|
|
| |
|
|
|
Net income per common share, assuming dilution: | | | | | | | | | | | | |
Income before extraordinary gain | | $ | 2.31 | | | $ | 1.81 | | | $ | 1.54 | |
Extraordinary gain on excess of fair value of net assets acquired over cost | | | — | | | | — | | | | 0.06 | |
| | |
|
|
| |
|
|
| |
|
|
|
Net income | | $ | 2.31 | | | $ | 1.81 | | | $ | 1.60 | |
| | |
|
|
| |
|
|
| |
|
|
|
Weighted-average shares outstanding, assuming dilution | | | 12,952 | | | | 12,349 | | | | 12,432 | |
| | |
|
|
| |
|
|
| |
|
|
|
See accompanying Notes to Consolidated Financial Statements.
SCANSOURCE 41
SCANSOURCE, INC. AND SUBSIDIARIES
CONDENSED CONSOLIDATED STATEMENTS OF SHAREHOLDERS’ EQUITY
Years ended June 30, 2004, 2003 and 2002
(In thousands, except share data)
| | | | | | | | | | | | | | | | |
| | | Common
Stock
(Shares)
| | Common
Stock
(Amount)
| | | Retained
Earnings
| | Accumulated
Other
Comprehensive
Income
| | Total
| |
Balance at June 30, 2001 | | 11,422,828 | | $ | 44,572 | | | $ | 48,790 | | $ | — | | $ | 93,362 | |
Comprehensive income: | | | | | | | | | | | | | | | | |
Net income | | — | | | — | | | | 19,942 | | | — | | | 19,942 | |
Foreign currency translation adjustment | | — | | | — | | | | — | | | 1,094 | | | 1,094 | |
| | | | | | | | | | | | | | |
|
|
|
Total comprehensive income | | | | | | | | | | | | | | | 21,036 | |
| | | | | | | | | | | | | | |
|
|
|
Exercise of stock options | | 238,656 | | | 2,265 | | | | — | | | — | | | 2,265 | |
Increase in minority ownership through the conversion of convertible stock into common stock of the subsidiary | | — | | | (147 | ) | | | — | | | — | | | (147 | ) |
Tax benefit of deductible compensation arising from exercise of stock options | | — | | | 1,533 | | | | — | | | — | | | 1,533 | |
| | |
| |
|
|
| |
|
| |
|
| |
|
|
|
Balance at June 30, 2002 | | 11,661,484 | | | 48,223 | | | | 68,732 | | | 1,094 | | | 118,049 | |
Comprehensive income: | | | | | | | | | | | | | | | | |
Net income | | — | | | — | | | | 22,574 | | | — | | | 22,574 | |
Foreign currency translation adjustment | | — | | | — | | | | — | | | 1,781 | | | 1,781 | |
| | | | | | | | | | | | | | |
|
|
|
Total comprehensive income | | | | | | | | | | | | | | | 24,355 | |
| | | | | | | | | | | | | | |
|
|
|
Exercise of stock options | | 581,746 | | | 4,992 | | | | — | | | — | | | 4,992 | |
Tax benefit of deductible compensation arising from exercise of stock options | | — | | | 3,491 | | | | — | | | — | | | 3,491 | |
| | |
| |
|
|
| |
|
| |
|
| |
|
|
|
Balance at June 30, 2003 | | 12,243,230 | | | 56,706 | | | | 91,306 | | | 2,875 | | | 150,887 | |
Comprehensive income: | | | | | | | | | | | | | | | | |
Net income | | — | | | — | | | | 29,982 | | | — | | | 29,982 | |
Foreign currency translation adjustment | | — | | | — | | | | — | | | 625 | | | 625 | |
| | | | | | | | | | | | | | |
|
|
|
Total comprehensive income | | | | | | | | | | | | | | | 30,607 | |
| | | | | | | | | | | | | | |
|
|
|
Exercise of stock options | | 316,459 | | | 4,268 | | | | — | | | — | | | 4,268 | |
Tax benefit of deductible compensation arising from exercise of stock options | | — | | | 882 | | | | — | | | — | | | 882 | |
| | |
| |
|
|
| |
|
| |
|
| |
|
|
|
Balance at June 30, 2004 | | 12,559,689 | | $ | 61,856 | | | $ | 121,288 | | $ | 3,500 | | $ | 186,644 | |
| | |
| |
|
|
| |
|
| |
|
| |
|
|
|
See accompanying Notes to Consolidated Financial Statements.
42
SCANSOURCE, INC. AND SUBSIDIARIES
CONDENSED CONSOLIDATED STATEMENTS OF CASH FLOWS
Years ended June 30, 2004, 2003 and 2002
(In thousands)
| | | | | | | | | | | | |
| | | 2004
| | | 2003
| | | 2002
| |
Cash flows from operating activities: | | | | | | | | | | | | |
Net income | | $ | 29,982 | | | $ | 22,574 | | | $ | 19,942 | |
Adjustments to reconcile net income to net cash provided by (used in) operating activities: | | | | | | | | | | | | |
Extraordinary gain, net of income taxes | | | — | | | | — | | | | (829 | ) |
Depreciation | | | 5,036 | | | | 4,909 | | | | 4,628 | |
Amortization of intangible assets | | | 314 | | | | 115 | | | | 27 | |
Allowance for accounts receivable | | | 4,030 | | | | 3,753 | | | | 5,737 | |
Impairment of capitalized software | | | 892 | | | | 191 | | | | 840 | |
Deferred income tax (benefit) expense | | | (51 | ) | | | 2,218 | | | | 237 | |
Tax benefit of stock option exercise | | | 882 | | | | 3,491 | | | | 1,533 | |
Minority interest in income of subsidiaries | | | 137 | | | | 530 | | | | 56 | |
Changes in operating assets and liabilities, net of acquisitions: | | | | | | | | | | | | |
Trade and notes receivables | | | (49,976 | ) | | | (12,133 | ) | | | (25,942 | ) |
Other receivables | | | 555 | | | | 3,405 | | | | 900 | |
Inventories | | | (30,090 | ) | | | 31,414 | | | | (11,380 | ) |
Prepaid expenses and other assets | | | 96 | | | | (491 | ) | | | (279 | ) |
Other noncurrent assets | | | 1,093 | | | | (6,321 | ) | | | 94 | |
Trade accounts payable | | | 15,273 | | | | (24,743 | ) | | | 8,180 | |
Accrued expenses and other liabilities | | | 2,817 | | | | 3,423 | | | | (2,980 | ) |
Income taxes payable | | | 2,586 | | | | (883 | ) | | | 1,080 | |
| | |
|
|
| |
|
|
| |
|
|
|
Net cash (used in) provided by operating activities | | | (16,424 | ) | | | 31,452 | | | | 1,844 | |
| | |
|
|
| |
|
|
| |
|
|
|
Cash flows from investing activities: | | | | | | | | | | | | |
Capital expenditures | | | (2,484 | ) | | | (6,324 | ) | | | (8,520 | ) |
Cash paid for business acquisitions | | | (540 | ) | | | (561 | ) | | | (20,460 | ) |
| | |
|
|
| |
|
|
| |
|
|
|
Net cash used in investing activities | | | (3,024 | ) | | | (6,885 | ) | | | (28,980 | ) |
| | |
|
|
| |
|
|
| |
|
|
|
Cash flows from financing activities: | | | | | | | | | | | | |
Advances (payments) on revolving credit, net | | | 14,451 | | | | (27,211 | ) | | | 26,360 | |
Exercise of stock options | | | 4,268 | | | | 4,992 | | | | 2,265 | |
Repayments of long-term debt borrowings | | | (861 | ) | | | (789 | ) | | | (815 | ) |
| | |
|
|
| |
|
|
| |
|
|
|
Net cash provided by (used in) financing activities | | | 17,858 | | | | (23,008 | ) | | | 27,810 | |
| | |
|
|
| |
|
|
| |
|
|
|
Effect of exchange rate changes on cash | | | 72 | | | | (290 | ) | | | 328 | |
| | |
|
|
| |
|
|
| |
|
|
|
(Decrease) increase in cash | | | (1,518 | ) | | | 1,269 | | | | 1,002 | |
Cash at beginning of year | | | 2,565 | | | | 1,296 | | | | 294 | |
| | |
|
|
| |
|
|
| |
|
|
|
Cash at end of year | | $ | 1,047 | | | $ | 2,565 | | | $ | 1,296 | |
| | |
|
|
| |
|
|
| |
|
|
|
Supplemental information: | | | | | | | | | | | | |
Interest paid | | $ | 1,169 | | | $ | 1,944 | | | $ | 2,611 | |
| | |
|
|
| |
|
|
| |
|
|
|
Income taxes paid | | $ | 14,830 | | | $ | 13,161 | | | $ | 9,764 | |
| | |
|
|
| |
|
|
| |
|
|
|
See accompanying Notes to Consolidated Financial Statements.
SCANSOURCE 43
SCANSOURCE, INC. AND SUBSIDIARIES
NOTES TO CONSOLIDATED FINANCIAL STATEMENTS
For the Three Years Ended June 30, 2004
(1) Business Description
ScanSource, Inc. (the “Company”) is a leading distributor of specialty technology products, providing value-added distribution sales to resellers in the specialty technology markets. The Company has two geographic distribution segments: one serving North America from the Memphis distribution center, and an international segment currently serving Latin America (including Mexico) and Europe. The North American distribution segment markets automatic identification and data capture (“AIDC”) and point-of-sale (“POS”) products through its ScanSource sales unit; voice, data and converged communications equipment through its CatalystTelecom sales unit; and voice, data and converged communications products through its Paracon sales unit. The international distribution segment markets AIDC and POS products through its ScanSource sales unit.
(2) Summary of Significant Accounting Policies and Accounting Standards Recently Issued
Consolidation Policy
The consolidated financial statements include the accounts of the Company and all wholly-owned and majority-owned subsidiaries. All significant inter-company accounts and transactions have been eliminated.
Minority Interest
Minority interest represents that portion of the net equity of majority-owned subsidiaries of the Company held by minority shareholders. The minority shareholders’ share of the subsidiaries’ income or loss is listed separately in the Consolidated Income Statements. Effective July 1, 2002, the Company acquired an additional 12% of Outsourcing Unlimited, Inc. (“OUI”) and an additional 8% of Netpoint International, Inc. (“Netpoint”). Effective July 1, 2003, the Company purchased the remaining 10% minority interest in ChannelMax, Inc. (“ChannelMax”). Effective August 15, 2003, the Company acquired an additional 12% of OUI and, effective October 1, 2003, an additional 8% of Netpoint. The Company now owns 100% of ChannelMax, 76% of OUI, and 68% of Netpoint.
Use of Estimates
The preparation of financial statements in conformity with accounting principles generally accepted in the United States of America requires management to make estimates and assumptions that affect the reported amounts of assets and liabilities and disclosure of contingent assets and liabilities at the date of the financial statements and the reported amounts of revenues and expenses during the reporting period. On an ongoing basis management evaluates its estimates, including those related to the allowance for uncollectible accounts receivable and inventory reserves to reduce inventories to the lower of cost or market. Management bases its
44
SCANSOURCE, INC. AND SUBSIDIARIES
NOTES TO CONSOLIDATED FINANCIAL STATEMENTS—(Continued)
For the Three Years Ended June 30, 2004
estimates on historical experience and on various other assumptions that management believes to be reasonable under the circumstances, the results of which form a basis for making judgments about the carrying value of assets and liabilities that are not readily available from other sources. Actual results may differ from these estimates under different assumptions or conditions; however, management believes that its estimates, including those for the above described items, are reasonable and that the actual results will not vary significantly from the estimated amounts.
The following significant accounting policies relate to the more significant judgments and estimates used in the preparation of the consolidated financial statements:
(a) Allowances for Accounts Receivable
The Company maintains an allowance for uncollectible accounts receivable for estimated losses resulting from customers’ failure to make payments on accounts receivable due to the Company. Management determines the estimate of the allowance for uncollectible accounts receivable considering a number of factors, including: (1) historical experience, (2) aging of the accounts receivable and (3) specific information obtained by the Company on the financial condition and the current credit worthiness of its customers. If the financial condition of the Company’s customers were to deteriorate and reduce the ability of the Company’s customers to make payments on their accounts, the Company may be required to increase its allowance by recording additional bad debt expense. Likewise, should the financial condition of the Company’s customers improve and result in payments or settlements of previously reserved amounts, the Company may be required to record a reduction in bad debt expense to reverse the recorded allowance. In addition, the Company maintains an allowance for credits to customers that will be applied against future purchases.
(b) Inventory Reserves
Management determines the inventory reserves required to reduce inventories to the lower of cost or market based principally on the effects of technological changes, quantities of goods on hand, and other factors. An estimate is made of the market value, less costs to dispose, of products whose value is determined to be impaired. If these products are ultimately sold at less than estimated amounts, additional reserves may be required. Likewise, if these products are sold for more than the estimated amounts, reserves may be reduced.
Reclassifications
Certain prior year amounts have been reclassified to conform to the current year presentation in the accompanying financial statements.
SCANSOURCE 45
SCANSOURCE, INC. AND SUBSIDIARIES
NOTES TO CONSOLIDATED FINANCIAL STATEMENTS—(Continued)
For the Three Years Ended June 30, 2004
Cash and Cash Equivalents
The Company considers all highly liquid investments with original maturities of three months or less to be cash equivalents. Book overdrafts of $8,953,000 and $17,412,000 as of June 30, 2004 and 2003, respectively, are included in accounts payable.
Concentration of Credit Risk
The Company sells its products to a large base of value-added resellers throughout North America, Latin America (including Mexico) and Europe. The Company performs ongoing credit evaluations of its customers’ financial condition. In certain cases, the Company will accept tangible assets as collateral to increase the trade credit of its customers. No single customer accounted for more than 6% of the Company’s net sales during fiscal 2004 and 2003, or more than 1% during fiscal 2002. The ten largest customers for the year ending June 30, 2004 represented approximately 20% of the Company’s sales and 27% of the Company’s consolidated trade and notes receivable as of June 30, 2004. The ten largest customers for the year ending June 30, 2003 represented approximately 19% of the Company’s sales and 31% of the Company’s consolidated trade and notes receivable as of June 30, 2003. Sales of the five largest vendors’ products of the Company represented approximately 75% of consolidated net sales of the Company as of June 30, 2004 and 2003.
The Company has established arrangements with certain customers for longer term financing. The Company accounts for these arrangements by recording them at their fair value at balance sheet dates. Interest income is recognized in the period earned and is recorded as interest income in the Consolidated Income Statement. Any fees or costs associated with these arrangements have been capitalized and are amortized over of the life of the arrangement.
Derivative Financial Instruments
The Company’s foreign currency exposure results from selling to customers internationally in several foreign currencies. In addition, the Company has foreign currency risk related to debt that is denominated in currencies other than the U.S. dollar. The Company may reduce its exposure to fluctuations in foreign exchange rates by creating offsetting positions through the use of derivative financial instruments. The market risk related to the foreign exchange agreements is offset by changes in the valuation of the underlying items hedged. The Company currently does not use derivative financial instruments for trading or speculative purposes, nor is the Company a party to leveraged derivatives.
Derivative financial instruments are accounted for on an accrual basis with gains and losses on these contracts recorded in income in the period in which their value changes. These contracts are generally for a duration of 90 days or less. The Company has elected not to designate its foreign currency contracts as
46
SCANSOURCE, INC. AND SUBSIDIARIES
NOTES TO CONSOLIDATED FINANCIAL STATEMENTS—(Continued)
For the Three Years Ended June 30, 2004
hedging instruments. They are, therefore, marked to market with changes in their value recorded in the Consolidated Income Statement each period. The underlying exposures are denominated primarily in British Pounds, Euros, and Canadian Dollars. Summarized financial information related to these derivative contracts and changes in the underlying value of the foreign currency exposures follows:
| | | | |
| | | Year ended June 30, 2004
| |
Foreign exchange derivative contract losses, net of gains | | $ | (264,000 | ) |
Foreign currency transactional and remeasurement gains, net of losses | | | 659,000 | |
| | |
|
|
|
Net foreign currency transactional and remeasurement gains | | $ | 395,000 | |
| | |
|
|
|
The Company had one currency forward contract outstanding as of June 30, 2004 with a net liability under this contract of $21,000. The amount is included in accrued expenses and other liabilities. The following table provides information about our outstanding foreign currency derivative financial instrument as of June 30, 2004:
| | | | | | | | | | |
| | | Year ended June 30, 2004
| |
US Dollar functional currency
| | Notional
Amount
| | Weighted Average
Contract Rate
| | Estimated Fair
Market Value
| |
Forward contracts – purchase US Dollar, sell Euro | | $ | 4,848,000 | | $ | 1.2120 | | $ | (21,000 | ) |
The notional amount of forward exchange contracts is the amount of foreign currency to be bought or sold at maturity. Notional amounts are indicative of the extent of the Company’s involvement in the various types and uses of derivative financial instruments and are not a measure of the Company’s exposure to credit or market risks through its use of derivatives. The estimated fair value of derivative financial instruments represents the amount required to enter into similar offsetting contracts with similar remaining maturities based on quoted market prices.
Inventories
Inventories (consisting of AIDC, POS, business phone and converged communications equipment) are stated at the lower of cost (first-in, first-out method) or market.
Vendor Programs
Funds received from vendors for marketing programs and product rebates have been accounted for as a reduction of selling, general and administrative expenses (“SG&A”) or product cost according to the nature of the program, in accordance with Emerging Issues Task Force (“EITF”) No. 02-16,Accounting for Cash Consideration Received from a Vendor.
SCANSOURCE 47
SCANSOURCE, INC. AND SUBSIDIARIES
NOTES TO CONSOLIDATED FINANCIAL STATEMENTS—(Continued)
For the Three Years Ended June 30, 2004
Product Warranty
The Company’s vendors generally warrant the products distributed by the Company and allow the Company to return defective products, including those that have been returned to the Company by its customers. The Company does not independently warrant the products it distributes. However, to maintain customer relations, the Company facilitates vendor warranty policies by accepting for exchange, with the Company’s prior approval, most defective products within 30 days of invoicing.
Long-Lived Assets
Property and equipment are recorded at cost. Depreciation is computed using the straight-line method over estimated useful lives of 2 to 5 years for furniture and equipment, 3 to 5 years for computer software, 40 years for buildings and 15 years for building improvements. Leasehold improvements are amortized over the shorter of the lease term or the estimated useful life. Maintenance, repairs and minor renewals are charged to expense as incurred. Additions, major renewals and betterments to property and equipment are capitalized.
For long-lived assets other than goodwill, if the sum of the expected cash flows, undiscounted and without interest, is less than the carrying amount of the asset, an impairment loss is recognized as the amount by which the carrying amount of the asset exceeds its fair value.
The Company reviews its long-lived assets for impairment whenever events or circumstances indicate that the carrying amount of an asset may not be recoverable or may be impaired. In fiscal 2004, 2003 and 2002, the Company recognized charges of approximately $892,000, $191,000 and $840,000, respectively, in operating expenses for the impairment of certain capitalized software for the North American distribution segment. This software was no longer functional based on current operational needs.
Goodwill and Other Identifiable Intangible Assets
Goodwill represents the excess of the purchase price over the fair value of the identifiable net assets acquired in acquisitions accounted for using the purchase method. With the adoption of Statement of Financial Accounting Standards (“SFAS”) No. 142,Goodwill and Other Intangible Assets, on July 1, 2001, the Company discontinued the amortization of goodwill. During fiscal year 2004 and 2003, the Company performed its annual test of goodwill to determine if there was impairment. These tests included the determination of each reporting unit’s fair value using market multiples and discounted cash flows modeling. No impairment was required to be recorded related to the Company’s annual impairment testing under this pronouncement.
The Company reviews the carrying value of its intangible assets with finite lives, which includes customer lists and non-compete agreements, as current events and circumstances warrant to determine whether there are
any impairment losses. If indicators of impairment are present in intangible assets used in operations, and future
48
SCANSOURCE, INC. AND SUBSIDIARIES
NOTES TO CONSOLIDATED FINANCIAL STATEMENTS—(Continued)
For the Three Years Ended June 30, 2004
cash flows are not expected to be sufficient to recover the assets’ carrying amount, an impairment loss is charged to expense in the period identified. These assets are included in other assets and are amortized using the straight-line method over a period of 5 years (see Note 10).
Fair Value of Financial Instruments
The fair value of financial instruments is the amount at which the instrument could be exchanged in a current transaction between willing parties. The carrying values of financial instruments such as accounts receivable, accounts payable, accrued liabilities, borrowings under the revolving credit facility and the subsidiary lines of credits approximate fair value, based upon either short maturities or variable interest rates of these instruments. See Note 5 for the fair value of the long-term debt.
Contingencies
The Company accrues for contingent obligations, including estimated legal costs, when it is probable that a liability is incurred and the amount is reasonably estimable. As facts concerning contingencies become known, management reassesses its position and makes appropriate adjustments to the financial statements. Estimates that are particularly sensitive to future changes include tax, legal, and other regulatory matters, which are subject to change as events evolve and as additional information becomes available during the administrative and litigation process.
Revenue Recognition
Revenue is recognized once four criteria are met: (1) the Company must have persuasive evidence that an arrangement exists; (2) delivery must occur, which happens at the point of shipment (this includes the transfer of both title and risk of loss, provided that no significant obligations remain); (3) the price must be fixed and determinable; and (4) collectibility must be reasonably assured. A provision for estimated losses on returns is recorded at the time of sale based on historical experience.
The Company has service revenue associated with configuration and marketing which is recognized when work is complete and all obligations are substantially met. Revenue from multiple element arrangements is allocated to the various elements based on the relative fair value of the elements, and each revenue cycle is considered a separate accounting unit with recognition of revenue based on the criteria met for the individual element of the multiple deliverables. The Company has arrangements in which it earns a service fee determined as a percentage of the value of products shipped on behalf of the manufacturer, who retains the risk of credit loss. In the event of termination of the arrangements, the Company has the right to return certain inventory to the manufacturer. Such service fees earned by the Company are included in net sales and were less than 1% of net sales for each of the three years ended June 30, 2004.
SCANSOURCE 49
SCANSOURCE, INC. AND SUBSIDIARIES
NOTES TO CONSOLIDATED FINANCIAL STATEMENTS—(Continued)
For the Three Years Ended June 30, 2004
Shipping Costs
Shipping revenue is included in net sales and related costs are included in the cost of goods sold.
Advertising Costs
The Company defers advertising related costs until the advertising is first run in trade or other publications or in the case of brochures, until the brochures are printed and available for distribution. Advertising costs, included in marketing costs, after vendor reimbursement, were not significant in any of the three years ended June 30, 2004. Deferred advertising costs at June 30, 2004 and 2003 were not significant.
Foreign Currency
The currency effects of translating the financial statements of the Company’s foreign entities that operate in their local currency are included in the cumulative currency translation adjustment component of accumulated other comprehensive income. The assets and liabilities of these foreign entities are translated into U.S. dollars using the exchange rate at the end of the respective period. Sales, costs and expenses are translated at average exchange rates effective during the respective period.
Foreign currency transactional and remeasurement gains and losses are included in other expense (income) in the Consolidated Income Statement. For the year ended June 30, 2004, foreign currency gains, net of losses, were $395,000. For the year ended June 30, 2003, foreign currency losses, net of gains, were $453,000. For the year ended June 30, 2002, foreign currency gains, net of losses, were less than 1% of operating income.
Income Taxes
Income taxes are accounted for using the liability method. Deferred taxes reflect tax consequences on future years of differences between the tax bases of assets and liabilities and their financial reporting amounts. Valuation allowances are provided against deferred tax assets that are unlikely to be realized. Federal income taxes are not provided on the undistributed earnings of foreign subsidiaries because it has been the practice of the Company to reinvest those earnings in the business outside of the United States.
Stock-Based Compensation
The Company has four stock-based employee compensation plans. The Company has adopted the disclosure provisions of Statement of Financial Accounting Standards (“SFAS”) No. 148,Accounting for Stock-Based Compensation—Transition and Disclosure, which amends SFAS No. 123,Accounting for Stock-Based Compensation. SFAS No. 148 allows for continued use of recognition and measurement principles of
50
SCANSOURCE, INC. AND SUBSIDIARIES
NOTES TO CONSOLIDATED FINANCIAL STATEMENTS—(Continued)
For the Three Years Ended June 30, 2004
Accounting Principles Board (“APB”) Opinion No. 25 and related interpretations in accounting for those plans. The Company applies the recognition and measurement principles of APB Opinion No. 25, and related interpretations in accounting for those plans. No stock-based employee compensation expense is reflected in net income as all options granted under those plans had an exercise price equal to the market value of the underlying common stock on the date of grant. The following table illustrates the effect on net income and earnings per share if the Company had applied the fair value recognition provisions to stock-based employee compensation. Such disclosure is not necessarily indicative of the fair value of stock options that could be granted by the Company in future fiscal years or of the value of all options currently outstanding (see Note 6).
| | | | | | | | | |
| | | Year ended June 30, |
| | | 2004
| | 2003
| | 2002
|
Net income, as reported | | $ | 29,982,000 | | $ | 22,574,000 | | $ | 19,942,000 |
Deduct: Total stock-based employee compensation expense determined under fair value based method for all awards, net of related tax effects | | | 1,402,000 | | | 1,376,000 | | | 1,735,000 |
| | |
|
| |
|
| |
|
|
Pro-forma net income | | $ | 28,580,000 | | $ | 21,198,000 | | $ | 18,207,000 |
| | |
|
| |
|
| |
|
|
Earnings per share: | | | | | | | | | |
Income per common share, basic, as reported | | $ | 2.40 | | $ | 1.88 | | $ | 1.73 |
| | |
|
| |
|
| |
|
|
Income per common share, basic, pro-forma | | $ | 2.29 | | $ | 1.76 | | $ | 1.58 |
| | |
|
| |
|
| |
|
|
Income per common share, assuming dilution, as reported | | $ | 2.31 | | $ | 1.81 | | $ | 1.60 |
| | |
|
| |
|
| |
|
|
Income per common share, assuming dilution, pro forma | | $ | 2.21 | | $ | 1.70 | | $ | 1.46 |
| | |
|
| |
|
| |
|
|
Pro-forma net income reflects only options granted during the years ended June 30, 2004, 2003 and 2002. Therefore, the full impact of calculating compensation cost for stock options under SFAS No. 123 is not reflected in net income effected above because compensation cost is reflected over the options vesting period of 3 years for options issued under the incentive stock option plans.
Comprehensive Income
Comprehensive income is comprised of net income and foreign currency translation. The foreign currency translation gains or losses are not tax-effected because the earnings of foreign subsidiaries are considered by Company management to be permanently reinvested. For the years ended June 30, 2004, 2003 and 2002, comprehensive income consisted of net income of the Company of $30.0 million, $22.6 million and $20.0 million, respectively, and translation adjustments of $625,000, $1.8 million and $1.1 million, respectively.
SCANSOURCE 51
SCANSOURCE, INC. AND SUBSIDIARIES
NOTES TO CONSOLIDATED FINANCIAL STATEMENTS—(Continued)
For the Three Years Ended June 30, 2004
Accounting Standards Recently Issued
In November 2002, the Financial Accounting Standards Board (“FASB”) issued FASB Interpretation (“FIN”) No. 45,Guarantor’s Accounting and Disclosure Requirements for Guarantees, Including Indirect Guarantees of Indebtedness of Others (an interpretation of FASB Statements of Financial Accounting Standards No. 5, 57, and 107 and rescission of FASB Interpretation No. 34). FIN No. 45 clarifies the requirements of SFAS No. 5,Accounting for Contingencies, relating to a guarantor’s accounting for, and disclosure of, the issuance of certain types of guarantees. The initial recognition and initial measurement provisions of FIN No. 45 are applicable to guarantees issued or modified after December 31, 2002 and the disclosure requirements are applicable to financial statements for periods ending after December 15, 2002. The adoption of FIN No. 45 had no effect on the Company’s financial position or results of operations.
In December 2002, the FASB issued SFAS No. 148,Accounting for Stock-Based Compensation – Transition and Disclosure. This statement amends the transition requirements of SFAS No. 123,Accounting for Stock-Based Compensation,to provide alternative, voluntary methods of transition to the fair value method of accounting for stock-based employee compensation. It also amends the disclosure provisions of SFAS No. 123 to require disclosure in the summary of significant accounting policies of the effects of an entity’s accounting policy with respect to stock-based employee compensation on reported net income and earnings per share in annual and interim financial statements. The disclosure provision is required for all companies with stock-based employee compensation, regardless of whether the Company utilizes the fair value method of accounting described in SFAS No. 123 or the intrinsic value method described in APB Opinion No. 25,Accounting for Stock Issued to Employees. The amendments to the transition and annual disclosure provisions of SFAS No. 123 were effective for the Company’s fiscal year ended June 30, 2003. The Company continues to account for stock-based employee compensation under the intrinsic value method described by APB Opinion No. 25. The adoption of SFAS No. 148 had no effect on the Company’s financial position or results of operations.
In December 2002, the FASB’s EITF issued Issue No. 02-16. This issue addresses the appropriate accounting, by a distributor, for cash consideration received from a vendor and became effective for the Company on January 1, 2003. The adoption of EITF No. 02-16 requires that cash consideration received from a vendor should be recorded as a direct reduction to cost of goods sold, unless certain criteria are met. If these criteria are met, then the cash consideration should be a reduction of the operating expense for which it is being reimbursed. The guidance is applicable to all of the Company’s vendor arrangements entered into after December 31, 2002.
In January 2003, the FASB issued Interpretation No. 46 (“FIN 46”),Consolidation of Variable Interest Entities.FIN 46 clarifies the application of Accounting Research Bulletin No. 51,Consolidated Financial Statements, to certain entities in which equity investors do not have the characteristics of a controlling financial interest or do not have sufficient equity at risk for the entity to finance its activities without additional subordinated financial
52
SCANSOURCE, INC. AND SUBSIDIARIES
NOTES TO CONSOLIDATED FINANCIAL STATEMENTS—(Continued)
For the Three Years Ended June 30, 2004
support from other parties. FIN 46 applies immediately to variable interest entities (“VIEs”) created after January 31, 2003, and to VIEs in which an enterprise obtains an interest after that date. In December 2003, the FASB published a revision to FIN 46 to clarify some of the provisions and to exempt certain entities from its requirements. Under the new guidance, special effective date provisions apply to enterprises that have fully or partially applied FIN 46 prior to issuance of the revised interpretation. Otherwise, application of Interpretation 46R (“FIN 46R”) is required in financial statements of public entities that have interests in structures that are commonly referred to as special-purpose entities (“SPEs”) for periods ending after December 15, 2003. Application by public entities, other than small business issuers, for all other types of VIEs other than SPEs is required in financial statements for periods ending after March 15, 2004. The Company has completed its evaluation of all potential VIEs relationships existing prior to February 1, 2003. The Company did not create or obtain any interest in a variable interest entity during the period February 1, 2003 through June 30, 2004. However, changes in the Company’s business relationships with various entities could occur which may impact its financial statements under the requirements of FIN 46R. The Company has concluded that these relationships do not meet the requirements under the provision and therefore, there is no effect of these relationships on the Company’s consolidated financial position or results of operations as of June 30, 2004.
In April 2003, the FASB issued SFAS No. 149,Amendment of Statement 133 on Derivative Instruments and Hedging Activities. SFAS No. 149 amends and clarifies financial accounting and reporting for derivative instruments, including certain derivative instruments embedded in other contracts. SFAS No. 149 is effective for contracts entered into or modified after June 30, 2003 and for hedging relationships designated after June 30, 2003. The adoption of SFAS No. 149 had no effect on the Company’s financial position or results of operations.
In May 2003, the FASB issued SFAS No. 150,Accounting for Certain Financial Instruments with Characteristics of both Liabilities and Equity. SFAS No. 150 requires that certain financial instruments, which under previous guidance were accounted for as equity, must now be accounted for as liabilities. The financial instruments affected include mandatorily redeemable stock, certain financial instruments that require or may require the issuer to buy back some of its shares in exchange for cash or other assets and certain obligations that can be settled with shares of stock. SFAS No. 150 is effective for all financial instruments entered into or modified after May 31, 2003 and must be applied to the Company’s existing financial instruments effective July 1, 2003, the beginning of the first fiscal period after June 15, 2003. The Company adopted SFAS No. 150 on July 1, 2003. The adoption of this statement had no effect on the Company’s financial position or results of operations.
(3) Earnings per Share (“EPS”)
Basic earnings per share are computed by dividing net income by the weighted-average number of common shares outstanding. Diluted earnings per share are computed by dividing net income by the weighted-average number of common and potential common shares outstanding.
SCANSOURCE 53
SCANSOURCE, INC. AND SUBSIDIARIES
NOTES TO CONSOLIDATED FINANCIAL STATEMENTS—(Continued)
For the Three Years Ended June 30, 2004
| | | | | | | | | |
| | | Net Income
| | | Shares
| | Per
Share Amount
|
2004: | | | | | | | | | |
Income per common share, basic | | $ | 29,982,000 | | | 12,485,000 | | $ | 2.40 |
| | | | | | | | |
|
|
Effect of dilutive stock options | | | — | | | 467,000 | | | |
| | |
|
|
| |
| | | |
Income per common share, assuming dilution | | $ | 29,982,000 | | | 12,952,000 | | $ | 2.31 |
| | |
|
|
| |
| |
|
|
2003: | | | | | | | | | |
Income per common share, basic | | $ | 22,574,000 | | | 12,013,000 | | $ | 1.88 |
| | | | | | | | |
|
|
Effect of dilutive stock options | | | (168,000 | ) | | 336,000 | | | |
| | |
|
|
| |
| | | |
Income per common share, assuming dilution | | $ | 22,406,000 | | | 12,349,000 | | $ | 1.81 |
| | |
|
|
| |
| |
|
|
2002: | | | | | | | | | |
Income per common share, basic | | $ | 19,942,000 | | | 11,524,000 | | $ | 1.73 |
| | | | | | | | |
|
|
Effect of dilutive stock options | | | (16,000 | ) | | 908,000 | | | |
| | |
|
|
| |
| | | |
Income per common share, assuming dilution | | $ | 19,926,000 | | | 12,432,000 | | $ | 1.60 |
| | |
|
|
| |
| |
|
|
For the years ended June 30, 2004, 2003 and 2002 there were 71,000, 59,000 and 0 shares, respectively, excluded from the computation of diluted earnings per share because their effect would have been antidilutive.
(4) Revolving Credit Facility and Subsidiary Lines of Credit
The Company entered into new credit facilities during the first quarter of fiscal year 2005 (see Note 15).
The Company had a revolving credit facility with its bank group at June 30, 2004 with a borrowing limit of the lesser of (i) $80 million or (ii) the sum of 85% of eligible accounts receivable plus the lesser of (a) 50% of eligible inventory or (b) $40 million. The facility bore interest at the 30-day LIBOR rate of interest plus a rate varying from 1.00% to 2.50% tied to the Company’s funded debt to EBITDA ratio ranging from 2.50:1 to 4.25:1 and a fixed charge coverage ratio of not less than 2.75:1. The effective interest rate at June 30, 2004 was 2.13% and the outstanding balance was $32.6 million on a calculated borrowing base of $80 million, leaving $47.4 million available for additional borrowings. The effective interest rate at June 30, 2003 was 2.57% and the outstanding balance was $18.1 million on a calculated borrowing base of $80 million, leaving $61.9 million available for additional borrowings. The revolving credit facility was collateralized by accounts receivable and eligible inventory. The credit agreement contained various restrictive covenants, including among other things, minimum net worth requirements, capital expenditure limits, maximum funded debt to EBITDA ratio and a fixed charge coverage ratio. The Company was in compliance with its covenants at June 30, 2004.
54
SCANSOURCE, INC. AND SUBSIDIARIES
NOTES TO CONSOLIDATED FINANCIAL STATEMENTS—(Continued)
For the Three Years Ended June 30, 2004
The former credit facility contained an acceleration clause that could have been invoked by the lenders based on the possible occurrence of a material adverse effect and a requirement to maintain a lock-box arrangement. These requirements result in a short-term classification of the revolving line of credit in accordance with Emerging Issues Task Force (“EITF”) 95-22,Balance Sheet Classifications of Borrowing Outstanding under Revolving Credit Agreements That Include both a Subjective Acceleration Clause and a Lock-Box Arrangement. The June 30, 2003 balance sheet has been restated to reclassify $18,118,000 of borrowings under the revolving credit facility, which were previously reported as long-term debt, to a current liability in accordance with EITF 95-22. The restated balance sheet had no impact on the Company’s previously reported net income, liquidity or debt covenants. The Company entered into a new credit facility in July 2004. The new credit facility does not require a lock-box arrangement. Accordingly, at June 30, 2004 the new facility is classified as long-term under FASB Statement No. 6, Classification of Short-Term Obligations Expected to Be Refinanced.
Netpoint, doing business as ScanSource Latin America, had an asset-based line of credit agreement with a bank at June 30, 2004 that was due on demand. The borrowing limit on the line was the lesser of $600,000 or the sum of 75% of domestic accounts receivable and 50% of foreign accounts receivable, plus 10% of eligible inventory (up to $250,000). As of the August 30, 2003 renewal date, the facility bore interest at the bank’s prime rate minus one percent, which was 3.00% at June 30, 2004. Prior to the renewal, the facility bore interest at the bank’s prime rate plus one percent, which was 5.00% at June 30, 2003. All of Netpoint’s assets collateralized the line of credit. The Company had guaranteed 68% of the balance on the line, while the remaining 32% of the balance was guaranteed by Netpoint’s minority shareholder. At June 30, 2004 and 2003, there were no outstanding borrowings on the line of credit. However, outstanding standby letters of credit totaled $40,000 leaving $560,000 available for additional borrowings.
SCANSOURCE 55
SCANSOURCE, INC. AND SUBSIDIARIES
NOTES TO CONSOLIDATED FINANCIAL STATEMENTS—(Continued)
For the Three Years Ended June 30, 2004
(5) Long-term Debt
Long-term debt consists of the following at June 30, 2004 and 2003:
| | | | | | |
| | | 2004
| | 2003
|
Note payable to a bank, secured by distribution center land and building; monthly payments of principal and interest of $65,000; 2.53% and 2.97% variable interest rate, respectively at June 30, 2004 and 2003; maturing in fiscal 2006 with a balloon payment of approximately $4,771,000 | | $ | 5,528,000 | | $ | 6,153,000 |
Note payable to a bank, secured by office building and land; monthly payments of principal and interest of $15,000; 9.19% fixed interest rate at June 30, 2004 and 2003; maturing in fiscal 2007 with a balloon payment of approximately $1,458,000 | | | 1,549,000 | | | 1,584,000 |
Note payable to a bank, secured by motor coach; monthly payments of principal and interest of $7,000; 2.53% and 2.97% variable interest rate, respectively at June 30, 2004 and 2003; maturing in fiscal 2006 with a balloon payment of approximately $144,000 | | | 274,000 | | | 354,000 |
Capital leases for equipment with monthly principal payments ranging from $33 to $1,903 and effective interest rates ranging from 7.60% to 23.82%, at June 30, 2004 and 2003, respectively | | | 87,000 | | | 208,000 |
| | |
|
| |
|
|
| | | | 7,438,000 | | | 8,299,000 |
Less current portion | | | 854,000 | | | 914,000 |
| | |
|
| |
|
|
Long-term portion | | $ | 6,584,000 | | $ | 7,385,000 |
| | |
|
| |
|
|
The note payables secured by the distribution center and the motor coach contain certain financial covenants, including minimum net worth, capital expenditure limits, a maximum debt to tangible net worth ratio, and prohibit the payment of dividends. The Company was in compliance with the various covenants at June 30, 2004.
The fair value of long-term debt is estimated by discounting the scheduled payment streams to present value based on current rates for similar instruments and was approximately $7,444,000 and $8,808,000 at June 30, 2004 and 2003, respectively.
Scheduled maturities of long-term debt and capital leases at June 30, 2004 are as follows:
| | | | | | | | | | | | |
| | | Payments Due by Period
|
| | | Total
| | Less than 1 Year
| | 1-3 Years
| | 3-5 Years
|
Long-term debt obligations | | $ | 7,351,000 | | $ | 767,000 | | $ | 6,584,000 | | $ | — |
Capital lease obligations | | | 87,000 | | | 87,000 | | | — | | | — |
| | |
|
| |
|
| |
|
| |
|
|
Total principal payments | | $ | 7,438,000 | | $ | 854,000 | | $ | 6,584,000 | | $ | — |
| | |
|
| |
|
| |
|
| |
|
|
56
SCANSOURCE, INC. AND SUBSIDIARIES
NOTES TO CONSOLIDATED FINANCIAL STATEMENTS—(Continued)
For the Three Years Ended June 30, 2004
(6) Stock Options and Earnings Per Share
(a) Stock Option Plans:
| | • | The 1993 Incentive Stock Option Plan reserved 560,000 shares of common stock for issuance to key employees. The plan provides for three-year vesting of the options at a rate of 33% annually. The options are exercisable over 10 years, and options are not to be granted at less than the fair market value of the underlying shares at the date of grant. As of June 30, 2004, there were 7,789 shares available for grant under this plan. |
| | • | The amended 1997 Stock Incentive Plan reserved 1,200,000 shares of common stock for issuance to officers, directors, employees, consultants or advisors to the Company. This plan provides for incentive stock options, nonqualified options, stock appreciation rights and restricted stock awards to be granted at exercise prices to be determined by the Compensation Committee of the Board of Directors. The plan provides for three-year vesting of the options at a rate of 33% annually. The term of each option is 10 years from the grant date. As of June 30, 2004, there were 11,920 shares available for grant under this plan. |
| | • | The 2002 Long-Term Incentive Plan reserved 400,000 shares of common stock for issuance to officers, employees, consultants or advisors to the Company. This plan provides for incentive stock options, nonqualified options, stock appreciation rights and restricted stock awards to be granted at exercise prices to be determined by the Compensation Committee of the Board of Directors. The fiscal year 2003 grants provide for three-year vesting of the options at a rate of 33% annually, and provide a term of 10 years from the grant date. As of June 30, 2004, there were 132,150 shares available for grant under this plan. |
| | • | Since 1993 the Company has compensated its non-employee directors with a grant of stock options issued at fair market value on the date following the annual meeting of shareholders. The stock option grants have had a term of 10 years and vesting six months after the date of grant. The 1993 Director Plan had 30,000 reserved shares remaining but never issued when it was replaced by the 1999 Director Plan. The 1999 Director Plan had 124,000 reserved shares remaining but never issued when it was replaced by the 2003 Directors Equity Compensation Plan (“the 2003 Director Plan”), which reserved 125,000 shares of common stock. Under the 2003 Director Plan the number of shares granted (rounded up to the nearest 100 shares) is calculated by dividing $200,000 by the average per share stock price of the common stock for the 30-day period immediately preceding the grant date. As of June 30, 2004, there were 110,900 shares available for grant under this plan. |
SCANSOURCE 57
SCANSOURCE, INC. AND SUBSIDIARIES
NOTES TO CONSOLIDATED FINANCIAL STATEMENTS—(Continued)
For the Three Years Ended June 30, 2004
A summary of stock option activity for the years ended June 30, 2004, 2003 and 2002 is as follows:
| | | | | | | | | | | | | | | | | | |
| | | 2004
| | 2003
| | 2002
|
| | | Shares
| | | Weighted-
Average
Exercise
Price
| | Shares
| | | Weighted-
Average
Exercise
Price
| | Shares
| | | Weighted-
Average
Exercise
Price
|
Options outstanding: | | | | | | | | | | | | | | | | | | |
Beginning of year | | 1,123,226 | | | $ | 16.39 | | 1,532,570 | | | $ | 12.23 | | 1,642,764 | | | $ | 11.12 |
Granted | | 157,850 | | | | 45.86 | | 189,400 | | | | 26.90 | | 141,020 | | | | 21.42 |
Exercised | | (320,705 | ) | | | 13.58 | | (587,928 | ) | | | 8.85 | | (238,656 | ) | | | 9.59 |
Terminated | | (5,987 | ) | | | 23.01 | | (10,816 | ) | | | 20.79 | | (12,558 | ) | | | 20.52 |
| | |
|
| | | | |
|
| | | | |
|
| | | |
End of year | | 954,384 | | | | 22.08 | | 1,123,226 | | | | 16.39 | | 1,532,570 | | | | 12.23 |
| | |
|
| | | | |
|
| | | | |
|
| | | |
Exercisable, end of year | | 666,348 | | | $ | 16.27 | | 776,154 | | | $ | 13.11 | | 1,184,170 | | | $ | 10.17 |
| | |
|
| | | | |
|
| | | | |
|
| | | |
The following table summarizes information about stock options outstanding and exercisable at June 30, 2004:
| | | | | | | | |
Options Outstanding
| | Options Exercisable
|
Range of
Exercise Prices
| | Number
Outstanding
| | Weighted-
Average
Remaining
Contractual
Life
| | Number
Exercisable
| | Weighted-
Average
Exercise
Price
|
$ 4.44 –4.70 | | 3,000 | | 1.0 years | | 3,000 | | $4.44 |
4.71 – 9.40 | | 231,540 | | 4.1 years | | 231,540 | | 8.02 |
9.41 – 14.11 | | 12,402 | | 5.3 years | | 12,402 | | 12.51 |
14.12 – 18.81 | | 251,754 | | 5.8 years | | 251,754 | | 17.57 |
18.82 – 23.51 | | 110,205 | | 7.3 years | | 75,965 | | 21.31 |
23.52 – 28.21 | | 156,300 | | 8.1 years | | 59,587 | | 25.72 |
28.22 – 37.62 | | 31,333 | | 8.4 years | | 18,000 | | 35.14 |
37.63 – 47.02 | | 157,850 | | 9.5 years | | 14,100 | | 43.15 |
| | |
| | | |
| | |
| | | 954,384 | | 6.6 years | | 666,348 | | $16.27 |
| | |
| | | |
| | |
58
SCANSOURCE, INC. AND SUBSIDIARIES
NOTES TO CONSOLIDATED FINANCIAL STATEMENTS—(Continued)
For the Three Years Ended June 30, 2004
(b) Fair Value
The pro forma fair value of stock options granted by the Company has been estimated at the date of grant using the Black-Scholes option-pricing model with the following weighted-average assumptions:
| | | | | | | | | | | | |
Weighted-Average Assumptions
| | 2004
| | | 2003
| | | 2002
| |
Risk-free interest rate | | | 3.8 | % | | | 3.6 | % | | | 4.9 | % |
Expected dividend yield | | | 0.0 | % | | | 0.0 | % | | | 0.0 | % |
Expected volatility factor | | | 37.4 | % | | | 63.7 | % | | | 50.9 | % |
Expected life | | | 10 years | | | | 10 years | | | | 10 years | |
| | | |
Per Share Weighted-Average
| | | | | | | | | |
Pro forma fair value of stock options granted | | $ | 25.22 | | | $ | 20.79 | | | $ | 14.56 | |
(c) Stock options of Subsidiary
Effective July 1, 2003, the Company purchased the remaining minority interest in ChannelMax and now owns 100%. At June 30, 2003 and 2002, ChannelMax was a majority owned subsidiary of the Company and had reserved 500,000 shares of ChannelMax common stock for issuance to its officers, directors, and employees under the ChannelMax, Inc. 2000 Stock Option Plan.
A summary of stock option activity for ChannelMax for the years ended June 30, 2004, 2003 and 2002 is as follows:
| | | | | | | | | | | | | | | | | | |
| | | 2004
| | 2003
| | 2002
|
| | | Shares
| | | Weighted-
Average
Exercise
Price
| | Shares
| | | Weighted-
Average
Exercise
Price
| | Shares
| | | Weighted-
Average
Exercise
Price
|
Options outstanding: | | | | | | | | | | | | | | | | | | |
Beginning of year | | 227,750 | | | $ | 0.71 | | 229,250 | | | $ | 0.71 | | 351,250 | | | $ | 0.65 |
Granted | | — | | | | | | — | | | | | | — | | | | |
Terminated | | (227,750 | ) | | | 0.71 | | (1,500 | ) | | | 0.71 | | (122,000 | ) | | | 0.54 |
| | |
|
| | | | |
|
| | | | |
|
| | | |
End of year | | — | | | | 0.00 | | 227,750 | | | | 0.71 | | 229,250 | | | | 0.71 |
| | |
|
| | | | |
|
| | | | |
|
| | | |
Exercisable, end of year | | — | | | $ | 0.00 | | 227,750 | | | $ | 0.71 | | 152,824 | | | $ | 0.71 |
| | |
|
| | | | |
|
| | | | |
|
| | | |
SCANSOURCE 59
SCANSOURCE, INC. AND SUBSIDIARIES
NOTES TO CONSOLIDATED FINANCIAL STATEMENTS—(Continued)
For the Three Years Ended June 30, 2004
(7) Income Taxes
Income tax expense (benefit), excluding any taxes related to extraordinary gain, consists of:
| | | | | | | | | | | |
| | | Current
| | Deferred
| | | Total
| |
Year ended June 30, 2004: | | | | | | | | | | | |
U.S. Federal | | $ | 15,940,000 | | $ | 585,000 | | | $ | 16,525,000 | |
State and local | | | 2,531,000 | | | (232,000 | ) | | | 2,299,000 | |
Foreign | | | 280,000 | | | (404,000 | ) | | | (124,000 | ) |
| | |
|
| |
|
|
| |
|
|
|
| | | $ | 18,751,000 | | $ | (51,000 | ) | | $ | 18,700,000 | |
| | |
|
| |
|
|
| |
|
|
|
Year ended June 30, 2003: | | | | | | | | | | | |
U.S. Federal | | $ | 12,412,000 | | $ | 1,599,000 | | | $ | 14,011,000 | |
State and local | | | 1,270,000 | | | 570,000 | | | | 1,840,000 | |
Foreign | | | 150,000 | | | 49,000 | | | | 199,000 | |
| | |
|
| |
|
|
| |
|
|
|
| | | $ | 13,832,000 | | $ | 2,218,000 | | | $ | 16,050,000 | |
| | |
|
| |
|
|
| |
|
|
|
Year ended June 30, 2002: | | | | | | | | | | | |
U.S. Federal | | $ | 10,537,000 | | $ | 841,000 | | | $ | 11,378,000 | |
State and local | | | 519,000 | | | (629,000 | ) | | | (110,000 | ) |
Foreign | | | — | | | — | | | | — | |
| | |
|
| |
|
|
| |
|
|
|
| | | $ | 11,056,000 | | $ | 212,000 | | | $ | 11,268,000 | |
| | |
|
| |
|
|
| |
|
|
|
A reconciliation of the U.S. Federal income tax expense at a statutory rate of 35% to actual income tax expense, excluding any other taxes related to extraordinary gain, is as follows:
| | | | | | | | | | | | |
| | | 2004
| | | 2003
| | | 2002
| |
U.S. Federal income tax at statutory rate | | $ | 17,087,000 | | | $ | 13,704,000 | | | $ | 10,633,000 | |
Increase (decrease) in income taxes due to: | | | | | | | | | | | | |
State and local income taxes, net of
U.S. Federal income tax benefit | | | 1,916,000 | | | | 1,248,000 | | | | 940,000 | |
State tax credits | | | — | | | | (49,000 | ) | | | (1,011,000 | ) |
Valuation allowance | | | (184,000 | ) | | | 777,000 | | | | 693,000 | |
Effect of foreign operations, net | | | (49,000 | ) | | | 279,000 | | | | (129,000 | ) |
Other | | | (70,000 | ) | | | 91,000 | | | | 142,000 | |
| | |
|
|
| |
|
|
| |
|
|
|
| | | $ | 18,700,000 | | | $ | 16,050,000 | | | $ | 11,268,000 | |
| | |
|
|
| |
|
|
| |
|
|
|
60
SCANSOURCE, INC. AND SUBSIDIARIES
NOTES TO CONSOLIDATED FINANCIAL STATEMENTS—(Continued)
For the Three Years Ended June 30, 2004
The tax effects of temporary differences that give rise to significant portions of the deferred tax assets and liabilities at June 30, 2004 and 2003 are presented below:
| | | | | | | | |
| | | 2004
| | | 2003
| |
Deferred tax assets derived from: | | | | | | | | |
Allowance for accounts receivable | | $ | 3,878,000 | | | $ | 3,867,000 | |
Inventories | | | 3,680,000 | | | | 4,636,000 | |
Nondeductible accrued expenses | | | 1,357,000 | | | | 943,000 | |
Net operating loss carryforwards | | | 2,050,000 | | | | 1,169,000 | |
Tax credits | | | 468,000 | | | | 262,000 | |
Other | | | 1,000 | | | | 338,000 | |
| | |
|
|
| |
|
|
|
Total deferred tax assets | | | 11,434,000 | | | | 11,215,000 | |
Valuation allowance | | | (1,654,000 | ) | | | (1,470,000 | ) |
| | |
|
|
| |
|
|
|
Total deferred tax assets | | $ | 9,780,000 | | | $ | 9,745,000 | |
| | |
|
|
| |
|
|
|
Deferred tax liabilities derived from: | | | | | | | | |
Timing of amortization deduction from intangible assets | | $ | (83,000 | ) | | $ | (261,000 | ) |
Timing of depreciation and other deductions for building and equipment | | | (2,002,000 | ) | | | (1,819,000 | ) |
Other | | | (313,000 | ) | | | (334,000 | ) |
| | |
|
|
| |
|
|
|
Total deferred tax liabilities | | $ | (2,398,000 | ) | | $ | (2,414,000 | ) |
| | |
|
|
| |
|
|
|
Net deferred tax assets | | $ | 7,382,000 | | | $ | 7,331,000 | |
| | |
|
|
| |
|
|
|
The components of pretax earnings are as follows:
| | | | | | | | | | | |
| | | Fiscal Year
| |
| | | 2004
| | 2003
| | | 2002
| |
Domestic | | $ | 48,447,000 | | $ | 41,730,000 | | | $ | 31,704,000 | |
Foreign | | | 372,000 | | | (2,576,000 | ) | | | (1,267,000 | ) |
| | |
|
| |
|
|
| |
|
|
|
| | | $ | 48,819,000 | | $ | 39,154,000 | | | $ | 30,437,000 | |
| | |
|
| |
|
|
| |
|
|
|
At June 30, 2004, the Company has: (i) operating loss carryforwards of approximately $529,000 for U.S. Federal income tax purposes that begin expiring in 2020; (ii) certain state income tax credit carryforwards of approximately $720,000 that begin expiring in 2009, and (iii) operating loss carryforwards of approximately $4.1 million in Belgium and $896,000 in Canada. Belgium operating loss carryforwards have no expiration date and Canadian operating losses begin expiring in 2008 for income tax purposes. A valuation allowance of $1.7 million at June 30, 2004 has been provided for the Belgium operating loss carryforward and a portion of the U.S. Federal operating loss carryforward, as utilization of such carryforwards is uncertain.
SCANSOURCE 61
SCANSOURCE, INC. AND SUBSIDIARIES
NOTES TO CONSOLIDATED FINANCIAL STATEMENTS—(Continued)
For the Three Years Ended June 30, 2004
The Company has not provided U.S. income taxes for undistributed earnings of foreign subsidiaries that are considered to be retained indefinitely for reinvestment. The distribution of these earnings would result in additional foreign withholding taxes and additional U.S. federal income taxes to the extent they are not offset by foreign tax credits, but it is not practicable to estimate the total liability that would be incurred upon such a distribution.
(8) Commitments and Contingencies
The Company leases office space under noncancelable operating leases that expire through April 2009. As discussed in Note 5, the Company leases certain equipment under capital leases. The Company no longer sub-leases office space to third parties. Future minimum lease payments under operating leases are as follows:
| | | |
| | | Payments
|
Fiscal year ended June 30: | | | |
2005 | | $ | 753,000 |
2006 | | | 504,000 |
2007 | | | 290,000 |
2008 | | | 179,000 |
2009 | | | 174,000 |
Thereafter | | | 396,000 |
| | |
|
|
| | | $ | 2,296,000 |
| | |
|
|
Lease expense was approximately $1,110,000, $1,023,000 and $882,000 for the years ended June 30, 2004, 2003 and 2002, respectively. Rental income was approximately $17,000, $106,000 and $142,000 for the years ended June 30, 2004, 2003 and 2002, respectively.
The Company anticipates capital expenditures of $515,000 in the first half of fiscal year 2005 for the replacement of the corporate office building roof and the purchase of financial software for Europe. Contractual obligations to purchase software amounted to approximately $175,000 at June 30, 2003.
A majority of the Company’s net revenues in 2004, 2003 and 2002 were received from the sale of products purchased from the Company’s ten largest vendors. The Company has entered into written distribution agreements with substantially all of its major vendors. While the Company’s agreements with most of its vendors contain standard provisions for periodic renewals, these agreements generally permit termination by either party without cause upon 30 to 120 days notice.
62
SCANSOURCE, INC. AND SUBSIDIARIES
NOTES TO CONSOLIDATED FINANCIAL STATEMENTS—(Continued)
For the Three Years Ended June 30, 2004
Guarantees
At June 30, 2003, the Company owned a 25% equity interest in a limited liability company for which it had guaranteed debt up to $446,000. At June 30, 2004, the Company had satisfied all obligations related to the debt.
Contingencies
The Company or its subsidiaries are, from time to time, parties to lawsuits arising out of operations. Although there can be no assurance, based upon information known to the Company, the Company believes that any liability resulting from an adverse determination of such lawsuits would not have a material adverse effect on the Company’s financial condition or results of operations.
The Company received an assessment for a sales and use tax matter for the three calendar years ended 2001. Based on this assessment, the Company has determined a probable range for the disposition of that assessment and for subsequent periods through March 2004. Although the Company is disputing the assessment, it has accrued $1.4 million for the year ended June 30, 2004. Although there can be no assurance of the ultimate outcome at this time, the Company intends to vigorously defend its position.
As discussed in Note 12, the Company has future commitments to purchase the remaining interest in Netpoint and OUI over several years. On August 15, 2003, the Company purchased an additional 12% interest in OUI for approximately $97,000. Effective October 1, 2003, the Company purchased an additional 8% interest in Netpoint for approximately $412,000.
(9) Employee Benefit Plan
The Company has a defined contribution plan under Section 401(k) of the Internal Revenue Code that covers all employees meeting certain eligibility requirements. For the years ended June 30, 2004, 2003 and 2002 the Company provided a matching contribution of $248,000, $242,000 and $265,000, respectively, which was equal to one-half of each participant’s contribution, up to a maximum matching contribution per participant of $800 for 2004, 2003 and 2002. The Company determines its matching contributions annually and can make discretionary contributions in addition to matching contributions. In fiscal 2004, 2003 and 2002, the Company made a discretionary profit-sharing contribution of approximately $2.8 million, $2.2 million and $1.1 million, respectively. Employer contributions are vested over a period of 2 to 5 years.
(10) Goodwill and Identifiable Intangible Assets
In accordance with SFAS No. 142,Goodwill and Other Intangible Assets, the Company performs its annual test of goodwill at the end of each fiscal year to determine if impairment has occurred. This testing includes the determination of each reporting unit’s fair value using market multiples and discounted cash flows modeling. At
SCANSOURCE 63
SCANSOURCE, INC. AND SUBSIDIARIES
NOTES TO CONSOLIDATED FINANCIAL STATEMENTS—(Continued)
For the Three Years Ended June 30, 2004
the end of fiscal year 2004, no impairment charge was recorded. As a result of adopting SFAS No. 142, no amortization of goodwill has been recorded in fiscal year 2004, 2003 and 2002. During the first quarter of fiscal year 2004, the Company recorded a reduction of goodwill related to the purchase of the additional 10% minority interest, as it related to the restructuring of the ChannelMax segment in the amount of $172,000, as required under SFAS No. 141,Business Combinations. The Company acquired additional goodwill of $132,000 through the acquisition of an additional 12% interest in OUI during the first quarter of fiscal year 2004 and additional goodwill of $177,000 through an additional 8% interest in Netpoint during the second quarter of fiscal year 2004. Changes in the carrying amount of goodwill and other intangibles assets for the year ended June 30, 2004, by operating segment, are as follows:
| | | | | | | | | | | |
| | | North
American
Distribution
Segment
| | | International
Distribution
Segment
| | Total
| |
Balance as of June 30, 2002 | | $ | 5,743,000 | | | $ | 3,832,000 | | $ | 9,575,000 | |
Goodwill acquired during 2003 | | | 16,000 | | | | 250,000 | | | 266,000 | |
| | |
|
|
| |
|
| |
|
|
|
Balance as of June 30, 2003 | | $ | 5,759,000 | | | $ | 4,082,000 | | $ | 9,841,000 | |
Goodwill acquired during 2004 | | | 132,000 | | | | 177,000 | | | 309,000 | |
ChannelMax impairment | | | (172,000 | ) | | | — | | | (172,000 | ) |
| | |
|
|
| |
|
| |
|
|
|
Balance as of June 30, 2004 | | $ | 5,719,000 | | | $ | 4,259,000 | | $ | 9,978,000 | |
| | |
|
|
| |
|
| |
|
|
|
Included within other assets are identifiable intangible assets as follows:
| | | | | | | | | | | | | | | | | | |
| | | As of June 30, 2004
| | As of June 30, 2003
|
| | | Gross
Carrying
Amount
| | Accumulated
Amortization
| | Net
Book
Value
| | Gross
Carrying
Amount
| | Accumulated
Amortization
| | Net
Book
Value
|
Amortized intangible assets: | | | | | | | | | | | | | | | | | | |
Customer lists | | $ | 338,000 | | $ | 167,000 | | $ | 171,000 | | $ | 338,000 | | $ | 98,000 | | $ | 240,000 |
Non-compete agreements | | | 425,000 | | | 250,000 | | | 175,000 | | | 132,000 | | | 28,000 | | | 104,000 |
| | |
|
| |
|
| |
|
| |
|
| |
|
| |
|
|
Total | | $ | 763,000 | | $ | 417,000 | | $ | 346,000 | | $ | 470,000 | | $ | 126,000 | | $ | 344,000 |
| | |
|
| |
|
| |
|
| |
|
| |
|
| |
|
|
The customer lists are amortized using the straight-line method over a period of 5 years. The non-compete agreements are amortized over their expected life. Amortization expense for the years ended June 30, 2004, 2003 and 2002 was $314,000, $115,000 and $27,000, respectively. Amortization expense for fiscal years 2005, 2006 and 2007 is estimated to be approximately $242,000, $67,000 and $35,000, respectively.
64
SCANSOURCE, INC. AND SUBSIDIARIES
NOTES TO CONSOLIDATED FINANCIAL STATEMENTS—(Continued)
For the Three Years Ended June 30, 2004
(11) Segment Information
The Company is a leading distributor of specialty technology products, providing value-added distribution sales to resellers in the specialty technology markets. Based on geographic location, the Company has two segments for distribution of specialty technology products. The measure of segment profit is income from operations, and the accounting policies of the segments are the same as those described in Note 2. Beginning with the first quarter of fiscal 2004, the ChannelMax segment has been restructured into the North American distribution segment. Prior period information has been reclassified to include ChannelMax in the North American distribution segment to reflect this restructuring.
North American Distribution
North American distribution offers products for sale in three primary categories: (i) AIDC and POS equipment sold by the ScanSource sales unit, (ii) voice, data and converged communications equipment sold by the CatalystTelecom sales unit and (iii) voice, data and converged communications products sold by the Paracon sales unit. These products are sold to more than 11,000 resellers and integrators of technology products that are geographically disbursed over the United States and Canada in a pattern that mirrors population concentration. No single account represented more than 6% of the Company’s consolidated net sales during the fiscal years ended June 30, 2004 and 2003.
International Distribution
The international distribution segment sells to two geographic areas, Latin America (including Mexico) and Europe, and offers AIDC and POS equipment to more than 4,000 resellers and integrators of technology products. This segment began during fiscal 2002 with the Company’s purchase of a majority interest in Netpoint (see Note 12) and the start-up of the Company’s European operations. Of this segment’s customers, no single account represented more than 1% of the Company’s consolidated net sales during the fiscal years ended June 30, 2004 and 2003.
The Company evaluates segment performance based on operating income. Inter-segment sales consist of sales by the North American distribution segment to the international distribution segment. All inter-segment revenues and profits have been eliminated in the accompanying consolidated financial statements.
SCANSOURCE 65
SCANSOURCE, INC. AND SUBSIDIARIES
NOTES TO CONSOLIDATED FINANCIAL STATEMENTS—(Continued)
For the Three Years Ended June 30, 2004
Selected financial information for each business unit are presented below:
| | | | | | | | | | | | |
| | | 2004
| | | 2003
| | | 2002
| |
Sales: | | | | | | | | | | | | |
North American distribution | | $ | 1,087,126,000 | | | $ | 930,267,000 | | | $ | 823,858,000 | |
International distribution | | | 116,278,000 | | | | 68,553,000 | | | | 20,584,000 | |
Less intersegment sales | | | (11,314,000 | ) | | | (7,626,000 | ) | | | (2,555,000 | ) |
| | |
|
|
| |
|
|
| |
|
|
|
| | | $ | 1,192,090,000 | | | $ | 991,194,000 | | | $ | 841,887,000 | |
| | |
|
|
| |
|
|
| |
|
|
|
Depreciation and amortization: | | | | | | | | | | | | |
North American distribution | | $ | 4,721,000 | | | $ | 4,728,000 | | | $ | 4,530,000 | |
International distribution | | | 629,000 | | | | 296,000 | | | | 125,000 | |
| | |
|
|
| |
|
|
| |
|
|
|
| | | $ | 5,350,000 | | | $ | 5,024,000 | | | $ | 4,655,000 | |
| | |
|
|
| |
|
|
| |
|
|
|
Operating income: | | | | | | | | | | | | |
North American distribution | | $ | 47,538,000 | | | $ | 40,729,000 | | | $ | 32,014,000 | |
International distribution | | | 1,718,000 | | | | (205,000 | ) | | | (204,000 | ) |
| | |
|
|
| |
|
|
| |
|
|
|
| | | $ | 49,256,000 | | | $ | 40,524,000 | | | $ | 31,810,000 | |
| | |
|
|
| |
|
|
| |
|
|
|
Income tax expense (benefit): | | | | | | | | | | | | |
North American distribution | | $ | 18,138,000 | | | $ | 15,877,000 | | | $ | 11,113,000 | |
International distribution | | | 562,000 | | | | 173,000 | | | | 155,000 | |
| | |
|
|
| |
|
|
| |
|
|
|
| | | $ | 18,700,000 | | | $ | 16,050,000 | | | $ | 11,268,000 | |
| | |
|
|
| |
|
|
| |
|
|
|
Assets: | | | | | | | | | | | | |
North American distribution | | $ | 373,101,000 | | | $ | 312,285,000 | | | $ | 334,244,000 | |
International distribution | | | 40,091,000 | | | | 32,062,000 | | | | 24,788,000 | |
| | |
|
|
| |
|
|
| |
|
|
|
| | | $ | 413,192,000 | | | $ | 344,347,000 | | | $ | 359,032,000 | |
| | |
|
|
| |
|
|
| |
|
|
|
Capital expenditures: | | | | | | | | | | | | |
North American distribution | | $ | 2,057,000 | | | $ | 5,693,000 | | | $ | 8,294,000 | |
International distribution | | | 427,000 | | | | 631,000 | | | | 226,000 | |
| | |
|
|
| |
|
|
| |
|
|
|
| | | $ | 2,484,000 | | | $ | 6,324,000 | | | $ | 8,520,000 | |
| | |
|
|
| |
|
|
| |
|
|
|
66
SCANSOURCE, INC. AND SUBSIDIARIES
NOTES TO CONSOLIDATED FINANCIAL STATEMENTS—(Continued)
For the Three Years Ended June 30, 2004
(12) Acquisitions
North American Distribution
On July 27, 2001, the Company’s North American distribution segment purchased the operating assets of Positive ID Wholesale, (“Positive ID”) a division of Azerty, Inc., a subsidiary of United Stationers. Positive ID was a distributor of automatic information and data capture products for whom the Company paid approximately $14.7 million in cash. The acquisition allowed the Company to reach additional customers and added sales and technical support employees in a new Buffalo, New York sales office. The Company’s purchase price to obtain this additional domestic market share and technical support exceeded the fair value of the net assets acquired. The acquisition was accounted for by the purchase method of accounting and accordingly, the operating results have been included in the Company’s consolidated results of operations from the date of acquisition. The purchase price was allocated to the fair value of net assets acquired, principally accounts receivable and inventories, and approximately $4.1 million of goodwill resulted from the acquisition.
On September 28, 2001, the Company purchased 52% of the common stock of OUI, a provider of services to the telephone reseller market, for approximately $524,000 in cash and assumed certain liabilities. The acquisition was accounted for by the purchase method of accounting. Operating results have been included in the Company’s consolidated results of operations from the date of acquisition. The acquisition allowed the Company to provide training, installation and programming services to its telephone reseller customers. The purchase price was allocated to the fair value of the net assets acquired, and approximately $383,000 of goodwill resulted from the acquisition. The Company obtained an additional 12% of the common stock of OUI for an insignificant amount effective July 1, 2002 and an additional 12% for approximately $97,000 effective August 15, 2003. The Company also has a commitment to purchase the remaining 24% of the common stock at a pre-determined multiple of pre-tax earnings over the next two years. Pro forma financial information is not provided in the table below because the total revenues from this acquisition were less than 1% of total Company revenue.
International Distribution
On November 9, 2001, the Company’s international distribution segment purchased 52% of the common stock of Netpoint, a Miami-based distributor of AIDC and POS equipment to the Latin American marketplace. The acquisition added new employees and provided geographic expansion for the Company’s business into Latin America. The Company’s purchase price exceeded the fair value of the net assets acquired. The Company paid approximately $2.6 million in cash and assumed certain liabilities. The acquisition was accounted for by the purchase method of accounting. Operating results have been included in the Company’s consolidated results of operations from the date of acquisition. The purchase price was allocated to the fair value of net assets acquired, principally accounts receivable and inventories, and approximately
SCANSOURCE 67
SCANSOURCE, INC. AND SUBSIDIARIES
NOTES TO CONSOLIDATED FINANCIAL STATEMENTS—(Continued)
For the Three Years Ended June 30, 2004
$1.6 million of goodwill resulted from the acquisition. The Company purchased an additional 8% of the common stock of Netpoint for approximately $400,000 effective July 1, 2002 and an additional 8% for approximately $412,000 effective October 1, 2003. The Company has a commitment to purchase the remaining 32% of the common stock at a predetermined multiple of pre-tax earnings over the next four years.
On May 7, 2002, the Company’s international distribution segment purchased 100% of the shares of ABC Technology Distribution, Ltd., an AIDC and POS distributor based in the United Kingdom, for approximately $2.7 million in cash and assumed certain liabilities. The acquisition allowed the Company to expand its European customer base and to add employees and an office in the United Kingdom, furthering the Company’s expansion of its European operations. The Company’s purchase price exceeded the fair value of the net assets acquired. The acquisition was accounted for by the purchase method of accounting. Operating results have been included in the Company’s consolidated results of operations from the date of the acquisition. The purchase price was allocated to the fair value of net assets acquired, principally accounts receivable and inventory, and approximately $2.2 million of goodwill resulted from the acquisition.
The following unaudited pro-forma financial information shows the results of operations of the Company as though the acquisitions noted above had occurred as of July 1, 2001. The unaudited pro forma financial information presented below does not purport to be indicative of the results of operations had the acquisitions been consummated as of July 1, 2001 or of the future results of operations of the combined businesses. The financial statements for the year ended June 30, 2004 and 2003 include the results of operations of the acquisitions.
| | | |
| | | 2002
|
| | | (unaudited) |
Net sales | | $ | 869,793,000 |
Income before extraordinary gain | | $ | 19,575,000 |
Net income | | $ | 20,404,000 |
Net income per common share, basic: | | | |
Income before extraordinary gain | | $ | 1.70 |
Net income | | $ | 1.77 |
Net income per common share, assuming dilution: | | | |
Income before extraordinary gain | | $ | 1.58 |
Net income | | $ | 1.64 |
68
SCANSOURCE, INC. AND SUBSIDIARIES
NOTES TO CONSOLIDATED FINANCIAL STATEMENTS—(Continued)
For the Three Years Ended June 30, 2004
For the above acquisitions, the estimated total fair values of the assets acquired and liabilities assumed at the dates of the acquisitions were as follows:
| | | | |
Current assets | | $ | 28,678,000 | |
Property and equipment | | | 1,187,000 | |
Other assets | | | 42,000 | |
Intangible assets | | | 337,000 | |
Goodwill | | | 8,298,000 | |
| | |
|
|
|
Total assets acquired | | | 38,542,000 | |
Current liabilities assumed | | | (16,754,000 | ) |
Minority interest in net assets | | | (1,133,000 | ) |
| | |
|
|
|
Net assets acquired | | $ | 20,655,000 | |
| | |
|
|
|
(13) Related Party Transactions
During fiscal year 2004 and 2003, the Company made sales of $2.4 million and $2.2 million, respectively, to companies affiliated with the minority shareholder of the Netpoint subsidiary. At June 30, 2004 and 2003, accounts receivable from these companies totaled $78,000 and $148,000, respectively.
At June 30, 2003, the minority shareholders of the OUI subsidiary owed the Company approximately $206,000, in the form of a note, in connection with an adjustment to the purchase price. The note is payable in thirty-six monthly installments and matures on October 31, 2005. Interest on the note is 2.01% per annum. The holders of the note are allowed to prepay the note in whole or part, without premium or penalty. At June 30, 2004, the balance of this note was $57,000.
(14) Special Charges
The Company incurred special charges of $2.3 million during the quarter ended September 30, 2003 related to the restructuring of the ChannelMax business segment into the North American distribution segment. Effective July 1, 2003, the Company reassigned the ChannelMax segment to become a part of the North American distribution segment. The Company consolidated the information services and operational staff into the Company’s corporate group. These charges primarily consisted of costs associated with employee severance for 9 employees of the operations management and programming groups and ChannelMax option settlement associated with the segment. These charges are included in operating expenses on the Company’s Consolidated Income Statements.
SCANSOURCE 69
SCANSOURCE, INC. AND SUBSIDIARIES
NOTES TO CONSOLIDATED FINANCIAL STATEMENTS—(Continued)
For the Three Years Ended June 30, 2004
(15) Subsequent Events
On July 16, 2004, the Company entered into a new $100 million multi-currency revolving credit facility with its bank group extending to July 31, 2008. This new facility has an accordion feature that allows the Company to increase the revolving credit line up to an additional $50 million, the first $30 million of which is committed with the existing bank group and the remaining $20 million is subject to syndication. The facility bears interest at the 30-day LIBOR rate of interest plus a rate varying from .75% to 1.75% tied to the Company’s funded debt to EBITDA ratio ranging from 0.00:1.00 to 2.50:1.00 and a fixed charge coverage ratio of not less than 1.50:1. In addition, the agreement contains other restrictive financial covenants, including among other things, total liabilities to tangible net worth ratio and capital expenditure limits. The effective interest rate at July 19, 2004 was 2.11%.
On August 27, 2004, Netpoint, doing business as ScanSource Latin America, increased its asset-based line of credit with a bank by $400,000 to $1 million. The facility matures on August 27, 2005 and is collateralized by accounts receivable and eligible inventory. The facility contains a restrictive covenant which requires an average deposit of $50,000 at the bank. The effective interest rate at August 27, 2004 was the bank’s prime rate minus one percent, which was 3.50%.
* * * * * * * *
70
MARKET FOR THE REGISTRANT’S COMMON STOCK AND RELATED SHAREHOLDER MATTERS
The Company’s Common Stock is quoted on The Nasdaq National Market (“NASDAQ”) under the symbol “SCSC.” The Company has never paid or declared a cash dividend since inception and the Board of Directors does not intend to institute a cash dividend policy in the foreseeable future. Under the terms of the Company’s revolving credit facility, the payment of cash dividends is prohibited. Effective January 28, 2003, the Board of Directors approved a two-for-one stock split of the common stock effected in the form of a 100% common stock dividend. The effect of the stock split has been recognized retroactively in all share and per share data. On September 1, 2004, there were approximately 14,000 recorded and known beneficial holders of Common Stock. The following table sets forth, for the periods indicated, the high and low closing prices of the Common Stock on the NASDAQ Stock Market.
| | | | | | |
| | | High
| | Low
|
Fiscal Year 2004 |
First quarter | | $ | 39.10 | | $ | 26.38 |
Second quarter | | | 47.50 | | | 36.10 |
Third quarter | | | 55.81 | | | 43.05 |
Fourth quarter | | | 60.14 | | | 47.31 |
Fiscal Year 2003 |
First quarter | | $ | 32.91 | | $ | 25.00 |
Second quarter | | | 38.25 | | | 21.82 |
Third quarter | | | 30.74 | | | 17.11 |
Fourth quarter | | | 29.60 | | | 18.27 |
SCANSOURCE 71

BOARD OF DIRECTORS
Steven H. Owings
Chairman
Michael L. Baur
President and Chief Executive Officer
Steven R. Fischer
President
North Fork Business Capital Corporation
James G. Foody
Business Consultant
John P. Reilly
Keltic Financial Services LLC
OFFICERS
Steven H. Owings
Chairman
Michael L. Baur
President and Chief Executive Officer
Richard P. Cleys
Vice President and Chief Financial Officer
Jeffery A. Bryson
Vice President – Administration and Investor Relations
R. Scott Benbenek
Executive Vice President – Corporate Operations
Andrea D. Meade
Executive Vice President – Corporate Operations
Gregory B. Dixon
Chief Technology Officer
Robert S. McLain, Jr.
Vice President – Marketing
John K. Black
President – Catalyst Telecom
Clayton D. Sorensen
President – Paracon
Elias Botbol
President – ScanSource Latin America
Xavier Cartiaux
Managing Director – ScanSource Europe
Peter J. O’Brien
Vice President – Partner Services
Linda B. Davis
Treasurer
STOCK LISTING
The Company’s Stock is traded on The Nasdaq
National Market under the symbol SCSC.
GENERAL COUNSEL
Alston & Bird LLP
Charlotte, North Carolina
TRANSFER AGENT
Wachovia Bank, N.A.
Charlotte, North Carolina
INDEPENDENT ACCOUNTANTS
Ernst & Young LLP
Greenville, South Carolina
SHAREHOLDER INQUIRIES
ScanSource, Inc., welcomes inquiries from its shareholders
and other interested investors. For further information or
a copy of SEC form 10K, contact our Investor Relations
Department at 800.944.2439, ext. 4375, or by e-mail at
investor@scansource.com.
ANNUAL MEETING
The annual meeting of shareholders of the Company
will be held at 10:00 a.m. on December 2, 2004, at the
Hyatt Regency, Greenville, South Carolina, 220 N. Main St.
CORPORATE HEADQUARTERS
Greenville, South Carolina
864.288.2432
SALES OFFICES
Bellingham,Washington
800.830.2422
Richmond, British Columbia
604.303.9711
Buffalo, New York
800.944.2432
Phoenix, Arizona
800.790.2029
Norcross, Georgia
800.944.2432
Miami, Florida
877.280.0840
Mexico City, Mexico
011.52.555.540.6111
Brussels, Belgium
011.32.4.246.7845
Hull, United Kingdom
011.44.1482.820200
Olivet, France
011.33.238.2531.90
Bad Homburg, Germany
011.49.6172.17104.0

ScanSource, Inc 6 Logue Court Greenville, SC 29615 800.944.2432 scansource.com