UNITED STATES
SECURITIES AND EXCHANGE COMMISSION
Washington, D.C. 20549
FORM N-CSR
CERTIFIED SHAREHOLDER REPORT OF REGISTERED
MANAGEMENT INVESTMENT COMPANIES
Investment Company Act file number | 811-08360 |
|
GUINNESS ATKINSON FUNDS |
(Exact name of registrant as specified in charter) |
|
21550 Oxnard Street, Suite 850 Woodland Hills, CA | | 91367 |
(Address of principal executive offices) | | (Zip code) |
|
James J. Atkinson, Jr. 21550 Oxnard Street, Suite 850 Woodland Hills, CA 91367 |
(Name and address of agent for service) |
|
Registrant’s telephone number, including area code: | (800-915-6566) | |
|
Date of fiscal year end: | December 31 | |
|
Date of reporting period: | December 31, 2014 | |
| | | | | | | | |
Item 1. Reports to Stockholders.
The registrant’s annual report transmitted to shareholders pursuant to Rule 30e-1 under the Investment Company Act of 1940, as amended (the “Investment Company Act”), is as follows:
2
Guinness AtkinsonTM Funds
Annual Report
December 31, 2014
TABLE OF CONTENTS
| | 5 | | | Letter to Shareholders | |
| | 7 | | | Expense Example | |
| | 8 | | | Alternative Energy Fund | |
| | 17 | | �� | Asia Focus Fund | |
| | 24 | | | Asia Pacific Dividend Builder Fund | |
| | 31 | | | China & Hong Kong Fund | |
| | 38 | | | Dividend Builder Fund | |
| | 46 | | | Global Energy Fund | |
| | 55 | | | Global Innovators Fund | |
| | 62 | | | Renminbi Yuan & Bond Fund | |
| | 69 | | | Statements of Assets and Liabilities | |
| | 71 | | | Statements of Operations | |
| | 73 | | | Statements of Changes in Net Assets | |
| | 76 | | | Financial Highlights | |
| | 84 | | | Notes to Financial Statements | |
| | 98 | | | Report of Independent Registered Public Accounting Firm | |
| | 99 | | | Trustee and Officer Information | |
| | 102 | | | Privacy Notice | |
| | 103 | | | Guinness Atkinson Funds Information | |
3
The table below provides total return data for each of the Funds over the one, three, five, ten and from inception periods through December 31, 2014. Also included in the table is the expense ratio data from the most recent prospectus dated May 1, 2014.
Fund (inception date) | | 1-year | | 3-year | | 5-year | | 10-year | | From Inception | | Expense Ratio | |
Alternative Energy Fund (March 31, 2006) | | | -14.29 | % | | | 5.50 | % | | | -12.02 | % | | | — | | | | -12.44 | % | | | 2.13 | % gross; 2.00% net† | |
Asia Focus Fund (April 29, 1996) | | | 1.91 | % | | | 1.91 | % | | | -0.21 | % | | | 6.55 | % | | | 2.55 | % | | | 1.88 | % | |
Asia Pacific Dividend Builder Fund (March 31, 2006) | | | 9.04 | % | | | 9.66 | % | | | 6.98 | % | | | — | | | | 5.19 | % | | | 3.56 | % gross; 1.98% net† | |
China & Hong Kong Fund (June 30, 1994) | | | -1.97 | % | | | 6.09 | % | | | -0.03 | % | | | 7.97 | % | | | 7.19 | % | | | 1.54 | % | |
Global Energy Fund (June 30, 2004) | | | -19.63 | % | | | 1.18 | % | | | 0.97 | % | | | 8.09 | % | | | 9.75 | % | | | 1.35 | % | |
Global Innovators Fund (December 15, 1998) | | | 12.55 | % | | | 25.16 | % | | | 16.49 | % | | | 10.58 | % | | | 7.43 | % | | | 1.47 | % | |
Dividend Builder Fund (March 30, 2012) | | | 4.99 | % | | | — | | | | — | | | | — | | | | 13.86 | % | | | 5.47 | % gross; 0.68% net† | |
Renminbi Yuan & Bond Fund (June 30, 2011) | | | -0.92 | % | | | 2.71 | % | | | — | | | | — | | | | 2.36 | % | | | 0.97 | % gross; 0.90% net† | |
Periods of greater than one year are average annualized returns; one year and shorter period returns are actual returns. All returns are for the periods ending December 31, 2014.
Performance data quoted represents past performance and does not guarantee future results. The investment return and principal value of an investment will fluctuate so that an investor's shares, when redeemed, may be worth more or less than the original cost. Current performance of the Funds may be lower or higher than the performance quoted. Performance data current to the most recent month end may be obtained by visiting www.gafunds.com, or calling (800) 915-6565.
Each of the Asia Focus Fund, the Asia Pacific Dividend Builder Fund, the China & Hong Kong Fund, and the Renminbi Yuan & Bond Fund imposes a 2% redemption fee on shares held less than 30 days. Performance data quoted does not reflect this fee. If it had, total return would be lower.
Expense ratios are from the most recent prospectus (dated May 1, 2014) and are from the most recent audited financials (period ending December 31, 2013) at the time that prospectus was completed.
†All of the Guinness Atkinson Funds have an expense cap in place and the advisor is contractually obligated to cap the Funds' total expenses at least through June 30, 2015. For the Inflation Managed Dividend Fund, the advisor is contractually obligated to cap total expenses at least through March 31, 2016.
4
Dear Guinness Atkinson Funds Shareholders,
This past year was a bit of good news/bad news for the Guinness Atkinson Funds as exactly half of the Fund family produced positive returns and half produced negative returns. The standout performer for 2014 among the Guinness Atkinson Funds was the Global Innovators Fund, which produced a total return of 12.55% for the year. The Asia Pacific Dividend Builder (9.04%), the Dividend Builder Fund (4.99%), and the Asia Focus Fund (1.91%) all produced positive returns for the year. The Renminbi Yuan & Bond Fund (-0.92%), the China & Hong Kong Fund (-1.97%), the Alternative Energy Fund (-14.29%) and the Global Energy Fund (-19.63) all produced negative returns for the year.
As mentioned, the Global Innovators Fund was the top performing Guinness Atkinson Fund, but in fact it is the top performing Fund based on total return within its Lipper Category over all of the time periods shown in the table.
Time period ending December 31, 2014 | | Rank | | Number of funds in Lipper
Global Multi Cap Growth
Category | |
One year | | | 1 | | | | 500 | | |
Three year | | | 1 | | | | 466 | | |
Five year | | | 1 | | | | 399 | | |
Ten year | | | 1 | | | | 278 | | |
We believe this performance is in part due to the underlying assumption for the Fund, specifically that innovative companies outperform in the market place, satisfy consumers and, in the process, produce superior financial results and, ultimately superior stock market performance. In short, we believe that innovation matters.
We've written in past letters about the state of the human condition and we think it is worth a few words in this letter to repeat our view that over the long term it is difficult to argue that the human condition is as good as it has ever been and continues to improve. It may be difficult to square this factual view with the daily news coverage which seems to be increasingly focused on the negative. This negativity can lead to the conclusion that life on the planet and the human condition is extremely dire. But, in fact, that is not the case. Yes, we know there are any host of negative trends and circumstances around the globe but that doesn't change the facts regarding worldwide per capita GDP (rising and never higher than today); global longevity (rising and never higher than today); literacy rates (rising and never higher than today); access to information and communication (at all-time highs and rising) etc. We continue to repeat this theme because we find it hard to understand how long-term investors can be successful without a factually based world view. Of course events ebb and flow and there are short-term negative as well as positive influences and the markets tend to move up and down in the short-term. But the long-term story has been extremely clear: the human condition has improved massively over the last decade, quarter century, century and last three centuries. If you're a long-term investor (which is our sincere hope) we believe it is helpful to have a world view that is consistent with the facts.
Our investment team has provided a detailed commentary for each of the Guinness Atkinson Funds adjacent to the Fund's financial results.
As usual, we appreciate the confidence you have placed in us and our management team and look forward to what will hopefully be a great 2015.
We encourage you to visit gafunds.com for the latest news and announcements on the Guinness Atkinson Funds.
Sincerely,

| | 
| |
Timothy Guinness | | James Atkinson | |
Lipper Analytical Services, Inc. is an independent mutual fund research and rating service. Each Lipper average represents a universe of Funds with similar investment objectives. Rankings for the period shown are based on Fund total returns with dividends and distributions reinvested and do not reflect sales charges.
5
Mutual fund investing involves risk. Principal loss is possible. The Funds invest in foreign securities, which involves greater volatility and political, economic and currency risks and differences in accounting methods. These risks are greater for emerging markets countries. Non-diversified Funds' assets may be concentrated in fewer individual holdings than diversified funds. Therefore, these Funds are more exposed to individual stock volatility than diversified funds. Investments in smaller companies involve additional risks such as limited liquidity and greater volatility. Investments in debt securities typically decrease in value when interest rates rise, which can be greater for longer-term debt securities. Investments in derivatives involve risks different from, and in certain cases, greater than the risks presented by traditional investments. Investments focused in a single geographic region may be exposed to greater risk than investments diversified among various geographies. Investments focused on the energy sector may be exposed to greater risk than an investments diversified among various sectors.
6
Expense Examples (Unaudited)
As a shareholder of the Funds, you incur two types of costs: (1) redemption fees; and (2) ongoing costs, including advisory fees and other Fund expenses. The examples below are intended to help you understand your ongoing costs (in dollars) of investing in the Funds and to compare these costs with the ongoing costs of investing in other mutual funds.
The examples are based on an investment of $1,000 invested at the beginning of the period shown and held for the entire period from July 1, 2014 to December 31, 2014.
Actual Expenses
For each Fund, the first line of the table below provides information about actual account values and actual expenses. You may use the information in this line, together with the amount you invested, to estimate the expenses that you paid over the period. Simply divide your account value by $1,000 (for example, an $8,600 account value divided by $1,000 = 8.6), then multiply the result by the number in the first line under the heading entitled "Expenses Paid during Period" to estimate the expenses you paid on your account during this period.
Hypothetical Example for Comparison Purposes
For each Fund, the second line of the table below provides information about hypothetical account values and hypothetical expenses based on the Fund's actual expense ratios and an assumed rate of return of 5% per year before expenses, which is not the Fund's actual return. The hypothetical account values and expenses may not be used to estimate the actual ending account balance or expenses you paid for the period. You may use this information to compare the ongoing costs of investing in the Fund and other funds. To do so, compare this 5% hypothetical example with the 5% hypothetical examples that appear in the shareholder reports of the other funds.
Please note that the expenses shown in the table are meant to highlight your ongoing costs only and do not reflect any redemption fees. Therefore, the second line for each Fund of the table is useful in comparing ongoing costs only, and will not help you determine the relative total costs of owning different funds. In addition, if these redemption fees were included, your costs would have been higher.
| | | Beginning
Account
Value
(07/01/14) | | Ending
Account
Value
(12/31/14) | | Expenses Paid
During Period*
(07/01/14 to
12/31/14) | | Expense Ratios
During Period*
(07/01/14 to
12/31/14) | |
Guinness Atkinson Alternative Energy Fund Actual | | $ | 1,000.00 | | | $ | 765.10 | | | $ | 8.90 | | | | 2.00 | %† | |
Guinness Atkinson Alternative Energy Fund Hypothetical
(5% return before expenses) | | $ | 1,000.00 | | | $ | 1,015.12 | | | $ | 10.16 | | | | 2.00 | %† | |
Guinness Atkinson Asia Focus Fund Actual | | $ | 1,000.00 | | | $ | 962.00 | | | $ | 9.40 | | | | 1.90 | % | |
Guinness Atkinson Asia Focus Fund Hypothetical
(5% return before expenses) | | $ | 1,000.00 | | | $ | 1,015.63 | | | $ | 9.65 | | | | 1.90 | % | |
Guinness Atkinson Asia Pacific Dividend Builder Fund Actual | | $ | 1,000.00 | | | $ | 1,020.00 | | | $ | 10.08 | | | | 1.98 | %† | |
Guinness Atkinson Asia Pacific Dividend Builder Fund Hypothetical
(5% return before expenses) | | $ | 1,000.00 | | | $ | 1,015.22 | | | $ | 10.06 | | | | 1.98 | %† | |
Guinness Atkinson China & Hong Kong Fund Actual | | $ | 1,000.00 | | | $ | 1,000.10 | | | $ | 7.06 | | | | 1.40 | % | |
Guinness Atkinson China & Hong Kong Fund Hypothetical
(5% return before expenses) | | $ | 1,000.00 | | | $ | 1,018.15 | | | $ | 7.12 | | | | 1.40 | % | |
Guinness Atkinson Dividend Builder Fund Actual | | $ | 1,000.00 | | | $ | 973.00 | | | $ | 3.38 | | | | 0.68 | %† | |
Guinness Atkinson Dividend Builder Fund Hypothetical
(5% return before expenses) | | $ | 1,000.00 | | | $ | 1,021.78 | | | $ | 3.47 | | | | 0.68 | %† | |
Guinness Atkinson Global Energy Fund Actual | | $ | 1,000.00 | | | $ | 668.60 | | | $ | 5.55 | | | | 1.32 | % | |
Guinness Atkinson Global Energy Fund Hypothetical
(5% return before expenses) | | $ | 1,000.00 | | | $ | 1,018.55 | | | $ | 6.72 | | | | 1.32 | % | |
Guinness Atkinson Global Innovators Fund Actual | | $ | 1,000.00 | | | $ | 1,019.70 | | | $ | 6.36 | | | | 1.25 | % | |
Guinness Atkinson Global Innovators Fund Hypothetical
(5% return before expenses) | | $ | 1,000.00 | | | $ | 1,018.90 | | | $ | 6.36 | | | | 1.25 | % | |
Guinness Atkinson Renminbi Yuan & Bond Fund Actual | | $ | 1,000.00 | | | $ | 1,001.50 | | | $ | 4.54 | | | | 0.90 | %† | |
Guinness Atkinson Renminbi Yuan & Bond Fund Hypothetical
(5% return before expenses) | | $ | 1,000.00 | | | $ | 1,020.67 | | | $ | 4.58 | | | | 0.90 | %† | |
*Expenses are equal to the Funds' annualized expense ratio as indicated, multiplied by the average account value over the period, multiplied by the number of days in most recent fiscal half-year period (184), then divided by the number of days in the fiscal year (365) (to reflect the one-half year period).
†Net of fee waivers and/or expense reimbursements. If those fee waivers and/or expense reimbursements had not been in effect, the Fund's actual expenses would have been higher.
7
ALTERNATIVE ENERGY FUND for the period ended December 31, 2014
1. Performance
AVERAGE ANNUALIZED TOTAL RETURNS
| | | 1 Year
(Actual) | | 3 Year | | 5 Year | | Since
Inception
(March 31, 2006) | |
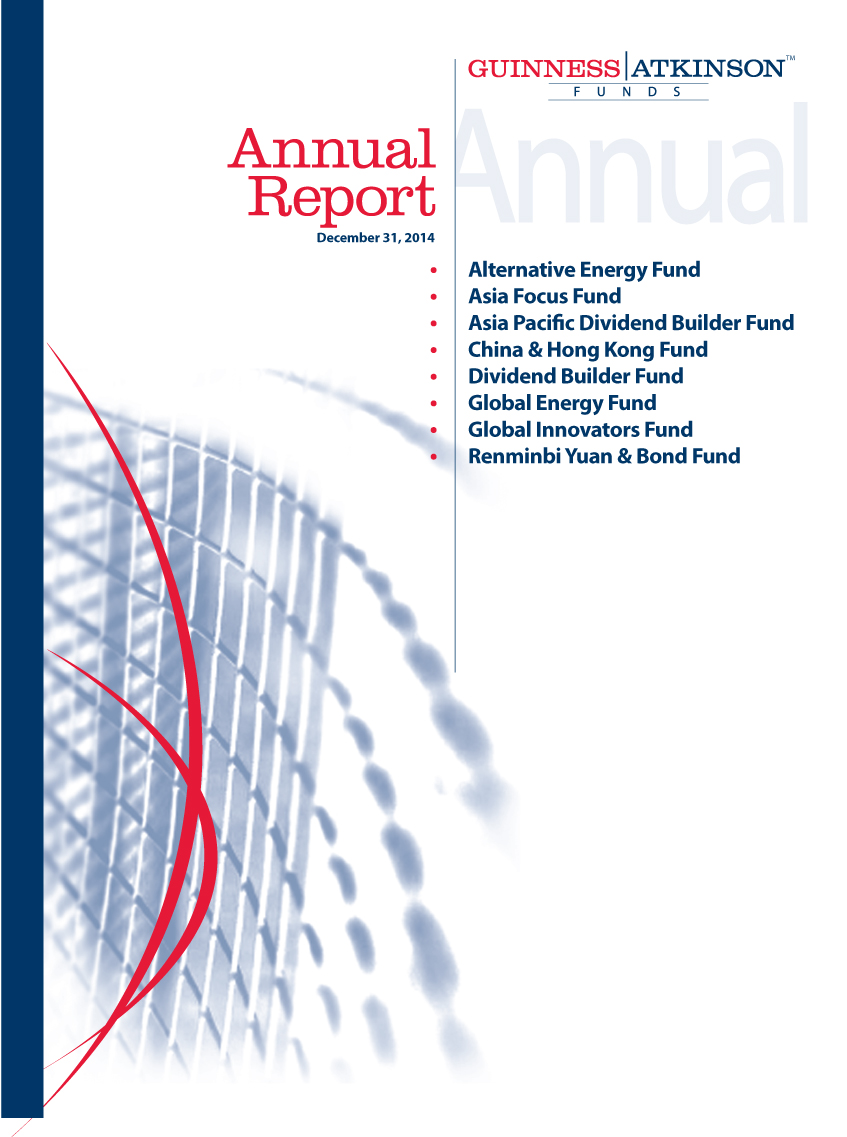
Fund | | | -14.29 | % | | | 5.50 | % | | | -12.02 | % | | | -12.44 | % | |
Benchmark Index: | |
Wilderhill New Energy Global Innovation Index | | | -2.15 | % | | | 13.33 | % | | | -5.07 | % | | | -3.45 | % | |
Wilderhill Clean Energy Index | | | -16.93 | % | | | 2.85 | % | | | -12.49 | % | | | -14.36 | % | |
MSCI World Index | | | 5.62 | % | | | 16.23 | % | | | 10.94 | % | | | 5.76 | % | |
The Fund's expense ratio is 2.13% and net expense ratio is 2.00% per the Summary Prospectus dated May 1, 2014. The Advisor has contractually agreed to waive a portion of its advisory fees and/or reimburse other Fund expenses so that the Fund's ratio of expenses to average daily net assets will not exceed 1.98% (excluding Acquired Fund Fees and Expenses, interest, taxes, dividends on short positions and extraordinary expenses) through at least June 30, 2015. To the extent that the Advisor waives fees, it may seek repayment of a portion or all of such amounts at any time within the three fiscal years after the fiscal year in which such amounts were waived and/or reimbursed, subject to the applicable cap.
Performance data quoted represents past performance and does not guarantee future results. The investment return and principal value of an investment in the Fund will fluctuate so that an investor's shares, when redeemed, may be worth more or less than their original cost. Current performance of the Fund may be lower or higher than the performance quoted. Performance data current to the most recent month end may be obtained by visiting www.gafunds.com, or calling (800) 915-6565.
The Guinness Atkinson Alternative Energy Fund was down 14.29% in 2014. This compared to a fall in the Wilderhill New Energy Global Innovation Index of 2.15% and in the Wilderhill Clean Energy Index of 16.93%. The Fund therefore performed between its benchmark indices and along with its sector underperformed the MSCI World Index in 2014.
All the sub sectors invested in contributed to the underperformance in the year. The smaller wind utilities struggled with weak operating conditions for Greentech and a debt refinancing suffered by Theolia. Poor wind conditions held the Chinese wind utilities back and the weak Euro detracted from otherwise good performance from the larger cap wind utilities. The sale of the wind turbine holdings were notable bright points in the year.
The solar module manufacturers were weak over the year, partly as a result of the falling oil price and partly as a result of a perception of weaker demand than expected in China. The sale of SMA Solar and the holdings in Enphase and China Singyes were positive contributors.
The Fund's Peruvian ethanol investment, Maple Energy was sold at a loss owing to underperformance in ramping up the assets, as was the investment in Canadian Lithium mining company RB Energy.
Overall, the equal weighting of the portfolio has been effective in providing some cushion to specific stock issues.
8
2. Portfolio
Sector | | % of Assets | |
Solar | | | 26.64 | % | |
Wind | | | 44.46 | % | |
Efficiency | | | 10.00 | % | |
Geothermal | | | 3.02 | % | |
Hydro | | | 10.97 | % | |
Biomass Energy | | | 3.25 | % | |
Cash | | | 1.66 | % | |
| | | | 100.00 | % | |
Domicile | | % of Assets | |
Europe | | | 35.80 | % | |
North America | | | 21.00 | % | |
Asia | | | 35.19 | % | |
Latin America | | | 6.33 | % | |
Australasia | | | 0.00 | % | |
Cash | | | 1.68 | % | |
| | | | 100.00 | % | |
* region is as per company domicile.
The portfolio is quite concentrated in the wind and solar sectors, with 26.64% in solar and 44.46% in Wind. We believe these sectors have the best long-term growth potential of the alternative energy space.
Within the solar sector, we are invested in a mix of low cost Asian solar cell and module manufacturers, an installer and the leading manufacturer of microinverters.
For our wind exposure we are invested now mainly in wind farm developers and owners, with one investment in a small wind turbine manufacturer. The split is 22.03% in large wind utilities, 16.92% in small utilities and 4.01% in wind turbine manufacturers. In the long run there are good potential returns both from owning wind assets as the value in operating assets and pipelines of potential assets becomes recognized as per the valuations of the yieldcos.
Further investments are in a hydroelectric power producer in Latin America, Austrian and Italian hydropower utilities, a ground source heat pump company, and a Chinese metering company.
The Fund has 35.80% of its holdings in companies domiciled in Europe. North America accounts for 21.00% of the Fund. The Fund's 41.53% of emerging markets holdings is predominantly held in Chinese and Hong Kong domiciled companies, which account for 31.57% of the portfolio.
Mkt Cap $m | | Positions | | % of Assets | |
>1000 | | | 17 | | | | 49.84 | % | |
500-1000 | | | 4 | | | | 12.35 | % | |
250-500 | | | 2 | | | | 6.00 | % | |
100-250 | | | 2 | | | | 5.05 | % | |
50-100 | | | 6 | | | | 20.78 | % | |
<50 | | | 1 | | | | 4.31 | % | |
9
Position size | | Positions | | % of Assets | |
Full | | | 30 | | | | 101.96 | % | |
Half | | | 0 | | | | 0.00 | % | |
Research | | | 1 | | | | 0.45 | % | |
The liquidity of the Fund has improved slightly as the percentage of the Fund in companies with a market capitalization over US$1,000 million is 49.84% at the end of 2014. One holding is now in a company with a market capitalisation lower than $50 million – Carmanah Technologies. The Fund now has thirty full units and one research holding.
3. Activity
The Fund acquired a position in Mytrah Energy in the first quarter. Mytrah is an Indian wind utility with a strong development pipeline. The Fund's position in SMA Solar, the German solar inverter manufacturer was sold having performed very well and has been replaced by a position in Northern Power Systems, a manufacturer of small wind turbines.
As a result of the takeover bid from Nibe, the Fund has sold its position in Waterfurnace and replaced it with a position in a small Italian hydroelectric company called Iniziative Bresciane. While we have some concerns about the subsidy regime in Italy given Italy's weaker economy, we believe that small hydro installations will continue to be supported as the subsidy levels are amongst the lowest for any technology and installations are expected to last for 100 years or more. This company has a portfolio of 16 hydro installations today and are proposing to increase their portfolio with the capital they raised in their IPO.
In the third quarter the wind turbine manufacturing holdings – Vestas, Nordex and Gamesa were sold as valuations appeared stretched. We expect solid levels of wind installations and margin improvements, but not enough to merit premium valuations. The US market remains a risk and the Chinese market is difficult to penetrate for international players, leaving the main prospects for growth in other emerging markets. We expect these emerging markets to develop but not at high turbine prices.
The three holdings were replaced by positions in Enphase, Canadian Solar and Centrotec Sustainable. Enphase is the leading solar microinverter manufacturer. Microinverters improve solar installation performance and robustness and have the potential to become cheaper than conventional inverters. We are excited about their prospects. Canadian Solar is a leading Chinese module manufacturer who has been early to recognize the opportunity in becoming an installer and developer of projects while maintaining a strong cost position and balance sheet. Centrotec is a German heating system installer who is well placed for pending changes to German rules that will require boilers to be replaced after 30 years. The economics of installing their equipment is compelling without subsidies.
We have sold our holding in Itron and replaced it with a position in a leading Chinese metering provider – Wasion Group Holdings who traded on attractive valuations multiples.
We have sold the Fund's holding in RB Energy, the lithium mining company as it failed to hit production targets and after the quarter end the Fund's position in Maple Energy who faced similar problems. We have replaced them with a position in Cosan SA, a leading Brazilian biofuels company with less direct ethanol price exposure.
In the fourth quarter, the Theolia refinancing closed which resulted in the acquisition of traded warrants in the stock as well as additional shares acquired in the rights issue.
The overall effect has been to lower the earnings multiple on which the Fund trades and we believe positions the Fund well in the stream of future growth stories.
4. Outlook
After a 2014 where the sector digested the gains of 2013, we believe that the alternative energy sector has the potential to start delivering again for investors. The headwinds and uncertainty facing the sector remains significant but as these headwinds are overcome, the robustness of the sector to external threats is increasing.
There are few in the industry who predicted the fall in the oil price, the shale gas phenomenon in the US, falling wholesale power prices in both Europe and the US and the failure of carbon pricing. While in the long run finite supplies of fossil fuel exists, the unexpected growth in shale gas and oil over the last ten years in the US serve a timely reminder that more of those reserves are
10
likely to be extracted than expected and probably at lower prices. In the medium term, the oil and gas industry is likely to remain cyclical. It is therefore not likely to be rising fossil fuel prices that drive the switch to alternative energy, but the increasing economic competitiveness of alternative energy, with growth supported for energy security, environmental and climate change reasons.
In the US energy security has become less of a concern as a direct result of the increases in oil and gas production. However for much of the rest of the world, energy security concerns remain high. Much of Europe is dependent on Russia for natural gas and the Middle East for oil; Japan has almost no fossil fuel reserves of its own; China and India are dependent on fossil fuel imports to support continuing growth. The current economic problems that Russia is facing as a result of sanctions are not going away and are exacerbated by the low oil price. Saudi Arabia and the Gulf states may be rich enough to sustain a price war for several years, but the economic hardship in countries heavily reliant on oil exports for hard currency is likely to lead to political turmoil and unrest. For this reason the likelihood of political unrest that increases the oil price is significantly higher.
Environmental concerns are today the strongest driver of policy supportive of alternative energy. Pollution problems in China and India are creating a tangible health problem. With pollution alerts keeping residents indoors, fossil fuel emissions are causing a direct reduction in GDP. China has emerged as the strongest supporter of the renewable energy industry. It is already the largest installer annually of wind installations and is forecast to become the world's largest installer of solar installations in 2015 if it has not already done so in 2015. Underpinning that, the majority of solar module manufacturing is now carried out by Chinese companies and its leading wind turbine manufacturers are beginning to produce product that will be viable outside of China at a much lower cost than its international competitors.
Climate change remains an important if secondary driver of alternative policy. Barrack Obama has made climate change policies central to what he would like to achieve over the remainder of his last term in office and despite the best efforts of the Republican Party, climate change is still on the political agenda in the US. Further increases in support are seen in China and India albeit not just for climate change reasons. Policy in Europe has remained steadily in favour of action to address climate change, notwithstanding headline reductions in subsidy levels. However, Australia has taken a major step away from policy driven following the Liberal Party's 2013 election victory and Saudi Arabia has pushed back its targets for solar deployment.
A major development over the last two years has been the emergence of large "yieldcos" as financing vehicles for alternative energy installations. These have a low cost of capital and are providing a more certain home and pricing for plant under development. This is having a knock on effect for developers and for manufacturers who are now competing as developers and as a result stimulating demand. These yieldcos are bringing alternative energy towards the mainstream of energy and we are seeing both manufacturers and utilities respond with yieldco offerings of their own.
Utilities in the meantime are facing growing threats from alternative energy. In Germany, the levels of solar and wind installations have significantly reduced the amount that utilities earn from power plants that provide power to cover peaks in demand and with consumers increasingly generating their own electricity, they are seeing falls in demand for their power. Utilities will have to evolve and embrace these changes or they will not survive.
The long term direction of travel still appears to be towards electrification of the vehicle fleet. Over the next five years there are a large number of electric vehicles due to come to the market at costs that do not make them prohibitive, and increased adoption is likely to see an acceleration in engineering solutions to the charging problems that electric vehicles have. It is important to remember that electricity is much more widely available than petrol/gasoline in terms of number of locations as any building with a connection to the grid can become a "filling" station.
A further part of our vision of the long term future of energy is that we will hopefully be using significantly more energy, more efficiently. Improvements in efficiency can make a meaningful difference to lowering our energy consumption while supporting growing GDP and quality of life. We believe that in the long run rather than being perceived as an expensive source of energy, alternative energy costs will continue to fall over the long term which will enable us to consume more energy for the same cost while supporting higher levels of economic activity and advances in quality of life globally.
The cost of solar, wind, geothermal and hydropower has now reached a point where unsubsidised production of electricity is viable in an increasing number of locations and the costs continue to fall.
The long term outlook for alternative energy remains good. The key drivers remain in place: dwindling fossil fuel supplies; energy security concerns; environmental issues; and climate change. The reduced cost of alternative energy technologies is likely to
11
accelerate the growth of the alternative energy sector. We continue to position the fund to benefit from the long term growth of the sector.

Edward Guinness
The Funds invest in foreign securities which will involve political, economic and currency risks, greater volatility, and differences in accounting methods. The Funds are non-diversified meaning their assets may be concentrated in fewer individual holdings than diversified funds. Therefore, the Funds are more exposed to individual stock volatility than diversified funds. The Funds invest in smaller companies, which will involve additional risks such as limited liquidity and greater volatility.
The Wilderhill New Energy Global Innovation Index (NEX) is a modified dollar weighted index of publicly traded companies, which are active in renewable and low-carbon energy, and which stand to benefit from responses to climate change and energy security concern. The Wilderhill Clean Energy Index (ECO) is a modified equal dollar weighted index comprised of publicly traded companies whose businesses stand to benefit substantially from societal transition toward the use of cleaner energy and conservation. The MSCI World Energy Index is an unmanaged index composed of more than 1,400 stocks listed on exchanges in the U.S., Europe, Canada, Australia, New Zealand, and the Far East. These indices are unmanaged, not available for investment and do not incur expenses.
Yieldcos in the alternative energy sector are companies set up specifically to hold constructed assets, paying out the cashflows from the assets in the form of dividends which provides investors with a yield.
Please refer to the Schedule of Investments for details on fund holdings. Current and future portfolio holdings are subject to risk.
The information provided herein represents the opinion of Guinness Atkinson Management for the period stated and is not intended to be a forecast of future events, a guarantee of future results, nor investment advice. Opinions, fund holdings and sector allocations are subject to change at any time and are not recommendations to buy or sell any security.
12
GUINNESS ATKINSON ALTERNATIVE ENERGY FUND
Growth of $10,000
Average Annual Total Return
Periods Ended December 31, 2014
| One Year | | Five Year | | Since Inception
(03/31/06) | |
| | -14.29 | % | | | -12.02 | % | | | -12.44 | % | |
*Inception date 03/31/06.
Performance data quoted represents past performance and does not guarantee future results. The investment return and principal value of an investment will fluctuate so that an investor's shares, when redeemed, may be worth more or less than their original cost. Current performance of the Fund may be lower or higher than the performance quoted. Performance data current to the most recent month end may be obtained by visiting www.gafunds.com.
Total returns for certain periods reflect a fee waiver in effect and in the absence of this waiver, the total returns would be lower. Returns reflect the reinvestment of distributions made by the Fund, if any. The graph and the performance table above do not reflect the deduction of taxes that a shareholder would pay on Fund distribution or the redemption of Fund shares.
The Wilderhill New Energy Global Innovations Index (NEX) is a modified dollar weighted index of publicly traded companies, which are active in renewable and low-carbon energy, and which stand to benefit from responses to climate change and energy security concern. The Wilderhill Clean Energy Index (ECO) is a modified equal dollar weighted index comprised of publicly traded companies whose businesses stand to benefit substantially from societal transition toward the use of cleaner energy and conservation.
13
FUND HIGHLIGHTS at December 31, 2014
GUINNESS ATKINSON ALTERNATIVE ENERGY FUND
# of Holdings in Portfolio: | | 32 | |
Portfolio Turnover: | | 42.3% | |
% of Stocks in Top 10: | | 39.9% | |
Fund Manager: | | | |
Edward Guinness | | | |
Top 10 Holdings (% of net assets) | | | | Industry Breakdown (% of net assets) | | | |
Theolia SA | | 6.2% | | Wind | | 44.3% | |
Iniziative Bresciane - Inbre - SpA | | 5.1% | | Solar | | 26.8% | |
Northern Power Systems Corp. | | 4.4% | | Hydro | | 11.0% | |
Good Energy Group PLC | | 4.3% | | Efficiency | | 10.1% | |
Mytrah Energy Ltd. | | 3.7% | | Biofuel | | 3.3% | |
Enphase Energy Inc. | | 3.4% | | Geothermal | | 3.0% | |
SunPower Corp. - Class B | | 3.3% | | | | | |
Cosan SA Industria e Comercio | | 3.3% | | | | | |
Trina Solar Ltd. - ADR | | 3.1% | | | | | | | |
Yingli Green Energy Holding Co., Ltd. - ADR | | 3.1% | | | | | | | |
14
SCHEDULE OF INVESTMENTS
at December 31, 2014
GUINNESS ATKINSON ALTERNATIVE ENERGY FUND
Shares | | COMMON STOCKS: 98.5% | | Value | |
Biofuel: 3.3% | | | |
| | 45,700 | | | Cosan SA Industria e Comercio | | $ | 495,992 | | |
Efficiency: 10.1% | | | |
| | 76,099 | | | Carmanah Technologies Corp.* | | | 190,607 | | |
| | 26,360 | | | CENTROTEC Sustainable AG | | | 455,329 | | |
| | 17,760 | | | Nibe Industrier AB - B Shares | | | 457,695 | | |
| | 456,000 | | | Wasion Group Holdings Ltd. | | | 423,942 | | |
| | | | | | | | 1,527,573 | | |
Geothermal: 3.0% | | | |
| | 16,959 | | | Ormat Technologies Inc. | | | 460,946 | | |
Hydro: 11.0% | | | |
| | 94,904 | | | Cia Energetica de Minas Gerais - ADR | | | 471,673 | | |
| | 27,750 | | | Iniziative Bresciane - Inbre - SpA* | | | 771,643 | | |
| | 23,550 | | | Verbund AG | | | 431,838 | | |
| | | | | | | | 1,675,154 | | |
Solar: 26.8% | | | |
| | 18,400 | | | Canadian Solar Inc.* | | | 445,096 | | |
| | 312,000 | | | China Singyes Solar Technologies Holdings Ltd. | | | 431,111 | | |
| | 35,900 | | | Enphase Energy Inc.* | | | 513,011 | | |
| | 53,900 | | | JA Solar Holdings Co., Ltd.* | | | 441,171 | | |
| | 23,800 | | | Jinkosolar Holdings Co - ADR* | | | 469,098 | | |
| | 224,000 | | | Renesola Ltd. - ADR* | | | 315,840 | | |
| | 19,450 | | | SunPower Corp. - Class B* | | | 502,393 | | |
| | 51,520 | | | Trina Solar Ltd. - ADR* | | | 477,075 | | |
| | 202,200 | | | Yingli Green Energy Holding Co., Ltd. - ADR* | | | 475,170 | | |
| | | | | | | | 4,069,965 | | |
Wind: 44.3% | | | |
| | 6,660 | | | Acciona S.A. | | | 447,139 | | |
| | 38,587 | | | Boralex Inc. - Class A | | | 426,788 | | |
| | 3,415,000 | | | China Datang Corp. Renewable Power Co. Ltd. - H Shares | | | 450,365 | | |
| | 437,000 | | | China Longyuan Power Group Corp. - H Shares | | | 450,175 | | |
| | 2,170,000 | | | China Suntien Green Energy Corp. Ltd. - H Shares | | | 451,336 | | |
| | 68,760 | | | EDP Renovaveis SA | | | 447,034 | | |
| | 209,880 | | | Enel Green Power SpA | | | 436,062 | | |
| | 200,441 | | | Good Energy Group PLC | | | 659,180 | | |
| | 325,080 | | | Greentech Energy Systems* | | | 374,201 | | |
| | 1,358,000 | | | Huaneng Renewables Corp. Ltd. - H Shares | | | 437,201 | | |
| | 467,823 | | | Mytrah Energy Ltd.* | | | 554,154 | | |
| | 228,800 | | | Northern Power Systems Corp.* | | | 669,582 | | |
| | 1,459,628 | | | Theolia SA* | | | 936,098 | | |
| | | | | | | | 6,739,315 | | |
| | | | | Total Common Stocks
(cost $22,964,044) | | | 14,968,945 | | |
The accompanying notes are an integral part of these financial statements.
15
Shares | | WARRANTS: 0.3% | | Value | |
| | 946,050 | | | Theolia SA, Expiration 6/09/16, Excerise price 0.60 EUR | | $ | 52,659 | | |
| | | Total Warrants
(cost $0) | | | 52,659 | | |
| | | Total Investments in Securities
(cost $22,964,044): 98.8% | | | 15,021,604 | | |
| | | Other Assets less Liabilities: 1.2% | | | 179,982 | | |
| | | Net Assets: 100.0% | | $ | 15,201,586 | | |
* Non-income producing security.
ADR - American Depository Receipt
The accompanying notes are an integral part of these financial statements.
16
ASIA FOCUS FUND for the period ended December 31, 2014
1. Performance
AVERAGE ANNUALIZED TOTAL RETURNS
| | | 1 Year
(actual) | | 3 Years | | 5 Years | | 10 Years | |
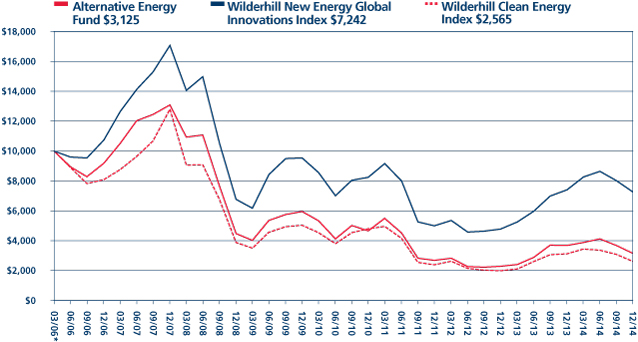
Fund | | | 1.91 | % | | | 1.91 | % | | | -0.21 | % | | | 6.55 | % | |
Benchmark Index: | |
MSCI AC Far East Free Ex Japan Index | | | 3.13 | % | | | 9.51 | % | | | 6.14 | % | | | 9.69 | % | |
S&P 500 Index | | | 13.66 | % | | | 20.34 | % | | | 15.42 | % | | | 7.66 | % | |
The Fund's gross expense ratio is 1.88% per the Summary Prospectus dated May 1, 2014. The Advisor has contractually agreed to waive a portion of its advisory fees and/or reimburse other Fund expenses so that the Fund's ratio of expenses to average daily net assets will not exceed 1.98% (excluding Acquired Fund Fees and Expenses, interest, taxes, dividends on short positions and extraordinary expenses) through at least June 30, 2015. To the extent that the Advisor waives fees and/or reimburses expenses, it may seek repayment of a portion or all of such amounts at any time within the three fiscal years after the fiscal year in which such amounts were waived and/or reimbursed, subject to the applicable cap.
Performance data quoted represents past performance and does not guarantee future results. The investment return and principal value of an investment in the Fund will fluctuate so that an investor's shares, when redeemed, may be worth more or less than their original cost. Current performance of the Fund may be lower or higher than the performance quoted. Performance data current to the most recent month-end may be obtained by visiting www.gafunds.com, or calling (800) 915-6565.
The Fund imposes a 2% redemption fee on the sale of shares held less than 30 days. Performance data quoted does not reflect this redemption fee. Total returns for certain periods reflect fee limitations in effect and, in the absence of these limitations, total returns would have been lower.
The Fund ended the year up 1.91% compared to the benchmark index, the MSCI AC Far East Free Ex-Japan Index, which rose 3.13%.
Emerging markets had a weak fourth quarter with the majority of the losses experienced in December marked by falling oil prices, a collapse in the ruble and declines in most other currencies against the dollar. The Asian region performed relatively well in this environment when of the major market blocs (US, Europe and Emerging Markets) only the US made any gains, with S&P 500 Index up 4.92% and Dollar (currency) Index up 5.04%. Within the Asian region over the quarter China was the best performer with the MSCI China Index up 7.18%. The MSCI Hong Kong and Taiwan indices rose 2.96% and 1.63% respectively. The weakest markets were Korea, Malaysia and Thailand each down approximately 5% in dollar terms.
Sector performance over the period was led by Chinese financial stocks – banks, insurers and brokers all performed strongly rising almost 25% in aggregate. Chinese industrials and technology stocks in Taiwan and Korea also gained modestly. Energy, materials and consumer discretionary sectors were weak across the region. The poor performance of Korea, across almost all sectors, with exception of technology, leaves it one of the cheapest markets in the region alongside China.
The sudden drop in the oil price brings with it problems as well as opportunities. If read as a sign of slower economic growth and thus external demand then Asian exporters such as Korea, Taiwan, Malaysia and Singapore look especially exposed. If we also read through to the prices of other commodities such as iron ore, rubber, tin, zinc then this too will have an impact on Malaysia and Indonesia, as it has on Latin America.
However, we believe the benefits will soon outweigh the negatives: Indonesia's new president just scrapped the fuel subsidy on gasoline and significantly reduced the level on diesel. Lower oil prices now mean Indonesians are paying 10% less now for unsubsidized fuel than before the subsidy was removed. Furthermore, the government has freed up an estimated 14% of government spending, projected to be spent on fuel subsidies, to invest in infrastructure and to meet the target of creating 2 million new jobs.
The strength of the dollar and the implications for the substantial increase in corporate debt denominated in dollars throughout the emerging market world has also weighed on markets. There is an estimated $5.7 trillion of dollar debt outstanding across all Emerging markets ($3.1 trillion of bank loans and $2.6 trillion in bonds). The problem is not so acute at a national level in Asia ex-Japan which holds $5.6 trillion of dollar reserves (China $3.9 trn, Rest of Asia ex-Japan $1.7 trn) out of a world total of
17
$11.8 trillion of reserves. The risks are greater at the corporate level although China has an 'easy' option of slashing the 20% required reserve ratio requirement if needed. Nevertheless Emerging Market bonds have fallen as dollar liquidity lessens with the end of Quantitative Easing by the Federal Reserve and in anticipation of an imminent US interest rate rise, which is now the market consensus.
In the portfolio over the quarter there were significant contributions from Chinese banks (China Construction bank, China Merchants Bank, China Minsheng), from Chinese industrials (Anhui Conch Cement, Weichai Power) and from the China A share ETF. The Hong Kong segment of the portfolio fell 7% led by technology names and Li & Fung. Malaysia was mixed down 2% overall (in local currency terms Digi.com rose 5%, UMW auto fell 11%) as was Korea up 2.5% (Hyundai Mobis down 8% in local currency terms, Samsung Electronics up 12%). The Taiwanese segment of the portfolio with its technology exposure rose 9% while Thailand fell 6% in line with the market led lower by energy exposure. Currency weakness in December pulled the Malaysian Ringgit 6% lower against the dollar while the Singapore dollar, the Korean won and Taiwan dollar were 3.5% to 3.8% lower for the quarter as a whole.
2. Portfolio Position
In the first half of the year we cut Hong Kong and China exposure and increased the position in Taiwan. At the sector level we increased to consumer discretionary, financials and information technology funded by cuts to energy, industrials, materials and telecom services. At the stock level we added China Merchants Bank and China Minsheng Bank which were trading at a significant discount to book value. We added Dongfeng Motor, Li & Fung and Nagacorp in the consumer discretionary sector and in the technology segment we added Catcher and Tencent, the latter being funded by the sale of China Mobile. In the second half we sold out of Kunlun Energy in October on weaker performance from its Kazakhstan oil operations and because of ongoing gas price reform in China that is expected to benefit producers and end distributors at the expense of the pipeline operators.
3. Outlook
The macro-environment remains challenging for Asia, as ever. Export manufacturers face a lopsided demand position with US performing well, Europe looking progressively weaker and many emerging economies under pressure from lower commodity prices and a strong dollar. Japan's renewed efforts at Quantitative Easing following lackluster results to date and Europe's decision to join the party spells further currency disruption. China's economic slowdown is likely to exert additional drag although that is more likely to felt through commodities exports rather than manufactured goods. The outstanding amount of US dollar debt remains a matter of some concern as Asian currencies weaken, but unlike 1998 the bulk was issued by corporates rather than government.
Falling oil prices have come as an unexpected source of relief for Asia allowing the political room in countries like Malaysia, Indonesia, Thailand and India to cut back or scrap fuel subsidies. Malaysia and Indonesia in particular have been battling to bring down government spending and in the case of Indonesia allows for the new President's program for infrastructure investment to progress with greater speed than was expected. The difficulty in both Thailand and Indonesia is political. In Thailand the initial period of relief following the coup is now being replaced with some hard-headed realism: the democratic framework has not been fixed and the royal succession to a now-frail King adds to the uncertainty. In Indonesia, the new president has already shown his decisiveness and new government spending power should drive the domestic economy. However, the recent move to intervene in cement pricing, following the fuel subsidy cuts, shows his interventionist colors and lowers predictability.
China remains the cheapest market in the region, followed by South Korea although the latter has seen the heaviest downgrades to forecast earnings of any country in the region led by Samsung Electronics and Hyundai Group. In spite of political concerns Indonesia and Thailand offer some of the fastest earnings growth over the next two years along with the Philippines. From a sector perspective the fastest growth is to be found in the Chinese technology and consumer discretionary sectors.

Edmund Harriss January 2015
The Fund invests in foreign securities, which involve political, economic and currency risks, greater volatility, and differences in accounting methods. These risks are greater for emerging markets. The Fund is non-diversified, meaning that its assets may be concentrated in fewer individual holdings than diversified funds. Therefore, the Fund is more exposed to individual stock volatility than diversified funds. Investments focused in a single geographic region may be exposed to greater risk and more volatility than investments diversified among various geographies. The Fund invests in smaller companies, which involves additional risks such as limited liquidity and greater volatility.
18
The MSCI AC (All Country) Far East Free ex Japan Index is a free float-adjusted market capitalization-weighted index that is designed to measure equity market performance of the Far East, excluding Japan. The Standard & Poor's 500 Index is a market capitalization-weighted index composed of 500 widely held common stocks of U.S. companies. The Dollar Index is a measure of the value of the United States dollar relative to other world currencies. The MSCI China Index is a free-float adjusted market capitalization weighted index that is designed to measure equity market performance of Chinese stocks available into international investors traded in China and Hong Kong. The MSCI Hong Kong Index is designed to measure the performance of the large and mid cap segments of the Hong Kong market and covers about 85% of the Hong Kong equity universe. The MSCI Taiwan Index is a free-float adjusted market capitalization weighted index that is designed to track the equity market performance of Taiwanese securities listed on Taiwan Stock Exchange and GreTai Securities Market. These indices are unmanaged, not available for investment and do not incur expenses.
Book Value is the net asset value of a company, calculated by total assets minus intangible assets (patents, goodwill) and liabilities.
Please refer to the Schedule of Investments for details on Fund holdings. Current and future portfolio holdings are subject to risk.
The information provided herein represents the opinion of Guinness Atkinson Asset Management, Inc. for the period stated and is not intended to be a forecast of future events, a guarantee of future results, or investment advice. Opinions, Fund holdings and sector allocations are subject to change at any time, and are not recommendations to buy or sell any security.
19
GUINNESS ATKINSON ASIA FOCUS FUND
Growth of $10,000
Average Annual Total Return
Periods Ended December 31, 2014
| One Year | | Five Year | | Ten Year | |
| | 1.91 | % | | | -0.21 | % | | | 6.55 | % | |
Performance data quoted represents past performance and does not guarantee future results. The investment return and principal value of an investment will fluctuate so that an investor's shares, when redeemed, may be worth more or less than their original cost. Current performance of the Fund may be lower or higher than the performance quoted. Performance data current to the most recent month end may be obtained by visiting www.gafunds.com.
Total returns for certain periods reflect a fee waiver in effect and in the absence of this waiver, the total returns would be lower. Returns reflect the reinvestment of distributions made by the Fund, if any. The graph and the performance table above do not reflect the deduction of taxes that a shareholder would pay on Fund distribution or the redemption of Fund shares. The Fund imposes a 2% redemption fee on shares held less than 30 days.
The MSCI All Country Far East Free ex-Japan Index (MSCI AC Far East Free ex-Japan Index) is a free float-adjusted, capitalization-weighted index that is designed to measure equity market performance of the Far East excluding Japan. The index referenced in this chart is not available for investment and does not incur expenses.
20
FUND HIGHLIGHTS at December 31, 2014
GUINNESS ATKINSON ASIA FOCUS FUND
# of Holdings in Portfolio: | | 39 | |
Portfolio Turnover: | | 23.2% | |
% of Stocks in Top 10: | | 36.1% | |
Fund Manager: | | | |
Edmund Harriss | | | |
Top 10 Holdings (% of net assets) | | | | | | | |
Taiwan Semiconductor Manufacturing Co., Ltd. | | | 4.8 | % | | Lenovo Group Ltd. | | | 3.2 | % | |
Largan Precision Co., Ltd. | | | 4.6 | % | | Anhui Conch Cement Co Ltd. - H Shares | | | 3.2 | % | |
Samsung Electronics Co., Ltd. | | | 4.0 | % | | PetroChina Co Ltd. - H Shares | | | 3.2 | % | |
China Merchants Bank Co Ltd. - H Shares | | | 3.5 | % | | Novatek Microelectronics Corp. | | | 3.1 | % | |
China Minsheng Banking Corp Ltd. - H Shares | | | 3.4 | % | | China Construction Bank Corp. - H Shares | | | 3.1 | % | |
Industry Breakdown (% of net assets) | | | | | | | |
Commercial Banks | | | 11.8 | % | | Building Products - Air&Heating | | | 3.2 | % | |
Semiconductor Components - Integrated Circuits | | | 7.9 | % | | Exchange Traded Funds | | | 3.0 | % | |
Oil Company - Integrated | | | 6.0 | % | | Web Portals/ISP | | | 2.7 | % | |
Auto/Truck Parts & Equipment | | | 5.8 | % | | Electronic Component - Miscellaneous | | | 2.5 | % | |
Electric - Generation | | | 5.5 | % | | Building & Construction Products | | | 2.5 | % | |
Telecommunication Services | | | 5.0 | % | | Metal Processors & Fabricators | | | 2.4 | % | |
Oil Company - Exploration & Production | | | 4.8 | % | | Internet Application Software | | | 2.4 | % | |
Auto - Cars/Light Trucks | | | 4.7 | % | | Public Thoroughfares | | | 2.3 | % | |
Real Estate Operations/Development | | | 4.7 | % | | Distribution/Wholesale | | | 1.9 | % | |
Casino Hotels | | | 4.6 | % | | Non-Ferrous Metals | | | 1.0 | % | |
Photo Equipment & Supplies | | | 4.6 | % | | Coal | | | 1.0 | % | |
Electronic Components - Semiconductor | | | 4.0 | % | | Machinery | | | 0.5 | % | |
Computers | | | 3.2 | % | | Apparel Manufacturers | | | 0.3 | % | |
21
SCHEDULE OF INVESTMENTS
at December 31, 2014
GUINNESS ATKINSON ASIA FOCUS FUND
Shares | | COMMON STOCKS: 98.3% | | Value | |
China: 45.0% | | | |
| | 94,000 | | | AAC Technologies Holdings Inc. | | $ | 499,539 | | |
| | 171,000 | | | Anhui Conch Cement Co Ltd. - H Shares | | | 637,719 | | |
| | 739,000 | | | China Construction Bank Corp. - H Shares | | | 601,456 | | |
| | 1,014,000 | | | China Lesso Group Holdings Ltd. | | | 494,033 | | |
| | 280,000 | | | China Merchants Bank Co Ltd. - H Shares | | | 698,755 | | |
| | 419,000 | | | CNOOC Ltd. | | | 566,796 | | |
| | 506,000 | | | China Minsheng Banking Corp Ltd. - H Shares | | | 659,850 | | |
| | 599,200 | | | db x-trackers CSI300 Index ETF | | | 588,023 | | |
| | 338,000 | | | Dongfeng Motor Group Co., Ltd. - H Shares | | | 472,500 | | |
| | 490,000 | | | Lenovo Group Ltd. | | | 638,817 | | |
| | 562,000 | | | PetroChina Co Ltd. - H Shares | | | 624,788 | | |
| | 696,000 | | | Shenzhen Expressway Co Ltd. - H Shares | | | 461,247 | | |
| | 521,000 | | | Soho China Ltd. | | | 366,333 | | |
| | 9,800 | | | Sohu.com Inc.* | | | 521,164 | | |
| | 32,500 | | | Tencent Holdings Ltd. | | | 466,321 | | |
| | 134,000 | | | Weichai Power Co., Ltd. - H Shares | | | 562,405 | | |
| | | | | | | | 8,859,746 | | |
Hong Kong: 9.3% | | | |
| | 380,000 | | | Chen Hsong Holdings | | | 103,168 | | |
| | 86,000 | | | Galaxy Entertainment Group Ltd. | | | 478,733 | | |
| | 322,000 | | | Global Brands Group Holding Ltd.* | | | 62,940 | | |
| | 39,398 | | | HSBC Holdings PLC | | | 374,824 | | |
| | 407,000 | | | Li & Fung Ltd. | | | 381,039 | | |
| | 532,000 | | | NagaCorp Ltd. | | | 433,527 | | |
| | | | | | | | 1,834,231 | | |
Indonesia: 1.8% | | | |
| | 129,000 | | | Indo Tambangraya Megah PT | | | 159,690 | | |
| | 666,000 | | | Vale Indonesia Tbk | | | 194,933 | | |
| | | | | | | | 354,623 | | |
Malaysia: 5.3% | | | |
| | 337,000 | | | DiGi.Com Bhd | | | 592,694 | | |
| | 144,000 | | | UMW Holdings Bhd | | | 451,377 | | |
| | | | | | | | 1,044,071 | | |
South Korea: 7.0% | | | |
| | 2,752 | | | Hyundai Mobis | | | 585,726 | | |
| | 656 | | | Samsung Electronics Co., Ltd. | | | 788,546 | | |
| | | | | | | | 1,374,272 | | |
Taiwan: 14.8% | | | |
| | 61,000 | | | Catcher Technology Co., Ltd. | | | 469,503 | | |
| | 12,000 | | | Largan Precision Co., Ltd. | | | 898,437 | | |
| | 110,000 | | | Novatek Microelectronics Corp. | | | 615,368 | | |
| | 2 | | | Shin Zu Shing Co., Ltd. | | | 5 | | |
| | 214,000 | | | Taiwan Semiconductor Manufacturing Co., Ltd. | | | 944,324 | | |
| | | | | | | | 2,927,637 | | |
The accompanying notes are an integral part of these financial statements.
22
Shares | | COMMON STOCKS: 98.3% (Continued) | | Value | |
Thailand: 15.1% | | | |
| | 99,500 | | | Electricity Generating PCL/Foreign | | $ | 506,573 | | |
| | 216,000 | | | Glow Energy PCL/Foreign | | | 585,957 | | |
| | 1,778,000 | | | Jasmine International PCL/Foreign | | | 394,332 | | |
| | 824,000 | | | LPN Development PCL/Foreign | | | 547,656 | | |
| | 113,198 | | | PTT Exploration & Production PCL/Foreign | | | 383,967 | | |
| | 56,700 | | | PTT PCL/Foreign | | | 555,886 | | |
| | | | | | | | 2,974,371 | | |
| | | | | Total Common Stocks
(cost $15,659,482) | | | 19,368,951 | | |
| | | | | Total Investments in Securities
(cost $15,659,482): 98.3% | | | 19,368,951 | | |
| | | | | Other Assets less Liabilities: 1.7% | | | 345,006 | | |
| | | | | Net Assets: 100.0% | | $ | 19,713,957 | | |
* Non-income producing security.
ADR - American Depository Receipt
The accompanying notes are an integral part of these financial statements.
23
ASIA PACIFIC DIVIDEND BUILDER FUND for the period ended December 31, 2014
1. Performance
ANNUALIZED TOTAL RETURNS
| | | 1 Year
(actual) | | 3 Year | | 5 Year | | Since
Launch
(March 31, 2006) | |
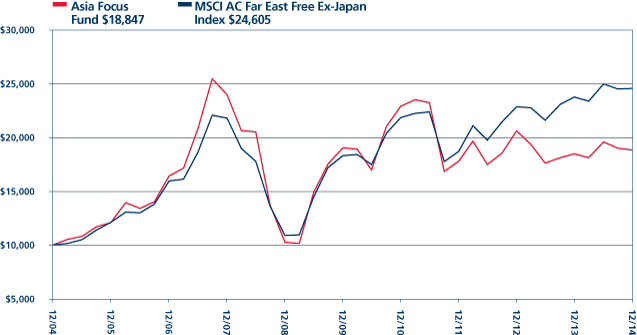
Fund | | | 9.04 | % | | | 9.66 | % | | | 6.98 | % | | | 5.19 | % | |
Benchmark Index: | |
MSCI AC Pacific Ex Japan Index | | | 2.14 | % | | | 9.52 | % | | | 6.32 | % | | | 8.01 | % | |
S&P 500 Index | | | 13.66 | % | | | 20.34 | % | | | 15.42 | % | | | 7.70 | % | |
The Fund's gross expense ratio is 3.56% and net expense ratio is 1.98% per the Summary Prospectus dated May 1, 2014. The Advisor has contractually agreed to waive a portion of its advisory fees and/or reimburse other Fund expenses so that the Fund's ratio of expenses to average daily net assets will not exceed 1.98% (excluding Acquired Fund Fees and Expenses, interest, taxes, dividends on short positions and extraordinary expenses) through at least June 30, 2015. To the extent that the Advisor waives fees and/or reimburses expenses, it may seek repayment of a portion or all of such amounts at any time within the three fiscal years after the fiscal year in which such amounts were waived and/or reimbursed, subject to the applicable cap.
Performance data quoted represents past performance and does not guarantee future results. The investment return and principal value of an investment in the Fund will fluctuate so that an investor's shares, when redeemed, may be worth more or less than their original cost. Current performance of the Fund may be lower or higher than the performance quoted. Performance data current to the most recent month-end may be obtained by visiting www.gafunds.com, or calling (800) 915-6565.
The Fund imposes a 2% redemption fee on the sale of shares held less than 30 days. Performance data quoted does not reflect this redemption fee. Total returns for certain periods reflect expense limitations in effect and, in the absence of these imitations, total returns would have been lower.
The Fund ended the year up 9.04% compared to the benchmark index, the MSCI AC Pacific ex. Japan, which rose 2.14%. Thus the Fund outperformed the benchmark by 6.90%. The Fund outperformed mainly in the second half of the year as Asia Pacific equities fell.
The best performing stocks in our portfolio came from a variety of sectors and countries. Huabao, a chemicals company listed in Hong Kong, rose 57.19% during the year. The company is not well covered by analysts, but re-rated significantly during the year. Following a coup in Thailand, which filled the political vacuum of the previous 12 months, the stock market performed well, and our holding in Thai property company LPN Development returned 49.03%. China Minsheng was one of our Chinese bank holdings that outperformed towards the end of the year, increasing by 45.63%. Relo Holdings, a relocation agent and our only holding in Japan, gained 43.92%, also rising due to multiple expansion supported by a growing dividend payout.
St Shine was the worst performing stock, falling 39.98% over the year, after releasing weak sales figures, particularly from Japan where customers still carry high inventory. This issue is expected to be resolved by the second quarter of 2015. JB Hi-Fi announced a cautious outlook mid-way through the year, which contributed to the stock's -28.23% return over the period. Management is currently rolling out a new store format selling white goods, and we believe that this is an appropriate long term use of capital. CNOOC returned -24.86% as the oil price fell sharply in November and December. NagaCorp, who operates a casino in Cambodia, decreased by 18.41% as sentiment towards gaming stocks turned negative. (All figures quoted are total returns in USD).
The Fund aims to provide investors with exposure to Asian businesses or businesses based overseas that have significant exposure to the region which have demonstrated an ability to generate superior returns on capital over time as well as an ability and willingness to pay dividends.
We have refined the universe of potential investments to those stocks that have demonstrated an ability to sustain profitability through the business cycle by their competitive advantage, management efficiency, product development and distribution or a combination of those factors
This approach is one which we believe will generate a steadier performance than the broad market and that will outperform the broad market over time.
24
ASIA PACIFIC DIVIDEND BUILDER FUND
2. Activity
We made two changes to the portfolio during the year. In August, we sold our holding in water utility Thai Tap Water, and replaced it with an investment in electronics manufacturer Hon Hai Precision. Thai Tap Water performed well during year, along with utilities stocks in general, but we were concerned that expected growth in the company's operations would be slow to materialize. We purchased Hon Hai following the company's recent track record of improving margins by controlling labour costs. We expect Hon Hai, which trades at attractive valuation multiples, to grow as a result of the continuing popularity of Apple products, including the new iPhone 6.
In September, we sold our position in Vtech, and replaced it with a holding in AAC Technologies. Vtech offered an attractive dividend yield, but we were concerned that the company was not making sufficient investment in new product research and development in order to be able to grow its dividend in future. We replaced it in the portfolio with AAC Technologies, which makes electronic audio components for mobile telephones and other devices. We think the company has attractive growth prospects, and trades at a reasonable valuation.
3. Portfolio Position
The Fund's largest country exposures were to China, Taiwan, Hong Kong and Australia. Our weightings in Hong Kong and China reflect our belief that companies in these markets are undervalued, and represent attractive investment opportunities. By contrast, we have lower or no allocations to other countries, for example, Indonesia or the Philippines, because the companies that meet our screening criteria in these countries have valuations that are not, at present, sufficiently attractive.
The Fund's largest sector exposures are to Financials, Information Technology and Consumer Discretionary. Again, our allocation to financials is due to our belief that there is sufficient undervaluation present in the sector. We note that some sectors, for example, Materials, Energy and Utilities have historically had low representation in our universe – materials and energy are highly cyclical industries, while utility companies are often heavily regulated, and achieve lower returns.
4. Outlook
The fall in the oil price towards the end of 2014, which has continued in early 2015, has dominated events in financial markets. Brent crude has fallen from $115 in June 2014 to around $47 at time of writing. Along with these price movements, European economic data has been weak, with deflation again concerning investors. Against this macro backdrop, equity markets have been volatile, and Asia Pacific markets have been no exception.
However, despite short-term market volatility, we think that the Asian Pacific region offers investors excellent long-term prospects. The region has, and will continue to benefit from, favourable demographic characteristics, and rising levels of personal wealth. Developing Asian economies are increasingly switching from being driven by investment, to becoming more consumption-led – we believe this trend will result in favourable economic growth and attractive investment returns.
We believe that the Fund's portfolio is conservative and strikes a balance between growth and income. We therefore believe that the underlying companies will participate in regional growth but with less volatility. The portfolio is positioned to benefit from rising consumption growth not only in China but also around the region.
Asian companies tend to base their dividend payments on a fixed payout ratio, thus short term fluctuations in the dividend along with earnings and the business cycle are to be expected. However, we believe that over the long term, dividends will grow at a satisfactory rate.

Edmund Harriss
The Fund invests in foreign securities, which involve political, economic and currency risks, greater volatility, and differences in accounting methods. These risks are greater for emerging markets. The Fund is non-diversified, meaning that its assets may be concentrated in fewer individual holdings than diversified funds. Therefore, the Fund is more exposed to individual stock volatility than diversified funds. Investments focused in a single geographic region may be exposed to greater risk and more volatility than investments diversified among various geographies. The Fund invests in smaller companies, which involve additional risks such as limited liquidity and greater volatility.
25
ASIA PACIFIC DIVIDEND BUILDER FUND
The MSCI AC Pacific ex-Japan Index is a free float-adjusted market capitalization weighted index that is designed to measure equity market performance of the developed and emerging markets in the Pacific region, excluding Japan. The Standard & Poor's 500 Index is a market capitalization-weighted index composed of 500 widely held common stocks of U.S. companies. These indices are unmanaged and not available for investment and do not incur expenses.
Market Capitalization (Market Cap) is the total value of the issued shares of a publicly traded company.
Please refer to the Schedule of Investments for details on Fund holdings. Current and future portfolio holdings are subject to risk.
The information provided herein represents the opinion of Guinness Atkinson Asset Management, Inc. for the period stated and is not intended to be a forecast of future events, a guarantee of future results, or investment advice. Opinions, Fund holdings and sector allocations are subject to change at any time, and are not recommendations to buy or sell any security.
26
GUINNESS ATKINSON ASIA PACIFIC DIVIDEND BUILDER FUND
Growth of $10,000
Average Annual Total Return
Periods Ended December 31, 2014
| One Year | | Five Year | | Since Inception
(03/31/06) | |
| | 9.04 | % | | | 6.98 | % | | | 5.19 | % | |
*Inception date 03/31/06.
Performance data quoted represents past performance and does not guarantee future results. The investment return and principal value of an investment will fluctuate so that an investor's shares, when redeemed, may be worth more or less than their original cost. Current performance of the Fund may be lower or higher than the performance quoted. Performance data current to the most recent month end may be obtained by visiting www.gafunds.com.
Total returns reflect a fee waiver in effect and in the absence of this waiver, the total returns would be lower. Returns reflect the reinvestment of distributions made by the Fund, if any. The graph and the performance table above do not reflect the deduction of taxes that a shareholder would pay on Fund distribution or the redemption of Fund shares. The Fund imposes a 2% redemption fee on shares held less than 30 days.
The MSCI All Country Pacific Free ex-Japan Index (MSCI AC Pacific ex-Japan Index) is a free float-adjusted, capitalization-weighted index that is designed to measure equity market performance in the Pacific region including Japan.
27
FUND HIGHLIGHTS at December 31, 2014
GUINNESS ATKINSON ASIA PACIFIC DIVIDEND BUILDER FUND
# of Holdings in Portfolio: | | 38 | |
Portfolio Turnover: | | 15.8% | |
% of Stocks in Top 10: | | 30.7% | |
Fund Manager: | | | |
Edmund Harriss | | | |
Top 10 Holdings (% of net assets) | | | | | | | |
Novatek Microelectronics Corp. | | | 3.2 | % | | Industrial & Commercial Bank of China Ltd. - H Shares | | | 3.1 | % | |
China Merchants Bank Co., Ltd. - H Shares | | | 3.1 | % | | Taiwan Semiconductor Manufacturing Co., Ltd. | | | 3.0 | % | |
China Minsheng Banking Corp. Ltd. - H Shares | | | 3.1 | % | | QUALCOMM Inc. | | | 3.0 | % | |
BOC Hong Kong Holdings Ltd. | | | 3.1 | % | | Relo Holdings Inc. | | | 3.0 | % | |
China Construction Bank Corp. - H Shares | | | 3.1 | % | | NagaCorp Ltd. | | | 3.0 | % | |
Industry Breakdown (% of net assets) | | | | | | | |
Commercial Banks | | | 15.5 | % | | Textile - Products | | | 2.7 | % | |
Semiconductor Components - Integrated Circuits | | | 9.2 | % | | Computers | | | 2.7 | % | |
Electronic Component - Miscellaneous | | | 7.7 | % | | MRI/Medical Diagnostics Imaging | | | 2.7 | % | |
REITS - Shopping Centers | | | 5.6 | % | | Retail - Consumer Electronics | | | 2.6 | % | |
Apparel Manufacturers | | | 3.0 | % | | Chemicals - Specialty | | | 2.6 | % | |
Real Estate Management/Service | | | 3.0 | % | | Textile - Apparel | | | 2.6 | % | |
Casino Hotels | | | 3.0 | % | | Investment Management/Advisory Service | | | 2.6 | % | |
Retail - Jewelry | | | 2.9 | % | | Web Portals/ISP | | | 2.6 | % | |
Oil Company - Exploration & Production | | | 2.8 | % | | Optical Supplies | | | 2.4 | % | |
Shipbuilding | | | 2.8 | % | | Oil Company - Integrated | | | 2.4 | % | |
Telecommunication Services | | | 2.8 | % | | Tobacco | | | 2.3 | % | |
Real Estate Operations/Development | | | 2.8 | % | | Metal Processors & Fabricators | | | 2.3 | % | |
Cellular Telecommunications | | | 2.8 | % | | Distribution/Wholesale | | | 1.8 | % | |
REITS - Diversified | | | 2.7 | % | | | | | |
28
SCHEDULE OF INVESTMENTS
at December 31, 2014
GUINNESS ATKINSON ASIA PACIFIC DIVIDEND BUILDER FUND
Shares | | COMMON STOCKS: 98.9% | | Value | |
Australia: 10.5% | | | |
| | 31,940 | | | Henderson Group PLC | | $ | 104,418 | | |
| | 16,300 | | | iiNET Ltd. | | | 104,085 | | |
| | 8,400 | | | JB Hi-Fi Ltd. | | | 107,653 | | |
| | 7,250 | | | Sonic Healthcare Ltd. | | | 108,877 | | |
| | | | | | | | 425,033 | | |
China: 33.9% | | | |
| | 19,000 | | | AAC Technologies Holdings Inc | | | 100,971 | | |
| | 153,000 | | | China Construction Bank Corp. - H Shares | | | 124,523 | | |
| | 169,000 | | | China Lilang Ltd. | | | 105,965 | | |
| | 51,000 | | | China Merchants Bank Co., Ltd. - H Shares | | | 127,273 | | |
| | 97,400 | | | China Minsheng Banking Corp. Ltd. - H Shares | | | 127,015 | | |
| | 9,500 | | | China Mobile Ltd. | | | 111,603 | | |
| | 20,000 | | | CNOOC Ltd | | | 27,055 | | |
| | 650 | | | CNOOC Ltd. - ADR | | | 88,036 | | |
| | 131,000 | | | Huabao International Holdings Ltd. | | | 106,933 | | |
| | 171,000 | | | Industrial & Commercial Bank of China Ltd. - H Shares | | | 124,221 | | |
| | 84,000 | | | Pacific Textiles Holdings Ltd. | | | 111,110 | | |
| | 32,000 | | | Shenzhou International Group Holdings Ltd. | | | 105,640 | | |
| | 126,000 | | | Yangzijiang Shipbuilding Holdings Ltd. | | | 114,431 | | |
| | | | | | | | 1,374,776 | | |
Hong Kong: 14.0% | | | |
| | 38,000 | | | BOC Hong Kong Holdings Ltd. | | | 126,517 | | |
| | 80,000 | | | Global Brands Group Holdings Ltd.* | | | 15,637 | | |
| | 80,000 | | | Li & Fung Ltd. | | | 74,897 | | |
| | 18,500 | | | Link REIT/The | | | 115,483 | | |
| | 31,000 | | | Luk Fook Holdings International Ltd. | | | 116,090 | | |
| | 148,000 | | | NagaCorp Ltd. | | | 120,605 | | |
| | | | | | | | 569,229 | | |
Japan: 3.0% | | | |
| | 1,700 | | | Relo Holdings Inc. | | | 120,699 | | |
Malaysia: 2.8% | | | |
| | 64,900 | | | DiGi.Com Bhd | | | 114,142 | | |
Singapore: 5.5% | | | |
| | 62,000 | | | Ascendas Real Estate Investment Trust | | | 111,293 | | |
| | 72,000 | | | CapitaMall Trust | | | 110,789 | | |
| | | | | | | | 222,082 | | |
South Korea: 2.3% | | | |
| | 1,350 | | | KT&G Corp. | | | 93,611 | | |
The accompanying notes are an integral part of these financial statements.
29
Shares | | COMMON STOCKS: 98.9% (Continued) | | Value | |
Taiwan: 16.1% | | | |
| | 10,000 | | | Asustek Computer Inc. | | $ | 108,880 | | |
| | 12,000 | | | Catcher Technology Co., Ltd. | | | 92,361 | | |
| | 38,080 | | | Hon Hai Precision Industry Co., Ltd. | | | 105,008 | | |
| | 23,000 | | | Novatek Microelectronics Corp. | | | 128,668 | | |
| | 6,000 | | | St Shine Optical Co., Ltd. | | | 97,903 | | |
| | 28,000 | | | Taiwan Semiconductor Manufacturing Co., Ltd. | | | 123,557 | | |
| | | | | | | | 656,377 | | |
Thailand: 7.8% | | | |
| | 49,200 | | | Delta Electronics Thailand PCL/Foreign | | | 105,429 | | |
| | 171,500 | | | LPN Development PCL/Foreign | | | 113,984 | | |
| | 9,900 | | | PTT PCL/Foreign | | | 97,059 | | |
| | | | | | | | 316,472 | | |
United States: 3.0% | | | |
| | 1,640 | | | QUALCOMM Inc. | | | 121,901 | | |
| | | | | Total Common Stocks
(cost $3,554,997) | | | 4,014,322 | | |
| | | | | Total Investments in Securities
(cost $3,554,997): 98.9% | | | 4,014,322 | | |
| | | | | Other Assets less Liabilities: 1.1% | | | 45,966 | | |
| | | | | Net Assets: 100.0% | | $ | 4,060,288 | | |
* Non-income producing security.
ADR - American Depository Receipt
The accompanying notes are an integral part of these financial statements.
30
CHINA & HONG KONG FUND for the period ended December 31, 2014
1. Performance
AVERAGE ANNUALIZED TOTAL RETURNS
| | | 1 Year
(actual) | | 3 Years | | 5 Years | | 10 Years | |
Fund | | | -1.97 | % | | | 6.09 | % | | | -0.03 | % | | | 7.97 | % | |
Benchmark Index: | |
Hang Seng Composite Index | | | 4.09 | % | | | 12.52 | % | | | 4.64 | % | | | 10.05 | % | |
S&P 500 Index | | | 13.66 | % | | | 20.34 | % | | | 15.42 | % | | | 7.66 | % | |
The Fund's expense ratio is 1.54% per the Summary Prospectus dated May 1, 2014. The Advisor has contractually agreed to waive a portion of its advisory fees and/or reimburse other Fund expenses so that the Fund's ratio of expenses to average daily net assets will not exceed 1.98% (excluding Acquired Fund Fees and Expenses, interest, taxes, dividends on short positions and extraordinary expenses) through at least June 30, 2015. To the extent that the Advisor waives fees and/or reimburses expenses, it may seek repayment of a portion or all of such amounts at any time within the three fiscal years after the fiscal year in which such amounts were waived and/or reimbursed, subject to the applicable cap.
Performance data quoted represents past performance and does not guarantee future results. The investment return and principal value of an investment in the Fund will fluctuate so that an investor's shares, when redeemed, may be worth more or less than their original cost. Current performance of the Fund may be lower or higher than the performance quoted. Performance data current to the most recent month-end may be obtained by visiting www.gafunds.com, or calling (800) 915-6565.
The Fund imposes a 2% redemption fee on the sale of shares held less than 30 days. Performance data quoted does not reflect this redemption fee. Total returns for certain periods reflect expense limitations in effect and, in the absence of these limitations, total returns would have been lower.
At the end of the first half of the year the Fund was down 1.97% compared to the Hang Seng Composite Index which rose 4.01%.
China's macro-economic backdrop remains difficult because of its interconnectedness, but not critical we believe. The effort to reduce investment and boost consumption is bound up with debt growth over the past few years which in turn in the result of poor capital allocation itself stemming from a financial system sorely in need of reform. The process of unpicking this, deleveraging, reducing excess capacity, re-pricing capital on a market basis all combine to slow economic growth. The government therefore faces the challenge of how to support growth in the short term without undermining its core efforts over the long term.
Domestic market sentiment has clearly been boosted by recent policy moves which have been perceived as market friendly but on closer inspection the central bank can be seen to be acting with some subtlety. The interest rate cut that sparked the rally was asymmetric – it will compress bank margins and will also force banks to move assets from the financial (interbank) sector into the real economy. The move to allow deposits from non-financial institutions to be included in the loan to deposit ratio calculation will allow that switch to happen. Importantly, neither move constitutes an additional liquidity injection but is instead a reallocation of capital. By contrast, a move to reduce the required reserve ratio with its consequent liquidity release which may be viewed positively by the market would, in our view, be a bad sign.
In the last three months of the year China's domestic stockmarkets staged a dramatic rally. The Shanghai Shenzhen CSI 300 index of domestic Chinese A shares rose 39.6%, with the bulk of gains generated since the announcement of an interest cut on 20th November 20 2014. Their Hong Kong listed (H share) counterparts rose a more modest 15.0% moving A shares from a 6.6% discount to H shares at the start of the year to a 28.1% premium. Hong Kong shares, as measured by the Hang Seng Index rose only 2.9% over the same period.
The strength in the Chinese stock markets has been primarily a domestic phenomenon with little impact on the outside world. International investors have been preoccupied by macro-concerns ranging from weakness in Europe, a falling oil price and instability within Russia as well as its relations with the outside world. Investors in emerging markets have had to contend with the impact of falling commodity prices, a stronger dollar (and its impact on dollar-denominated debt burdens) and a slowing economy in China. The sudden Chinese stock market take-off looks to be a reflection of domestic sentiment associated with monetary easing as well as being driven by a switch away from real estate investment. There has been significant retail participation and trade volumes are high.
31
For the portfolio, the strong performers have been the banking stocks bought earlier in the year as well as the 'old' economy stocks deemed to benefit from policy support. The weaker performers include Galaxy Entertainment, the Macau casino operator and oil names. The anti-corruption campaign now looks like being more than just a campaign but a long term effort to root out or break up vested interests. Luxury spending, of which gambling is a significant component, is part of that effort. Technology names still account for a significant share (24%) of the portfolio and were comparatively weaker at the end of the year. This, we believe, is the result of rotational selling into Chinese financials rather than indicating problems with sector. The business models of the larger holdings (in Lenovo, NetEase and Tencent) remain sound with no signs of erosion in market share or margins.
2. Portfolio Position
Earlier in the year we increased bank and consumer discretionary exposure and cut back positions in industrial companies and real estate. China Merchants and China Minsheng banks were added to the portfolio on the grounds that valuations more than reflected the risks of a credit crisis in China, since when the risks have reduced, in our opinion. Amongst the consumer stocks we added Dongfeng Motor, Li & Fung (a sourcing agent for international business seeking to manufacture goods in Asia) and Nagacorp, a gaming company. We cut our positions on Dongfang Electrical Machinery, Jiangxi Copper and Kingboard Chemical, which is now diversifying into real estate. In October the holding in Kunlun Energy was sold and is now confined to CNOOC (pure oil exploration) and Petrochina (onshore oil and gas).
3. Outlook
Recent economic data report that China's economy grew 7.4% in 2014 which is, as press commentators have been quick to point out, the slowest rate in 25 years. But it should also be noted that China's economy is over nine times larger than it was 25 years ago. A reduction in the rate of growth is inevitable. The government is keen to show that it is unworried by this number and that we are now in "the new normal". From a practical perspective we believe this means that calls for aggressive monetary easing, big cuts to required reserve ratios and new stimulus packages are unlikely. The problem the government faces is well known: the inefficiencies in the financial system mean that the benefits of broad monetary stimulus to not appear in the places they ought.
We believe it likely that economic support efforts are likely to remain measured and targeted. The recent interest rate cut for example was structured in such a way as to leave deposit rates unchanged, even though the headline rate was reduced by 0.25%, to support savers and pass on the benefits of falling inflation and therefore rising real deposit rates. We shall therefore see ongoing Short-term Lending Operations (SLO) to keep short term rates stable, Medium-term Lending Facilities (MLF) to support base money and liquidity management and Pledged Supplementary Lending (PSL) operations to support infrastructure development as the main monetary tools. We may see further interest rate cuts as inflation has fallen to help with the debt burden but pressure will remain to prevent renewed growth in credit.
In sum, following the policies of 2014 we expect to see more of the same. State-owned enterprise reforms will be promoted to consolidate and reduce excess capacity in industries such as steel, aluminum and cement. The anti-corruption campaign looks to be increasingly entrenched on the one hand viewed as an attempt to clear away political opposition and on the other as an honest drive to improve the operational and moral position of the Party. The emphasis on the promotion of consumption, evident in the recent interest rate cuts has been further bolstered by plans to increase the wages of 40 million civil servants by 60%-100%.
The risks posed by the property sector remain evident. High leverage, production ahead of demand and the need to sell inventory to support cash flows will all remain issues in 2015. The intersect between the property sector and the battle against corruption adds to the risks. However, given the importance of the property sector to the economy at large we expect considerable official efforts to be made to maintain stability.
In the coming year it seems probable that growth will slow further with signs that the government now sees 6.5%-7% as tolerable in contrast to the view under the heavy industrial model that 8% was the minimum needed to sustain job creation and social stability. The economy will also see benefits from the lower oil price: with imports of around 6 million barrels per day China could save over $107bn (equivalent to 1.04% of 2014 gross domestic product (GDP)) at a price of $50 per barrel compared to the average price of $101.6 paid in 2014.

Edmund Harriss January 2015
32
The Fund invests in foreign securities, which involve political, economic and currency risks, greater volatility, and differences in accounting methods. These risks are greater for emerging markets. The Fund is non-diversified, meaning that its assets may be concentrated in fewer individual holdings than diversified funds. Therefore, the Fund is more exposed to individual stock volatility than diversified funds. Investments focused in a single geographic region may be exposed to greater risk and more volatility than investments diversified among various geographies. The Fund invests in smaller companies, which involve additional risks such as limited liquidity and greater volatility.
The Hang Seng Composite Index is a market capitalization-weighted index that is comprised of the top 200 companies listed on the Hong Kong Stock Exchange, based on the average market capitalization for the past twelve months. The Standard & Poor's 500 Index is a market capitalization-weighted index composed of 500 widely held common stocks of U.S. companies. These indices are unmanaged and not available for investment, and do not incur expenses.
The Shanghai Shenzhen CSI 300 Index is a free-float weighted index that consists of 300 A-share stocks listed on the Shanghai or Shenzhen Stock Exchanges.
The gross domestic product (GDP) is the total value of all goods and services produced domestically by a nation during a year.
Please refer to the Schedule of Investments for details on Fund holdings. Current and future portfolio holdings are subject to risk.
The information provided herein represents the opinion of Guinness Atkinson Asset Management, Inc. for the period stated and is not intended to be a forecast of future events, a guarantee of future results, or investment advice. Opinions, Fund holdings and sector allocations are subject to change at any time, and are not recommendations to buy or sell any security.
33
GUINNESS ATKINSON CHINA & HONG KONG FUND
Growth of $10,000
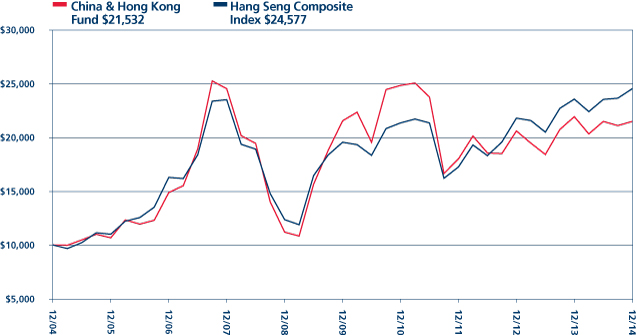
Average Annual Total Return
Periods Ended December 31, 2014
| One Year | | Five Year | | Ten Year | |
| | -1.97 | % | | | -0.03 | % | | | 7.97 | % | |
Performance data quoted represents past performance and does not guarantee future results. The investment return and principal value of an investment will fluctuate so that an investor's shares, when redeemed, may be worth more or less than their original cost. Current performance of the Fund may be lower or higher than the performance quoted. Performance data current to the most recent month end may be obtained by visiting www.gafunds.com.
Total returns for certain periods reflect a fee waiver in effect and in the absence of this waiver, the total returns would be lower. Returns reflect the reinvestment of distributions made by the Fund, if any. The graph and the performance table above do not reflect the deduction of taxes that a shareholder would pay on Fund distribution or the redemption of Fund shares. The Fund imposes a 2% redemption fee on shares held less than 30 days.
The Hang Seng Composite Index is a market-capitalization weighted index that comprises the top 200 companies listed on the Hong Kong Stock Exchange, based on the average market capitalization for the past twelve months. The index referenced in this chart is not available for investment and does not incur expenses.
34
FUND HIGHLIGHTS at December 31, 2014
GUINNESS ATKINSON CHINA & HONG KONG FUND
# of Holdings in Portfolio: | | 35 | |
Portfolio Turnover: | | 15.1% | |
% of Stocks in Top 10: | | 47.6% | |
Fund Manager: | | | |
Edmund Harriss | | | |
Top 10 Holdings (% of net assets) | | | | | | | |
NetEase Inc. - ADR | | | 6.8 | % | | China Construction Bank Corp. - H Shares | | | 4.5 | % | |
Lenovo Group Ltd. | | | 5.9 | % | | China Merchants Bank Co., Ltd. - H Shares | | | 4.0 | % | |
Tencent Holdings Ltd. | | | 5.5 | % | | db x-trackers CSI300 INDEX ETF | | | 4.0 | % | |
Industrial & Commercial Bank of China Ltd. - H Shares | | | 4.6 | % | | BOC Hong Kong Holdings Ltd. | | | 3.9 | % | |
China Minsheng Banking Corp. Ltd. | | | 4.6 | % | | CNOOC Ltd. | | | 3.8 | % | |
Industry Breakdown (% of net assets) | | | | | | | |
Commercial Banks | | | 23.9 | % | | Electronic Component - Miscellaneous | | | 3.5 | % | |
Computers | | | 6.9 | % | | Airlines | | | 3.0 | % | |
Internet Content - Entertainment | | | 6.8 | % | | Cellular Telecommunications | | | 2.5 | % | |
Internet Application Software | | | 5.5 | % | | Coal | | | 2.4 | % | |
Building Products | | | 5.4 | % | | Real Estate Operations/Development | | | 2.3 | % | |
Auto - Cars/Light Trucks | | | 4.8 | % | | Web Portals/ISP | | | 2.2 | % | |
Casino Hotels | | | 4.4 | % | | Retail - Automobile | | | 2.1 | % | |
Exchange Traded Funds | | | 4.0 | % | | Public Thoroughfares | | | 2.0 | % | |
Oil Company - Exploration & Production | | | 3.8 | % | | Distribution/Wholesale | | | 1.6 | % | |
Telecommunication Equipment | | | 3.7 | % | | Shipbuilding | | | 1.5 | % | |
Auto/Truck Parts & Equipment | | | 3.7 | % | | Machinery - General Industries | | | 0.8 | % | |
Gas - Distribution | | | 3.6 | % | | Apparel Manufacturers | | | 0.3 | % | |
Oil Company - Integrated | | | 3.5 | % | | | | | | | | | |
35
SCHEDULE OF INVESTMENTS
at December 31, 2014
GUINNESS ATKINSON CHINA & HONG KONG FUND
Shares | | COMMON STOCKS: 104.2% | | Value | |
Airlines: 3.0% | | | |
| | 1,187,000 | | | Cathay Pacific Airways Ltd. | | $ | 2,582,872 | | |
Apparel Manufacturers: 0.3% | | | |
| | 1,496,000 | | | Global Brands Group Holding Ltd.* | | | 292,416 | | |
Auto/Truck Parts & Equipment: 3.7% | | | |
| | 750,120 | | | Weichai Power Co., Ltd. - H Shares | | | 3,148,293 | | |
Auto – Cars/Light Trucks: 4.8% | | | |
| | 1,600,000 | | | Dongfeng Motor Group Co., Ltd. - H Shares | | | 2,236,687 | | |
| | 5,975,000 | | | Geely Automobile Holdings Ltd. | | | 1,885,552 | | |
| | | | | | | | 4,122,239 | | |
Building Products: 5.4% | | | |
| | 733,000 | | | Anhui Conch Cement Co., Ltd. - H Shares | | | 2,733,616 | | |
| | 3,793,000 | | | China Lesso Group Holdings Ltd. | | | 1,847,996 | | |
| | | | | | | | 4,581,612 | | |
Casino Hotels: 4.4% | | | |
| | 397,000 | | | Galaxy Entertainment Group Ltd. | | | 2,209,966 | | |
| | 1,862,000 | | | NagaCorp. Ltd. | | | 1,517,345 | | |
| | | | | | | | 3,727,311 | | |
Cellular Telecommunications: 2.5% | | | |
| | 181,500 | | | China Mobile Ltd. | | | 2,132,194 | | |
Coal: 2.4% | | | |
| | 689,000 | | | China Shenhua Energy Co Ltd. - H Shares | | | 2,029,081 | | |
Commercial Banks: 23.9% | | | |
| | 1,001,000 | | | BOC Hong Kong Holdings Ltd. | | | 3,332,736 | | |
| | 4,763,670 | | | China Construction Bank Corp. - H Shares | | | 3,877,050 | | |
| | 1,379,000 | | | China Merchants Bank Co., Ltd. - H Shares | | | 3,441,366 | | |
| | 2,988,000 | | | China Minsheng Banking Corp. Ltd. | | | 3,896,506 | | |
| | 117,681 | | | Dah Sing Financial Holdings Ltd. | | | 682,839 | | |
| | 140,810 | | | HSBC Holdings PLC | | | 1,339,635 | | |
| | 5,386,330 | | | Industrial & Commercial Bank of China Ltd. - H Shares | | | 3,912,832 | | |
| | | | | | | | 20,482,964 | | |
Computers: 6.9% | | | |
| | 86,500 | | | ChinaCache International Holdings Ltd. - ADR* | | | 794,935 | | |
| | 3,883,000 | | | Lenovo Group Ltd. | | | 5,062,299 | | |
| | | | | | | | 5,857,234 | | |
Distribution/Wholesale: 1.6% | | | |
| | 1,496,000 | | | Li & Fung Ltd. | | | 1,400,574 | | |
Electronic Component – Miscellaneous: 3.5% | | | |
| | 565,000 | | | AAC Technologies Holdings Inc. | | | 3,002,549 | | |
The accompanying notes are an integral part of these financial statements.
36
Shares | | COMMON STOCKS: 104.2% (Continued) | | Value | |
Exchange Traded Funds (ETFs): 4.0% | | | |
| | 3,443,900 | | | db x-trackers CSI300 INDEX ETF | | $ | 3,379,660 | | |
Gas – Distribution: 3.6% | | | |
| | 397,000 | | | Beijing Enterprises Holdings Ltd. | | | 3,103,532 | | |
Internet Application Software: 5.5% | | | |
| | 329,500 | | | Tencent Holdings Ltd. | | | 4,727,777 | | |
Internet Content – Entertainment: 6.8% | | | |
| | 58,775 | | | NetEase Inc. - ADR | | | 5,826,953 | | |
Machinery – General Industries: 0.8% | | | |
| | 2,430,000 | | | Chen Hsong Holdings | | | 659,734 | | |
Oil Company – Integrated: 3.5% | | | |
| | 2,720,000 | | | PetroChina Co., Ltd. - H Shares | | | 3,023,885 | | |
Oil Company – Exploration & Production: 3.8% | | | |
| | 2,431,000 | | | CNOOC Ltd. | | | 3,288,499 | | |
Public Thoroughfares: 2.0% | | | |
| | 2,610,000 | | | Shenzhen Expressway Co., Ltd. - H Shares | | | 1,729,676 | | |
Real Estate Operations/Development: 2.3% | | | |
| | 2,769,000 | | | Soho China Ltd. | | | 1,946,981 | | |
Retail – Automobile: 2.1% | | | |
| | 3,100,000 | | | Baoxin Auto Group Ltd. | | | 1,780,103 | | |
Shipbuilding: 1.5% | | | |
| | 1,396,000 | | | Yangzijiang Shipbuilding Holdings Ltd. | | | 1,267,822 | | |
Telecommunication Equipment: 3.7% | | | |
| | 221,800 | | | VTech Holdings Ltd. | | | 3,173,662 | | |
Web Portals/ISP: 2.2% | | | |
| | 35,250 | | | Sohu.com Inc.* | | | 1,874,595 | | |
| | | | | Total Common Stocks
(cost $68,894,520) | | | 89,142,218 | | |
| | | | | Total Investments in Securities
(cost $68,894,520): 104.2% | | | 89,142,218 | | |
| | | | | Liabilities in Excess of Other Assets: (4.2%) | | | (3,557,744 | ) | |
| | | | | Net Assets: 100.0% | | $ | 85,584,474 | | |
* Non-income producing security.
ADR - American Depository Receipt
The accompanying notes are an integral part of these financial statements.
37
DIVIDEND BUILDER FUND for the period ended December 31, 2014
1. Performance
AVERAGE ANNUALIZED TOTAL RETURN
| | | 6 Months
(actual) | | 1 Year
(actual) | | Since
Inception
(March 30, 2012) | |
Fund | | | -2.70 | % | | | 4.99 | % | | | 13.86 | % | |
Benchmark Index: | |
MSCI World Index | | | -0.87 | % | | | 5.62 | % | | | 13.17 | % | |
The Fund's gross expense ratio is 5.47% and net expense ratio is 0.68% per the Summary Prospectus dated May 1, 2014. The Advisor has contractually agreed to waive a portion of its advisory fees and/or reimburse other Fund expenses so that the Fund's ratio of expenses to average daily net assets will not exceed 0.68% (excluding Acquired Fund Fees and Expenses, interest, taxes, dividends on short positions and extraordinary expenses) through at least March 31, 2016. To the extent that the Advisor waives fees and/or reimburses expenses, it may seek repayment of a portion or all of such amounts at any time within the three fiscal years after the fiscal year in which such amounts were waived and/or reimbursed, subject to the applicable cap.
Performance data quoted represents past performance and does not guarantee future results. The investment return and principal value of an investment in the Fund will fluctuate so that an investor's shares, when redeemed, may be worth more or less than their original cost. Current performance of the Fund may be lower or higher than the performance quoted. Performance data current to the most recent month-end may be obtained by visiting www.gafunds.com, or calling (800) 915-6565.
In 2014 the Dividend Builder Fund produced a total return of 4.99%. The Fund underperformed the MSCI World Index by 0.63% over the period.
2. Activity
Portfolio turnover was particularly low in 2014, even by our own historical standards – we only made two purchases and three sales leaving the portfolio with 35 holdings by the end of the year.
In February we sold our position in Northrop Grumman and replaced it with Li & Fung. We had bought US defense contractor Northrop Grumman in March 2013. When we looked at the valuation multiples back then we found the company was trading at the lower end of its ten year range, with a 2014 P/E of 9x. We appreciated the concerns surrounding defense spending cuts, but ultimately we thought that the valuation multiples had gone too far.
When we initiated the position, the source of return we felt most confident about was the dividend stream; the company had grown its dividend for the last ten years, the payout ratio was very modest at 30%, and we expected the impact from earnings declines to be slower than the market was forecasting. Share price overreaction on the downside and our willingness to be patient also gave us some confidence that we could derive a return from a re-rating (multiple expansion). Finally, earnings growth was clearly quite uncertain.
We decided to sell it in February this year as sentiment had turned quite rapidly. The total return over the holding period was 80.3% (in USD). Given the relatively short holding period, the proportion of total return from dividends was only 2.5%, while 75.9% came from price appreciation. Of this price appreciation, more than half came from price multiple expansion, and the remainder from earnings forecast growth.
To replace it we bought a position in Hong Kong-listed Li & Fung, which is a global outsourcing company. It's an interesting example of a company that is listed in Asia but derives the bulk of its revenues from outside Asia (88%, derived mainly from the US and Europe). Just like Northrop Grumman it was trading at the low end of its ten year valuation range when we bought it. Partly this was due to general fear surrounding China and emerging market-listed companies, and partly because the holiday season in the US the previous year was a little disappointing. They also took a restructuring charge on the US arm of their business. So there were reasons why the valuation was attractive, but we have to remember this is another company that has a ten year history of generating top quartile return on capital, and it weathered the financial crisis extremely well.
Our level of confidence in terms of the sources of total return was the same as Northrop Grumman. Dividends, then price multiple expansion, and finally earnings growth. But we may well have to wait considerably longer than we did with Northrop Grumman.
38
In February we also sold our position in Vodafone after Verizon's acquisition of Vodafone's stake in Verizon Wireless. Vodafone was a company whose return on capital was already in a state of decline, and we concluded that once the Verizon wireless stake was gone the return on capital was likely to fall below our threshold level.
In June we decided to sell our position in tobacco company Reynolds American and bought Cisco. Reynolds American was a company we have owned since the launch of the Fund, and it has provided a good return, more than doubling in value over this period (119.4% in USD). The consensus bear case on tobacco companies over this period has always focused on falling volumes because of campaigns against smoking, the threat of plain packaging, and the tax burden on consumers. We don't disagree with any of these specific threats, but we did also observe that tobacco companies in general were able to offset falling volumes with an increase in price.
When you look at Reynolds American specifically, the expectation for revenues in 2014 was only around 2% lower than the company's reported revenues in 2010. Over this period the company has also managed to grow gross, operating and net margins quite substantially, leading to a healthy growth in cash flow. Net income has grown by 23% (in USD) over our holding period. When combined with an 8% reduction in shares outstanding through share buybacks, this translates into 33% earnings per share growth.
When we initially bought the company back in 2010, it was trading on a modest one-year forward P/E ratio of 13.0x, whereas by June of this year it was trading on 17.7x. Therefore we have certainly seen a sentiment improvement towards the business, and the return due to price multiple expansion equates to 36%.
We also received a healthy growing dividend stream over our holding period, with the company expected to pay out $2.68 in 2014 vs $2.15 in 2011, representing a growth of 25%. Dividends represented 20.6% of the total return.
In the end we decided to sell the position largely on the rerating of its valuation, which has coincided with merger and acquisition activity in the sector. The risks to the business remain the same as when we bought it, but the potential for upside from here was, in our opinion, much reduced, despite the prospect for a steady dividend (but with likely lower growth going forward). In place of Reynolds American we bought a position in Cisco. Cisco only started paying a dividend in 2011 and is an interesting example of what has historically been considered a growth company morphing into more of a steady state. Like many large-cap IT companies, Cisco is awash with cash and short-term investments – over $50 billion, which compares to the company's market capitalisation of $126 billion (when we initiated our position).
We also like the company's geographic diversification, with 59% of revenues coming from North America, 25% from Europe and 16% from Asia-Pacific.
Its balance sheet also looks extremely healthy with a (gross) debt to equity ratio of just 27%, total debt to Earnings Before Interest & Tax (EBIT) of just 2.1x, and interest cover of over 19x.
Revenue has been growing modestly over the last few years, and margins are stable. Acquisitions have been a significant part of how Cisco has managed to maintain its edge over the last 10 years, and it has largely financed these through free cash flow generation. Given the amount of cash on the balance sheet and the steady, but not spectacular growth prospects, we believe there is scope for a very reliable dividend, with potential growth. The payout ratio is around 35% and the company currently offered a prospective yield for 2015 of 3.2% when we initiated the position.
Most importantly, the valuation was attractive, with the company trading on a one-year forward P/E ratio of 12.1x, which was certainly cheap relative to its historical range, its peers, and the broad market.
Time will tell where the total return from this position will come from. But we feel very confident that if we look back in three years' time we will have received a very healthy proportion of the total return from the dividend. The price multiple looks attractive even when you take the cash into consideration, and there is still opportunity for earnings growth, but how the proportion of any future total return will split between these two is uncertain.
3. Portfolio Position
The effect of these changes on the sector and geographic breakdown of the portfolio was commensurately modest. Over the 12 months our exposure to Telcos, Industrials and Consumer Staples reduced while we increased our exposure to Consumer Discretionary and IT.
39
The Fund has maintained its zero exposure to both the materials and utilities sectors.
Sector Allocation at 12/31/14 | |
Consumer Discretionary | | | 7.7 | % | | Information Technology | | | 6.4 | % | |
Consumer Staples | | | 17.7 | % | | Materials | | | 0.0 | % | |
Energy | | | 9.1 | % | | Telecommunication Services | | | 6.3 | % | |
Financials | | | 18.4 | % | | Utilities | | | 0.0 | % | |
Health Care | | | 15.8 | % | | Cash | | | 0.2 | % | |
Industrials | | | 18.4 | % | | | | | 100.0 | % | |
4. Dividend
The trailing twelve months dividend distributed by the Fund was $0.471 per share.
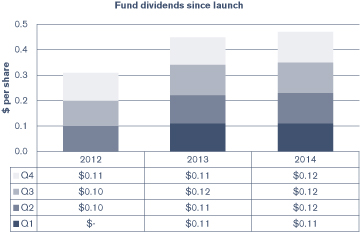
5. Outlook
As interested as we are in the macro environment we don't spend any time trying to make big macro forecasts and therefore don't have any particularly interesting views to share with you. We prefer to prioritise our time on the three core pillars of our investment process: Quality, value and growing dividends, as we believe these will ultimately drive our returns.
This will continue to be our priority in 2015 and beyond.
Thank you for your continued support as we look forward to updating you with the Fund's progress over the coming year.


Matthew Page Ian Mortimer January 2015
40
The Fund invests in foreign securities, which involve political, economic and currency risks, greater volatility, and differences in accounting methods. These risks are greater for emerging markets. The Fund invests in small- or mid-cap companies, which involve additional risks such as limited liquidity and greater volatility.
The MSCI World Index is a free float-adjusted market capitalization weighted index that is designed to measure the equity market performance of developed markets.
PER or P/E – Price to Earnings ratio is calculated by dividing current price of the stock by the company's trailing months' earnings per share.
Return on Capital (ROC) is a ratio measuring the profitability of a firm expressed as a percentage of funds acquired from investors and lenders.
The debt to equity ratio is a measure of a company's financial leverage calculated by dividing its total liabilities by stockholders' equity.
Free cash flow represents the cash that a company is able to generate after laying out the money required to maintain or expand its asset base.
Diversification does not assure a profit nor protect against loss in a declining market.
Growth stocks typically are more volatile than value stocks; however, value stocks have a lower expected growth rate in earnings and sales.
Please refer to the Schedule of Investments for details on Fund holdings. Current and future portfolio holdings are subject to risk.
The information provided herein represents the opinion of Guinness Atkinson Asset Management, Inc. for the period stated and is not intended to be a forecast of future events, a guarantee of future results, or investment advice. Opinions, Fund holdings and sector allocations are subject to change at any time, and are not recommendations to buy or sell any security.
41
GUINNESS ATKINSON DIVIDEND BUILDER FUND
Growth of $10,000

Average Annual Total Return
Periods Ended December 31, 2014
| One Year | | Since Inception
(03/30/12) | |
| | 4.99 | % | | | 13.86 | % | |
*Inception date 03/30/12.
Performance data quoted represents past performance and does not guarantee future results. The investment return and principal value of an investment will fluctuate so that an investor's shares, when redeemed, may be worth more or less than their original cost. Current performance of the Fund may be lower or higher than the performance quoted. Performance data current to the most recent month end may be obtained by visiting www.gafunds.com.
Total returns reflect a fee waiver in effect and in the absence of this waiver, the total returns would be lower. Returns reflect the reinvestment of distributions made by the Fund, if any. The graph and the performance table above do not reflect the deduction of taxes that a shareholder would pay on Fund distribution or the redemption of Fund shares.
The MSCI World Index is a free float-adjusted market capitalization weighted index that is designed to measure the equity market performance of developed markets.
42
FUND HIGHLIGHTS at December 31, 2014
GUINNESS ATKINSON DIVIDEND BUILDER FUND
# of Holdings in Portfolio: | | 35 | |
Portfolio Turnover: | | 7.6% | |
% of Stocks in Top 10: | | 33.4% | |
Fund Managers: | | | |
Ian Mortimer | | | |
Matthew Page | | | |
Top 10 Holdings (% of net assets) | | | | | | | |
AbbVie Inc. | | | 3.7 | % | | Illinois Tool Works Inc. | | | 3.3 | % | |
General Dynamics Corp. | | | 3.5 | % | | H&R Block Inc. | | | 3.2 | % | |
ICAP PLC | | | 3.5 | % | | Willis Group Holdings PLC | | | 3.2 | % | |
Procter & Gamble Co/The | | | 3.4 | % | | Cisco Systems Inc. | | | 3.1 | % | |
China Mobile Ltd. - ADR | | | 3.4 | % | | Microsoft Corp. | | | 3.1 | % | |
Industry Breakdown (% of net assets) | | | | | | | |
Pharmaceuticals | | | 9.8 | % | | Medical - Generic Drugs | | | 3.1 | % | |
Aerospace/Defense | | | 9.2 | % | | Beverages - Non-alcoholic | | | 3.0 | % | |
Oil Company - Integrated | | | 6.6 | % | | Finance - Other Services | | | 2.9 | % | |
Insurance Brokers | | | 6.2 | % | | Life/Health Insurance | | | 2.9 | % | |
Cellular Telecommunications | | | 6.2 | % | | Tobacco | | | 2.9 | % | |
Food-Miscellaneous/Diversified | | | 5.3 | % | | Soap & Cleaning Prepar | | | 2.8 | % | |
Finance - Investment Banker/Broker | | | 3.5 | % | | MRI/Medical Diagnostics Imaging | | | 2.7 | % | |
Cosmetics & Toiletries | | | 3.4 | % | | Toys | | | 2.6 | % | |
Diversified Manufactured Operations | | | 3.4 | % | | Investment Management/Advisory Services | | | 2.5 | % | |
Commercial Service - Finance | | | 3.2 | % | | Power Conversion/Supply Equipment | | | 2.4 | % | |
Networking Products | | | 3.1 | % | | Oil Company - Exploration & Production | | | 2.3 | % | |
Applications Software | | | 3.1 | % | | Distribution/Wholesale | | | 1.8 | % | |
Electronics - Military | | | 3.1 | % | | | | | | | |
43
SCHEDULE OF INVESTMENTS
at December 31, 2014
GUINNESS ATKINSON DIVIDEND BUILDER FUND
Shares | | COMMON STOCKS: 98.0% | | Value | |
Australia: 2.7% | | | |
| | 9,430 | | | Sonic Healthcare Ltd. | | $ | 141,616 | | |
China: 2.3% | | | |
| | 890 | | | CNOOC Ltd. - ADR | | | 120,542 | | |
France: 7.3% | | | |
| | 2,030 | | | Danone SA | | | 133,547 | | |
| | 1,720 | | | Schneider Electric SA | | | 124,978 | | |
| | 2,290 | | | Total SA | | | 118,071 | | |
| | | | | | | | 376,596 | | |
Germany: 3.0% | | | |
| | 2,130 | | | Deutsche Boerse AG | | | 152,634 | | |
Hong Kong: 5.2% | | | |
| | 2,970 | | | China Mobile Ltd. - ADR | | | 174,695 | | |
| | 100,000 | | | Li & Fung Ltd. | | | 93,621 | | |
| | | | | | | | 268,316 | | |
Israel: 3.1% | | | |
| | 2,810 | | | Teva Pharmaceutical Industries Ltd. - ADR | | | 161,603 | | |
Italy: 1.9% | | | |
| | 5,560 | | | ENI SpA | | | 97,106 | | |
Netherlands: 2.4% | | | |
| | 3,760 | | | Royal Dutch Shell PLC - Class A | | | 125,847 | | |
South Africa: 2.8% | | | |
| | 13,300 | | | Vodacom Group Ltd. | | | 146,878 | | |
United Kingdom: 23.2% | | | |
| | 19,340 | | | Aberdeen Asset Management PLC | | | 129,174 | | |
| | 21,750 | | | BAE Systems PLC | | | 158,776 | | |
| | 25,736 | | | ICAP PLC | | | 179,513 | | |
| | 3,400 | | | Imperial Tobacco Group PLC | | | 148,897 | | |
| | 1,820 | | | Indivior PLC* | | | 4,238 | | |
| | 16,700 | | | Meggitt PLC | | | 133,489 | | |
| | 1,820 | | | Reckitt Benckiser Group PLC | | | 146,822 | | |
| | 3,440 | | | Unilever PLC | | | 139,735 | | |
| | 3,670 | | | Willis Group Holdings PLC | | | 164,453 | | |
| | | | | | | | 1,205,097 | | |
The accompanying notes are an integral part of these financial statements.
44
Shares | | COMMON STOCKS: 98.0% (Continued) | | Value | |
United States: 44.1% | | | |
| | 2,930 | | | AbbVie Inc. | | $ | 191,739 | | |
| | 2,450 | | | Aflac Inc. | | | 149,670 | | |
| | 3,370 | | | Arthur J Gallagher & Co. | | | 158,660 | | |
| | 5,870 | | | Cisco Systems Inc. | | | 163,274 | | |
| | 3,730 | | | Coca-Cola Co/The | | | 157,481 | | |
| | 1,330 | | | General Dynamics Corp. | | | 183,035 | | |
| | 4,910 | | | H&R Block Inc. | | | 165,369 | | |
| | 1,830 | | | Illinois Tool Works Inc. | | | 173,301 | | |
| | 1,530 | | | Johnson & Johnson | | | 159,992 | | |
| | 1,290 | | | L-3 Communications Holdings Inc. | | | 162,811 | | |
| | 4,310 | | | Mattel Inc. | | | 133,373 | | |
| | 2,700 | | | Merck & Co., Inc. | | | 153,333 | | |
| | 3,510 | | | Microsoft Corp. | | | 163,039 | | |
| | 1,930 | | | Procter & Gamble Co/The | | | 175,804 | | |
| | | | | | | | 2,290,881 | | |
| | | | | Total Common Stocks
(cost $4,649,503) | | | 5,087,116 | | |
| | | | | Total Investments in Securities
(cost $4,649,503): 98.0% | | | 5,087,116 | | |
| | | | | Other Assets less Liabilities: 2.0% | | | 105,779 | | |
| | | | | Net Assets: 100.0% | | $ | 5,192,895 | | |
* Non-income producing security.
ADR - American Depository Receipt
The accompanying notes are an integral part of these financial statements.
45
GLOBAL ENERGY FUND for the period ended December 31, 2014
1. Performance
AVERAGE ANNUALIZED TOTAL RETURNS
| | | 1 Year
(actual) | | 3 Years | | 5 Years | | 10 Years | |
Fund | | | -19.63 | % | | | 1.18 | % | | | 0.97 | % | | | 8.09 | % | |
Benchmark Index: | |
MSCI World Energy Index | | | -10.92 | % | | | 2.81 | % | | | 4.28 | % | | | 6.98 | % | |
S&P 500 Index | | | 13.66 | % | | | 20.34 | % | | | 15.42 | % | | | 7.66 | % | |
The Fund's expense ratio is 1.35% per the Summary Prospectus dated May 1, 2014. The Advisor has contractually agreed to waive a portion of its advisory fees and/or reimburse other Fund expenses so that the Fund's ratio of expenses to average daily net assets will not exceed 1.45% (excluding Acquired Fund Fees and Expenses, interest, taxes, dividends on short positions and extraordinary expenses) through at least June 30, 2015. To the extent that the Advisor waives fees and/or reimburses expenses, it may seek repayment of a portion or all of such amounts at any time within the three fiscal years after the fiscal year in which such amounts were waived and/or reimbursed, subject to the applicable cap.
Performance data quoted represents past performance and does not guarantee future results. The investment return and principal value of an investment in the Fund will fluctuate so that an investor's shares, when redeemed, may be worth more or less than their original cost. Current performance of the Fund may be lower or higher than the performance quoted. Performance data current to the most recent month-end may be obtained by visiting www.gafunds.com, or calling (800) 915-6565.
The Global Energy Fund in 2014 produced a total return of -19.63%. This compares to the total return of the MSCI World Energy Index of -10.92% and the S&P 500's total return of 13.66%.
It was a tough year for energy equities. The first half of 2014 delivered strong gains (the MSCI World Energy Index was up 14.3% to June 30 versus the MSCI World +6.6%), but the second half erased those gains, and more, as a result of the crude oil price weakness. In the second half of the year, the MSCI World Energy Index fell 22.0% (vs MSCI World -0.9%), ending 2014 with a total return of -10.9% versus the MSCI World +5.6%.
And the performance of the MSCI World Energy Index was only part of the story, with a number of energy equity subsectors finishing 2014 down by 20% to 50%, particularly those more levered to oil.
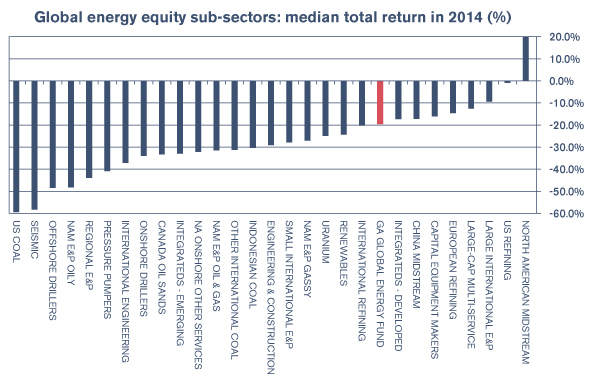
46
2. Activity
In February we sold our position in ConocoPhillips and switched into Enquest. We had held ConocoPhillips' stock since the launch of the Fund in 2008, over which period it outperformed the Fund by around 3% per annum, prompting us into taking profits. The purchase of Enquest represents a switch into North Sea exploration and production. We are attracted by Enquest's stage of development and expect the company to be able to grow its North Sea reserves and production significantly over the next few years.
In March we sold our position in Penn Virginia and switched into Bankers Petroleum. Penn Virginia had been one of the strongest performers in the portfolio over the previous year while Bankers Petroleum offered an attractive opportunity to gain exposure to cheap, OECD and Brent oil price-related production and reserves. Bankers Petroleum holds the licence to develop the Patos Marinza heavy oil field in Albania, the largest onshore oil field in Europe. We believe that the company has developed a very efficient and effective way of developing the field in a 'manufacturing process' that will deliver strong profitable growth for a number for years.
In May, we sold our position in Patterson UTI, the US based land drilling contractor, and switched into John Wood Group, the UK listed oil and gas engineering company. The purchase represented a further switch away from North American land based unconventional exposure towards more global themes.
In August we sold our position in Chevron and switched to a position in Occidental. Chevron had been the best performing super-major over the previous five years, the stock's total return outpacing both US and European peers. The purchase of Occidental was driven by the value we saw in the restructuring process that the company was undertaking. We saw a sharp focus from company management towards raising return on capital employed in 2015 and 2016, led by strong operational performance in the Permian basin.
In December, we sold positions in Bill Barrett Corp, California Resources Corp and Seventy Seven Energy Inc. In aggregate, the three holdings represented less than 100 basis point (bps) of the Fund at the end of November 2014. Both Seventy Seven Energy and California Resources Corp were spin-offs from other companies held in the Fund (from Chesapeake and Occidental respectively) while Bill Barrett was sold due to increased concerns over balance sheet strength and the company's ability to weather a longer period of lower oil prices.
3. Portfolio Position
The Fund at December 31, 2014 was on an average price to earnings ratio (P/E) versus the S&P 500 Index at 2,058.9 as set out in the table. (Based on S&P 500 'operating' earnings per share estimates of $56.9 for 2009, $83.8 for 2010, $96.4 for 2011, $96.8 for 2012, $107.3 for 2013 and $117.1 or 2014). This is shown in the following table:
| | | 2009 | | 2010 | | 2011 | | 2012 | | 2013 | | 2014 | |
Fund P/E | | | 14.4 | | | | 9.3 | | | | 9.1 | | | | 9.9 | | | | 10.3 | | | | 9.9 | | |
S&P 500 P/E | | | 36.4 | | | | 24.7 | | | | 21.4 | | | | 21.4 | | | | 19.3 | | | | 17.6 | | |
Premium (+)/Discount (-) | | | -60 | % | | | -62 | % | | | -57 | % | | | -54 | % | | | -47 | % | | | -44 | % | |
Average oil price (WTI$) | | $ | 61.9/ | bbl | | $ | 79.5/ | bbl | | $ | 95/ | bbl | | $ | 94/ | bbl | | $ | 98/ | bbl | | $ | 93/ | bbl | |
Source: Standard and Poor's; Guinness Atkinson Asset Management Ltd
47
The sector and geographic weightings of the portfolio at December 31, 2014 were as follows:
Sector Breakdown | |
| | | Dec. 31, 2013 | | Dec. 31, 2014 | |
Integrated | | | 39.6 | | | | 37.5 | | |
Exploration and production | | | 36.8 | | | | 38.1 | | |
Drilling | | | 6.8 | | | | 3.1 | | |
Equipment and services | | | 9.0 | | | | 13.1 | | |
Refining and marketing | | | 3.4 | | | | 3.5 | | |
Coal and consumables | | | 0.0 | | | | 0.0 | | |
Solar | | | 2.8 | | | | 3.5 | | |
Construction and engineering | | | 0.9 | | | | 0.0 | | |
Cash | | | 0.7 | | | | 1.2 | | |
Total | | | 100.0 | | | | 100.0 | | |
Geographic Breakdown | |
| | | Dec. 31, 2013 | | Dec. 31, 2014 | |
US | | | 57.2 | | | | 51.1 | | |
Canada | | | 10.0 | | | | 11.7 | | |
UK | | | 9.4 | | | | 12.0 | | |
Latin America | | | — | | | | — | | |
Europe | | | 16.9 | | | | 17.0 | | |
Hong Kong | | | 3.1 | | | | 3.6 | | |
Russia | | | 3.2 | | | | 3.0 | | |
Other | | | 0.2 | | | | 0.5 | | |
Cash | | | — | | | | 1.1 | | |
Total | | | 100.0 | | | | 100.0 | | |
4. Market Background
In terms of oil prices, 2014 was a year of two halves. The first half saw Brent oil trade between $100 and $120 per barrel, averaging $109, while the second half saw Brent collapsing. Although it averaged $91 in the second half of the year, it closed 2014 at around $55, close to its lowest level of the year. An acceleration in North American unconventional oil production growth, together with weakening Far East and European oil demand, combined in mid to late 2014 to weaken the supply/demand balance and pressure oil prices.
All eyes were then on Organization of the Petroleum Exporting Countries (OPEC) and how they might respond in their official meeting at the end of November. In the event, OPEC chose to leave their production quota unchanged, whilst providing no clarity on when a cut might be forthcoming, which caught the market by surprise. The lack of visibility and pricing volatility are continuing and are likely to persist through the early part of 2015. The major components to oil supply/demand for 2014 were as follows:
• Non-OPEC oil supply is likely to have grown by around 1.9 million barrels per day in 2014, principally 1.4m b/day from the US (driven by shale oil) and 0.2m b/day from Canada (driven by oil sands production). This is the largest annual growth from non-OPEC since 1978 and the fourth largest ever;
48
• OPEC oil supply (including natural gas liquids (NGLs)) is likely to have been essentially flat versus 2013 (36.7m b/day versus 36.8m b/day). Libyan production was around 0.4m b/day lower in 2014, offset by a slight recovery in Iranian supply (up 0.2m b/day) and growth of 0.1m b/day from both Saudi and Iraq. Importantly, however, Saudi announced a new production policy – to maintain their production regardless of price;
• Global oil demand is likely to have grown by around 0.6 million barrels per day in 2014, according to the International Energy Agency (IEA). This is made up of non-Organisation for Economic Co-operation and Development (OECD) oil demand growth of 1.1m b/day and OECD oil demand shrinkage of around 0.5m b/day, with Europe down 0.2m b/day and Japan down 0.3m b/day. We will not be surprised if the ultimate oil demand numbers for 2014 are revised upwards somewhat (as usually happens), but that still leaves 2014 as a mediocre oil demand growth year;
• OECD oil inventories at the end of November 2014 were estimated to be 2,712 million barrels (versus 2,615 million barrels at the end of November 2013). While still within the ten-year range, OECD inventories have therefore loosened and are now at elevated levels versus recent history.
For natural gas, 2014 ended up being a continuation of the same theme as in the past several years. Production growth from newer gas shales (the Marcellus in particular) along with by-product gas from new shale oil production (i.e. associated gas) regularly outran demand growth until the price dipped and coal-to-gas switching kicked in. As ever, weather was an important wildcard. Henry Hub averaged $4.26/gas per cubic feet (mcf) in 2014, versus $3.73 in 2013; this increase can largely be attributed to strong demand amid an unusually cold start to the year rather than anything fundamental. The year ended on a weak note, with Henry Hub testing $3 as natural gas inventories recovered to average levels having been severely depleted by the cold winter at the start of the year.
Outside the US, natural gas prices began to retreat from their highs, helped by warm winter weather in Europe and the weakening of the oil price. European natural gas averaged $8/mcf (vs $11/mcf in 2013) and Asian natural gas (as measured by the ICAP JKM North-East Asian liquefied natural gas (LNG contract) averaged $14.7/mcf (vs $16.6 in 2013).
5. Outlook
We expect the oil price to remain volatile for a number of months, with a recovery to $75+/bbl likely over the next 12 months. A necessary part of this outcome is for US oil shale growth to fall back by the end of 2015. After 2015 the likelihood is that the price will fluctuate quite widely, but move on an upwards trajectory as accelerating emerging country demand growth and flattening US shale oil growth slowly tighten the global oil supply/demand balance.
The oil price at $50-60/bbl is not yet at an economic extreme, leaving a reasonable chance that it continues to decline while the market starts to rebalance. An oil price in the $50-60/bbl range is not high enough to justify new investment in higher cost and more marginal non-OPEC projects. However, it is not low enough to warrant existing high cost producers to shut in reasonable volumes of supply. We believe that oil prices would need to fall to around $35-40/bbl to warrant this.
Saudi and other OPEC members are acting rationally in their response to the falling oil price. OPEC's decision not to cut production is borne out of a realisation that the falling price is principally a function of non-OPEC over-supply, making 'emergency' quota cuts a fools' errand as they would simply encourage more non-OPEC growth. We sense that Saudi are eyeing US shale oil growth and would prefer a shallower oil price recovery for the time being (i.e., one that doesn't allow US oil growth to accelerate unabated), rather than a 'V' shaped recovery that restores it to $100/bbl. If we are right, it is logical for Saudi & co to tolerate a lower oil price for as long as it takes to achieve this.
We expect oil demand to bounce back to growth of over 1m b/day (vs 0.6m b/day in 2014). Not only will there be a demand response to lower oil prices, but the negatives (Europe and Japan weakness) are not expected to persist and global GDP growth is expected to be stronger. The IEA is forecasting oil demand growth recovering to 0.9m b/day in 2015 (from 0.6m b/day in 2014). We won't be surprised if oil demand is substantially more robust than this, both near and long-term.
The most relevant precedent for comparison with current oil markets is probably 1985-87. This was an oil price fall caused by supply/demand imbalance as opposed to one related to an external demand shock like we saw in 2000/01 and 2008/09. In late 1985, Saudi did much as now, announcing that they would no longer support the oil price. The price fell by 65% before doubling over the following 12 months. If history were to repeat itself, we would see the oil price bottoming at $35-40/bbl, before recovering to $70-80/bbl.
The political backdrop to OPEC's actions remains as complicated as it ever has been. At time of writing, we have force majeure announced in Libya as heavy fighting continues close to the two oil export ports of Es Sider and Ras Lanuf (which have a
49
combined export capacity of 0.6m b/day). Islamic State (IS) in Iraq is regrouping. North-south tensions are very high in Nigeria. Saudi's King Abdullah passed away at 91.
Energy equities have now underperformed the broad market for longer than they did after the price declines in 1986, and indeed for longer than after any of the large price declines since 1970. If you believe, as we do, that a recovery in the oil price to $75-80/bbl is very likely (and to $100/bbl over a slightly longer timeframe), the case for accumulating energy equities at this level looks strong.
Our analysis shows that, at the equivalent point to today in the oil price declines of 1985-87 and 1996-98, an investment in the energy sector outperformed the S&P 500 over the following 1 year, 3 years and 5 years.

Tim Guinness January 2015
Will Riley Jonathan Waghorn
Fund investment team
The Fund invests in foreign securities, which involve political, economic and currency risks, greater volatility, and differences in accounting methods. These risks are greater for emerging markets. The Fund is non-diversified, meaning that its assets may be concentrated in fewer individual holdings than diversified funds. Therefore, the Fund is more exposed to individual stock volatility than diversified funds. The Fund invests in smaller companies, which involve additional risks such as limited liquidity and greater volatility. The Fund's focus on the energy sector to the exclusion of other sectors exposes the Fund to greater market risk and potential monetary losses than if the Fund's assets were diversified among various sectors.
The MSCI World Energy Index is an unmanaged index composed of more than 1,400 stocks listed on exchanges in the U.S., Europe, Canada, Australia, New Zealand and the Far East. The Standard & Poor's 500 Index is a market capitalization-weighted index composed of 500 widely held common stocks of U.S. companies. The MSCI World Index is a free float-adjusted market capitalization weighted index that is designed to measure the equity market performance of developed markets. These indices are unmanaged and not available for investment, and do not incur expenses.
Price to earnings (P/E) ratio (PER) reflects the multiple of earnings at which a stock sells and is calculated by dividing current price of the stock by the company's trailing 12 months' earnings per share.
Please refer to the Schedule of Investments for details on Fund holdings. Current and future portfolio holdings are subject to risk.
The information provided herein represents the opinion of Guinness Atkinson Asset Management, Inc. for the period stated and is not intended to be a forecast of future events, a guarantee of future results, or investment advice. Opinions, Fund holdings and sector allocations are subject to change at any time, and are not recommendations to buy or sell any security.
50
GUINNESS ATKINSON GLOBAL ENERGY FUND
Growth of $10,000
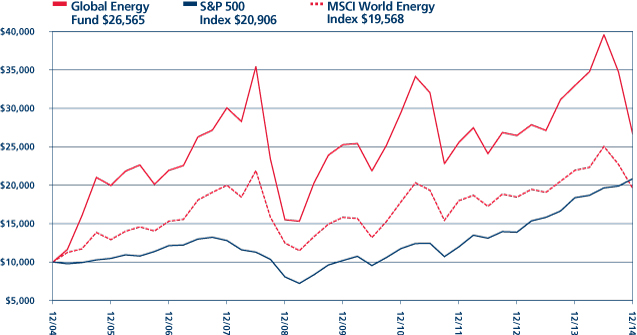
Average Annual Total Return
Periods Ended December 31, 2014
| One Year | | Five Year | | Ten Year | |
| | -19.63 | % | | | 0.97 | % | | | 8.09 | % | |
Performance data quoted represents past performance and does not guarantee future results. The investment return and principal value of an investment will fluctuate so that an investor's shares, when redeemed, may be worth more or less than their original cost. Current performance of the Fund may be lower or higher than the performance quoted. Performance data current to the most recent month end may be obtained by visiting www.gafunds.com.
Total returns for certain periods reflect a fee waiver in effect and in the absence of this waiver, the total returns would be lower. Returns reflect the reinvestment of distributions made by the Fund, if any. The graph and the performance table above do not reflect the deduction of taxes that a shareholder would pay on Fund distribution or the redemption of Fund shares.
The MSCI World Energy Index is an unmanaged index composed of more than 1,400 stocks listed on exchanges in the U.S., Europe, Canada, Australia, New Zealand and the Far East.
The S&P 500 Index is a broad based unmanaged index of 500 stocks, which is widely recognized as representative of the equity market in general. These indices are unmanaged, not available for investment and do not incur expenses.
51
FUND HIGHLIGHTS at December 31, 2014
GUINNESS ATKINSON GLOBAL ENERGY FUND
# of Holdings in Portfolio: | | 43 | |
Portfolio Turnover: | | 39.3% | |
% of Stocks in Top 10: | | 36.1% | |
Fund Managers: | | | |
Timothy W. N. Guinness | | | |
Will Riley | | | |
Jonathan Waghorn | | | |
Top 10 Holdings (% of net assets) | | | | | | | |
Chesapeake Energy Corp. | | | 3.9 | % | | Exxon Mobil Corp. | | | 3.6 | % | |
Devon Energy Corp. | | | 3.7 | % | | Hess Corp. | | | 3.5 | % | |
Newfield Exploration Co. | | | 3.7 | % | | Suncor Energy, Inc. | | | 3.5 | % | |
Occidental Petroleum Corp. | | | 3.6 | % | | Noble Energy Inc. | | | 3.5 | % | |
Royal Dutch Shell PLC - Class A | | | 3.6 | % | | Valero Energy, Corp. | | | 3.5 | % | |
Industry Breakdown (% of net assets) | | | | | | | |
Oil & Gas - Exploration & Production | | | 40.9 | % | | Energy - Alternate Sources | | | 3.5 | % | |
Oil & Gas - Integrated | | | 37.6 | % | | Oil & Gas - Drilling | | | 0.3 | % | |
Oil & Gas - Field Services | | | 13.0 | % | | Machinery - General Industries | | | 0.1 | % | |
Oil Refining & Marketing | | | 3.5 | % | | | | | |
52
SCHEDULE OF INVESTMENTS
at December 31, 2014
GUINNESS ATKINSON GLOBAL ENERGY FUND
Shares | | COMMON STOCKS: 98.9% | | Value | |
Energy – Alternate Sources: 3.5% | | | |
| | 132,620 | | | JA Solar Holdings Co. Ltd. - ADR* | | $ | 1,085,495 | | |
| | 121,300 | | | Trina Solar Ltd. - ADR* | | | 1,123,238 | | |
| | | | | | | | 2,208,733 | | |
Machinery – General Industries: 0.1% | | | |
| | 182,956 | | | Shandong Molong Petroleum Machinery Co., Ltd. - H Shares | | | 71,626 | | |
Oil & Gas – Drilling: 0.3% | | | |
| | 3,124,988 | | | Cluff Natural Resources PLC* | | | 188,736 | | |
Oil & Gas – Exploration & Production: 40.9% | | | |
| | 35,309 | | | Apache Corp. | | | 2,212,815 | | |
| | 322,100 | | | Bankers Petroleum Ltd.* | | | 903,810 | | |
| | 66,100 | | | Canadian Natural Resources Ltd. | | | 2,043,650 | | |
| | 30,070 | | | Carrizo Oil & Gas Inc.* | | | 1,250,912 | | |
| | 124,400 | | | Chesapeake Energy Corp. | | | 2,434,508 | | |
| | 37,600 | | | Devon Energy Corp. | | | 2,301,496 | | |
| | 132,890 | | | Dragon Oil PLC | | | 1,104,453 | | |
| | 988,710 | | | EnQuest PLC* | | | 540,202 | | |
| | 575,230 | | | JKX Oil & Gas PLC* | | | 107,586 | | |
| | 84,686 | | | Newfield Exploration Co.* | | | 2,296,684 | | |
| | 46,770 | | | Noble Energy Inc. | | | 2,218,301 | | |
| | 28,200 | | | Occidental Petroleum Corp. | | | 2,273,202 | | |
| | 46,199 | | | Ophir Energy PLC* | | | 100,313 | | |
| | 37,200 | | | QEP Resources Inc. | | | 752,184 | | |
| | 1,890,000 | | | Sino Gas & Energy Holdings Ltd.* | | | 290,131 | | |
| | 249,550 | | | SOCO International PLC | | | 1,167,510 | | |
| | 51,800 | | | Stone Energy Corp.* | | | 874,384 | | |
| | 25,000 | | | Triangle Petroleum Corp.* | | | 119,500 | | |
| | 119,408 | | | Trinity Exploration & Production PLC* | | | 48,894 | | |
| | 48,500 | | | Ultra Petroleum Corp.* | | | 638,260 | | |
| | 56,897 | | | Unit Corp.* | | | 1,940,188 | | |
| | 254,740 | | | WesternZagros Resources Ltd.* | | | 95,380 | | |
| | | | | | | | 25,714,363 | | |
Oil & Gas – Field Services: 13.0% | | | |
| | 50,800 | | | Halliburton Co. | | | 1,997,964 | | |
| | 90,880 | | | Helix Energy Solutions Group, Inc.* | | | 1,972,096 | | |
| | 232,210 | | | John Wood Group PLC | | | 2,135,726 | | |
| | 57,200 | | | ShawCor Ltd. DL | | | 2,087,519 | | |
| | | | | | | | 8,193,305 | | |
The accompanying notes are an integral part of these financial statements.
53
Shares | | COMMON STOCKS: 98.9% (Continued) | | Value | |
Oil & Gas – Integrated: 37.6% | | | |
| | 337,180 | | | BP PLC | | $ | 2,141,006 | | |
| | 118,750 | | | ENI SpA | | | 2,073,994 | | |
| | 24,400 | | | Exxon Mobil Corp. | | | 2,255,780 | | |
| | 406,460 | | | Gazprom OAO - ADR | | | 1,880,001 | | |
| | 30,143 | | | Hess Corp. | | | 2,225,156 | | |
| | 82,898 | | | OMV AG | | | 2,193,619 | | |
| | 1,949,000 | | | PetroChina Co., Ltd. - H Shares | | | 2,166,747 | | |
| | 67,430 | | | Royal Dutch Shell PLC - Class A | | | 2,256,881 | | |
| | 119,730 | | | Statoil ASA | | | 2,098,200 | | |
| | 69,976 | | | Suncor Energy, Inc. | | | 2,222,512 | | |
| | 40,860 | | | Total SA | | | 2,106,710 | | |
| | | | | | | | 23,620,606 | | |
Oil Refining & Marketing: 3.5% | | | |
| | 44,799 | | | Valero Energy, Corp. | | | 2,217,551 | | |
| | | | | Total Common Stocks
(cost $72,899,847) | | | 62,214,920 | | |
| | | WARRANTS: 0.0% | | | |
| | 829,161 | | | Cluff Natural Resources, Expiration 5/22/15, Excerise price £0.10*†^ | | | — | | |
| | | | | Total Warrants
(cost $0) | | | — | | |
| | | | | Total Investments in Securities
(cost $72,899,847): 98.9% | | | 62,214,920 | | |
| | | | | Other Assets less Liabilities: 1.0% | | | 691,224 | | |
| | | | | Net Assets: 100.0% | | $ | 62,906,144 | | |
* Non-income producing security.
† Illiquid. Illiquid securities represent 0.0% of net assets.
^ Fair value under direction of the Board of Trustees. Fair valued securities represent 0.0% of net assets.
ADR - American Depository Receipt
The accompanying notes are an integral part of these financial statements.
54
GLOBAL INNOVATORS FUND for the period ended December 31, 2014
1. Performance
AVERAGE ANNUALIZED TOTAL RETURNS
| | | 1 Year
(actual) | | 3 Years | | 5 Years | | 10 Years | |
Fund | | | 12.55 | % | | | 25.16 | % | | | 16.49 | % | | | 10.58 | % | |
Benchmark Index: | |
MSCI World Index | | | 5.62 | % | | | 16.23 | % | | | 10.94 | % | | | 6.75 | % | |
S&P 500 Index | | | 13.66 | % | | | 20.34 | % | | | 15.42 | % | | | 7.66 | % | |
NASDAQ Composite Index | | | 14.81 | % | | | 23.69 | % | | | 17.28 | % | | | 9.26 | % | |
The Fund's expense ratio is 1.47% per the Summary Prospectus dated May 1, 2014. The Advisor has contractually agreed to waive a portion of its advisory fees and/or reimburse other Fund expenses so that the Fund's ratio of expenses to average daily net assets will not exceed 1.55% (excluding Acquired Fund Fees and Expenses, interest, taxes, dividends on short positions and extraordinary expenses) through at least June 30, 2015. To the extent that the Advisor waives fees and/or reimburses expenses, it may seek repayment of a portion or all of such amounts at any time within the three fiscal years after the fiscal year in which such amounts were waived and/or reimbursed, subject to the applicable cap.
Performance data quoted represents past performance and does not guarantee future results. The investment return and principal value of an investment in the Fund will fluctuate so that an investor's shares, when redeemed, may be worth more or less than their original cost. Current performance of the Fund may be lower or higher than the performance quoted. Performance data current to the most recent month-end may be obtained by visiting www.gafunds.com, or calling (800) 915-6565.
2014 marked another good year for the Fund, despite the various headwinds seen in markets throughout the period. Our approach of looking for innovative, growing businesses helped us to identify a group of companies for the portfolio that managed to take advantage of the pockets of positive economic environments that were available, and our value discipline once again helped us avoid some of the companies 'priced to perfection' that stumbled in the year.
The approach of the Fund is not to provide access to the most innovative companies in the world but rather to look at companies using the 'prism' of innovation to highlight those we think might be winners in the future – and then only buy them if they are offering reasonable value compared to those future expectations. We are firm believers that innovative companies can outperform in the future and that a value discipline to stock selection will add meaningfully to that performance.
The Global Innovators Fund in 2014 produced a total return of 12.55%. The Fund outperformed its benchmark MSCI World Index by 6.93% in the year. For reference, the Fund underperformed the S&P 500 Index by 1.11%; and underperformed the NASDAQ Index by 2.26% over the period.
Equity markets were positive overall, despite a poor start to the year. And much like 2012, the year was characterized by quite significant moves to the downside and subsequent recoveries. Pleasingly, the Fund outperformed the benchmark MSCI World Index in every quarter of the year, whether the market was up or down. The individual quarterly performance of the Fund was +2.74%, +7.43%, -0.95%, and +2.95% in each of Q1, Q2, Q3, and Q4, respectively; versus the benchmark performance of +1.44%, 5.06%, -2.01%, and +1.16%.
We would not necessarily expect the Fund to outperform in both falling and rising markets (and it is certainly something we would never promise to achieve in the future!). The Fund is orientated towards growth, rather than value, and so typically we would expect the Fund to underperform in sharply down markets and outperform in rising markets. Analyzing the Fund performance in the year into its component parts of individual company performances we can see this expectation was broadly met but good stock selection helped 'boost' the performance of the fund in periods where the market was down. For example, in Q3 our holding in Gilead Sciences was up almost 30% despite the market falling 2%. Similarly our holdings in Intel, eBay, and Lenovo all had total returns in double figures over the same period.
Our large overweight to the information technology sector aided performance, with good individual performances from our holdings in Intel, Applied Materials, Taiwan Semiconductor, Ubisoft, and NVIDIA. Our holding in Shire, the UK pharmaceuticals company, benefitted from a bid for the entire company from rival Abbvie which also helped performance in the first half of the year.
55
On the negative side, the worst performing companies held in the portfolio came from those stocks in more cyclical sectors (like energy, industrials, and consumer discretionary) as worries surrounding the prospects for global growth came to the front of investors' minds near the end of the year. The two worst performing companies held in the Fund were BP and Schlumberger which were negatively affected by the sharp drop in the oil price which began its precipitous fall in the middle of the year.
Our zero weighting to the utilities and consumer staples sectors were a drag on Fund performance relatively as these sectors were in the top four of the ten broad sectors the index is composed of. However, our lack of exposure to the materials sector was an aide to performance as these companies struggled with lower commodity prices and a weakening of global demand.
2. Activity
In the first quarter we sold our holdings in Vodafone and Verizon following the latter's acquisition of the stake of Verizon Wireless it did not already own. In their place we purchased a new position in Li & Fung, a Hong Kong-listed global outsourcing company whose share price had been weakened by the selloff in emerging markets at the start of the year. We noted that over 60% of its revenues came from the US and over 20% from Europe, however, so had potentially been dragged down indiscriminately rather than anything necessarily specific to the company itself.
In the second quarter we made only one change to the portfolio: we sold our holding in CenturyLink and replaced it with a holding in Cisco, the information technology company. Cisco is the type of mature, incrementally innovative company we like to invest in – it has a long history of high and persistent return on capital which, to us at least, demonstrates its ability to defend its market share and prevent itself from becoming a 'company in decline'. At purchase the company was also trading on PE multiples less than 12 times which was at a decent discount to the broad market and its history and so provided a good entry point for purchase.
In the third quarter we made a number of changes to the portfolio; we sold our holdings in Ubisoft and Shire, and bought new positions in Xerox, Boeing, and Schlumberger. Ubisoft and Shire were holdings we had owned for a relatively short period of time for the fund, at less than one year apiece. We bought Ubisoft after a period of very weak performance in the share price and the subsequent rebound occurred much faster than we might have expected meaning the valuation rerated to such an extent we felt compelled to take profits and look for a better idea. Shire was the subject of a bid for the entire company from Abbvie. With the stock up just over 90% over our holding period (October 2013 to July 2014) and an increase in the potential offer not seemingly likely we decided to sell. Like Cisco, Xerox and Boeing represent the type of more mature companies which are incrementally innovative in the way they do business. Both were trading at reasonable valuations and also have long histories of high return on capital. Schlumberger is also a large capitalization company but has potentially better chances for growth, and as such we were happy to pay a slightly higher valuation multiple.
We made no changes to the portfolio in the final quarter of the year.
3. Portfolio Position
The portfolio on December 31, by our calculations, had a price to earnings ration (PER) of 15.7X 2014 earnings, and 14.8X 2015 earnings; a discount to the MSCI World Index equivalent price multiples of 11.0% and 4.3%.
Due to the purchases and sales made in the fourth quarter the exposure of the Fund decreased to the Telecoms sectors, and increased exposure to energy and industrials. The largest allocation in the fund remains to the IT sector at 43%. All other sector allocations remained largely unchanged.
Sector Allocation at 12/31/14 | |
Consumer Discretionary | | | 12.9 | % | | Information Technology | | | 42.7 | % | |
Consumer Staples | | | 0.0 | % | | Materials | | | 0.0 | % | |
Energy | | | 5.5 | % | | Telecommunication Services | | | 0.0 | % | |
Financials | | | 12.9 | % | | Utilities | | | 0.0 | % | |
Health Care | | | 3.0 | % | | Cash | | | 3.5 | % | |
Industrials | | | 19.5 | % | | | | | 100.0 | % | |
56
4. Outlook
In the 2012 annual report we wrote at the beginning of 2013 we summarised global equity valuations as:
"...not at extreme levels, and actually provide good value in many cases..."
In the 2013 annual report that we wrote as 2014 began we then stated in relation to this comment:
"At the risk of becoming a broken record, we think this statement rings as true today as it did then, with the exception that equity valuations are obviously higher now than they were at the end of last year. The areas of good value are also becoming smaller so our search for good companies at reasonable valuations has meant looking further afield...as the US performed particularly well relative to world markets over the year..."
With hindsight we can see that the US continued its strong performance, both relatively and in absolute terms which means valuations are at even higher levels. So does this mean the markets are uninvestable at these elevated levels? We think not, but caution is obviously required.
Following the financial crisis and subsequent fallout almost all equity markets were definitively cheap versus both historic averages and in absolute terms. The rebound in the next three to four years lifted most boats, but in 2013 and 2014 we started to observe divergences both regionally and across sectors. This means that one must be careful when assessing the overall macro environment but individual companies may be found that continue to offer good value. Our purchase of Cisco in late 2014 is a case in point. It ticks all the boxes of what should be expensive in today's environment: US-listed, large cap, information technology, stable margins. Yet we were still able to purchase this company for the Fund at a steep discount to the S&P500 valuation.
After periods of strong market performance it is more important than ever to focus on the valuations of the companies you are considering investing in. This is something that has been, and will continue to be, integral to the approach we take to running your Fund. We believe more than ever that innovative companies will best their peers over the long run, but that for these types of companies to provide a good return on investment you must be disciplined in when you purchase them. By demanding a reasonable discount to intrinsic value, and trying to avoid getting caught up in the 'next big thing', we believe we can avoid some of the most common pitfalls of investing in growth companies.
Only time will tell how markets evolve over the following year but our focus remains, as ever, on quality innovative companies that have shown the ability to consistently earn high levels of return on capital over a prolonged period. We continue to believe these innovative companies can navigate the economic cycle better than the average company and therefore should be well rewarded over the long-term.


Matthew Page Ian Mortimer January 2015
The Fund invests in foreign securities, which involve political, economic and currency risks, greater volatility, and differences in accounting methods. The Fund is non-diversified, meaning that its assets may be concentrated in fewer individual holdings than diversified funds. Therefore, the Fund is more exposed to individual stock volatility than diversified funds. The Fund invests in smaller companies, which involve additional risks such as limited liquidity and greater volatility.
The MSCI World Index is a free float-adjusted market capitalization weighted index that is designed to measure the equity market performance of developed markets. The Standard & Poor's 500 Index is a market capitalization-weighted index composed of 500 widely held common stocks of U.S. companies. The NASDAQ Composite Index is a market capitalization-weighted index that is designed to represent the performance of the National Market System, which includes over 5,000 stocks traded only over-the-counter and not on an exchange. These indices are unmanaged and not available for investment, and do not incur expenses.
Price to earnings (P/E) ratio (PER) reflects the multiple of earnings at which a stock sells and is calculated by dividing current price of the stock by the company's trailing 12 months' earnings per share.
Please refer to the Schedule of Investments for details on Fund holdings. Current and future portfolio holdings are subject to risk.
The information provided herein represents the opinion of Guinness Atkinson Asset Management, Inc. for the period stated and is not intended to be a forecast of future events, a guarantee of future results, or investment advice. Opinions, Fund holdings and sector allocations are subject to change at any time, and are not recommendations to buy or sell any security.
57
GUINNESS ATKINSON GLOBAL INNOVATORS FUND
Growth of $10,000
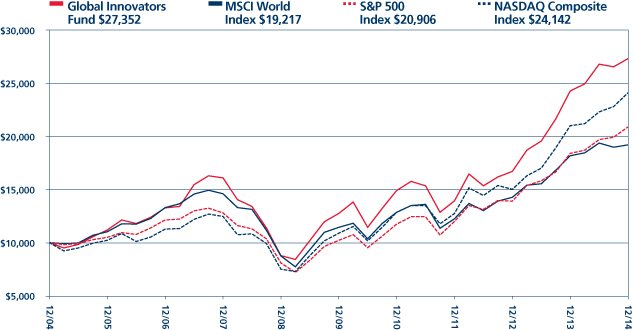
Average Annual Total Return
Periods Ended December 31, 2014
| One Year | | Five Year | | Ten Year | |
| | 12.55 | % | | | 16.49 | % | | | 10.58 | % | |
Performance data quoted represents past performance and does not guarantee future results. The investment return and principal value of an investment will fluctuate so that an investor's shares, when redeemed, may be worth more or less than their original cost. Current performance of the Fund may be lower or higher than the performance quoted. Performance data current to the most recent month end may be obtained by visiting www.gafunds.com.
Total returns for certain periods reflect a fee waiver in effect and in the absence of this waiver, the total returns would be lower. Returns reflect the reinvestment of distributions made by the Fund, if any. The graph and the performance table above do not reflect the deduction of taxes that a shareholder would pay on Fund distribution or the redemption of Fund shares.
The Fund's performance benchmark is changing from the NASDAQ Composite Index to the MSCI World Index, which more closely reflects the Fund's investment strategy.
The MSCI World Index is a free float-adjusted market capitalization weighted index that is designed to measure the equity market performance of developed markets. The Standard & Poor's 500 Index is an unmanaged index which is widely regarded as the standard for measuring large cap U.S. stock market performance. The NASDAQ Composite Index is a market capitalization weighted index that is designed to represent the performance of the National Market System which includes over 5,000 stocks traded only over-the-counter and not on an exchange. The indices referenced in this chart are not available for investment and do not incur expenses.
58
FUND HIGHLIGHTS at December 31, 2014
GUINNESS ATKINSON GLOBAL INNOVATORS FUND
# of Holdings in Portfolio: | | 30 | |
Portfolio Turnover: | | 14.4% | |
% of Stocks in Top 10: | | 33.2% | |
Fund Managers: | | | |
Matthew Page | | | |
Ian Mortimer | | | |
Top 10 Holdings (% of net assets) | | | | | | | |
Oracle Corp. | | | 3.5 | % | | QUALCOMM Inc. | | | 3.3 | % | |
Applied Materials Inc. | | | 3.4 | % | | Comcast Corp. - Class A | | | 3.3 | % | |
H&R Block, Inc. | | | 3.3 | % | | Danaher Corp. | | | 3.3 | % | |
Cisco Systems Inc. | | | 3.3 | % | | L-3 Communications Holdings Inc. | | | 3.3 | % | |
Samsung Electronics Co., Ltd. - GDR | | | 3.3 | % | | Check Point Software Technologies Ltd. | | | 3.2 | % | |
Industry Breakdown (% of net assets) | | | | | | | |
Semiconductor | | | 9.8 | % | | E-Commerce/Products | | | 3.2 | % | |
Electronic Components - Semiconductor | | | 9.5 | % | | Machinery | | | 3.2 | % | |
Electronics - Military | | | 6.4 | % | | Aerospace/Defense | | | 3.2 | % | |
Application Software | | | 6.4 | % | | Finance - Investment Bank/Broker | | | 3.2 | % | |
Computers | | | 6.2 | % | | Publishing - Newspapers | | | 3.2 | % | |
Medical - Biomedical | | | 6.2 | % | | Fiduciary Banks | | | 3.2 | % | |
Oil - Integrated | | | 5.4 | % | | Commercial Banks | | | 3.2 | % | |
Enterprise Software/Services | | | 3.5 | % | | Finance - Other Services | | | 3.1 | % | |
Commercial Services | | | 3.3 | % | | Power Conversion/Supply Equipment | | | 3.0 | % | |
Cable/Satellite TV | | | 3.3 | % | | Distribution/Wholesale | | | 2.8 | % | |
Diversified Manufacturing Operations | | | 3.3 | % | | | | | |
59
SCHEDULE OF INVESTMENTS
at December 31, 2014
GUINNESS ATKINSON GLOBAL INNOVATORS FUND
Shares | | COMMON STOCKS: 94.6% | | Value | |
Aerospace/Defense: 3.2% | | | |
| | 38,980 | | | Boeing Co. | | $ | 5,066,620 | | |
Application Software: 6.4% | | | |
| | 65,020 | | | Check Point Software Technologies Ltd.* | | | 5,108,621 | | |
| | 133,620 | | | PTC Inc.* | | | 4,897,173 | | |
| | | | | | | | 10,005,794 | | |
Cable/Satellite TV: 3.3% | | | |
| | 88,280 | | | Comcast Corp. - Class A | | | 5,121,123 | | |
Commercial Banks: 3.2% | | | |
| | 60,480 | | | Capital One Financial Corp. | | | 4,992,624 | | |
Commercial Services: 3.3% | | | |
| | 155,930 | | | H&R Block, Inc. | | | 5,251,722 | | |
Computers: 6.2% | | | |
| | 3,642,000 | | | Lenovo Group Ltd. | | | 4,748,105 | | |
| | 358,400 | | | Xerox Corp. | | | 4,967,424 | | |
| | | | | | | | 9,715,529 | | |
Distribution/Wholesale: 2.8% | | | |
| | 4,792,000 | | | Li & Fung Ltd. | | | 4,486,330 | | |
Diversified Manufacturing Operations: 3.3% | | | |
| | 59,710 | | | Danaher Corp. | | | 5,117,744 | | |
E-Commerce/Products: 3.2% | | | |
| | 90,990 | | | eBay, Inc.* | | | 5,106,359 | | |
Electronic Components – Semiconductor: 9.5% | | | |
| | 136,280 | | | Intel Corp. | | | 4,945,601 | | |
| | 242,055 | | | NVIDIA Corp. | | | 4,853,203 | | |
| | 8,610 | | | Samsung Electronics Co., Ltd. - GDR | | | 5,174,660 | | |
| | | | | | | | 14,973,464 | | |
Electronics – Military: 6.4% | | | |
| | 40,500 | | | L-3 Communications Holdings Inc. | | | 5,111,505 | | |
| | 179,870 | | | Ultra Electronics Holdings PLC | | | 5,017,190 | | |
| | | | | | | | 10,128,695 | | |
Enterprise Software/Services: 3.5% | | | |
| | 121,760 | | | Oracle Corp. | | | 5,475,547 | | |
Fiduciary Banks: 3.2% | | | |
| | 63,564 | | | State Street Corp. | | | 4,989,774 | | |
Finance – Investment Bank/Broker: 3.2% | | | |
| | 140,380 | | | TD Ameritrade Holding Corp. | | | 5,022,797 | | |
The accompanying notes are an integral part of these financial statements.
60
Shares | | COMMON STOCKS: 94.6% (Continued) | | Value | |
Finance – Other Services: 3.1% | | | |
| | 22,370 | | | IntercontinentalExchange, Inc. | | $ | 4,905,517 | | |
Machinery: 3.2% | | | |
| | 32,470 | | | Roper Industries, Inc. | | | 5,076,685 | | |
Medical – Biomedical: 6.2% | | | |
| | 187,325 | | | Cisco Systems Inc. | | | 5,210,445 | | |
| | 48,660 | | | Gilead Sciences, Inc.* | | | 4,586,692 | | |
| | | | | | | | 9,797,137 | | |
Oil – Integrated: 5.4% | | | |
| | 113,420 | | | BP PLC - ADR | | | 4,323,570 | | |
| | 49,050 | | | Schlumberger Ltd. | | | 4,189,361 | | |
| | | | | | | | 8,512,931 | | |
Power Conversion/Supply Equipment: 3.0% | | | |
| | 64,800 | | | Schneider Electric | | | 4,708,488 | | |
Publishing – Newspapers: 3.2% | | | |
| | 156,810 | | | Gannett Co, Inc. | | | 5,006,943 | | |
Semiconductor: 9.8% | | | |
| | 212,030 | | | Applied Materials Inc. | | | 5,283,788 | | |
| | 69,000 | | | QUALCOMM Inc. | | | 5,128,770 | | |
| | 225,079 | | | Taiwan Semiconductor Manufacturing Co., Ltd. - ADR | | | 5,037,268 | | |
| | | | | | | | 15,449,826 | | |
| | | | | Total Common Stocks
(cost $133,172,521) | | | 148,911,649 | | |
| | | | | Total Investments in Securities
(cost $133,172,521): 94.6% | | | 148,911,649 | | |
| | | | | Other Assets less Liabilities: 5.4% | | | 8,551,044 | | |
| | | | | Net Assets: 100.0% | | $ | 157,462,693 | | |
* Non-income producing security.
ADR - American Depository Receipt
GDR - Global Depository Receipt
The accompanying notes are an integral part of these financial statements.
61
RENMINBI YUAN & BOND FUND for the period ended December 31, 2014
1. Performance
| | | 1 Year | | 3 Years | | Since
Inception
(June 30, 2011) | |
Fund | | | -0.92 | % | | | 2.71 | % | | | 2.36 | % | |
Comparisons: | |
RMB Cash Offshore (CNH)* | | | -2.57 | % | | | 0.68 | % | | | 1.13 | % | |
RMB Cash Onshore (CNY)* | | | -2.44 | % | | | 0.48 | % | | | 1.17 | % | |
HSBC Offshore RMB Bond Index | | | 0.40 | % | | | 4.88 | % | | | 3.71 | % | |
*Net change in exchange rate versus U.S. dollar.
The Fund's gross expense ratio is 0.97% and net expense ratio is 0.90% per the Summary Prospectus dated May 1, 2014. The Advisor has contractually agreed to waive a portion of its advisory fees and/or reimburse other Fund expenses so that the Fund's ratio of expenses to average daily net assets will not exceed 0.90% (excluding Acquired Fund Fees and Expenses, interest, taxes, dividends on short positions and extraordinary expenses) through at least June 30, 2015. To the extent that the Advisor waives fees and/or reimburses expenses, it may seek repayment of a portion or all of such amounts at any time within the three fiscal years after the fiscal year in which such amounts were waived and/or reimbursed, subject to the applicable cap.
Performance data quoted represents past performance and does not guarantee future results. The investment return and principal value of an investment will fluctuate so that an investor's shares, when redeemed, may be worth more or less than their original cost. Current performance of the Fund may be lower or higher than the performance quoted. Performance data current to the most recent month-end may be obtained by visiting www.gafunds.com, or calling (800) 915-6565.
The Fund imposes a 2% redemption fee on the sales of shares held less than 30 days. Performance data quoted does not reflect this redemption fee. Total returns for certain periods reflect expense limitations in effect and, in the absence of these limitations, total returns would have been lower.
The Fund fell 0.92% over the year compared to a drop in the renminbi against the dollar of 2.57% and a rise in the HSBC Offshore Renminbi Bond Index of 0.40%.
Two themes dominated the offshore RMB market this year: amongst bonds it was the accelerated convergence between offshore and onshore yields; in the currency it was increased volatility in both the exchange rate and money market rates. The currency intervention by the central bank in the first half of the year designed to introduce 2-way volatility, was not repeated in the second half. The average yield on offshore RMB bonds, as measured by the HSBC Offshore Renminbi Bond index rose to 4.54% at the year end, up from 4.24% at the start of the quarter and 4.05% at the beginning of the year.
The convergence between onshore and offshore yields is largely the result of increased cross-border flows as new channels have opened up. The most eye-catching has been the establishment of the Shanghai-Hong Kong stock connect scheme which allows for daily flows north-bound up to RMB 13bn ($2.1bn) and RMB 10.5bn ($1.7bn) south-bound. The effect of this and other measures, such as the establishment of the Shanghai Free Trade Zone, has been tightened liquidity which pushed offshore bond yields higher. These met onshore bond yields which fell in response to expectations of easing monetary policy to the extent that the gap between onshore and offshore 10 year bond yields almost disappeared at the end of October.
The changing pattern of cross-border flows also had a significant impact on money market rates. Interbank rates for CNH have risen over 2% this year and have been significantly more volatile. The gap between 3-month CNH HIBOR and SHIBOR (Shanghai interbank rates) has narrowed from 3% at the start of the year to 0.91% at the end of 2014. Higher rates and yields have also come about as a result of higher two-way volatility in the exchange rate. There has been little evidence of further government intervention in the exchange rate during the quarter; instead it has been market forces that dictated the moves. Indeed since the end of September the central fixing rate for the CNY has strengthened against the dollar from RMB 6.1525 to RMB 6.1190 at the year end. At the end of the quarter the CNY spot rate was trading 1.43% weaker than the central fixing, and the CNH 0.33% below that.
62
RENMINBI YUAN & BOND FUND
2. Portfolio Position
The portfolio is 98% invested in offshore renminbi denominated bonds with 15% invested in Chinese and overseas government or supranational issuers, 36% of in overseas corporates and 47% in Chinese corporates. The overall portfolio is split 55% Chinese issuers and 43% international with the balance held in renminbi cash. By comparison, 78% of the offshore renminbi bond market consists of bonds from Chinese issuers, 22% from international. Approximately a quarter of the portfolio's holdings matured this year. Recent additions to the portfolio have all been bonds considered to be investment grade. We therefore added for example, bonds issued by the governments of the UK and British Columbia and by the Asian Development Bank. We also added a position in Caterpillar and in China Construction Bank.
3. Outlook and Strategy
The renminbi exchange rate is likely to become more volatile in the coming year as market forces increasingly come to dominate. The trade surplus appears now to be the most influential factor to determine the daily central fixing. We expect that seasonal factors which account for a smaller trade surplus in the first half of the year will push the central fixing weaker before recovering in the second half of the year. However we do not expect any substantial changes to currency policy: the overall trade surplus is rising; on balance the central banks regards a stronger currency as more beneficial than a weaker; internationalization is still the goal. Furthermore, there is a good chance the International Monetary Fund (IMF) may include the renminbi in late 2015 in its five-yearly review of the currencies basket its members can count toward official reserves.
RMB trade settlement remains a significant source of demand for the currency with 11.2% of the world's payments with China and Hong Kong using it in October. 50 countries settled more than 10% of their payments to China in RMB. The share of China's trade settled in RMB rose from 14.5% in the first eleven months of 2013 (11M 2013) to 23% in 11M 2014 which in money terms amounts to RMB3.4trn/$548bn in 2013 and RMB5.6trn/$910bn in 2014. Assuming 6% trade growth and a 33% share in 2015 this figure could rise to RMB8.4trn/$1.4trn in 2015. RMB deposits outside China are estimated to be RMB1.9 trillion ($305bn); half are in Hong Kong but other offshore centres are growing quickly. There are now 10 offshore clearing centres with UK and Germany added in March 2014, France in July, Australia and Canada in November 2014. RMB deposit figures for these markets are not yet available but are likely to be picking up in line with the experience in Taiwan, Singapore and Korea. The overall offshore pool could increase by 20% in 2015.
The more modest pace of offshore deposit growth should be seen against the backdrop of the rise in cross-border activity. Inbound direct investment has long been a feature of the China story but outbound investment has been much more muted. This is about to change significantly boosted by China's "One Belt, One Road" policy and the desire to apply some of their reserves more profitably. Outbound investment is also being encouraged with portfolio flows as evidenced by the establishment of the Shanghai-Hong Kong Stock Connect and by growth in the Renminbi – Qualified Domestic Institutional Investor scheme (now RMB770bn/$124bn and due to expand). The experimentation with Free Trade Zones (FTZ) is also helping to ease cross-border flows through cash pooling, for example. For years foreign investor corporations have had problems repatriating funds sitting in the onshore market. The regulator now permits fund movements in the form of inter-company loans which makes it easier. The new creation of Free Trade Units in Shanghai's banking system makes it even easier since inflows and outflows through these accounts do not require approval by SAFE. This amounts to a virtual offshore RMB market established within Mainland China. As the FTZ initiative is extended to Guangdong, Fujian and Tianjin these flows will probably increase.
In the offshore bond market we expect to see new issuance of bonds and certificates of deposit to be around RMB500bn/$80bn versus the maturity in 2015 of RMB96bn/$15bn of bonds and RMB235bn/38bn of bank certificates of deposit. We expect to see increasing volumes of bank CDs issued by the European and Canadian branches of Chinese banks as RMB business picks up in the newly established offshore centres. Amongst bond issuers we expect to see continued international presence but also a growing number of Chinese state owned enterprise (SOE) issuers seeking to fund overseas investment. Financial issuers both international and domestic are likely to remain the most active sector. Yields moved higher as the market priced in currency volatility and weakness and then moved lower following the interest rate cut onshore in November. We expect these two forces to be at play in the first half of 2015.

Edmund Harriss January 2015
63
RENMINBI YUAN & BOND FUND
The Fund invests in foreign securities, which involve political, economic and currency risks, greater volatility, and differences in accounting methods. These risks are greater for emerging markets. The Fund is non-diversified, meaning that its assets may be concentrated in fewer individual holdings than diversified funds. Therefore, the Fund is more exposed to individual stock volatility than diversified funds. The Fund invests in smaller companies, which involve additional risks such as limited liquidity and greater volatility. Investments in debt securities typically decrease in value when interest rates rise, which can be greater for longer-term debt securities. The Fund may invest in derivatives, which involves risks different from, and in certain cases, greater than the risks presented by traditional investments. Investments focused in a single geographic region may be exposed to greater risk than investments diversified among various geographic regions.
The HSBC Offshore Renminbi Bond Index tracks total return performance of renminbi-denominated and renminbi-settled bonds and certificates of deposit issued outside the People's Republic of China. This index is unmanaged and not available for investment, and does not incur expenses.
The RMB Cash Offshore (CNH) is the currency code for renminbi traded outside China in the offshore market.
The RMB Cash Onshore (CNY) is the international currency code for the renminbi.
Please refer to the Schedule of Investments for details on Fund holdings. Current and future portfolio holdings are subject to risk.
The information provided herein represents the opinion of Guinness Atkinson Asset Management, Inc. for the period stated and is not intended to be a forecast of future events, a guarantee of future results, or investment advice. Opinions, Fund holdings and sector allocations are subject to change at any time, and are not recommendations to buy or sell any security.
64
GUINNESS ATKINSON RENMINBI YUAN & BOND FUND
Growth of $10,000
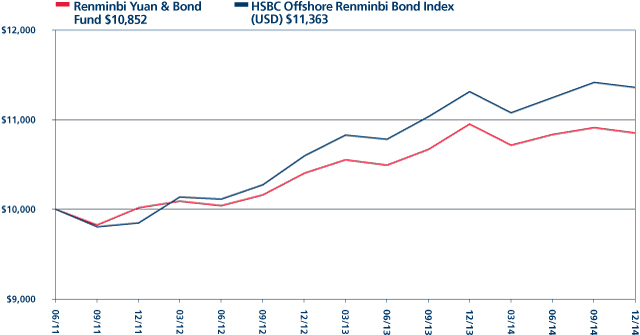
Average Annual Total Return
Periods Ended December 31, 2014
| One Year | | Since Inception
(06/30/11) | |
| | -0.92 | % | | | 2.36 | % | |
*Inception date 6/30/11.
Performance data quoted represents past performance and does not guarantee future results. The investment return and principal value of an investment will fluctuate so that an investor's shares, when redeemed, may be worth more or less than their original cost. Current performance of the Fund may be lower or higher than the performance quoted. Performance data current to the most recent month end may be obtained by visiting www.gafunds.com.
Total returns for certain periods reflect a fee waiver in effect and in the absence of this waiver, the total returns would be lower. Returns reflect the reinvestment of distributions made by the Fund, if any. The graph and the performance table above do not reflect the deduction of taxes that a shareholder would pay on Fund distribution or the redemption of Fund shares. The Fund imposes a 2% redemption fee on shares held less than 30 days.
The HSBC Offshore Renminbi Bond Index tracks total return performance of renminbi-denominated and renminbi-settled bonds and certificates of deposit issued outside the People's Republic of China. The index referenced in this chart is not available for investment and does not incur expenses.
65
FUND HIGHLIGHTS at December 31, 2014
GUINNESS ATKINSON RENMINBI YUAN & BOND FUND
# of Holdings in Portfolio: | | 45 | |
Portfolio Turnover: | | 28.3% | |
% of Investments in Top 10: | | 34.7% | |
Fund Manager: | | | |
Edmund Harriss | | | |
Top 10 Holdings (% of net assets) | | | | | | | |
Air Liquide Finance SA, 3.000%, 09/19/16 | | | 5.5 | % | | Unican Ltd., 5.600%, 09/18/17 | | | 3.2 | % | |
New World China Land Ltd., 5.500%, 02/06/18 | | | 4.9 | % | | Cagamas Global 3.700%, 09/22/17 | | | 3.2 | % | |
China Guangdong, 3.750%, 11/01/15 | | | 3.5 | % | | HSBC Bank PLC, 2.875%, 04/30/15 | | | 3.2 | % | |
BOC Aviation Pte. Ltd., 4.500%, 11/20/18 | | | 3.2 | % | | Caterpillar Financial Services Corp., 3.400%, 11/25/17 | | | 3.2 | % | |
ICICI Bank Ltd., 4.900%, 09/21/15 | | | 1.6 | % | | Datang Telecom HK Co. Ltd., 5.500%, 09/29/17 | | | 3.2 | % | |
Industry Breakdown (% of net assets) | | | | | | | |
Commercial Banks | | | 23.9 | % | | Industrial Gases | | | 5.5 | % | |
Real Estate Operation/Developer | | | 12.4 | % | | Auto - Cars/Light Trucks | | | 4.9 | % | |
Finance - Leasing Company | | | 12.0 | % | | Electric - Integrated | | | 4.3 | % | |
Machinery | | | 7.7 | % | | Finance - Investment Bank/Broker | | | 2.3 | % | |
Sovereign | | | 6.7 | % | | Life/Health Insurance | | | 1.9 | % | |
Special Purpose Banks | | | 6.4 | % | | Oil Company - Integrated | | | 1.6 | % | |
Cellular Telecommunications | | | 6.0 | % | | Investment Management/Advisor Services | | | 1.6 | % | |
66
SCHEDULE OF INVESTMENTS
at December 31, 2014
GUINNESS ATKINSON RENMINBI YUAN & BOND FUND
Principal Amount (CNH) | | CORPORATE BONDS: 97.2% | | Value | |
Auto – Cars/Light Trucks: 4.9% | | | |
| | 18,000,000 | | | Volkswagen International Finance NV, 2.150%, 05/23/16 | | $ | 2,844,872 | | |
| | 4,000,000 | | | Volkswagen International Finance NV, 3.750%, 11/30/17 | | | 651,135 | | |
| | 9,000,000 | | | Volvo Treasury AB, 3.800%, 11/22/15 | | | 1,443,717 | | |
| | | | | | | | 4,939,724 | | |
Cellular Telecommunication: 6.0% | | | |
| | 18,000,000 | | | China Unicom Ltd., 4.000%, 04/16/17 | | | 2,878,547 | | |
| | 20,000,000 | | | Datang Telecom HK Co. Ltd., 5.500%, 09/29/17 | | | 3,205,166 | | |
| | | | | | | | 6,083,713 | | |
Commerical Banks: 23.9% | | | |
| | 8,000,000 | | | Agriculture Bank of China Ltd., 3.200%, 11/28/15 | | | 1,280,352 | | |
| | 15,000,000 | | | Bank of China, 3.450%, 01/16/17 | | | 2,396,226 | | |
| | 10,000,000 | | | CCBL Funding PLC, 3.200%, 11/29/15 | | | 1,596,169 | | |
| | 2,000,000 | | | China Construction Bank, 4.900%,11/12/24 | | | 324,952 | | |
| | 20,000,000 | | | HSBC Bank PLC, 2.875%, 04/30/15 | | | 3,208,047 | | |
| | 20,000,000 | | | ICICI Bank Ltd., 4.900%, 09/21/15 | | | 3,232,046 | | |
| | 10,000,000 | | | ICICI Bank Ltd., 4.000%, 06/25/16 | | | 1,604,390 | | |
| | 12,000,000 | | | Industrial & Commercial Bank of China Ltd., 3.350%, 11/19/16 | | | 1,913,135 | | |
| | 15,000,000 | | | Industrial & Commercial Bank of China Ltd., 3.500%, 9/23/16 | | | 2,398,857 | | |
| | 11,000,000 | | | Industrial & Commercial Bank of China Ltd., 3.950%, 9/23/21 | | | 1,765,403 | | |
| | 12,000,000 | | | National Australia Bank Ltd., 2.400%, 06/18/15 | | | 1,912,184 | | |
| | 15,000,000 | | | Rabobank Nederland, 3.250%, 09/20/15 | | | 2,400,467 | | |
| | | | | | | | 24,032,228 | | |
Electric – Integrated: 4.3% | | | |
| | 5,000,000 | | | China Datang Corp., 3.600%, 04/25/16 | | | 796,248 | | |
| | 22,000,000 | | | China Guangdong, 3.750%, 11/01/15 | | | 3,529,349 | | |
| | | | | | | | 4,325,597 | | |
Finance – Investment Bank/Broker: 2.3% | | | |
| | 15,000,000 | | | Banco BTG Pactual SA, 4.100%, 03/26/16 | | | 2,358,515 | | |
Finance – Leasing Company: 12.0% | | | |
| | 7,000,000 | | | BOC Aviation Pte Ltd., 4.200%, 11/05/18 | | | 1,126,057 | | |
| | 20,000,000 | | | BOC Aviation Pte. Ltd., 4.500%, 11/20/18 | | | 3,245,404 | | |
| | 20,000,000 | | | Cagamas Global 3.700%, 09/22/17 | | | 3,212,579 | | |
| | 8,000,000 | | | Far East Horizon Ltd., 5.450%, 12/11/16 | | | 1,300,198 | | |
| | 20,000,000 | | | Unican Ltd., 5.600%, 09/18/17 | | | 3,227,849 | | |
| | | | | | | | 12,112,087 | | |
Industrial Gases: 5.5% | | | |
| | 35,000,000 | | | Air Liquide Finance SA, 3.000%, 09/19/16 | | | 5,574,552 | | |
Investment Management/Advisor Service: 1.6% | | | |
| | 10,000,000 | | | Starway Assets Enterprise, Inc., 4.100%, 01/22/17 | | | 1,601,979 | | |
Life/Health Insurance: 1.9% | | | |
| | 12,000,000 | | | Value Success International, 4.000%, 11/21/16 | | | 1,921,481 | | |
The accompanying notes are an integral part of these financial statements.
67
Principal Amount (CNH) | | CORPORATE BONDS: 97.2% (Continued) | | Value | |
Machinery: 7.7% | | | |
| | 18,000,000 | | | Caterpillar Financial Services Corp., 3.250%, 06/26/15 | | $ | 2,889,982 | | |
| | 10,000,000 | | | Caterpillar Financial Services Corp., 2.950%, 03/03/16 | | | 1,596,228 | | |
| | 20,000,000 | | | Caterpillar Financial Services Corp., 3.400%, 11/25/17 | | | 3,207,128 | | |
| | | | | | | | 7,693,338 | | |
Oil Company – Integrated: 1.6% | | | |
| | 10,000,000 | | | BP Capital Markets PLC, 3.650%, 02/28/19 | | | 1,610,267 | | |
Real Estate Operator/Developer: 12.4% | | | |
| | 15,000,000 | | | Agile Property Holdings Ltd., 6.500%, 02/28/17 | | | 2,241,478 | | |
| | 5,000,000 | | | Central Plaza Development Ltd., 7.600%, 11/29/15 | | | 815,845 | | |
| | 18,500,000 | | | Global Logistic Properties Ltd., 3.375%, 05/11/16 | | | 2,946,012 | | |
| | 30,000,000 | | | New World China Land Ltd., 5.500%, 02/06/18 | | | 4,885,370 | | |
| | 10,000,000 | | | Yanlord Land HK Co. Ltd., 5.375%, 05/23/16 | | | 1,564,731 | | |
| | | | | | | | 12,453,436 | | |
Sovereign: 6.7% | | | |
| | 10,000,000 | | | British Columbia, 2.850%, 11/13/16 | | | 1,603,807 | | |
| | 15,000,000 | | | China Government Bond, 2.870%, 06/27/16 | | | 2,401,659 | | |
| | 10,000,000 | | | China Government Bond, 3.020%, 06/27/18 | | | 1,600,141 | | |
| | 7,000,000 | | | United Kingdom, 2.700%, 10/21/17 | | | 1,122,130 | | |
| | | | | | | | 6,727,737 | | |
Special Purpose Banks: 6.4% | | | |
| | 8,000,000 | | | Asian Develop Bank, 3.200%, 11/10/19 | | | 1,287,951 | | |
| | 15,000,000 | | | China Develop Bank 3.600%, 09/19/19 | | | 2,405,457 | | |
| | 7,000,000 | | | Export Import Bank of China/The, 3.350%, 06/18/17 | | | 1,123,187 | | |
| | 10,000,000 | | | Korea Development Bank/The, 3.300%, 06/21/15 | | | 1,604,420 | | |
| | | | | | | | 6,421,015 | | |
| | | | | Total Corporate Bonds
(cost $98,850,291): 97.2% | | | 97,855,669 | | |
| | | | | Total Investments in Securities
(cost $98,850,291): 97.2% | | | 97,855,669 | | |
| | | | | China Yuan (Offshore): 3.0% | | | 3,024,447 | | |
| | | | | Liabilities in Excess of Other Assets : (0.2%) | | | (233,977 | ) | |
| | | | | Net Assets: 100.0% | | $ | 100,646,139 | | |
The accompanying notes are an integral part of these financial statements.
68
STATEMENTS OF ASSETS AND LIABILITIES
at December 31, 2014
| | | Alternative
Energy
Fund | | Asia
Focus
Fund | | Asia Pacific
Dividend
Builder
Fund | | China &
Hong Kong
Fund | |
Assets | |
Investments in securities, at cost | | $ | 22,964,044 | | | $ | 15,659,482 | | | $ | 3,554,997 | | | $ | 68,894,520 | | |
Investments in securities, at value | | $ | 15,021,604 | | | $ | 19,368,951 | | | $ | 4,014,322 | | | $ | 89,142,218 | | |
Cash | | | 227,624 | | | | 468,651 | | | | 75,432 | | | | — | | |
Cash denominated in foreign currency (cost of $0, $1,346, $9,048
and $0, respectively) | | | — | | | | 1,291 | | | | 9,022 | | | | — | | |
Receivables: | |
Fund shares sold | | | 29,032 | | | | 18 | | | | — | | | | 15,427 | | |
Dividends and interest | | | 16,407 | | | | 12,106 | | | | 1,095 | | | | 36,175 | | |
Miscellaneous receivable | | | 4,044 | | | | — | | | | — | | | | — | | |
Due from Advisor, net | | | — | | | | — | | | | 6,930 | | | | — | | |
Prepaid expenses | | | 11,592 | | | | 8,478 | | | | 1,833 | | | | 13,903 | | |
Total assets | | | 15,310,303 | | | | 19,859,495 | | | | 4,108,634 | | | | 89,207,723 | | |
Liabilities | |
Overdraft due to custodian bank | | | — | | | | — | | | | — | | | | 2,678,317 | | |
Payable for Fund shares redeemed | | | 24,134 | | | | 11,808 | | | | — | | | | 645,747 | | |
Due to Advisor, net | | | 7,224 | | | | 17,547 | | | | — | | | | 76,676 | | |
Accrued administration fees | | | 758 | | | | 943 | | | | 103 | | | | 5,189 | | |
Accrued shareholder servicing plan fees | | | 3,085 | | | | 3,696 | | | | 992 | | | | 12,513 | | |
Deferred trustees' compensation | | | 35,719 | | | | 63,419 | | | | 24,339 | | | | 129,197 | | |
Other accrued expenses | | | 37,797 | | | | 48,125 | | | | 22,912 | | | | 75,610 | | |
Total liabilities | | | 108,717 | | | | 145,538 | | | | 48,346 | | | | 3,623,249 | | |
Net Assets | | $ | 15,201,586 | | | $ | 19,713,957 | | | $ | 4,060,288 | | | $ | 85,584,474 | | |
Number of shares issued and outstanding (unlimited shares authorized,
no par value) | | | 4,439,178 | | | | 1,196,812 | | | | 293,605 | | | | 3,619,170 | | |
Net asset value per share | | $ | 3.42 | | | $ | 16.47 | | | $ | 13.83 | | | $ | 23.65 | | |
Composition of Net Assets | |
Paid-in capital | | $ | 111,796,303 | | | $ | 16,685,536 | | | $ | 7,134,462 | | | $ | 65,071,752 | | |
Undistributed net investment income (loss) | | | (39,203 | ) | | | (70,253 | ) | | | (25,222 | ) | | | 265,187 | | |
Accumulated net realized gain (loss) on investments and foreign currency | | | (88,611,528 | ) | | | (605,007 | ) | | | (3,508,240 | ) | | | (178 | ) | |
Net unrealized appreciation (depreciation) on: | |
Investments | | | (7,942,440 | ) | | | 3,709,469 | | | | 459,325 | | | | 20,247,698 | | |
Foreign currency | | | (1,546 | ) | | | (5,788 | ) | | | (37 | ) | | | 15 | | |
Net Assets | | $ | 15,201,586 | | | $ | 19,713,957 | | | $ | 4,060,288 | | | $ | 85,584,474 | | |
The accompanying notes are an integral part of these financial statements.
69
STATEMENTS OF ASSETS AND LIABILITIES
at December 31, 2014
| | | Dividend
Builder
Fund | | Global
Energy
Fund | | Global
Innovators
Fund | | Renminbi
Yuan & Bond
Fund | |
Assets | |
Investments in securities, at cost | | $ | 4,649,503 | | | $ | 72,899,847 | | | $ | 133,172,521 | | | $ | 98,850,291 | | |
Investments in securities, at value | | $ | 5,087,116 | | | $ | 62,214,920 | | | $ | 148,911,649 | | | $ | 97,855,669 | | |
Cash | | | 118,292 | | | | 620,977 | | | | 4,187,938 | | | | — | | |
Cash denominated in foreign currency (cost of $0, $0, $10,775 and
$3,001,924 respectively) | | | — | | | | — | | | | 10,494 | | | | 3,024,447 | | |
Receivables: | |
Fund shares sold | | | 342,850 | | | | 318,294 | | | | 4,677,543 | | | | 219,950 | | |
Dividends and interest | | | 9,904 | | | | 120,090 | | | | 126,384 | | | | 807,410 | | |
Prepaid expenses | | | 2,301 | | | | 11,723 | | | | 23,936 | | | | 14,302 | | |
Total assets | | | 5,560,463 | | | | 63,286,004 | | | | 157,937,944 | | | | 101,921,778 | | |
Liabilities | |
Overdraft due to custodian bank | | | — | | | | 856 | | | | — | | | | 1,135,545 | | |
Payable for Fund shares redeemed | | | 320,007 | | | | 195,674 | | | | 240,670 | | | | 2,079 | | |
Due to Advisor, net | | | 14,846 | ‡ | | | 39,694 | | | | 95,275 | | | | 46,933 | | |
Accrued administration fees | | | 360 | | | | 3,402 | | | | 6,426 | | | | 4,651 | | |
Accrued shareholder servicing plan fees | | | 962 | | | | 17,330 | | | | 3,538 | | | | 20,543 | | |
Deferred trustees' compensation | | | 7,402 | | | | 57,213 | | | | 81,574 | | | | 24,201 | | |
Other accrued expenses | | | 23,991 | | | | 65,691 | | | | 47,768 | | | | 41,687 | | |
Total liabilities | | | 367,568 | | | | 379,860 | | | | 475,251 | | | | 1,275,639 | | |
Net Assets | | $ | 5,192,895 | | | $ | 62,906,144 | | | $ | 157,462,693 | | | $ | 100,646,139 | | |
Number of shares issued and outstanding (unlimited shares authorized,
no par value) | | | 327,958 | | | | 2,445,197 | | | | 4,630,763 | | | | 8,104,197 | | |
Net asset value per share | | $ | 15.83 | | | $ | 25.73 | | | $ | 34.00 | | | $ | 12.42 | | |
Composition of Net Assets | |
Paid-in capital | | $ | 4,723,813 | | | $ | 79,118,266 | | | $ | 143,127,397 | | | $ | 101,708,344 | | |
Undistributed net investment income (loss) | | | (220 | ) | | | (57,213 | ) | | | (89,707 | ) | | | 70,111 | | |
Accumulated net realized gain (loss) on investments and foreign currency | | | 31,903 | | | | (5,457,830 | ) | | | (1,313,844 | ) | | | (152,945 | ) | |
Net unrealized appreciation (depreciation) on: | |
Investments | | | 437,613 | | | | (10,684,927 | ) | | | 15,739,128 | | | | (994,622 | ) | |
Foreign currency | | | (214 | ) | | | (12,152 | ) | | | (281 | ) | | | 15,251 | | |
Net Assets | | $ | 5,192,895 | | | $ | 62,906,144 | | | $ | 157,462,693 | | | $ | 100,646,139 | | |
‡ Includes $23,281 of registration fees advanced by the Advisor.
The accompanying notes are an integral part of these financial statements.
70
STATEMENTS OF OPERATIONS
For the year ended December 31, 2014
| | | Alternative
Energy
Fund | | Asia
Focus
Fund | | Asia Pacific
Dividend
Builder
Fund | | China &
Hong Kong
Fund | |
Investment Income | |
Dividends * | | $ | 297,492 | | | $ | 594,966 | | | $ | 177,916 | | | $ | 2,845,172 | | |
Total income | | | 297,492 | | | | 594,966 | | | | 177,916 | | | | 2,845,172 | | |
Expenses | |
Advisory fees | | | 225,649 | | | | 211,394 | | | | 41,605 | | | | 940,738 | | |
Shareholder servicing plan fees | | | 44,873 | | | | 24,367 | | | | 7,489 | | | | 121,972 | | |
Transfer agent fees and expenses | | | 47,501 | | | | 31,467 | | | | 18,998 | | | | 84,988 | | |
Fund accounting fee and expenses | | | 33,978 | | | | 33,000 | | | | 26,999 | | | | 52,146 | | |
Administration fees | | | 9,680 | | | | 9,456 | | | | 1,664 | | | | 37,648 | | |
Custody fees and expenses | | | 9,830 | | | | 14,998 | | | | 8,001 | | | | 29,708 | | |
Audit fees | | | 18,498 | | | | 24,999 | | | | 18,498 | | | | 24,999 | | |
Legal fees | | | 11,016 | | | | 9,034 | | | | 1,799 | | | | 38,676 | | |
Registration fees | | | 16,002 | | | | 13,074 | | | | 16,002 | | | | 20,777 | | |
Printing | | | 16,002 | | | | 5,263 | | | | 3,501 | | | | 19,567 | | |
Trustees' fees and expenses | | | 12,781 | | | | 13,447 | | | | 9,601 | | | | 15,225 | | |
Insurance | | | 1,004 | | | | 1,814 | | | | 372 | | | | 10,368 | | |
CCO fees and expenses | | | 7,388 | | | | 7,803 | | | | 6,563 | | | | 17,204 | | |
Miscellaneous | | | 1,097 | | | | 1,800 | | | | 1,000 | | | | 5,001 | | |
Interest expense | | | 8,346 | | | | 1,943 | | | | 393 | | | | 7,629 | | |
Total expenses | | | 463,645 | | | | 403,859 | | | | 162,485 | | | | 1,426,646 | | |
Less: fees waived and expenses absorbed | | | (8,860 | ) | | | — | | | | (79,713 | ) | | | — | | |
Net expenses | | | 454,785 | | | | 403,859 | | | | 82,772 | | | | 1,426,646 | | |
Net investment income (loss) | | | (157,293 | ) | | | 191,107 | | | | 95,144 | | | | 1,418,526 | | |
Realized and unrealized gain (loss) on investments and foreign currency | |
Net realized gain (loss) on: | |
Investments | | | (1,950,263 | ) | | | 828,177 | | | | 287,212 | | | | 16,172,716 | | |
Foreign currency | | | (34,888 | ) | | | (8,549 | ) | | | (4,879 | ) | | | (3,151 | ) | |
| | | | (1,985,151 | ) | | | 819,628 | | | | 282,333 | | | | 16,169,565 | | |
Net unrealized appreciation (depreciation) on: | |
Investments | | | (462,758 | ) | | | (673,200 | ) | | | (26,763 | ) | | | (20,220,281 | ) | |
Foreign currency | | | (2,491 | ) | | | 17 | | | | (85 | ) | | | 17 | | |
| | | | (465,249 | ) | | | (673,183 | ) | | | (26,848 | ) | | | (20,220,264 | ) | |
Net realized and unrealized gain (loss) on investments and foreign currency | | | (2,450,400 | ) | | | 146,445 | | | | 255,485 | | | | (4,050,699 | ) | |
Net increase (decrease) in net assets from operations | | $ | (2,607,693 | ) | | $ | 337,552 | | | $ | 350,629 | | | $ | (2,632,173 | ) | |
* Net of foreign tax withheld of $22,777, $52,647, $12,303, and $144,155 respectively.
The accompanying notes are an integral part of these financial statements.
71
STATEMENTS OF OPERATIONS
For the year ended December 31, 2014
| | | Dividend
Builder
Fund | | Global
Energy
Fund | | Global
Innovators
Fund | | Renminbi
Yuan & Bond
Fund | |
Investment Income | |
Dividends * | | $ | 185,466 | | | $ | 1,778,347 | | | $ | 2,322,575 | | | $ | — | | |
Interest | | | — | | | | — | | | | — | | | | 3,377,943 | | |
Total income | | | 185,466 | | | | 1,778,347 | | | | 2,322,575 | | | | 3,377,943 | | |
Expenses | |
Advisory fees | | | 20,125 | | | | 645,959 | | | | 693,922 | | | | 539,172 | | |
Shareholder servicing plan fees | | | 8,721 | | | | 172,334 | | | | 147,718 | | | | 102,031 | | |
Transfer agent fees and expenses | | | 19,767 | | | | 50,798 | | | | 72,464 | | | | 19,897 | | |
Fund accounting fee and expenses | | | 25,258 | | | | 54,655 | | | | 52,245 | | | | 53,840 | | |
Administration fees | | | 2,086 | | | | 37,867 | | | | 41,022 | | | | 43,594 | | |
Custody fees and expenses | | | 4,115 | | | | 11,976 | | | | 9,688 | | | | 17,226 | | |
Audit fees | | | 14,002 | | | | 24,999 | | | | 24,499 | | | | 18,498 | | |
Legal fees | | | 1,475 | | | | 35,001 | | | | 37,278 | | | | 43,857 | | |
Registration fees | | | 15,384 | | | | 20,384 | | | | 22,037 | | | | 21,634 | | |
Printing | | | 4,110 | | | | 16,740 | | | | 16,129 | | | | 5,583 | | |
Trustees' fees and expenses | | | 9,408 | | | | 22,999 | | | | 25,828 | | | | 30,635 | | |
Insurance | | | 142 | | | | 6,948 | | | | 4,528 | | | | 9,597 | | |
CCO fees and expenses | | | 6,881 | | | | 15,990 | | | | 16,390 | | | | 17,845 | | |
Miscellaneous | | | 1,001 | | | | 3,000 | | | | 3,500 | | | | 3,201 | | |
Interest expense | | | 34 | | | | 2,893 | | | | 32 | | | | 4,235 | | |
Total expenses | | | 132,509 | | | | 1,122,543 | | | | 1,167,280 | | | | 930,845 | | |
Less: fees waived and expenses absorbed | | | (102,063 | ) | | | — | | | | — | | | | (42,918 | ) | |
Net expenses | | | 30,446 | | | | 1,122,543 | | | | 1,167,280 | | | | 887,927 | | |
Net investment income | | | 155,020 | | | | 655,804 | | | | 1,155,295 | | | | 2,490,016 | | |
Realized and unrealized gain (loss) on investments and foreign currency | |
Net realized gain (loss) on: | |
Investments | | | 57,338 | | | | (470,045 | ) | | | 2,433,697 | | | | 517,815 | | |
Foreign currency | | | (1,034 | ) | | | (33,711 | ) | | | (21,957 | ) | | | 25,687 | | |
| | | | 56,304 | | | | (503,756 | ) | | | 2,411,740 | | | | 543,502 | | |
Net unrealized appreciation (depreciation) on: | |
Investments | | | (20,227 | ) | | | (20,816,478 | ) | | | 4,906,905 | | | | (3,860,378 | ) | |
Foreign currency | | | (390 | ) | | | (15,619 | ) | | | (281 | ) | | | (65,659 | ) | |
| | | | (20,617 | ) | | | (20,832,097 | ) | | | 4,906,624 | | | | (3,926,037 | ) | |
Net realized and unrealized gain (loss) on investments and foreign currency | | | 35,687 | | | | (21,335,853 | ) | | | 7,318,364 | | | | (3,382,535 | ) | |
Net increase (decrease) in net assets from operations | | $ | 190,707 | | | $ | (20,680,049 | ) | | $ | 8,473,659 | | | $ | (892,519 | ) | |
* Net of foreign tax withheld of $11,595, $193,896, $25,685, and $0, respectively.
The accompanying notes are an integral part of these financial statements.
72
STATEMENTS OF CHANGES IN NET ASSETS
| | | Alternative Energy Fund | | Asia Focus Fund | | Asia Pacific Dividend Builder Fund | |
| | | Year Ended
December 31, 2014 | | Year Ended
December 31, 2013 | | Year Ended
December 31, 2014 | | Year Ended
December 31, 2013 | | Year Ended
December 31, 2014 | | Year Ended
December 31, 2013 | |
Increase/(decrease) in
net assets from: | |
Operations | |
Net investment income (loss) | | $ | (157,293 | ) | | $ | (227,296 | ) | | $ | 191,107 | | | $ | 192,592 | | | $ | 95,144 | | | $ | 92,963 | | |
Net realized gain (loss) on: | |
Investments | | | (1,950,263 | ) | | | (3,043,284 | ) | | | 828,177 | | | | 4,653,729 | | | | 287,212 | | | | 415,710 | | |
Foreign currency | | | (34,888 | ) | | | (16,551 | ) | | | (8,549 | ) | | | (42,174 | ) | | | (4,879 | ) | | | (6,932 | ) | |
Net change in unrealized
appreciation (depreciation) on: | |
Investments | | | (462,758 | ) | | | 10,503,778 | | | | (673,200 | ) | | | (7,840,609 | ) | | | (26,763 | ) | | | (582,717 | ) | |
Foreign currency | | | (2,491 | ) | | | 932 | | | | 17 | | | | (1,648 | ) | | | (85 | ) | | | 25 | | |
Net increase (decrease) in net
assets resulting from
operations | | | (2,607,693 | ) | | | 7,217,579 | | | | 337,552 | | | | (3,038,110 | ) | | | 350,629 | | | | (80,951 | ) | |
Distributions to shareholders | |
From net investment income | | | — | | | | — | | | | (204,461 | ) | | | (400,182 | ) | | | (85,227 | ) | | | (101,646 | ) | |
Total distributions to
shareholders | | | — | | | | — | | | | (204,461 | ) | | | (400,182 | ) | | | (85,227 | ) | | | (101,646 | ) | |
Capital transactions | |
Proceeds from shares sold | | | 7,514,832 | | | | 17,203,455 | | | | 1,420,065 | | | | 764,866 | | | | 516,751 | | | | 823,529 | | |
Reinvestment of distributions | | | — | | | | — | | | | 176,160 | | | | 351,504 | | | | 81,472 | | | | 96,502 | | |
Cost of shares repurchased | | | (13,487,563 | ) | | | (13,751,424 | ) | | | (3,924,930 | ) | | | (20,629,442 | ) | | | (1,060,073 | ) | | | (1,309,444 | ) | |
Redemption fee proceeds | | | 6,012 | | | | 65,885 | | | | 6,650 | | | | 864 | | | | 2,985 | | | | 299 | | |
Net change in net assets from
capital transactions | | | (5,966,719 | ) | | | 3,517,916 | | | | (2,322,055 | ) | | | (19,512,208 | ) | | | (458,865 | ) | | | (389,114 | ) | |
Total increase (decrease) in
net assets | | | (8,574,412 | ) | | | 10,735,495 | | | | (2,188,964 | ) | | | (22,950,500 | ) | | | (193,463 | ) | | | (571,711 | ) | |
Net assets | |
Beginning of period | | | 23,775,998 | | | | 13,040,503 | | | | 21,902,921 | | | | 44,853,421 | | | | 4,253,751 | | | | 4,825,462 | | |
End of period | | $ | 15,201,586 | | | $ | 23,775,998 | | | $ | 19,713,957 | | | $ | 21,902,921 | | | $ | 4,060,288 | | | $ | 4,253,751 | | |
Accumulated net investment loss | | $ | (39,203 | ) | | $ | (41,716 | ) | | $ | (70,253 | ) | | $ | (56,828 | ) | | $ | (25,222 | ) | | $ | (35,676 | ) | |
Capital share activity | |
Shares sold | | | 1,782,301 | | | | 4,446,514 | | | | 79,440 | | | | 42,567 | | | | 37,760 | | | | 60,475 | | |
Shares issued on reinvestment | | | — | | | | — | | | | 10,709 | | | | 21,618 | | | | 6,027 | | | | 7,239 | | |
Shares redeemed | | | (3,304,204 | ) | | | (3,756,334 | ) | | | (234,391 | ) | | | (1,139,424 | ) | | | (78,604 | ) | | | (96,247 | ) | |
Net increase (decrease) in
shares outstanding | | | (1,521,903 | ) | | | 690,180 | | | | (144,242 | ) | | | (1,075,239 | ) | | | (34,817 | ) | | | (28,533 | ) | |
The accompanying notes are an integral part of these financial statements.
73
STATEMENTS OF CHANGES IN NET ASSETS
| | | China & Hong Kong Fund | | Dividend Builder Fund | | Global Energy Fund | |
| | | Year Ended
December 31, 2014 | | Year Ended
December 31, 2013 | | Year Ended
December 31, 2014 | | Year Ended
December 31, 2013 | | Year Ended
December 31, 2014 | | Year Ended
December 31, 2013 | |
Increase/(decrease) in
net assets from: | |
Operations | |
Net investment income | | $ | 1,418,526 | | | $ | 1,593,135 | | | $ | 155,020 | | | $ | 56,917 | | | $ | 655,804 | | | $ | 601,205 | | |
Net realized gain (loss) on: | |
Investments | | | 16,172,716 | | | | 12,156,492 | | | | 57,338 | | | | 75,166 | | | | (470,045 | ) | | | (1,388,787 | ) | |
Foreign currency | | | (3,151 | ) | | | (7,035 | ) | | | (1,034 | ) | | | 492 | | | | (33,711 | ) | | | 5,025 | | |
Net change in unrealized
appreciation (depreciation) on: | |
Investments | | | (20,220,281 | ) | | | (9,244,559 | ) | | | (20,227 | ) | | | 403,742 | | | | (20,816,478 | ) | | | 17,370,899 | | |
Foreign currency | | | 17 | | | | (116 | ) | | | (390 | ) | | | 146 | | | | (15,619 | ) | | | 5,225 | | |
Net increase (decrease) in net
assets resulting from
operations | | | (2,632,173 | ) | | | 4,497,917 | | | | 190,707 | | | | 536,463 | | | | (20,680,049 | ) | | | 16,593,567 | | |
Distributions to shareholders | |
From net investment income | | | (1,324,676 | ) | | | (1,501,284 | ) | | | (139,116 | ) | | | (63,759 | ) | | | (540,664 | ) | | | (338,807 | ) | |
From net realized gain | | | (18,055,782 | ) | | | (1,539,106 | ) | | | (38,760 | ) | | | (75,918 | ) | | | (309,365 | ) | | | — | | |
Total distributions to
shareholders | | | (19,380,458 | ) | | | (3,040,390 | ) | | | (177,876 | ) | | | (139,677 | ) | | | (850,029 | ) | | | (338,807 | ) | |
Capital transactions | |
Proceeds from shares sold | | | 15,260,317 | | | | 11,539,134 | | | | 5,792,295 | | | | 2,138,276 | | | | 56,236,413 | | | | 10,278,491 | | |
Reinvestment of distributions | | | 18,704,431 | | | | 2,931,713 | | | | 177,125 | | | | 138,503 | | | | 821,686 | | | | 328,596 | | |
Cost of shares repurchased | | | (36,249,008 | ) | | | (58,106,462 | ) | | | (3,895,760 | ) | | | (1,360,879 | ) | | | (44,969,440 | ) | | | (44,819,039 | ) | |
Redemption fee proceeds | | | 27,367 | | | | 24,920 | | | | 83 | | | | 16 | | | | 28,669 | | | | 3,568 | | |
Net change in net assets from
capital transactions | | | (2,256,893 | ) | | | (43,610,695 | ) | | | 2,073,743 | | | | 915,916 | | | | 12,117,328 | | | | (34,208,384 | ) | |
Total increase (decrease) in
net assets | | | (24,269,524 | ) | | | (42,153,168 | ) | | | 2,086,574 | | | | 1,312,702 | | | | (9,412,750 | ) | | | (17,953,624 | ) | |
Net assets | |
Beginning of period | | | 109,853,998 | | | | 152,007,166 | | | | 3,106,321 | | | | 1,793,619 | | | | 72,318,894 | | | | 90,272,518 | | |
End of period | | $ | 85,584,474 | | | $ | 109,853,998 | | | $ | 5,192,895 | | | $ | 3,106,321 | | | $ | 62,906,144 | | | $ | 72,318,894 | | |
Accumulated net investment
income (loss) | | $ | 265,187 | | | $ | 174,488 | | | $ | (220 | ) | | $ | (4,002 | ) | | $ | (57,213 | ) | | $ | (143,300 | ) | |
Capital share activity | |
Shares sold | | | 512,348 | | | | 392,079 | | | | 360,429 | | | | 142,453 | | | | 1,610,018 | | | | 362,946 | | |
Shares issued on reinvestment | | | 793,906 | | | | 95,403 | | | | 11,036 | | | | 9,127 | | | | 31,861 | | | | 10,133 | | |
Shares redeemed | | | (1,247,128 | ) | | | (2,026,546 | ) | | | (242,174 | ) | | | (93,058 | ) | | | (1,425,324 | ) | | | (1,591,419 | ) | |
Net increase (decrease) in
shares outstanding | | | 59,126 | | | | (1,539,064 | ) | | | 129,291 | | | | 58,522 | | | | 216,555 | | | | (1,218,340 | ) | |
The accompanying notes are an integral part of these financial statements.
74
STATEMENTS OF CHANGES IN NET ASSETS
| | | Global Innovators Fund | | Renminbi Yuan & Bond Fund | |
| | | Year Ended
December 31, 2014 | | Year Ended
December 31, 2013 | | Year Ended
December 31, 2014 | | Year Ended
December 31, 2013 | |
Increase/(decrease) in net assets from: | |
Operations | |
Net investment income | | $ | 1,155,295 | | | $ | 121,436 | | | $ | 2,490,016 | | | $ | 2,010,171 | | |
Net realized gain (loss) on: | |
Investments | | | 2,433,697 | | | | (45,990 | ) | | | 517,815 | | | | 605,289 | | |
Foreign currency | | | (21,957 | ) | | | (4,320 | ) | | | 25,687 | | | | 322,413 | | |
Net change in unrealized appreciation (depreciation) on: | |
Investments | | | 4,906,905 | | | | 14,383,887 | | | | (3,860,378 | ) | | | 1,844,433 | | |
Foreign currency | | | (281 | ) | | | — | | | | (65,659 | ) | | | (79,312 | ) | |
Net increase (decrease) in net assets resulting from operations | | | 8,473,659 | | | | 14,455,013 | | | | (892,519 | ) | | | 4,702,994 | | |
Distributions to shareholders | |
From net investment income | | | (1,179,848 | ) | | | (200,095 | ) | | | (3,220,427 | ) | | | (3,012,616 | ) | |
From net realized gain | | | (1,049,989 | ) | | | — | | | | — | | | | — | | |
Total distributions to shareholders | | | (2,229,837 | ) | | | (200,095 | ) | | | (3,220,427 | ) | | | (3,012,616 | ) | |
Capital transactions | |
Proceeds from shares sold | | | 129,608,055 | | | | 9,765,713 | | | | 18,817,422 | | | | 15,501,499 | | |
Reinvestment of distributions | | | 2,154,069 | | | | 195,241 | | | | 3,208,597 | | | | 2,996,514 | | |
Cost of shares repurchased | | | (31,295,552 | ) | | | (5,115,843 | ) | | | (11,468,535 | ) | | | (15,313,968 | ) | |
Redemption fee proceeds | | | 21,151 | | | | 132 | | | | 381 | | | | 503 | | |
Net change in net assets from capital transactions | | | 100,487,723 | | | | 4,845,243 | | | | 10,557,865 | | | | 3,184,548 | | |
Total increase in net assets | | | 106,731,545 | | | | 19,100,161 | | | | 6,444,919 | | | | 4,874,926 | | |
Net assets | |
Beginning of period | | | 50,731,148 | | | | 31,630,987 | | | | 94,201,220 | | | | 89,326,294 | | |
End of period | | $ | 157,462,693 | | | $ | 50,731,148 | | | $ | 100,646,139 | | | $ | 94,201,220 | | |
Accumulated net investment income (loss) | | $ | (89,707 | ) | | $ | (70,204 | ) | | $ | 70,111 | | | $ | 151,395 | | |
Capital share activity | |
Shares sold | | | 3,853,082 | | | | 358,498 | | | | 1,476,615 | | | | 1,202,698 | | |
Shares issued on reinvestment | | | 62,819 | | | | 6,418 | | | | 255,998 | | | | 234,015 | | |
Shares redeemed | | | (940,210 | ) | | | (203,029 | ) | | | (904,540 | ) | | | (1,190,910 | ) | |
Net increase in shares outstanding | | | 2,975,691 | | | | 161,887 | | | | 828,073 | | | | 245,803 | | |
The accompanying notes are an integral part of these financial statements.
75
FINANCIAL HIGHLIGHTS
For a capital share outstanding throughout each period
| | | Year Ended December 31, | |
Alternative Energy Fund | | 2014 | | 2013 | | 2012 | | 2011 | | 2010 | |
Net asset value, beginning of period | | $ | 3.99 | | | $ | 2.47 | | | $ | 2.92 | | | $ | 5.17 | | | $ | 6.62 | | |
Income (loss) from investment operations: | |
Net investment income (loss) | | | (0.04 | ) | | | (0.04 | ) | | | (0.02 | ) | | | 0.06 | | | | (0.05 | ) | |
Net realized and unrealized gain (loss)
on investments and foreign currency | | | (0.53 | ) | | | 1.55 | | | | (0.42 | ) | | | (2.26 | ) | | | (1.40 | ) | |
Total from investment operations | | | (0.57 | ) | | | 1.51 | | | | (0.44 | ) | | | (2.20 | ) | | | (1.45 | ) | |
Less distributions: | |
From net investment income | | | — | | | | — | | | | (0.01 | ) | | | (0.05 | ) | | | — | | |
Total distributions | | | — | | | | — | | | | (0.01 | ) | | | (0.05 | ) | | | — | | |
Redemption fee proceeds | | | — | (1) | | | 0.01 | | | | — | (1) | | | — | (1) | | | — | (1) | |
Net asset value, end of period | | $ | 3.42 | | | $ | 3.99 | | | $ | 2.47 | | | $ | 2.92 | | | $ | 5.17 | | |
Total return | | | (14.29 | )% | | | 61.54 | % | | | (15.20 | )% | | | (42.53 | )% | | | (21.90 | )% | |
Ratios/supplemental data: | |
Net assets, end of period (millions) | | $ | 15.2 | | | $ | 23.8 | | | $ | 13.0 | | | $ | 17.6 | | | $ | 36.2 | | |
Ratio of expenses to average net assets: | |
Before fee waived/recaptured | | | 2.06 | % | | | 2.13 | % | | | 2.32 | % | | | 1.81 | % | | | 1.76 | % | |
After fees waived/recaptured | | | 2.02 | % | | | 2.00 | % | | | 2.02 | % | | | 1.81 | % | | | 1.76 | % | |
| After fees waived/recaptured excluding interest expense(2) | | | 1.98 | % | | | 1.98 | % | | | 1.98 | % | | | 1.79 | % | | | 1.73 | % | |
Ratio of net investment income (loss) to average net assets: | |
Before fees waived/recaptured | | | (0.74 | )% | | | (1.37 | )% | | | (1.11 | )% | | | 1.11 | % | | | (0.86 | )% | |
After fees waived/recaptured | | | (0.70 | )% | | | (1.24 | )% | | | (0.81 | )% | | | 1.11 | % | | | (0.86 | )% | |
Portfolio turnover rate | | | 42.27 | % | | | 60.20 | % | | | 7.80 | % | | | 43.10 | % | | | 24.74 | % | |
(1) Amount represents less than $0.01 per share.
(2) The Advisor has contractually agreed to limit the operating expenses of the Fund to 1.98%, excluding interest expense, expenses related to dividends on short positions, brokerage commissions, taxes and other extraordinary expenses. See Note 3.
The accompanying notes are an integral part of these financial statements.
76
FINANCIAL HIGHLIGHTS
For a capital share outstanding throughout each period
| | | Year Ended December 31, | |
Asia Focus Fund | | 2014 | | 2013 | | 2012 | | 2011 | | 2010 | |
Net asset value, beginning of period | | $ | 16.33 | | | $ | 18.56 | | | $ | 16.23 | | | $ | 21.04 | | | $ | 17.63 | | |
Income (loss) from investment operations: | |
Net investment income | | | 0.16 | | | | 0.21 | | | | 0.30 | | | | 0.18 | | | | 0.12 | | |
Net realized and unrealized gain (loss)
on investments and foreign currency | | | 0.15 | | | | (2.14 | ) | | | 2.28 | | | | (4.88 | ) | | | 3.45 | | |
Total from investment operations | | | 0.31 | | | | (1.93 | ) | | | 2.58 | | | | (4.70 | ) | | | 3.57 | | |
Less distributions: | |
From net investment income | | | (0.17 | ) | | | (0.30 | ) | | | (0.25 | ) | | | (0.11 | ) | | | (0.19 | ) | |
Total distributions | | | (0.17 | ) | | | (0.30 | ) | | | (0.25 | ) | | | (0.11 | ) | | | (0.19 | ) | |
Redemption fee proceeds | | | — | (1) | | | — | (1) | | | — | (1) | | | — | (1) | | | 0.03 | | |
Net asset value, end of period | | $ | 16.47 | | | $ | 16.33 | | | $ | 18.56 | | | $ | 16.23 | | | $ | 21.04 | | |
Total return | | | 1.91 | % | | | (10.38 | )% | | | 15.89 | % | | | (22.35 | )% | | | 20.43 | % | |
Ratios/supplemental data: | |
Net assets, end of period (millions) | | $ | 19.7 | | | $ | 21.90 | | | $ | 44.90 | | | $ | 45.8 | | | $ | 64.4 | | |
Ratio of expenses to average net assets: | |
Before fees waived | | | 1.91 | % | | | 1.87 | % | | | 1.70 | % | | | 1.59 | % | | | 1.67 | % | |
After fees waived | | | 1.91 | % | | | 1.87 | % | | | 1.70 | % | | | 1.59 | % | | | 1.67 | % | |
| After fees waived excluding interest expense(2) | | | 1.90 | % | | | 1.85 | % | | | 1.69 | % | | | 1.59 | % | | | 1.65 | % | |
Ratio of net investment income to average net assets: | |
Before fees waived | | | 0.90 | % | | | 0.73 | % | | | 1.56 | % | | | 0.89 | % | | | 0.77 | % | |
After fees waived | | | 0.90 | % | | | 0.73 | % | | | 1.56 | % | | | 0.89 | % | | | 0.77 | % | |
Portfolio turnover rate | | | 23.16 | % | | | 7.43 | % | | | 10.90 | % | | | 7.79 | % | | | 25.44 | % | |
(1) Amount represents less than $0.01 per share.
(2) The Advisor has contractually agreed to limit the operating expenses of the Fund to 1.98%, excluding interest expense, expenses related to dividends on short positions, borkerage commissions, taxes and other extraordinary expenses. See Note 3.
The accompanying notes are an integral part of these financial statements.
77
FINANCIAL HIGHLIGHTS
For a capital share outstanding throughout each period
| | | Year Ended December 31, | |
Asia Pacific Dividend Builder Fund | | 2014 | | 2013 | | 2012 | | 2011 | | 2010 | |
Net asset value, beginning of period | | $ | 12.95 | | | $ | 13.52 | | | $ | 11.23 | | | $ | 13.41 | | | $ | 11.03 | | |
Income from investment operations: | |
Net investment income | | | 0.31 | | | | 0.27 | | | | 0.30 | | | | 0.30 | | | | 0.17 | | |
Net realized and unrealized gain (loss)
on investments and foreign currency | | | 0.85 | | | | (0.54 | ) | | | 2.31 | | | | (2.18 | ) | | | 2.41 | | |
Total from investment operations | | | 1.16 | | | | (0.27 | ) | | | 2.61 | | | | (1.88 | ) | | | 2.58 | | |
Less distributions: | |
From net investment income | | | (0.28 | ) | | | (0.30 | ) | | | (0.32 | ) | | | (0.30 | ) | | | (0.20 | ) | |
Total distributions | | | (0.28 | ) | | | (0.30 | ) | | | (0.32 | ) | | | (0.30 | ) | | | (0.20 | ) | |
Redemption fee proceeds | | | — | (1) | | | — | (1) | | | — | (1) | | | — | | | | — | (1) | |
Net asset value, end of period | | $ | 13.83 | | | $ | 12.95 | | | $ | 13.52 | | | $ | 11.23 | | | $ | 13.41 | | |
Total return | | | 9.04 | % | | | (2.06 | )% | | | 23.48 | % | | | (14.04 | )% | | | 23.65 | % | |
Ratios/supplemental data: | |
Net assets, end of period (millions) | | $ | 4.1 | | | $ | 4.3 | | | $ | 4.8 | | | $ | 4.5 | | | $ | 6.7 | | |
Ratio of expenses to average net assets: | |
Before fees waived | | | 3.91 | % | | | 3.56 | % | | | 3.57 | % | | | 3.26 | % | | | 2.92 | % | |
After fees waived | | | 1.99 | % | | | 1.98 | % | | | 1.98 | % | | | 1.98 | % | | | 2.01 | % | |
| After fees waived excluding interest expense(2) | | | 1.98 | % | | | 1.98 | % | | | 1.98 | % | | | 1.98 | % | | | 1.98 | % | |
Ratio of net investment income to average net assets: | |
Before fees waived | | | 0.37 | % | | | 0.39 | % | | | 0.71 | % | | | 1.13 | % | | | 0.38 | % | |
After fees waived | | | 2.29 | % | | | 1.97 | % | | | 2.39 | % | | | 2.41 | % | | | 1.29 | % | |
Portfolio turnover rate | | | 15.76 | % | | | 56.96 | % | | | 10.19 | % | | | 10.67 | % | | | 27.20 | % | |
(1) Amount represents less than $0.01 per share.
(2) The Advisor has contractually agreed to limit the operating expenses of the Fund to 1.98%, excluding interest expense, expenses related to dividends on short positions, brokerage commissions, taxes and other extraordinary expenses. See Note 3.
The accompanying notes are an integral part of these financial statements.
78
FINANCIAL HIGHLIGHTS
For a capital share outstanding throughout each period
| | | Year Ended December 31, | |
China & Hong Kong Fund | | 2014 | | 2013 | | 2012 | | 2011 | | 2010 | |
Net asset value, beginning of period | | $ | 30.86 | | | $ | 29.81 | | | $ | 26.58 | | | $ | 38.76 | | | $ | 35.13 | | |
Income from investment operations: | |
Net investment income | | | 0.48 | | | | 0.46 | | | | 0.45 | | | | 0.39 | | | | 0.27 | | |
Net realized and unrealized gain (loss)
on investments and foreign currency | | | (1.12 | ) | | | 1.45 | | | | 3.37 | | | | (11.06 | ) | | | 5.10 | | |
Total from investment operations | | | (0.64 | ) | | | 1.91 | | | | 3.82 | | | | (10.67 | ) | | | 5.37 | | |
Less distributions: | |
From net investment income | | | (0.45 | ) | | | (0.43 | ) | | | (0.59 | ) | | | (0.20 | ) | | | (0.38 | ) | |
From net realized gain | | | (6.13 | ) | | | (0.44 | ) | | | — | | | | (1.31 | ) | | | (1.38 | ) | |
Total distributions | | | (6.58 | ) | | | (0.87 | ) | | | (0.59 | ) | | | (1.51 | ) | | | (1.76 | ) | |
Redemption fee proceeds | | | 0.01 | | | | 0.01 | | | | — | (1) | | | — | (1) | | | 0.02 | | |
Net asset value, end of period | | $ | 23.65 | | | $ | 30.86 | | | $ | 29.81 | | | $ | 26.58 | | | $ | 38.76 | | |
Total return | | | (1.97 | )% | | | 6.45 | % | | | 14.42 | % | | | (27.52 | )% | | | 15.38 | % | |
Ratios/supplemental data: | |
Net assets, end of period (millions) | | $ | 85.6 | | | $ | 109.9 | | | $ | 152.0 | | | $ | 153.0 | | | $ | 242.8 | | |
Ratio of expenses to average net assets: | |
Before fees waived | | | 1.52 | % | | | 1.53 | % | | | 1.51 | % | | | 1.53 | % | | | 1.48 | % | |
After fees waived | | | 1.52 | % | | | 1.53 | % | | | 1.51 | % | | | 1.53 | % | | | 1.48 | % | |
| After fees waived excluding interest expense(2) | | | 1.51 | % | | | 1.52 | % | | | 1.51 | % | | | 1.52 | % | | | 1.47 | % | |
Ratio of net investment income to average net assets: | | | 1.51 | % | | | 1.27 | % | | | 1.34 | % | | | 1.14 | % | | | 0.62 | % | |
Portfolio turnover rate | | | 15.11 | % | | | 6.90 | % | | | 3.85 | % | | | 7.81 | % | | | 32.35 | % | |
(1) Amount represents less than $0.01 per share.
(2) The Advisor has contractually agreed to limit the operating expenses of the Fund to 1.98%, excluding interest expense, expenses related to dividends on short positions, borkerage commissions, taxes and other extraordinary expenses. See Note 3.
The accompanying notes are an integral part of these financial statements.
79
FINANCIAL HIGHLIGHTS
For a capital share outstanding throughout each period
| | | Year Ended December 31, | | March 30, 2012(1)
Through | |
Dividend Builder Fund | | 2014 | | 2013 | | December 31, 2012 | |
Net asset value, beginning of period | | $ | 15.64 | | | $ | 12.80 | | | $ | 12.50 | | |
Income from investment operations: | |
Net investment income | | | 0.52 | | | | 0.41 | | | | 0.31 | | |
Net realized and unrealized gain on investments and foreign currency | | | 0.26 | | | | 3.35 | | | | 0.30 | | |
Total from investment operations | | | 0.78 | | | | 3.76 | | | | 0.61 | | |
Less distributions: | |
From net investment income | | | (0.47 | ) | | | (0.45 | ) | | | (0.31 | ) | |
From net realized gain | | | (0.12 | ) | | | (0.47 | ) | | | — | | |
Total distributions | | | (0.59 | ) | | | (0.92 | ) | | | (0.31 | ) | |
Redemption fee proceeds | | | — | (2) | | | — | (2) | | | — | | |
Net asset value, end of period | | $ | 15.83 | | | $ | 15.64 | | | $ | 12.80 | | |
Total return | | | 4.99 | % | | | 29.77 | % | | | 4.97 | %(3) | |
Ratios/supplemental data: | |
Net assets, end of period (millions) | | $ | 5.2 | | | $ | 3.1 | | | $ | 1.8 | | |
Ratio of expenses to average net assets: | |
Before fees waived | | | 2.96 | % | | | 5.47 | % | | | 7.05 | %(4) | |
After fees waived | | | 0.68 | % | | | 0.68 | % | | | 0.68 | %(4) | |
| After fees waived excluding interest expense(5) | | | 0.68 | % | | | 0.68 | % | | | 0.68 | %(4) | |
Ratio of net investment income (loss) to average net assets: | |
Before fees waived/recaptured | | | 1.18 | % | | | (2.04 | )% | | | (3.02 | )%(4) | |
After fees waived/recaptured | | | 3.46 | % | | | 2.75 | % | | | 3.35 | %(4) | |
Portfolio turnover rate | | | 7.60 | % | | | 24.88 | % | | | 13.33 | %(3) | |
(1) Commencement of Operations.
(2) Amount represents less than $0.01 per share.
(3) Not annualized.
(4) Annualized.
(5) The Advisor has contractually agreed to limit the operating expenses of the Fund to 0.68%, excluding interest expense, expenses related to dividends on short positions, brokerage commissions, taxes and other extraordinary expenses. See Note 3.
The accompanying notes are an integral part of these financial statements.
80
FINANCIAL HIGHLIGHTS
For a capital share outstanding throughout each period
| | | Year Ended December 31, | |
Global Energy Fund | | 2014 | | 2013 | | 2012 | | 2011 | | 2010 | |
Net asset value, beginning of period | | $ | 32.45 | | | $ | 26.19 | | | $ | 25.72 | | | $ | 29.74 | | | $ | 25.60 | | |
Income from investment operations: | |
Net investment income | | | 0.28 | | | | 0.18 | | | | 0.22 | | | | 0.14 | | | | 0.12 | | |
Net realized and unrealized gain (loss)
on investments and foreign currency | | | (6.66 | ) | | | 6.23 | | | | 0.69 | | | | (4.06 | ) | | | 4.13 | | |
Total from investment operations | | | (6.38 | ) | | | 6.41 | | | | 0.91 | | | | (3.92 | ) | | | 4.25 | | |
Less distributions: | |
From net investment income | | | (0.22 | ) | | | (0.15 | ) | | | (0.44 | ) | | | (0.11 | ) | | | (0.12 | ) | |
From net realized gain | | | (0.13 | ) | | | — | | | | — | | | | — | | | | — | | |
Total distributions | | | (0.35 | ) | | | (0.15 | ) | | | (0.44 | ) | | | (0.11 | ) | | | (0.12 | ) | |
Redemption fee proceeds | | | 0.01 | | | | — | (1) | | | — | (1) | | | 0.01 | | | | 0.01 | | |
Net asset value, end of period | | $ | 25.73 | | | $ | 32.45 | | | $ | 26.19 | | | $ | 25.72 | | | $ | 29.74 | | |
Total return | | | (19.63 | )% | | | 24.48 | % | | | 3.53 | % | | | (13.16 | )% | | | 16.63 | % | |
Ratios/supplemental data: | |
Net assets, end of period (millions) | | $ | 62.9 | | | $ | 72.3 | | | $ | 90.3 | | | $ | 143.1 | | | $ | 118.0 | | |
Ratio of expenses to average net assets: | |
Before fees waived | | | 1.30 | % | | | 1.35 | % | | | 1.35 | % | | | 1.27 | % | | | 1.25 | % | |
After fees waived | | | 1.30 | % | | | 1.35 | % | | | 1.35 | % | | | 1.27 | % | | | 1.25 | % | |
| After fees waived excluding interest expense(2) | | | 1.30 | % | | | 1.34 | % | | | 1.34 | % | | | 1.27 | % | | | 1.25 | % | |
Ratio of net investment income to average net assets: | | | 0.76 | % | | | 0.77 | % | | | 0.62 | % | | | 0.43 | % | | | 0.46 | % | |
Portfolio turnover rate | | | 39.33 | % | | | 8.19 | % | | | 14.02 | % | | | 28.23 | % | | | 42.08 | % | |
(1) Amount represents less than $0.01 per share.
(2) The Advisor has contractually agreed to limit the operating expenses of the Fund to 1.45%, excluding interest expense, expenses related to dividends on short positions, brokerage commissions, taxes and other extraordinary expenses. See Note 3.
The accompanying notes are an integral part of these financial statements.
81
FINANCIAL HIGHLIGHTS
For a capital share outstanding throughout each period
| | | Year Ended December 31, | |
Global Innovators Fund | | 2014 | | 2013 | | 2012 | | 2011 | | 2010 | |
Net asset value, beginning of period | | $ | 30.65 | | | $ | 21.18 | | | $ | 17.72 | | | $ | 19.00 | | | $ | 16.24 | | |
Income from investment operations: | |
Net investment income (loss) | | | 0.28 | | | | 0.07 | | | | 0.11 | | | | 0.04 | | | | (0.05 | ) | |
Net realized and unrealized gain (loss)
on investments | | | 3.57 | | | | 9.52 | | | | 3.42 | | | | (1.28 | ) | | | 2.81 | | |
Total from investment operations | | | 3.85 | | | | 9.59 | | | | 3.53 | | | | (1.24 | ) | | | 2.76 | | |
Less distributions: | |
From net investment income | | | (0.26 | ) | | | (0.12 | ) | | | (0.07 | ) | | | (0.04 | ) | | | — | | |
From net realized gain | | | (0.24 | ) | | | — | | | | — | | | | — | | | | — | | |
Total distributions | | | (0.50 | ) | | | (0.12 | ) | | | (0.07 | ) | | | (0.04 | ) | | | — | | |
Redemption fee proceeds | | | — | (1) | | | — | (1) | | | — | (1) | | | — | (1) | | | — | (1) | |
Net asset value, end of period | | $ | 34.00 | | | $ | 30.65 | | | $ | 21.18 | | | $ | 17.72 | | | $ | 19.00 | | |
Total return | | | 12.55 | % | | | 45.29 | % | | | 19.91 | % | | | (6.51 | )% | | | 17.00 | % | |
Ratios/supplemental data: | |
Net assets, end of period (millions) | | $ | 157.5 | | | $ | 50.7 | | | $ | 31.6 | | | $ | 32.4 | | | $ | 38.2 | | |
Ratio of expenses to average net assets: | |
Before fees waived/recaptured | | | 1.26 | % | | | 1.47 | % | | | 1.51 | % | | | 1.42 | % | | | 1.47 | % | |
After fees waived/recaptured | | | 1.26 | % | | | 1.47 | % | | | 1.51 | % | | | 1.44 | % | | | 1.55 | % | |
| After fees waived/recaptured excluding interest expense(2) | | | 1.26 | % | | | 1.46 | % | | | 1.50 | % | | | 1.44 | % | | | 1.55 | % | |
Ratio of net investment income (loss) to average net assets: | |
Before fees waived/recaptured | | | 1.25 | % | | | 0.31 | % | | | 0.49 | % | | | 0.26 | % | | | (0.16 | )% | |
After fees waived/recaptured | | | 1.25 | % | | | 0.31 | % | | | 0.49 | % | | | 0.24 | % | | | (0.24 | )% | |
Portfolio turnover rate | | | 14.40 | % | | | 29.63 | % | | | 6.02 | % | | | 47.40 | % | | | 56.97 | % | |
(1) Amount represents less than $0.01 per share.
(2) The Advisor has contractually agreed to limit the operating expenses of the Fund to 1.55%, excluding interest expense, expenses related to dividends on short positions, borkerage commissions, taxes and other extraordinary expenses. See Note 3.
The accompanying notes are an integral part of these financial statements.
82
FINANCIAL HIGHLIGHTS
For a capital share outstanding throughout each period
| | | Year Ended December 31, | | June 30, 2011(1)
Through | |
Renminbi Yuan & Bond Fund | | 2014 | | 2013 | | 2012 | | December 31, 2011 | |
Net asset value, beginning of period | | $ | 12.95 | | | $ | 12.71 | | | $ | 12.52 | | | $ | 12.50 | | |
Income from investment operations: | |
Net investment income | | | 0.32 | | | | 0.28 | | | | 0.12 | | | | — | (2) | |
Net realized and unrealized gain (loss) on investments and foreign currency | | | (0.44 | ) | | | 0.38 | | | | 0.36 | | | | 0.02 | | |
Total from investment operations | | | (0.12 | ) | | | 0.66 | | | | 0.48 | | | | 0.02 | | |
Less distributions: | |
From net investment income | | | (0.41 | ) | | | (0.42 | ) | | | (0.29 | ) | | | — | | |
Total distributions | | | (0.41 | ) | | | (0.42 | ) | | | (0.29 | ) | | | — | | |
Redemption fee proceeds | | | — | (2) | | | — | (2) | | | — | (2) | | | — | (2) | |
Net asset value, end of period | | $ | 12.42 | | | $ | 12.95 | | | $ | 12.71 | | | $ | 12.52 | | |
Total return | | | (0.92 | )% | | | 5.26 | % | | | 3.88 | % | | | 0.16 | %(3) | |
Ratios/supplemental data: | |
Net assets, end of period (millions) | | $ | 100.6 | | | $ | 94.2 | | | $ | 89.3 | | | $ | 92.7 | | |
Ratio of expenses to average net assets: | |
Before fees waived/recaptured | | | 0.95 | % | | | 0.97 | % | | | 0.90 | % | | | 0.92 | %(4) | |
After fees waived/recaptured | | | 0.90 | % | | | 0.90 | % | | | 0.90 | % | | | 0.90 | %(4) | |
| After fees waived/recaptured excluding interest expense(5) | | | 0.90 | % | | | 0.90 | % | | | 0.90 | % | | | 0.90 | %(4) | |
Ratio of net investment income to average net assets: | |
Before fees waived/recaptured | | | 2.49 | % | | | 2.11 | % | | | 1.05 | % | | | 0.02 | %(4) | |
After fees waived/recaptured | | | 2.54 | % | | | 2.18 | % | | | 1.05 | % | | | 0.04 | %(4) | |
Portfolio turnover rate | | | 28.29 | % | | | 12.32 | % | | | 9.19 | % | | | 0.72 | %(3)† | |
† Restated
(1) Commencement of Operations.
(2) Amount represents less than $0.01 per share.
(3) Not annualized.
(4) Annualized.
(5) The Advisor has contractually agreed to limit the operating expenses of the Fund to 0.90%, excluding interest expense, expenses related to dividends on short positions, brokerage commissions, taxes and other extraordinary expenses. See Note 3.
The accompanying notes are an integral part of these financial statements.
83
NOTES TO FINANCIAL STATEMENTS
Note 1
Organization
Guinness AtkinsonTM Funds (the "Trust"), was organized on April 28, 1997 as a Delaware business trust and registered under the Investment Company Act of 1940, as amended (the "1940 Act"), as an open-end management investment company. Currently, the Trust offers eight separate series: Guinness Atkinson Alternative Energy Fund (the "Alternative Energy Fund"), Guinness Atkinson Asia Focus Fund (the "Asia Focus Fund"), Guinness Atkinson Asia Pacific Dividend Builder Fund (formerly known as the Asia Pacific Dividend Fund) (the "Asia Pacific Dividend Builder Fund"), Guinness Atkinson China & Hong Kong Fund (the "China & Hong Kong Fund"), Guinness Atkinson Global Energy Fund (the "Global Energy Fund"), Guinness Atkinson Global Innovators Fund (the "Global Innovators Fund"), Guinness Atkinson Dividend Builder Fund (formerly known as the Inflation Managed Dividend Fund) (the "Dividend Builder Fund") and Guinness Atkinson Renminbi Yuan & Bond Fund (the "Renminbi Yuan & Bond Fund"), all of which (each a "Fund" and collectively, the "Funds") are covered by this report. Except for the Dividend Builder Fund, each Fund is a non-diversified Fund. The China & Hong Kong Fund began operations on June 30, 1994, the Asia Focus Fund began operations on April 29, 1996, the Global Innovators Fund began operations on December 15, 1998, the Global Energy Fund began operations on June 30, 2004, the Alternative Energy Fund and the Asia Pacific Dividend Builder Fund began operations on March 31, 2006, the Renminbi Yuan & Bond Fund began operations on June 30, 2011, and the Dividend Builder Fund began operations on March 30, 2012.
The Alternative Energy Fund's, Asia Focus Fund's, Global Energy Fund's and Global Innovators Fund's investment objective is long-term capital appreciation. The Asia Pacific Dividend Builder Fund's investment objective is to provide investors with dividend income and long-term capital growth. The China & Hong Kong Fund's investment objective is long-term capital appreciation primarily through investments in securities of China and Hong Kong. The Renminbi Yuan & Bond Fund's investment objective is to seek total return. Total return means the combination of capital appreciation and investment income, which includes changes in the value of the renminbi, the currency of China of which the yuan is the unit. The Dividend Builder Fund's investment objective is to seek a moderate level of current income and consistent dividend growth at a rate that exceeds inflation.
Note 2
Significant accounting policies
Each Fund is an investment company and accordingly follows the investment company accounting and reporting guidance of the Financial Accounting Standards Board (FASB) Accounting Standard Codification Topic 946 "Financial Services—Investment Companies".
The following is a summary of significant accounting policies consistently followed by the Funds. These policies are in conformity with accounting principles generally accepted in the United States of America ("GAAP").
A. Security Valuation. Securities of the Funds that are traded on a principal exchange (U.S. or foreign) or NASDAQ are valued at the official closing price on each day that the exchanges are open for trading. Securities traded on an exchange for which there have been no sales, and other over-the-counter securities are valued at the mean between the bid and asked prices. Debt securities are valued based on available market quotations received from an independent pricing service approved by the Trust's Board of Trustees which may utilize both transaction data and market information such as yield, prices of securities of comparable quality, coupon rate, maturity, type of issue, trading characteristics and other market data. Securities for which quotations are not readily available are valued at their respective fair values as determined in good faith by the Funds' Valuation Committee in accordance with procedures established by the Board of Trustees. In determining fair value, the Funds' Valuation Committee take into account all relevant factors and available information. Consequently, the price of the security used to calculate its Net Asset Value may differ from quoted or published prices for the same security. Fair value pricing involves subjective judgments and there is no single standard for determining a security's fair value. As a result, different mutual funds could reasonably arrive at different fair value for the same security. It is possible that the fair value determined for a security is materially different from the value that could be realized upon the sale of that security or from the values that other mutual funds may determine. Short-term investments are stated at cost, combined with accrued interest, which approximates market value. Realized gains and losses from securities transactions are calculated using the identified cost method.
Foreign securities are recorded in the financial statements after translation to U.S. dollars based on the applicable exchange rate at the end of the period. The Funds do not isolate that portion of the results of operations resulting from changes in the currency exchange rate from the fluctuations resulting from changes in the market prices of investments.
84
Foreign exchange gain or loss resulting from holding of a foreign currency, expiration of a currency exchange contract, difference in exchange rates between the trade date and settlement date of an investment purchased or sold, and the difference between dividends actually received compared to the amount shown in a Fund's accounting records on the date of receipt are shown as net realized gains or losses on foreign currency transactions in the respective Fund's statement of operations.
B. Forward Foreign Currency Exchange Contracts. The Funds may utilize forward foreign currency exchange contracts ("forward contracts") to hedge against foreign exchange fluctuations on foreign-denominated investments under which they are obligated to exchange currencies at specific future dates and at specified rates. All commitments are "marked-to-market" daily and any resulting unrealized gains or losses are included as unrealized appreciation (depreciation) on foreign currency denominated assets and liabilities. The Funds record realized gains or losses at the time the forward contract is settled. Risks may arise upon entering these contracts from the potential inability of a counter party to meet the terms of their contracts and from unanticipated movements in the value of a foreign currency relative to the U.S. dollar or other currencies. Counterparties to these contracts are major U.S. financial institutions. Please refer to Note 7 for further information on forward foreign currency contracts held in each Fund.
C. Restricted and Illiquid Securities. A restricted security cannot be resold to the general public without prior registration under the Securities Act of 1933. If the security is subsequently registered and resold, the issuers would typically bear the expense of all registrations at no cost to the Fund. Restricted securities are valued according to the guidelines and procedures adopted by the Funds' Board of Trustees. A security may be considered illiquid if it lacks a readily available market. Securities are generally considered liquid if they can be sold or disposed of in the ordinary course of business within seven days at approximately the price at which the security is valued by a fund. Illiquid securities may be valued under methods approved by the Board of Trustees as reflecting fair value.
D. Security Transactions, Dividend Income and Distributions. Security transactions are accounted for on the trade date. Dividend income and distributions to shareholders are recorded on the ex-dividend date. Realized gains and losses from securities transactions are calculated using the identified cost method.
E. Allocation of Expenses. Each Fund is charged for those expenses directly attributable to it. Expenses that are not directly attributable to a Fund are allocated among the Funds in proportion to their respective assets or another appropriate method.
F. Cash overdraft. Throughout the year, the Funds may have cash overdraft balances. A fee is incurred on these overdrafts, calculated by multiplying the overdraft by a rate plus London Interbank Offered Rate ("LIBOR"). Payables, if any, are reflected as Overdraft Due to Custodian Bank in the Statements of Assets and Liabilities. Expenses from cash overdrafts are included in Interest Expense in the Statements of Operations.
G. Concentration of Risk. The Alternative Energy Fund invests substantially in the alternative energy or energy technology sectors. The Asia Focus Fund invests substantially all of its assets in the Asian continent. The Asia Pacific Dividend Builder Fund invests primarily in dividend-producing equity securities of Asia Pacific companies. The China & Hong Kong Fund invests substantially all of its assets in securities that are traded in China or Hong Kong or that are issued by companies that do a substantial part of their business in China. The Global Energy Fund invests substantially in energy companies; the changes in the prices and supplies of oil and other energy fuels may affect the Fund's investments. The Renminbi Yuan & Bond Fund invests in securities issued by companies economically tied to China, which exposes the Fund to greater market risk and potential monetary losses than if the Fund's assets were diversified among other regions. The consequences of political, social, or economic changes in the countries or business sectors in which the securities are offered or the issuers conduct their operations may affect the market prices of the Funds' investments and any income generated, as well as the Funds' ability to repatriate such amounts.
H. Use of Estimates. The preparation of financial statements in conformity with accounting principles generally accepted in the United States requires management to make estimates and assumptions that affect the reported amounts of assets and liabilities and the disclosure of contingent assets and liabilities at the date of the financial statements. Actual results could differ from those estimates.
I. Reclassifications. Accounting principles generally accepted in the United States require that certain components of net assets be reclassified between financial and tax reporting. These reclassifications have no effect on net assets or net asset value per share and were primarily attributed to differences in the treatment of foreign currency and net investment losses. For the year ended December 31, 2014, permanent differences in book and tax accounting have been reclassified as follows:
85
| | | Increase (Decrease) | |
| | Paid in Capital | | Undistributed
Net Investment
Income/(Loss) | | Accumulated
Gains or
(Losses) | |
Alternative Energy Fund | | $ | (194,694 | ) | | $ | 159,806 | | | $ | 34,888 | | |
Asia Focus Fund | | | (8,478 | ) | | | (71 | ) | | | 8,549 | | |
Asia Pacific Dividend Fund | | | — | | | | 537 | | | | (537 | ) | |
China & Hong Kong Fund | | | — | | | | (3,151 | ) | | | 3,151 | | |
Dividend Builder Fund | | | — | | | | (12,122 | ) | | | 12,122 | | |
Global Energy Fund | | | (57 | ) | | | (29,053 | ) | | | 29,110 | | |
Global Innovators Fund | | | (1,076,996 | ) | | | 5,050 | | | | 1,071,946 | | |
Renminbi Yuan & Bond Fund | | | — | | | | 649,127 | | | | (649,127 | ) | |
J. Indemnifications. Under the Trust's organizational documents, its current and former officers and trustees are indemnified against certain liabilities arising out of the performance of their duties to the Funds. In addition, in the normal course of business, the Funds enter into contracts that contain a variety of representations and warranties that provide general indemnifications. The Funds' maximum exposure under these arrangements is unknown as this would involve future claims that may be made against the Funds that have not yet occurred or that would be covered by other parties.
K. Federal Income Taxes. The Funds intend to comply with the requirements of Subchapter M of the Internal Revenue Code applicable to regulated investment companies, and to distribute all of their taxable income to their shareholders. Therefore, no provision is made for federal income or excise tax.
The Funds recognize the tax benefits of uncertain tax positions only where the position is "more likely than not" to be sustained assuming examination by tax authorities. Management has analyzed the Funds' tax positions, and has concluded that no liability for unrecognized tax benefits should be recorded related to uncertain tax positions taken on returns filed for open tax years 2011 through 2013, or expected to be taken in the Funds' 2014 tax returns. The Funds identify their major tax jurisdiction as U.S. Federal, California State and foreign jurisdictions where the Funds make significant investments; however the Funds are not aware of any tax positions for which it is reasonably possible that the total amounts of unrecognized tax benefits will change materially in the next twelve months.
Note 3
Investment Advisory and Other Agreements
The Trust, on behalf of each Fund, entered into an Investment Advisory Agreement with Guinness Atkinson Asset Management, Inc. (the "Advisor"), under which the Advisor provides the Funds with investment management services. The Advisor furnishes all investment advice, office space, facilities, and most of the personnel needed by the Funds. As compensation for its services, the Advisor is entitled to a monthly fee at the following annual rates based upon the average daily net assets of the Funds:
Alternative Energy Fund | | | 1.00 | % | |
Asia Focus Fund | | | 1.00 | % | |
Asia Pacific Dividend Builder Fund | | | 1.00 | % | |
China & Hong Kong Fund | | | 1.00 | % | |
Dividend Builder Fund | | | 0.45 | % | |
Global Energy Fund | | | 0.75 | % | |
Global Innovators Fund | | 0.75% on the 1st $500 million, 0.60% thereafter | |
Renminbi Yuan & Bond Fund | | | 0.55 | % | |
86
The Funds are responsible for their own operating expenses. The Advisor has contractually agreed to limit each Fund's total operating expenses (excluding interest, dividends on short positions, taxes and extraordinary expenses) by reducing all or a portion of its fees and reimbursing the Fund for expenses so that its ratio of expenses to average daily net assets will not exceed the following levels:
Alternative Energy Fund | | | 1.98 | % | |
Asia Focus Fund | | | 1.98 | % | |
Asia Pacific Dividend Builder Fund | | | 1.98 | % | |
China & Hong Kong Fund | | | 1.98 | % | |
Dividend Builder Fund | | | 0.68 | % | |
Global Energy Fund | | | 1.45 | % | |
Global Innovators Fund | | | 1.55 | % | |
Renminbi Yuan & Bond Fund | | | 0.90 | % | |
The expense ratios shown in the financial highlights may exceed these levels due to expenses incurred, but not covered by the expense limitation agreement.
To the extent that the Advisor waives fees and/or absorbs expenses it may seek repayment of a portion or all of such amounts at any time within three fiscal years after the fiscal year in which such amounts were waived or absorbed, subject to the applicable cap. For the period ended December 31, 2014, the Advisor waived fees and absorbed expenses of $8,860, $79,713, $102,063 and $42,918 in the Alternative Energy Fund, Asia Pacific Dividend Builder Fund, the Dividend Builder Fund, and the Renminbi Yuan & Bond Fund, respectively.
At December 31, 2014, the Advisor may recapture a portion of the following amounts that had been paid and/or waived on behalf of the Funds no later than the dates as stated below:
Fund: | | December 31, 2015 | | December 31, 2016 | | December 31, 2017 | | Total | |
Alternative Energy Fund | | $ | 45,850 | | | $ | 24,186 | | | $ | 8,860 | | | $ | 78,896 | | |
Asia Pacific Dividend Builder Fund | | | 74,715 | | | | 74,741 | | | | 79,713 | | | | 229,169 | | |
Dividend Builder Fund | | | 71,229 | | | | 99,129 | | | | 102,063 | | | | 272,421 | | |
Renminbi Yuan & Bond Fund | | | — | | | | 60,089 | | | | 42,918 | | | | 103,007 | | |
Mutual Fund Administration, LLC (the "Administrator") acts as the Funds' administrator under an administration agreement. The fees paid to the Administrator for the period ended December 31, 2014 are reported on the Statements of Operations.
Quasar Distributors, LLC (the "Distributor") acts as the Funds' principal underwriter in a continuous public offering of the Funds' shares.
Foreside Compliance Services, LLC provides Chief Compliance Officer ("CCO") services to the Funds. The fees paid for CCO services for the period ended December 31, 2014 are reported on the Statements of Operations.
On August 14, 1998, the Trust approved a Deferred Compensation Plan for Trustees (the "Plan"). Trustees can elect to receive payment in cash or defer payments provided for in the Plan. If a trustee elects to defer payment, the Plan provides for the creation of a deferred payment account (Phantom Share Account). This account accumulates the deferred fees earned, and the value of the account is adjusted at the end of each quarter to reflect the value that would have been earned if the account had been invested in designated investments. The Funds recognize as trustee expense amounts accrued as meetings are attended plus the change in value of the Phantom Share Account.
The change in the value of the phantom share account during the period ended December 31, 2014 is shown in the table below. These amounts included any additional contributions to the deferred compensation plan and any appreciation (depreciation) on the underlying investments.
87
Alternative Energy Fund | | $ | 5,180 | | |
Asia Focus Fund | | $ | 5,850 | | |
Asia Pacific Dividend Builder Fund | | $ | 4,000 | | |
China & Hong Kong Fund | | $ | (9,600 | ) | |
Global Energy Fund | | $ | 9,000 | | |
Global Innovators Fund | | $ | 10,700 | | |
Dividend Builder Fund | | $ | 3,400 | | |
Renminbi Yuan & Bond Fund | | $ | 13,000 | | |
The fees paid to non-interested Trustees for the period ended December 31, 2014 are reported on the Statements of Operations.
Certain officers of the Trust are also officers and/or Directors of the Advisor and the Administrator. None of these officers are compensated directly by the Funds.
Note 4
Shareholder Servicing Plan
Each Fund has adopted a Shareholder Servicing Plan to pay a fee at an annual rate of up to 0.25% of its daily average net assets of shares serviced by shareholder servicing agents who provide administrative and support services to their customers.
The fees paid under the Shareholder Servicing Plan for the period ended December 31, 2014 are reported on the Statements of Operations.
Note 5
Investment Transactions
The following table presents purchases and sales of securities during the period ended December 31, 2014 excluding short-term investments, to indicate the volume of transactions in each Fund.
| | | Purchases | | Sales | |
Alternative Energy Fund | | $ | 9,528,492 | | | $ | 16,326,346 | | |
Asia Focus Fund | | $ | 4,891,446 | | | $ | 7,463,721 | | |
Asia Pacific Dividend Builder Fund | | $ | 652,686 | | | $ | 1,073,585 | | |
China & Hong Kong Fund | | $ | 14,315,376 | | | $ | 31,460,622 | | |
Dividend Builder Fund | | $ | 2,861,556 | | | $ | 330,660 | | |
Global Energy Fund | | $ | 44,573,474 | | | $ | 32,872,111 | | |
Global Innovators Fund | | $ | 104,976,653 | | | $ | 13,229,769 | | |
Renminbi Yuan & Bond Fund | | $ | 38,014,912 | | | $ | 25,827,819 | | |
The Funds did not purchase U.S. Government securities as a part of their long-term investment strategy during the period ended December 31, 2014.
Note 6
Fair Value Measurements and Disclosures
The Funds utilize various inputs in determining the value of their investments. These inputs are summarized in the three broad levels listed below:
Level 1 — Unadjusted quoted prices in active markets for identical assets or liabilities that a Fund has the ability to access.
88
Level 2 — Observable inputs other than quoted prices included in level 1 that are observable for the asset or liability, either directly or indirectly. These inputs may include quoted prices for the identical instrument on an inactive market, prices for similar instruments, interest rates, prepayment speeds, credit risk, yield curves, default rates and similar data.
Level 3 — Unobservable inputs for the asset or liability, to the extent relevant observable inputs are not available, representing the Fund's own assumptions about the assumptions a market participant would use in valuing the asset or liability, and would be based on the best information available.
The availability of observable inputs can vary from security to security and is affected by a wide variety of factors, including for example, the type of security, whether the security is new and not yet established in the marketplace, the liquidity of markets, and other characteristics particular to the security. To the extent that valuation is based on models or inputs that are less observable or unobservable in the market, the determination of fair value requires more judgment. Accordingly the degree of judgment exercised in determining fair value is greatest for instruments categorized in Level 3.
The inputs used to measure fair value may fall into different levels of the fair value hierarchy. In such cases, for disclosure purposes, the level in the fair value hierarchy within which the fair value measurement falls in its entirety, is determined based on the lowest level input that is significant to the fair value measurement in its entirety.
The inputs or methodology used for valuing securities are not an indication of the risk associated with investing in those securities. The following is a summary of the inputs used, as of December 31, 2014, in valuing the Funds' assets carried at fair value:
Alternative Energy Fund
Assets Table | | Level 1 | | Level 2 | | Level 3 | | Total | |
Investments, at Value | |
Common Stocks: | |
Energy | | $ | 6,355,503 | | | $ | 901,511 | | | $ | — | | | $ | 7,257,014 | | |
Industrial | | | 2,526,290 | | | | 1,302,192 | | | | — | | | | 3,828,482 | | |
Utilities | | | 1,359,407 | | | | 2,576,701 | | | | — | | | | 3,936,108 | | |
Total Investments, at Value | | | 10,241,200 | | | | 4,780,404 | | | | — | | | | 15,021,604 | | |
Total Assets | | $ | 10,241,200 | | | $ | 4,780,404 | | | $ | — | | | $ | 15,021,604 | | |
Asia Focus Fund
Assets Table | | Level 1 | | Level 2 | | Level 3 | | Total | |
Investments, at Value | |
Common Stocks:1 | |
Basic Materials | | $ | 194,933 | | | $ | — | | | $ | — | | | $ | 194,933 | | |
Communications | | | 521,164 | | | | 1,453,347 | | | | — | | | | 1,974,511 | | |
Consumer, Cyclical | | | 832,416 | | | | 2,595,831 | | | | — | | | | 3,428,247 | | |
Consumer, Non-cyclical | | | — | | | | 461,247 | | | | — | | | | 461,247 | | |
Energy | | | — | | | | 2,291,127 | | | | — | | | | 2,291,127 | | |
Exchange Traded Funds ("ETFs") | | | 588,023 | | | | — | | | | — | | | | 588,023 | | |
Financial | | | — | | | | 3,248,874 | | | | — | | | | 3,248,874 | | |
Industrial | | | — | | | | 3,102,404 | | | | — | | | | 3,102,404 | | |
Technology | | | — | | | | 2,987,055 | | | | — | | | | 2,987,055 | | |
Utilities | | | 1,092,530 | | | | — | | | | — | | | | 1,092,530 | | |
Total Investments, at Value | | | 3,229,066 | | | | 16,139,885 | | | | — | | | | 19,368,951 | | |
Total Assets | | $ | 3,229,066 | | | $ | 16,139,885 | | | $ | — | | | $ | 19,368,951 | | |
89
Asia Pacific Dividend Builder Fund
Assets Table | | Level 1 | | Level 2 | | Level 3 | | Total | |
Investments, at Value | |
Common Stocks:1 | |
Basic Materials | | $ | 106,933 | | | $ | — | | | $ | — | | | $ | 106,933 | | |
Communications | | | — | | | | 329,829 | | | | — | | | | 329,829 | | |
Consumer, Cyclical | | | 180,537 | | | | 577,061 | | | | — | | | | 757,598 | | |
Consumer, Non-cyclical | | | — | | | | 300,392 | | | | — | | | | 300,392 | | |
Energy | | | 88,036 | | | | 124,114 | | | | — | | | | 212,150 | | |
Financial | | | — | | | | 1,306,216 | | | | — | | | | 1,306,216 | | |
Industrial | | | 105,428 | | | | 412,771 | | | | — | | | | 518,199 | | |
Technology | | | 121,901 | | | | 361,104 | | | | — | | | | 483,005 | | |
Total Investments, at Value | | | 602,835 | | | | 3,411,487 | | | | — | | | | 4,014,322 | | |
Total Assets | | $ | 602,835 | | | $ | 3,411,487 | | | $ | — | | | $ | 4,014,322 | | |
China & Hong Kong Fund
Assets Table | | Level 1 | | Level 2 | | Level 3 | | Total | |
Investments, at Value | |
Common Stocks: | |
Communications | | $ | 2,669,530 | | | $ | 10,033,633 | | | $ | — | | | $ | 12,703,163 | | |
Consumer, Cyclical | | | 1,400,574 | | | | 15,653,233 | | | | — | | | | 17,053,807 | | |
Consumer, Non-cyclical | | | — | | | | 1,729,676 | | | | — | | | | 1,729,676 | | |
Energy | | | — | | | | 8,341,465 | | | | — | | | | 8,341,465 | | |
Exchange Traded Funds ("ETFs") | | | 3,379,660 | | | | — | | | | — | | | | 3,379,660 | | |
Financial | | | — | | | | 22,429,945 | | | | — | | | | 22,429,945 | | |
Industrial | | | — | | | | 9,511,717 | | | | — | | | | 9,511,717 | | |
Technology | | | 5,826,954 | | | | 5,062,299 | | | | — | | | | 10,889,253 | | |
Utilities | | | — | | | | 3,103,532 | | | | — | | | | 3,103,532 | | |
Total Investments, at Value | | | 13,276,718 | | | | 75,865,500 | | | | — | | | | 89,142,218 | | |
Total Assets | | $ | 13,276,718 | | | $ | 75,865,500 | | | $ | — | | | $ | 89,142,218 | | |
90
Dividend Builder Fund
Assets Table | | Level 1 | | Level 2 | | Level 3 | | Total | |
Investments, at Value | |
Common Stocks: | |
Communications | | $ | 337,969 | | | $ | 146,879 | | | $ | — | | | $ | 484,848 | | |
Consumer, Cyclical | | | 226,994 | | | | — | | | | — | | | | 226,994 | | |
Consumer, Non-cyclical | | | 1,169,559 | | | | 710,616 | | | | — | | | | 1,880,175 | | |
Energy | | | 246,389 | | | | 215,177 | | | | — | | | | 461,566 | | |
Financial | | | 625,417 | | | | 308,687 | | | | — | | | | 934,104 | | |
Industrial | | | 519,147 | | | | 417,243 | | | | — | | | | 936,390 | | |
Technology | | | 163,039 | | | | — | | | | — | | | | 163,039 | | |
Total Investments, at Value | | | 3,288,514 | | | | 1,798,602 | | | | — | | | | 5,087,116 | | |
Total Assets | | $ | 3,288,514 | | | $ | 1,798,602 | | | $ | — | | | $ | 5,087,116 | | |
Global Energy Fund
Assets Table | | Level 1 | | Level 2 | | Level 3 | | Total | |
Investments, at Value | |
Common Stocks: | |
Energy | | $ | 42,095,787 | | | $ | 20,047,507 | | | $ | — | (a) | | $ | 62,143,294 | | |
Industrial | | | — | | | | 71,626 | | | | — | | | | 71,626 | | |
Total Investments, at Value | | | 42,095,787 | | | | 20,119,133 | | | | — | | | | 62,214,920 | | |
Total Assets | | $ | 42,095,787 | | | $ | 20,119,133 | | | $ | — | (a) | | $ | 62,214,920 | | |
(a) Cluff Natural Resources warrants fair valued at zero.
Global Innovators Fund
Assets Table | | Level 1 | | Level 2 | | Level 3 | | Total | |
Investments, at Value | |
Common Stocks: | |
Communications | | $ | 20,444,870 | | | $ | — | | | $ | — | | | $ | 20,444,870 | | |
Consumer, Cyclical | | | 4,486,330 | | | | | | | | | | | | 4,486,330 | | |
Consumer, Non-cyclical | | | 9,838,414 | | | | — | | | | — | | | | 9,838,414 | | |
Energy | | | 8,512,931 | | | | — | | | | — | | | | 8,512,931 | | |
Financial | | | 19,910,712 | | | | — | | | | — | | | | 19,910,712 | | |
Industrial | | | 20,372,554 | | | | 9,725,678 | | | | — | | | | 30,098,232 | | |
Technology | | | 45,697,395 | | | | 9,922,765 | | | | — | | | | 55,620,160 | | |
Total Investments, at Value | | | 129,623,206 | | | | 19,648,443 | | | | — | | | | 148,911,649 | | |
Total Assets | | $ | 129,623,206 | | | $ | 19,648,443 | | | $ | — | | | $ | 148,911,649 | | |
91
Renminbi Yuan & Bond Fund
Assets Table | | Level 1 | | Level 2 | | Level 3 | | Total | |
Investments, at Value | |
Corporate Bonds: | |
Basic Materials | | $ | — | | | $ | 5,574,552 | | | $ | — | | | $ | 5,574,552 | | |
Communication | | | — | | | | 6,083,713 | | | | — | | | | 6,083,713 | | |
Consumer, Cyclical | | | — | | | | 4,939,724 | | | | — | | | | 4,939,724 | | |
Energy | | | — | | | | 1,610,266 | | | | — | | | | 1,610,266 | | |
Financial | | | — | | | | 58,489,604 | | | | — | | | | 58,489,604 | | |
Government | | | — | | | | 9,138,874 | | | | — | | | | 9,138,874 | | |
Industrial | | | — | | | | 7,693,338 | | | | — | | | | 7,693,338 | | |
Utilities | | | — | | | | 4,325,598 | | | | — | | | | 4,325,598 | | |
Total Investments, at Value | | | — | | | | 97,855,669 | | | | — | | | | 97,855,669 | | |
Total Assets | | $ | — | | | $ | 97,855,669 | | | $ | — | | | $ | 97,855,669 | | |
1 Foreign securities traded in foreign exchanges may be adjusted due to a significant change in the value of U.S. traded securities, as measured by the S&P 500 Index. Significant movements were deemed to have occurred at December 31, 2014 and therefore such securities were classified as Level 2. As a result, securities still held by the Alternative Energy Fund, Asia Focus Fund, Asia Pacific Dividend Builder Fund, China & Hong Kong Fund, Dividend Builder Fund, Global Energy Fund, and Global Innovators Fund were transferred from Level 1 into Level 2 with an end of period value of $4,356,462, $11,485,723, $2,930,186, $63,213,359, $1,956,083, $17,443,205, and $19,648,443, respectively. There were no securities transferred between Level 1 and Level 2 in the Renminbi Yuan & Bond Fund.
Note 7
Derivatives and Hedging Transactions
FASB Accounting Standards Codification 815, Derivatives and Hedging requires enhanced disclosures about the Funds' derivative and hedging activities, including how such activities are accounted for and their effects on the Funds' financial position, performance and cash flows.
Forward Foreign Currency Contracts
In order to hedge their portfolio and to protect them against possible fluctuations in foreign exchange rates pending the settlement of securities transactions, the Funds may enter into forward foreign currency contracts that obligate them to exchange currencies at specified future dates. At the maturity of a forward contract, a Fund may either make delivery of the foreign currency from currency held, if any, or from the proceeds of the portfolio securities sold. It may also terminate its obligation to deliver the foreign currency at any time by purchasing an offsetting contract. The forward values of amounts due are netted against the forward value of the currency to be delivered, and the net amount is shown as a receivable or payable in the financial statements. The Funds did not enter into forward foreign currency contracts during the period ended December 31, 2014 and did not have any outstanding forward contracts as of December 31, 2014.
92
Note 8
Tax Matters
As of December 31, 2014, the tax bases of investments were as follows:
| | | Alternative
Energy Fund | | Asia Focus
Fund | | Asia Pacific
Dividend
Builder
Fund | | China &
Hong Kong
Fund | | Dividend
Builder
Fund | | Global
Energy
Fund | | Global
Innovators
Fund | | Renminbi
Yuan & Bond
Fund | |
Cost of investments
for tax puroses | | $ | 22,964,044 | | | $ | 15,659,482 | | | $ | 3,586,371 | | | $ | 68,894,520 | | | $ | 4,649,503 | | | $ | 75,035,192 | | | $ | 133,172,521 | | | $ | 98,850,291 | | |
Gross tax unrealized
appreciation | | | 993,320 | | | | 4,896,160 | | | | 627,050 | | | | 26,500,896 | | | | 643,638 | | | | 5,487,442 | | | | 20,710,803 | | | | 339,723 | | |
Gross tax unrealized
(depreciation) | | | (8,935,760 | ) | | | (1,186,691 | ) | | | (199,099 | ) | | | (6,253,198 | ) | | | (206,025 | ) | | | (18,307,714 | ) | | | (4,971,675 | ) | | | (1,334,345 | ) | |
Net tax unrealized
appreciation (depreciation)
on investments | | | (7,942,440 | ) | | | 3,709,469 | | | | 427,951 | | | | 20,247,698 | | | | 437,613 | | | | (12,820,272 | ) | | | 15,739,128 | | | | (994,622 | ) | |
Net tax appreciation
(depreciation) on foreign-
currency denominated assets
and liabilities | | | (1,546 | ) | | | (5,788 | ) | | | (37 | ) | | | 15 | | | | (214 | ) | | | (12,152 | ) | | | (281 | ) | | | 15,251 | | |
Net tax unrealized
appreciation
(depreciation)* | | | (7,943,986 | ) | | | 3,703,681 | | | | 427,914 | | | | 20,247,713 | | | | 437,399 | | | | (12,832,424 | ) | | | 15,738,847 | | | | (979,370 | ) | |
Undistributed net ordinary
income** | | | — | | | | — | | | | 34,449 | | | | 394,278 | | | | 39,280 | | | | — | | | | — | | | | 94,312 | | |
Undistributed Long-term
Capital Gains | | | — | | | | — | | | | — | | | | — | | | | — | | | | 1,057 | | | | — | | | | — | | |
Post October loss*** | | | (63,223 | ) | | | (6,834 | ) | | | (4,538 | ) | | | (29 | ) | | | (177 | ) | | | (3,323,542 | ) | | | (8,133 | ) | | | (138,475 | ) | |
Capital loss carryforward | | | (88,548,305 | ) | | | (605,007 | ) | | | (3,504,120 | ) | | | — | | | | — | | | | — | | | | (1,313,844 | ) | | | (14,470 | ) | |
Other accumulated
gain/(loss) | | | (39,203 | ) | | | (63,419 | ) | | | (27,879 | ) | | | (129,240 | ) | | | (7,420 | ) | | | (57,213 | ) | | | (81,574 | ) | | | (24,201 | ) | |
Total accumulated
gain/(loss) | | $ | (96,594,717 | ) | | $ | 3,028,421 | | | $ | (3,074,174 | ) | | $ | 20,512,722 | | | $ | 469,082 | | | $ | (16,212,122 | ) | | $ | 14,335,296 | | | $ | (1,062,205 | ) | |
* The differences between book-basis and tax-basis unrealized appreciation/(depreciation) is attributable primary to the tax deferral of losses on wash sales and passive foreign investment company (PFIC) mark to market adjustments.
** The differences between book-basis and tax basis undistributed net ordinary income is attributed to deferred compensation, which is included in Other Accumulated Loss.
*** Under the current tax law, capital and currency losses realized after October 31 and prior to a Fund's fiscal year end may be deferred as occurring on the first day of the following year.
93
As of December 31, 2014, the Funds have the following capital loss carryforwards available to offset future realized capital gains:
Capital losses expiring in: | | Alternative
Energy Fund | | Asia Focus
Fund | | Asia Pacific
Dividend
Builder
Fund | | China &
Hong Kong
Fund | | Dividend
Builder
Fund | | Global
Energy
Fund | | Global
Innovators
Fund | | Renminbi
Yuan & Bond
Fund | |
2015 | | $ | — | | | $ | — | | | $ | — | | | $ | — | | | $ | — | | | $ | — | | | $ | — | | | $ | — | | |
2016 | | | 10,370,865 | | | | — | | | | 885,255 | | | | — | | | | — | | | | — | | | | — | | | | — | | |
2017 | | | 40,204,652 | | | | — | | | | 1,115,940 | | | | — | | | | — | | | | — | | | | — | | | | — | | |
2018 | | | 9,296,377 | | | | 605,007 | | | | 1,502,925 | | | | — | | | | — | | | | — | | | | — | | | | — | | |
No Expiration Long-term | | | 27,930,707 | | | | — | | | | — | | | | — | | | | — | | | | — | | | | 1,313,844 | | | | — | | |
No Expiration Short-term | | | 745,704 | | | | — | | | | | | — | | | | — | | | | — | | | | — | | | | 14,470 | | |
Total | | $ | 88,548,305 | | | $ | 605,007 | | | $ | 3,504,120 | | | $ | — | | | $ | — | | | $ | — | | | $ | 1,313,844 | | | $ | 14,470 | | |
For the year ended December 31, 2014, the Asia Focus Fund, Asia Pacific Dividend Builder Fund and the Global Energy Fund utilized capital loss carryforwards of $828,177, $261,135, and $3,201,119, respectively.
Under the Regulated Investment Company Modernization Act of 2010 (the "Act"), the Funds will be permitted to carryforward capital losses incurred in taxable years beginning after December 22, 2010, for an unlimited period. However, any losses incurred during those future taxable years will be required to be utilized prior to the losses incurred in pre-enactment taxable years. As a result of this ordering rule, pre-enactment capital loss carryforwards may be more likely to expire unused. Additionally, post-enactment capital losses that are carried forward will retain their character as either short-term or long-term capital losses rather than being considered all short-term as under previous law.
The tax character of distributions paid during 2014 and 2013 fiscal years are as follows:
| | | 2014 | | 2013 | |
| | | Ordinary
Income | | Long-term
Capital Gain | | Ordinary
Income | | Long-term
Capital Gain | |
Alternative Energy Fund | | $ | — | | | $ | — | | | $ | — | | | $ | — | | |
Asia Focus Fund | | | 204,461 | | | | — | | | | 400,182 | | | | — | | |
Asia Pacific Dividend Builder Fund | | | 85,227 | | | | — | | | | 101,646 | | | | — | | |
China & Hong Kong Fund | | | 1,336,756 | | | | 18,043,702 | | | | 1,501,284 | | | | 1,539,106 | | |
Dividend Builder | | | 168,735 | | | | 9,141 | | | | 90,608 | | | | 49,069 | | |
Global Energy Fund | | | 536,063 | | | | 313,966 | | | | 338,807 | | | | — | | |
Global Innovators Fund | | | 2,229,837 | | | | — | | | | 200,095 | | | | — | | |
Renminbi Yuan & Bond Fund | | | 3,220,427 | | | | — | | | | 3,012,616 | | | | — | | |
Note 9
Disclosures about Offsetting Assets and Liabilities
Disclosures about Offsetting Assets and Liabilities require an entity to disclose information about offsetting and related arrangements to enable users of its financial statements to understand the effect of those arrangements on its financial position. The guidance requires retrospective application for all comparative periods presented. Management has evaluated the impact on the financial statement disclosures and determined that there is no effect.
94
Note 10
Recently Issued Accounting Pronouncements
In June 2014, the Financial Accounting Standards Board ("FASB") issued Accounting Standards Update ("ASU") No. 2014-11 Repurchase-to-Maturity Transactions, Repurchase Financings, and Disclosures. The amendments in this ASU require an entity to modify accounting for repurchase-to-maturity transactions and repurchase financing arrangements, as well as modify required disclosures for repurchase agreements, securities lending transactions, and repurchase-to-maturity transactions that are accounted for as secured borrowings. The guidance is effective for fiscal years beginning on or after December 15, 2014, and for interim periods within those fiscal years. Management is currently evaluating the impact these changes will have on the Funds' financial statement disclosures.
Note 11
Events Subsequent to the Fiscal Period End
The Funds have adopted financial reporting rules regarding a subsequent event which requires an entity to recognize in the financial statements the effects of all subsequent events that provide additional evidence about conditions that existed at the date of the balance sheet. Management has evaluated the Funds' related events and transactions and has determined that there were no events or transactions that occurred that would materially impact the amounts or disclosures in the Funds' financial statements.
95
Additional Information (Unaudited)
Proxy Voting Procedures
The Advisor votes proxies relating to portfolio securities in accordance with procedures that have been approved by the Board. You may obtain a description of these procedures, free of charge, by calling "toll-free" (800) 915-6565. This information is also available through the Securities and Exchange Commission's website at www.sec.gov.
Proxy Voting Records
Information regarding how the Advisor voted proxies relating to portfolio securities during the latest 12-month period ended June 30 is available, without charge, by calling toll-free, (800) 915-6565. This information is also available through the Securities and Exchange Commission's website at www.sec.gov.
Form N-Q Disclosure
The Funds file their complete schedule of portfolio holdings with the Securities and Exchange Commission for the first and third quarters of each fiscal year on Form N-Q. The Funds' Form N-Q is available on the Securities and Exchange Commission's website at www.sec.gov. The Funds' Form N-Q may be reviewed and copied at the Commission's Public Reference Room in Washington, DC, and information on the operation of the Public Reference Room may be obtained by calling (800) SEC-0330. This information is also available, without charge, by calling toll-free, (800) 915-6565.
Supplemental Tax Information
For the fiscal year ended December 31, 2014, certain dividends paid by the Funds may be subject to a maximum tax rate of 15%, as provided for by the Jobs and Growth Tax Relief Reconciliation Act of 2003. The percentage of dividends declared from ordinary income designated as qualified dividend income was as follows:
Alternative Energy Fund | | | N/A | | |
Asia Focus Fund | | | 100.00 | % | |
Asia Pacific Dividend Builder Fund | | | 47.91 | % | |
China & Hong Kong Fund | | | 89.38 | % | |
Dividend Builder Fund | | | 65.53 | % | |
Global Energy Fund | | | 100.00 | % | |
Global Innovators Fund | | | 100.00 | % | |
Renminbi Yuan & Bond Fund | | | N/A | | |
For the year ended December 31, 2014, pursuant to Section 853(b)(3) of the Internal Revenue Code, the China & Hong Kong Fund, the Dividend Builder Fund, and the Global Energy Fund designates $18,043,702, $9,141, and $309,365 respectively, as long-term capital gains.
96
Pursuant to Section 853 of the Internal Revenue Code of 1986, as amended, the Funds designate the following income earned from foreign sources and foreign taxes paid for the year ended December 31, 2014:
| | | Foreign Sourced Income | | Foreign Taxes Paid | |
| | | Total
Amount | | Per Share
Amount | | Total
Amount | | Per Share
Amount | |
Alternative Energy Fund | | | N/A | | | | N/A | | | | N/A | | | | N/A | | |
Asia Focus Fund | | $ | 647,613 | | | $ | 0.54 | | | $ | 52,647 | | | $ | 0.04 | | |
Asia Pacific Dividend Builder Fund | | | 190,218 | | | | 0.65 | | | | 12,303 | | | | 0.04 | | |
China & Hong Kong Fund | | | 2,991,713 | | | | 0.83 | | | | 144,155 | | | | 0.04 | | |
Dividend Builder Fund | | | 144,130 | | | | 0.60 | | | | 11,595 | | | | 0.04 | | |
Global Energy Fund | | | 1,527,541 | | | | 0.81 | | | | 193,896 | | | | 0.08 | | |
Global Innovators Fund | | | N/A | | | | N/A | | | | N/A | | | | N/A | | |
Renminbi Yuan & Bond Fund | | | N/A | | | | N/A | | | | N/A | | | | N/A | | |
97
REPORT OF INDEPENDENT REGISTERED
PUBLIC ACCOUNTING FIRM
To the Shareholders and Board of Trustees
Guinness Atkinson Funds
Woodland Hills, California
We have audited the accompanying statements of assets and liabilities, including the schedules of investments, of the Alternative Energy Fund, Asia Focus Fund, Asia Pacific Dividend Builder Fund (formerly known as Asia Pacific Dividend Fund), China & Hong Kong Fund, Global Energy Fund, Global Innovators Fund, Renminbi Yuan & Bond Fund and Dividend Builder Fund (formerly known as Inflation Managed Dividend Fund) (the "Funds"), each a series of shares of the Guinness Atkinson Funds, as of December 31, 2014, the related statements of operations for the year then ended, the statements of changes in net assets for each of the two years in the period then ended, and the financial highlights for each of the five years in the period then ended, except for Renminbi Yuan & Bond Fund the related statement of operations for the year then ended, the statement of changes in net assets for each of the two years in the period then ended and the financial highlights for each of the three years in the period then ended and for the period June 30, 2011 (commencement of operations) to December 31, 2011, and for Dividend Builder Fund the related statement of operations for the year then ended, the statement of changes in net assets for each of the two years in the period then ended and the financial highlights for each of the two years in the period then ended and the period March 30, 2012 (commencement of operations) to December 31, 2012. These financial statements and financial highlights are the responsibility of the Funds' management. Our responsibility is to express an opinion on these financial statements and financial highlights based on our audits.
We conducted our audits in accordance with the standards of the Public Company Accounting Oversight Board (United States). Those standards require that we plan and perform the audits to obtain reasonable assurance about whether the financial statements and financial highlights are free of material misstatement. The Funds are not required to have, nor were we engaged to perform, an audit of their internal control over financial reporting. Our audits included consideration of internal control over financial reporting as a basis for designing audit procedures that are appropriate in the circumstances, but not for the purpose of expressing an opinion on the effectiveness of the Funds' internal control over financial reporting. Accordingly, we express no such opinion. An audit includes examining, on a test basis, evidence supporting the amounts and disclosures in the financial statements. Our procedures included confirmation of securities owned as of December 31, 2014, by correspondence with the custodian. An audit also includes assessing the accounting principles used and significant estimates made by management, as well as evaluating the overall financial statement presentation. We believe that our audits provide a reasonable basis for our opinion.
In our opinion, the financial statements and financial highlights referred to above present fairly in all material respects, the financial position of the above mentioned Funds as of December 31, 2014, the results of their operations, the changes in their net assets and the financial highlights for the periods indicated above, in conformity with accounting principles generally accepted in the United States of America.
TAIT, WELLER & BAKER LLP
Philadelphia, Pennsylvania
February 26, 2015
98
TRUSTEE AND OFFICER INFORMATION (Unaudited)
Unless otherwise noted, each Trustee and officer's address is 21550 Oxnard Street, Suite 850, Woodland Hills, California 91367. Trustees and officers of the Trust serve until their resignation, removal or retirement. Additional information about the Trustees is included in the Funds' Statement of Additional Information which is available, without charge, upon request by calling toll-free, 1-800-915-6565 or by visiting the Funds' website at www.gafunds.com.
| Name and Age | | Position(s)
Held with
Trust† | | Year Elected | | Principal Occupation(s) During the
Past 5 Years | | Number of
Portfolios In
Fund Complex
Overseen by
Trustee | | Other Directorships
Held by Trustee
During the Past 5 Years | |
Non-Interested Trustees | | | | | | | | | | | | | | | | | | | | | |
Dr. Gunter Dufey
(74) | | Trustee | | | 1994 | | | Executive Director of Education Exchange Ltd., a consulting firm since 2010. Professorial Fellow, Nanyang Technological University (Singapore) since 2005. Professor (Emeritus) of Ross School at The University of Michigan, where he served from 1968 to 2002. | | | 8 | | | Independent director, various subsidiaries of Ally Financial Inc. (formerly GMAC) in the United States and Canada.
SmartX ETF Trust, a registered investment company | |
James I. Fordwood
(67) | | Trustee | | | 1994 | | | CFO and Managing Member of Prima Marketing LLC (network of convenience stores) since 1998. | | | 8 | | | SmartX ETF Trust, a registered investment company | |
Dr. Bret A. Herscher
(56) | | Trustee | | | 1994 | | | Vice President of Minnow Medical, a company that develops medical devices for treating peripheral artery disease since 2009. President of Pacific Consultants, a technical and technology management consulting company serving the electronic industry and venture capital community that he co-founded, from 1996 to 2007. | | | 8 | | | SmartX ETF Trust, a registered investment company | |
J. Brooks Reece, Jr.
(67) | | Trustee and Chairman | | | 1994 | | | Vice President of Adcole Corp., a manufacturer of precision measuring machines and sun angle sensors for space satellites since 1984. President of Adcole Far East Ltd. since 2008. Executive Director of Adcole Measuring Equipment Shanghai Co. Ltd., since 2004. | | | 8 | | | SmartX ETF Trust, a registered investment company | |
99
| Name and Age | | Position(s)
Held with
Trust† | | Year Elected | | Principal Occupation(s) During the
Past 5 Years | | Number of
Portfolios In
Fund Complex
Overseen by
Trustee | | Other Directorships
Held by Trustee
During the Past 5 Years | |
Interested Trustee | | | | | | | | | | | | | | | | | | | | | |
Timothy W.N.
Guinness*
14 Queen Anne's Gate
London,
England SW1H 9AA
U.K.
(66) | | Trustee | | | 1998 | | | Chairman/CIO of Guinness AtkinsonTM Asset Management since November 2002. Chairman of Guinness Asset Management Ltd., investment advisor in London, since 2003. Director of Guinness Capital Management Ltd. since 2010. Director of SR Europe Investment Trust Plc since 2001. Director of Atlantis Japan Growth Fund Ltd., since 2002. Non-Executive Director of Quayle Munro since 2007. Non-Executive Director of Brompton Bicycle Ltd., since 2000. | | | 8 | | | SmartX ETF Trust, a registered investment company | |
Officers | | | | | | | | | | | | | | | | | | | | | |
James Atkinson
(57) | | President | | | 2003 | | | Chief Executive Officer and Director of Guinness AtkinsonTM Asset Management since November 2002. Director of Guinness Asset Management Ltd. since 2003. Principal of Orbis Marketing, a mutual fund marketing and advertising firm, since November 2001. | | | N/A | | | | N/A | | |
Patrick Keniston
(50) | | Chief Compliance Officer | | | 2014 | | | Managing Director, Foreside Compliance Services, LLC since October 2008. | | | N/A | | | | N/A | | |
Rita Dam
(48) | | Treasurer | | | 2009 | | | Vice President, Mutual Fund Administration, LLC since 2006. | | | N/A | | | | N/A | | |
Joy Ausili
(48) | | Secretary and Assistant Treasurer | | | 2009 | | | Vice President, Mutual Fund Administration, LLC since 2006. | | | N/A | | | | N/A | | |
Sardjono Kadiman
(39) | | Assistant Treasurer | | | 2009 | | | Assistant Vice President, Mutual Fund Administration, LLC since 2008. | | | N/A | | | | N/A | | |
* "Interested person" (as defined in the 1940 Act) of the Funds because of his affiliation with the Funds' Advisor, Guinness Atkinson Asset Management, Inc.
100
| Name and Age | | Position(s)
Held with
Trust† | | Year Elected | | Principal Occupation(s) During the
Past 5 Years | | Number of
Portfolios In
Fund Complex
Overseen by
Trustee | | Other Directorships
Held by Trustee
During the Past 5 Years | |
Lyna Phan
(39) | | Assistant Treasurer | | | 2011 | | | Assistant Vice President, Mutual Fund Administration, LLC (2010-present); Compliance Officer, U.S. Bancorp Fund Services, LLC, a mutual and hedge fund service provider (2005-2010). | | | N/A | | | | N/A | | |
101
Privacy Notice
Guinness AtkinsonTM Funds and Guinness Atkinson Asset Management, Inc. may collect non-public information about you from the following sources:
• Information we receive about you on applications or other forms;
• Information you give us orally; and
• Information about your transactions with us.
We do not disclose any non-public personal information about our shareholders or former shareholders without the shareholder's authorization, except as required by law or in response to inquiries from governmental authorities. We restrict access to your personal and account information to those employees who need to know that information to provide products and services to you. We also may disclose that information to unaffiliated third parties (such as to brokers or custodians) only as permitted by law and only as needed for us to provide agreed services to you. We maintain physical, electronic and procedural safeguards to guard your non-public personal information.
102
Guinness AtkinsonTM Funds Information
Board of Trustees
J. Brooks Reece, Jr., Chairman | |
Dr. Gunter Dufey | |
James I. Fordwood | |
Timothy W.N. Guinness | |
Dr. Bret A. Herscher | |
Contact Guinness AtkinsonTM Funds
P.O. Box 701 | |
Milwaukee, WI 53201-0701 | |
Shareholder Services: 800-915-6566 | |
Literature Request: 800-915-6565 | |
Website: www.gafunds.com | |
Email: mail@gafunds.com | |
Guinness AtkinsonTM Funds
Fund | | Cusip | | Ticker | | Fund# | |
Alternative Energy Fund | | 402031 50 4 | | GAAEX | | | 1298 | | |
Asia Focus Fund | | 402031 10 8 | | IASMX | | | 1096 | | |
Asia Pacific Dividend Builder Fund | | 402031 60 3 | | GAADX | | | 1299 | | |
China & Hong Kong Fund | | 402031 20 7 | | ICHKX | | | 1094 | | |
Global Energy Fund | | 402031 40 5 | | GAGEX | | | 1098 | | |
Global Innovators Fund | | 402031 30 6 | | IWIRX | | | 1095 | | |
Dividend Builder Fund | | 402031 80 1 | | GAINX | | | 1092 | | |
Renminbi Yuan & Bond Fund | | 402031 70 2 | | GARBX | | | 1099 | | |
Distributed by Quasar Distributors, LLC, Milwaukee, WI 53202
This report is intended for shareholders of the Guinness AtkinsonTM Funds and may not be used as literature unless preceded or accompanied by a current prospectus.
103
Guinness Atkinson Funds
c/o U.S. Bancorp Fund Services, LLC
P.O. Box 701
Milwaukee, WI 53201-0701
Item 2. Code of Ethics.
The registrant has adopted a code of ethics that applies to the registrant’s principal executive officer and principal financial officer. The registrant has not made any amendments to its code of ethics during the period covered by this report. The registrant has not granted any waivers from any provisions of the code of ethics during the period covered by this report.
The registrant undertakes to provide to any person without charge, upon request, a copy of its code of ethics by mail when they call the registrant at 1-800-915-6565.
Item 3. Audit Committee Financial Expert.
The registrant’s board of trustees has determined that there is at least one audit committee financial expert serving on its audit committee. James I. Fordwood is the “audit committee financial expert” and is considered to be “independent” as each term is defined in Item 3 of Form N-CSR.
Item 4. Principal Accountant Fees and Services.
The registrant has engaged its principal accountant to perform audit services, audit-related services, tax services and other services during the past two fiscal years. “Audit services” refer to performing an audit of the registrant’s annual financial statements or services that are normally provided by the accountant in connection with statutory and regulatory filings or engagements for those fiscal years. “Audit-related services” refer to the assurance and related services by the principal accountant that are reasonably related to the performance of the audit. “Tax services” refer to professional services rendered by the principal accountant for tax compliance, tax advice, and tax planning. There were no “other services” provided by the principal accountant. The following table details the aggregate fees billed or expected to be billed for each of the last two fiscal years for audit fees, audit-related fees, tax fees and other fees by the principal accountant.
| | FYE 12/31/2014 | | FYE 12/31/2013 | |
Audit Fees | | $ | 140,900 | | $ | 140,900 | |
Audit-Related Fees | | N/A | | N/A | |
Tax Fees | | $ | 25,600 | | $ | 25,600 | |
All Other Fees | | N/A | | N/A | |
The audit committee has adopted pre-approval policies and procedures that require the audit committee to pre-approve all audit and non-audit services of the registrant, including services provided to any entity affiliated with the registrant.
The percentage of fees billed by Tait, Weller, & Baker LLP applicable to non-audit services pursuant to waiver of pre-approval requirement were as follows:
| | FYE 12/31/2014 | | FYE 12/31/2013 | |
Audit-Related Fees | | 0 | % | 0 | % |
Tax Fees | | 0 | % | 0 | % |
All Other Fees | | 0 | % | 0 | % |
All of the principal accountant’s hours spent on auditing the registrant’s financial statements were attributed to work performed by full-time permanent employees of the principal accountant.
The following table indicates the non-audit fees billed or expected to be billed by the registrant’s accountant for services to the registrant and to the registrant’s investment adviser (and any other controlling entity, etc.—not sub-adviser) for the last two years. The audit committee of the Board of Trustees has considered whether the provision of non-audit services that were rendered to the registrant’s investment adviser is compatible with maintaining the principal accountant’s independence and has concluded that the provision of such non-audit services by the accountant has not compromised the accountant’s independence.
Non-Audit Related Fees | | FYE 12/31/2014 | | FYE 12/31/2013 |
Registrant | | N/A | | N/A |
Registrant’s Investment Advisor | | N/A | | N/A |
Item 5. Audit Committee of Listed Registrants.
Not applicable to registrants who are not listed issuers (as defined in Rule 10A-3 under the Securities Exchange Act of 1934).
Item 6. Schedule of Investments.
(a) Schedule of Investments is included as part of the report to shareholders filed under Item 1 of this Form.
(b) Not Applicable.
Item 7. Disclosure of Proxy Voting Policies and Procedures for Closed-End Management Investment Companies.
Not Applicable.
Item 8. Portfolio Managers of Closed-End Management Investment Companies.
Not Applicable.
Item 9. Purchases of Equity Securities by Closed-End Management Investment Company and Affiliated Purchasers.
Not Applicable.
Item 10. Submission of Matters to a Vote of Security Holders.
The registrant has not made any material changes to the procedures by which shareholders may recommend nominees to the registrant’s Board of Trustees.
Item 11. Controls and Procedures.
(a) The registrant’s principal executive officer and principal financial officer have evaluated the registrant’s disclosure controls and procedures within 90 days of this filing and have concluded based on such evaluation that the registrant’s disclosure controls and procedures were effective, as of that
date, in ensuring that information required to be disclosed by the registrant in this Form N-CSR was recorded, processed, summarized, and reported within the time periods specified in the Securities and Exchange Commission’s rules and forms.
(b) There were no changes in the registrant’s internal control over financial reporting (as defined in Rule 30a-3(d) under the Investment Company Act of 1940) that occurred during the registrant’s last fiscal quarter that have materially affected, or are reasonably likely to materially affect, the registrant’s internal control over financial reporting.
Item 12. Exhibits.
(a) (1) Any code of ethics or amendment thereto, that is subject of the disclosure required by Item 2, to the extent that the registrant intends to satisfy Item 2 requirements through filing an exhibit. Incorporated by reference to the Registrant’s Form N-CSR filed March 10, 2011.
(b)
(2) Certifications pursuant to Section 302 of the Sarbanes-Oxley Act of 2002. Filed herewith.
(3) Any written solicitation to purchase securities under Rule 23c-1 under the Act sent or given during the period covered by the report by or on behalf of the registrant to 10 or more persons. Not applicable to open-end investment companies.
(c) Certification pursuant to Section 906 of the Sarbanes-Oxley Act of 2002. Filed herewith.
SIGNATURES
Pursuant to the requirements of the Securities Exchange Act of 1934 and the Investment Company Act of 1940, the registrant has duly caused this report to be signed on its behalf by the undersigned, thereunto duly authorized.
(Registrant) | Guinness Atkinson Funds | | |
| | |
| |
By | /s/ James J. Atkinson | |
Name: James J. Atkinson | |
Title: President | |
Date: | 3/10/2015 | |
| | | | |
Pursuant to the requirements of the Securities Exchange Act of 1934 and the Investment Company Act of 1940, this report has been signed by the following persons on behalf of the registrant and in the capacities and on the dates indicated.
By | /s/ James J. Atkinson | |
Name: James J. Atkinson | |
Title: President | |
Date: | 3/10/2015 | |
| | |
| | |
By | /s/ Rita Dam | |
Name: Rita Dam | |
Title: Treasurer | |
Date: | 3/10/2015 | |