UNITED STATES
SECURITIES AND EXCHANGE COMMISSION
Washington, D.C. 20549
FORM N-CSR
CERTIFIED SHAREHOLDER REPORT OF REGISTERED
MANAGEMENT INVESTMENT COMPANIES
Investment Company Act file number | 811-08360 |
|
GUINNESS ATKINSON FUNDS |
(Exact name of registrant as specified in charter) |
|
21550 Oxnard Street, Suite 850 Woodland Hills, CA | | 91367 |
(Address of principal executive offices) | | (Zip code) |
|
James J. Atkinson, Jr. 21550 Oxnard Street, Suite 850 Woodland Hills, CA 91367 |
(Name and address of agent for service) |
|
Registrant’s telephone number, including area code: | (800-915-6566) | |
|
Date of fiscal year end: | December 31 | |
|
Date of reporting period: | December 31, 2012 | |
| | | | | | | | |
Item 1. Reports to Stockholders.
The registrant’s annual report transmitted to shareholders pursuant to Rule 30e-1 under the Investment Company Act of 1940, as amended (the “Investment Company Act”), is as follows:
Guinness AtkinsonTM Funds
Annual Report
December 31, 2012
TABLE OF CONTENTS
| | 3 | | | Letter to Shareholders | |
| | 6 | | | Expense Example | |
| | 7 | | | Alternative Energy Fund | |
| | 15 | | | Asia Focus Fund | |
| | 21 | | | Asia Pacific Dividend Fund | |
| | 27 | | | China & Hong Kong Fund | |
| | 33 | | | Global Energy Fund | |
| | 41 | | | Global Innovators Fund | |
| | 48 | | | Inflation Managed Dividend FundTM | |
| | 55 | | | Renminbi Yuan & Bond Fund | |
| | 62 | | | Statements of Assets and Liabilities | |
| | 64 | | | Statements of Operations | |
| | 66 | | | Statements of Changes in Net Assets | |
| | 69 | | | Financial Highlights | |
| | 77 | | | Notes to Financial Statements | |
| | 91 | | | Report of Independent Registered Public Accounting Firm | |
| | 92 | | | Trustee and Officer Information | |
| | 95 | | | Privacy Notice | |
| | 99 | | | Guinness Atkinson Funds Information | |
2
Dear Guinness Atkinson Funds Shareholders,
Judging by the performance of the global equity markets in 2012 it appears the world isn't going to end soon. We're not surprised; in fact, readers of these letters will note that we've been planning on continued improvement even during the worst of times. Yes, we know, the news always seem to be negative. But as we're fond of saying, there has never been a better time to be alive and the human condition has never been better. On a global basis, life expectancy has never been higher; same for per capita income, literacy rates, access to education, health care and, frankly, by any statistical measure life on this planet has never been better. Are there intractable and serious problems? Yes, of course there are. But that doesn't diminish the fact that the human condition has improved (and continues to improve) for the vast majority of world's seven billion.
One economic fact that may surprise: Despite the global economic crisis that continues to linger, global per capita gross domestic product (GDP) has nearly doubled since the turn of the century. (Source: CIA Factbook.) Your newspaper is more likely to report on the European debt crisis, the US budget crisis or other negative economic news on the global economy. It isn't that the negative news isn't true; it is. But the dramatic improvement in global per capita GDP happens incrementally over time. The media has a short news cycle and a decade plus trend, as inexorable as it clearly is, struggles to compete with the repeated bursts of big bad news. And, let's face it, negative news is generally more newsworthy than positive news. But in the end, it is extremely clear that the constant compounding of positivity handily beats the repeated bursts of negative news. We base that assessment on the facts we cite above, namely that humans are healthier, wealthier and wiser than at any point in history.
This brings us to the themes that form the foundation of the Guinness Atkinson Funds. Asia continues its remarkable economic advance. We know that the "Asia Miracle" has become a tired cliché for many, but the fact is that the economic progress over the last 30 years in Asia is unprecedented in human history. Innovation (and we don't just mean technological innovation) has been rapidly and persistently reshaping the global business environment and is one of the keys to the steady growth in per capita GDP. Global economic growth and the aforementioned growth in per capita GDP is increasing global energy demand which in turn, has been one of the factors spurring a shift to alternative energy. Regardless of the economic cycle we believe these themes will continue to reshape the planet and those investors that understand these themes could potentially position themselves for investment success.
Outlook for 2013
Given that the global economy is in a recovery mode (albeit a slow and fitful recovery to date), and given the interest rate environment and the large amounts of economic stimulus that has been provided, it is hard to see how higher interest rates and inflation are not headed our way. While the timing may be a bit difficult to forecast, it is our opinion that we will see a return of higher interest rates and inflation. We believe two Guinness Atkinson Funds may be well-positioned to deal with higher interest rates and inflation. The Renminbi Yuan & Bond Fund may do well should the US dollar decline relative to the Renminbi Yuan in an inflationary environment. The newest addition to the Guinness Atkinson Fund family, the Inflation Managed Dividend Fund, was designed to assist investors meet their long-term income needs and is specifically designed to mitigate the effect of inflationary environments with a focus on dividend growth. The Fund seeks to invest in high quality dividend paying stocks that we believe can grow their dividend at a rate greater than inflation. While dividend paying stocks may be negatively affected by rising interest rates over a short-term period, we believe the ability to grow the dividend should, over time, help combat both rising interest rates and inflation.
Fund Performance
The performance for the Guinness Atkinson Funds for 2012 was, broadly speaking, good. With the exception of the Alternative Energy Fund all of the Funds produced a positive total return. The leader among the Guinness Atkinson Funds for 2012 was the Asia Pacific Dividend Fund which produced a total return of 23.39%. The lone negative result for the year was posted by the Alternative Energy Fund which produced a negative total return of 15.20%. It is worth noting that despite the dismal returns for this Fund the Alternative Energy Fund finished the year with a spring in its step and has gotten off to a very good start early in 2013. Clearly this Fund has a long way to go to recover but the signs point to a recovery for the beleaguered sector.
3
The table below provides total return data for each of the Funds over the one, three, five, ten and from inception periods through December 31, 2012. Also included in the table is the expense ratio data from the most recent prospectus dated May 1, 2012.
Fund (inception date) | | 1-year | | 3-year | | 5-year | | 10-year | | From Inception | | Expense Ratio | |
Alternative Energy Fund (March 31, 2006) | | | -15.20 | % | | | -27.53 | % | | | -29.64 | % | | | — | | | | -19.78 | % | | | 1.81 | % | |
Asia Focus (April 29, 1996) | | | 15.89 | % | | | 2.72 | % | | | -2.99 | % | | | 14.05 | % | | | 3.42 | % | | | 1.59 | % | |
Asia Pacific Dividend Fund (March 31, 2006) | | | 23.48 | % | | | 9.49 | % | | | 0.87 | % | | | — | | | | 5.73 | % | | | 3.26 | % gross; 1.98% net† | |
China & Hong Kong (June 30, 1994) | | | 14.42 | % | | | -1.46 | % | | | -3.43 | % | | | 14.36 | % | | | 7.75 | % | | | 1.53 | % | |
Global Energy Fund (June 30, 2004) | | | 3.53 | % | | | 1.60 | % | | | -2.51 | % | | | — | | | | 12.16 | % | | | 1.27 | % | |
Global Innovators Fund (December 15, 1998) | | | 19.91 | % | | | 9.46 | % | | | 0.78 | % | | | 9.69 | % | | | 4.79 | % | | | 1.42 | % gross; 1.44% net* | |
Inflation Managed Dividend FundTM (March 30, 2012) | | | — | | | | — | | | | — | | | | — | | | | 4.97 | % | | | 0.92 | % gross; 0.68% net† | |
Renminbi Yuan & Bond Fund (June 30, 2011) | | | 3.88 | % | | | — | | | | — | | | | — | | | | 2.67 | % | | | 0.92 | % gross; 0.90% net† | |
Periods of greater than one year are average annualized returns; one year and shorter period returns are actual returns. All returns are for the periods ending December 31, 2012.
Performance data quoted represents past performance and does not guarantee future results. The investment return and principal value of an investment will fluctuate so that an investor's shares, when redeemed, may be worth more or less than the original cost. Current performance of the Funds may be lower or higher than the performance quoted. Performance data current to the most recent month end may be obtained by visiting www.gafunds.com.
Each Fund imposes a 2% redemption fee on shares held less than 30 days. Performance data quoted does not reflect this fee. If it had, total return would be lower.
†All of the Guinness Atkinson Funds have an expense cap in place and the advisor is contractually obligated to cap the Funds' total expenses at least through June 30, 2013. For the Inflation Managed Dividend FundTM, the advisor is contractually obligated to cap total expenses at least through March 31, 2015.
*Includes 0.02% of recaptured fees previously waived by the Advisor.
Expense ratios are from the most recent prospectus (dated May 1, 2012) and are from the most recent audited financials (period ending December 31, 2011) at the time that prospectus was completed.
Our investment team has provided a detailed commentary for each of the Guinness Atkinson Funds adjacent to each Fund's financial results. Below you'll find Morningstar ratings data for the Fund range.
As usual, we appreciate the confidence you have placed in us and our management team and look forward to what will hopefully be a great 2013.
Sincerely,

| | 
| |
Timothy Guinness | | James Atkinson | |
4
Morningstar Ratings (based on Morningstar risk-adjusted returns)
Below is a table listing the Morningstar star ratings as of December 31, 2012 for the six Guinness Atkinson Funds that have at least a three year history. Parenthetical numbers after the star rating indicate the number of funds in the comparison group.
Fund | | Category | | Overall | | 3-year | | 5-year | | 10-year | |
Alternative Energy | | Equity Energy | | | 1 | * | | | 1 | * | | | 1 | * | | | | | |
Fund | | | | | | | (78 | funds) | | | (78 | funds) | | | (69 | funds) | | | N/A | | |
Asia Focus | | Pacific/Asia | | | 2 | ** | | | 2 | ** | | | 2 | ** | | | 2 | ** | |
Fund | | Ex-Japan Stk | | | (51 | funds) | | | (51 | funds) | | | (37 | funds) | | | (30 | funds) | |
Asia Pacific Dividend | | Pacific/Asia | | | 3 | *** | | | 4 | **** | | | 3 | *** | | | | | |
Fund | | Ex-Japan Stk | | | (51 | funds) | | | (51 | funds) | | | (37 | funds) | | | N/A | | |
China & Hong Kong | | China Region | | | 3 | *** | | | 2 | ** | | | 2 | ** | | | 3 | *** | |
Fund | | | | | | | (81 | funds) | | | (81 | funds) | | | (60 | funds) | | | (24 | funds) | |
Global Energy | | Equity Energy | | | 3 | *** | | | 2 | ** | | | 3 | *** | | | | | |
Fund | | | | | | | (78 | funds) | | | (78 | funds) | | | (69 | funds) | | | N/A | | |
Global Innovators | | Large Growth | | | 3 | *** | | | 3 | *** | | | 2 | ** | | | 4 | **** | |
Fund | | | | | | | (1,503 | funds) | | | (1,503 | funds) | | | (1,301 | funds) | | | (863 | funds) | |
©2013 Morningstar, Inc. All Rights Reserved. The information contained herein: (1) is proprietary to Morningstar and/or its content providers; (2) may not be copied or distributed; and (3) is not warranted to be accurate, complete or timely. Neither Morningstar nor its content providers are responsible for any damages or losses arising from any use of this information. Past performance is no guarantee of future results.
The Funds invest in foreign securities, which involves greater volatility and political, economic and currency risks and differences in accounting methods. Non-diversified Funds' assets may be concentrated in fewer individual holdings than diversified funds. Therefore, these Funds are more exposed to individual stock volatility than diversified funds. Investments in smaller companies involve additional risks such as limited liquidity and greater volatility. Investments focused in a single geographic region may be exposed to greater risk than investments diversified among various geographies. Investments focused on the energy sector may be exposed to greater risk than an investments diversified among various sectors.
For each fund with at least a three-year history, Morningstar calculates a Morningstar RatingTM based on a Morningstar Risk-Adjusted Return measure that accounts for variation in a fund's monthly performance (including the effects of sales charges, loads, and redemption fees), placing more emphasis on downward variations and rewarding consistent performance. The top 10% of funds in each category receive 5 stars, the next 22.5% receive 4 stars the next 35% receive 3 stars, the next 22.5% receive 2 stars and the bottom 10% receive 1 star. (Each share class is counted as a fraction of one fund within this scale and rated separately, which may cause slight variations in distribution percentages.)
5
Expense Examples (Unaudited)
As a shareholder of the Funds, you incur two types of costs: (1) redemption fees; and (2) ongoing costs, including advisory fees and other Fund expenses. The examples below are intended to help you understand your ongoing costs (in dollars) of investing in the Funds and to compare these costs with the ongoing costs of investing in other mutual funds.
The examples are based on an investment of $1,000 invested at the beginning of the period shown and held for the entire period from July 1, 2012 to December 31, 2012.
Actual Expenses
For each Fund, the first line of the table below provides information about actual account values and actual expenses. You may use the information in this line, together with the amount you invested, to estimate the expenses that you paid over the period. Simply divide your account value by $1,000 (for example, an $8,600 account value divided by $1,000 = 8.6), then multiply the result by the number in the first line under the heading entitled "Expenses Paid during Period" to estimate the expenses you paid on your account during this period.
Hypothetical Example for Comparison Purposes
For each Fund, the second line of the table below provides information about hypothetical account values and hypothetical expenses based on the Fund's actual expense ratios and an assumed rate of return of 5% per year before expenses, which is not the Fund's actual return. The hypothetical account values and expenses may not be used to estimate the actual ending account balance or expenses you paid for the period. You may use this information to compare the ongoing costs of investing in the Fund and other funds. To do so, compare this 5% hypothetical example with the 5% hypothetical examples that appear in the shareholder reports of the other funds.
Please note that the expenses shown in the table are meant to highlight your ongoing costs only and do not reflect any redemption fees. Therefore, the second line for each Fund of the table is useful in comparing ongoing costs only, and will not help you determine the relative total costs of owning different funds. In addition, if these redemption fees were included, your costs would have been higher.
| | | Beginning
Account
Value
(07/01/12) | | Ending
Account
Value
(12/31/12) | | Expenses Paid
During Period*
(07/01/12 to
12/31/12) | | Expense Ratios
During Period*
(07/01/12 to
12/31/12) | |
Guinness Atkinson Alternative Energy Fund Actual | | $ | 1,000.00 | | | $ | 1,014.90 | | | $ | 10.03 | | | | 1.98 | %† | |
Guinness Atkinson Alternative Energy Fund Hypothetical
(5% return before expenses) | | $ | 1,000.00 | | | $ | 1,015.18 | | | $ | 10.03 | | | | 1.98 | %† | |
Guinness Atkinson Asia Focus Fund Actual | | $ | 1,000.00 | | | $ | 1,178.10 | | | $ | 9.25 | | | | 1.69 | % | |
Guinness Atkinson Asia Focus Fund Hypothetical
(5% return before expenses) | | $ | 1,000.00 | | | $ | 1,016.64 | | | $ | 8.57 | | | | 1.69 | % | |
Guinness Atkinson Asia Pacific Dividend Fund Actual | | $ | 1,000.00 | | | $ | 1,159.50 | | | $ | 10.75 | | | | 1.98 | %† | |
Guinness Atkinson Asia Pacific Dividend Fund Hypothetical
(5% return before expenses) | | $ | 1,000.00 | | | $ | 1,015.18 | | | $ | 10.03 | | | | 1.98 | %† | |
Guinness Atkinson China & Hong Kong Fund Actual | | $ | 1,000.00 | | | $ | 1,110.40 | | | $ | 8.01 | | | | 1.51 | % | |
Guinness Atkinson China & Hong Kong Fund Hypothetical
(5% return before expenses) | | $ | 1,000.00 | | | $ | 1,017.55 | | | $ | 7.66 | | | | 1.51 | % | |
Guinness Atkinson Global Energy Fund Actual | | $ | 1,000.00 | | | $ | 1,098.20 | | | $ | 7.23 | | | | 1.37 | % | |
Guinness Atkinson Global Energy Fund Hypothetical
(5% return before expenses) | | $ | 1,000.00 | | | $ | 1,018.25 | | | $ | 6.95 | | | | 1.37 | % | |
Guinness Atkinson Global Innovators Fund Actual | | $ | 1,000.00 | | | $ | 1,089.10 | | | $ | 8.09 | | | | 1.54 | % | |
Guinness Atkinson Global Innovators Fund Hypothetical
(5% return before expenses) | | $ | 1,000.00 | | | $ | 1,017.39 | | | $ | 7.81 | | | | 1.54 | % | |
Guinness Atkinson Inflation Managed Dividend Fund Actual | | $ | 1,000.00 | | | $ | 1,071.80 | | | $ | 3.54 | | | | 0.68 | %† | |
Guinness Atkinson Inflation Managed Dividend Fund Hypothetical
(5% return before expenses) | | $ | 1,000.00 | | | $ | 1,021.72 | | | $ | 3.46 | | | | 0.68 | %† | |
Guinness Atkinson Renminbi Yuan & Bond Fund Actual | | $ | 1,000.00 | | | $ | 1,036.30 | | | $ | 4.61 | | | | 0.90 | % | |
Guinness Atkinson Renminbi Yuan & Bond Fund Hypothetical
(5% return before expenses) | | $ | 1,000.00 | | | $ | 1,020.61 | | | $ | 4.57 | | | | 0.90 | % | |
*Expenses are equal to the Funds' annualized expense ratio as indicated, multiplied by the average account value over the period, multiplied by the number of days in most recent fiscal half-year period (184), then divided by the number of days in the fiscal year (366) (to reflect the one-half year period).
†Net of fee waivers and/or expense reimbursements. If those fee waivers and/or expense reimbursements had not been in effect, the Fund's actual expenses would have been higher.
6
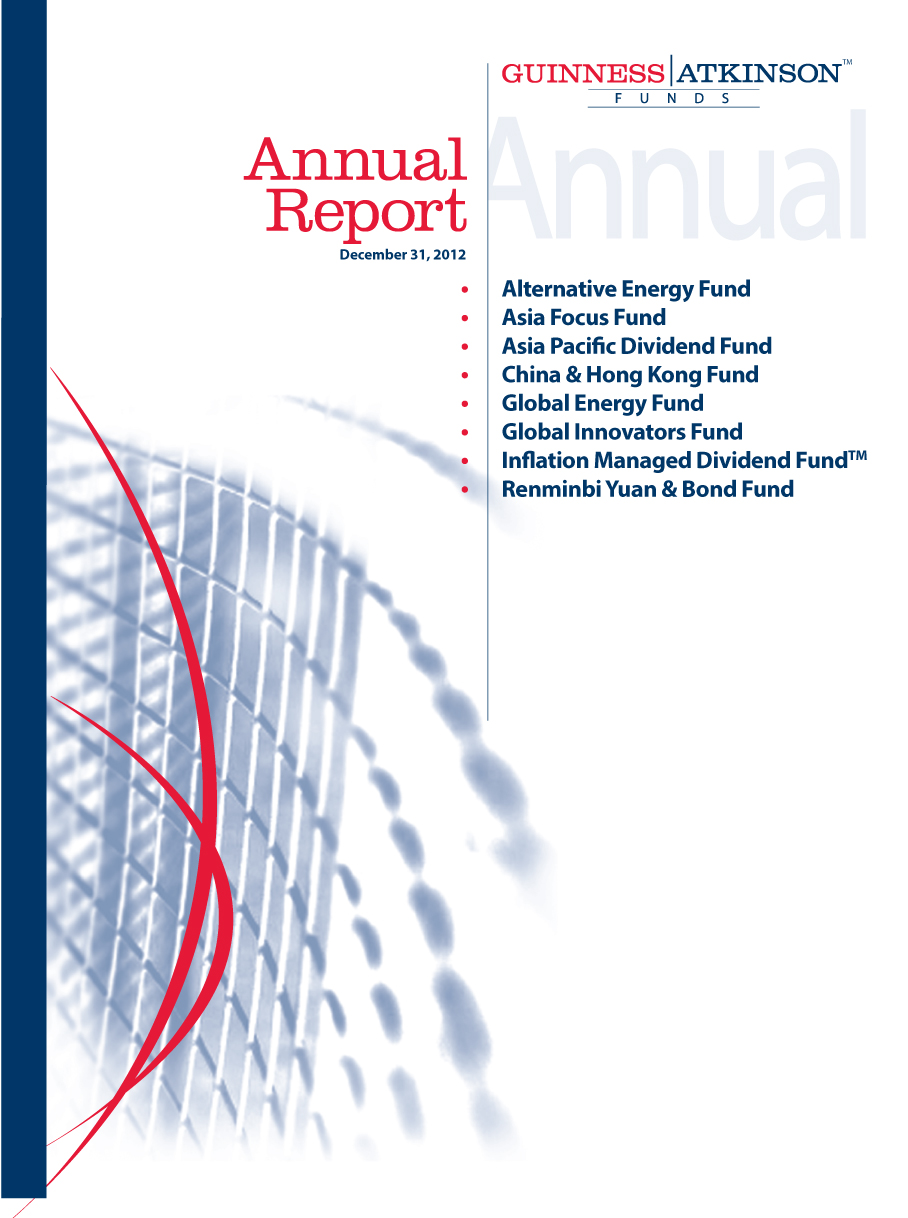
1. Performance
AVERAGE ANNUALISED TOTAL RETURNS
| | | 1 Year
(actual) | | 3 years | | 5 Years | | Since
Inception
(March 31, 2006) | |
Fund | | | -15.20 | % | | | -27.53 | % | | | -29.64 | | | | -19.78 | % | |
Benchmark indices | |
Wilderhill New Energy Global Innovation Index | | | -4.23 | % | | | -20.67 | % | | | -22.57 | % | | | -10.42 | % | |
Wilderhill Clean Energy Index | | | -17.58 | % | | | -26.99 | % | | | -31.37 | % | | | -21.50 | % | |
MSCI World Index | | | 16.60 | % | | | 7.59 | % | | | -0.55 | % | | | 2.82 | % | |
The Fund's gross expense ratio is 1.81% per the Summary Prospectus dated May 1, 2012. The Advisor has contractually agreed to waive a portion of its advisory fees and/or reimburse other Fund expenses so that the Fund's ratio of expenses to average daily net assets will not exceed 1.98% (excluding Acquired Fund Fees and Expenses, interest, taxes, dividends on short positions and extraordinary expenses) through at least June 30, 2013. To the extent that the Advisor waives fees, it may seek repayment of a portion or all of such amounts at any time within the three fiscal years after the fiscal year in which such amounts were waived and/or reimbursed, subject to the applicable cap.
Performance data quoted represents past performance and does not guarantee future results. The investment return and principal value of an investment in the Fund will fluctuate so that an investor's shares, when redeemed, may be worth more or less than their original cost. Current performance of the Fund may be lower or higher than the performance quoted. Performance data current to the most recent month end may be obtained by visiting www.gafunds.com, or calling (800) 916-6566.
The Fund imposes a 2% redemption fee on the sale of shares held less than 30 days. Performance data quoted does not reflect this redemption fee. Total returns for certain periods reflect fee limitations in effect and in the absence of these limitations total returns would have been lower.
The Guinness Atkinson Alternative Energy Fund was down -15.20% in 2012. This compared to a fall in the Wilderhill New Energy Global Innovation Index of -4.23% and in the Wilderhill Clean Energy Index of -17.58%. The Fund underperformed the Wilderhill New Energy Global Innovation Index as this index has little solar exposure compared to the Fund. The sector has not recovered with broad markets as shown by the underperformance versus the MSCI World Index.
As in a number of previous years, the first quarter saw strong performance but this tailed off for the rest of the year. The Fund's performance turned in November to end the year well up from its low.
The portfolios efficiency stocks were the best performing subsector, with strong performances from Canada Lithium, Good Energy, Elster and Itron. Canada Lithium and Good Energy were acquired during the year and the performance partly reflected the Fund taking advantage of discounted share issuance by the company. Elster was acquired by Melrose Industrials. Powerone, Boralex and Ormat Technologies all further contributed. The portfolios solar and wind stocks were the main source of underperformance. The worst solar performers were STR Holdings, LDK Solar, SMA Solar and the worst wind performers were Greentech, Theolia and Vestas. They hydro holdings also underperformed.
The main reasons that alternative energy has underperformed versus global equities are that the alternative energy sector currently faces the headwinds of falling subsidies and lower availability of finance for alternative energy projects. Importantly, we believe the long term drivers for alternative energy remain broadly intact and the prices of stocks in the sector reflect the challenges the sector faces.
7
2. Portfolio
Sector | | % of Assets | |
Solar | | | 26.76 | % | |
Wind | | | 49.38 | % | |
Efficiency | | | 15.15 | % | |
Geothermal | | | 3.26 | % | |
Hydro | | | 5.24 | % | |
Biomass Energy | | | 0.00 | % | |
Cash | | | 0.21 | % | |
| | | | 100.00 | % | |
Domicile* | | % of Assets | |
Europe | | | 36.60 | % | |
North America | | | 31.57 | % | |
Asia | | | 29.54 | % | |
Latin America | | | 2.08 | % | |
Australasia | | | 0.00 | % | |
Cash | | | 0.21 | % | |
| | | | 100.00 | % | |
* region is as per company domicile.
The Fund uses a structure of 30 equally weighted holdings.
The portfolio is focused in the wind and solar sectors, with 26.76% in solar and 49.38% in Wind. We believe these sectors have the best long-term growth potential of the alternative energy space.
Within the solar sector, most of our holdings have Asian manufacturing capabilities as this is essential for a competitive cost structure today. Further solar holdings are in leading installers with good exposure to the end market volume growth and we hold two companies that manufacture inverters.
For our wind exposure we are invested in both turbine manufacturers and wind farm developers.
Further investments are in hydroelectric power producers in Europe and Latin America, a geothermal energy company, a ground source heat company and a lithium mining company.
The Fund has 36.61% of its holdings in companies domiciled in Europe, reflecting the more mature European industry. North America accounts for 31.57% of the Fund. The Fund's 31.62% of emerging markets holdings is principally in Asia, with our investments in Chinese companies making up 29.54% of the Fund.
Mkt Cap $m | | Positions | | % of Assets | |
>1000 | | | 9 | | | | 28.21 | % | |
500-1000 | | | 6 | | | | 18.26 | % | |
250-500 | | | 6 | | | | 18.75 | % | |
100-250 | | | 8 | | | | 25.83 | % | |
50-100 | | | — | | | | 0.00 | % | |
<50 | | | 4 | | | | 8.74 | % | |
8
Position size | | Positions | | % of Assets | |
Full | | | 30 | | | | 97.50 | % | |
Half | | | 0 | | | | 0.00 | % | |
Research | | | 3 | | | | 2.29 | % | |
The liquidity of The Fund is good, with 28.21% of The Fund in companies with a market capitalization over US$1,000 million. The Fund now has 30 full units and 3 research holdings.
3. Activity
The Fund acquired new positions in Canada Lithium and Good Energy Group plc. Canada Lithium is a lithium mining company that supports the global lithium battery industry. Good Energy Group is a renewables utility with wind generation assets and a customer base in the UK.
The Fund sold its holdings in Elster which was acquired by Melrose Industrials.
4. Outlook
The outlook for 2013 remains challenging from a macroeconomic perspective and visibility on 2013 earnings for most companies is limited. However, this is offset by stock prices that reflect the uncertainty and the negative investor sentiment for the sector.
Longer term, the investment case is still intact but there are grounds for near term caution. Reviewing the drivers of energy security, rising fossil fuel prices and environmental concerns (including climate change) we see specific challenges for each.
Energy security is an important driver for promotion of alternative energy. However, increasing oil and gas production in the US is moving the country closer towards a notional energy independence. However, even if the US produces as much oil as is consumed domestically, its energy security is still impacted by events in oil producing nations. Instability in the Middle east will continue to be a concern for the US notwithstanding increased fossil fuel production. On the natural gas side, we think that once liquefied natural gas (LNG) exports from the US commence in 2015, we will move closer to a global gas market which is likely to lead to higher US natural gas prices.
Given the experience of the US in increasing oil and gas supply and the many announcements of new oil and gas discoveries, there is an implication that supply is not a long term concern. However, the discoveries are more than offset by increasing emerging markets demand and declines in production in existing fields. Ultimately fossil fuels are a finite resource, nothwithstanding that at higher prices we will find new ways to produce them.
The environmental case for moving to alternative energy remains fully intact, but there is a lower political will towards addressing climate change as witnessed by the Republican position in the US. However, the visible increasing numbers of "extreme" weather events underpins popular support for alternative energy and we expect policy support to continue globally albeit focused on the least expensive solutions.
We believe the long term outlook for the alternative energy sector remains positive and continues to improve as costs of alternative energy technologies become more competitive and global demand for energy continues to rise, pushing fossil fuel prices higher.

Edward Guinness
The Fund invests in foreign securities, which will involve political, economic and currency risks, greater volatility, and differences in accounting methods. The Fund is non-diversified, meaning that its assets may be concentrated in fewer individual holdings than diversified funds. Therefore, the Fund is more exposed to individual stock volatility than diversified funds. The Fund invests in smaller companies, which will involve additional risks such as limited liquidity and greater volatility. The Fund's focus on the energy sector to the exclusion of other sectors exposes the Fund to greater market risk and potential monetary losses than if the Fund's assets were diversified among various sectors. Should the prices of energy (oil, gas, electricity) or alternative energy decline, this would likely have a negative affect on the Fund's holdings. Investing in this Fund may be more risky than investing in a fund that invests in U.S. securities due to increased volatility of foreign or emerging markets. Specific risks include the risk of expropriation of assets and higher volatility among other risks.
9
The Wilderhill New Energy Global Innovation Index (NEX) is a modified dollar-weighted index of publicly traded companies that are active in renewable and low-carbon energy, and that stand to benefit from responses to climate change and energy security concerns. The Wilderhill Clean Energy Index (ECO) is a modified equal dollar weighted index comprised of publicly traded companies whose businesses stand to benefit substantially from societal transition toward the use of cleaner energy and conservation. The MSCI World Energy Index is an unmanaged index composed of more than 1,400 stocks listed on exchanges in the U.S. Europe, Canada, Australia, New Zealand, and the Far East. These indices are unmanaged, not available for investment and do not incur expenses.
Please refer to the Schedule of Investments for details on fund holdings. Current and future portfolio holdings are subject to risk.
The information provided herein represents the opinion of Guinness Atkinson Asset Management, Inc. for the period stated and is not intended to be a forecast of future events, a guarantee of future results, or investment advice. Opinions, fund holdings and sector allocations are subject to change at any time and are not recommendations to buy or sell any security.
10
GUINNESS ATKINSON ALTERNATIVE ENERGY FUND
Growth of $10,000
Average Annual Total Return
Periods Ended December 31, 2012
| One Year | | Five Year | | Since Inception
(03/31/06) | |
| | -15.20 | % | | | -29.64 | % | | | -19.78 | % | |
*Inception date 03/31/06.
Performance data quoted represents past performance and does not guarantee future results. The investment return and principal value of an investment will fluctuate so that an investor's shares, when redeemed, may be worth more or less than their original cost. Current performance of the Fund may be lower or higher than the performance quoted. Performance data current to the most recent month end may be obtained by visiting www.gafunds.com.
Total returns reflect a fee waiver in effect and in the absence of this waiver, the total returns would be lower. The Fund imposes a 2% redemption fee on shares held less than 30 days.
The Wilderhill New Energy Global Innovations Index (NEX) is a modified dollar weighted index of publicly traded companies, which are active in renewable and low-carbon energy, and which stand to benefit from responses to climate change and energy security concern. The Wilderhill Clean Energy Index (ECO) is a modified equal dollar weighted index comprised of publicly traded companies whose businesses stand to benefit substantially from societal transition toward the use of cleaner energy and conservation.
11
FUND HIGHLIGHTS at December 31, 2012
GUINNESS ATKINSON ALTERNATIVE ENERGY FUND
# of Holdings in Portfolio: | | | 33 | | |
Portfolio Turnover: | | | 7.8 | % | |
% of Stocks in Top 10: | | | 43.0 | % | |
Fund Managers:
Edward Guinness | |
Matthew Page | |
Top 10 Holdings (% of net assets) | | | | Sector Breakdown (% of net assets) | | | |
Canada Lithium Corp. | | | 6.7 | % | | Wind | | | 49.5 | % | |
Good Energy Group PLC | | | 6.5 | % | | Solar | | | 26.8 | % | |
China Longyuan Power Group Corp. - H Shares | | | 4.1 | % | | Efficiency | | | 15.2 | % | |
China Suntien Green Energy Corp. Ltd. - H Shares | | | 4.0 | % | | Hydro | | | 5.3 | % | |
Boralex, Inc. - Class A | | | 3.9 | % | | Geothermal | | | 3.3 | % | |
Enel Green Power SpA | | | 3.8 | % | | | | | | | |
Acciona, S.A. | | | 3.6 | % | | | | | | | |
Power-One Inc. | | | 3.6 | % | | | | | | | |
SunPower Corp. | | | 3.5 | % | | | | | | | |
Theolia SA | | | 3.3 | % | | | | | | | |
12
SCHEDULE OF INVESTMENTS
December 31, 2012
GUINNESS ATKINSON ALTERNATIVE ENERGY FUND
Shares | | COMMON STOCKS: 100.1% | | Value | |
Efficiency: 15.2% | | | |
| | 146,000 | | | Applied Intellectual Capital Ltd.*†^ | | $ | — | | |
| | 1,310,000 | | | Canada Lithium Corp. | | | 869,207 | | |
| | 760,987 | | | Carmanah Technologies Corp.* | | | 206,561 | | |
| | 9,000 | | | Itron, Inc.* | | | 400,950 | | |
| | 2,306,792 | | | Thermal Energy International, Inc.* | | | 92,763 | | |
| | 28,400 | | | WaterFurnace Renewable Energy Inc | | | 412,281 | | |
| | | | | | | | 1,981,762 | | |
Geothermal: 3.3% | | | |
| | 22,119 | | | Ormat Technologies, Inc. | | | 426,454 | | |
Hydro: 5.3% | | | |
| | 25,066 | | | Cia Energetica de Minas Gerais ADR | | | 272,217 | | |
| | 16,700 | | | Verbund AG | | | 413,532 | | |
| | | | | | | | 685,749 | | |
Solar: 26.8% | | | |
| | 85,700 | | | JA Solar Holdings Co., Ltd.* | | | 365,939 | | |
| | 155,800 | | | LDK Solar Co., Ltd. - ADR* | | | 224,352 | | |
| | 113,000 | | | Power-One Inc.* | | | 464,227 | | |
| | 252,000 | | | Renesola Ltd. - ADR* | | | 388,080 | | |
| | 10,560 | | | SMA Solar Technology AG | | | 265,564 | | |
| | 114,200 | | | STR Holdings, Inc.* | | | 287,784 | | |
| | 81,205 | | | SunPower Corp. - Class B* | | | 456,372 | | |
| | 247,291 | | | Suntech Power Holdings Co., Ltd. - ADR* | | | 378,355 | | |
| | 80,500 | | | Trina Solar Ltd. - ADR* | | | 349,370 | | |
| | 136,500 | | | Yingli Green Energy Holding Co., Ltd. - ADR* | | | 320,775 | | |
| | | | | | | | 3,500,818 | | |
Wind: 49.5% | | | |
| | 6,200 | | | Acciona S.A. | | | 470,161 | | |
| | 55,627 | | | Boralex Inc. - Class A* | | | 512,818 | | |
| | 2,946,000 | | | China Datang Corp. Renewable Power Co. Ltd. - H Shares* | | | 377,588 | | |
| | 763,000 | | | China Longyuan Power Group Corp. - H Shares | | | 535,987 | | |
| | 2,356,000 | | | China Suntien Green Energy Corp. Ltd. - H Shares | | | 518,199 | | |
| | 75,400 | | | EDP Renovaveis SA* | | | 402,083 | | |
| | 264,600 | | | Enel Green Power SpA | | | 494,868 | | |
| | 156,831 | | | Gamesa Corporation Tecnologica S.A. | | | 346,958 | | |
| | 332,941 | | | Good Energy Group PLC | | | 843,724 | | |
| | 221,100 | | | Greentech Energy Systems* | | | 396,975 | | |
| | 2,264,000 | | | Huaneng Renewables Corp. Ltd. - H Shares* | | | 408,210 | | |
| | 108,400 | | | Nordex SE* | | | 428,008 | | |
| | 245,708 | | | Theolia SA* | | | 435,091 | | |
| | 51,315 | | | Vestas Wind Systems A/S* | | | 290,939 | | |
| | | | | | | | 6,461,609 | | |
| | | | | Total Common Stocks
(cost $31,039,852) | | | 13,056,392 | | |
The accompanying notes are an integral part of these financial statements.
13
| | | | | Value | |
| | | | | Total Investments in Securities
(cost $ $31,039,852): 100.1% | | $ | 13,056,392 | | |
| | | | | Liabilities in Excess of Other Assets: (0.1%) | | | (15,889 | ) | |
| | | Net Assets: 100.0% | | $ | 13,040,503 | | |
* Non-income producing security.
† Illiquid. Illiquid securities represent 0.0% of net assets.
^ Fair value under direction of the Board of Trustees. Fair valued securities represent 0.0% of net assets.
ADR - American Depository Receipt
The accompanying notes are an integral part of these financial statements.
14
ASIA FOCUS FUND for the period ended December 31, 2012
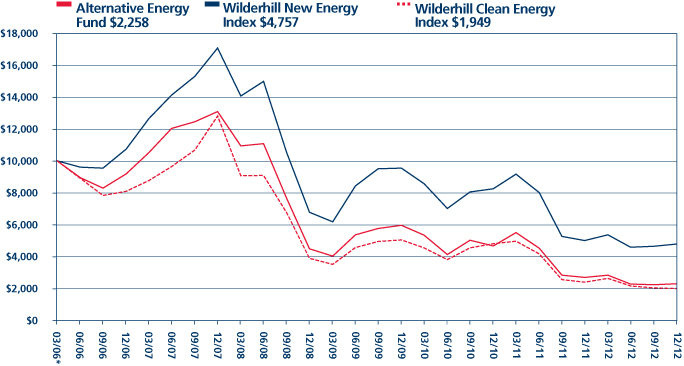
1. Performance
AVERAGE ANNUALIZED TOTAL RETURNS
| | 1 Year
(actual) | | 3 Years | | 5 Years | | 10 Years | |
Fund | | | 15.89 | % | | | 2.72 | % | | | -2.99 | % | | | 14.05 | % | |
Benchmark Index: | |
MSCI AC Far East Free Ex Japan Index | | | 22.06 | % | | | 7.56 | % | | | 0.85 | % | | | 14.42 | % | |
S&P 500 Index | | | 15.99 | % | | | 10.86 | % | | | 1.66 | % | | | 7.09 | % | |
The Fund's gross expense ratio is 1.59% per the Summary Prospectus dated May 1, 2012. The Advisor has contractually agreed to waive a portion of its advisory fees and/or reimburse other Fund expenses so that the Fund's ratio of expenses to average daily net assets will not exceed 1.98% (excluding Acquired Fund Fees and Expenses, interest, taxes, dividends on short positions and extraordinary expenses) through at least June 30, 2013. To the extent that the Advisor waives fees and/or reimburses expenses, it may seek repayment of a portion or all of such amounts at any time within the three fiscal years after the fiscal year in which such amounts were waived and/or reimbursed, subject to the applicable cap.
Performance data quoted represents past performance and does not guarantee future results. The investment return and principal value of an investment in the Fund will fluctuate so that an investor's shares, when redeemed, may be worth more or less than their original cost. Current performance of the Fund may be lower or higher than the performance quoted. Performance data current to the most recent month-end may be obtained by visiting www.gafunds.com, or calling (800) 916-6566.
The Fund imposes a 2% redemption fee on the sale of shares held less than 30 days. Performance data quoted does not reflect this redemption fee. Total returns for certain periods reflect fee limitations in effect and, in the absence of these limitations, total returns would have been lower.
The Fund ended the year up 15.89%, with a strong period of performance from the beginning of August through to the end of the year compared to a return of 22.06% for the benchmark, the MSCI AC Far East Free Ex Japan Index. There is still ground to be made up, however.
The performance of cyclical stocks, especially those in the Energy, Materials and Industrials sectors, were the main drivers of overall Fund performance. In the first part of the year markets were concerned about slowing Chinese growth and fears, exacerbated by weakness in the developed world, that Chinese exports might sharply contract. This did not happen. Tighter policies designed to counteract the inflationary effects of the 2009/10 credit expansion remained in place for longer than expected as the political transition in China encountered unexpected turbulence in the middle of the year. By August, however, there were signs of monetary loosening and a number of new investment projects were given formal approval to proceed. By the end September the Renminbi resumed its appreciation against the US Dollar.
While Chinese stocks languished in the first half of the year, money moved to South-East Asia, where Singapore, Thailand and the Philippines all had a particularly good year. In Singapore, economic growth slowed given its high exposure to trade, but in spite of this, the stock market did well. Earnings forecasts for 2012 stayed largely unchanged in contrast to most other countries, which were supported by material upgrades to bank sector earnings forecasts. Thailand's economy rebounded from the widespread damage cause by flooding in late 2011 and the stock market rallied strongly on the back of it. The Philippines too saw a strong performance as economic growth picked up and national finances were such as to warrant an upgrade to its sovereign debt investment rating, with S&P raising the rating to a nine-year high of B+ in July, and Moody's following suit in October to Ba1.
Indonesia and Malaysia were relatively weaker performers. The Indonesian market has performed well over the past few years, but 2012 saw more modest returns and a weaker exchange rate against the U.S. dollar. After a number of years of strong economic growth, inflationary pressures have risen, as have political concerns, now that the popular president SB Yudhoyono is nearing the end of his term and cannot seek re-election.
The past year has seen political developments assume much greater significance than in prior years, as sovereign debt and budget issues persisted in Europe and the U.S. By the end of the year, however, (right at the end, in the case of the U.S.) the immediacy of the problems had retreated. In Asia, there was a change in China's leadership, and also new governments in Japan and South Korea. All three have emphasized their focus on domestic economic growth and stimulus. Discussion about reflation efforts in
15
Japan have perhaps been the most eye-catching, since they represent a significant change. This has been reflected in strong Japanese stock market performance (in yen terms) and a significant weakening of the yen against the U.S. dollar.
2. Portfolio Position
The position of the Fund at the year-end remains largely unchanged, with overweight positions in China/Hong Kong and Thailand, and underweight in South Korea, Singapore and Taiwan. On a sector basis, the focus has been on Energy and Materials at the expense of banks, insurance, real estate and Consumer Staples. The portfolio also has been overweight in technology, with the bulk of this concentrated the consumer-related segments of tablet computers and smartphones.
3. Outlook
We see a better likelihood for stronger economic growth to come from Asia in the coming year. In part, this is based on an expectation of a continued cyclical recovery in developed markets, which, although not expected to drive growth through an export rebound, is at least likely to be supportive. Efforts to support domestic growth in China and South Korea also are positive in our view. Elsewhere, there are upcoming elections in Malaysia and Indonesia that may result in some pre-election giveaways. This should not, however, detract from the fact that there is a marked increase in investment which appears to be already underway.
Malaysia's economic transformation plan is designed to push it into becoming a high-income country. The Plan was begun three years ago and calls for significant new investment in sectors such as not only agribusiness, technology, oil & gas, but also in infrastructure and education. Efforts to develop southern Malaysia into an economic hinterland with Singapore, much the same as Shenzhen does for Hong Kong could benefit both Malaysia and Singapore. Progress clearly is being made, and Malaysian economic growth looks like it has the potential to sustain the 5% growth rate that surprised the market in 2012.
The Asian domestic investment story is not just confined to Malaysia. Investment in Indonesia is sorely needed and has increased, directed not only at mining, but also at power, transportation, communications, motor vehicles and agriculture. Furthermore, if the new governments of South Korea and Japan are to deliver on their election promises, further stimulus and reflation policies can be expected there too.
Asian currencies were strong in 2012 and it seems likely they will remain so in 2013. Emerging markets is still an attractive asset class and there is also some mild inflation, which at current levels suggests decent underlying economic activity and would also likely be supportive of stronger local currencies. The weakness of the yen is the major standout, with Taiwan and South Korea as the two countries most vulnerable to this weakness, given their export competition. A cyclical recovery in world trade, however, which is forecast by the World Trade Organization to grow 4.5% in 2013, combined with increasing sales into emerging markets, may offset some of the currency effect.


Edmund Harriss James Weir
The Fund invests in foreign securities, which involves political, economic and currency risks, greater volatility, and differences in accounting methods. The Fund is non-diversified, meaning that its assets may be concentrated in fewer individual holdings than diversified funds. Therefore, the Fund is more exposed to individual stock volatility than diversified funds. Investments focused in a single geographic region may be exposed to greater risk and more volatility than investments diversified among various geographies. The Fund invests in smaller companies, which involves additional risks such as limited liquidity and greater volatility.
The MSCI All Country Far East Free ex-Japan Index (MSCI AC Far East Free ex-Japan Index) is a free float-adjusted, capitalization-weighted index that is designed to measure equity market performance in the Asia region, excluding Japan. The Standard & Poor's 500 Index is a market capitalization-weighted index composed of 500 widely held common stocks of U.S. companies. These indices are unmanaged, not available for investment and do not incur expenses.
Please refer to the Schedule of Investments for details on Fund holdings. Current and future portfolio holdings are subject to risk.
The information provided herein represents the opinion of Guinness Atkinson Asset Management, Inc. for the period stated and is not intended to be a forecast of future events, a guarantee of future results, or investment advice. Opinions, Fund holdings and sector allocations are subject to change at any time, and are not recommendations to buy or sell any security.
16
GUINNESS ATKINSON ASIA FOCUS FUND
Growth of $10,000
Average Annual Total Return
Periods Ended December 31, 2012
| One Year | | Five Year | | Ten Year | |
| | 15.89 | % | | | -2.99 | % | | | 14.05 | % | |
Performance data quoted represents past performance and does not guarantee future results. The investment return and principal value of an investment will fluctuate so that an investor's shares, when redeemed, may be worth more or less than their original cost. Current performance of the Fund may be lower or higher than the performance quoted. Performance data current to the most recent month end may be obtained by visiting www.gafunds.com.
Total returns reflect a fee waiver in effect and in the absence of this waiver, the total returns would be lower. The Fund imposes a 2% redemption fee on shares held less than 30 days.
The MSCI All Country Far East Free ex-Japan Index (MSCI AC Far East Free ex-Japan Index) is a free float-adjusted, capitalization-weighted index that is designed to measure equity market performance in the Asia region excluding Japan. The index referenced in this chart is not available for investment and does not incur expenses.
17
FUND HIGHLIGHTS at December 31, 2012
GUINNESS ATKINSON ASIA FOCUS FUND
# of Holdings in Portfolio: | | | 37 | | |
Portfolio Turnover: | | | 10.9 | % | |
% of Stocks in Top 10: | | | 41.3 | % | |
Fund Managers:
Edmund Harriss | |
James Weir | |
Top 10 Holdings (% of net assets) | | | |
Samsung Electronics Co. Ltd. | | | 6.4 | % | | Glow Energy PCL/Foreign | | | 3.4 | % | |
Taiwan Semiconductor Manufacturing Co., Ltd. | | | 5.6 | % | | PetroChina Co. Ltd. - H Shares | | | 3.3 | % | |
DiGi.Com Bhd | | | 5.3 | % | | Jiangxi Copper Co. Ltd. - H Shares | | | 3.3 | % | |
Kunlun Energy Co., Ltd. | | | 4.2 | % | | China Shenhua Energy Co. Ltd. - H Shares | | | 3.2 | % | |
Weichai Power Co. Ltd. - H Shares | | | 3.4 | % | | CNOOC Ltd | | | 3.2 | % | |
Sector Breakdown (% of net assets) | | | | | | | |
Oil Company - Exploration & Production | | | 10.0 | % | | Commercial Banks | | | 2.6 | % | |
Coal | | | 9.0 | % | | Engineering/R&D Services | | | 2.5 | % | |
Semiconductor Components - Integrated Circuits | | | 8.8 | % | | Chemicals - Other | | | 2.3 | % | |
Auto/Truck Parts & Equipment | | | 6.4 | % | | Auto-Cars/Light Trucks | | | 2.3 | % | |
Electronic Components - Semiconductor | | | 6.4 | % | | Exchange Traded Funds | | | 2.2 | % | |
Electric - Generation | | | 6.0 | % | | Building Products - Air&Heating | | | 2.2 | % | |
Oil Company - Integrated | | | 5.8 | % | | Casino Hotels | | | 2.1 | % | |
Telecommunication Services | | | 5.3 | % | | Steel - Producers | | | 1.8 | % | |
Metal - Copper | | | 3.3 | % | | Web Portals/ISP | | | 1.8 | % | |
Real Estate Operations/Development | | | 3.1 | % | | Power Converson/Supply Equipment | | | 1.7 | % | |
Cellular Telecommunications | | | 2.9 | % | | Public Thoroughfares | | | 1.3 | % | |
Computers | | | 2.7 | % | | Non-Ferrous Metals | | | 0.9 | % | |
Electronic Components - Miscellaneous | | | 2.7 | % | | Machinery | | | 0.4 | % | |
Building & Construction Products | | | 2.6 | % | | Metal Processors & Fabricators | | | 0.0 | % | |
18
SCHEDULE OF INVESTMENTS
December 31, 2012
GUINNESS ATKINSON ASIA FOCUS FUND
Shares | | COMMON STOCKS: 99.1% | | Value | |
China: 35.1% | | | |
| | 263,000 | | | Anhui Conch Cement Co Ltd - H Shares | | $ | 978,515 | | |
| | 1,671,000 | | | China Liansu Group Holdings Ltd | | | 1,165,380 | | |
| | 321,000 | | | China Shenhua Energy Co., Ltd. - H Shares | | | 1,432,084 | | |
| | 645,000 | | | CNOOC Ltd | | | 1,416,263 | | |
| | 1,209,900 | | | db x-trackers - CSI300 INDEX ETF - 2D | | | 980,839 | | |
| | 382,000 | | | Dongfang Electric Corp. Ltd. - H Shares | | | 785,302 | | |
| | 145,950 | | | Inner Mongolia Yitai - B Shares | | | 832,547 | | |
| | 550,000 | | | Jiangxi Copper Co., Ltd. - H Shares | | | 1,478,501 | | |
| | 1,030,000 | | | PetroChina Co., Ltd. - H Shares | | | 1,479,385 | | |
| | 1,492,000 | | | Shenzhen Expressway Co., Ltd. - H Shares | | | 579,911 | | |
| | 1,694,000 | | | Soho China, Ltd. | | | 1,372,822 | | |
| | 16,650 | | | Sohu.com Inc.* | | | 788,211 | | |
| | 336,000 | | | Weichai Power Co., Ltd. - H Shares | | | 1,525,777 | | |
| | 544,800 | | | Yanzhou Coal Mining Co., Ltd. - H Shares | | | 920,076 | | |
| | | | | | | | 15,735,613 | | |
Hong Kong: 14.5% | | | |
| | 618,000 | | | Chen Hsong Holdings | | | 188,024 | | |
| | 110,500 | | | China Mobile Ltd. | | | 1,294,381 | | |
| | 240,000 | | | Galaxy Entertainment Group Ltd | | | 957,325 | | |
| | 109,266 | | | HSBC Holdings PLC | | | 1,159,938 | | |
| | 286,000 | | | Kingboard Chemical Holdings Ltd. | | | 1,029,761 | | |
| | 904,000 | | | Kunlun Energy Co., Ltd. | | | 1,897,783 | | |
| | | | | | | | 6,527,212 | | |
Indonesia: 2.9% | | | |
| | 198,000 | | | Indo Tambangraya Megah PT | | | 854,890 | | |
| | 1,747,000 | | | Vale Indonesia Tbk | | | 428,622 | | |
| | | | | | | | 1,283,512 | | |
Malaysia: 7.6% | | | |
| | 1,375,000 | | | DiGi.Com Bhd | | | 2,380,457 | | |
| | 262,000 | | | UMW Holdings Bhd | | | 1,022,982 | | |
| | | | | | | | 3,403,439 | | |
South Korea: 13.8% | | | |
| | 4,962 | | | Hyundai Mobis | | | 1,345,827 | | |
| | 2,525 | | | POSCO | | | 825,597 | | |
| | 2,010 | | | Samsung Electronics Co., Ltd. | | | 2,876,764 | | |
| | 7,373 | | | Samsung Engineering Co., Ltd. | | | 1,149,037 | | |
| | | | | | | | 6,197,225 | | |
The accompanying notes are an integral part of these financial statements.
19
Shares | | COMMON STOCKS: 99.1% (Continued) | | Value | |
Taiwan: 14.1% | | | |
| | 108,000 | | | Asustek Computer Inc. | | $ | 1,219,509 | | |
| | 343,000 | | | Novatek Microelectronics Corp. Ltd. | | | 1,408,410 | | |
| | 2 | | | Shin Zu Shing Co., Ltd. | | | 6 | | |
| | 750,000 | | | Taiwan Semiconductor Manufacturing Co., Ltd. | | | 2,510,184 | | |
| | 67,000 | | | TPK Holding Co. Ltd. | | | 1,196,693 | | |
| | | | | | | | 6,334,802 | | |
Thailand: 11.1% | | | |
| | 234,500 | | | Electricity Generating PCL/Foreign | | | 1,159,007 | | |
| | 595,000 | | | Glow Energy PCL/Foreign | | | 1,511,319 | | |
| | 216,198 | | | PTT Exploration & Production PCL/Foreign | | | 1,165,105 | | |
| | 103,700 | | | PTT PCL/Foreign | | | 1,130,746 | | |
| | | | | | | | 4,966,177 | | |
| | | | | Total Common Stocks
(cost $32,224,702) | | | 44,447,980 | | |
| | | | | Total Investments in Securities
(cost $32,224,702): 99.1% | | | 44,447,980 | | |
| | | | | Other Assets less Liabilities: 0.9% | | | 405,441 | | |
| | | | | Net Assets: 100.0% | | $ | 44,853,421 | | |
* Non-income producing security.
ADR - American Depository Receipt
The accompanying notes are an integral part of these financial statements.
20
ASIA PACIFIC DIVIDEND FUND for the period ended December 31, 2012
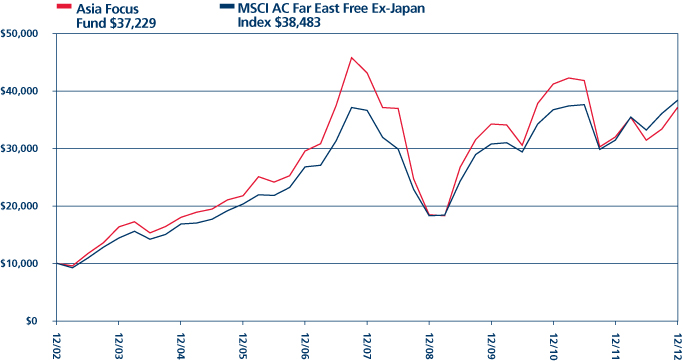
1. Performance
AVERAGE ANNUALIZED TOTAL RETURNS
| | 1 Year
(actual) | | 3 Year | | 5 Year | | Since
Launch
(March 31, 2006) | |
Fund | | | 23.48 | % | | | 9.49 | % | | | 0.87 | % | | | 5.74 | % | |
Benchmark Index: | |
MSCI Pacific Ex Japan Index | | | 22.72 | % | | | 8.08 | % | | | 1.60 | % | | | 9.13 | % | |
S&P 500 Index | | | 15.99 | % | | | 10.86 | % | | | 1.66 | % | | | 3.63 | % | |
The Fund's gross expense ratio is 3.26% and net expense ratio is 1.98% per the Summary Prospectus dated May 1, 2012. The Advisor has contractually agreed to waive a portion of its advisory fees and/or reimburse other Fund expenses so that the Fund's ratio of expenses to average daily net assets will not exceed 1.98% (excluding Acquired Fund Fees and Expenses, interest, taxes, dividends on short positions and extraordinary expenses) through at least June 30, 2013. To the extent that the Advisor waives fees and/or reimburses expenses, it may seek repayment of a portion or all of such amounts at any time within the three fiscal years after the fiscal year in which such amounts were waived and/or reimbursed, subject to the applicable cap.
Performance data quoted represents past performance and does not guarantee future results. The investment return and principal value of an investment in the Fund will fluctuate so that an investor's shares, when redeemed, may be worth more or less than their original cost. Current performance of the Fund may be lower or higher than the performance quoted. Performance data current to the most recent month-end may be obtained by visiting www.gafunds.com, or calling (800) 916-6566.
The Fund imposes a 2% redemption fee on the sale of shares held less than 30 days. Performance data quoted does not reflect this redemption fee. Total returns for certain periods reflect expense limitations in effect and, in the absence of these imitations, total returns would have been lower.
2012 was a decent year for the Fund, which finished up 23.48%, 0.76% ahead of its benchmark, the MSCI Pacific Ex Japan Index, which returned 22.72%. Over the longer term, the Fund is now ahead of the benchmark for three years, although it remains behind over five and since inception time periods. This has been a good year for Asian equities, and a good year for the dividend-producing stocks favoured by our strategy, as they tend to have relatively defensive cash flows.
The first half of the year was dominated by fears over a slowdown in Chinese growth, with concerns that excessive tightening in the property market had done permanent damage to China's economy. Decent economic growth in China in the second half of the year demonstrated that the government appeared to have successfully engineered a 'soft landing' for growth, and a sharp contraction of activity was not in progress. It is becoming clear, however, that part of the slowdown in China's growth this year was structural, rather than just cyclical, and the hyper-growth period of double digit annual gross domestic product (GDP) growth for the economy is likely coming to an end.
There are also fears that China's growth is facing a 'middle income trap' and that it will not be able to keep growing its per capita GDP. We believe that, while there is some danger of this, the available evidence suggests to us that the government's medium term target of 7-8% real GDP growth per annum is achievable. A new administration came to power in China in October 2012, and this was a catalyst for improved performance in Chinese equities, and helped to spread confidence across the region.
The economies of South East Asia performed well in 2012, and some of the smaller countries, such as the Philippines and Thailand, were the best-performing Asian equity markets over the period. The growth in these economies is founded on material improvements in household incomes as a result of better employment prospects. The governments of these countries have helped create the conditions for recovery by leading crackdowns on corruption in business and public life, and creating a degree of stability based on genuine political mandates. The improvements have been recognised by international investors, both through the equity market and through inflows to sovereign debt markets, which help lower borrowing costs for governments in these countries.
21
ASIA PACIFIC DIVIDEND FUND
2. Portfolio Position
In our view, China remains central to economic activity in Asia, and this is reflected in an overweight position in the portfolio in China and Hong Kong. Although Chinese growth has slowed in recent quarters, the growth in middle-class households there continues, and this theme has the potential to re-shape the Chinese economy. The new Chinese administration seems to recognise this, and has highlighted urbanisation is its key message for economic development. This is of benefit not only to direct consumption stocks, but also to indirect beneficiaries, such as those involved in construction and infrastructure, given that a home is often an early purchase for a household with improved incomes. The Fund is overweight in Energy, as a direct proxy for Asia growth, and in Information Technology, particularly those firms that can benefit from domestic Asian growth.
The Fund also has a significant relative weighting in Thailand, which saw a strong year of economic activity in 2012, and still looks to offer reasonable value. Thailand's growth has helped it achieve full employment, with the availability of labour now a serious issue for many employers. Firms in Thailand have a good propensity to pay dividends, as this is expected by local investors. This has meant that we have been able to find stocks there offering a compelling combination of value, earnings growth and attractive dividend yields.
3. Outlook
The challenge for the Fund in 2013 is to find decent value and dividends, given this theme was favoured by investors looking for defensive cash flows during the cyclical slowdown. Good stock returns in 2012 have led to some yield compression, but as the northern economies of Asia, such as China and South Korea, recover and offer better growth potential, so we anticipate that dividend yields could improve further. This is mainly due to a propensity to pay dividends based on a payout ratio, that is, as a percentage of net income. As economic growth improves and confidence returns to north Asia, firms can potentially grow the absolute level of their dividends as earnings grow, and some may even improve their payout ratios to further improve dividends.
We believe tapping into domestic growth remains the key to equity returns in Asia, and we anticipate that the export economy is likely to remain sluggish in the coming year. The changes underway in Asia have not been swept away by a financial crisis in the Western world, nor were they simply created by leverage, unlike some of the economic growth elsewhere in the world over the last decade. Rather, Asian growth is due to steady, and sometimes rapid, improvement of household incomes and living standards as a result of demographics, urbanisation and the improving ability of Asian countries to trade with one another. The prospect of a recovery in Chinese growth, albeit a measured one, is helpful, but the story of the growing middle-class is a pan-Asian story that can drive decent equity returns for some years to come.


Edmund Harriss James Weir
The Fund invests in foreign securities, which involves political, economic and currency risks, greater volatility, and differences in accounting methods. The Fund is non-diversified, meaning that its assets may be concentrated in fewer individual holdings than diversified funds. Therefore, the Fund is more exposed to individual stock volatility than diversified funds. Investments focused in a single geographic region may be exposed to greater risk and more volatility than investments diversified among various geographies. The Fund invests in smaller companies, which involves additional risks such as limited liquidity and greater volatility.
The MSCI Pacific ex-Japan Index is a free float-adjusted, capitalization-weighted index that is designed to measure equity market performance in the Pacific region excluding Japan. The Standard & Poor's 500 Index is a market capitalization-weighted index composed of 500 widely held common stocks of U.S. companies. These indices are unmanaged and not available for investment. and do not incur expenses.
Cash flow measures the cash generating capability of a company by adding non-cash charges (e.g., depreciation) and interest expense to pretax income.
Please refer to the Schedule of Investments for details on Fund holdings. Current and future portfolio holdings are subject to risk.
The information provided herein represents the opinion of Guinness Atkinson Asset Management, Inc. for the period stated and is not intended to be a forecast of future events, a guarantee of future results, or investment advice. Opinions, Fund holdings and sector allocations are subject to change at any time, and are not recommendations to buy or sell any security.
22
GUINNESS ATKINSON ASIA PACIFIC DIVIDEND FUND
Growth of $10,000
Average Annual Total Return
Periods Ended December 31, 2012
| One Year | | Five Year | | Since Inception
(03/31/06) | |
| | 23.48 | % | | | 0.87 | % | | | 5.74 | % | |
*Inception date 03/31/06.
Performance data quoted represents past performance and does not guarantee future results. The investment return and principal value of an investment will fluctuate so that an investor's shares, when redeemed, may be worth more or less than their original cost. Current performance of the Fund may be lower or higher than the performance quoted. Performance data current to the most recent month end may be obtained by visiting www.gafunds.com.
Total returns reflect a fee waiver in effect and in the absence of this waiver, the total returns would be lower. The Fund imposes a 2% redemption fee on shares held less than 30 days.
The MSCI All Country Pacific Free ex-Japan Index (MSCI AC Pacific ex-Japan Index) is a free float-adjusted, capitalization-weighted index that is designed to measure equity market performance in the Pacific region including Japan.
23
FUND HIGHLIGHTS at December 31, 2012
GUINNESS ATKINSON ASIA PACIFIC DIVIDEND FUND
# of Holdings in Portfolio: | | | 30 | | |
Portfolio Turnover: | | | 10.2 | % | |
% of Stocks in Top 10: | | | 42.5 | % | |
Fund Managers:
Edmund Harriss | |
James Weir | |
Top 10 Holdings (% of net assets) | | | | | | | |
Taiwan Semiconductor Manufacturing Co., Ltd. | | | 4.9 | % | | China Mobile Ltd. | | | 4.1 | % | |
DiGi.Com Bhd | | | 4.6 | % | | BOC Hong Kong Holdings Ltd. | | | 4.1 | % | |
KT&G Corp. | | | 4.5 | % | | Novatek Microelectronics Corp. Ltd. | | | 4.0 | % | |
HSBC Holdings PLC - ADR | | | 4.3 | % | | PTT PCL/Foreign | | | 3.9 | % | |
PetroChina Co., Ltd. - ADR | | | 4.2 | % | | VTech Holdings Ltd. | | | 3.9 | % | |
Sector Breakdown (% of net assets) | | | | | | | |
Commercial Banks | | | 15.0 | % | | Electric - Generation | | | 3.1 | % | |
Semiconductor Components - Integrated Circuits | | | 8.9 | % | | Textile - Apparel | | | 3.1 | % | |
Coal | | | 8.4 | % | | Real Estate Operations/Development | | | 2.9 | % | |
Telecommunication Services | | | 8.1 | % | | Electric - Integrated | | | 2.9 | % | |
Oil Company - Integrated | | | 8.1 | % | | Chemical Diversified | | | 2.7 | % | |
Electronic Component-Miscellaneous | | | 5.5 | % | | Computers | | | 2.6 | % | |
Tobacco | | | 4.5 | % | | Computers - Peripheral Equipment | | | 2.4 | % | |
Cellular Telecommunications | | | 4.1 | % | | Building Products - Air & Heating | | | 2.3 | % | |
Telecommunication Equipment | | | 3.9 | % | | Agricultural Chemicals | | | 2.0 | % | |
Optical Supplies | | | 3.8 | % | | Steel - Producers | | | 1.8 | % | |
Water | | 3.5% | |
24
SCHEDULE OF INVESTMENTS
December 31, 2012
GUINNESS ATKINSON ASIA PACIFIC DIVIDEND FUND
Shares | | COMMON STOCKS: 99.6% | | Value | |
Australia: 2.0% | | | |
| | 28,849 | | | Incitec Pivot Ltd. | | $ | 98,048 | | |
China: 21.4% | | | |
| | 152,000 | | | China Shanshui Cement Group Ltd. | | | 113,996 | | |
| | 218,000 | | | Industrial & Commercial Bank of China - H Shares | | | 157,215 | | |
| | 23,915 | | | Inner Mongolia Yitai - B Shares | | | 136,060 | | |
| | 1,400 | | | PetroChina Co., Ltd. - ADR | | | 201,292 | | |
| | 67,000 | | | Shenzhou Int'l Group | | | 151,274 | | |
| | 171,000 | | | Soho China Ltd. | | | 138,579 | | |
| | 80,000 | | | Yanzhou Coal Mining Co., Ltd. - H Shares | | | 135,107 | | |
| | | | | | | | 1,033,523 | | |
Hong Kong: 19.2% | | | |
| | 62,500 | | | BOC Hong Kong Holdings Ltd. | | | 196,080 | | |
| | 17,000 | | | China Mobile Ltd. | | | 199,135 | | |
| | 16,500 | | | CLP Holdings Ltd. | | | 138,555 | | |
| | 3,924 | | | HSBC Holdings PLC - ADR | | | 208,247 | | |
| | 16,600 | | | VTech Holdings Ltd. | | | 186,514 | | |
| | | | | | | | 928,531 | | |
Indonesia: 6.3% | | | |
| | 30,500 | | | Indo Tambangraya Megah PT | | | 131,687 | | |
| | 179,500 | | | Telekomunikasi Indonesia Tbk PT | | | 168,892 | | |
| | | | | | | | 300,579 | | |
Malaysia: 4.6% | | | |
| | 129,000 | | | DiGi.Com Bhd | | | 223,330 | | |
Singapore: 3.4% | | | |
| | 10,000 | | | United Overseas Bank Ltd. | | | 163,784 | | |
South Korea: 6.3% | | | |
| | 2,840 | | | KT&G Corp. | | | 215,377 | | |
| | 270 | | | POSCO | | | 88,282 | | |
| | | | | | | | 303,659 | | |
Taiwan: 19.8% | | | |
| | 11,000 | | | Asustek Computer Inc. | | | 124,209 | | |
| | 86,126 | | | Lite-On Technology Corp. | | | 114,648 | | |
| | 47,000 | | | Novatek Microelectronics Corp. Ltd. | | | 192,989 | | |
| | 12,000 | | | St Shine Optical Co., Ltd. | | | 182,650 | | |
| | 70,000 | | | Taiwan Semiconductor Manufacturing Co., Ltd. | | | 234,284 | | |
| | 6,000 | | | TPK Holding Co. Ltd. | | | 107,166 | | |
| | | | | | | | 955,946 | | |
The accompanying notes are an integral part of these financial statements.
25
Shares | | COMMON STOCKS: 99.6% (Continued) | | Value | |
Thailand: 16.6% | | | |
| | 151,400 | | | Delta Electronics Thai PCL/Foreign | | $ | 159,000 | | |
| | 60,100 | | | Glow Energy PCL/Foreign | | | 152,656 | | |
| | 56,820 | | | PTT Global Chemical PCL/Foreign | | | 131,636 | | |
| | 17,200 | | | PTT PCL/Foreign | | | 187,549 | | |
| | 560,600 | | | Thai Tap Water Supply PCL/Foreign | | | 168,821 | | |
| | | | | | | | 799,662 | | |
| | | | | Total Common Stocks
(cost $3,738,257) | | | 4,807,062 | | |
| | | | | Total Investments in Securities
(cost $3,738,257): 99.6% | | | 4,807,062 | | |
| | | | | Other Assets less Liabilities: 0.4% | | | 18,400 | | |
| | | | | Net Assets: 100.0% | | $ | 4,825,462 | | |
ADR - American Depository Receipt
The accompanying notes are an integral part of these financial statements.
26
CHINA & HONG KONG FUND for the period ended December 31, 2012
1. Performance
AVERAGE ANNUALIZED TOTAL RETURNS
| | 1 Year
(actual) | | 3 Years | | 5 Years | | 10 Years | |
Fund | | | 14.42 | % | | | -1.46 | % | | | -3.43 | % | | | 14.36 | % | |
Benchmark Index: | |
Hang Seng Composite Index | | | 26.34 | % | | | 3.67 | % | | | -1.53 | % | | | 14.32 | % | |
Hang Seng Index | | | 27.64 | % | | | 4.56 | % | | | -0.71 | % | | | 13.15 | % | |
S&P 500 Index | | | 15.99 | % | | | 10.86 | % | | | 1.66 | % | | | 7.09 | % | |
The Fund's gross expense ratio is 1.53% per the Summary Prospectus dated May 1, 2012. The Advisor has contractually agreed to waive a portion of its advisory fees and/or reimburse other Fund expenses so that the Fund's ratio of expenses to average daily net assets will not exceed 1.98% (excluding Acquired Fund Fees and Expenses, interest, taxes, dividends on short positions and extraordinary expenses) through at least June 30, 2013. To the extent that the Advisor waives fees and/or reimburses expenses, it may seek repayment of a portion or all of such amounts at any time within the three fiscal years after the fiscal year in which such amounts were waived and/or reimbursed, subject to the applicable cap.
Performance data quoted represents past performance and does not guarantee future results. The investment return and principal value of an investment in the Fund will fluctuate so that an investor's shares, when redeemed, may be worth more or less than their original cost. Current performance of the Fund may be lower or higher than the performance quoted. Performance data current to the most recent month-end may be obtained by visiting www.gafunds.com, or calling (800) 916-6566.
The Fund imposes a 2% redemption fee on the sale of shares held less than 30 days. Performance data quoted does not reflect this redemption fee. Total returns for certain periods reflect expense limitations in effect and, in the absence of these limitations, total returns would have been lower.
During 2012 the Fund returned 14.42%, compared to a return of 26.34% for the benchmark, the Hang Seng Composite Index. This was a mixed year for the Fund, with a slowdown in economic growth in China affecting the performance of some of our holdings, particularly in the first half of the year. The second half of the year was more favourable to Fund performance, with a cyclical recovery in growth in progress, and even early signs of an improvement in China's export economy.
At the beginning of 2012, the Chinese authorities attempted to restart economic growth, having slowed the economy in 2011 through monetary tightening to deal with inflation in the property market. This led to concerns over China's development model, and there was a slowdown in activity in construction for infrastructure and private housing, which negatively affected investor confidence., By mid-2012, however, the impact of the pro-growth policies was felt, and the economy reported a soft landing in Q3 (7.4% real GDP growth) and a decent recovery in Q4 (7.9% real GDP growth). The improved economic outlook was positive for cyclical stocks, in particular those related to construction and property development.
Chinese equities were given a further boost in October with the announcement of a new political leadership at the 18th People's Congress. The Congress marked a significant change of leadership, with the two most senior leaders and most of the politburo being replaced. The new leadership quickly set out its economic agenda, with a renewed commitment to economic growth-led development. The emphasis of this growth will change, however, with urbanisation now the central tenet of policy.
2. Portfolio Position
The Fund's focus is on stocks that can benefit from the domestic-led growth underway in China, with less emphasis on exporters. The Fund is overweight in Energy, Materials and Industrials stocks, and is underweight in Real Estate and Financials stocks. The rationale for this positioning is that infrastructure spending has been used as a driving force for economic growth in recent years, and this has been of benefit to earnings in our favoured sectors. We believe these sectors also offer reasonable value for investment, although they are cyclical. As a result of good economic growth, there is now a growing middle-class in China, and the expectations of this middle class are rising as household income and living standards improve. This has positively reinforced the need for further infrastructure spending, as the middle-class demand better roads, railways, retail centres and housing to reflect their greater spending power and higher status.
27
Increasingly, although the government is prioritising policies that encourage consumption over investment, investment and construction remain the bedrocks of the Chinese economy. In response to rising property prices, the government also has been keen to encourage the construction of affordable housing, and this has helped create additional demand for building materials such as cement and pipes, which has been of benefit to some of the Fund's holdings.
Real Estate and Financials stocks have suffered in recent quarters, as the government has tightened monetary policy as a result of excess price rises in the property sector. This process reversed during 2012, and the government encouraged greater loan growth from the banks, and eased some of the administrative restrictions on Real Estate companies. Banking remains a relatively controlled sector, and its returns are primarily defined by government policy, rather than free competition between the banks. Similarly, the government is keen to control private property development, as it wishes to avoid social discontent if property price rises become excessive.
3. Outlook
For the coming year, we anticipate that the recovery in Chinese growth should continue, although we are cautious that it may not accelerate back to the previous exceptionally high levels of growth. Our view of the fundamental data is that there could be a structural element to the recent growth slowdown, and that the benefit of China's demographic composition is coming to an end. We are not concerned that Chinese growth will fall sharply, but that a future real GDP growth rate of 7-8% per annum seems realistic. There will also be a greater emphasis on the quality, rather than just the quantity, of growth, with a focus on improving productivity and encouraging consumption. Infrastructure spending and construction will remain significant elements in China's growth, but adding further pillars to the China growth story is a healthy development.
This thinking is reflected in the new government's economic agenda, with urbanisation named as central to its growth strategy. In the Chinese context, urbanisation encompasses not just the act of moving to urban areas, but improving living standards in the cities, and easing the official burden on individuals in order to make relocation easier. In our view, this is likely to be positive for housing construction and infrastructure spending, as well as middle-class spending to help set up those homes and purchase other capital goods such as cars, computers and mobile phones.
Our investment focus remains on the recovery in China's domestic economy, but there has also been good data on the export sector in recent months. There are early signs of recovery in the U.S., and the Japanese economy also is looking better than it has in some time. Europe is still stuck in the process of deleveraging, but there may be some selected opportunities for us to add more export-related exposure to the portfolio.


Edmund Harriss James Weir
The Fund invests in foreign securities, which involves political, economic and currency risks, greater volatility, and differences in accounting methods. The Fund is non-diversified, meaning that its assets may be concentrated in fewer individual holdings than diversified funds. Therefore, the Fund is more exposed to individual stock volatility than diversified funds. Investments focused in a single geographic region may be exposed to greater risk and more volatility than investments diversified among various geographies. The Fund invests in smaller companies, which involves additional risks such as limited liquidity and greater volatility.
The Hang Seng Composite Index is a market capitalization-weighted index that is comprised of the top 200 companies listed on the Hong Kong Stock Exchange, based on the average market capitalization for the past twelve months. The Hang Seng Index is a barometer of the Hong Kong Stock Market, whose aggregate market capitalization accounts for about 70% of the total market-capitalization of the Stock Exchange of Hong Kong Limited. The Standard & Poor's 500 Index is a market capitalization-weighted index composed of 500 widely held common stocks of U.S. companies. These indices are unmanaged and not available for investment, and do not incur expenses.
Please refer to the Schedule of Investments for details on Fund holdings. Current and future portfolio holdings are subject to risk.
The information provided herein represents the opinion of Guinness Atkinson Asset Management, Inc. for the period stated and is not intended to be a forecast of future events, a guarantee of future results, or investment advice. Opinions, Fund holdings and sector allocations are subject to change at any time, and are not recommendations to buy or sell any security.
28
GUINNESS ATKINSON CHINA & HONG KONG FUND
Growth of $10,000
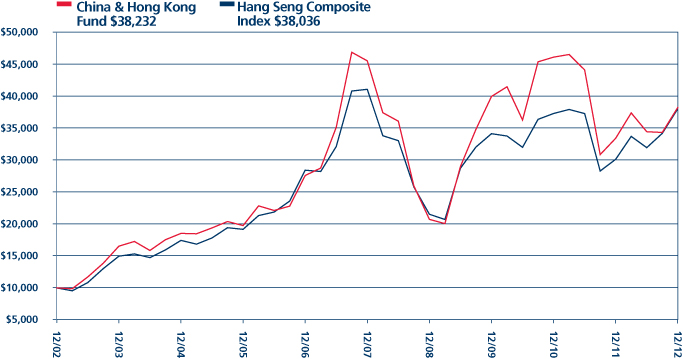
Average Annual Total Return
Periods Ended December 31, 2012
| One Year | | Five Year | | Ten Year | |
| | 14.42 | % | | | -3.43 | % | | | 14.36 | % | |
Performance data quoted represents past performance and does not guarantee future results. The investment return and principal value of an investment will fluctuate so that an investor's shares, when redeemed, may be worth more or less than their original cost. Current performance of the Fund may be lower or higher than the performance quoted. Performance data current to the most recent month end may be obtained by visiting www.gafunds.com.
Total returns reflect a fee waiver in effect and in the absence of this waiver, the total returns would be lower. The Fund imposes a 2% redemption fee on shares held less than 30 days.
The Hang Seng Composite Index is a market-capitalization weighted index that comprises the top 200 companies listed on the Hong Kong Stock Exchange, based on the average market capitalization for the past twelve months. The Fund changed its benchmark from the Hang Seng to the Hang Seng Composite Index to more accurately reflect the market sectors in which the Fund invests. The index referenced in this chart is not available for investment and does not incur expenses.
29
FUND HIGHLIGHTS at December 31, 2012
GUINNESS ATKINSON CHINA & HONG KONG FUND
# of Holdings in Portfolio: | | | 35 | | |
Portfolio Turnover: | | | 3.9 | % | |
% of Stocks in Top 10: | | | 44.5 | % | |
Fund Managers:
Edmund Harriss | |
James Weir | |
Top 10 Holdings (% of net assets) | | | | | | | |
Soho China Ltd. | | | 5.4 | % | | China Mobile Ltd. | | | 4.4 | % | |
CNOOC Ltd. | | | 5.1 | % | | Lenovo Group Ltd. | | | 4.3 | % | |
Kunlun Energy Co., Ltd. | | | 4.9 | % | | Weichai Power Co., Ltd. - H Shares | | | 4.0 | % | |
PetroChina Co., Ltd. - H Shares | | | 4.6 | % | | BOC Hong Kong Holdings Ltd. | | | 3.7 | % | |
Tencent Holdings Ltd. | | | 4.4 | % | | China Construction Bank Corp. - H Shares | | | 3.7 | % | |
Sector Breakdown (% of net assets) | | | | | | | |
Commercial Banks | | | 15.7 | % | | Telecommunication Equipment | | | 3.1 | % | |
Oil - Exploration & Production | | | 10.0 | % | | Auto-Cars/Light Trucks | | | 3.1 | % | |
Coal | | | 7.3 | % | | Distribution/Wholesale | | | 2.7 | % | |
Building Products | | | 5.5 | % | | Exchange Traded Funds | | | 2.6 | % | |
Real Estate Operations/Development | | | 5.5 | % | | Chemicals - Other | | | 2.4 | % | |
Oil - Integrated | | | 4.6 | % | | Casino Hotels | | | 2.3 | % | |
Web Portals/ISP | | | 4.5 | % | | Power Conversion/Supply Equipment | | | 2.2 | % | |
Internet Application Software | | | 4.4 | % | | Airlines | | | 2.1 | % | |
Cellular Telecommunications | | | 4.4 | % | | Real Estate Management/Service | | | 1.7 | % | |
Computers | | | 4.3 | % | | Public Thoroughfares | | | 0.9 | % | |
Auto/Truck Parts & Equipment | | | 4.0 | % | | Machinery - General Industries | | | 0.6 | % | |
Metal - Copper | | | 3.7 | % | | Retail - Apparel | | | 0.1 | % | |
Gas - Distribution | | | 3.2 | % | | | | | | | |
30
SCHEDULE OF INVESTMENTS
December 31, 2012
GUINNESS ATKINSON CHINA & HONG KONG FUND
Shares | | COMMON STOCKS: 100.9% | | Value | |
Airlines: 2.1% | | | |
| | 1,759,000 | | | Cathay Pacific Airways Ltd. | | $ | 3,265,588 | | |
Auto/Truck Parts & Equipment: 4.0% | | | |
| | 1,353,120 | | | Weichai Power Co., Ltd. - H Shares | | | 6,144,522 | | |
Auto – Cars/Light Trucks: 3.1% | | | |
| | 3,014,000 | | | Dongfeng Motor Group Co Ltd. - H Shares | | | 4,746,206 | | |
Building Products: 5.5% | | | |
| | 993,000 | | | Anhui Conch Cement Co Ltd. - H Shares | | | 3,694,547 | | |
| | 6,705,000 | | | China Liansu Group Holdings Ltd. | | | 4,676,168 | | |
| | | | | | | | 8,370,715 | | |
Casino Hotels: 2.3% | | | |
| | 870,000 | | | Galaxy Entertainment Group Ltd.* | | | 3,470,302 | | |
Cellular Telecommunications: 4.4% | | | |
| | 568,000 | | | China Mobile Ltd. | | | 6,653,468 | | |
Chemicals – Other: 2.4% | | | |
| | 1,026,000 | | | Kingboard Chemical Holdings Ltd. | | | 3,694,176 | | |
Coal: 7.3% | | | |
| | 909,000 | | | China Shenhua Energy Co Ltd. - H Shares | | | 4,055,340 | | |
| | 529,908 | | | Inner Mongolia Yitai - B Shares | | | 3,022,771 | | |
| | 2,384,200 | | | Yanzhou Coal Mining Co., Ltd. - H Shares | | | 4,026,514 | | |
| | | | | | | | 11,104,625 | | |
Commercial Banks: 15.7% | | | |
| | 1,802,000 | | | BOC Hong Kong Holdings Ltd. | | | 5,653,384 | | |
| | 6,885,670 | | | China Construction Bank Corp. - H Shares | | | 5,611,851 | | |
| | 113,281 | | | Dah Sing Financial Holdings Ltd. | | | 516,901 | | |
| | 483,491 | | | HSBC Holdings PLC | | | 5,132,607 | | |
| | 7,330,330 | | | Industrial & Commercial Bank of China - H Shares | | | 5,286,401 | | |
| | 157,400 | | | Wing Hang Bank Ltd. | | | 1,657,241 | | |
| | | | | | | | 23,858,385 | | |
Computers: 4.3% | | | |
| | 7,058,000 | | | Lenovo Group Ltd. | | | 6,461,552 | | |
Distribution/Wholesale: 2.7% | | | |
| | 2,419,000 | | | Digital China Holdings Ltd. | | | 4,142,525 | | |
Exchange Traded Funds (ETFs): 2.6% | | | |
| | 4,923,600 | | | db x-trackers - CSI300 INDEX ETF - 2D | | | 3,991,453 | | |
Gas – Distribution: 3.2% | | | |
| | 733,000 | | | Beijing Enterprises Holdings Ltd. | | | 4,805,786 | | |
The accompanying notes are an integral part of these financial statements.
31
Shares | | COMMON STOCKS: 100.9% (Continued) | | Value | |
Internet Application Software: 4.4% | | | |
| | 207,300 | | | Tencent Holdings Ltd. | | $ | 6,746,559 | | |
Machinery – General Industries: 0.6% | | | |
| | 2,820,000 | | | Chen Hsong Holdings | | | 857,972 | | |
Metal – Copper: 3.7% | | | |
| | 2,067,000 | | | Jiangxi Copper Co., Ltd. - H Shares | | | 5,556,474 | | |
Oil – Integrated: 4.6% | | | |
| | 4,818,000 | | | PetroChina Co., Ltd. - H Shares | | | 6,920,072 | | |
Oil – Exploration & Production: 10.0% | | | |
| | 3,548,000 | | | CNOOC Ltd. | | | 7,790,545 | | |
| | 3,548,000 | | | Kunlun Energy Co., Ltd. | | | 7,448,380 | | |
| | | | | | | | 15,238,925 | | |
Power Conversion/Supply Equipment: 2.2% | | | |
| | 1,622,000 | | | Dongfang Electric Corp., Ltd. - H Shares | | | 3,334,450 | | |
Public Thoroughfares: 0.9% | | | |
| | 3,534,000 | | | Shenzhen Expressway Co., Ltd. - H Shares | | | 1,373,596 | | |
Real Estate Operations/Development: 5.5% | | | |
| | 10,145,000 | | | Soho China Ltd. | | | 8,221,537 | | |
Real Estate Management/Service: 1.7% | | | |
| | 5,401,000 | | | Midland Holdings Ltd. | | | 2,622,760 | | |
Retail – Apparel: 0.1% | | | |
| | 436,000 | | | Glorious Sun Enterprises Ltd. | | | 127,657 | | |
Telecommunication Equipment: 3.1% | | | |
| | 423,000 | | | VTech Holdings Ltd. | | | 4,752,749 | | |
Web Portals/ISP: 4.5% | | | |
| | 97,040 | | | NetEase Inc. ADR* | | | 4,129,052 | | |
| | 57,400 | | | Sohu.com Inc.* | | | 2,717,316 | | |
| | | | | | | | 6,846,368 | | |
| | | | | Total Common Stocks
(costs $103,595,884) | | | 153,308,422 | | |
| | | | | Total Investments in Securities
(costs $103,595,884): 100.9% | | | 153,308,422 | | |
| | | | | Liabilities in Excess of Other Assets: (0.9%) | | | (1,301,256 | ) | |
| | | | | Net Assets: 100.0% | | $ | 152,007,166 | | |
* Non-income producing security.
ADR - American Depository Receipt
The accompanying notes are an integral part of these financial statements.
32
GLOBAL ENERGY FUND for the period ended December 31, 2012
1. Performance
AVERAGE ANNUALIZED TOTAL RETURNS
| | 1 Year
(actual) | | 3 Year | | 5 Year | | Since
Inception
June 30, 2004 | |
Fund | | | 3.53 | % | | | 1.60 | % | | | -2.51 | % | | | 12.16 | % | |
Benchmark Index: | |
S&P 500 Index | | | 15.99 | % | | | 10.86 | % | | | 1.66 | % | | | 4.81 | % | |
MSCI World Energy Index | | | 2.54 | % | | | 5.21 | % | | | -1.63 | % | | | 9.52 | % | |
The Fund's gross expense ratio is 1.27% per the Summary Prospectus dated May 1, 2012. The Advisor has contractually agreed to waive a portion of its advisory fees and/or reimburse other Fund expenses so that the Fund's ratio of expenses to average daily net assets will not exceed 1.45% (excluding Acquired Fund Fees and Expenses, interest, taxes, dividends on short positions and extraordinary expenses) through at least June 30, 2013. To the extent that the Advisor waives fees and/or reimburses expenses, it may seek repayment of a portion or all of such amounts at any time within the three fiscal years after the fiscal year in which such amounts were waived and/or reimbursed, subject to the applicable cap.
Performance data quoted represents past performance and does not guarantee future results. The investment return and principal value of an investment in the Fund will fluctuate so that an investor's shares, when redeemed, may be worth more or less than their original cost. Current performance of the Fund may be lower or higher than the performance quoted. Performance data current to the most recent month-end may be obtained by visiting www.gafunds.com, or calling (800) 916-6566.
The Fund imposes a 2% redemption fee on the sale of shares held less than 30 days. Performance data quoted does not reflect this redemption fee. Total returns for certain periods reflect expense limitations in effect and in the absence of these limitations, total returns would have been lower.
The Global Energy Fund in 2012 produced a total return of 3.53%. This compares to the total return of the MSCI World Energy Index of 2.54%, and the S&P 500's total return of 15.99%.
Similar to 2011, there was a wide variance in performance across and within energy sectors over the year. The best performing subsector was U.S. independent refining, which benefitted from strong refining margins helped by the wide spread between West Texas Intermediate (WTI) and Brent benchmarks. The Fund had exposure to the sector via Valero (+66.2%), Marathon Petroleum (+89.8%) and Phillips 66 (+57.6% since it spun out of ConocoPhillips at the end of April).
Integrated oil and gas companies performed well as a group, up by an average of 8.4%. The group was led by OMV (+25.1%) and ENI (+24.4%), both recovering well after Libyan production disruption in 2011, followed by PetroChina (+18.8%) and ConocoPhillips (+ 9.2%).
Another bright spot in the portfolio was Nexen, which was up 63.5% when we sold our position in July following the proposed acquisition of the company by CNOOC. Our other Canadian exposure was mixed: Suncor (+15.6%) grew production well, while Canadian Natural Resources (-22.2%) suffered due to being on the wrong end of widening oil price differentials.
International exploration and production companies performed satisfactorily as a basket, with three clear winners – Afren (+60.2%), Dragon (+30.5%) and Soco (+28.1%) – enjoying operational success, in contrast to Petrominerales (-44.3%), which reported a number of exploration failures.
North America-focused exploration and production companies were weak as a group, hampered by low natural gas prices, falling NGL prices and rising capital expenditures. Weakest amongst the group were Newfield (-29.0%), Chesapeake (-24.1%) and Stone Energy (-22.2%). Elsewhere, the solar sector also fared particularly poorly, with Trina (-35.0%) and JA Solar (-36.3%) exposed to the industry-wide issue of buoyant demand being outweighed by excess capacity.
The oil service sector produced a mixed bag, with offshore-focused companies generally performing best, while onshore-focused companies fared less well, as oversupply in the group reduced pricing and margins, particularly in North America. Oil service exposure in the Fund mirrored these overall trends, with offshore well intervention specialist Helix (+30.6%) significantly outperforming land drillers Patterson (-5.6%) and Unit (-2.6%).
33
2. Activity
In February, we sold our holding in Forest Oil. In its place, we purchased a holding in Stone Energy. Stone is a U.S.-focused exploration and production company with attractively valued assets, particularly in the Gulf of Mexico.
ConocoPhillips spun off its refining business, Phillips 66, at the beginning of May, meaning that we then had a holding in ConocoPhillips and a holding in Phillips 66. We also added to our research portfolio in May: we took a small position in Cluff Natural Resources, a UK-listed company looking to buy acreage in the UK North Sea.
In July we sold our position in Nexen. It was announced on 23 July that CNOOC had entered into an agreement to acquire Nexen at a 61% premium to Nexen's closing price the previous day. We opted to sell our position in the company shortly after the acquisition agreement was announced.
In September, we sold our holdings in U.S. refiners, Phillips 66 and Marathon Petroleum. Both refiners had been among the best performing stocks in the portfolio in 2012, benefiting from a particularly benign environment for U.S. refiners in general, to a point where the stocks looked fairly fully priced. We switched to a position in Exxon Mobil, which to us presented good relative value versus the positions sold.
In October, we sold our holding in Marathon Oil and bought a position across three natural gas levered exploration and production companies: Ultra Petroleum, QEP Resources and Bill Barrett. The switch represented a desire to increase our exposure to the recovery in the U.S. natural gas price.
3. Portfolio Position
The Fund at December 31 2012 was on an average price to earnings ratio (PER) versus the S&P 500 Index at 1,426 as set out in the table. (Based on S&P 500 'operating' earnings per share estimates of $49.5 for 2008, $56.9 for 2009, $83.8 for 2010, $96.4 for 2011 and $99.5 for 2012). This is shown in the following table:
| | 2007 | | 2008 | | 2009 | | 2010 | | 2011 | | 2012 | |
Fund PER | | | 8.4 | | | | 7.4 | | | | 14.4 | | | | 9.5 | | | | 8.9 | | | | 10.0 | | |
S&P 500 PER | | | 17.3 | | | | 28.8 | | | | 25.1 | | | | 17.0 | | | | 14.8 | | | | 14.3 | | |
Premium (+)/Discount (-) | | | -51 | % | | | -74 | % | | | -43 | % | | | -44 | % | | | -40 | % | | | -30 | % | |
Average oil price (WTI $) | | $ | 72.2/ | bbl | | $ | 99.9/ | bbl | | $ | 61.9/ | bbl | | $ | 79.5/ | bbl | | $ | 95/ | bbl | | $ | 94/ | bbl | |
Source: Standard and Poor's; Guinness Atkinson Asset Management Ltd
The sector and geographic weightings of the portfolio at 31 December 2012 were as follows:
Sector Breakdown | |
| | 31 Dec 2011 | | 31 Dec 2012 | |
Integrated | | | 39.6 | | | | 39.1 | | |
Exploration & Production | | | 41.4 | | | | 41.6 | | |
Drilling | | | 6.0 | | | | 7.4 | | |
Equipment & Services | | | 6.6 | | | | 7.1 | | |
Refining & Marketing | | | 4.8 | | | | 3.4 | | |
Solar | | | 1.2 | | | | 1.2 | | |
Coal & Consumables | | | | | |
Construction & Engineering | | | | | |
Total | | | 100.0 | | | | 100.0 | | |
34
Geographic Breakdown | |
| | 31 Dec 2011 | | 31 Dec 2012 | |
US | | | 54.3 | | | | 57.9 | | |
Canada | | | 13.6 | | | | 8.5 | | |
UK | | | 9.8 | | | | 11.6 | | |
Latin America | | | | | |
Europe | | | 16.9 | | | | 16.6 | | |
Hong Kong | | | 3.7 | | | | 3.6 | | |
Russia | | | 1.7 | | | | 1.8 | | |
Other | | | | | |
Total | | | 100.0 | | | | 100.0 | | |
4. Market Background
Analysis of the oil price has been complicated by the dislocation between Brent and WTI that started at the beginning of 2010. Below we discuss both benchmarks.
Having averaged $111 in 2011, Brent oil averaged slightly higher in 2012 at $112. The first half of the year was more volatile, with the price oscillating from highs of around $125 to lows below $90, before settling down in the second half to trade mostly in a range from $105 to $115. On the supply side, oil markets were dominated by the reduction of Iran's oil exports as a result of U.S. and European sanctions, and the disruptions to supply in Sudan/South Sudan, Yemen and Syria. At their peak, lost supply from these four countries totalled around 1.6m b/day. The resulting tightening of Organisation for Economic Co-operation and Development (OECD) oil inventories in the middle of the year was addressed by a ramp up of production from Saudi Arabia, which co-ordinated an effort to keep the price stable but not too high. The spike in the oil price in the first half of the year had some effect on demand, but 2012 still saw a new high for global oil demand at 89.7m b/day, up 0.8m b/day on 2011. The march of non-OECD demand continued, up 1.2m/day, dampened by OECD demand, down 0.5 m b/day.
WTI averaged $94 in 2012, $18 lower than Brent. The spread between WTI and Brent, driven principally by an oversupply of U.S. domestically produced oil and a shortage of suitable refining capacity, started the year at around $9 and peaked in November at nearly $25. WTI price at the end of 2012 was $92. We expect various infrastructure changes, notably the reversal of the Seaway pipeline from Cushing to the U.S. Gulf Coast, to narrow the spread somewhat in 2013.
The US natural gas price weakened significantly during the first four months of 2012 (continuing the downward trend started in the second half of 2011) before recovering well to close the year higher that it started. The spot price started the year at $2.98/thousand cubic feet (mcf) and fell to below $2 in April, caused by a combination of strong onshore supply and an extremely mild 2011/12 winter which reduced heating demand. Self-correction followed as the very low gas price stimulated new demand via coal to gas switching amongst power generation companies. This, coupled with a slowdown in gas drilling and supply growth, prevented gas storage becoming full in the autumn and helped to bring the market into better balance by the year-end, with the price back to $3.44.
5. Outlook
The future of energy equities will continue to be determined by expectations of the likely medium- to long-term level of oil and gas prices.
We expect oil to remain relatively strong in 2013 and forecast a trading range of $90-$110, with Brent likely averaging towards the higher end of this range. Saudi Arabia could remain in over-production mode for as long as supply remains fairly tight, while its ability to put a floor under the price should Brent fall much below $100 has never been greater. The U.S. natural gas price has now recovered from its sub-$2 lows and has moved through the $3/mcf mark. Over time, we expect oil and gas prices to recover further. We continue to point to the extreme levels of divergence from traditional oil per barrel /gas per mcf and coal per tonne /gas per mcf ratios; these used to be in the 6-10x range, both are now over 20x. Extreme ratios rarely last. And above all, we regard the
35
energy sector as cheap relative to the broad market on an earnings basis. We have positioned the fund to potentially take advantage of the commodity price environment outlined above.

Tim Guinness | | January 2013 | |

| |  | |
Will Riley Ian Mortimer
Fund investment team
The Fund invests in foreign securities, which involves political, economic and currency risks, greater volatility, and differences in accounting methods. The Fund is non-diversified, meaning that its assets may be concentrated in fewer individual holdings than diversified funds. Therefore, the Fund is more exposed to individual stock volatility than diversified funds. The Fund invests in smaller companies, which involves additional risks such as limited liquidity and greater volatility. The Fund's focus on the energy sector to the exclusion of other sectors exposes the Fund to greater market risk and potential monetary losses than if the Fund's assets were diversified among various sectors. Should the prices of energy (oil, gas, electricity) or alternative energy decline, this would likely have a negative affect on the Fund's holdings. Investing in this Fund may be more risky than investing in a fund that invests in U.S. securities due to increased volatility of foreign or emerging markets. Specific risks include the risk of expropriation of assets and higher volatility, among other risks.
The MSCI World Energy Index is an unmanaged index composed of more than 1,400 stocks listed on exchanges in the U.S., Europe, Canada, Australia, New Zealand and the Far East. The Standard & Poor's 500 Index is a market capitalization-weighted index composed of 500 widely held common stocks of U.S. companies. These indices are unmanaged and not available for investment, and do not incur expenses.
PER or P/E – Price to Earnings ratio is calculated by dividing the current price of the stock by the company's trailing 12 months' earnings per share.
Earnings per share (EPS) is calculated by taking the total earnings divided by the number of shares outstanding.
Please refer to the Schedule of Investments for details on Fund holdings. Current and future portfolio holdings are subject to risk.
The information provided herein represents the opinion of Guinness Atkinson Asset Management, Inc. for the period stated and is not intended to be a forecast of future events, a guarantee of future results, or investment advice. Opinions, Fund holdings and sector allocations are subject to change at any time, and are not recommendations to buy or sell any security.
36
GUINNESS ATKINSON GLOBAL ENERGY FUND
Growth of $10,000
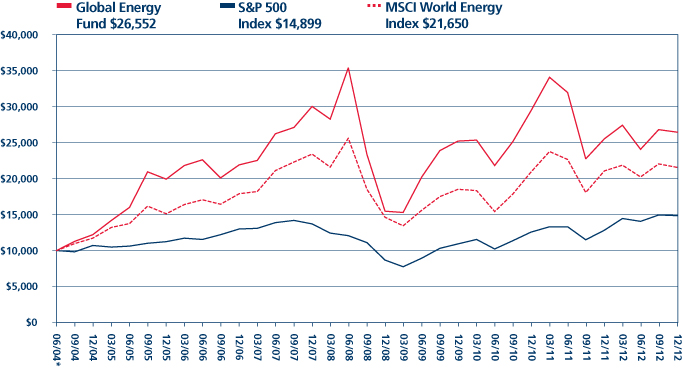
Average Annual Total Return
Periods Ended December 31, 2012
| One Year | | Five Year | | Since Inception
(06/30/04) | |
| | 3.53 | % | | | -2.51 | % | | | 12.16 | % | |
*Inception date 06/30/04.
Performance data quoted represents past performance and does not guarantee future results. The investment return and principal value of an investment will fluctuate so that an investor's shares, when redeemed, may be worth more or less than their original cost. Current performance of the Fund may be lower or higher than the performance quoted. Performance data current to the most recent month end may be obtained by visiting www.gafunds.com.
Total returns reflect a fee waiver in effect and in the absence of this waiver, the total returns would be lower. The Fund imposes a 2% redemption fee on shares held less than 30 days.
The MSCI World Energy Index is an unmanaged index composed of more than 1,400 stocks listed on exchanges in the U.S., Europe, Canada, Australia, New Zealand and the Far East.
The S&P 500 Index is a broad based unmanaged index of 500 stocks, which is widely recognized as representative of the equity market in general. These indices are unmanaged, not available for investment and do not incur expenses.
37
FUND HIGHLIGHTS at December 31, 2012
GUINNESS ATKINSON GLOBAL ENERGY FUND
# of Holdings in Portfolio: | | | 47 | | |
Portfolio Turnover: | | | 14.0 | % | |
% of Stocks in Top 10: | | | 34.5 | % | |
Fund Managers:
Timothy W. N. Guinness | |
Ian Mortimer | |
Will Riley | |
Top 10 Holdings (% of net assets) | | | | | | | |
Helix Energy Solutions Group, Inc. | | | 3.6 | % | | ENI SpA | | | 3.4 | % | |
PetroChina Co., Ltd. - H Shares | | | 3.6 | % | | Valero Energy Corp. | | | 3.4 | % | |
Noble Energy Inc. | | | 3.5 | % | | Statoil ASA | | | 3.4 | % | |
Canadian Natural Resources Ltd. | | | 3.4 | % | | Suncor Energy, Inc. | | | 3.4 | % | |
Halliburton Co. | | | 3.4 | % | | Total SA | | | 3.4 | % | |
Sector Breakdown (% of net assets) | | | | | | | |
Oil & Gas - Integrated | | | 42.7 | % | | Oil Refining & Marketing | | | 3.4 | % | |
Oil & Gas - Exploration & Production | | | 41.7 | % | | Energy - Alternate Sources | | | 1.2 | % | |
Oil & Gas - Field Services | | | 7.6 | % | | Machinery - General Industries | | | 0.1 | % | |
Oil & Gas - Drilling | | | 4.1 | % | | | | | |
38
SCHEDULE OF INVESTMENTS
December 31, 2012
GUINNESS ATKINSON GLOBAL ENERGY FUND
Shares | | COMMON STOCKS: 100.8% | | Value | |
Energy – Alternate Source: 1.2% | | | |
| | 111,420 | | | JA Solar Holdings Co. Ltd. - ADR* | | $ | 475,763 | | |
| | 149,600 | | | Trina Solar Ltd. - ADR* | | | 649,264 | | |
| | | | | | | | 1,125,027 | | |
Machinery – General Industries: 0.1% | | | |
| | 182,956 | | | Shandong Molong Petroleum Machinery Co., Ltd. - H Shares | | | 80,013 | | |
Oil & Gas – Drilling: 4.1% | | | |
| | 163,070 | | | Patterson-UTI Energy, Inc. | | | 3,037,994 | | |
| | 14,930 | | | Transocean Ltd. | | | 666,774 | | |
| | | | | | | | 3,704,768 | | |
Oil & Gas – Exploration & Production: 41.6% | | | |
| | 788,200 | | | Afren PLC* | | | 1,728,181 | | |
| | 38,709 | | | Apache Corp. | | | 3,038,657 | | |
| | 677,083 | | | Bayfield Energy Holdings PLC*†^ | | | 228,228 | | |
| | 55,700 | | | Bill Barrett Corp* | | | 990,903 | | |
| | 107,700 | | | Canadian Natural Resources Ltd. | | | 3,100,963 | | |
| | 73,470 | | | Carrizo Oil & Gas Inc.* | | | 1,536,992 | | |
| | 178,600 | | | Chesapeake Energy Corp. | | | 2,968,332 | | |
| | 1,658,322 | | | Cluff Natural Resources* | | | 111,305 | | |
| | 57,400 | | | Devon Energy Corp. | | | 2,987,096 | | |
| | 196,650 | | | Dragon Oil PLC | | | 1,782,136 | | |
| | 575,230 | | | JKX Oil & Gas PLC | | | 724,189 | | |
| | 114,286 | | | Newfield Exploration Co.* | | | 3,060,579 | | |
| | 30,535 | | | Noble Energy Inc. | | | 3,106,631 | | |
| | 72,285 | | | Ophir Energy PLC* | | | 602,200 | | |
| | 192,000 | | | Pantheon Resources PLC* | | | 47,174 | | |
| | 234,700 | | | Penn Virginia Corp. | | | 1,035,027 | | |
| | 130,500 | | | Petrominerales Ltd. | | | 1,128,280 | | |
| | 37,900 | | | QEP Resources Inc. | | | 1,147,233 | | |
| | 290,000 | | | SOCO International PLC* | | | 1,692,094 | | |
| | 81,400 | | | Stone Energy Corp* | | | 1,670,328 | | |
| | 80,000 | | | Triangle Petroleum Corp.* | | | 479,200 | | |
| | 56,500 | | | Ultra Petroleum Corp* | | | 1,024,345 | | |
| | 66,697 | | | Unit Corp* | | | 3,004,700 | | |
| | 362,740 | | | WesternZagros Resources Ltd.* | | | 397,493 | | |
| | | | | | | | 37,592,266 | | |
Oil & Gas – Field Services: 7.6% | | | |
| | 89,300 | | | Halliburton Co. | | | 3,097,817 | | |
| | 155,880 | | | Helix Energy Solutions Group, Inc.* | | | 3,217,363 | | |
| | 84,900 | | | Kentz Corp Ltd. | | | 538,913 | | |
| | | | | | | | 6,854,093 | | |
The accompanying notes are an integral part of these financial statements.
39
Shares | | COMMON STOCKS: 100.8% (Continued) | | Value | |
Oil & Gas – Integrated: 42.8% | | | |
| | 441,600 | | | BP PLC | | $ | 3,059,757 | | |
| | 28,000 | | | Chevron Corp. | | | 3,027,920 | | |
| | 52,128 | | | ConocoPhillips | | | 3,022,903 | | |
| | 125,700 | | | ENI SpA | | | 3,100,978 | | |
| | 35,000 | | | Exxon Mobil Corp. | | | 3,029,250 | | |
| | 171,700 | | | Gazprom OAO - ADR | | | 1,646,410 | | |
| | 57,943 | | | Hess Corp. | | | 3,068,661 | | |
| | 83,738 | | | OMV AG | | | 3,059,609 | | |
| | 2,233,000 | | | PetroChina Co., Ltd. - H Shares | | | 3,207,248 | | |
| | 88,620 | | | Royal Dutch Shell PLC - Class A | | | 3,046,961 | | |
| | 123,750 | | | Statoil ASA | | | 3,105,383 | | |
| | 93,676 | | | Suncor Energy, Inc. | | | 3,080,468 | | |
| | 59,500 | | | Total SA | | | 3,079,590 | | |
| | | | | | | | 38,535,138 | | |
Oil Refining & Marketing: 3.4% | | | |
| | 90,699 | | | Valero Energy Corp. | | | 3,094,650 | | |
| | | | | Total Common Stocks
(cost $98,225,303): 100.8% | | | 90,985,955 | | |
Warrants: 0.0% | | | |
| | 829,161 | | | Cluff Natural Resources, Expiration 5/22/15, Excerise price £0.10*†^ | | | — | | |
| | | | | Total Warrants
(cost $0) | | | | | |
| | | | | Total Investments in Securities
(cost $98,225,303): 100.8% | | | 90,985,955 | | |
| | | | | Liabilities in Excess of Other Assets: (0.8%) | | | (713,437 | ) | |
| | | | | Net Assets: 100.0% | | $ | 90,272,518 | | |
* Non-income producing security.
† Illiquid. Illiquid securities represent 0.3% of net assets.
^ Fair value under direction of the Board of Trustees. Fair valued securities represent 0.3% of net assets.
ADR - American Depository Receipt
The accompanying notes are an integral part of these financial statements.
40
GLOBAL INNOVATORS FUND for the period ended December 31, 2012
1. Performance
AVERAGE ANNUALIZED TOTAL RETURNS
| | 1 Year
(actual) | | 3 Year | | 5 Year | | 10 Year | |
Fund | | | 19.91 | % | | | 9.46 | % | | | 0.78 | % | | | 9.69 | % | |
Benchmark Index: | |
S&P 500 Index | | | 15.99 | % | | | 10.86 | % | | | 1.66 | % | | | 7.09 | % | |
NASDAQ Composite Index | | | 17.73 | % | | | 11.32 | % | | | 3.78 | % | | | 9.46 | % | |
The Fund's gross expense ratio is 1.42% and net is 1.44% per the Summary Prospectus dated May 1, 2012. The Advisor has contractually agreed to waive a portion of its advisory fees and/or reimburse other Fund expenses so that the Fund's ratio of expenses to average daily net assets will not exceed 1.55% (excluding Acquired Fund Fees and Expenses, interest, taxes, dividends on short positions and extraordinary expenses) through at least June 30, 2013. To the extent that the Advisor waives fees and/or reimburses expenses, it may seek repayment of a portion or all of such amounts at any time within the three fiscal years after the fiscal year in which such amounts were waived and/or reimbursed, subject to the applicable cap.
Performance data quoted represents past performance and does not guarantee future results. The investment return and principal value of an investment in the Fund will fluctuate so that an investor's shares, when redeemed, may be worth more or less than their original cost. Current performance of the Fund may be lower or higher than the performance quoted. Performance data current to the most recent month-end may be obtained by visiting www.gafunds.com, or calling (800) 916-6566.
The Fund imposes a 2% redemption fee on the sale of shares held less than 30 days. Performance data quoted does not reflect this redemption fee. Total returns for certain periods reflect expense limitations in effect and, in the absence of these limitations, total returns would have been lower.
The Global Innovators Fund in 2012 produced a total return of 19.91%. The Fund outperformed the S&P 500 Index by 3.92% and outperformed the NASDAQ Index by 2.18% over the period.
The table below sets out the comparative returns for each year ended December 31st, since launch.
| | 2003 | | 2004 | | 2005 | | 2006 | | 2007 | | 2008 | | 2009 | | 2010 | | 2011 | | 2012 | |
Fund | | | 35.97 | % | | | 10.89 | % | | | 11.82 | % | | | 18.76 | % | | | 21.17 | % | | | -45.42 | % | | | 45.20 | % | | | 17.00 | % | | | -6.51 | % | | | 19.91 | % | |
S&P 500 Index | | | 28.68 | % | | | 10.88 | % | | | 4.91 | % | | | 15.79 | % | | | 5.49 | % | | | -37.00 | % | | | 26.46 | % | | | 15.06 | % | | | 2.11 | % | | | 16.00 | % | |
NASDAQ Composite
Index | | | 50.77 | % | | | 9.15 | % | | | 2.13 | % | | | 10.39 | % | | | 10.66 | % | | | -39.98 | % | | | 45.36 | % | | | 18.15 | % | | | -0.79 | % | | | 17.75 | % | |
Outperformance | |
Fund vs S&P 500
Index | | | Yes | | | | Yes | | | | Yes | | | | Yes | | | | Yes | | | | No | | | | Yes | | | | Yes | | | | No | | | | Yes | | |
Fund vs NASDAQ
Composite Index | | | No | | | | Yes | | | | Yes | | | | Yes | | | | Yes | | | | No | | | | No | | | | No | | | | No | | | | Yes | | |
In equity markets, the year started strongly: in the first quarter of 2012 the Fund was up 17.95%, versus the S&P 500, up 12.59%, and the NASDAQ, up 18.98%. Some of these gains were then given up in the second quarter as investor confidence declined with a raft of weaker economic indicators and European sovereign worries resurfacing; in the second quarter of 2012 the Fund was down 6.65%, versus the S&P 500 down 4.76% and the NASDAQ down 2.75%. In the third quarter, markets retraced their earlier gains: the Fund was up 5.38% in the third quarter, versus the S&P 500, up 6.35%, and the NASDAQ, up 6.54%. In the final quarter of the year, the S&P 500 and NASDAQ both posted negative performance of -0.38% and -2.47%, respectively. The Fund outperformed both indices in this period, and posted a gain of 3.34%.
41
2. Activity
In the first quarter of the year, we did not make any changes to the portfolio. In the second quarter, we made only one change to the portfolio: in April, we sold our position in Apple. We bought Apple almost exactly a year previously, in March 2011, when we saw good value in the company based on our predictions that it would realize strong growth in demand for its emerging iPad technology and its continued expansion into the Chinese and Asian markets. Over the year, we witnessed extraordinary revenue and earnings expansion for Apple, with top line sales rising from $24.7bn in the second quarter of 2011 to over $39.2bn in the equivalent quarter of 2012 – a rise of some 58% over a single year. Apple's share price reflected this rise, moving from approximately $350 per share in March 2011 to a peak of $636 per share in April 2012 – a point at which the market capitalization of the company touched $590bn. We sold our position at $625 per share (slightly before the peak), as we believed the market had begun to price in earnings growth for 2013, and beyond that we felt that the stock's price was unsustainable levels, considering the extraordinarily rapid rise that we had witnessed in such a short space of time and the size the company had reached.
No changes were made to the portfolio in the third quarter, and in the final quarter of the year, we made one purchase; H&R Block, one of the world's largest tax services providers, which prepares approximately one of every seven U.S. tax returns. The company has a market capitalization of approximately $5billion and, as such, is relatively small compared to many of the companies already held in the portfolio. It is trading at very attractive price-to-earnings (PER) multiples, which we believe underestimate its potential to grow both its revenues and earnings. The company also sits in the consumer discretionary sector, but we feel that it has characteristics more usually associated with a consumer staples business, which means it may be being priced 'incorrectly' by the wider market; an anomaly we hope to exploit.
3. Portfolio Position
The portfolio on 31 December, by our calculations, had a PER of 12.2X (2011) and 14.6X (2012) versus the S&P 500 at 14.8X (2011) and 14.3X (2012). The stocks held by the portfolio were at that date, in our view, on average 44% undervalued (i.e., 44% scope for appreciation) versus the market when we applied our discounted cash flow model to the individual constituents.
Due to our purchase of H&R Block, and some good performance from other companies in the sector, our exposure to the Consumer Discretionary sector has increased from 12.2% to 15.2% since June 31, 2012. This addition resulted in a small decrease across all other sector allocations, which otherwise remained largely unchanged.
Sector Allocation | |
Consumer Discretionary | | | 15.2 | % | | Industrials | | | 11.7 | % | |
Consumer Staples | | | 0.0 | % | | Information Technology | | | 42.4 | % | |
Energy | | | 3.6 | % | | Materials | | | 0.0 | % | |
Financials | | | 15.6 | % | | Telecommunication Services | | | 7.5 | % | |
Health Care | | | 4.0 | % | | Utilities | | | 0.0 | % | |
| | | | | | | 100 | % | |
4. Outlook
At the end of 2011 we wrote that our outlook for 2012:
"...remains somewhat cautious, but we note that some progress has been made towards stimulating a recovery in the US. However, at the same time our concerns over the Eurozone have escalated. The Eurozone crisis is largely a result of a lack of political will to address a very difficult situation. Until certainty can be provided to the market, yields on peripheral Eurozone debt is likely to remain high, banks will likely continue to reduce lending, and the threat of a default by Greece will mean management of companies will continue to hoard cash rather than make investments. We therefore expect lower growth, or even recession, in the Eurozone in the short- to medium- term."
Looking back at equities performance in 2012 on an absolute basis, this caution would appear to have been misplaced; the S&P 500 started the year at 1258 and finished at 1426, providing investors with a 16% total return (including dividends). This belies the fact, however, that markets did not move steadily upwards over the year, but instead swung between strongly positive months and strongly negative months, as investors reacted to various economic situations. In 2012, investors had to deal with the
42
continuing European debt crisis; a polarizing U.S. presidential election; a slowdown in growth in China, combined with a once–in-a-decade leadership change; continued unrest in the Middle East; and the looming 'fiscal cliff' debates in the U.S. Yet, despite these issues, we witnessed double-digit increases in equity prices over the period, as investors appeared to look beyond the near-term uncertainty and focus on the long-term.
Many of the issues outlined above remain at the fore, however, and we cannot forget that we are currently in a world where governments and central banks are intervening in financial markets to an extent never seen before. Also, with the good performance of 2012 behind us, we must believe that the bar at the start of 2013 has been set higher. Equity valuations are not at extreme levels, however, and actually appear to provide good value in many cases – suggesting there remains some healthy scepticism going forward and that we have not yet reached unsustainable levels. If the currently low levels of expected economic growth prove too cautious, then we may potentially see continued good performance for equities going forward.
Our focus remains, as ever, on quality innovative companies that have shown the ability to consistently earn high levels of return on capital over a prolonged period. We continue to believe these innovative companies can navigate the economic cycle better than the average company and therefore should be well rewarded over the long-term.


Matthew Page Ian Mortimer January 2013
The Fund invests in foreign securities, which involves political, economic and currency risks, greater volatility, and differences in accounting methods. The Fund is non-diversified, meaning that its assets may be concentrated in fewer individual holdings than diversified funds. Therefore, the Fund is more exposed to individual stock volatility than diversified funds. The Fund invests in smaller companies, which involves additional risks such as limited liquidity and greater volatility.
The Standard & Poor's 500 Index is a market capitalization-weighted index composed of 500 widely held common stocks of U.S. companies. The NASDAQ Composite Index is a market capitalization-weighted index that is designed to represent the performance of the National Market System, which includes over 5,000 stocks traded only over-the-counter and not on an exchange. These indices are unmanaged and not available for investment, and do not incur expenses.
PER or P/E – Price to Earnings ratio is calculated by dividing current price of the stock by the company's trailing months' earnings per share.
Cash flow measures the cash generating capability of a company by adding non-cash charges (e.g. depreciation) and interest expense to pretax income.
Return on Capital (ROC) is a ratio measuring the profitability of a firm expressed as a percentage of funds acquired from investors and lenders.
Please refer to the Schedule of Investments for details on Fund holdings. Current and future portfolio holdings are subject to risk.
The information provided herein represents the opinion of Guinness Atkinson Asset Management, Inc. for the period stated and is not intended to be a forecast of future events, a guarantee of future results, or investment advice. Opinions, Fund holdings and sector allocations are subject to change at any time, and are not recommendations to buy or sell any security.
43
GUINNESS ATKINSON GLOBAL INNOVATORS FUND
Growth of $10,000

Average Annual Total Return
Periods Ended December 31, 2012
| One Year | | Five Year | | Ten Year | |
| | 19.91 | % | | | 0.78 | % | | | 9.69 | % | |
Performance data quoted represents past performance and does not guarantee future results. The investment return and principal value of an investment will fluctuate so that an investor's shares, when redeemed, may be worth more or less than their original cost. Current performance of the Fund may be lower or higher than the performance quoted. Performance data current to the most recent month end may be obtained by visiting www.gafunds.com.
Total returns reflect a fee waiver in effect and in the absence of this waiver, the total returns would be lower. The Fund imposes a 2% redemption fee on shares held less than 30 days.
The Standard & Poor's 500 Index is an unmanaged index which is widely regarded as the standard for measuring large cap U.S. Stock market performance. The NASDAQ Composite Index is a market capitalization weighted index that is designed to represent the performance of the National Market System which includes over 5,000 stocks traded only over-the-counter and not on an exchange. The indices referenced in this chart are not available for investment and do not incur expenses.
44
FUND HIGHLIGHTS at December 31, 2012
GUINNESS ATKINSON GLOBAL INNOVATORS FUND
# of Holdings in Portfolio: | | | 28 | | |
Portfolio Turnover: | | | 6.0 | % | |
% of Stocks in Top 10: | | | 41.7 | % | |
Fund Managers:
Timothy W. N. Guinness | |
Ian Mortimer | |
Matthew Page | |
Top 10 Holdings (% of net assets) | | | | | | | |
Samsung Electronics Co., Ltd. - GDR | | | 4.4 | % | | Parametric Technology Corp. | | | 4.1 | % | |
State Street Corp. | | | 4.3 | % | | L-3 Communications Holdings, Inc. | | | 4.1 | % | |
Oracle Corp. | | | 4.2 | % | | Gilead Sciences, Inc. | | | 4.1 | % | |
CenturyLink, Inc. | | | 4.2 | % | | H&R Block, Inc. | | | 4.1 | % | |
Taiwan Semiconductor Manufacturing Co., Ltd. - ADR | | | 4.2 | % | | TD Ameritrade Holding Corp. | | | 4.0 | % | |
Sector Breakdown (% of net assets) | | | | | | | |
Electronics | | | 15.5 | % | | E-Commerce | | | 4.0 | % | |
Prepackaged Software | | | 8.2 | % | | Cable/Satellite TV | | | 4.0 | % | |
Semiconductor | | | 8.2 | % | | Machinery | | | 4.0 | % | |
Commerical Banks | | | 8.1 | % | | Diversified Manufacturing Operations | | | 3.9 | % | |
Telecommunications | | | 7.7 | % | | Oil - Integrated | | | 3.7 | % | |
Automobile Manufacturers | | | 4.9 | % | | Finance - Other Services | | | 3.7 | % | |
Computer Aided Design | | | 4.1 | % | | Web Portals/ISP | | | 3.4 | % | |
Medical - Biomedical | | | 4.1 | % | | Wireless Equipment | | | 2.7 | % | |
Commerical Services | | | 4.1 | % | | Retail | | | 2.5 | % | |
Finance - Investment Banker/Broker | | | 4.0 | % | | Computers | | | 1.4 | % | |
45
SCHEDULE OF INVESTMENTS
December 31, 2012
GUINNESS ATKINSON GLOBAL INNOVATORS FUND
Shares | | COMMON STOCKS: 102.2% | | Value | |
Automobile Manufacturers: 4.9% | | | |
| | 19,940 | | | Honda Motor Co., Ltd. - ADR | | $ | 736,584 | | |
| | 8,740 | | | Toyota Motor Corp. - ADR | | | 815,005 | | |
| | | | | | | | 1,551,589 | | |
Cable/Satellite TV: 4.0% | | | |
| | 33,880 | | | Comcast Corp. - Class A | | | 1,266,434 | | |
Commercial Bank: 8.1% | | | |
| | 20,780 | | | Capital One Financial Corp. | | | 1,203,785 | | |
| | 29,174 | | | State Street Corp. | | | 1,371,470 | | |
| | | | | | | | 2,575,255 | | |
Commercial Services: 4.1% | | | |
| | 69,130 | | | H&R Block, Inc. | | | 1,283,744 | | |
Computer Aided Design: 4.1% | | | |
| | 58,310 | | | Parametric Technology Corp.* | | | 1,312,558 | | |
Computers: 1.4% | | | |
| | 36,660 | | | Research In Motion Ltd.* | | | 435,521 | | |
Diversified Manufacturing Operations: 3.9% | | | |
| | 21,870 | | | Danaher Corp. | | | 1,222,533 | | |
E-Commerce: 4.0% | | | |
| | 24,990 | | | eBay, Inc.* | | | 1,274,990 | | |
Electronics: 15.5% | | | |
| | 55,050 | | | Intel Corp. | | | 1,135,131 | | |
| | 17,110 | | | L-3 Communications Holdings, Inc. | | | 1,310,968 | | |
| | 85,395 | | | NVIDIA Corp. | | | 1,049,505 | | |
| | 1,980 | | | Samsung Electronics Co., Ltd. - GDR | | | 1,407,194 | | |
| | | | | | | | 4,902,798 | | |
Finance – Investment Bank/Broker: 4.0% | | | |
| | 76,080 | | | TD Ameritrade Holding Corp. | | | 1,278,905 | | |
Finance – Other Services: 3.7% | | | |
| | 9,440 | | | IntercontinentalExchange, Inc.* | | | 1,168,766 | | |
Machinery: 4.0% | | | |
| | 11,230 | | | Roper Industries, Inc. | | | 1,251,920 | | |
Medical – Biomedical: 4.1% | | | |
| | 17,750 | | | Gilead Sciences, Inc.* | | | 1,303,737 | | |
Oil – Integrated: 3.7% | | | |
| | 28,280 | | | BP PLC - ADR | | | 1,177,579 | | |
The accompanying notes are an integral part of these financial statements.
46
Shares | | COMMON STOCKS: 102.2% (Continued) | | Value | |
Prepackaged Software: 8.2% | | | |
| | 26,520 | | | Check Point Software Technologies* | | $ | 1,263,413 | | |
| | 39,680 | | | Oracle Corp. | | | 1,322,138 | | |
| | | | | | | | 2,585,551 | | |
Retail: 2.5% | | | |
| | 67,220 | | | Best Buy Co., Inc. | | | 796,557 | | |
Semiconductor: 8.2% | | | |
| | 110,990 | | | Applied Materials, Inc. | | | 1,269,726 | | |
| | 76,529 | | | Taiwan Semiconductor Manufacturing Co., Ltd - ADR | | | 1,313,238 | | |
| | | | | | | | 2,582,964 | | |
Telecommunications: 7.7% | | | |
| | 33,577 | | | CenturyLink, Inc. | | | 1,313,532 | | |
| | 44,045 | | | Vodafone Group PLC - ADR | | | 1,109,494 | | |
| | | | | | | | 2,423,026 | | |
Web Portals/ISP: 3.4% | | | |
| | 67,810 | | | Blucora Inc.* | | | 1,065,295 | | |
Wireless Equipment: 2.7% | | | |
| | 216,422 | | | Nokia OYJ - ADR | | | 854,867 | | |
| | | | | Total Common Stocks
(cost $35,866,253) | | | 32,314,589 | | |
| | | | | Total Investments in Securities
(cost $35,866,253): 102.2% | | | 32,314,589 | | |
| | | | | Liabilities in Excess of Other Assets: (2.2%) | | | (683,602 | ) | |
| | | | | Net Assets: 100.0% | | $ | 31,630,987 | | |
* Non-income producing security.
ADR - American Depository Receipt
GDR - Global Depository Receipt
The accompanying notes are an integral part of these financial statements.
47
INFLATION MANAGED DIVIDEND FUND for the period ended December 31, 2012
1. Performance
TOTAL RETURN
| | 6 Months
(actual) | | Since
Inception
(March 30, 2012)
(actual) | |
Fund | | | 7.26 | % | | | 4.97 | % | |
Benchmark Index: | |
MSCI World Index | | | 9.70 | % | | | 4.37 | % | |
The Fund's gross expense ratio is 0.92% and net expense ratio is 0.68% per the Summary Prospectus dated May 1, 2012. The Advisor has contractually agreed to waive a portion of its advisory fees and/or reimburse other Fund expenses so that the Fund's ratio of expenses to average daily net assets will not exceed 0.68% (excluding Acquired Fund Fees and Expenses, interest, taxes, dividends on short positions and extraordinary expenses) through at least March 31, 2015. To the extent that the Advisor waives fees and/or reimburses expenses, it may seek repayment of a portion or all of such amounts at any time within the three fiscal years after the fiscal year in which such amounts were waived and/or reimbursed, subject to the applicable cap.
Performance data quoted represents past performance and does not guarantee future results. The investment return and principal value of an investment in the Fund will fluctuate so that an investor's shares, when redeemed, may be worth more or less than their original cost. Current performance of the Fund may be lower or higher than the performance quoted. Performance data current to the most recent month-end may be obtained by visiting www.gafunds.com, or calling (800) 916-6566.
The Fund imposes a 2% redemption fee on the sale of shares held less than 30 days. Performance data quoted does not reflect this redemption fee. Total returns for certain periods reflect expense limitations in effect and, in the absence of these limitations, total returns would have been lower.
Since launch (March 30 2012) to December 31 2012, the Fund was up 4.97%, versus the MSCI World Index, which was up 4.37%. The Fund therefore outperformed the Index by 0.60% over that period.
2. Activity
In the second quarter of the year, we made no changes to the portfolio.
In the third quarter, we made the following changes to the portfolio: we sold our positions in the Spanish telecoms giant Telefonica, and the French pharmaceutical company Sanofi; and we bought positions in the U.S.-based pharmaceutical Merck, insurance broker Arthur Gallagher, and the Italian energy company ENI.
In the final quarter of the year, we made one change to the portfolio; we sold our position in PepsiCo and we bought a position in H&R Block, one of the world's largest tax services providers, which prepares approximately one of every seven US tax returns.
3. Portfolio Position
P/E
| | 2010 | | 2011 | | 2012 | | 2013 | |
Fund | | | 13.9 | | | | 12.0 | | | | 12.0 | | | | 11.5 | | |
MSCI World Index | | | 14.5 | | | | 13.7 | | | | 16.1 | | | | 13.1 | | |
Fund discount | | | -4.1 | % | | | -12.4 | % | | | -25.5 | % | | | -12.2 | % | |
The portfolio on December 31, 2012, by our calculations, had an estimated P/E of 11.5X for 2013 versus the MSCI World Index at 13.1X for 2013, a 12.2% discount. Furthermore the stocks held by the portfolio were at that date, in our view, on average 23% undervalued (i.e., 23% scope for appreciation) versus the market when we applied our discounted cash flow model to the individual constituents.
48
INFLATION MANAGED DIVIDEND FUND
The table below shows the sector allocation of the Fund at the end of the period. The largest weighting is to the consumer staples sector at 31.9%. The Fund currently has no exposure to materials or utilities.
Sector Allocation | |
Consumer Discretionary | | | 9.3 | % | | Industrials | | | 11.5 | % | |
Consumer Staples | | | 32.0 | % | | Information Technology | | | 5.6 | % | |
Energy | | | 8.6 | % | | Materials | | | 0.0 | % | |
Financials | | | 14.4 | % | | Telecommunication Services | | | 5.5 | % | |
Health Care | | | 13.1 | % | | Utilities | | | 0.0 | % | |
| | | | | | | 100 | % | |
4. Dividend
The Fund paid a dividend of $0.11 per share for the quarter ended December 31, 2012. The table below shows the cumulative dividend payments from the Fund since launch (March 30, 2012).
| | Dividend per share (USD) | |
| | 1Q | | 2Q | | 3Q | | 4Q | | Total | |
| | 2012 | | | | na | | | | 0.10 | | | | 0.10 | | | | 0.11 | | | | 0.31 | | |
5. Outlook
Given the volatility seen over the year, the Fund has performed as we would have expected since its launch at the end of March; outperforming during periods of weak market performance, and underperforming in rapidly rising markets. Over the long term, however, we believe our focus on companies that achieve consistently high returns on capital over an entire business cycle, and that pay a sustainable, and growing, dividend should be rewarded.
2012 might be best characterised as a year of continued deleveraging; particularly in the southern European economies whose debt positions continued to cause worries across the region and beyond. Slowing growth rates in the emerging markets, and in particular China, weighed further on investor sentiment, as the ability of the east to drive a recovery in the west was called into question. Liquidity provisions, in the form of quantitative easing, helped allay investors' fears in the short-term, however, and aided double-digit returns in equity markets. We are not convinced these efforts really solved the underlying problem, however. Indeed, recent estimates for global gross domestic product (GDP) growth indicate a further slowdown for 2013.
So where does that leaves us? Despite the good returns on equities in 2012, valuation levels do not appear stretched, suggesting that there remains some healthy scepticism going forward. The potential benefit for the Fund is that many of the companies we believe will perform best in the current uncertain environment look relatively inexpensive. We continue to look only at those companies with sound balance sheets, good cash flows, mature businesses, attractive franchises, and sustainable dividend payments. History has shown that these companies can potentially perform well in almost all economic environments.
We believe that this approach to identifying stocks is well suited to current economic conditions. The characteristics of these companies appear attractive, while at the same time providing the potential to generate fairly steady economic profits in times of slow economic growth and uncertainty.


Matthew Page Ian Mortimer January 2013
The Fund invests in foreign securities, which involves political, economic and currency risks, greater volatility, and differences in accounting methods. The Fund invests in small- or mid-cap companies, which involves additional risks such as limited liquidity and greater volatility.
49
INFLATION MANAGED DIVIDEND FUND
The MSCI World Index is a free float-adjusted market capitalization weighted index that is designed to measure the equity market performance of developed markets. The index is unmanaged and not available for investment, and does not incur expenses.
PER or P/E – Price to Earnings ratio is calculated by dividing current price of the stock by the company's trailing months' earnings per share.
Cash flow measures the cash generating capability of a company by adding non-cash charges (e.g. depreciation) and interest expense to pretax income.
Return on Capital (ROC) is a ratio measuring the profitability of a firm expressed as a percentage of funds acquired from investors and lenders.
Please refer to the Schedule of Investments for details on Fund holdings. Current and future portfolio holdings are subject to risk.
The information provided herein represents the opinion of Guinness Atkinson Asset Management, Inc. for the period stated and is not intended to be a forecast of future events, a guarantee of future results, or investment advice. Opinions, Fund holdings and sector allocations are subject to change at any time, and are not recommendations to buy or sell any security.
50
GUINNESS ATKINSON INFLATION MANAGED DIVIDEND FUNDTM
Growth of $10,000
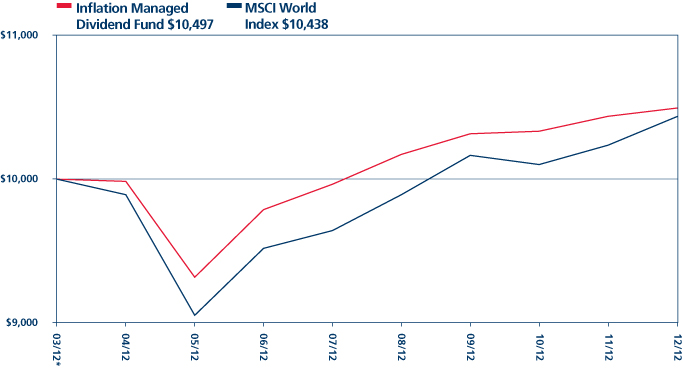
Total Return
Period Ended December 31, 2012
Since Inception
(03/30/12) | |
| | 4.97 | % | |
*Inception date 03/30/12.
Performance data quoted represents past performance and does not guarantee future results. The investment return and principal value of an investment will fluctuate so that an investor's shares, when redeemed, may be worth more or less than their original cost. Current performance of the Fund may be lower or higher than the performance quoted. Performance data current to the most recent month end may be obtained by visiting www.gafunds.com.
Total returns reflect a fee waiver in effect and in the absence of this waiver, the total returns would be lower. The Fund imposes a 2% redemption fee on shares held less than 30 days.
The MSCI World Index is a free float-adjusted market capitalization weighted index that is designed to measure the equity market performance of developed markets.
51
FUND HIGHLIGHTS at December 31, 2012
GUINNESS ATKINSON INFLATION MANAGED DIVIDEND FUNDTM
# of Holdings in Portfolio: | | | 36 | | |
Portfolio Turnover: | | | 13.3 | % | |
% of Stocks in Top 10: | | | 29.4 | % | |
Fund Managers:
Ian Mortimer | |
Matthew Page | |
Top 10 Holdings (% of net assets) | | | | | | | |
Reckitt Benckiser Group PLC | | | 3.1 | % | | Unilever PLC | | | 2.9 | % | |
Halma PLC | | | 3.0 | % | | Procter & Gamble Co/The | | | 2.9 | % | |
Deutsche Boerse AG | | | 3.0 | % | | Pfizer Inc. | | | 2.9 | % | |
Mattell Inc. | | | 3.0 | % | | ENI SpA | | | 2.9 | % | |
VF Corp. | | | 2.9 | % | | H&R Block, Inc. | | | 2.8 | % | |
Sector Breakdown (% of net assets) | | | | | | | |
Pharmaceuticals | | | 13.7 | % | | Cosmetics & Toiletries | | | 2.9 | % | |
Food-Misc/Diversified | | | 11.2 | % | | Commercial Services | | | 2.8 | % | |
Oil Company - Integrated | | | 8.2 | % | | Investment Management/Advisory Services | | | 2.8 | % | |
Aerospace/Defense | | | 5.5 | % | | Electronics - Military | | | 2.7 | % | |
Cellular Telecommunications | | | 5.2 | % | | Life/Health Insurance | | | 2.7 | % | |
Tobacco | | | 5.1 | % | | Food-Wholesale/Distribution | | | 2.7 | % | |
Insurance Brokers | | | 5.0 | % | | Diversified Manufactured Operations | | | 2.6 | % | |
Soap & Cleaning Products | | | 3.1 | % | | Retail - Discount | | | 2.6 | % | |
Electronic Measure Instruments | | | 3.0 | % | | Finance - Investment Banker/Broker | | | 2.5 | % | |
Finance - Other Services | | | 3.0 | % | | Beverages-Non-alcoholic | | | 2.4 | % | |
Toys | | | 3.0 | % | | Applications Software | | | 2.3 | % | |
Apparel Manufacturers | | | 3.0 | % | | | | | |
52
SCHEDULE OF INVESTMENTS
December 31, 2012
GUINNESS ATKINSON INFLATION MANAGED DIVIDEND FUNDTM
Shares | | COMMON STOCKS: 98.0% | | Value | |
Australia: 2.7% | | | |
| | 13,680 | | | Metcash Ltd. | | $ | 47,633 | | |
France: 5.4% | | | |
| | 760 | | | Danone SA | | | 50,213 | | |
| | 910 | | | Total SA | | | 47,492 | | |
| | | | | | | | 97,705 | | |
Germany: 3.0% | | | |
| | 880 | | | Deutsche Boerse AG | | | 53,712 | | |
Hong Kong: 2.8% | | | |
| | 860 | | | China Mobile Ltd. - ADR | | | 50,499 | | |
Italy: 2.9% | | | |
| | 2,080 | | | ENI SpA | | | 51,453 | | |
Netherlands: 2.7% | | | |
| | 1,390 | | | Royal Dutch Shell PLC - Class A | | | 47,828 | | |
United Kingdom: 27.3% | | | |
| | 8,480 | | | Aberdeen Asset Management PLC | | | 50,291 | | |
| | 1,050 | | | AstraZeneca PLC | | | 49,627 | | |
| | 7,200 | | | Halma PLC | | | 54,266 | | |
| | 8,850 | | | ICAP PLC | | | 45,282 | | |
| | 1,220 | | | Imperial Tobacco Group PLC | | | 47,110 | | |
| | 7,760 | | | Meggitt PLC | | | 48,381 | | |
| | 890 | | | Reckitt Benckiser Group PLC | | | 55,753 | | |
| | 1,390 | | | Unilever PLC | | | 52,873 | | |
| | 16,740 | | | Vodafone Group PLC | | | 42,130 | | |
| | 1,300 | | | Willis Group Holding PLC | | | 43,589 | | |
| | | | | | | | 489,302 | | |
The accompanying notes are an integral part of these financial statements.
53
Shares | | COMMON STOCKS: 98.0% (Continued) | | Value | |
United States: 51.2% | | | |
| | 740 | | | Abbott Laboratories | | $ | 48,470 | | |
| | 910 | | | Aflac Inc. | | | 48,339 | | |
| | 1,340 | | | Arthur J Gallagher | | | 46,431 | | |
| | 1,220 | | | Coca-Cola Co./The | | | 44,225 | | |
| | 720 | | | General Dynamics Corp. | | | 49,874 | | |
| | 2,740 | | | H&R Block, Inc. | | | 50,882 | | |
| | 770 | | | Illinois Tool Works Inc. | | | 46,824 | | |
| | 700 | | | Johnson & Johnson | | | 49,070 | | |
| | 1,063 | | | Kraft Foods Inc. - Class A | | | 48,335 | | |
| | 640 | | | L-3 Communications Holdings Inc. | | | 49,037 | | |
| | 1,450 | | | Mattel Inc. | | | 53,099 | | |
| | 1,140 | | | Merck & Co Inc | | | 46,672 | | |
| | 1,550 | | | Microsoft Corp. | | | 41,400 | | |
| | 1,920 | | | Mondelez International Inc. | | | 48,870 | | |
| | 2,070 | | | Pfizer Inc. | | | 51,915 | | |
| | 770 | | | Procter & Gamble Co./The | | | 52,275 | | |
| | 1,060 | | | Reynolds American Inc. | | | 43,916 | | |
| | 350 | | | VF Corp. | | | 52,840 | | |
| | 680 | | | Wal-Mart Stores Inc. | | | 46,396 | | |
| | | | | | | | 918,870 | | |
| | | | | Total Common Stocks
(cost $1,702,904) | | | 1,757,002 | | |
| | | | | Total Investments in Securities
(cost $1,702,904): 98.0% | | | 1,757,002 | | |
| | | | | Other Assets less Liabilities: 2.0% | | | 36,617 | | |
| | | | | Net Assets: 100.0% | | $ | 1,793,619 | | |
ADR - American Depository Receipt
The accompanying notes are an integral part of these financial statements.
54
RENMINBI YUAN & BOND FUND for the period ended December 31, 2012
1. Performance
AVERAGE ANNUALIZED TOTAL RETURN
| | 1 Year
(actual) | | Since
Inception
(June 30, 2011) | |
Fund | | | 3.88 | % | | | 2.67 | % | |
Comparisons: | |
RMB Cash Offshore (CNH)* | | | 1.94 | % | | | 2.57 | %* | |
RMB Cash Onshore (CNY)* | | | 1.03 | % | | | 2.48 | %* | |
BOCHK Offshore RMB Bond Index | | | 9.25 | % | | | 3.50 | % | |
*Net change in exchange rate versus U.S. dollar.
The Fund's gross expense ratio is 0.92% and net expense ratio is 0.90% per the Summary Prospectus dated May 1, 2012. The Advisor has contractually agreed to waive a portion of its advisory fees and/or reimburse other Fund expenses so that the Fund's ratio of expenses to average daily net assets will not exceed 0.90% (excluding Acquired Fund Fees and Expenses, interest, taxes, dividends on short positions and extraordinary expenses) through at least June 30, 2013. To the extent that the Advisor waives fees and/or reimburses expenses, it may seek repayment of a portion or all of such amounts at any time within the three fiscal years after the fiscal year in which such amounts were waived and/or reimbursed, subject to the applicable cap.
Performance data quoted represents past performance and does not guarantee future results. The investment return and principal value of an investment will fluctuate so that an investor's shares, when redeemed, may be worth more or less than their original cost. Current performance of the Fund may be lower or higher than the performance quoted. Performance data current to the most recent month-end may be obtained by visiting www.gafunds.com, or calling (800) 916-6566.
The Fund imposes a 2% redemption fee on the sales of shares held less than 30 days. Performance data quoted does not reflect this redemption fee. Total returns for certain periods reflect expense limitations in effect and, in the absence of these limitations, total returns would have been lower.
The Fund is designed to give U.S. dollar-based investors exposure to the Chinese renminbi by purchasing the currency in the offshore market, generally in Hong Kong (known as the CNH market). The Fund also seeks to generate additional return by investing in renminbi-denominated bonds, often referred to as Dim Sum bonds (so named after a lunchtime favourite in Hong Kong), and certificates of deposit issued by banks. The intention is to give investors the benefit of hoped-for renminbi appreciation, while adding to the return through interest and possibly some capital gain. The aim, however, also is to keep credit risk and volatility low.
In 2012 the Fund returned 3.88%, compared to an appreciation of the offshore renminbi (CNH) against the dollar of 1.94%. The volatility of the Fund over the year, based on weekly data, was 1.35%, which compares to currency volatility of 1.20%. Over the course of the year, the Fund distributed income of $0.29 per share.
The currency did little in the first half of the year and began to strengthen against the U.S. dollar beginning in September. This climb was not only a result of policy moves, but also a sign of returning domestic confidence. In China's onshore market, the exchange rate is managed carefully, with a daily fixing price released by the China Foreign Exchange trading system. The onshore renminbi (CNY) is permitted to trade within a certain range of this daily rate. In May, the range was widened from +/-0.5% to +/-1%.
In the period immediately following the widening of the range, while domestic confidence was still weak, the CNY traded at the weak end of the range before turning in September. In the offshore market, the renminbi (CNH) exchange rate is determined wholly by market forces, but in practice remains close to the CNY spot rate. At year end, the CNH rate was 6.2240 to $1, compared to the CNY rate, which was 6.2306, and the daily fixing price of the renminbi was 6.2855. Improvements in Chinese economic data and steady, though modest trade growth appear to be behind the rise in the daily fix and the move in the exchange rate from a discount to a premium.
Interest rates on certificates of deposit improved markedly compared to 2011. For example, the interest rate offered on a 6-month certificate of deposit at the end of 2011 stood at 1.7%, but by the end of 2012, an interest rate of over 3% was available. This move reflected greater competition amongst the banks to fund their expanding offshore renminbi lending business against a background
55
RENMINBI YUAN & BOND FUND
of a modest decline in the overall deposit pool in Hong Kong. This decline has been attributed not to falling activity, but to growth in trade usage of renminbi, as well as an opening up of channels between the onshore and offshore market that allow, albeit with restrictions, money to move between the two.
The offshore renminbi bond market also has developed over the course of 2012. After significant weakness in 2011, corporate bond yields recovered, with high yield/unrated names moving most. Government bond yields actually fell marginally, which resulted in a convergence with those in the onshore market. The development of the market over the last twelve months has seen new supply coming from multi-national companies as well as a significant number of financial issuers. The government issued a new series in the middle of the year, as did some of China's policy banks. The main contributions of these to the offshore market have served not only to reaffirm broad official Chinese commitment, but also to lengthen the yield curve.
In spite of the government issuance at longer maturities, the bulk of new issues are still at three years' maturity or less. The duration of the market, as measured by the HSBC Offshore RMB Bond Index, was 2.58 years at the end of 2012. In the high yield space, where new issuance has been sparse in 2012, duration has fallen to 1.81 years. The growth in the market overall, coupled with a moderation in currency expectations, has obliged issuers, including the government, to increase the coupons they offer. The average coupon of the index has increased from 2.94% at the end of 2011 to 3.52%. The biggest increase has been in the investment grade segment of the market.
2. Portfolio Position
During the year, the portfolio has increased its bond exposure from 34% in 2011 to 66% by the end of this year as we participated in a series of new offerings mostly in the investment grade area. The Fund's portfolio at year-end was made up of 51% in investment grade bonds, 12% in below investment grade but rated bonds, and 3.5% in unrated bonds. The balance of the portfolio consisted of certificates of deposit and renminbi cash. The duration of the portfolio was 1.56 years.
3. Outlook and Strategy
We believe that there is still substantial room for the renminbi to appreciate further against the dollar. Estimates as to the degree of undervaluation can vary widely on small changes made to underlying assumptions. We believe, however, that Chinese trade growth will continue, albeit at a more moderate pace, and that the trade surplus will persist, which would support the case for appreciation. Furthermore, we believe that policy is also supportive. Export manufacturers most vulnerable to a stronger renminbi tend to be producers of the more basic products and there is plenty of anecdotal evidence to suggest that the government would like to see the export sector move into higher value-added activities. If so, then the case for saying the Chinese wish to keep their currency weak to protect exporters becomes weaker.
The other arguments that support the idea of further appreciation relate to domestic financial reform and greater international usage of the currency. In the cause of financial reform, there has been the development of the domestic corporate bond market, which provides an alternative to bank-sourced funding, the introduction of greater flexibility in bank lending and deposit rates, and a wider permitted trading band for the currency. We believe that these trends will continue, that a wider trading band for the currency is likely to be introduced, and that the effects will be reflected in the offshore renminbi market.
Greater international usage would be a natural development, given China's substantial role in world trade. The World Trade Organization predicts global trade growth in 2013 of 4.5%, while private sector economists believe that China's trade could grow at twice the pace, with its increasing trade with emerging market partners. Even with existing partners in the U.S. and Europe, there is encouragement to use renminbi for trade settlement, with some Chinese manufacturers offering discounts for those that do so. A wider use and consequently more widespread holding of the currency is likely to mean increased demand for renminbi and upward pressure on the exchange rate.
The strategy for the Fund is to continue to offer investor exposure to the currency and to try and earn a yield by holding renminbi denominated assets while keeping credit risk low. The offshore renminbi bond market has grown both in terms of the number and diversity of issuers, as well as in terms of the breadth of investor participation, mostly from Europe and Asia. This leads us to become more confident in expanding the bond portfolio up to 75% of the Fund, but we continue to be careful about the structure and quality of the issues we will buy.

Edmund Harriss
56
RENMINBI YUAN & BOND FUND
The Fund invests in foreign securities, which involves political, economic and currency risks, greater volatility, and differences in accounting methods. The Fund is non-diversified, meaning that its assets may be concentrated in fewer individual holdings than diversified funds. Therefore, the Fund is more exposed to individual stock volatility than diversified funds. The Fund invests in all market capitalization companies, including companies in emerging markets. Investments in debt securities typically decrease in value when interest rates rise, which can be greater for longer-term debt securities. The Fund may invest in derivatives, which involves risks different from, and in certain cases, greater than the risks presented by traditional investments.
The BOCHK Offshore RMB Bond Index tracks the total return performance of offshore renminbi (RMB)-denominated bonds that: (i) are issued outside the Mainland of China; and (ii) satisfy a set of pre-specified and transparent eligibility criteria. It includes RMB-denominated bonds issued in the Hong Kong SAR presently and perhaps in other countries or regions in future. The Index was launched on December 31, 2010, with a base value of 100. This index is unmanaged and not available for investment, and does not incur expenses.
Duration is a commonly used measure of the potential volatility of the price of a debt security, or the aggregate market value of a portfolio of debt securities, prior to maturity. Securities with a longer duration generally have more volatile prices than securities of comparable quality with a shorter duration.
Dim Sum Bonds are bonds denominated in Chinese yuan and issued in Hong Kong. Dim sum bonds are attractive to foreign investors who desire exposure to yuan-denominated assets, but are restricted by China's capital controls from investing in domestic Chinese debt. The issuers of dim sum bonds are largely entities based in China or Hong Kong, and occasionally foreign companies. The term is derived from the Chinese cuisine that involves serving a variety of small delicacies and is especially popular in Hong Kong.
HSBC Offshore Renminbi Bond Index tracks total return performance of renminbi-denominated and renminbi-settled bonds and certificates of deposit issued outside the People's Republic of China.
Please refer to the Schedule of Investments for details on Fund holdings. Current and future portfolio holdings are subject to risk.
The information provided herein represents the opinion of Guinness Atkinson Asset Management, Inc. for the period stated and is not intended to be a forecast of future events, a guarantee of future results, or investment advice. Opinions, Fund holdings and sector allocations are subject to change at any time, and are not recommendations to buy or sell any security.
57
GUINNESS ATKINSON RENMINBI YUAN & BOND FUND
Growth of $10,000
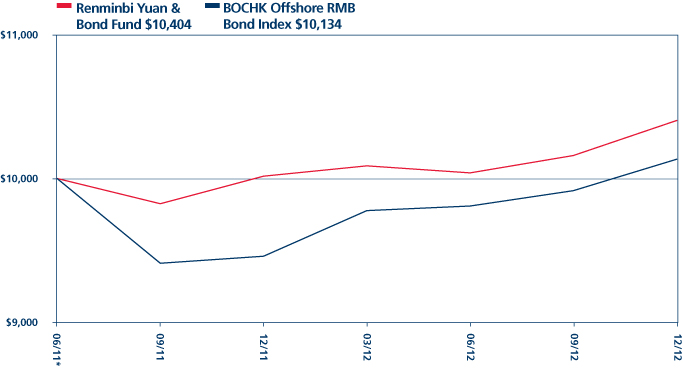
Average Annual Total Return
Periods Ended December 31, 2012
| One Year | | Since Inception
(06/30/11)* | |
| | 3.88 | % | | | 2.67 | % | |
*Inception date 6/30/11.
Performance data quoted represents past performance and does not guarantee future results. The investment return and principal value of an investment will fluctuate so that an investor's shares, when redeemed, may be worth more or less than their original cost. Current performance of the Fund may be lower or higher than the performance quoted. Performance data current to the most recent month end may be obtained by visiting www.gafunds.com.
Total returns reflect a fee waiver in effect and in the absence of this waiver, the total returns would be lower. The Fund imposes a 2% redemption fee on shares held less than 30 days.
The BOCHK Offshore RMB Bond Index tracks the total return performance of offshore renminbi (RMB)-denominated bonds that (i) are issued outside the Mainland of China; and (ii) satisfy a set of pre-specified and transparent eligibility criteria. It includes RMB-denominated bonds issued in the Hong Kong SAR presently and perhaps in other countries or regions in the future. The Index was launched on December 31, 2010 with a base value of 100.
58
FUND HIGHLIGHTS at December 31, 2012
GUINNESS ATKINSON RENMINBI YUAN & BOND FUND
# of Holdings in Portfolio: | | | 27 | | |
Portfolio Turnover: | | | 9.2 | % | |
% of Investments in Top 10: | | | 54.1 | % | |
Fund Managers:
Edmund Harriss | |
Tim Guinness | |
Top 10 Holdings (% of net assets) | | | | | | | |
Bank of China, 3.03%, 05/06/13 | | | 12.6 | % | | Renault S.A., 5.62%, 10/10/14 | | | 3.8 | % | |
Air Liquide Finance SA, 3.00%, 09/19/16 | | | 10.8 | % | | HSBC Bank PLC, 2.87%, 04/30/15 | | | 3.6 | % | |
BP Capital Markets PLC, 1.70%, 09/15/14 | | | 5.1 | % | | CNPC Golden Autumn Ltd, 2.55%, 10/26/13 | | | 3.6 | % | |
Caterpillar Financial Services Corp., 1.35%, 07/12/13 | | | 4.1 | % | | Global Logistic Properties Ltd, 3.37%, 05/11/16 | | | 3.3 | % | |
China Guangdong, 3.75%, 11/01/15 | | | 4.0 | % | | Volkswagen International Finance NV, 2.15%, 05/23/16 | | | 3.2 | % | |
Sector Breakdown (% of net assets) | | | | | | | |
Commercial Banks | | | 15.1 | % | | Oil Company - Exploration & Production | | | 3.6 | % | |
Industrial Gases | | | 10.8 | % | | Special Purpose Banks | | | 3.1 | % | |
Certificates of Deposit | | | 12.6 | % | | Food - Retail | | | 1.9 | % | |
Auto-Cars/Light Trucks | | | 7.8 | % | | Steel - Producers | | | 1.8 | % | |
Machinery | | | 5.0 | % | | Diversified Financial Services | | | 1.6 | % | |
Oil Company - Integrated | | | 5.1 | % | | Manufacturer | | | 1.1 | % | |
Real Estate Operator/Developer | | | 4.2 | % | | Casino Hotels | | | 0.9 | % | |
Electric - Integrated | | | 4.0 | % | | | | | |
59
SCHEDULE OF INVESTMENTS
December 31, 2012
GUINNESS ATKINSON RENMINBI YUAN & BOND FUND
Principal Amount (CNH) | | CORPORATE BONDS: 66.0% | | Value | |
Auto-Cars/Light Trucks: 9.4% | | | |
| | 15,000,000 | | | Renault S.A., 5.625%, 10/10/14 | | $ | 2,450,431 | | |
| | 6,000,000 | | | Renault S.A., 5.625%, 10/10/14 | | | 980,172 | | |
| | 18,000,000 | | | Volkswagen International Finance NV, 2.150%, 05/23/16 | | | 2,837,971 | | |
| | 4,000,000 | | | Volkswagen International Finance NV, 3.750%, 11/30/17 | | | 662,001 | | |
| | 9,000,000 | | | Volvo Treasury AB, 3.800%, 11/22/15 | | | 1,448,363 | | |
| | | | | | | | 8,378,938 | | |
Casino Hotels: 0.9% | | | |
| | 5,000,000 | | | Galaxy Entertainment, 4.625%, 12/16/13 | | | 806,767 | | |
Commerical Banks: 15.1% | | | |
| | 8,000,000 | | | Ag Bank Of China, 3.200%, 11/28/15 | | | 1,283,580 | | |
| | 10,000,000 | | | CCBL Funding PLC, 3.200%, 11/29/15 | | | 1,602,859 | | |
| | 20,000,000 | | | HSBC Bank PLC, 2.875%, 04/30/15 | | | 3,233,985 | | |
| | 6,000,000 | | | ICICI Bank Ltd., 4.900%, 09/21/15 | | | 983,531 | | |
| | 14,000,000 | | | ICICI Bank Ltd./Singapore, 4.900%, 09/21/15 | | | 2,294,907 | | |
| | 15,000,000 | | | Rabobank Nederland, 3.250%, 09/20/15 | | | 2,451,115 | | |
| | 10,000,000 | | | Societe Generale, 4.150%, 09/06/14 | | | 1,625,057 | | |
| | | | | | | | 13,475,034 | | |
Electric – Integrated: 4.0% | | | |
| | 22,000,000 | | | China Guangdong, 3.750%, 11/01/15 | | | 3,567,276 | | |
Food-Retail: 1.9% | | | |
| | 10,500,000 | | | Tesco PLC, 1.750%, 09/01/14 | | | 1,654,058 | | |
Industrial Gases: 10.8% | | | |
| | 60,000,000 | | | Air Liquide Finance SA, 3.000%, 09/19/16 | | | 9,682,524 | | |
Machinery: 5.0% | | | |
| | 23,000,000 | | | Caterpillar Financial Services Corp., 1.350%, 07/12/13 | | | 3,669,950 | | |
| | 5,000,000 | | | Caterpillar Financial Services Corp., 2.900%, 03/16/14 | | | 805,737 | | |
| | | | | | | | 4,475,687 | | |
Manufacturer: 1.1% | | | |
| | 6,500,000 | | | Singamas Container Holdings Ltd, 4.750%, 04/14/14 | | | 1,031,294 | | |
Oil Company – Exploration & Production: 3.6% | | | |
| | 20,000,000 | | | CNPC Golden Autumn Ltd, 2.550%, 10/26/13 | | | 3,202,271 | | |
Oil Company – Integrated: 5.1% | | | |
| | 29,000,000 | | | BP Capital Markets PLC, 1.700%, 09/15/14 | | | 4,593,924 | | |
Real Estate Operator/Developer: 4.2% | | | |
| | 5,000,000 | | | Central Plaza Devt, 7.600%, 11/29/15 | | | 845,513 | | |
| | 18,500,000 | | | Global Logistic Properties Ltd, 3.375%, 05/11/16 | | | 2,937,301 | | |
| | | | | | | | 3,782,814 | | |
The accompanying notes are an integral part of these financial statements.
60
Principal Amount (CNH) | | CORPORATE BONDS: 66.0% (Continued) | | Value | |
Special Purpose Banks: 3.1% | | | |
| | 7,000,000 | | | Export Import Bank of China, 3.350%, 6/18/17 | | $ | 1,126,795 | | |
| | 10,000,000 | | | Korea Development Bank, 3.300%, 06/21/15 | | | 1,611,950 | | |
| | | | | | | | 2,738,745 | | |
Steel – Producers: 1.8% | | | |
| | 10,000,000 | | | Shanghai Baosteel Group Corp., 3.125%, 12/01/13 | | | 1,606,550 | | |
| | | | | Total Corporate Bonds
(cost $58,008,788) | | | 58,995,882 | | |
| | | Short-Term Investments: 12.6% | | | |
Certificates of Deposit: 12.6% | | | |
| | 70,000,000 | | | Bank of China, 3.030%, 05/06/13 | | | 11,246,787 | | |
| | | | | Total Certificates of Deposit
(cost $11,212,558) | | | 11,246,787 | | |
| | | | | Total Investments in Securities
(cost $69,221,346): 78.6% | | | 70,242,669 | | |
Cash: 22.2% | | | |
| | 123,359,975 | | | China Yuan (Offshore): 22.2% | | | 19,820,046 | | |
| | | | | Liabilities in Excess of Other Assets: (0.8%) | | | (736,421 | ) | |
| | | | | Net Assets: 100.0% | | $ | 89,326,294 | | |
The accompanying notes are an integral part of these financial statements.
61
STATEMENTS OF ASSETS AND LIABILITIES
at December 31, 2012
| | | Alternative
Energy
Fund | | Asia
Focus
Fund | | Asia Pacific
Dividend
Fund | | China &
Hong Kong
Fund | |
Assets | |
Investments in securities, at cost | | $ | 31,039,852 | | | $ | 32,224,702 | | | $ | 3,738,257 | | | $ | 103,595,884 | | |
Investments in securities, at value | | $ | 13,056,392 | | | $ | 44,447,980 | | | $ | 4,807,062 | | | $ | 153,308,422 | | |
Cash | | | 41,750 | | | | 488,771 | | | | 62,148 | | | | — | | |
Cash denominated in foreign currency (cost of $0,
$2,453, $15,556, and $0, respectively) | | | — | | | | 2,456 | | | | 15,580 | | | | — | | |
Receivables: | |
Securities sold | | | — | | | | — | | | | — | | | | 989,859 | | |
Fund shares sold | | | 517 | | | | 109,952 | | | | 2,419 | | | | 117,694 | | |
Dividends and interest | | | 68,973 | | | | 12,337 | | | | 51 | | | | 10,031 | | |
Prepaid expenses | | | 2,491 | | | | 5,705 | | | | 1,568 | | | | 14,107 | | |
Total assets | | | 13,170,123 | | | | 45,067,201 | | | | 4,888,828 | | | | 154,440,113 | | |
Liabilities | |
Overdraft due to custodian bank | | | 78 | | | | — | | | | — | | | | 1,557,852 | | |
Payable for Fund shares redeemed | | | 42,979 | | | | 49,611 | | | | 11,660 | | | | 478,288 | | |
Due to Advisor, net | | | 13,737 | | | | 37,613 | | | | 1,020 | | | | 131,797 | | |
Accrued administration fees | | | 423 | | | | 2,105 | | | | 418 | | | | 4,525 | | |
Accrued shareholder servicing plan fees | | | 1,420 | | | | 12,103 | | | | 1,384 | | | | 46,407 | | |
Deferred trustees' compensation | | | 24,191 | | | | 47,535 | | | | 15,839 | | | | 96,297 | | |
Other accrued expenses | | | 46,792 | | | | 64,813 | | | | 33,045 | | | | 117,781 | | |
Total liabilities | | | 129,620 | | | | 213,780 | | | | 63,366 | | | | 2,432,947 | | |
Net Assets | | $ | 13,040,503 | | | $ | 44,853,421 | | | $ | 4,825,462 | | | $ | 152,007,166 | | |
Number of shares issued and outstanding
(unlimited shares authorized, no par value) | | | 5,270,901 | | | | 2,416,294 | | | | 356,956 | | | | 5,099,109 | | |
Net asset value per share | | $ | 2.47 | | | $ | 18.56 | | | $ | 13.52 | | | $ | 29.81 | | |
Composition of Net Assets | |
Paid-in capital | | $ | 114,671,086 | | | $ | 38,528,277 | | | $ | 7,982,905 | | | $ | 110,939,340 | | |
Undistributed net investment income (loss) | | | (29,155 | ) | | | 192,936 | | | | (20,525 | ) | | | 89,672 | | |
Accumulated net realized loss on investments and foreign currency | | | (83,617,981 | ) | | | (6,086,913 | ) | | | (4,205,746 | ) | | | (8,734,498 | ) | |
Net unrealized appreciation (depreciation) on: | |
Investments | | | (17,983,460 | ) | | | 12,223,278 | | | | 1,068,805 | | | | 49,712,538 | | |
Foreign currency | | | 13 | | | | (4,157 | ) | | | 23 | | | | 114 | | |
Net Assets | | $ | 13,040,503 | | | $ | 44,853,421 | | | $ | 4,825,462 | | | $ | 152,007,166 | | |
The accompanying notes are an integral part of these financial statements.
62
STATEMENTS OF ASSETS AND LIABILITIES
at December 31, 2012
| | | Global
Energy
Fund | | Global
Innovators
Fund | | Inflation
Managed
Dividend
FundTM | | Renminbi
Yuan & Bond
Fund | |
Assets | |
Investments in securities, at cost | | $ | 98,225,303 | | | $ | 35,866,253 | | | $ | 1,702,904 | | | $ | 69,221,346 | | |
Investments in securities, at value | | $ | 90,985,955 | | | $ | 32,314,589 | | | $ | 1,757,002 | | | $ | 70,242,669 | | |
Cash | | — | | — | | 26,756 | |
Cash denominated in foreign currency (cost of $0,
$0, $0, and $19,660,822, respectively) | | | — | | | | — | | | | — | | | | 19,820,046 | | |
Receivables: | |
Securities sold | | | 248,608 | | | | — | | | | — | | | | — | | |
Fund shares sold | | | 50,279 | | | | — | | | | 32,350 | | | | 215,850 | | |
Dividends and interest | | | 90,260 | | | | 53,110 | | | | 8,377 | | | | 444,405 | | |
Prepaid expenses | | | 17,914 | | | | 9,612 | | | | 7,788 | | | | 26,262 | | |
Total assets | | | 91,393,016 | | | | 32,377,311 | | | | 1,832,273 | | | | 90,749,232 | | |
Liabilities | |
Overdraft due to custodian bank | | | 488,554 | | | | 568,477 | | | | 2 | | | | 1,336,813 | | |
Payable for Fund shares redeemed | | | 406,889 | | | | 41,578 | | | | — | | | | 1,039 | | |
Due to Advisor, net | | | 62,667 | | | | 20,380 | | | | 19,768 | ‡ | | | 35,761 | | |
Accrued administration fees | | | 4,456 | | | | 1,372 | | | | 52 | | | | 3,085 | | |
Accrued shareholder servicing plan fees | | | 35,825 | | | | 6,993 | | | | 389 | | | | 12,165 | | |
Deferred trustees' compensation | | | 37,265 | | | | 58,812 | | | | 900 | | | | 7,401 | | |
Other accrued expenses | | | 84,842 | | | | 48,712 | | | | 17,543 | | | | 26,674 | | |
Total liabilities | | | 1,120,498 | | | | 746,324 | | | | 38,654 | | | | 1,422,938 | | |
Net Assets | | $ | 90,272,518 | | | $ | 31,630,987 | | | $ | 1,793,619 | | | $ | 89,326,294 | | |
Number of shares issued and outstanding
(unlimited shares authorized, no par value) | | | 3,446,982 | | | | 1,493,185 | | | | 140,145 | | | | 7,030,321 | | |
Net asset value per share | | $ | 26.19 | | | $ | 21.18 | | | $ | 12.80 | | | $ | 12.71 | | |
Composition of Net Assets | |
Paid-in capital | | $ | 101,381,461 | | | $ | 38,871,427 | | | $ | 1,734,154 | | | $ | 87,965,931 | | |
Undistributed net investment income (loss) | | | (589,492 | ) | | | 12,775 | | | | 1,599 | | | | 226,138 | | |
Accumulated net realized gain (loss) on investments and foreign currency | | | (3,278,345 | ) | | | (3,701,551 | ) | | | 3,738 | | | | (47,320 | ) | |
Net unrealized appreciation (depreciation) on: | |
Investments | | | (7,239,348 | ) | | | (3,551,664 | ) | | | 54,098 | | | | 1,021,323 | | |
Foreign currency | | | (1,758 | ) | | | — | | | | 30 | | | | 160,222 | | |
Net Assets | | $ | 90,272,518 | | | $ | 31,630,987 | | | $ | 1,793,619 | | | $ | 89,326,294 | | |
‡ Includes $23,281 of registration fees advanced by the Advisor.
The accompanying notes are an integral part of these financial statements.
63
STATEMENTS OF OPERATIONS
For the year ended December 31, 2012
| | | Alternative
Energy
Fund | | Asia
Focus
Fund | | Asia Pacific
Dividend
Fund | | China &
Hong Kong
Fund | |
Investment Income | |
Dividends * | | $ | 180,532 | | | $ | 1,467,394 | | | $ | 201,531 | | | $ | 4,526,442 | | |
Total income | | | 180,532 | | | | 1,467,394 | | | | 201,531 | | | | 4,526,442 | | |
Expenses | |
Advisory fees | | | 149,540 | | | | 450,885 | | | | 47,088 | | | | 1,584,488 | | |
Shareholder servicing plan fees | | | 29,468 | | | | 79,139 | | | | 8,476 | | | | 260,211 | | |
Transfer agent fees and expenses | | | 53,001 | | | | 42,124 | | | | 19,998 | | | | 144,500 | | |
Fund accounting fee and expenses | | | 26,501 | | | | 37,116 | | | | 25,999 | | | | 68,001 | | |
Administration fees | | | 5,992 | | | | 18,031 | | | | 1,883 | | | | 63,380 | | |
Custody fees and expenses | | | 7,499 | | | | 27,082 | | | | 7,499 | | | | 48,000 | | |
Audit fees | | | 18,000 | | | | 24,716 | | | | 17,600 | | | | 24,650 | | |
Legal fees | | | 5,002 | | | | 17,048 | | | | 1,501 | | | | 61,000 | | |
Registration fees | | | 12,998 | | | | 20,053 | | | | 16,002 | | | | 30,001 | | |
Printing | | | 14,000 | | | | 12,037 | | | | 4,999 | | | | 31,999 | | |
Trustees' fees and expenses | | | 9,999 | | | | 17,048 | | | | 9,000 | | | | 32,498 | | |
Insurance | | | 1,274 | | | | 3,126 | | | | 322 | | | | 10,998 | | |
CCO fees and expenses | | | 7,888 | | | | 10,997 | | | | 6,600 | | | | 22,213 | | |
Miscellaneous | | | 997 | | | | 1,504 | | | | 998 | | | | 4,001 | | |
Interest expense | | | 5,455 | | | | 5,238 | | | | 154 | | | | 9,600 | | |
Total expenses | | | 347,614 | | | | 766,144 | | | | 168,119 | | | | 2,395,540 | | |
Less: fees waived and expenses absorbed | | | (45,850 | ) | | | — | | | | (74,715 | ) | | | — | | |
Net expenses | | | 301,764 | | | | 766,144 | | | | 93,404 | | | | 2,395,540 | | |
Net investment income (loss) | | | (121,232 | ) | | | 701,250 | | | | 108,127 | | | | 2,130,902 | | |
Realized and Unrealized Gain (Loss) on Investments and Foreign Currency | |
Net realized gain (loss) on: | |
Investments | | | (781,828 | ) | | | (736,729 | ) | | | 120,630 | | | | (3,912,231 | ) | |
Foreign currency | | | 2,144 | | | | (6,733 | ) | | | 173 | | | | (283 | ) | |
| | | | (779,684 | ) | | | (743,462 | ) | | | 120,803 | | | | (3,912,514 | ) | |
Net unrealized appreciation (depreciation) on: | |
Investments | | | (1,661,165 | ) | | | 6,559,009 | | | | 752,656 | | | | 22,659,307 | | |
Foreign currency | | | 14,803 | | | | 49 | | | | (8 | ) | | | 34 | | |
| | | | (1,646,362 | ) | | | 6,559,058 | | | | 752,648 | | | | 22,659,341 | | |
Net increase from payments by affiliates | | | 853 | | | | — | | | | — | | | | — | | |
Net realized and unrealized gain (loss) on investments and foreign currency | | | (2,425,193 | ) | | | 5,815,596 | | | | 873,451 | | | | 18,746,827 | | |
Net Increase (Decrease) in Net Assets from Operations | | $ | (2,546,425 | ) | | $ | 6,516,846 | | | $ | 981,578 | | | $ | 20,877,729 | | |
* Net of foreign tax withheld of $20,798, $166,207, $19,574, and $239,938, respectively.
The accompanying notes are an integral part of these financial statements.
64
STATEMENTS OF OPERATIONS
For the year ended December 31, 2012
| | | Global
Energy
Fund | | Global
Innovators
Fund | | Inflation
Managed
Dividend
FundTM† | | Renminbi
Yuan & Bond
Fund | |
Investment Income | |
Dividends * | | $ | 2,522,533 | | | $ | 662,623 | | | $ | 45,055 | | | $ | — | | |
Interest | | | — | | | | — | | | | — | | | | 1,860,976 | | |
Total income | | | 2,522,533 | | | | 662,623 | | | | 45,055 | | | | 1,860,976 | | |
Expenses | |
Advisory fees | | | 962,838 | | | | 248,223 | | | | 5,016 | | | | 524,110 | | |
Shareholder servicing plan fees | | | 303,552 | | | | 46,645 | | | | 1,035 | | | | 94,662 | | |
Transfer agent fees and expenses | | | 115,000 | | | | 65,000 | | | | 10,727 | | | | 16,498 | | |
Fund accounting fee and expenses | | | 60,001 | | | | 27,999 | | | | 14,762 | | | | 41,234 | | |
Administration fees | | | 51,368 | | | | 13,239 | | | | 445 | | | | 38,117 | | |
Custody fees and expenses | | | 17,895 | | | | 3,999 | | | | 2,110 | | | | 17,975 | | |
Audit fees | | | 24,650 | | | | 24,650 | | | | 10,000 | | | | 17,802 | | |
Legal fees | | | 52,999 | | | | 12,001 | | | | 571 | | | | 38,710 | | |
Registration fees | | | 26,001 | | | | 14,999 | | | | 17,766 | | | | 16,002 | | |
Printing | | | 42,500 | | | | 11,501 | | | | 2,501 | | | | 5,501 | | |
Trustees' fees and expenses | | | 27,092 | | | | 14,001 | | | | 5,250 | | | | 20,101 | | |
Insurance | | | 10,032 | | | | 2,518 | | | | 52 | | | | 7,203 | | |
CCO fees and expenses | | | 21,287 | | | | 9,676 | | | | 4,516 | | | | 16,038 | | |
Offering costs | | | — | | | | — | | | | 3,272 | | | | 2,155 | | |
Miscellaneous | | | 6,093 | | | | 1,500 | | | | 806 | | | | 3,999 | | |
Interest expense | | | 9,645 | | | | 3,217 | | | | 21 | | | | 1,761 | | |
Total expenses | | | 1,730,953 | | | | 499,168 | | | | 78,850 | | | | 861,868 | | |
Less: fees waived and expenses absorbed | | | — | | | | | | | | (71,229 | ) | | | — | | |
Net expenses | | | 1,730,953 | | | | 499,168 | | | | 7,621 | | | | 861,868 | | |
Net investment income | | | 791,580 | | | | 163,455 | | | | 37,434 | | | | 999,108 | | |
Realized and Unrealized Gain (Loss) on Investments and Foreign Currency | |
Net realized gain (loss) on: | |
Investments | | | 948,292 | | | | 2,871,543 | | | | 3,738 | | | | 787,616 | | |
Foreign currency | | | (41,881 | ) | | | — | | | | 906 | | | | 571,822 | | |
| | | | 906,411 | | | | 2,871,543 | | | | 4,644 | | | | 1,359,438 | | |
Net unrealized appreciation (depreciation) on: | |
Investments | | | 3,019,512 | | | | 2,937,143 | | | | 54,098 | | | | 1,304,800 | | |
Foreign currency | | | 2,719 | | | | — | | | | 30 | | | | (243,357 | ) | |
| | | 3,022,231 | | | | 2,937,143 | | | | 54,128 | | | | 1,061,443 | | |
Net realized and unrealized gain on investments and foreign currency | | | 3,928,642 | | | | 5,808,686 | | | | 58,772 | | | | 2,420,881 | | |
Net Increase in Net Assets from Operations | | $ | 4,720,222 | | | $ | 5,972,141 | | | $ | 96,206 | | | $ | 3,419,989 | | |
* Net of foreign tax withheld of $266,101, $20,895, $3,028, and $0, respectively.
† For the period March 30, 2012 (inception date) to December 31, 2012.
The accompanying notes are an integral part of these financial statements.
65
STATEMENTS OF CHANGES IN NET ASSETS
| | | Alternative Energy Fund | | Asia Focus Fund | | Asia Pacific Dividend Fund | |
| | | Year Ended
December 31, 2012 | | Year Ended
December 31, 2011 | | Year Ended
December 31, 2012 | | Year Ended
December 31, 2011 | | Year Ended
December 31, 2012 | | Year Ended
December 31, 2011 | |
Increase/(decrease) in
net assets from: | |
Operations | |
Net investment income (loss) | | $ | (121,232 | ) | | $ | 352,418 | | | $ | 701,250 | | | $ | 524,580 | | | $ | 108,127 | | | $ | 140,334 | | |
Net realized gain (loss) on: | |
Investments | | | (781,828 | ) | | | (12,089,642 | ) | | | (736,729 | ) | | | (1,683,154 | ) | | | 120,630 | | | | (39,788 | ) | |
Foreign currency | | | 2,144 | | | | (76,896 | ) | | | (6,733 | ) | | | (12,420 | ) | | | 173 | | | | (4,518 | ) | |
Net change in unrealized
appreciation (depreciation) on: | |
Investments | | | (1,661,165 | ) | | | (2,954,894 | ) | | | 6,559,009 | | | | (12,954,702 | ) | | | 752,656 | | | | (941,879 | ) | |
Foreign currency | | | 14,803 | | | | (153 | ) | | | 49 | | | | (1,322 | ) | | | (8 | ) | | | (672 | ) | |
Net increase from payments
by affiliates | | | 853 | | | | — | | | | — | | | | — | | | | — | | | | — | | |
Net increase (decrease) in
net assets resulting
from operations | | | (2,546,425 | ) | | | (14,769,167 | ) | | | 6,516,846 | | | | (14,127,018 | ) | | | 981,578 | | | | (846,523 | ) | |
Distributions to Shareholders | |
From net investment income | | | (32,745 | ) | | | (300,549 | ) | | | (585,229 | ) | | | (300,042 | ) | | | (117,316 | ) | | | (133,958 | ) | |
Total distributions to
shareholders | | | (32,745 | ) | | | (300,549 | ) | | | (585,229 | ) | | | (300,042 | ) | | | (117,316 | ) | | | (133,958 | ) | |
Capital Transactions | |
Proceeds from shares sold | | | 2,056,290 | | | | 8,147,342 | | | | 2,119,393 | | | | 7,257,517 | | | | 559,935 | | | | 827,821 | | |
Reinvestment of distributions | | | 31,264 | | | | 284,072 | | | | 542,486 | | | | 280,174 | | | | 111,467 | | | | 125,151 | | |
Cost of shares repurchased | | | (4,030,304 | ) | | | (12,006,381 | ) | | | (9,557,136 | ) | | | (11,255,854 | ) | | | (1,242,158 | ) | | | (2,103,513 | ) | |
Redemption fee proceeds | | | 1,920 | | | | 2,041 | | | | 25 | | | | 3,670 | | | | 2 | | | | — | | |
Net change in net assets from
capital transactions | | | (1,940,830 | ) | | | (3,572,926 | ) | | | (6,895,232 | ) | | | (3,714,493 | ) | | | (570,754 | ) | | | (1,150,541 | ) | |
Total increase (decrease)
in net assets | | | (4,520,000 | ) | | | (18,642,642 | ) | | | (963,615 | ) | | | (18,141,553 | ) | | | 293,508 | | | | (2,131,022 | ) | |
Net Assets | |
Beginning of period | | | 17,560,503 | | | | 36,203,145 | | | | 45,817,036 | | | | 63,958,589 | | | | 4,531,954 | | | | 6,662,976 | | |
End of period | | $ | 13,040,503 | | | $ | 17,560,503 | | | $ | 44,853,421 | | | $ | 45,817,036 | | | $ | 4,825,462 | | | $ | 4,531,954 | | |
Accumulated net investment
income (loss) | | $ | (29,155 | ) | | $ | (66,032 | ) | | $ | 192,936 | | | $ | 83,648 | | | $ | (20,525 | ) | | $ | (17,496 | ) | |
Capital Share Activity | |
Shares sold | | | 778,024 | | | | 1,550,792 | | | | 121,708 | | | | 351,785 | | | | 44,401 | | | | 62,558 | | |
Shares issued on reinvestment | | | 12,813 | | | | 98,636 | | | | 29,709 | | | | 17,316 | | | | 8,971 | | | | 10,924 | | |
Shares redeemed | | | (1,544,024 | ) | | | (2,623,104 | ) | | | (558,880 | ) | | | (584,513 | ) | | | (100,055 | ) | | | (166,844 | ) | |
Net decrease in shares
outstanding | | | (753,187 | ) | | | (973,676 | ) | | | (407,463 | ) | | | (215,412 | ) | | | (46,683 | ) | | | (93,362 | ) | |
The accompanying notes are an integral part of these financial statements.
66
STATEMENTS OF CHANGES IN NET ASSETS
| | | China & Hong Kong Fund | | Global Energy Fund | | Global Innovators Fund | |
| | | Year Ended
December 31, 2012 | | Year Ended
December 31, 2011 | | Year Ended
December 31, 2012 | | Year Ended
December 31, 2011 | | Year Ended
December 31, 2012 | | Year Ended
December 31, 2011 | |
Increase/(decrease) in
net assets from: | |
Operations | |
Net investment income | | $ | 2,130,902 | | | $ | 2,294,652 | | | $ | 791,580 | | | $ | 729,106 | | | $ | 163,455 | | | $ | 88,570 | | |
Net realized gain (loss) on: | |
Investments | | | (3,912,231 | ) | | | (4,007,524 | ) | | | 948,292 | | | | (1,871,232 | ) | | | 2,871,543 | | | | (5,820,540 | ) | |
Foreign currency | | | (283 | ) | | | (6,210 | ) | | | (41,881 | ) | | | (17,768 | ) | | | — | | | | — | | |
Net change in unrealized
appreciation (depreciation) on: | |
Investments | | | 22,659,307 | | | | (58,741,199 | ) | | | 3,019,512 | | | | (29,179,143 | ) | | | 2,937,143 | | | | 3,263,403 | | |
Foreign currency | | | 34 | | | | 148 | | | | 2,719 | | | | (3,738 | ) | | | — | | | | — | | |
Net increase (decrease) in
net assets resulting
from operations | | | 20,877,729 | | | | (60,460,133 | ) | | | 4,720,222 | | | | (30,342,775 | ) | | | 5,972,141 | | | | (2,468,567 | ) | |
Distributions to Shareholders | |
From net investment income | | | (3,000,059 | ) | | | (1,088,646 | ) | | | (1,500,024 | ) | | | (600,511 | ) | | | (100,107 | ) | | | (78,408 | ) | |
From net realized gains | | | — | | | | (7,235,100 | ) | | | — | | | | — | | | | — | | | | — | | |
Total distributions to
shareholders | | | (3,000,059 | ) | | | (8,323,746 | ) | | | (1,500,024 | ) | | | (600,511 | ) | | | (100,107 | ) | | | (78,408 | ) | |
Capital Transactions | |
Proceeds from shares sold | | | 20,402,275 | | | | 23,988,630 | | | | 21,843,906 | | | | 123,498,806 | | | | 959,196 | | | | 6,606,455 | | |
Reinvestment of distributions | | | 2,921,167 | | | | 8,109,546 | | | | 1,458,196 | | | | 581,198 | | | | 97,437 | | | | 76,261 | | |
Cost of shares repurchased | | | (42,164,990 | ) | | | (53,159,985 | ) | | | (79,375,997 | ) | | | (68,102,501 | ) | | | (7,688,122 | ) | | | (9,898,210 | ) | |
Redemption fee proceeds | | | 11,531 | | | | 3,671 | | | | 9,488 | | | | 56,298 | | | | 21 | | | | 2,515 | | |
Net change in net assets from
capital transactions | | | (18,830,017 | ) | | | (21,058,138 | ) | | | (56,064,407 | ) | | | 56,033,801 | | | | (6,631,468 | ) | | | (3,212,979 | ) | |
Total increase (decrease)
in net assets | | | (952,347 | ) | | | (89,842,017 | ) | | | (52,844,209 | ) | | | 25,090,515 | | | | (759,434 | ) | | | (5,759,954 | ) | |
Net Assets | |
Beginning of period | | | 152,959,513 | | | | 242,801,530 | | | | 143,116,727 | | | | 118,026,212 | | | | 32,390,421 | | | | 38,150,375 | | |
End of period | | $ | 152,007,166 | | | $ | 152,959,513 | | | $ | 90,272,518 | | | $ | 143,116,727 | | | $ | 31,630,987 | | | $ | 32,390,421 | | |
Accumulated net investment
income (loss) | | $ | 89,672 | | | $ | 959,112 | | | $ | (589,492 | ) | | $ | (38,834 | ) | | $ | 12,775 | | | $ | (50,573 | ) | |
Capital Share Activity | |
Shares sold | | | 712,765 | | | | 690,005 | | | | 820,901 | | | | 3,939,920 | | | | 48,744 | | | | 331,956 | | |
Shares issued on reinvestment | | | 99,495 | | | | 305,100 | | | | 56,041 | | | | 22,676 | | | | 4,638 | | | | 4,287 | | |
Shares redeemed | | | (1,467,538 | ) | | | (1,504,412 | ) | | | (2,995,145 | ) | | | (2,366,541 | ) | | | (387,704 | ) | | | (516,774 | ) | |
Net increase (decrease) in
shares outstanding | | | (655,278 | ) | | | (509,307 | ) | | | (2,118,203 | ) | | | 1,596,055 | | | | (334,322 | ) | | | (180,531 | ) | |
The accompanying notes are an integral part of these financial statements.
67
STATEMENTS OF CHANGES IN NET ASSETS
| | | Inflation Managed Dividend FundTM | | Renminbi Yuan & Bond Fund | |
| | | For the period March 30, 2012+
to December 31, 2012 | | Year Ended
December 31, 2012 | | For the period
June 30, 2011+ to
December 31, 2011 | |
Increase/(decrease) in net assets from: | |
Operations | |
Net investment income | | $ | 37,434 | | | $ | 999,108 | | | $ | 12,226 | | |
Net realized gain (loss) on: | |
Investments | | | 3,738 | | | | 787,616 | | | | (42,819 | ) | |
Foreign currency | | | 906 | | | | 571,822 | | | | (315,628 | ) | |
Net change in unrealized appreciation (depreciation) on: | |
Investments | | | 54,098 | | | | 1,304,800 | | | | (283,477 | ) | |
Foreign currency | | | 30 | | | | (243,357 | ) | | | 403,579 | | |
Net increase (decrease) in net assets resulting from operations | | | 96,206 | | | | 3,419,989 | | | | (226,119 | ) | |
Distributions to Shareholders | |
From net investment income | | | (36,741 | ) | | | (2,095,737 | ) | | | — | | |
Total distributions to shareholders | | | (36,741 | ) | | | (2,095,737 | ) | | | — | | |
Capital Transactions | |
Proceeds from shares sold | | | 2,583,826 | | | | 13,773,598 | | | | 96,086,295 | | |
Reinvestment of distributions | | | 36,392 | | | | 2,080,658 | | | | — | | |
Cost of shares repurchased | | | (886,064 | ) | | | (20,582,714 | ) | | | (3,134,355 | ) | |
Redemption fee proceeds | | | — | | | | 3,167 | | | | 1,512 | | |
Net change in net assets from capital transactions | | | 1,734,154 | | | | (4,725,291 | ) | | | 92,953,452 | | |
Total increase (decrease) in net assets | | | 1,793,619 | | | | (3,401,039 | ) | | | 92,727,333 | | |
Net Assets | |
Beginning of period | | | — | | | | 92,727,333 | | | | — | | |
End of period | | $ | 1,793,619 | | | $ | 89,326,294 | | | $ | 92,727,333 | | |
Accumulated net investment income (loss) | | $ | 1,599 | | | $ | 226,138 | | | $ | (83,991 | ) | |
Capital Share Activity | |
Shares sold | | | 209,158 | | | | 1,090,531 | | | | 7,660,903 | | |
Shares issued on reinvestment | | | 2,899 | | | | 164,436 | | | | — | | |
Shares redeemed | | | (71,912 | ) | | | (1,633,857 | ) | | | (251,692 | ) | |
Net increase (decrease) in shares outstanding | | | 140,145 | | | | (378,890 | ) | | | 7,409,211 | | |
+ The Inflation Managed Dividend Fund and the Renminbi Yuan & Bond Fund commenced operations on March 30, 2012 and June 30, 2011, respectively.
The accompanying notes are an integral part of these financial statements.
68
FINANCIAL HIGHLIGHTS
For a capital share outstanding throughout the year
| | | Year Ended December 31, | |
Alternative Energy Fund | | 2012 | | 2011 | | 2010 | | 2009 | | 2008 | |
Net asset value, beginning of period | | $ | 2.92 | | | $ | 5.17 | | | $ | 6.62 | | | $ | 5.14 | | | $ | 16.25 | | |
Income from investment operations: | |
Net investment income (loss) | | | (0.02 | ) | | | 0.06 | | | | (0.05 | ) | | | (0.05 | ) | | | (0.10 | ) | |
Net realized and unrealized gain (loss)
on investments and foreign currency | | | (0.42 | ) | | | (2.26 | ) | | | (1.40 | ) | | | 1.77 | | | | (10.64 | ) | |
Total from investment operations | | | (0.44 | ) | | | (2.20 | ) | | | (1.45 | ) | | | 1.72 | | | | (10.74 | ) | |
Less distributions: | |
From net investment income | | | (0.01 | ) | | | (0.05 | ) | | | — | | | | — | | | | (0.01 | ) | |
From net realized gain | | | — | | | | — | | | | — | | | | — | | | | (0.37 | ) | |
Return of capital | | | — | | | | — | | | | — | | | | (0.24 | ) | | | — | | |
Total distributions | | | (0.01 | ) | | | (0.05 | ) | | | — | | | | (0.24 | ) | | | (0.38 | ) | |
Redemption fee proceeds | | | — | (1) | | | — | (1) | | | — | (1) | | | — | (1) | | | 0.01 | | |
Net asset value, end of period | | $ | 2.47 | | | $ | 2.92 | | | $ | 5.17 | | | $ | 6.62 | | | $ | 5.14 | | |
Total return | | | (15.20 | )% | | | (42.53 | )% | | | (21.90 | )% | | | 33.42 | % | | | (66.05 | )% | |
Ratios/supplemental data: | |
Net assets, end of period (millions) | | $ | 13.0 | | | $ | 17.6 | | | $ | 36.2 | | | $ | 62.1 | | | $ | 47.1 | | |
Ratio of expenses to average net assets: | |
Before fee waived | | | 2.32 | % | | | 1.81 | % | | | 1.76 | % | | | 1.85 | % | | | 1.69 | % | |
After fees waived | | | 2.02 | % | | | 1.81 | % | | | 1.76 | % | | | 1.85 | % | | | 1.69 | % | |
| After fees waived excluding interest expense(2) | | | 1.98 | % | | | 1.79 | % | | | 1.73 | % | | | 1.85 | % | | | 1.67 | % | |
Ratio of net investment income (loss) to average net assets: | |
Before fees waived | | | (1.11 | )% | | | 1.11 | % | | | (0.86 | )% | | | (0.98 | )% | | | (0.80 | )% | |
After fees waived | | | (0.81 | )% | | | 1.11 | % | | | (0.86 | )% | | | (0.98 | )% | | | (0.80 | )% | |
Portfolio turnover rate | | | 7.80 | % | | | 43.10 | % | | | 24.74 | % | | | 47.10 | % | | | 94.76 | % | |
(1) Amount represents less than $0.01 per share.
(2) The Advisor has contractually agreed to limit the operating expenses of the Fund to 1.98%, excluding interest expense, expenses related to dividends on short positions, brokerage commissions, taxes and other extraordinary expenses. See Note 3.
The accompanying notes are an integral part of these financial statements.
69
FINANCIAL HIGHLIGHTS
For a capital share outstanding throughout the year
| | | Year Ended December 31, | |
Asia Focus Fund | | 2012 | | 2011 | | 2010 | | 2009 | | 2008 | |
Net asset value, beginning of period | | $ | 16.23 | | | $ | 21.04 | | | $ | 17.63 | | | $ | 9.52 | | | $ | 23.96 | | |
Income from investment operations: | |
Net investment income | | | 0.30 | | | | 0.18 | | | | 0.12 | | | | 0.06 | (1) | | | 0.55 | | |
Net realized and unrealized gain (loss)
on investments and foreign currency | | | 2.28 | | | | (4.88 | ) | | | 3.45 | | | | 8.13 | | | | (14.30 | ) | |
Total from investment operations | | | 2.58 | | | | (4.70 | ) | | | 3.57 | | | | 8.19 | | | | (13.75 | ) | |
Less distributions: | |
From net investment income | | | (0.25 | ) | | | (0.11 | ) | | | (0.19 | ) | | | (0.08 | ) | | | (0.69 | ) | |
Total distributions | | | (0.25 | ) | | | (0.11 | ) | | | (0.19 | ) | | | (0.08 | ) | | | (0.69 | ) | |
Redemption fee proceeds | | | — | (2) | | | — | (2) | | | 0.03 | | | | — | (2) | | | — | (2) | |
Net asset value, end of period | | $ | 18.56 | | | $ | 16.23 | | | $ | 21.04 | | | $ | 17.63 | | | $ | 9.52 | | |
Total return | | | 15.89 | % | | | (22.35 | )% | | | 20.43 | % | | | 86.05 | % | | | (57.38 | )% | |
Ratios/supplemental data: | |
Net assets, end of period (millions) | | $ | 44.9 | | | $ | 45.8 | | | $ | 64.4 | | | $ | 112.4 | | | $ | 21.8 | | |
Ratio of expenses to average net assets: | |
Before fees waived | | | 1.70 | % | | | 1.59 | % | | | 1.67 | % | | | 1.68 | % | | | 1.75 | % | |
After fees waived | | | 1.70 | % | | | 1.59 | % | | | 1.67 | % | | | 1.68 | % | | | 1.75 | % | |
| After fees waived excluding interest expense(3) | | | 1.69 | % | | | 1.59 | % | | | 1.65 | % | | | 1.68 | % | | | 1.70 | % | |
Ratio of net investment income to average net assets: | |
Before fees waived | | | 1.56 | % | | | 0.89 | % | | | 0.77 | % | | | 0.73 | % | | | 2.55 | % | |
After fees waived | | | 1.56 | % | | | 0.89 | % | | | 0.77 | % | | | 0.73 | % | | | 2.55 | % | |
Portfolio turnover rate | | | 10.90 | % | | | 7.79 | % | | | 25.44 | % | | | 31.35 | % | | | 28.89 | % | |
(1) Based on average shares outstanding during the period.
(2) Amount represents less than $0.01 per share.
(3) The Advisor has contractually agreed to limit the operating expenses of the Fund to 1.98%, excluding interest expense, expenses related to dividends on short positions, borkerage commissions, taxes and other extraordinary expenses. See Note 3.
The accompanying notes are an integral part of these financial statements.
70
FINANCIAL HIGHLIGHTS
For a capital share outstanding throughout the year
| | | Year Ended December 31, | |
Asia Pacific Dividend Fund | | 2012 | | 2011 | | 2010 | | 2009 | | 2008 | |
Net asset value, beginning of period | | $ | 11.23 | | | $ | 13.41 | | | $ | 11.03 | | | $ | 7.00 | | | $ | 16.75 | | |
Income from investment operations: | |
Net investment income | | | 0.30 | | | | 0.30 | | | | 0.17 | | | | 0.18 | (1) | | | 0.75 | | |
Net realized and unrealized gain (loss)
on investments and foreign currency | | | 2.31 | | | | (2.18 | ) | | | 2.41 | | | | 4.32 | | | | (9.22 | ) | |
Total from investment operations | | | 2.61 | | | | (1.88 | ) | | | 2.58 | | | | 4.50 | | | | (8.47 | ) | |
Less distributions: | |
From net investment income | | | (0.32 | ) | | | (0.30 | ) | | | (0.20 | ) | | | (0.18 | ) | | | (0.51 | ) | |
From net realized gain | | | — | | | | — | | | | — | | | | — | | | | (0.78 | ) | |
Return of capital | | | — | | | | — | | | | — | | | | (0.29 | ) | | | — | | |
Total distributions | | | (0.32 | ) | | | (0.30 | ) | | | (0.20 | ) | | | (0.47 | ) | | | (1.29 | ) | |
Redemption fee proceeds | | | — | (2) | | | — | | | | — | (2) | | | — | (2) | | | 0.01 | | |
Net asset value, end of period | | $ | 13.52 | | | $ | 11.23 | | | $ | 13.41 | | | $ | 11.03 | | | $ | 7.00 | | |
Total return | | | 23.48 | % | | | (14.04 | )% | | | 23.65 | % | | | 64.84 | % | | | (51.74 | )% | |
Ratios/supplemental data: | |
Net assets, end of period (millions) | | $ | 4.8 | | | $ | 4.5 | | | $ | 6.7 | | | $ | 11.4 | | | $ | 5.3 | | |
Ratio of expenses to average net assets: | |
Before fees waived | | | 3.57 | % | | | 3.26 | % | | | 2.92 | % | | | 2.93 | % | | | 2.33 | % | |
After fees waived | | | 1.98 | % | | | 1.98 | % | | | 2.01 | % | | | 1.98 | % | | | 2.10 | % | |
| After fees waived excluding interest expense(3) | | | 1.98 | % | | | 1.98 | % | | | 1.98 | % | | | 1.98 | % | | | 1.98 | % | |
Ratio of net investment income to average net assets: | |
Before fees waived | | | 0.71 | % | | | 1.13 | % | | | 0.38 | % | | | 1.23 | % | | | 3.71 | % | |
After fees waived | | | 2.30 | % | | | 2.41 | % | | | 1.29 | % | | | 2.18 | % | | | 3.94 | % | |
Portfolio turnover rate | | | 10.19 | % | | | 10.67 | % | | | 27.20 | % | | | 26.03 | % | | | 48.02 | % | |
(1) Based on average shares outstanding during the period.
(2) Amount represents less than $0.01 per share.
(3) The Advisor has contractually agreed to limit the operating expenses of the Fund to 1.98%, excluding interest expense, expenses related to dividends on short positions, brokerage commissions, taxes and other extraordinary expenses. See Note 3.
The accompanying notes are an integral part of these financial statements.
71
FINANCIAL HIGHLIGHTS
For a capital share outstanding throughout the year
| | | Year Ended December 31, | |
China & Hong Kong Fund | | 2012 | | 2011 | | 2010 | | 2009 | | 2008 | |
Net asset value, beginning of period | | $ | 26.58 | | | $ | 38.76 | | | $ | 35.13 | | | $ | 18.98 | | | $ | 43.02 | | |
Income from investment operations: | |
Net investment income | | | 0.45 | | | | 0.39 | | | | 0.27 | | | | 0.15 | | | | 0.68 | | |
Net realized and unrealized gain (loss)
on investments and foreign currency | | | 3.37 | | | | (11.06 | ) | | | 5.10 | | | | 17.44 | | | | (24.13 | ) | |
Total from investment operations | | | 3.82 | | | | (10.67 | ) | | | 5.37 | | | | 17.59 | | | | (23.45 | ) | |
Less distributions: | |
From net investment income | | | (0.59 | ) | | | (0.20 | ) | | | (0.38 | ) | | | (0.34 | ) | | | (0.53 | ) | |
From net realized gain | | | — | | | | (1.31 | ) | | | (1.38 | ) | | | (1.11 | ) | | | (0.07 | ) | |
Total distributions | | | (0.59 | ) | | | (1.51 | ) | | | (1.76 | ) | | | (1.45 | ) | | | (0.60 | ) | |
Redemption fee proceeds | | | — | (1) | | | — | (1) | | | 0.02 | | | | 0.01 | | | | 0.01 | | |
Net asset value, end of period | | $ | 29.81 | | | $ | 26.58 | | | $ | 38.76 | | | $ | 35.13 | | | $ | 18.98 | | |
Total return | | | 14.42 | % | | | (27.52 | )% | | | 15.38 | % | | | 92.76 | % | | | (54.47 | )% | |
Ratios/supplemental data: | |
Net assets, end of period (millions) | | $ | 152.0 | | | $ | 153.0 | | | $ | 242.8 | | | $ | 241.0 | | | $ | 123.3 | | |
Ratio of expenses to average net assets | |
Before fees waived | | | 1.51 | % | | | 1.53 | % | | | 1.48 | % | | | 1.58 | % | | | 1.52 | % | |
After fees waived | | | 1.51 | % | | | 1.53 | % | | | 1.48 | % | | | 1.58 | % | | | 1.52 | % | |
| After fees waived excluding interest expense(2) | | | 1.51 | % | | | 1.52 | % | | | 1.47 | % | | | 1.58 | % | | | 1.51 | % | |
Ratio of net investment income to average net assets | | | 1.34 | % | | | 1.14 | % | | | 0.62 | % | | | 0.62 | % | | | 2.22 | % | |
Portfolio turnover rate | | | 3.85 | % | | | 7.81 | % | | | 32.35 | % | | | 7.87 | % | | | 26.62 | % | |
(1) Amount represents less than $0.01 per share.
(2) The Advisor has contractually agreed to limit the operating expenses of the Fund to 1.98%, excluding interest expense, expenses related to dividends on short positions, borkerage commissions, taxes and other extraordinary expenses. See Note 3.
The accompanying notes are an integral part of these financial statements.
72
FINANCIAL HIGHLIGHTS
For a capital share outstanding throughout the year
| | | Year Ended December 31, | |
Global Energy Fund | | 2012 | | 2011 | | 2010 | | 2009 | | 2008 | |
Net asset value, beginning of period | | $ | 25.72 | | | $ | 29.74 | | | $ | 25.60 | | | $ | 15.68 | | | $ | 31.86 | | |
Income from investment operations: | |
Net investment income | | | 0.22 | | | | 0.14 | | | | 0.12 | | | | 0.11 | | | | 0.22 | | |
Net realized and unrealized gain (loss)
on investments and foreign currency | | | 0.69 | | | | (4.06 | ) | | | 4.13 | | | | 9.80 | | | | (15.71 | ) | |
Total from investment operations | | | 0.91 | | | | (3.92 | ) | | | 4.25 | | | | 9.91 | | | | (15.49 | ) | |
Less distributions: | |
From net investment income | | | (0.44 | ) | | | (0.11 | ) | | | (0.12 | ) | | | — | | | | — | | |
From net realized gain | | | — | | | | — | | | | — | | | | — | | | | (0.70 | ) | |
Total distributions | | | (0.44 | ) | | | (0.11 | ) | | | (0.12 | ) | | | — | | | | (0.70 | ) | |
Redemption fee proceeds | | | — | (1) | | | 0.01 | | | | 0.01 | | | | 0.01 | | | | 0.01 | | |
Net asset value, end of period | | $ | 26.19 | | | $ | 25.72 | | | $ | 29.74 | | | $ | 25.60 | | | $ | 15.68 | | |
Total return | | | 3.53 | % | | | (13.16 | )% | | | 16.63 | % | | | 63.27 | % | | | (48.56 | )% | |
Ratios/supplemental data: | |
Net assets, end of period (millions) | | $ | 90.3 | | | $ | 143.1 | | | $ | 118.0 | | | $ | 75.4 | | | $ | 30.2 | | |
Ratio of expenses to average net assets | |
Before fees waived | | | 1.35 | % | | | 1.27 | % | | | 1.25 | % | | | 1.42 | % | | | 1.31 | % | |
After fees waived | | | 1.35 | % | | | 1.27 | % | | | 1.25 | % | | | 1.42 | % | | | 1.31 | % | |
| After fees waived excluding interest expense(2) | | | 1.34 | % | | | 1.27 | % | | | 1.25 | % | | | 1.42 | % | | | 1.30 | % | |
Ratio of net investment income to average net assets | | | 0.62 | % | | | 0.43 | % | | | 0.46 | % | | | 0.82 | % | | | 0.76 | % | |
Portfolio turnover rate | | | 14.02 | % | | | 28.23 | % | | | 42.08 | % | | | 51.74 | % | | | 74.90 | % | |
(1) Amount represents less than $0.01 per share.
(2) The Advisor has contractually agreed to limit the operating expenses of the Fund to 1.45%, excluding interest expense, expenses related to dividends on short positions, brokerage commissions, taxes and other extraordinary expenses. See Note 3.
The accompanying notes are an integral part of these financial statements.
73
FINANCIAL HIGHLIGHTS
For a capital share outstanding throughout the year
| | | Year Ended December 31, | |
Global Innovators Fund | | 2012 | | 2011 | | 2010 | | 2009 | | 2008 | |
Net asset value, beginning of period | | $ | 17.72 | | | $ | 19.00 | | | $ | 16.24 | | | $ | 11.21 | | | $ | 21.68 | | |
Income from investment operations: | |
Net investment income (loss) | | | 0.11 | | | | 0.04 | | | | (0.05 | ) | | | (0.01 | ) | | | 0.62 | | |
Net realized and unrealized gain (loss)
on investments | | | 3.42 | | | | (1.28 | ) | | | 2.81 | | | | 5.08 | | | | (10.48 | ) | |
Total from investment operations | | | 3.53 | | | | (1.24 | ) | | | 2.76 | | | | 5.07 | | | | (9.86 | ) | |
Less distributions: | |
From net investment income | | | (0.07 | ) | | | (0.04 | ) | | | — | | | | — | | | | (0.61 | ) | |
Return of capital | | | — | | | | — | | | | — | | | | (0.04 | ) | | | — | | |
Total distributions | | | (0.07 | ) | | | (0.04 | ) | | | — | | | | (0.04 | ) | | | (0.61 | ) | |
Redemption fee proceeds | | | — | (1) | | | — | (1) | | | — | (1) | | | — | (1) | | | — | (1) | |
Net asset value, end of period | | $ | 21.18 | | | $ | 17.72 | | | $ | 19.00 | | | $ | 16.24 | | | $ | 11.21 | | |
Total return | | | 19.91 | % | | | (6.51 | )% | | | 17.00 | % | | | 45.20 | % | | | (45.42 | )% | |
Ratios/supplemental data: | |
Net assets, end of period (millions) | | $ | 31.6 | | | $ | 32.4 | | | $ | 38.2 | | | $ | 36.7 | | | $ | 29.6 | | |
Ratio of expenses to average net assets: | |
Before fees waived/recaptured | | | 1.51 | % | | | 1.42 | % | | | 1.47 | % | | | 1.68 | % | | | 1.40 | % | |
After fees waived/recaptured | | | 1.51 | % | | | 1.44 | % | | | 1.55 | % | | | 1.56 | % | | | 1.40 | % | |
| After fees waived/recapture excluding interest expense(4) | | | 1.50 | % | | | 1.44 | % | | | 1.55 | % | | | 1.55 | % | | | 1.39 | % | |
Ratio of net investment income (loss) to average net assets: | |
Before fees waived/recaptured | | | 0.49 | % | | | 0.26 | % | | | (0.16 | )% | | | (0.20 | )% | | | 3.07 | % | |
After fees waived/recaptured | | | 0.49 | % | | | 0.24 | % | | | (0.24 | )% | | | (0.07 | )% | | | 3.07 | % | |
Portfolio turnover rate | | | 6.02 | % | | | 47.40 | % | | | 56.97 | % | | | 50.54 | % | | | 36.49 | % | |
(1) Amount represents less than $0.01 per share.
(2) The Advisor has contractually agreed to limit the operating expenses of the Fund to 1.55%, excluding interest expense, expenses related to dividends on short positions, borkerage commissions, taxes and other extraordinary expenses. See Note 3.
The accompanying notes are an integral part of these financial statements.
74
FINANCIAL HIGHLIGHTS
For a capital share outstanding throughout the period
Inflation Managed Dividend FundTM | | March 30, 2012(1)
Through
December 31, 2012* | |
Net asset value, beginning of period | | $ | 12.50 | | |
Income from investment operations: | |
Net investment income | | | 0.31 | | |
Net realized and unrealized gain (loss) on investments and foreign currency | | | 0.30 | | |
Total from investment operations | | | 0.61 | | |
Less distributions: | |
From net investment income | | | (0.31 | ) | |
Total distributions | | | (0.31 | ) | |
Redemption fee proceeds | | | — | | |
Net asset value, end of period | | $ | 12.80 | | |
Total return | | | 4.97 | %(2) | |
Ratios/supplemental data: | |
Net assets, end of period (millions) | | $ | 1.8 | | |
Ratio of expenses to average net assets: | |
Before fees waived | | | 7.05 | %(3) | |
After fees waived | | | 0.68 | %(3) | |
| After fees waived excluding interest expense(4) | | | 0.68 | %(3) | |
Ratio of net investment income (loss) to average net assets: | |
Before fees waived/recaptured | | | (3.02 | )%(3) | |
After fees waived/recaptured | | | 3.35 | %(3) | |
Portfolio turnover rate | | | 13.33 | %(2) | |
(1) Commencement of Operations.
(2) Not annualized.
(3) Annualized.
(4) The Advisor has contractually agreed to limit the operating expenses of the Fund to 0.68%, excluding interest expense, expenses related to dividends on short positions, brokerage commissions, taxes and other extraordinary expenses. See Note 3.
The accompanying notes are an integral part of these financial statements.
75
FINANCIAL HIGHLIGHTS
For a capital share outstanding throughout the period
Renminbi Yuan & Bond Fund | | Year Ended
December 31, 2012 | | June 30, 2011(1)
Through
December 31, 2011 | |
Net asset value, beginning of period | | $ | 12.52 | | | $ | 12.50 | | |
Income from investment operations: | |
Net investment income | | | 0.12 | | | | — | (2) | |
Net realized and unrealized gain (loss) on investments and foreign currency | | | 0.36 | | | | 0.02 | | |
Total from investment operations | | | 0.48 | | | | 0.02 | | |
Less distributions: | |
From net investment income | | | (0.29 | ) | | | — | | |
Total distributions | | | (0.29 | ) | | | — | | |
Redemption fee proceeds | | | — | (2) | | | — | (2) | |
Net asset value, end of period | | $ | 12.71 | | | $ | 12.52 | | |
Total return | | | 3.88 | % | | | 0.16 | %(3) | |
Ratios/supplemental data: | |
Net assets, end of period (millions) | | $ | 89.3 | | | $ | 92.7 | | |
Ratio of expenses to average net assets: | |
Before fees waived/recaptured | | | 0.90 | % | | | 0.92 | %(4) | |
After fees waived/recaptured | | | 0.90 | % | | | 0.90 | %(4) | |
| After fees waived/recaptured excluding interest expense(5) | | | 0.90 | % | | | 0.90 | %(4) | |
Ratio of net investment income to average net assets: | |
Before fees waived/recaptured | | | 1.05 | % | | | 0.02 | %(4) | |
After fees waived/recaptured | | | 1.05 | % | | | 0.04 | %(4) | |
Portfolio turnover rate | | | 9.19 | % | | | 0.72 | %(3)† | |
† Restated
(1) Commencement of Operations.
(2) Amount represents less than $0.01 per share.
(3) Not annualized.
(4) Annualized.
(5) The Advisor has contractually agreed to limit the operating expenses of the Fund to 0.90%, excluding interest expense, expenses related to dividends on short positions, brokerage commissions, taxes and other extraordinary expenses. See Note 3.
The accompanying notes are an integral part of these financial statements.
76
NOTES TO FINANCIAL STATEMENTS
Note 1
Organization
Guinness AtkinsonTM Funds (the "Trust"), was organized on April 28, 1997 as a Delaware business trust and registered under the Investment Company Act of 1940, as amended (the "1940 Act"), as an open-end management investment company. Currently, the Trust offers eight separate series: Guinness Atkinson Alternative Energy Fund (the "Alternative Energy Fund"), Guinness Atkinson Asia Focus Fund (the "Asia Focus Fund"), Guinness Atkinson Asia Pacific Dividend Fund (the "Asia Pacific Dividend Fund"), Guinness Atkinson China & Hong Kong Fund (the "China & Hong Kong Fund"), Guinness Atkinson Global Energy Fund (the "Global Energy Fund"), Guinness Atkinson Global Innovators Fund (the "Global Innovators Fund"), Guinness Atkinson Inflation Managed Dividend FundTM (the "Inflation Managed Dividend FundTM") and Guinness Atkinson Renminbi Yuan & Bond Fund (the "Renminbi Yuan & Bond Fund"), all of which (each a "Fund" and collectively, the "Funds") are covered by this report. Except for the Inflation Managed Dividend FundTM, each Fund is a non-diversified Fund. The China & Hong Kong Fund began operations on June 30, 1994, the Asia Focus Fund began operations on April 29, 1996, the Global Innovators Fund began operations on December 15, 1998, the Global Energy Fund began operations on June 30, 2004, the Alternative Energy Fund and the Asia Pacific Dividend Fund began operations on March 31, 2006, the Renminbi Yuan & Bond Fund began operations on June 30, 2011, and the Inflation Managed Dividend FundTM began operations on March 30, 2012.
The Alternative Energy Fund's and Asia Focus Fund's investment objective is long-term capital appreciation. The Asia Pacific Dividend Fund's investment objective is to provide investors with dividend income and long-term capital growth. The China & Hong Kong Fund's investment objective is long-term capital appreciation primarily through investments in securities of China and Hong Kong. The Global Energy Fund's and Global Innovators Fund's investment objective is long-term capital appreciation. The Renminbi Yuan & Bond Fund's investment objective is to seek total return. Total return means the combination of capital appreciation and investment income, which includes changes in the value of the renminbi, the currency of China of which the yuan is the unit. The Inflation Managed Dividend Fund's investment objective is to seek a moderate level of current income and consistent dividend growth at a rate that exceeds inflation.
Note 2
Significant accounting policies
The following is a summary of significant accounting policies consistently followed by the Funds. These policies are in conformity with accounting principles generally accepted in the United States of America.
A. Security Valuation. Securities of the Funds that are traded on a principal exchange (U.S. or foreign) or NASDAQ are valued at the official closing price on each day that the exchanges are open for trading. Securities traded on an exchange for which there have been no sales, and other over-the-counter securities are valued at the mean between the bid and asked prices. Debt securities are valued based on available market quotations received from an independent pricing service approved by the Trust's Board of Trustees which may utilize both transaction data and market information such as yield, prices of securities of comparable quality, coupon rate, maturity, type of issue, trading characteristics and other market data. Securities for which quotations are not readily available are valued at their respective fair values as determined in good faith by the Investment Advisor in accordance with procedures established by the Board of Trustees. In determining fair value, the Funds take into account all relevant factors and available information. Consequently, the price of the security used to calculate its Net Asset Value may differ from quoted or published prices for the same security. Fair value pricing involves subjective judgments and there is no single standard for determining a security's fair value. As a result, different mutual funds could reasonably arrive at different fair value for the same security. It is possible that the fair value determined for a security is materially different from the value that could be realized upon the sale of that security or from the values that other mutual funds may determine. Short-term investments are stated at cost, combined with accrued interest, which approximates market value. Realized gains and losses from securities transactions are calculated using the identified cost method.
Foreign securities are recorded in the financial statements after translation to U.S. dollars based on the applicable exchange rate at the end of the period. The Funds do not isolate that portion of the results of operations resulting from changes in the currency exchange rate from the fluctuations resulting from changes in the market prices of investments.
Foreign exchange gain or loss resulting from holding of a foreign currency, expiration of a currency exchange contract, difference in exchange rates between the trade date and settlement date of an investment purchased or sold, and the difference between dividends actually received compared to the amount shown in a Fund's accounting records on the date of receipt are shown as net realized gains or losses on foreign currency transactions in the respective Fund's statement of operations.
B. Forward Foreign Currency Exchange Contracts. The Funds may utilize forward foreign currency exchange contracts ("forward contracts") to hedge against foreign exchange fluctuations on foreign-denominated investments under which they are obligated to exchange currencies at specific future dates and at specified rates. All commitments are "marked-to-market" daily and any resulting
77
unrealized gains or losses are included as unrealized appreciation (depreciation) on foreign currency denominated assets and liabilities. The Funds record realized gains or losses at the time the forward contract is settled. Risks may arise upon entering these contracts from the potential inability of a counter party to meet the terms of their contracts and from unanticipated movements in the value of a foreign currency relative to the U.S. dollar or other currencies. Counterparties to these contracts are major U.S. financial institutions. Please refer to Note 7 for further information on forward foreign currency contracts held in each Fund.
C. Restricted and Illiquid Securities. A restricted security cannot be resold to the general public without prior registration under the Securities Act of 1933. If the security is subsequently registered and resold, the issuers would typically bear the expense of all registrations at no cost to the Fund. Restricted securities are valued according to the guidelines and procedures adopted by the Funds' Board of Trustees. A security may be considered illiquid if it lacks a readily available market. Securities are generally considered liquid if they can be sold or disposed of in the ordinary course of business within seven days at approximately the price at which the security is valued by a fund. Illiquid securities may be valued under methods approved by the Board of Trustees as reflecting fair value.
D. Security Transactions, Dividend Income and Distributions. Security transactions are accounted for on the trade date. Dividend income and distributions to shareholders are recorded on the ex-dividend date. Realized gains and losses from securities transactions are calculated using the identified cost method.
E. Allocation of Expenses. Each Fund is charged for those expenses directly attributable to it. Expenses that are not directly attributable to a Fund are allocated among the Funds in proportion to their respective assets or another appropriate method.
F. Cash Overdraft. Throughout the year, the Funds may have cash overdraft balances. A fee is incurred on these overdrafts, calculated by multiplying the overdraft by a rate plus London Interbank Offered Rate ("LIBOR"). Payables, if any, are reflected as Due to Custodian in the Statements of Assets and Liabilities. Expenses from cash overdrafts are included in Interest Expense in the Statements of Operations.
G. Concentration of Risk. The Alternative Energy Fund invests substantially in the alternative energy or energy technology sectors. The Asia Focus Fund invests substantially all of its assets in the Asian continent. The Asia Pacific Dividend Fund invests primarily in dividend-producing equity securities of Asia Pacific companies. The China & Hong Kong Fund invests substantially all of its assets in securities that are traded in China or Hong Kong or that are issued by companies that do a substantial part of their business in China. The Global Energy Fund invests substantially in energy companies; the changes in the prices and supplies of oil and other energy fuels may affect the Fund's investments. The Renminbi Yuan & Bond Fund invests in securities issued by companies economically tied to China, which exposes the Fund to greater market risk and potential monetary losses than if the Fund's assets were diversified among other regions. The consequences of political, social, or economic changes in the countries or business sectors in which the securities are offered or the issuers conduct their operations may affect the market prices of the Funds' investments and any income generated, as well as the Funds' ability to repatriate such amounts.
H. Use of Estimates. The preparation of financial statements in conformity with accounting principles generally accepted in the United States requires management to make estimates and assumptions that affect the reported amounts of assets and liabilities and the disclosure of contingent assets and liabilities at the date of the financial statements. Actual results could differ from those estimates.
I. Reclassifications. Accounting principles generally accepted in the United States require that certain components of net assets be reclassified between financial and tax reporting. These reclassifications have no effect on net assets or net asset value per share. For the year ended December 31, 2012, permanent differences in book and tax accounting have been reclassified to paid-in capital, undistributed net investment income/(loss) and accumulated realized gain/(loss) and accumulated realized gain/(loss) as follows:
| | | Increase (Decrease) | |
| | | Paid in Capital | | Undistributed Net
Investment
Income/(Loss) | | Accumulated
Gains or
(Losses) | |
Alternative Energy Fund | | $ | (188,714 | ) | | $ | 190,854 | | | $ | (2,140 | ) | |
Asia Focus Fund | | | — | | | | (6,733 | ) | | | 6,733 | | |
Asia Pacific Dividend Fund | | | (6,077 | ) | | | 6,160 | | | | (83 | ) | |
China & Hong Kong Fund | | | — | | | | (283 | ) | | | 283 | | |
Global Energy Fund | | | — | | | | 157,786 | | | | (157,786 | ) | |
Global Innovators Fund | | | (4,814,343 | ) | | | — | | | | 4,814,343 | | |
Inflation Managed Dividend FundTM | | | — | | | | 906 | | | | (906 | ) | |
Renminbi Yuan & Bond Fund | | | — | | | | 1,406,758 | | | | (1,406,758 | ) | |
78
J. Indemnifications. Under the Trust's organizational documents, its current and former officers and trustees are indemnified against certain liabilities arising out of the performance of their duties to the Funds. In addition, in the normal course of business, the Funds enter into contracts that contain a variety of representations and warranties that provide general indemnifications. The Funds' maximum exposure under these arrangements is unknown as this would involve future claims that may be made against the Funds that have not yet occurred or that would be covered by other parties.
K. Federal Income Taxes. The Funds intend to comply with the requirements of Subchapter M of the Internal Revenue Code applicable to regulated investment companies, and to distribute all of their taxable income to their shareholders. Therefore, no federal income tax provision is required.
The Funds recognize the tax benefits of uncertain tax positions only where the position is "more likely than not" to be sustained assuming examination by tax authorities. Management has analyzed the Funds' tax positions, and has concluded that no liability for unrecognized tax benefits should be recorded related to uncertain tax positions taken on returns filed for open tax years 2009 through 2011, or expected to be taken in the Funds' 2012 tax returns. The Funds identify their major tax jurisdiction as U.S. Federal, California State and foreign jurisdictions where the Funds make significant investments; however the Funds are not aware of any tax positions for which it is reasonably possible that the total amounts of unrecognized tax benefits will change materially in the next twelve months.
Note 3
Investment Advisory and Other Agreements
The Trust, on behalf of each Fund, entered into an Investment Advisory Agreement with Guinness Atkinson Asset Management, Inc. (the "Advisor"), under which the Advisor provides the Funds with investment management services. The Advisor furnishes all investment advice, office space, facilities, and most of the personnel needed by the Funds. As compensation for its services, the Advisor is entitled to a monthly fee at the following annual rates based upon the average daily net assets of the Funds:
Alternative Energy Fund | | | 1.00 | % | |
Asia Focus Fund | | | 1.00 | % | |
Asia Pacific Dividend Fund | | | 1.00 | % | |
China & Hong Kong Fund | | | 1.00 | % | |
Global Energy Fund | | | 0.75 | % | |
Global Innovators Fund | | 0.75% on the 1st $500 million, 0.60% thereafter | |
Inflation Managed Dividend FundTM | | | 0.45 | % | |
Renminbi Yuan & Bond Fund | | | 0.55 | % | |
The Funds are responsible for their own operating expenses. The Advisor has contractually agreed to limit each Fund's total operating expenses (excluding interest, dividends on short positions, taxes and extraordinary expenses) by reducing all or a portion of its fees and reimbursing the Fund for expenses so that its ratio of expenses to average daily net assets will not exceed the following levels:
Alternative Energy Fund | | | 1.98 | % | |
Asia Focus Fund | | | 1.98 | % | |
Asia Pacific Dividend Fund | | | 1.98 | % | |
China & Hong Kong Fund | | | 1.98 | % | |
Global Energy Fund | | | 1.45 | % | |
Global Innovators Fund | | | 1.55 | % | |
Inflation Managed Dividend FundTM | | | 0.68 | % | |
Renminbi Yuan & Bond Fund | | | 0.90 | % | �� |
79
The expense ratios shown in the financial highlights may exceed these levels due to expenses incurred, but not covered by the expense limitation agreement.
To the extent that the Advisor waives fees and/or absorbs expenses it may seek repayment of a portion or all of such amounts at any time within three fiscal years after the fiscal year in which such amounts were waived or absorbed, subject to the applicable cap. For the year ended December 31, 2012, the Advisor waived fees and absorbed expenses of $45,850, $74,715 and $71,229 for the Alternative Energy Fund, the Asia Pacific Dividend Fund and the Inflation Managed Dividend FundTM.
At December 31, 2012, the Advisor may recapture a portion of the following amounts that had been paid and/or waived on behalf of the Funds no later than the dates as stated below:
Fund: | | December 31, 2013 | | December 31, 2014 | | December 31, 2015 | | Total | |
Alternative Energy Fund | | $ | — | | | $ | — | | | $ | 45,850 | | | $ | 45,850 | | |
Asia Pacific Dividend Fund | | | 71,467 | | | | 74,834 | | | | 74,715 | | | | 221,016 | | |
Inflation Managed Dividend FundTM | | | — | | | | — | | | | 71,229 | | | | 71,229 | | |
Renminbi Yuan & Bond Fund | | | — | | | | 5,856 | | | | — | | | | 5,856 | | |
During the year ended December 31, 2012, the Advisor reimbursed the Alternative Energy Fund $853 for a trade error. This amount is reported on the Statement of Operations under the caption "Net increase from payments by affiliates".
Mutual Fund Administration Corporation (the "Administrator") acts as the Funds' administrator under an administration agreement. The fees paid to the Administrator for the year ended December 31, 2012 are reported on the Statements of Operations.
Quasar Distributors, LLC (the "Distributor") acts as the Funds' principal underwriter in a continuous public offering of the Funds' shares.
Foreside Compliance Services, LLC provides Chief Compliance Officer ("CCO") services to the Funds. The fees paid for CCO services for the year ended December 31, 2012 are reported on the Statements of Operations.
On August 14, 1998, the Trust approved a Deferred Compensation Plan for Trustees (the "Plan"). Trustees can elect to receive payment in cash or defer payments provided for in the Plan. If a trustee elects to defer payment, the Plan provides for the creation of a deferred payment account (Phantom Share Account). This account accumulates the deferred fees earned, and the value of the account is adjusted at the end of each quarter to reflect the value that would have been earned if the account had been invested in designated investments. The Funds recognize as trustee expense amounts accrued as meetings are attended plus the change in value of the Phantom Share Account.
The change in the value of the phantom share account during the year ended December 31, 2012 is shown in the table below. These amounts included any additional contributions to the deferred compensation plan and any appreciation (depreciation) on the underlying investments.
Alternative Energy Fund | | $ | 1,703 | | |
Asia Focus Fund | | $ | 3,469 | | |
Asia Pacific Dividend Fund | | $ | 1,505 | | |
China & Hong Kong Fund | | $ | 7,304 | | |
Global Energy Fund | | $ | 3,942 | | |
Global Innovators Fund | | $ | 7,804 | | |
Inflation Managed Dividend FundTM | | $ | (57 | ) | |
Renminbi Yuan & Bond Fund | | $ | 1,981 | | |
The fees paid to non-interested Trustees for the year ended December 31, 2012 are reported on the Statements of Operations.
Certain officers of the Trust are also officers and/or Directors of the Advisor and the Administrator. None of these officers are compensated directly by the Funds.
80
Note 4
Shareholder Servicing Plan
Each Fund has adopted a Shareholder Servicing Plan to pay a fee at an annual rate of up to 0.25% of its daily average net assets of shares serviced by shareholder servicing agents who provide administrative and support services to their customers.
The fees paid under the Shareholder Servicing Plan for the year ended December 31, 2012 are reported on the Statements of Operations.
Note 5
Investment Transactions
The following table presents purchases and sales of securities during the year ended December 31, 2012, excluding short-term investments, to indicate the volume of transactions in each Fund.
| | | Purchases | | Sales | |
Alternative Energy Fund | | $ | 1,169,270 | | | $ | 3,021,868 | | |
Asia Focus Fund | | | 4,939,030 | | | | 12,347,345 | | |
Asia Pacific Dividend Fund | | | 478,135 | | | | 1,105,459 | | |
China & Hong Kong Fund | | | 6,101,364 | | | | 26,612,942 | | |
Global Energy Fund | | | 17,790,241 | | | | 76,298,490 | | |
Global Innovators Fund | | | 1,997,918 | | | | 7,254,638 | | |
Inflation Managed Dividend FundTM | | | 1,889,647 | | | | 190,481 | | |
Renminbi Yuan & Bond Fund | | | 29,664,978 | | | | 3,715,592 | | |
The Funds did not purchase U.S. Government securities as a part of their long-term investment strategy during the year ended December 31, 2012.
Note 6
Fair Value Measurements and Disclosures
The Funds utilize various inputs in determining the value of its investments. These inputs are summarized in the three broad levels listed below:
Level 1 — Unadjusted quoted prices in active markets for identical assets or liabilities that a Fund has the ability to access.
Level 2 — Observable inputs other than quoted prices included in level 1 that are observable for the asset or liability, either directly or indirectly. These inputs may include quoted prices for the identical instrument on an inactive market, prices for similar instruments, interest rates, prepayment speeds, credit risk, yield curves, default rates and similar data.
Level 3 — Unobservable inputs for the asset or liability, to the extent relevant observable inputs are not available, representing the Fund's own assumptions about the assumptions a market participant would use in valuing the asset or liability, and would be based on the best information available.
The availability of observable inputs can vary from security to security and is affected by a wide variety of factors, including for example, the type of security, whether the security is new and not yet established in the marketplace, the liquidity of markets, and other characteristics particular to the security. To the extent that valuation is based on models or inputs that are less observable or unobservable in the market, the determination of fair value requires more judgment. Accordingly the degree of judgment exercised in determining fair value is greatest for instruments categorized in Level 3.
The inputs used to measure fair value may fall into different levels of the fair value hierarchy. In such cases, for disclosure purposes, the level in the fair value hierarchy within which the fair value measurement falls in its entirety, is determined based on the lowest level input that is significant to the fair value measurement in its entirety.
81
The inputs or methodology used for valuing securities are not an indication of the risk associated with investing in those securities. The following is a summary of the inputs used, as of December 31, 2012, in valuing the Funds' assets carried at fair value:
Alternative Energy Fund
Assets Table | | Level 1 | | Level 2 | | Level 3 | | Total | |
Investments, at Value | |
Common Stocks:1 | |
Basic Materials | | $ | 869,207 | | | $ | — | | | $ | — | | | $ | 869,207 | | |
Energy | | | 2,171,465 | | | | 3,211,211 | | | | — | | | | 5,382,676 | | |
Industrial | | | 3,020,068 | | | | 1,373,622 | | | | — | (a) | | | 4,393,690 | | |
Utilities | | | 1,625,021 | | | | 785,798 | | | | — | | | | 2,410,819 | | |
Total Investments, at Value | | | 7,685,761 | | | | 5,370,631 | | | | — | | | | 13,056,392 | | |
Total Assets | | $ | 7,685,761 | | | $ | 5,370,631 | | | $ | — | (a) | | $ | 13,056,392 | | |
(a) Applied Intellectual Capital Ltd. fair valued at zero as the company has been delisted since 2009.
Asia Focus Fund
Assets Table | | Level 1 | | Level 2 | | Level 3 | | Total | |
Investments, at Value | |
Common Stocks:1 | |
Basic Materials | | $ | — | | | $ | 3,762,481 | | | $ | — | | | $ | 3,762,481 | | |
Communications | | | 788,211 | | | | 3,674,838 | | | | — | | | | 4,463,049 | | |
Consumer, Cyclical | | | 1,022,982 | | | | 3,828,929 | | | | — | | | | 4,851,911 | | |
Consumer, Non-cyclical | | | — | | | | 579,911 | | | | — | | | | 579,911 | | |
Energy | | | — | | | | 11,128,879 | | | | — | | | | 11,128,879 | | |
Exchange Traded Funds ("ETFs") | | | — | | | | 980,839 | | | | — | | | | 980,839 | | |
Financial | | | — | | | | 2,532,760 | | | | — | | | | 2,532,760 | | |
Industrial | | | — | | | | 5,462,957 | | | | — | | | | 5,462,957 | | |
Technology | | | — | | | | 8,014,867 | | | | — | | | | 8,014,867 | | |
Utilities | | | — | | | | 2,670,326 | | | | — | | | | 2,670,326 | | |
Total Investments, at Value | | | 1,811,193 | | | | 42,636,787 | | | | — | | | | 44,447,980 | | |
Total Assets | | $ | 1,811,193 | | | $ | 42,636,787 | | | $ | — | | | $ | 44,447,980 | | |
82
Asia Pacific Dividend Fund
Assets Table | | Level 1 | | Level 2 | | Level 3 | | Total | |
Investments, at Value | |
Common Stocks:1 | |
Basic Materials | | $ | — | | | $ | 317,966 | | | $ | — | | | $ | 317,966 | | |
Communications | | | | | 777,872 | | | | — | | | | 777,872 | | |
Consumer, Cyclical | | | 151,274 | | | | — | | | | — | | | | 151,274 | | |
Consumer, Non-cyclical | | | 182,650 | | | | 215,377 | | | | — | | | | 398,027 | | |
Energy | | | 201,292 | | | | 590,403 | | | | — | | | | 791,695 | | |
Financial | | | 208,247 | | | | 655,658 | | | | — | | | | 863,905 | | |
Industrial | | | | | 380,161 | | | | — | | | | 380,161 | | |
Technology | | | | | 666,130 | | | | — | | | | 666,130 | | |
Utilities | | | | | 460,032 | | | | — | | | | 460,032 | | |
Total Investments, at Value | | | 743,463 | | | | 4,063,599 | | | | — | | | | 4,807,062 | | |
Total Assets | | $ | 743,463 | | | $ | 4,063,599 | | | $ | — | | | $ | 4,807,062 | | |
China & Hong Kong Fund
Assets Table | | Level 1 | | Level 2 | | Level 3 | | Total | |
Investments, at Value | |
Common Stocks:1 | |
Basic Materials | | $ | — | | | $ | 9,250,650 | | | $ | — | | | $ | 9,250,650 | | |
Communications | | | 6,846,368 | | | | 18,152,776 | | | | — | | | | 24,999,144 | | |
Consumer, Cyclical | | | | | 21,896,800 | | | | — | | | | 21,896,800 | | |
Consumer, Non-cyclical | | | | | 1,373,596 | | | | — | | | | 1,373,596 | | |
Energy | | | — | | | | 33,263,622 | | | | — | | | | 33,263,622 | | |
Exchange Traded Funds ("ETFs") | | | | | 3,991,453 | | | | — | | | | 3,991,453 | | |
Financial | | | | | 34,702,682 | | | | — | | | | 34,702,682 | | |
Industrial | | | | | 12,563,137 | | | | — | | | | 12,563,137 | | |
Technology | | | | | 6,461,552 | | | | — | | | | 6,461,552 | | |
Utilities | | | | | 4,805,786 | | | | — | | | | 4,805,786 | | |
Total Investments, at Value | | | 6,846,368 | | | | 146,462,054 | | | | — | | | | 153,308,422 | | |
Total Assets | | $ | 6,846,368 | | | $ | 146,462,054 | | | $ | — | | | $ | 153,308,422 | | |
83
Global Energy Fund
Assets Table | | Level 1 | | Level 2 | | Level 3 | | Total | |
Investments, at Value | |
Common Stocks:1 | |
Energy | | $ | 60,916,949 | | | $ | 29,760,765 | | | $ | 228,228 | (a) | | $ | 90,905,942 | | |
Industrial | | | — | | | | 80,013 | | | | — | | | | 80,013 | | |
Total Investments, at Value | | | 60,916,949 | | | | 29,840,778 | | | | 228,228 | | | | 90,985,955 | | |
Total Assets | | $ | 60,916,949 | | | $ | 29,840,778 | | | $ | 228,228 | (a) | | $ | 90,985,955 | | |
(a) Includes Cluff Natural Resources warrants fair valued at zero.
Following is a reconciliation of Level 3 assets for which significant unobservable inputs were used to determine fair value.
Global Energy Fund | | Common Stock | | Warrant | |
Balance as of 12/31/11 | | $ | — | | | $ | — | | |
Realized gain (loss) | | | — | | | | — | | |
Change in unrealized appreciation (depreciation) | | | 2,439 | | | | — | | |
Cost of purchases | | | — | | | | — | | |
Proceeds from sales | | | — | | | | — | | |
Accrued interest | | | — | | | | — | | |
Transfers into Level 3* | | | 225,789 | | | | — | | |
Transfers out of Level 3 | | | — | | | | — | | |
Balance as of 12/31/12 | | $ | 228,228 | | | $ | — | | |
Net change in unrealized appreciation on Level 3 investments held as of 12/31/12† | | $ | 2,439 | | | $ | — | | |
* The amount of transfers in are reflected at the securities' fair value on the date of transfer.
† Included in the related amounts on the Statements of Operations.
Following is a description of the valuation techniques and significant inputs used in determining the value of the Fund's securities classified as Level 3:
Financial Assets | | Fair Value at
December 31, 2012 | | Valuation
Techniques | | Unobservable
Inputs | |
Common Stock | | $ | 228,228 | | | Vendor Pricing | | Price | |
Warrant
| | | —
| | | Intrinsic value
based on common
stock price | | Discount for
illiquidity
| |
84
Global Innovators Fund
Assets Table | | Level 1 | | Level 2 | | Level 3 | | Total | |
Investments, at Value | |
Common Stocks: | |
Communications | | $ | 6,884,612 | | | $ | — | | | $ | — | | | $ | 6,884,612 | | |
Consumer, Cyclical | | | 2,348,146 | | | | — | | | | — | | | | 2,348,146 | | |
Consumer, Non-cyclical | | | 2,587,481 | | | | — | | | | — | | | | 2,587,481 | | |
Energy | | | 1,177,579 | | | | — | | | | — | | | | 1,177,579 | | |
Financial | | | 5,022,926 | | | | — | | | | — | | | | 5,022,926 | | |
Industrial | | | 3,785,421 | | | | — | | | | — | | | | 3,785,421 | | |
Technology | | | 9,101,230 | | | | 1,407,194 | | | | — | | | | 10,508,424 | | |
Total Investments, at Value | | | 30,907,395 | | | | 1,407,194 | | | | — | | | | 32,314,589 | | |
Total Assets | | $ | 30,907,395 | | | $ | 1,407,194 | | | $ | — | | | $ | 32,314,589 | | |
Inflation Managed Dividend FundTM
Assets Table | | Level 1 | | Level 2 | | Level 3 | | Total | |
Investments, at Value | |
Common Stocks: | |
Communications | | $ | 50,499 | | | $ | 42,130 | | | $ | — | | | $ | 92,629 | | |
Consumer, Cyclical | | | 152,335 | | | | — | | | | — | | | | 152,335 | | |
Consumer, Non-cyclical | | | 534,257 | | | | 253,582 | | | | — | | | | 787,839 | | |
Energy | | | — | | | | 146,773 | | | | | | 146,773 | | |
Financial | | | 138,359 | | | | 149,285 | | | | — | | | | 287,644 | | |
Industrial | | | 145,735 | | | | 102,647 | | | | — | | | | 248,382 | | |
Technology | | | 41,400 | | | | — | | | | — | | | | 41,400 | | |
Total Investments, at Value | | | 1,062,585 | | | | 694,417 | | | | — | | | | 1,757,002 | | |
Total Assets | | $ | 1,062,585 | | | $ | 694,417 | | | $ | — | | | $ | 1,757,002 | | |
85
Renminbi Yuan & Bond Fund
Assets Table | | Level 1 | | Level 2 | | Level 3 | | Total | |
Cash | | $ | 19,820,046 | | | $ | — | | | $ | — | | | $ | 19,820,046 | | |
Investments, at Value | |
Corporate Bonds | | $ | — | | | $ | 58,995,882 | | | $ | — | | | $ | 58,995,882 | | |
Certificates of Deposits | | | — | | | | 11,246,787 | | | | — | | | | 11,246,787 | | |
Total Investments, at Value | | | — | | | | 70,242,669 | | | | — | | | | 70,242,669 | | |
Total Assets | | $ | 19,820,046 | | | $ | 70,242,669 | | | $ | — | | | $ | 90,062,715 | | |
* Other financial instruments are derivative instruments not reflected in the Schedule of Investments, such as foreign currency exchange contracts which are valued at the unrealized appreciation/depreciation on the investments.
1 Foreign securities traded in foreign exchanges may be adjusted due to a significant change in the value of U.S. traded securities, as measured by the S&P 500 Index. Significant movements were deemed to have occurred at December 31, 2012 and therefore such securities were classified as Level 2. As a result, securities still held by the Alternative Energy Fund, Asia Focus Fund, Asia Pacific Dividend Fund, China & Hong Kong Fund, Global Energy Fund, and Global Innovators Fund were transferred from Level 1 into Level 2 with an end of period value of $5,370,631, $34,804,412, $3,696,165, $139,968,981, $21,412,778, and $1,407,194, respectively. There were no securities transferred between Level 1 and Level 2 in the Inflation Managed Dividend Fund and the Renminbi Yuan & Bond Fund.
Note 7
Derivatives and Hedging Transactions
FASB Accounting Standards Codification 815, Derivatives and Hedging requires enhanced disclosures about the Funds' derivative and hedging activities, including how such activities are accounted for and their effects on the Funds' financial position, performance and cash flows.
Forward Foreign Currency Contracts
In order to hedge their portfolio and to protect them against possible fluctuations in foreign exchange rates pending the settlement of securities transactions, the Funds may enter into forward foreign currency contracts that obligate them to exchange currencies at specified future dates. At the maturity of a forward contract, a Fund may either make delivery of the foreign currency from currency held, if any, or from the proceeds of the portfolio securities sold. It may also terminate its obligation to deliver the foreign currency at any time by purchasing an offsetting contract. The forward value of amounts due are netted against the forward value of the currency to be delivered, and the net amount is shown as a receivable or payable in the financial statements. The Funds did not enter into forward foreign currency contracts during the year ended December 31, 2012 and did not have any outstanding forward contracts as of December 31, 2012.
86
Note 8
Tax Matters
As of December 31, 2012, the tax basis of investments were as follows:
| | | Alternative
Energy Fund | | Asia Focus
Fund | | Asia Pacific
Dividend
Fund | | China &
Hong Kong
Fund | | Global
Energy
Fund | | Global
Innovators
Fund | | Inflation
Managed
Dividend
FundTM | | Renminbi
Yuan & Bond
Fund | |
Cost of investments for
tax purposes | | $ | 31,039,852 | | | $ | 32,224,702 | | | $ | 3,798,693 | | | $ | 103,595,884 | | | $ | 100,480,660 | | | $ | 35,940,174 | | | $ | 1,702,904 | | | $ | 69,221,346 | | |
Gross tax unrealized
appreciation | | | 857,002 | | | | 13,820,089 | | | | 1,075,076 | | | | 53,902,344 | | | | 12,027,019 | | | | 4,214,405 | | | | 93,533 | | | | 1,032,654 | | |
Gross tax unrealized
(depreciation) | | | (18,840,462 | ) | | | (1,596,811 | ) | | | (66,707 | ) | | | (4,189,806 | ) | | | (21,521,724 | ) | | | (7,839,990 | ) | | | (39,435 | ) | | | (11,331 | ) | |
Net tax unrealized
appreciation (depreciation)
on investments | | | (17,983,460 | ) | | | 12,223,278 | | | | 1,008,369 | | | | 49,712,538 | | | | (9,494,705 | ) | | | (3,625,585 | ) | | | 54,098 | | | | 1,021,323 | | |
Net tax appreciation
(depreciation) on foreign-
currency denominated
assets and liabilities | | | 13 | | | | (4,157 | ) | | | 23 | | | | 114 | | | | (1,758 | ) | | | — | | | | 30 | | | | 160,222 | | |
Net tax unrealized
appreciation
(depreciation)* | | | (17,983,447 | ) | | | 12,219,121 | | | | 1,008,392 | | | | 49,712,652 | | | | (9,496,463 | ) | | | (3,625,585 | ) | | | 54,128 | | | | 1,181,545 | | |
Undistributed net ordinary
income** | | | — | | | | 245,687 | | | | — | | | | 186,567 | | | | 338,750 | | | | 71,587 | | | | 6,237 | | | | 233,539 | | |
Undistributed Long-Term
Capital Gains | | | — | | | | — | | | | — | | | | — | | | | — | | | | — | | | | — | | | | — | | |
Post October loss*** | | | (598,141 | ) | | | (5,216 | ) | | | — | | | | (598 | ) | | | (1,328,766 | ) | | | — | | | | — | | | | — | | |
Capital loss carryforward | | | (83,020,188 | ) | | | (6,086,913 | ) | | | (4,145,310 | ) | | | (8,734,498 | ) | | | (585,199 | ) | | | (3,627,630 | ) | | | — | | | | (47,320 | ) | |
Other accumulated
gain/(loss) | | | (28,807 | ) | | | (47,535 | ) | | | (20,525 | ) | | | (96,297 | ) | | | (37,265 | ) | | | (58,812 | ) | | | (900 | ) | | | (7,401 | ) | |
Total accumulated
gain/(loss) | | $ | (101,630,583 | ) | | $ | 6,325,144 | | | $ | (3,157,443 | ) | | $ | 41,067,826 | | | $ | (11,108,943 | ) | | $ | (7,240,440 | ) | | $ | 59,465 | | | $ | 1,360,363 | | |
* The differences between book-basis and tax-basis unrealized appreciation/(depreciation) is attributable primary to the tax deferral of losses on wash sales and passive foreign investment company (PFIC) mark to market adjustments.
** The differences between book-basis and tax basis undistributed net ordinary income is attributed to deferred compensation.
*** Under the current tax law, capital and currency losses realized after October 31 and prior to the Fund's fiscal year end may be deferred as occurring on the first day of the following year.
87
As of December 31, 2012, the Funds have the following capital loss carryforwards available to offset future realized capital gains:
Capital losses expiring in: | | Alternative
Energy Fund | | Asia Focus
Fund | | Asia Pacific
Dividend
Fund | | China &
Hong Kong
Fund | | Global
Energy
Fund | | Global
Innovators
Fund | | Inflation
Managed
Dividend
FundTM | | Renminbi
Yuan & Bond
Fund | |
2013 | | $ | — | | | $ | — | | | $ | — | | | $ | — | | | $ | — | | | $ | — | | | $ | — | | | $ | — | | |
2014 | | | — | | | | — | | | | — | | | | — | | | | — | | | | — | | | | — | | | | — | | |
2015 | | | — | | | | — | | | | — | | | | — | | | | — | | | | — | | | | — | | | | — | | |
2016 | | | 10,370,865 | | | | — | | | | 1,321,324 | | | | — | | | | — | | | | — | | | | — | | | | — | | |
2017 | | | 40,204,652 | | | | — | | | | 1,115,940 | | | | — | | | | 585,199 | | | | — | | | | — | | | | — | | |
2018 | | | 9,296,377 | | | | 3,440,534 | | | | 1,502,925 | | | | — | | | | — | | | | — | | | | — | | | | — | | |
No Expiration Long-term | | | 22,159,427 | | | | 1,823,877 | | | | 152,572 | | | | 5,390,843 | | | | — | | | | 3,627,630 | | | | — | | | | — | | |
No Expiration Short-term | | | 988,867 | | | | 822,502 | | | | 52,549 | | | | 3,343,655 | | | | — | | | | — | | | | — | | | | 47,320 | | |
Total | | $ | 83,020,188 | | | $ | 6,086,913 | | | $ | 4,145,310 | | | $ | 8,734,498 | | | $ | 585,199 | | | $ | 3,627,630 | | | $ | — | | | $ | 47,320 | | |
Asia Pacific Dividend Fund utilized capital loss carryforwards of $111,928. Global Innovators Fund utilized capital loss carryforwards of $2,822,241 and $4,814,343 expired on December 31, 2012. Global Energy utilized capital loss carryforwards of $957,173.
Under the Regulated Investment Company Modernization Act of 2010 (the "Act"), the Funds will be permitted to carryforward capital losses incurred in taxable years beginning after December 22, 2010, for an unlimited period. However, any losses incurred during those future taxable years will be required to be utilized prior to the losses incurred in pre-enactment taxable years. As a result of this ordering rule, pre-enactment capital loss carryforwards may be more likely to expire unused. Additionally, post-enactment capital losses that are carried forward will retain their character as either short-term or long-term capital losses rather than being considered all short-term as under previous law.
The tax character of distributions (other than return of capital dividends) paid during 2012 and 2011 fiscal years are as follows:
| | | 2012 | | 2011 | |
| | | Ordinary
Income | | Long-term
Capital Gain | | Ordinary
Income | | Long-term
Capital Gain | |
Alternative Energy Fund | | $ | 32,745 | | | $ | — | | | $ | 300,549 | | | $ | — | | |
Asia Focus Fund | | | 585,229 | | | | — | | | | 300,042 | | | | — | | |
Asia Pacific Dividend Fund | | | 117,316 | | | | — | | | | 133,958 | | | | — | | |
China & Hong Kong Fund | | | 3,000,059 | | | | — | | | | 1,088,646 | | | | 7,235,100 | | |
Global Energy Fund | | | 1,500,024 | | | | — | | | | 600,511 | | | | — | | |
Global Innovators Fund | | | 100,107 | | | | — | | | | 78,408 | | | | — | | |
Inflation Managed Dividend FundTM | | | 36,741 | | | | — | | | | — | | | | — | | |
Renminbi Yuan & Bond Fund | | | 2,095,737 | | | | — | | | | — | | | | ��� | | |
Note 9
Recently Issued Accounting Pronouncements
In December 2011, FASB issued ASU No. 2011-11 related to disclosure about offsetting assets and liabilities. The amendments in this ASU require an entity to disclose information about offsetting and related arrangements to enable users of its financial statements to understand the effect of those arrangements on its financial position. The ASU is effective for annual reporting periods beginning on or after January 1, 2013, and interim periods within those annual periods. The guidance requires retrospective application for all comparative periods presented. Management is currently evaluating the impact ASU 2011-11 will have on the financial statement disclosures.
88
Note 10
Events Subsequent to the Fiscal Period End
The Funds have adopted financial reporting rules regarding subsequent events which requires an entity to recognize in the financial statements the effects of all subsequent events that provide additional evidence about conditions that existed at the date of the balance sheet. Management has evaluated the Funds' related events and transactions and has determined that there were no events or transactions that occurred that would materially impact the amounts or disclosures in the Funds' financial statements.
89
Additional Information (Unaudited)
Proxy Voting Procedures
The Advisor votes proxies relating to portfolio securities in accordance with procedures that have been approved by the Board. You may obtain a description of these procedures, free of charge, by calling "toll-free" 1-800-915-6565. This information is also available through the Securities and Exchange Commission's website at http://www.sec.gov.
Proxy Voting Records
Information regarding how the Advisor voted proxies relating to portfolio securities during the latest 12-month period ended June 30 is available, without charge, by calling toll-free, 1-800-915-6565. This information is also available through the Securities and Exchange Commission's website at http://www.sec.gov.
Form N-Q Disclosure
The Funds file their complete schedule of portfolio holdings with the Securities and Exchange Commission for the first and third quarters of each fiscal year on Form N-Q. The Funds' Form N-Q is available on the Securities and Exchange Commission's website at http://www.sec.gov. The Funds' Form N-Q may be reviewed and copied at the Commission's Public Reference Room in Washington, DC, and information on the operation of the Public Reference Room may be obtained by calling 1-800-SEC-0330. This information is also available, without charge, by calling toll-free, 1-800-915-6565.
Supplemental Tax Information
For the fiscal year ended December 31, 2012, certain dividends paid by the Funds may be subject to a maximum tax rate of 15%, as provided for by the Jobs and Growth Tax Relief Reconciliation Act of 2003. The percentage of dividends declared from ordinary income designated as qualified dividend income was as follows:
Alternative Energy Fund | | | 100.00 | % | |
Asia Focus Fund | | | 89.48 | % | |
Asia Pacific Dividend Fund | | | 73.97 | % | |
China & Hong Kong Fund | | | 80.39 | % | |
Global Energy Fund | | | 100.00 | % | |
Global Innovators Fund | | | 100.00 | % | |
Inflation Managed Dividend FundTM | | | 100.00 | % | |
Renminbi Yuan & Bond Fund | | | N/A | | |
Pursuant to Section 853 of the Internal Revenue Code of 1986, as amended, the Funds designate the following income earned from foreign sources and foreign taxes paid for the year ended December 31, 2012:
| | | Foreign Sourced Income | | Foreign Taxes Paid | |
| | | Total
Amount | | Per Share
Amount | | Total
Amount | | Per Share
Amount | |
Alternative Energy Fund | | $ | 230,397 | | | $ | 0.04 | | | | N/A | | | | N/A | | |
Asia Focus Fund | | | 1,473,268 | | | | 0.61 | | | $ | 166,207 | | | $ | 0.07 | | |
Asia Pacific Dividend Fund | | | 283,314 | | | | 0.79 | | | | 19,574 | | | | 0.05 | | |
China & Hong Kong Fund | | | 4,802,825 | | | | 0.94 | | | | 239,938 | | | | 0.05 | | |
Global Energy Fund | | | N/A | | | | N/A | | | | N/A | | | | N/A | | |
Global Innovators Fund | | | N/A | | | | N/A | | | | N/A | | | | N/A | | |
Inflation Managed Dividend FundTM | | | N/A | | | | N/A | | | | N/A | | | | N/A | | |
Renminbi Yuan & Bond Fund | | | N/A | | | | N/A | | | | N/A | | | | N/A | | |
90
REPORT OF INDEPENDENT REGISTERED
PUBLIC ACCOUNTING FIRM
To the Shareholders and Board of Trustees
Guinness Atkinson Funds
Woodland Hills, California
We have audited the accompanying statements of assets and liabilities, including the schedules of investments, of the Alternative Energy Fund, Asia Focus Fund, Asia Pacific Dividend Fund, China & Hong Kong Fund, Global Energy Fund, Global Innovators Fund, Renminbi Yuan & Bond Fund and Inflation Managed Dividend Fund (the "Funds"), each a series of shares of the Guinness Atkinson Funds, as of December 31, 2012, the related statements of operations for the year then ended, the statements of changes in net assets for each of the two years in the period then ended, and the financial highlights for each of the five years in the period then ended, except for Renminbi Yuan & Bond Fund the related statement of operations for the year then ended, the statement of changes in net assets and the financial highlights for the year then ended and for the period June 30, 2011 (commencement of operations) to December 31, 2011, and for Inflation Managed Dividend Fund the related statement of operations, the statement of changes in net assets and the financial highlights for the period March 30, 2012 (commencement of operations) to December 31, 2012. These financial statements and financial highlights are the responsibility of the Funds' management. Our responsibility is to express an opinion on these financial statements and financial highlights based on our audits.
We conducted our audits in accordance with the standards of the Public Company Accounting Oversight Board (United States). Those standards require that we plan and perform the audits to obtain reasonable assurance about whether the financial statements and financial highlights are free of material misstatement. The Funds are not required to have, nor were we engaged to perform, an audit of their internal control over financial reporting. Our audits included consideration of internal control over financial reporting as a basis for designing audit procedures that are appropriate in the circumstances, but not for the purpose of expressing an opinion on the effectiveness of the Funds' internal control over financial reporting. Accordingly, we express no such opinion. An audit includes examining, on a test basis, evidence supporting the amounts and disclosures in the financial statements. Our procedures included confirmation of securities owned as of December 31, 2012, by correspondence with the custodian and brokers or by other appropriate auditing procedures where replies from brokers were not received. An audit also includes assessing the accounting principles used and significant estimates made by management, as well as evaluating the overall financial statement presentation. We believe that our audits provide a reasonable basis for our opinion.
In our opinion, the financial statements and financial highlights referred to above present fairly in all material respects, the financial position of the above mentioned Funds as of December 31, 2012, the results of their operations, the changes in their net assets and the financial highlights for the periods indicated above, in conformity with accounting principles generally accepted in the United States of America.
TAIT, WELLER & BAKER LLP
Philadelphia, Pennsylvania
February 25, 2013
91
TRUSTEE AND OFFICER INFORMATION (Unaudited)
Unless otherwise noted, each Trustee and officer's address is 21550 Oxnard Street, Suite 850, Woodland Hills, California 91367. Trustees and officers of the Trust serve until their resignation, removal or retirement. Additional information about the Trustees is included in the Funds' Statement of Additional Information which is available, without charge, upon request by calling toll-free, 1-800-915-6565 or by visiting the Funds' website at www.gafunds.com.
| Name and Age | | Position(s)
Held with
Trust† | | Year Elected | | Principal Occupation(s) During the
Past 5 Years | | Number of
Portfolios In
Fund Complex
Overseen by
Trustee | | Other Directorships
Held by Trustee
During the Past 5 Years | |
Non-Interested Trustees | |
Dr. Gunter Dufey
(72) | | Trustee | | | 1994 | | | Executive Director of Education Exchange Ltd., a consulting firm since 2010. Professorial Fellow, Nanyang Technological University (Singapore) since 2005. Professor (Emeritus) of Ross School at The University of Michigan, where he served from 1968 to 2002. | | | 8 | | | Independent director, various subsidiaries of Ally Financial Inc. (formerly GMAC) in the United States and Canada. | |
James I. Fordwood
(65) | | Trustee | | | 1994 | | | CFO and Managing Member of Prima Marketing LLC (network of convenience stores) since 1998. | | | 8 | | | None | |
Dr. Bret A. Herscher
(54) | | Trustee | | | 1994 | | | Vice President of Minnow Medical, a company that develops medical devices for treating peripheral artery disease since 2009. President of Pacific Consultants, a technical and technology management consulting company serving the electronic industry and venture capital community that he co-founded, from 1996 to 2007. | | | 8 | | | None | |
J. Brooks Reece, Jr.
(65) | | Trustee and Chairman | | | 1994 | | | Vice President of Adcole Corp., a manufacturer of precision measuring machines and sun angle sensors for space satellites since 1984. President of Adcole Far East Ltd. since 2008. Executive Director of Adcole Measuring Equipment Shanghai Co. Ltd., since 2004. | | | 8 | | | None | |
92
| Name and Age | | Position(s)
Held with
Trust† | | Year Elected | | Principal Occupation(s) During the
Past 5 Years | | Number of
Portfolios In
Fund Complex
Overseen by
Trustee | | Other Directorships
Held by Trustee
During the Past 5 Years | |
Interested Trustee | |
Timothy W.N. Guinness*
14 Queen Anne's Gate
London, England
SW1H 9AA
U.K.
(64) | | Trustee | | | 1998 | | | Chairman/CIO of Guinness AtkinsonTM Asset Management since November 2002. Chairman of Guinness Asset Management Ltd., investment advisor in London, since 2003. Director of Guinness Capital Management Ltd. since 2010. Director of SR Europe Investment Trust Plc since 2001. Director of Atlantis Japan Growth Fund Ltd., since 2002. Non-Executive Director of Quayle Munro since 2007. Non-Executive Director of Brompton Bicycle Ltd., since 2000. | | | 8 | | | None | |
Officers | |
James Atkinson
(55) | | President | | | 2003 | | | Chief Executive Officer and Director of Guinness AtkinsonTM Asset Management since November 2002. Director of Guinness Asset Management Ltd. since 2003. Principal of Orbis Marketing, a mutual fund marketing and advertising firm, since November 2001. | | N/A | | N/A | |
Ashley Atkinson
(29) | | Vice President | | | 2012 | | | Compliance Manager and Operations Manager of Guinness AtkinsonTM Asset Management since 2011. Part-time compliance assistant at Guinness AtkinsonTM Asset Management since 2010. Earned Juris Doctor degree at Southwestern University School of Law from 2006 to 2009. Volunteer at the Los Angeles City Attorney's office in 2009 and 2010. California bar member since 2010 | | N/A | | N/A | |
* "Interested person" (as defined in the 1940 Act) of the Funds because of his affiliation with the Funds' Advisor, Guinness Atkinson Asset Management, Inc.
93
| Name and Age | | Position(s)
Held with
Trust† | | Year Elected | | Principal Occupation(s) During the
Past 5 Years | | Number of
Portfolios In
Fund Complex
Overseen by
Trustee | | Other Directorships
Held by Trustee
During the Past 5 Years | |
Ann E. Edgeworth
(51) | | Chief Compliance Officer | | | 2013 | | | Director, Foreside Compliance Services, from November 2010 to present. From 2004 to 2010, Vice President, Compliance Advisory Services, State Street/Investors Bank & Trust. | | | N/A | | | | N/A | | |
Rita Dam
(46) | | Treasurer | | | 2009 | | | Vice President, Mutual Fund Administration Corp. since 2006. | | | N/A | | | | N/A | | |
Joy Ausili
(46) | | Secretary and Assistant Treasurer | | | 2009 | | | Vice President, Mutual Fund Administration Corp. since 2006. | | | N/A | | | | N/A | | |
Sardjono Kadiman
(37) | | Assistant Treasurer | | | 2009 | | | Assistant Vice President, Mutual Fund Administration Corp. (2008-present); Compliance Officer, U.S. Bancorp Fund Services, LLC, a mutual and hedge fund service provider (2001-2008). | | | N/A | | | | N/A | | |
Lyna Phan
(37) | | Assistant Treasurer | | | 2011 | | | Assistant Vice President, Mutual Fund Administration Corp. (2010-present); Compliance Officer, U.S. Bancorp Fund Services, LLC, a mutual and hedge fund service provider (2005-2010). | | | N/A | | | | N/A | | |
94
Privacy Notice
Guinness AtkinsonTM Funds and Guinness Atkinson Asset Management, Inc. may collect non-public information about you from the following sources:
• Information we receive about you on applications or other forms;
• Information you give us orally; and
• Information about your transactions with us.
We do not disclose any non-public personal information about our shareholders or former shareholders without the shareholder's authorization, except as required by law or in response to inquiries from governmental authorities. We restrict access to your personal and account information to those employees who need to know that information to provide products and services to you. We also may disclose that information to unaffiliated third parties (such as to brokers or custodians) only as permitted by law and only as needed for us to provide agreed services to you. We maintain physical, electronic and procedural safeguards to guard your non-public personal information.
95
This page is Intentionally Left Blank
96
This page is Intentionally Left Blank
97
This page is Intentionally Left Blank
98
Guinness AtkinsonTM Funds Information
Board of Trustees
J. Brooks Reece, Jr., Chairman | |
Dr. Gunter Dufey | |
James I. Fordwood | |
Timothy W.N. Guinness | |
Dr. Bret A. Herscher | |
Contact Guinness AtkinsonTM Funds
P.O. Box 701 | |
Milwaukee, WI 53201-0701 | |
Shareholder Services: 800-915-6566 | |
Literature Request: 800-915-6565 | |
Website: www.gafunds.com | |
Email: mail@gafunds.com | |
Guinness AtkinsonTM Funds | |
Fund | | Cusip | | Ticker | | Fund# | |
Alternative Energy Fund | | 402031 50 4 | | GAAEX | | | 1298 | | |
Asia Focus Fund | | 402031 10 8 | | IASMX | | | 1096 | | |
Asia Pacific Dividend Fund | | 402031 60 3 | | GAADX | | | 1299 | | |
China & Hong Kong Fund | | 402031 20 7 | | ICHKX | | | 1094 | | |
Global Energy Fund | | 402031 40 5 | | GAGEX | | | 1098 | | |
Global Innovators Fund | | 402031 30 6 | | IWIRX | | | 1095 | | |
Inflation Managed Dividend FundTM | | 402031 80 1 | | GAINX | | | 1092 | | |
Renminbi Yuan & Bond Fund | | 402031 70 2 | | GARBX | | | 1099 | | |
Distributed by Quasar Distributors, LLC, Milwaukee, WI 53202
This report is intended for shareholders of the Guinness AtkinsonTM Funds and may not be used as literature unless preceded or accompanied by a current prospectus.
99
Item 2. Code of Ethics.
The registrant has adopted a code of ethics that applies to the registrant’s principal executive officer and principal financial officer. The registrant has not made any amendments to its code of ethics during the period covered by this report. The registrant has not granted any waivers from any provisions of the code of ethics during the period covered by this report.
The registrant undertakes to provide to any person without charge, upon request, a copy of its code of ethics by mail when they call the registrant at 1-800-915-6565.
Item 3. Audit Committee Financial Expert.
The registrant’s board of trustees has determined that there is at least one audit committee financial expert serving on its audit committee. James I. Fordwood is the “audit committee financial expert” and is considered to be “independent” as each term is defined in Item 3 of Form N-CSR.
Item 4. Principal Accountant Fees and Services.
The registrant has engaged its principal accountant to perform audit services, audit-related services, tax services and other services during the past two fiscal years. “Audit services” refer to performing an audit of the registrant’s annual financial statements or services that are normally provided by the accountant in connection with statutory and regulatory filings or engagements for those fiscal years. “Audit-related services” refer to the assurance and related services by the principal accountant that are reasonably related to the performance of the audit. “Tax services” refer to professional services rendered by the principal accountant for tax compliance, tax advice, and tax planning. There were no “other services” provided by the principal accountant. The following table details the aggregate fees billed or expected to be billed for each of the last two fiscal years for audit fees, audit-related fees, tax fees and other fees by the principal accountant.
| | FYE 12/31/2012 | | FYE 12/31/2011 | |
Audit Fees | | $ | 140,300 | | $ | 124,400 | |
Audit-Related Fees | | N/A | | N/A | |
Tax Fees | | $ | 21,700 | | $ | 21,700 | |
All Other Fees | | N/A | | N/A | |
The audit committee has adopted pre-approval policies and procedures that require the audit committee to pre-approve all audit and non-audit services of the registrant, including services provided to any entity affiliated with the registrant.
The percentage of fees billed by Tait, Weller, & Baker LLP applicable to non-audit services pursuant to waiver of pre-approval requirement were as follows:
| | FYE 12/31/2012 | | FYE 12/31/2011 | |
Audit-Related Fees | | 0 | % | 0 | % |
Tax Fees | | 0 | % | 0 | % |
All Other Fees | | 0 | % | 0 | % |
All of the principal accountant’s hours spent on auditing the registrant’s financial statements were attributed to work performed by full-time permanent employees of the principal accountant.
The following table indicates the non-audit fees billed or expected to be billed by the registrant’s accountant for services to the registrant and to the registrant’s investment adviser (and any other controlling entity, etc.—not sub-adviser) for the last two years. The audit committee of the Board of Trustees has considered whether the provision of non-audit services that were rendered to the registrant’s investment adviser is compatible with maintaining the principal accountant’s independence and has concluded that the provision of such non-audit services by the accountant has not compromised the accountant’s independence.
| | FYE 12/31/2012 | | FYE 12/31/2011 | |
Non-Audit Related Fees | | | | | |
Registrant | | N/A | | N/A | |
Registrant’s Investment Advisor | | N/A | | N/A | |
Item 5. Audit Committee of Listed Registrants.
Not applicable to registrants who are not listed issuers (as defined in Rule 10A-3 under the Securities Exchange Act of 1934).
Item 6. Schedule of Investments.
(a) Schedule of Investments is included as part of the report to shareholders filed under Item 1 of this Form.
(b) Not Applicable.
Item 7. Disclosure of Proxy Voting Policies and Procedures for Closed-End Management Investment Companies.
Not Applicable.
Item 8. Portfolio Managers of Closed-End Management Investment Companies.
Not Applicable.
Item 9. Purchases of Equity Securities by Closed-End Management Investment Company and Affiliated Purchasers.
Not Applicable.
Item 10. Submission of Matters to a Vote of Security Holders.
The registrant has not made any material changes to the procedures by which shareholders may recommend nominees to the registrant’s Board of Trustees.
Item 11. Controls and Procedures.
(a) The registrant’s principal executive officer and principal financial officer have evaluated the registrant’s disclosure controls and procedures within 90 days of this filing and have concluded based on such evaluation that the registrant’s disclosure controls and procedures were effective, as of that
date, in ensuring that information required to be disclosed by the registrant in this Form N-CSR was recorded, processed, summarized, and reported within the time periods specified in the Securities and Exchange Commission’s rules and forms.
(b) There were no changes in the registrant’s internal control over financial reporting (as defined in Rule 30a-3(d) under the Investment Company Act of 1940) that occurred during the registrant’s last fiscal quarter that have materially affected, or are reasonably likely to materially affect, the registrant’s internal control over financial reporting.
Item 12. Exhibits.
(a) (1) Any code of ethics or amendment thereto, that is subject of the disclosure required by Item 2, to the extent that the registrant intends to satisfy Item 2 requirements through filing an exhibit. Incorporated by reference to the registrant’s Form N-CSR filed March 10, 2011.
(2) Certifications pursuant to Section 302 of the Sarbanes-Oxley Act of 2002. Filed herewith.
(3) Any written solicitation to purchase securities under Rule 23c-1 under the Act sent or given during the period covered by the report by or on behalf of the registrant to 10 or more persons. Not applicable to open-end investment companies.
(b) Certification pursuant to Section 906 of the Sarbanes-Oxley Act of 2002. Filed herewith.
SIGNATURES
Pursuant to the requirements of the Securities Exchange Act of 1934 and the Investment Company Act of 1940, the registrant has duly caused this report to be signed on its behalf by the undersigned, thereunto duly authorized.
(Registrant) Guinness Atkinson Funds
By | /s/ James J. Atkinson | | |
Name: | James J. Atkinson | | |
Title: | President | | |
Date: | 3/8/13 | | |
Pursuant to the requirements of the Securities Exchange Act of 1934 and the Investment Company Act of 1940, this report has been signed by the following persons on behalf of the registrant and in the capacities and on the dates indicated.
By | /s/ James J. Atkinson | | |
Name: | James J. Atkinson | | |
Title: | President | | |
Date: | 3/8/13 | | |
| | | |
| | | |
By | /s/ Rita Dam | | |
Name: | Rita Dam | | |
Title: | Treasurer | | |
Date: | 3/7/13 | | |