UNITED STATES
SECURITIES AND EXCHANGE COMMISSION
Washington, D.C. 20549
FORM N-CSR
CERTIFIED SHAREHOLDER REPORT OF REGISTERED
MANAGEMENT INVESTMENT COMPANIES
Investment Company Act file number | 811-08360 |
|
GUINNESS ATKINSON FUNDS |
(Exact name of registrant as specified in charter) |
|
21550 Oxnard Street, Suite 750 Woodland Hills, CA | | 91367 |
(Address of principal executive offices) | | (Zip code) |
|
James J. Atkinson, Jr. 21550 Oxnard Street, Suite 750 Woodland Hills, CA 91367 |
(Name and address of agent for service) |
|
Registrant’s telephone number, including area code: | (800-915-6566) - | |
|
Date of fiscal year end: | December 31 | |
|
Date of reporting period: | December 31, 2011 | |
| | | | | | | | |
Item 1. Reports to Stockholders.
The registrant’s annual report transmitted to shareholders pursuant to Rule 30e-1 under the Investment Company Act of 1940, as amended (the “Investment Company Act”), is as follows:


Annual
Report
December 31, 2011
• Alternative Energy Fund
• Asia Focus Fund
• Asia Pacific Dividend Fund
• China & Hong Kong Fund
• Global Energy Fund
• Global Innovators Fund
• Renminbi Yuan & Bond Fund
Guinness Atkinson Funds
Annual Report
December 31, 2011
TABLE OF CONTENTS
| 4 | | | Letter to Shareholders | |
|
| 7 | | | Expense Example | |
|
| 8 | | | Alternative Energy Fund | |
|
| 16 | | | Asia Focus Fund | |
|
| 23 | | | Asia Pacific Dividend Fund | |
|
| 29 | | | China & Hong Kong Fund | |
|
| 35 | | | Global Energy Fund | |
|
| 42 | | | Global Innovators Fund | |
|
| 50 | | | Renminbi Yuan & Bond Fund | |
|
| 56 | | | Statements of Assets and Liabilities | |
|
| 58 | | | Statements of Operations | |
|
| 60 | | | Statements of Changes in Net Assets | |
|
| 63 | | | Financial Highlights | |
|
| 70 | | | Notes to Financial Statements | |
|
| 83 | | | Report of Independent Registered Public Accounting Firm | |
|
| 84 | | | Trustee and Officer Information | |
|
| 86 | | | Privacy Notice | |
|
| 87 | | | Guinness Atkinson Funds Information | |
|
3
Dear Guinness Atkinson Funds Shareholders,
To acknowledge the obvious, 2011 will not be among our favorite years. All of the Guinness Atkinson Funds with a full year track record produced negative total returns during the year. The newest member of the Guinness Atkinson Fund family, the Renminbi Yuan & Bond Fund, did manage to produce a positive return during its first six months which ended December 31, 2011. Despite the generally disappointing performance for the year we feel many of the Funds still have had excellent longer term results. The most obvious exception to that statement is the Alternative Energy Fund; more on that in a moment. Notwithstanding the performance of the Guinness Atkinson Funds or the global stock markets of late, we're still optimistic about the themes that underlie our fund range and look forward to improving performance both for the markets, our Funds and the global economy. And while it is still early in 2012, the year is starting off quite well for each of the Funds.
The performance of the Alternative Energy Fund pains all of us. We are still strongly of the opinion that alternative energy will play a major role in meeting the world's energy needs in coming years. In fact, it seems to us to be an inescapable conclusion. But, short term issues have swamped the long term potential. These short term issues include a weak global economy, reduced government support for alternative energy and a scarcity of capital at a time when much of the industry is still in its development years. Despite these short term negatives there are some positive developments. Most importantly solar technology continues to improve and the cost of solar panels continues to drop as efficiency increases. We believe we are not far from the day when solar power (without subsidy) is fully competitive with grid delivered electricity. If you live in the sunnier portions of the US you may have noticed more and more solar installations in your neighborhood. Our view is that within a few years neighborhood solar panels will be the norm.
As in past letters, we continue to advise investors to focus on the long term. In many ways it seems that we are alone in this long term orientation. We understand that global markets have become volatile and that for many sectors the buy and hold strategy has not worked well. Two points are worth making here. First, the themes that underlie the Guinness Atkinson Funds are by their very definition long term. We see more velocity in and out of the Guinness Atkinson Funds than seems appropriate, particularly given the long term nature of the Funds. Second, the Guinness Atkinson Funds with long term track records have generally done quite well. We don't mean to boast here; our point is more that we believe that the Guinness Atkinson Funds are meant to be long term investments and despite some very volatile periods, including a very weak 2011, the Funds have generally done well over the long term.
Fund Performance
The table below provides total return data for each of the Funds over the one, three, five, ten and from inception periods through December 31, 2011. Also included in the table is the expense ratio data from the most recent prospectus dated May 1, 2011. Astute readers will recognize that these expense ratios are inconsistent with the expense ratios found elsewhere in this report. By rule we are required to provide this expense ratio data whenever standardized performance data is provided and, further, the rule requires data from the most recent prospectus, which is sourcing its data from the 2010 annual report.
| Fund (inception date) | | 1-year | | 3-year | | 5-year | | 10-year | | From Inception | | Expense Ratio | |
| Alternative Energy Fund (March 31, 2006) | | | -42.53 | % | | | -15.71 | % | | | -21.93 | % | | | N/A | | | | -20.55 | % | | 1.76% | |
| Asia Focus (April 29, 1996) | | | -22.35 | % | | | 20.27 | % | | | 1.60 | % | | | 11.67 | % | | | 2.67 | % | | 1.67% | |
| Asia Pacific Dividend Fund (March 31, 2006) | | | -14.04 | % | | | 20.55 | % | | | 1.32 | % | | | N/A | | | | 2.93 | % | | 2.92% gross; 2.01% net† | |
| China & Hong Kong (June 30, 1994) | | | -27.52 | % | | | 17.25 | % | | | 3.91 | % | | | 11.29 | % | | | 7.38 | % | | 1.48% | |
| Global Energy Fund (June 30, 2004) | | | -13.16 | % | | | 18.25 | % | | | 3.15 | % | | | N/A | | | | 13.37 | % | | 1.25% | |
| Global Innovators Fund (December 15, 1998) | | | -6.51 | % | | | 16.67 | % | | | 0.99 | % | | | 3.77 | % | | | 3.72 | % | | 1.47% gross; 1.55% net† | |
| Renminbi Yuan & Bond Fund (June 30, 2011) | | | N/A | | | | N/A | | | | N/A | | | | N/A | | | | 0.16 | % | | .90%* | |
Periods of greater than one year are average annualized returns; one year and shorter period returns are actual returns. All returns are for the periods ending December 31, 2011.
4
Performance data quoted represents past performance and does not guarantee future results. The investment return and principal value of an investment will fluctuate so that an investor's shares, when redeemed, may be worth more or less than the original cost. Current performance of the Funds may be lower or higher than the performance quoted. Performance data current to the most recent month end may be obtained by visiting www.gafunds.com. Each Fund imposes a 2% redemption fee on shares held less than 30 days. Performance data quoted does not reflect this fee. If it had, total return would be lower.
†All of the Guinness Atkinson Funds have an expense cap in place and the advisor is contractually obligated to cap the total expenses at least through June 30, 2012 and June 30, 2013 for the Renminbi Yuan & Bond Fund.
Expense ratios are from the most recent prospectus (dated May 1, 2011) and are from the most recent audited financials (period ending December 31, 2010) at the time that prospectus was completed.
*The Fund commenced operations on June 30, 2011.
Our investment team has provided a detailed commentary for each of the Guinness Atkinson Funds adjacent to each Fund's financial results. Below you'll find Morningstar ratings data for the Fund range.
As usual, we appreciate the confidence you have placed in us and our management team and look forward to what will hopefully be a great 2012.
Sincerely,


Timothy Guinness James Atkinson
5
Morningstar Ratings (based on Morningstar risk adjusted returns)
Below is a table listing the Morningstar star ratings as of December 31, 2011 for the six Guinness Atkinson Funds that have at least a three year history. Parenthetical numbers after the star rating indicate the number of funds in the comparison group.
| Fund | | Category | | Overall | | 3-year | | 5-year | | 10-year | |
Alternative Energy
Fund | | Equity Energy
| | | 1
(75 funds) | * | | | 1
(75 funds) | * | | | 1
(61 funds) | * | | | N/A
| | |
Asia Focus
Fund | | Pacific/Asia
Ex-Japan Stk | | | 2
(65 funds) | ** | | | 3
(65 funds) | *** | | | 2
(41 funds) | ** | | | 2
(35 funds) | ** | |
Asia Pacific Dividend
Fund | | Pacific/Asia
Ex-Japan Stk | | | 3
(65 funds) | *** | | | 4
(65 funds) | **** | | | 3
(41 funds) | *** | | | N/A
| | |
China & Hong Kong
Fund | | China Region | | | 3
(80 funds) | *** | | | 3
(80funds) | *** | | | 3
(61 funds) | *** | | | 3
(29 funds) | *** | |
Global Energy
Fund | | Equity Energy
| | | 3
(75 funds) | *** | | | 4
(75 funds) | **** | | | 3
(61 funds) | *** | | | N/A
| | |
Global Innovators
Fund | | Large Growth
| | | 3
(1,478 funds) | *** | | | 3
(1,478 funds) | *** | | | 2
(1,279 funds) | ** | | | 3
(804 funds) | *** | |
©2012 Morningstar, Inc. All Rights Reserved. The information contained herein: (1) is proprietary to Morningstar and/or its content providers; (2) may not be copied or distributed; and (3) is not warranted to be accurate, complete or timely. Neither Morningstar nor its content providers are responsible for any damages or losses arising from any use of this information. Past performance is no guarantee of future results.
The Funds invest in foreign securities which involves greater volatility and political, economic and currency risks and differences in accounting methods. Non-diversified Funds' assets may be concentrated in fewer individual holdings than diversified funds. Therefore, these Funds are more exposed to individual stock volatility than diversified funds. Investments in smaller companies involve additional risks such as limited liquidity and greater volatility. Investments in debt securities typically decrease in value when interest rates rise, which can be greater for long-term debt securities. The Funds may invest in derivatives which involves risks different from, and in certain cases, greater than the risks presented by traditional investments.
For each fund with at least a three-year history, Morningstar calculates a Morningstar RatingTM based on a Morningstar Risk-Adjusted Return measure that accounts for variation in a fund's monthly performance (including the effects of sales charges, loads, and redemption fees), placing more emphasis on downward variations and rewarding consistent performance. The top 10% of funds in each category receive 5 stars, the next 22.5% receive 4 stars the next 35% receive 3 stars, the next 22.5% receive 2 stars and the bottom 10% receive 1 star. (Each share class is counted as a fraction of one fund within this scale and rated separately, which may cause slight variations in distribution percentages.)
6
GUINNESS ATKINSON FUNDS
Expense Examples (Unaudited)
As a shareholder of the Funds, you incur two types of costs: (1) redemption fees; and (2) ongoing costs, including advisory fees; and other Fund expenses. The examples below are intended to help you understand your ongoing costs (in dollars) of investing in the Funds and to compare these costs with the ongoing costs of investing in other mutual funds.
The examples are based on an investment of $1,000 invested at the beginning of the period shown and held for the entire period from July 1, 2011 to December 31, 2011.
Actual Expenses
For each Fund, the first line of the table below provides information about actual account values and actual expenses. You may use the information in this line, together with the amount you invested, to estimate the expenses that you paid over the period. Simply divide your account value by $1,000 (for example, an $8,600 account value divided by $1,000 = 8.6), then multiply the result by the number in the first line under the heading entitled "Expenses Paid during Period" to estimate the expenses you paid on your account during this period.
Hypothetical Example for Comparison Purposes
For each Fund, the second line of the table below provides information about hypothetical account values and hypothetical expenses based on the Fund's actual expense ratios and an assumed rate of return of 5% per year before expenses, which is not the Fund's actual return. The hypothetical account values and expenses may not be used to estimate the actual ending account balance or expenses you paid for the period. You may use this information to compare the ongoing costs of investing in the Fund and other funds. To do so, compare this 5% hypothetical example with the 5% hypothetical examples that appear in the shareholder reports of the other funds.
Please note that the expenses shown in the table are meant to highlight your ongoing costs only and do not reflect any redemption fees. Therefore, the second line for each Fund of the table is useful in comparing ongoing costs only, and will not help you determine the relative total costs of owning different funds. In addition, if these redemption fees were included, your costs would have been higher.
| | | Beginning
Account
Value
(07/01/11) | | Ending
Account
Value
(12/31/11) | | Expenses Paid
During Period*
(07/01/11 to
12/31/11) | | Expense Ratios
During Period*
(07/01/11 to
12/31/11) | |
| Guinness Atkinson Alternative Energy Fund Actual | | $ | 1,000.00 | | | $ | 591.90 | | | $ | 7.34 | | | | 1.83 | % | |
Guinness Atkinson Alternative Energy Fund Hypothetical
(5% return before expenses) | | $ | 1,000.00 | | | $ | 1,015.98 | | | $ | 9.30 | | | | 1.83 | % | |
| Guinness Atkinson Asia Focus Fund Actual | | $ | 1,000.00 | | | $ | 765.20 | | | $ | 7.12 | | | | 1.60 | % | |
Guinness Atkinson Asia Focus Fund Hypothetical
(5% return before expenses) | | $ | 1,000.00 | | | $ | 1,017.14 | | | $ | 8.13 | | | | 1.60 | % | |
| Guinness Atkinson Asia Pacific Dividend Fund Actual | | $ | 1,000.00 | | | $ | 851.90 | | | $ | 9.24 | | | | 1.98 | %† | |
Guinness Atkinson Asia Pacific Dividend Fund Hypothetical
(5% return before expenses) | | $ | 1,000.00 | | | $ | 1,015.22 | | | $ | 10.06 | | | | 1.98 | %† | |
| Guinness Atkinson China & Hong Kong Fund Actual | | $ | 1,000.00 | | | $ | 757.70 | | | $ | 6.82 | | | | 1.54 | % | |
Guinness Atkinson China & Hong Kong Fund Hypothetical
(5% return before expenses) | | $ | 1,000.00 | | | $ | 1,017.44 | | | $ | 7.83 | | | | 1.54 | % | |
| Guinness Atkinson Global Energy Fund Actual | | $ | 1,000.00 | | | $ | 798.10 | | | $ | 6.21 | | | | 1.37 | % | |
Guinness Atkinson Global Energy Fund Hypothetical
(5% return before expenses) | | $ | 1,000.00 | | | $ | 1,018.30 | | | $ | 6.97 | | | | 1.37 | % | |
| Guinness Atkinson Global Innovators Fund Actual | | $ | 1,000.00 | | | $ | 909.10 | | | $ | 6.78 | | | | 1.41 | % | |
Guinness Atkinson Global Innovators Fund Hypothetical
(5% return before expenses) | | $ | 1,000.00 | | | $ | 1,018.10 | | | $ | 7.17 | | | | 1.41 | % | |
| Guinness Atkinson Renminbi Yuan & Bond Fund Actual | | $ | 1,000.00 | | | $ | 1,001.60 | | | $ | 4.54 | | | | 0.90 | %† | |
Guinness Atkinson Renminbi Yuan & Bond Fund Hypothetical
(5% return before expenses) | | $ | 1,000.00 | | | $ | 1,020.67 | | | $ | 4.58 | | | | 0.90 | %† | |
*Expenses are equal to the Funds' annualized expense ratio as indicated, multiplied by the average account value over the period, multiplied by the number of days in most recent fiscal half-year period (184), then divided by the number of days in the fiscal year (365) (to reflect the one-half year period).
†Net of fee waivers and/or expense reimbursements. If those fee waivers and/or expense reimbursements had not been in effect, the Fund's actual expenses would have been higher.
7
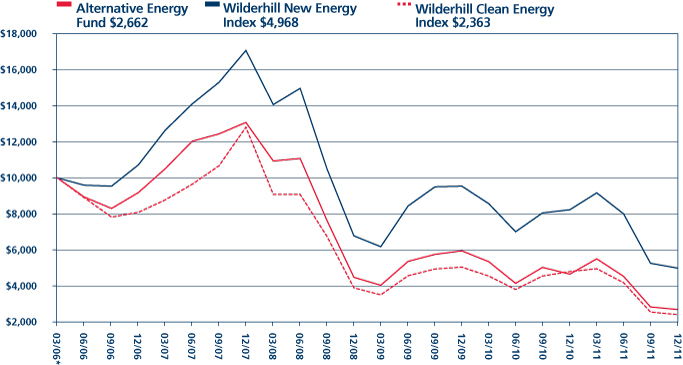
ALTERNATIVE ENERGY FUND for the period ended December 31, 2011
1. Performance
AVERAGE ANNUALIZED TOTAL RETURNS
| | | 1 Year
(actual) | | 3 Years | | 5 Years | | Since
inception
(March 31, 2006) | |
| Fund | | | -42.53 | % | | | -15.71 | % | | | -21.93 | % | | | -20.55 | % | |
| Benchmark Indices: | |
| Wilderhill New Energy Global Innovation Index | | | -39.61 | % | | | -9.75 | % | | | -14.27 | % | | | -11.46 | % | |
| Wilderhill Clean Energy Index | | | -50.48 | % | | | -15.11 | % | | | -21.76 | % | | | -22.18 | % | |
| MSCI World Index | | | -5.01 | % | | | 11.81 | % | | | -1.76 | % | | | 0.60 | % | |
The Fund's gross expense ratio is 1.76% per the Summary Prospectus dated May 1, 2011. Guinness Atkinson Asset Management has contractually agreed to waive a portion of its advisory fees so that the Fund's ratio of expenses to average daily net assets will not exceed 1.98% (excluding Acquired Fund Fees and Expenses, interest, taxes, dividends on short positions and extraordinary expenses) through at least June 30, 2012. To the extent that the Advisor waives fees it may seek repayment of a portion or all of such amounts at any time within the three fiscal years after the fiscal year in which such amounts were waived, subject to the applicable cap.
Performance data quoted represents past performance and does not guarantee future results. The investment return and principal value of an investment will fluctuate so that an investor's shares, when redeemed, may be worth more or less than their original cost. Current performance of the Fund may be lower or higher than the performance quoted. Performance data current to the most recent month end may be obtained by visiting www.gafunds.com, or calling (800) 916-6566.
The Fund imposes a 2% redemption fee on shares held less than 30 days. Performance data quoted does not reflect the 2% redemption fee on shares held less than 30 days. Total returns for certain periods reflect a fee waiver in effect and in the absence of this waiver, the total returns would have been lower.
The Guinness Atkinson Alternative Energy Fund was down 42.53% in 2011. This compared to a fall in the Wilderhill New Energy Global Innovation Index of 39.61% and in the Wilderhill Clean Energy Index of 50.48%. The year was particularly disappointing given the strong first quarter. The alternative energy industry appeared to be getting back on track but the European debt crisis set the recovery back dramatically.
As a result of the crisis, demand for alternative energy was weaker in key European markets which was compounded by the difficulty investors faced in procuring bank financing. The ensuing oversupply in both the wind and solar sectors saw pricing pressure and lower volumes than expected which significantly eroded profitability and hurt share prices.
The Fund has been positioned in the lower cost solar manufacturers, and while we believe these companies are positioned to emerge as leaders in the next cycle of the industry, 2012 saw indiscriminate poor performance from all solar stocks and notwithstanding the Fund's sales of some solar holdings in the first quarter, the remaining solar holdings were the main driver of the Fund's weak performance.
The wind sector also experienced a difficult year, with installations levels plateauing in most market and continued pricing pressure, which weighed on the stock prices of the turbine manufacturers.
The Fund's better performing stocks were mainly the renewables utility holdings, with a notable outperformance from one of the Fund's ground source heat pump stocks – LSB Industries.
Stock performance numbers taken as the price return of the stocks when included in the fund; Source: Bloomberg
8
ALTERNATIVE ENERGY FUND
2. Portfolio
| Sector | | % of Assets | |
| Wind | | | 38.89 | % | |
| Solar | | | 35.19 | % | |
| Efficiency | | | 11.30 | % | |
| Geothermal | | | 3.18 | % | |
| Hydro | | | 6.40 | % | |
| Biomass Energy | | | 0.00 | % | |
| Cash | | | 1.46 | % | |
| | | | 100.00 | % | |
| Domicile* | | % of Assets | |
| Europe | | | 36.28 | % | |
| Asia | | | 30.88 | % | |
| North America | | | 28.31 | % | |
| Latin America | | | 3.07 | % | |
| Australasia | | | 0.00 | % | |
| Cash | | | 1.46 | % | |
| | | | 100.00 | % | |
* region is as per company domicile.
The portfolio is concentrated in the wind and solar sectors, with 38.89% in Wind and 35.19% in Solar. We believe these sectors have the best long-term growth potential of the alternative energy space.
Within the Solar sector, most of our holdings have Asian manufacturing capabilities, as we believe that this is essential for a competitive cost structure today. Further solar holdings are in leading installers with good exposure to the end market volume growth and we hold one company that manufactures inverters.
For our Wind exposure we are invested in both turbine manufacturers and wind farm developers. In the long run, we believe that there are good potential returns both from owning Wind assets and investing in the turbine value chain as the Wind industry becomes more mainstream and as offshore Wind gains traction.
Further investments are in a hydroelectric power producer in Latin America, a geothermal company, a ground source heat pump company two metering companies and two inverter manufacturers.
The Fund has 36.28% of its holdings in companies domiciled in Europe, reflecting the more mature European industry. North America accounts for 28.31% of the Fund. The Fund's 33.96% of emerging markets holdings is principally in Asia, with our investments in Chinese companies making up 30.88% of the Fund.
| Mkt Cap $m | | Positions | | % of Assets | |
| >1000 | | | 13 | | | | 41.99 | % | |
| 500-1000 | | | 6 | | | | 18.60 | % | |
| 250-500 | | | 6 | | | | 20.44 | % | |
| 100-250 | | | 4 | | | | 14.12 | % | |
| 50-100 | | | 0 | | | | 0.00 | % | |
| <50 | | | 3 | | | | 3.39 | % | |
9
ALTERNATIVE ENERGY FUND
| Position size | | Positions | | % of Assets | |
| Full | | | 29 | | | | 95.15 | % | |
| Half | | | 0 | | | | 0.00 | % | |
| Research | | | 3 | | | | 3.39 | % | |
The liquidity of the Fund remains excellent, with 41.99% of the Fund in companies with a market capitalization over US$1,000 million. The Fund now has 29 full units and 3 research holdings.
3. Activity
The Fund uses a structure of 30 equally weighted holdings, a small number of which are split into two half holdings. The Fund has also historically held a small number of research holdings. The Fund has moved away from holding half-units in stocks in favour of holding full units in stocks and there has been a reduction in the number of research holdings. The Fund should continue to hold around 30 equally weighted holdings.
The Fund acquired new positions in Enel Green Power, Nordex, Verbund, China Datang, China Longyuan, China Suntien, Huaneng Renewables, Elster, Power One. As a result the Fund has increased its exposure to utility stocks in both Europe and China. Elster is a metering company that complements the fund's holding in Itron and Power One increases the Fund's holdings in inverter manufacturers.
The Fund sold its holdings in Iberdrola Renovables, Phoenix Solar, Solarworld, Clipper Windpower, Hansen Transmissions, PV Crystalox, Renewable Energy Corporation, Canadian Solar, First Solar, LSB Industries and MEMC Electronics. The main emphasis has been on reducing the Fund's exposure to solar companies, in our view, that do not have a competitive cost structure in the current pricing environment, which has principally involved selling the Fund's remaining European solar holdings.
4. Outlook
We believe that 2012 should be a challenging year for companies in the sector as a result of the current economic environment. The sector is vulnerable to lack of financing and reductions in subsidies. However, we would point out that the share prices and valuations reflect this challenging environment and there is potential for earnings expectations for 2012 to be exceeded given how low they have been set and for the outlook for 2013 to improve, both of which would be positive for share prices.
It is our view that there should be a demand response to the current low price of solar modules that could see demand exceed expectations. The low cost solar manufacturers should be able to operate plants at capacities that allow them to continue lowering costs further, which, in our view, should lead to higher margins and a better ability to compete. Headwinds include further German tariff reductions and the potential imposition of import tariffs on solar modules by the US. However, a major difference between today and three years ago is that Germany is now less than 30% of the market, having been over half of the market and the main countries experiencing growth in demand are emerging markets and those with high electricity prices. In our view, this provides better diversification of the sources of solar demand.
In our view, key markets for 2012 will be China and the US. China has introduced a feed-in tariff that is leading to demand far in excess of that expected and based on Edward Guinness's visit to China in early 2011, we do not think that China will look to constrain the volumes of installations. The US is emerging as a serious market with utility scale installations leading the way. We also note the emergence of the rent-a-roof model in the US that is likely to lead to rapid deployment of residential installations that provide a firmer foundation for demand. We also believe that we will start to see installations in Germany and Italy being made that do not rely on Feed-in Tariffs for their economics, which should begin the transition away from subsidies.
We expect that the key drivers of growth in the wind market will be emerging markets and the construction of large new offshore wind installations. The US market has been hurt by the low natural gas price caused by the production of high volumes of shale gas. There is an expectation that 2012 could be a relatively strong year for US installations as the Production Tax Credit expires at the end of 2012, but expectations for installations in 2013 are low unless it is extended. Previously this credit has been extended on expiration, but the freeze in legislative activity caused by the US presidential election and the aggressive positioning of the Republican Party against alternative energy means that wind developers in the US are not expecting an extension and are preparing for low levels of installations in the US from 2013.
10
ALTERNATIVE ENERGY FUND
The Chinese electricity market has grown dramatically over the last five years to over 20GW of annual installations. However, the level of new installations is now expected to plateau at this high level as a result of grid constraints. There has been a sharp reduction in turbine prices as the domestic manufacturers – Dongfang Electric, Sinovel and Goldwind – compete hard. The main beneficiaries of this have been the Chinese Wind developers, which are able to generate higher returns from newly constructed assets.
We have begun to see the first indications of improvement in the US housing market, which should improve the outlook for ground source heat pump installations, and we see good opportunities for companies in the metering sector as utilities execute upgrades to their networks.
The long term outlook for the sector remains positive and continues to improve as costs of alternative energy technologies become more competitive and global demand for energy continues to rise, pushing fossil fuel prices higher.
 | |  | |
|
| Edward Guinness | | Matthew Page | |
|
The Fund invests in foreign securities, which will involve political, economic and currency risks, greater volatility, and differences in accounting methods. The Fund is non-diversified, meaning that its assets may be concentrated in fewer individual holdings than diversified funds. Therefore, the Fund is more exposed to individual stock volatility than diversified funds. The Fund invests in smaller companies, which will involve additional risks such as limited liquidity and greater volatility.
The Wilderhill New Energy Global Innovation Index (NEX) is a modified dollar-weighted index of publicly traded companies that are active in renewable and low-carbon energy, and that stand to benefit from responses to climate change and energy security concerns. The Wilderhill Clean Energy Index (ECO) is a modified equal dollar weighted index comprised of publicly traded companies whose businesses stand to benefit substantially from societal transition toward the use of cleaner energy and conservation. The MSCI World Energy Index is an unmanaged index composed of more than 1,400 stocks listed on exchanges in the U.S., Europe, Canada, Australia, New Zealand, and the Far East. These indices are unmanaged, not available for investment and do not incur expenses.
Please refer to the Schedule of Investments for details on fund holdings. Current and future portfolio holdings are subject to risk.
The information provided herein represents the opinion of Guinness Atkinson Management for the period stated and is not intended to be a forecast of future events, a guarantee of future results, or investment advice. Opinions, fund holdings and sector allocations are subject to change at any time and are not recommendations to buy or sell any security.
11
GUINNESS ATKINSON ALTERNATIVE ENERGY FUND
Growth of $10,000
Average Annual Total Return
Periods Ended December 31, 2011
| One Year | | Five Year | | Since Inception
(03/31/06)* | |
| | (42.53 | )% | | | (21.93 | )% | | | (20.55 | )% | |
* Inception date 3/31/06.
Performance data quoted represents past performance and does not guarantee future results. The investment return and principal value of an investment will fluctuate so that an investor's shares, when redeemed, may be worth more or less than their original cost. Current performance of the Fund may be lower or higher than the performance quoted. Performance data current to the most recent month end may be obtained by visiting www.gafunds.com.
Total returns reflect a fee waiver in effect and in the absence of this waiver, the total returns would be lower. The Fund imposes a 2% redemption fee on shares held less than 30 days.
The Wilderhill New Energy Global Innovations Index (NEX) is a modified dollar weighted index of publicly traded companies, which are active in renewable and low-carbon energy, and which stand to benefit from responses to climate change and energy security concern. The Wilderhill Clean Energy Index (ECO) is a modified equal dollar weighted index comprised of publicly traded companies whose businesses stand to benefit substantially from societal transition toward the use of cleaner energy and conservation.
12
FUND HIGHLIGHTS at December 31, 2011
GUINNESS ATKINSON ALTERNATIVE ENERGY FUND
| # of Holdings in Portfolio: | | 33 | |
| Portfolio Turnover: | | 43.1% | |
| % of Stocks in Top 10: | | 36.3% | |
| Fund Managers: | |
| Edward Guinness | | | |
| Top 10 Holdings (% of net assets) | | | | Sector Breakdown (% of net assets) | | | |
| WaterFurnace Renewable Energy, Inc. | | 4.7% | | Wind | | 42.6% | |
| Greentech Energy Systems | | 3.9% | | Solar | | 32.1% | |
| Boralex, Inc. | | 3.6% | | Efficiency | | 14.5% | |
| Gamesa Corporacion Tecnologica S.A. | | 3.6% | | Hydro | | 6.4% | |
| SunPower Corp. - Class B | | 3.6% | | Geothermal | | 3.2% | |
| STR Holdings, Inc. | | 3.5% | | | | | |
| China Longyuan Power Group Corp. - H Shares | | 3.4% | | | | | |
| SMA Solar Technology AG | | 3.4% | | | | | |
| Verbund AG | | 3.3% | | | | | |
| EDP Renovaveis SA | | 3.3% | | | | | |
13
SCHEDULE OF INVESTMENTS
at December 31, 2011
GUINNESS ATKINSON ALTERNATIVE ENERGY FUND
| Shares | | COMMON STOCKS: 98.8% | | Value | |
| Efficiency: 14.5% | | | |
| | 146,000 | | | Applied Intellectual Capital Ltd.*†^ | | $ | — | | |
| | 760,987 | | | Carmanah Technologies Corp.*† | | | 336,141 | | |
| | 44,000 | | | Elster Group SE - ADR* | | | 572,000 | | |
| | 16,000 | | | Itron, Inc.* | | | 572,320 | | |
| | 4,445,888 | | | Thermal Energy International, Inc.*† | | | 250,934 | | |
| | 53,700 | | | WaterFurnace Renewable Energy, Inc. | | | 820,193 | | |
| | | | | | | | 2,551,588 | | |
| Geothermal: 3.2% | | | |
| | 31,119 | | | Ormat Technologies, Inc. | | | 561,076 | | |
| Hydro: 6.4% | | | |
| | 30,453 | | | Cia Energetica de Minas Gerais ADR | | | 541,759 | | |
| | 21,800 | | | Verbund AG | | | 585,029 | | |
| | | | | | | | 1,126,788 | | |
| Solar: 32.1% | | | |
| | 428,500 | | | JA Solar Holdings Co., Ltd.* | | | 574,190 | | |
| | 122,200 | | | LDK Solar Co., Ltd. - ADR* | | | 512,018 | | |
| | 143,000 | | | Power-One Inc.* | | | 559,130 | | |
| | 356,600 | | | Renesola Ltd. - ADR* | | | 545,598 | | |
| | 10,560 | | | SMA Solar Technology AG | | | 589,947 | | |
| | 74,900 | | | STR Holdings, Inc.* | | | 616,427 | | |
| | 100,705 | | | SunPower Corp. - Class B* | | | 627,392 | | |
| | 247,291 | | | Suntech Power Holdings Co., Ltd. - ADR* | | | 546,513 | | |
| | 80,500 | | | Trina Solar Ltd. - ADR* | | | 537,740 | | |
| | 136,500 | | | Yingli Green Energy Holding Co., Ltd. - ADR* | | | 518,700 | | |
| | | | | | | | 5,627,655 | | |
| Wind: 42.6% | | | |
| | 6,200 | | | Acciona S.A. | | | 535,464 | | |
| | 90,387 | | | Boralex, Inc.* | | | 632,598 | | |
| | 2,946,000 | | | China Datang Corp. Renewable Power Co. Ltd. - H Shares* | | | 531,043 | | |
| | 763,000 | | | China Longyuan Power Group Corp. - H Shares | | | 596,324 | | |
| | 2,967,000 | | | China Suntien Green Energy Corp. Ltd. - H Shares | | | 519,548 | | |
| | 94,300 | | | EDP Renovaveis SA* | | | 577,040 | | |
| | 264,600 | | | Enel Green Power SpA | | | 552,727 | | |
| | 152,219 | | | Gamesa Corporacion Tecnologica S.A. | | | 632,399 | | |
| | 221,100 | | | Greentech Energy Systems* | | | 692,946 | | |
| | 2,264,000 | | | Huaneng Renewables Corp. Ltd. - H Shares* | | | 559,689 | | |
| | 108,400 | | | Nordex SE* | | | 554,171 | | |
| | 491,416 | | | Theolia SA* | | | 546,972 | | |
| | 51,315 | | | Vestas Wind Systems A/S* | | | 553,955 | | |
| | | | | | | | 7,484,876 | | |
| | | | | Total Common Stocks
(cost $33,674,278) | | | 17,351,983 | | |
The accompanying notes are an integral part of these financial statements.
14
| | | | Value | |
| | | | | Total Investments in Securities
(cost $ $33,674,278): 98.8% | | $ | 17,351,983 | | |
| | | | | Other Assets less Liabilities: 1.2% | | | 208,520 | | |
| | | Net Assets: 100.0% | | $ | 17,560,503 | | |
* Non-income producing security.
† Illiquid. Illiquid securities represent 3.3% of net assets.
^ Fair value under direction of the Board of Trustees. Fair valued securities represent 0.0% of net assets.
ADR - American Depository Receipt
The accompanying notes are an integral part of these financial statements.
15
ASIA FOCUS FUND for the period ended December 31, 2011
1. Performance
AVERAGE ANNUALIZED TOTAL RETURNS
| | | 6 Months
(actual) | | 1 Year
(actual) | | 3 Years | | 5 Years | | 10 Years | |
| Fund | | | -23.48 | % | | | -22.35 | % | | | 20.27 | % | | | 1.60 | % | | | 11.67 | % | |
| Benchmark Index: | |
| MSCI AC Far East Free Ex Japan | | | -16.60 | % | | | -14.68 | % | | | 19.84 | % | | | 3.19 | % | | | 11.46 | % | |
| S&P 500 | | | -3.70 | % | | | 2.09 | % | | | 14.12 | % | | | -0.25 | % | | | 2.92 | % | |
The Fund's gross expense ratio is 1.67% per the Summary Prospectus dated May 1, 2011. Guinness Atkinson Asset Management has contractually agreed to waive a portion of its advisory fees so that the Fund's ratio of expenses to average daily net assets will not exceed 1.98% (excluding Acquired Fund Fees and Expenses, interest, taxes, dividends on short positions and extraordinary expenses) through at least June 30, 2012. To the extent that the Advisor waives fees it may seek repayment of a portion or all of such amounts at any time within the three fiscal years after the fiscal year in which such amounts were waived, subject to the applicable cap.
Performance data quoted represents past performance and does not guarantee future results. The investment return and principal value of an investment will fluctuate so that an investor's shares, when redeemed, may be worth more or less than their original cost. Current performance of the Fund may be lower or higher than the performance quoted. Performance data current to the most recent month end may be obtained by visiting www.gafunds.com, or calling (800) 916-6566.
The Fund imposes a 2% redemption fee on shares held less than 30 days. Performance data quoted does not reflect the 2% redemption fee on shares held less than 30 days. Total returns for certain periods reflect a fee waiver in effect and in the absence of this waiver, the total returns would have been lower.
The Fund had a disappointing year in 2011, and suffered as a result of volatility in Asian equity markets, particularly in the third quarter of the year. During the third quarter, there was a fall in global risk appetite as a result of fears over excess sovereign debt in the Eurozone countries, and this caused volatility in global equity markets. Emerging markets equities, including Asian equities, suffered relative to developed world equities as investors considered them to be riskier than their counterparts in the US or Europe. In our view, the flight to developed world assets reflects a misunderstanding of the real risks in the financial world at present, given much of the excess leverage, and the risk to sovereign finances, lies in the developed world and not in Asia. In our view, some of the selling was based on fear, and was detached from the reality of balance sheet strength and faster growth in Asia, relative to the US and Europe.
In addition to these macro issues, the construction of the portfolio is driven by bottom-up stock selection, and we have overweight positions in some sectors which suffered on a relative basis this year. The Fund is overweight in Materials, Energy and Industrials stocks, and is underweight in Consumer Staples and Utilities, sectors which are traditionally considered as having 'defensive' earnings. In our view, Materials, Energy and Industrials stocks offer a good combination of earnings growth, and a reasonable valuation, although their earnings can be considered reasonably cyclical. These stocks have suffered excessively, in our view, given there are also investor concerns about a slowdown in Chinese growth, partly due to slowing growth globally, and partly due to the monetary tightening policies of the Chinese authorities.
Although global growth is clearly slowing, the Chinese authorities seem to have changed course on monetary policy, and have already started some limited loosening. The loosening reflects a shift to more pro-growth policies, but also their view that inflation and the property market are coming under control. If this trend continues, it is likely to be positive for the construction industry in China, and this could help confidence return to some of our holdings in Materials, Energy and Industrials.
Elsewhere in Asia, there was a decent performance from Thai equities, where the Fund is well represented. Thailand held a successful transfer of power following its general election in July, and this helped improve confidence with international investors. However, there was widespread flooding in October, and as a result there was disruption and dislocation of economic activity. It seems, though, that there was little permanent damage to Thailand's infrastructure as a result, and the market was one of the better performers over the full year.
16
ASIA FOCUS FUND
2. Portfolio Position
The Fund remains overweight in Chinese equities, and the rise of domestic consumption there is the central theme in the portfolio. Portfolio construction is driven principally by stock selection, but the portfolio is managed to reflect our view of the macro circumstances. Although Chinese economic growth has slowed in recent quarters, it is still rapid for a country of its size, and China should continue to suck in goods and services from elsewhere in Asia.
The Fund is also overweight in Thailand and Indonesia, and both of these countries have continued to grow well in the last year, despite facing challenges. We did not change positioning as a result of the flooding in Thailand, and we have been rewarded with a decent bounce in our equity holdings there. Growth in Indonesia has been consistently impressive in the last two years, and the market has attracted more foreign capital as a result. Indeed, Indonesia was one of the select few equity indices in Asia to finish 2011 in positive territory. We are looking more closely at Indonesia in the light of the Land Acquisition Act, which passed into law in December 2011. This Act is designed to encourage infrastructure development by making it easier to acquire land for government projects.
By sector, the Fund is overweight in Energy, Materials, Industrials and Information Technology stocks. This makes the Fund sensitive to domestic construction and infrastructure projects, which we see as a good way to benefit from domestic consumption growth whilst avoiding Consumer stocks, which we feel have insufficient value to be attractive. The portfolio is also underweight in Financials and Real Estate stocks, which have been under pressure due to monetary tightening in the last year, particularly in China.
3. Outlook
Looking forward, we remain concerned that the fundamental problem of excess leverage in the developed world has not been resolved, and this could cause further equity instability in the future. Economic growth remains slow in Europe, although there are some signs that growth may be beginning to bottom out in the US. In Asia, Chinese growth is clearly slowing, but the most recent economic data suggest that a gradual slowdown is underway, rather than the 'hard landing' which has been suggested by some commentators.
In our view, China remains central to the economic welfare of Asia, and we think that the prospects for this market are good for the coming year. Chinese equities have suffered a de-rating over the course of the last two years, and a range of blue-chip stocks have effectively remained below their medium-term ratings since the financial crisis of 2008/9. We think that this situation will not persist, and that investors will recognise the superior prospects of these stocks, relative to their indebted cousins in the developed world.
Elsewhere in Asia, we have been underweight in South Korea for a number of quarters, but we feel that prospects there are as bright as they have been for some time, and we are considering adding to our holdings. South Korea was down in line with the benchmark last year, but we believe its stocks have reasonable earnings momentum, and on a valuation basis we feel this is one of the more attractive markets in the region. Although South Korea has significant exports, these are spread across a range of sectors including shipbuilding, engineering, petrochemicals, electronics and mobile phone handsets. Exports to emerging markets, particularly China, are now making up a bigger part of the mix. This diversity of trading partners and sectors has helped to smooth out economic growth, whilst domestic consumption is also becoming more significant.

Edmund Harriss
The Fund invests in foreign securities, which involves political, economic and currency risks, greater volatility, and differences in accounting methods. The Fund is non-diversified, meaning its assets may be concentrated in fewer individual holdings than diversified funds. Therefore, the Fund is more exposed to individual stock volatility than diversified funds. The Fund invests in smaller companies, which involves additional risks such as limited liquidity and greater volatility.
The MSCI All Country Far East Free ex-Japan Index (MSCI AC Far East Free ex-Japan Index) is a free float-adjusted, capitalization-weighted index that is designed to measure equity market performance in the Asia region excluding Japan. The
17
ASIA FOCUS FUND
Standard & Poor's 500 Index is a market-capitalization weighted index composed of 500 widely held common stocks of U.S. companies. These indices are unmanaged, not available for investment and do not incur expenses.
Please refer to the Schedule of Investments for details on Fund holdings. Current and future portfolio holdings are subject to risk.
The information provided herein represents the opinion of Guinness Atkinson Management for the period stated and is not intended to be a forecast of future events, a guarantee of future results, or investment advice. Opinions, Fund holdings and sector allocations are subject to change at any time, and are not recommendations to buy or sell any security.
18
GUINNESS ATKINSON ASIA FOCUS FUND
Growth of $10,000

Periods Ended December 31, 2011
| One Year | | Five Year | | Ten Year | |
| | (22.35 | )% | | | 1.60 | % | | | 11.67 | % | |
Performance data quoted represents past performance and does not guarantee future results. The investment return and principal value of an investment will fluctuate so that an investor's shares, when redeemed, may be worth more or less than their original cost. Current performance of the Fund may be lower or higher than the performance quoted. Performance data current to the most recent month end may be obtained by visiting www.gafunds.com.
Total returns reflect a fee waiver in effect and in the absence of this waiver, the total returns would be lower. The Fund imposes a 2% redemption fee on shares held less than 30 days.
The MSCI All Country Far East Free ex-Japan Index (MSCI AC Far East Free ex-Japan Index) is a free float-adjusted, capitalization-weighted index that is designed to measure equity market performance in the Asia region excluding Japan. The index referenced in this chart is not available for investment and does not incur expenses.
19
FUND HIGHLIGHTS at December 31, 2011
GUINNESS ATKINSON ASIA FOCUS FUND
| # of Holdings in Portfolio: | | 39 | |
| Portfolio Turnover: | | 7.8% | |
| % of Stocks in Top 10: | | 41.4% | |
| Fund Managers: | |
| Edmund Harriss | |
| James Weir | |
| Top 10 Holdings (% of net assets) | | | |
| Hyundai Mobis | | 6.0% | |
| Samsung Electronics Co., Ltd. | | 5.0% | |
| Taiwan Semiconductor Manufacturing Co., Ltd. | | 4.5% | |
| Weichai Power Co., Ltd. - H Shares | | 4.3% | |
| Digi.Com Bhd | | 4.2% | |
| PetroChina Co., Ltd. - H Shares | | 4.0% | |
| HTC Corp. | | 3.7% | |
| Kunlun Energy Co., Ltd. | | 3.3% | |
| Dongfang Electric Corp. Ltd. - H Shares | | 3.2% | |
| Jiangxi Copper Co., Ltd. - H Shares | | 3.2% | |
| Sector Breakdown (% of net assets) | | | | | | | |
| Coal | | 10.8% | | Computers | | 2.4% | |
| Oil Company - Exploration & Production | | 8.8% | | Cellular Telecommunications | | 2.4% | |
| Oil Company - Integrated | | 6.9% | | Steel - Producers | | 2.2% | |
| Semiconductor Components - Integrated Circuits | | 6.8% | | Commercial Banks | | 2.1% | |
| Auto/Truck Parts & Equipment - Original | | 6.0% | | Exchange Traded Funds | | 2.1% | |
| Electronic Components - Semiconductor | | 5.0% | | Auto-Cars/Light Trucks | | 2.0% | |
| Electric - Generation | | 4.3% | | Building Products - Cement/Aggregate | | 2.0% | |
| Auto/Truck Parts & Equipment - Replacements | | 4.2% | | Chemicals - Other | | 1.8% | |
| Telecommunication Services | | 4.2% | | Web Portals/ISP | | 1.8% | |
| Wireless Equipment | | 3.7% | | Non-Ferrous Metals | | 1.6% | |
| Power Converson/Supply Equipment | | 3.2% | | Building & Construction Products | | 1.6% | |
| Metal - Copper | | 3.2% | | Public Thoroughfares | | 1.6% | |
| Engineering/R&D Services | | 3.1% | | Energy - Alternate Sources | | 1.3% | |
| Computers - Peripheral Equipment | | 2.5% | | Machinery - General Industry | | 0.4% | |
| Real Estate Operations/Development | | 2.5% | | | | | | | |
20
SCHEDULE OF INVESTMENTS
at December 31, 2011
GUINNESS ATKINSON ASIA FOCUS FUND
| Shares | | COMMON STOCKS: 100.5% | | Value | |
| China: 33.8% | | | |
| | 309,000 | | | Anhui Conch Cement Co Ltd - H Shares | | $ | 917,062 | | |
| | 321,000 | | | China Shenhua Energy Co., Ltd. - H Shares | | | 1,392,849 | | |
| | 1,209,900 | | | db x-trackers - CSI300 INDEX ETF - 2D | | | 959,620 | | |
| | 490,000 | | | Dongfang Electric Corp. Ltd. - H Shares | | | 1,451,085 | | |
| | 1,104,636 | | | Guangzhou Automobile Group Co., Ltd. - H Shares | | | 921,644 | | |
| | 168,300 | | | JA Solar Holdings Co., Ltd. - ADR* | | | 225,522 | | |
| | 670,000 | | | Jiangxi Copper Co., Ltd. - H Shares | | | 1,447,558 | | |
| | 1,490,000 | | | PetroChina Co., Ltd. - H Shares | | | 1,855,162 | | |
| | 1,714,000 | | | Shenzhen Expressway Co., Ltd. - H Shares | | | 723,859 | | |
| | 1,694,000 | | | Soho China, Ltd. | | | 1,127,647 | | |
| | 16,650 | | | Sohu.com Inc.* | | | 832,500 | | |
| | 54,000 | | | Trina Solar Ltd. - ADR* | | | 360,720 | | |
| | 396,000 | | | Weichai Power Co., Ltd. - H Shares | | | 1,947,725 | | |
| | 616,800 | | | Yanzhou Coal Mining Co., Ltd. - H Shares | | | 1,316,734 | | |
| | | | 15,479,687 | | |
| Hong Kong: 14.4% | | | |
| | 618,000 | | | Chen Hsong Holdings † | | | 191,767 | | |
| | 1,671,000 | | | China Liansu Group Holdings Ltd. | | | 725,062 | | |
| | 110,500 | | | China Mobile Ltd. | | | 1,079,874 | | |
| | 715,000 | | | CNOOC Ltd. | | | 1,250,187 | | |
| | 129,266 | | | HSBC Holdings PLC | | | 981,986 | | |
| | 286,000 | | | Kingboard Chemical Holdings Ltd. | | | 846,960 | | |
| | 1,048,000 | | | Kunlun Energy Co., Ltd. | | | 1,492,401 | | |
| | | | 6,568,237 | | |
| Indonesia: 3.7% | | | |
| | 225,000 | | | Indo Tambangraya Megah PT | | | 959,057 | | |
| | 2,111,000 | | | International Nickel Indonesia Tbk PT | | | 744,990 | | |
| | | | 1,704,047 | | |
| Malaysia: 4.2% | | | |
| | 1,588,000 | | | DiGi.Com Bhd | | | 1,943,672 | | |
| Singapore: 2.8% | | | |
| | 901,000 | | | Sakari Resources Ltd. | | | 1,278,162 | | |
| South Korea: 16.3% | | | |
| | 10,730 | | | Hyundai Mobis | | | 2,733,965 | | |
| | 3,055 | | | POSCO | | | 1,011,842 | | |
| | 2,500 | | | Samsung Electronics Co., Ltd. | | | 2,300,773 | | |
| | 8,000 | | | Samsung Engineering Co., Ltd. | | | 1,407,547 | | |
| | | | 7,454,127 | | |
The accompanying notes are an integral part of these financial statements.
21
| Shares | | COMMON STOCKS: 100.5% (Continued) | | Value | |
| Taiwan: 15.4% | | | |
| | 103,411 | | | HTC Corp. | | $ | 1,697,390 | | |
| | 1,039,314 | | | Lite-On Technology Corp. | | | 1,170,468 | | |
| | 407,000 | | | Novatek Microelectronics Corp. Ltd. | | | 1,020,222 | | |
| | 2 | | | Shin Zu Shing Co., Ltd. | | | 4 | | |
| | 830,000 | | | Taiwan Semiconductor Manufacturing Co., Ltd. | | | 2,077,810 | | |
| | 863,324 | | | Wistron Corp. | | | 1,093,447 | | |
| | | | 7,059,341 | | |
| Thailand: 9.9% | | | |
| | 234,500 | | | Electricity Generating PCL/Foreign | | | 715,392 | | |
| | 685,000 | | | Glow Energy PCL/Foreign | | | 1,237,559 | | |
| | 239,000 | | | PTT Exploration & Production PCL/Foreign | | | 1,276,434 | | |
| | 130,700 | | | PTT PCL/Foreign | | | 1,317,357 | | |
| | | | 4,546,742 | | |
| | | | | Total Common Stocks
(cost $40,369,746) | | | 46,034,015 | | |
| | | | | Total Investments in Securities
(cost $40,369,746): 100.5% | | | 46,034,015 | | |
| | | | | Liabilities in Excess of Other Assets: (0.5%) | | | (216,979 | ) | |
| | | | | Net Assets: 100.0% | | $ | 45,817,036 | | |
* Non-income producing security.
† Illiquid. Illiquid securities represent 0.4% of net assets.
ADR - American Depository Receipt
The accompanying notes are an integral part of these financial statements.
22
ASIA PACIFIC DIVIDEND FUND for the period ended December 31, 2011
1. Performance
ANNUALIZED TOTAL RETURNS
| | | 6 Months
(actual) | | 1 Year
(actual) | | 3 Years | | 5 Years | | Since Launch
(March 31, 2006) | |
| Fund | | | -14.81 | % | | | -14.04 | % | | | 20.55 | % | | | 1.32 | % | | | 2.93 | % | |
| Benchmark Index: | |
| MSCI Pacific Ex Japan | | | -15.65 | % | | | -13.18 | % | | | 20.86 | % | | | 3.55 | % | | | 6.93 | % | |
| S&P 500 | | | -3.70 | % | | | 2.09 | % | | | 14.12 | % | | | -0.25 | % | | | 1.63 | % | |
The Fund's gross expense ratio is 2.92% per the Summary Prospectus dated May 1, 2011. Guinness Atkinson Asset Management has contractually agreed to waive a portion of its advisory fees so that the Fund's ratio of expenses to average daily net assets will not exceed 1.98% (excluding Acquired Fund Fees and Expenses, interest, taxes, dividends on short positions and extraordinary expenses) through at least June 30, 2012. To the extent that the Advisor waives fees it may seek repayment of a portion or all of such amounts at any time within the three fiscal years after the fiscal year in which such amounts were waived, subject to the applicable cap.
Performance data quoted represents past performance and does not guarantee future results. The investment return and principal value of an investment will fluctuate so that an investor's shares, when redeemed, may be worth more or less than their original cost. Current performance of the Fund may be lower or higher than the performance quoted. Performance data current to the most recent month end may be obtained by visiting www.gafunds.com, or calling (800) 916-6566.
The Fund imposes a 2% redemption fee on shares held less than 30 days. Performance data quoted does not reflect the 2% redemption fee on shares held less than 30 days. Total returns for certain periods reflect a fee waiver in effect and in the absence of this waiver, total returns would have been lower.
2011 was a difficult year for Asian equities, and a fall in investor risk appetite has affected the performance of Asian markets. Although we feel that the fundamentals of Asian countries and equities are in many cases better than their developed world counterparts, there has been a flight to perceived 'safety', which has been negative for our holdings. On a relative basis, the Fund has fallen almost in line with the wider market, reflecting our overweight position in cash-flow generative companies. Our overweight position in Telecoms worked well last year, whilst our Utility and Healthcare holdings have also outperformed. However, some of our sector allocations have hurt performance, with Industrials, Materials and Energy all falling more than the benchmark during 2011. There were also mixed performances from our holdings in Technology stocks, with performance much more stock, than sector, driven.
China has been a mixed performer in 2011, with concerns over the property market, and the continuation of monetary tightening, weighing on equities. This marks the second consecutive year where China has underperformed the broader Asian market, and in our view, there is now considerable value in the equity market there. In the final quarter of 2011, the Chinese central bank began to change course on monetary policy, and reduced the banks' reserve requirement ratio, to release more liquidity back into the financial system. If this trend continues, this should be supportive for Chinese equities in 2012, and should improve investor comfort with the region as a whole.
Our overweight position in Thailand worked well this year, with a change of government successfully taking place in July, and despite heavy flooding in the Bangkok area in October. There was a widespread impact on industrial production in the third quarter, but Thailand showed remarkable resilience, and there was, in fact, little lasting damage to infrastructure. Indonesia was also a stand-out performer in 2011, and was one of the very few equity indices in our universe to finish the year in positive territory.
2. Portfolio Position
The Fund's positioning is constructed primarily from the bottom-up, with a focus on finding stocks with a good combination of earnings growth and cash flow generation, allied to a management willingness to pay dividends. These stocks might be available in any Asian nation, but we also have a macroeconomic view which helps to keep the Fund's allocation reasonable.
23
ASIA PACIFIC DIVIDEND FUND
From a top down perspective, we remain focused on benefiting from Chinese growth as the key driver of economic growth in the Asian region. The Fund is skewed towards China and Hong Kong, with also significant overweight positions in Taiwan, Thailand and Indonesia. As well as a good combination of growth and cash flow, we have found stocks in these markets that have a propensity to pay dividends, as, in our view, management sees this as a good way to manage capital structure and to incentivise shareholders.
The Fund is well underweight Australia, as we feel there are fewer stocks that benefit directly from Asian economic growth, and the market is focused on domestic large cap stocks, such as banks and insurance companies. We are also well underweight South Korea, mainly given the low propensity for firms to pay dividends to their shareholders.
By sector, the Fund is focused on cash-generative firms that can benefit from increased consumer spending, such as Telecoms, Utilities, Consumer Staples and some in Healthcare. We also have significant positions in Information Technology companies in Taiwan, which have been paying very good dividends, and are decent value, even in the face of a slowdown in export orders. The Fund is particularly underweight in Financials, which have suffered due to monetary tightening in Asia over the last two years.
3. Outlook
There is still considerable uncertainty in the developed world over economic growth, and over the financial future of the eurozone countries. There is some evidence that economic growth might be bottoming in the US, and that is certainly encouraging for better prospects for equities in 2012. We continue to prefer companies that derive their profits from domestic growth in Asia, and are less keen on exporters, unless we can make a strong argument on grounds of attractive valuations or good, sustainable dividends.
Looking forward, we believe that economic growth in China is slowing to what we think are more sustainable rates, and that in response the central bank has shifted to a loosening stance on monetary policy. We are not alarmed by this slower growth in China, as we believe that Chinese equities have underperformed for two years now, and that there is substantial value in this market. The looser monetary policy is likely to be more positive for financials, and we are looking critically at this sector and actively looking for opportunities.
Elsewhere in the region, South Korea is looking increasingly attractive from a valuation and growth point of view, but it remains difficult to find many stocks with sufficiently high dividends to add to the Fund. There seems to be an unwillingness in South Korea to pay dividends, and many firms have little or no interest in optimizing capital structure to the benefit of the shareholders.
Indonesia is also a market of interest for the coming year, as the domestic economy is growing at a steady pace and the government seems committed to encouraging spending on infrastructure. The country also has a range of materials exporters selling coal, nickel, oil and palm oil to the growing countries of Asia, and the tax and earnings from these companies could help to support the rest of the economy.
 | |  | |
|
| Edmund Harriss | | James Weir | |
|
The Fund invests in foreign securities, which involves political, economic and currency risks, greater volatility, and differences in accounting methods. The Fund is non-diversified, meaning that its assets may be concentrated in fewer individual holdings than diversified funds. Therefore, the Fund is more exposed to individual stock volatility than diversified funds. The Fund invests in smaller companies, which involves additional risks such as limited liquidity and greater volatility.
The MSCI Pacific ex-Japan Index is a free float-adjusted, capitalization-weighted index that is designed to measure equity market performance in the Pacific region excluding Japan. The Standard & Poor's 500 Index is a market capitalization-weighted index composed of 500 widely held common stocks of U.S. companies. These indices are unmanaged, not available for investment and do not incur expenses.
Please refer to the Schedule of Investments for details on Fund holdings. Current and future portfolio holdings are subject to risk.
The information provided herein represents the opinion of Guinness Atkinson Management for the period stated and is not intended to be a forecast of future events, a guarantee of future results, or investment advice. Opinions, Fund holdings and sector allocations are subject to change at any time, and are not recommendations to buy or sell any security.
24
GUINNESS ATKINSON ASIA PACIFIC DIVIDEND FUND
Growth of $10,000

Average Annual Total Return
Periods Ended December 31, 2011
| One Year | | Five Year | | Since Inception
(03/31/06)* | |
| | (14.04 | )% | | | 1.32 | % | | | 2.93 | % | |
* Inception date 3/31/06.
Performance data quoted represents past performance and does not guarantee future results. The investment return and principal value of an investment will fluctuate so that an investor's shares, when redeemed, may be worth more or less than their original cost. Current performance of the Fund may be lower or higher than the performance quoted. Performance data current to the most recent month end may be obtained by visiting www.gafunds.com.
Total returns reflect a fee waiver in effect and in the absence of this waiver, the total returns would be lower. The Fund imposes a 2% redemption fee on shares held less than 30 days.
The MSCI All Country Pacific Free ex-Japan Index (MSCI AC Pacific ex-Japan Index) is a free float-adjusted, capitalization-weighted index that is designed to measure equity market performance in the Pacific region including Japan.
25
FUND HIGHLIGHTS at December 31, 2011
GUINNESS ATKINSON ASIA PACIFIC DIVIDEND FUND
| # of Holdings in Portfolio: | | 31 | |
| Portfolio Turnover: | | 10.7% | |
| % of Stocks in Top 10: | | 41.8% | |
| Fund Managers: | |
| Edmund Harriss | |
| James Weir | |
| Top 10 Holdings (% of net assets) | | | | | | | |
| Digi.Com BHD | | 5.2% | | CLP Holdings Ltd. | | 3.9% | |
| KT&G Corporation | | 5.0% | | Yanzhou Coal Mining Co., Ltd. - H Shares | | 3.8% | |
| PTT PCL Foreign | | 4.7% | | Vtech Holdings Ltd. | | 3.7% | |
| PetroChina Co., Ltd. - ADR | | 4.3% | | China Mobile Ltd. | | 3.7% | |
| Taiwan Semiconductor Manufacturing Co., Ltd. | | 4.1% | | Compal Electronics, Inc. | | 3.4% | |
| Sector Breakdown (% of net assets) | | | | | | | |
| Commercial Banks | | 12.0% | | Textile - Products | | 3.0% | |
| Oil Company - Integrated | | 9.0% | | Agricultural Chemicals | | 3.0% | |
| Telecommunication Services | | 8.3% | | Chemical Diversified | | 2.9% | |
| Semiconductor Components - Integrated Circuits | | 6.7% | | Optical Supplies | | 2.8% | |
| Coal | | 6.6% | | Steel - Producers | | 2.7% | |
| Tobacco | | 5.0% | | Electric - Generation | | 2.7% | |
| Electric - Integrated | | 4.0% | | Water | | 2.7% | |
| Telecommunication Equipment | | 3.7% | | Auto/Truck Parts & Equipment - Replacements | | 2.5% | |
| Cellular Telecommunications | | 3.7% | | Real Estate Operations/Development | | 2.5% | |
| Computers | | 3.4% | | Wireless Equipment | | 2.5% | |
| Computers - Peripheral Equipment | | 3.3% | | Electronic Component - Miscellaneous | | 2.3% | |
| Chemicals - Plastics | | 3.1% | | Building Products - Cement/Aggregate | | 2.2% | |
26
SCHEDULE OF INVESTMENTS
at December 31, 2011
GUINNESS ATKINSON ASIA PACIFIC DIVIDEND FUND
| Shares | | COMMON STOCKS: 100.6% | | Value | |
| Australia: 3.0% | | | |
| | 42,787 | | | Incitec Pivot Ltd. | | $ | 136,101 | | |
| China: 15.6% | | | |
| | 152,000 | | | China Shanshui Cement Group Ltd | | | 101,182 | | |
| | 218,000 | | | Industrial & Commercial Bank of China - H Shares | | | 129,398 | | |
| | 1,560 | | | PetroChina Co., Ltd. - ADR | | | 193,924 | | |
| | 171,000 | | | Soho China Ltd | | | 113,830 | | |
| | 80,000 | | | Yanzhou Coal Mining Co., Ltd. - H Shares | | | 170,783 | | |
| | | | 709,117 | | |
| Hong Kong: 20.9% | | | |
| | 62,500 | | | BOC Hong Kong Holdings Ltd. | | | 148,070 | | |
| | 17,000 | | | China Mobile Ltd. | | | 166,134 | | |
| | 21,000 | | | CLP Holdings Ltd. | | | 178,592 | | |
| | 3,924 | | | HSBC Holdings PLC - ADR | | | 149,504 | | |
| | 241,000 | | | Pacific Textile Holdings Ltd | | | 136,844 | | |
| | 16,600 | | | VTech Holdings Ltd. | | | 166,286 | | |
| | | | 945,430 | | |
| Indonesia: 6.0% | | | |
| | 30,500 | | | Indo Tambangraya Megah PT | | | 130,006 | | |
| | 179,500 | | | Telekomunikasi Indonesia Tbk PT | | | 139,562 | | |
| | | | 269,568 | | |
| Malaysia: 5.2% | | | |
| | 194,200 | | | DiGi.Com Bhd | | | 237,696 | | |
| Singapore: 2.6% | | | |
| | 10,000 | | | United Overseas Bank Ltd. | | | 117,729 | | |
| South Korea: 7.7% | | | |
| | 3,220 | | | KT&G Corp | | | 227,524 | | |
| | 370 | | | POSCO | | | 122,547 | | |
| | | | 350,071 | | |
| Taiwan: 21.2% | | | |
| | 155,394 | | | Compal Electronics, Inc. | | | 154,989 | | |
| | 60,400 | | | Depo Auto Parts Ind Co., Ltd. | | | 115,697 | | |
| | 6,854 | | | HTC Corp. | | | 112,502 | | |
| | 130,633 | | | Lite-On Technology Corp. | | | 147,118 | | |
| | 47,000 | | | Novatek Microelectronics Corp. Ltd. | | | 117,814 | | |
| | 12,000 | | | St Shine Optical Co., Ltd. | | | 126,821 | | |
| | 74,000 | | | Taiwan Semiconductor Manufacturing Co., Ltd. | | | 185,250 | | |
| | | | 960,191 | | |
The accompanying notes are an integral part of these financial statements.
27
| Shares | | COMMON STOCKS: 100.6% (Continued) | | Value | |
| Thailand: 18.4% | | | |
| | 151,400 | | | Delta Electronics Thai PCL/Foreign | | $ | 104,132 | | |
| | 67,800 | | | Glow Energy PCL/Foreign | | | 122,491 | | |
| | 67,720 | | | PTT Chemical PCL/Foreign | | | 130,932 | | |
| | 21,200 | | | PTT PCL/Foreign | | | 213,680 | | |
| | 152,100 | | | Thai Plastic & Chemical PCL/Foreign | | | 142,217 | | |
| | 760,600 | | | Thai Tap Water Supply PCL/Foreign | | | 121,744 | | |
| | | | 835,196 | | |
| | | | | Total Common Stocks
(cost $4,244,950) | | | 4,561,099 | | |
| | | | | Total Investments in Securities
(cost $4,244,950): 100.6% | | | 4,561,099 | | |
| | | | | Liabilities in Excess of Other Assets: (0.6%) | | | (29,145 | ) | |
| | | | | Net Assets: 100.0% | | $ | 4,531,954 | | |
ADR - American Depository Receipt
The accompanying notes are an integral part of these financial statements.
28
CHINA & HONG KONG FUND for the period ended December 31, 2011
1. Performance
AVERAGE ANNUALIZED TOTAL RETURNS
| | | 6 Months
(actual) | | 1 Year
(actual) | | 3 Years | | 5 Years | | 10 Years | |
| Fund | | | -24.23 | % | | | -27.52 | % | | | 17.25 | % | | | 3.91 | % | | | 11.29 | % | |
| Benchmark Index: | |
| Hang Seng Composite | | | -19.23 | % | | | -19.29 | % | | | 11.86 | % | | | 1.17 | % | | | 10.12 | % | |
| Hang Seng | | | -16.49 | % | | | -17.27 | % | | | 11.92 | % | | | 1.55 | % | | | 8.57 | % | |
| S&P 500 | | | -3.70 | % | | | 2.09 | % | | | 14.12 | % | | | -0.25 | % | | | 2.92 | % | |
The Fund's gross expense ratio is 1.48% per the Summary Prospectus dated May 1, 2011. Guinness Atkinson Asset Management has contractually agreed to waive a portion of its advisory fees so that the Fund's ratio of expenses to average daily net assets will not exceed 1.98% (excluding Acquired Fund Fees and Expenses, interest, taxes, dividends on short positions and extraordinary expenses) through at least June 30, 2012. To the extent that the Advisor waives fees it may seek repayment of a portion or all of such amounts at any time within the three fiscal years after the fiscal year in which such amounts were waived, subject to the applicable cap.
Performance data quoted represents past performance and does not guarantee future results. The investment return and principal value of an investment will fluctuate so that an investor's shares, when redeemed, may be worth more or less than their original cost. Current performance of the Fund may be lower or higher than the performance quoted. Performance data current to the most recent month end may be obtained by visiting www.gafunds.com, or calling (800) 916-6566.
The Fund imposes a 2% redemption fee on shares held less than 30 days. Performance data quoted does not reflect the 2% redemption fee on shares held less than 30 days. Total returns for certain periods reflect a fee waiver in effect and in the absence of this waiver, total returns would have been lower.
During the year investor sentiment has been very bearish toward China as inflation remained high and as a consequence, the measures put in place to tighten liquidity looked unlikely to ease any time soon. This was compounded by increasing fears for the property market which has been particular focus of monetary tightening. In the last three months of the year the China and Hong Kong markets rebounded as investors' fears about European debt receded somewhat and Chinese inflation began to ease. The Fund finished the year down 27.52%, compared to a fall in the Hang Seng Composite Index of 19.29%
The portfolio is positioned with higher exposure toward energy, industrials and materials which reflects our belief that China's domestic economy offers the best investment prospects. During the year investor sentiment has been very bearish toward China as inflation remained high and as a consequence, the measures put in place to tighten liquidity looked unlikely to ease any time soon. This was compounded by increasing fears for the property market which has been particular focus of monetary tightening. This meant that stocks related to construction such as steelmaking and cement did poorly for much of the year but rebounded strongly on signs of policy easing.
The last three months of the year brought some relief to policymakers as inflation began to come down in the food, non-food and industrial products categories. This has provided more policy flexibility at a time when external demand was deteriorating. We therefore saw increased bank lending, a cut in banks' required reserve ratios and an increase in money supply. While the authorities are wary about providing actual stimulus, since they are trying to correct the ill-effects of the last stimulus package, the mood has certainly changed to one that is supportive of growth.
2. Portfolio Position
The portfolio positioning was substantially unchanged this year, with our overweight positions in Energy, Materials and Industrials stocks remaining in place. The portfolio is also underweight in Financials, Insurance and Real Estate stocks, and this has been supportive to performance as these sectors have been under pressure due to monetary tightening for most of 2011.
29
CHINA & HONG KONG FUND
3. Outlook
We expect inflation in China will continue to fall and we also expect external demand for Chinese-manufactured goods will continue to weaken. China's measures to put downward pressure on residential property prices are also likely to continue and this should depress construction activity. However, policy makers now have the flexibility and the resources to tailor policy to support domestic growth while maintaining a grip on those sectors of the economy that overheated following the stimulus policies of 2009/10.
We have already seen moves to support growth with increased liquidity being made available and we expect this continue with additional cuts to the required reserve ratio over the course of the year. Fiscal measures are likely to be preferred rather than direct stimulus which could take the form of tax cuts, rebates and/or subsidies. There is also a big social housing construction programme underway which is likely to ramp up this year.
We believe these measures may cushion, but not prevent, a deceleration of growth. In our view, the reality is that the days of double digit growth are almost certainly behind us and the focus now is on the quality and sustainability of growth. The social housing programme should help preserve jobs in the construction industry while at the same time provide an adequate supply of affordable housing which would help take the heat out of the residential property market.
From an investment perspective we believe that stable growth, albeit slower than in 2009-11, is still better than investors were expecting. Stock market valuations are currently very cheap and we believe will close up toward the regional average supported by a steady stream of low level supportive policy moves.

Edmund Harriss
The Fund invests in foreign securities, which involves political, economic and currency risks, greater volatility, and differences in accounting methods. The Fund is non-diversified, meaning its assets may be concentrated in fewer individual holdings than diversified funds. Therefore, the Fund is more exposed to individual stock volatility than diversified funds. The Fund invests in smaller companies, which involves additional risks such as limited liquidity and greater volatility.
The Hang Seng Composite Index is a market capitalization-weighted index that is comprised of the top 200 companies listed on the Hong Kong Stock Exchange, based on the average market capitalization for the past twelve months. The Hang Seng Composite Index commenced operations on January 3, 2000 and therefore does not have returns since the Fund's inception. The Hang Seng Index is a barometer of the Hong Kong Stock Market, whose aggregate market capitalization accounts for about 70% of the total market-capitalization of the Stock Exchange of Hong Kong Limited. The Standard & Poor's 500 Index is a market capitalization-weighted index composed of 500 widely held common stocks of U.S. companies. These indices are unmanaged, not available for investment and do not incur expenses.
Please refer to the Schedule of Investments for details on Fund holdings. Current and future portfolio holdings are subject to risk.
The information provided herein represents the opinion of Guinness Atkinson Management for the period stated and is not intended to be a forecast of future events, a guarantee of future results, or investment advice. Opinions, Fund holdings and sector allocations are subject to change at any time, and are not recommendations to buy or sell any security.
30
GUINNESS ATKINSON CHINA & HONG KONG FUND
Growth of $10,000

Average Annual Total Return
Periods Ended December 31, 2011
| One Year | | Five Year | | Ten Year | |
| | (27.52 | )% | | | 3.91 | % | | | 11.29 | % | |
Performance data quoted represents past performance and does not guarantee future results. The investment return and principal value of an investment will fluctuate so that an investor's shares, when redeemed, may be worth more or less than their original cost. Current performance of the Fund may be lower or higher than the performance quoted. Performance data current to the most recent month end may be obtained by visiting www.gafunds.com.
Total returns reflect a fee waiver in effect and in the absence of this waiver, the total returns would be lower. The Fund imposes a 2% redemption fee on shares held less than 30 days.
The Hang Seng Composite Index is a market-capitalization weighted index that comprises the top 200 companies listed on the Hong Kong Stock Exchange, based on the average market capitalization for the past twelve months. The Fund changed its benchmark from the Hang Seng to the Hang Seng Composite Index to more accurately reflect the market sectors in which the Fund invests. The Hang Seng Composite Index commenced on 01/31/00. The index referenced in this chart is not available for investment and does not incur expenses.
31
FUND HIGHLIGHTS at December 31, 2011
GUINNESS ATKINSON CHINA & HONG KONG FUND
| # of Holdings in Portfolio: | | 37 | |
| Portfolio Turnover: | | 7.8% | |
| % of Stocks in Top 10: | | 44.4% | |
| Fund Managers: | |
| Edmund Harriss | |
| James Weir | |
| Top 10 Holdings (% of net assets) | | | | | | | |
| Weichai Power Co., Ltd. - H Shares | | 6.4% | | PetroChina Co., Ltd. - H Shares | | 4.3% | |
| Soho China Ltd. | | 4.8% | | Yanzhou Coal Mining Co., Ltd. - H Shares | | 4.1% | |
| CNOOC Ltd. | | 4.5% | | Beijing Enterprises Holdigs Ltd. | | 3.9% | |
| Kunlun Energy Co., Ltd. | | 4.4% | | Dongfang Electric Corp., Ltd. - H Shares | | 3.9% | |
| Dongfeng Motor Group Co., Ltd. - H Shares | | 4.3% | | China Mobile Ltd. | | 3.8% | |
| Sector Breakdown (% of net assets) | | | | | | | |
| Commercial Banks | | 13.6% | | Exchange Traded Funds | | 3.1% | |
| Oil & Gas - Exploration & Production | | 8.8% | | Internet Application Software | | 3.0% | |
| Coal | | 7.0% | | Metal - Copper | | 3.0% | |
| Auto - Cars/Light Trucks | | 6.8% | | Telecommunication Equipment | | 3.0% | |
| Auto/Truck Parts & Equipment | | 6.4% | | Distribution/Wholesale | | 2.7% | |
| Web Portals/ISP | | 5.3% | | Chemicals - Other | | 2.2% | |
| Real Estate | | 4.8% | | Energy - Alternate Sources | | 2.2% | |
| Oil - Integrated | | 4.3% | | Airlines | | 2.1% | |
| Gas - Distribution | | 3.9% | | Real Estate Management/Service | | 2.0% | |
| Power Conversion/Supply Equipment | | 3.9% | | Public Thoroughfares | | 1.4% | |
| Building Products | | 3.8% | | Machinery | | 0.7% | |
| Cellular Telecommunications | | 3.8% | | Retail - Apparel | | 0.1% | |
| Computers | | 3.5% | | | | | | | |
32
SCHEDULE OF INVESTMENTS
at December 31, 2011
GUINNESS ATKINSON CHINA & HONG KONG FUND
| Shares | | COMMON STOCKS: 101.4% | | Value | |
| Airlines: 2.1% | | | |
| | 1,843,000 | | | Cathay Pacific Airways Ltd. | | $ | 3,160,812 | | |
| Auto/Truck Parts & Equipment: 6.4% | | | |
| | 1,980,600 | | | Weichai Power Co., Ltd. - H Shares | | | 9,741,575 | | |
| Auto – Cars/Light Trucks: 6.8% | | | |
| | 3,878,000 | | | Dongfeng Motor Group Co., Ltd. - H Shares | | | 6,650,910 | | |
| | 4,463,078 | | | Guangzhou Automobile Group Co. Ltd. - H Shares | | | 3,723,733 | | |
| | | | 10,374,643 | | |
| Building Products: 3.8% | | | |
| | 993,000 | | | Anhui Conch Cement Co Ltd - H Shares | | | 2,947,062 | | |
| | 6,705,000 | | | China Liansu Group Holdings Ltd. | | | 2,909,362 | | |
| | | | 5,856,424 | | |
| Cellular Telecommunications: 3.8% | | | |
| | 601,000 | | | China Mobile Ltd. | | | 5,873,342 | | |
| Chemicals – Other: 2.2% | | | |
| | 1,142,000 | | | Kingboard Chemical Holdings Ltd. | | | 3,381,917 | | |
| Coal: 7.0% | | | |
| | 1,018,000 | | | China Shenhua Energy Co Ltd - H Shares | | | 4,417,197 | | |
| | 2,928,200 | | | Yanzhou Coal Mining Co., Ltd. - H Shares | | | 6,251,069 | | |
| | | | 10,668,266 | | |
| Commercial Banks: 13.6% | | | |
| | 1,953,000 | | | BOC Hong Kong Holdings Ltd. | | | 4,626,889 | | |
| | 7,358,670 | | | China Construction Bank Corp. - H Shares | | | 5,135,322 | | |
| | 216,481 | | | Dah Sing Financial Holdings Ltd. | | | 648,055 | | |
| | 546,691 | | | HSBC Holdings PLC | | | 4,153,010 | | |
| | 7,872,330 | | | Industrial & Commercial Bank of China - H Shares | | | 4,672,758 | | |
| | 190,400 | | | Wing Hang Bank Ltd. | | | 1,560,395 | | |
| | | | 20,796,429 | | |
| Computers: 3.5% | | | |
| | 7,938,000 | | | Lenovo Group Ltd. | | | 5,294,317 | | |
| Distribution/Wholesale: 2.7% | | | |
| | 2,623,000 | | | Digital China Holdings Ltd. | | | 4,066,248 | | |
| Energy – Alternate Sources: 2.2% | | | |
| | 755,000 | | | JA Solar Holdings Co. Ltd. - ADR* | | | 1,011,700 | | |
| | 460,800 | | | Renesola Ltd. - ADR* | | | 705,024 | | |
| | 241,500 | | | Trina Solar Ltd. - ADR* | | | 1,613,220 | | |
| | | | 3,329,944 | | |
| Exchange Traded Funds (ETFs): 3.1% | | | |
| | 5,945,600 | | | db x-trackers - CSI300 INDEX ETF - 2D | | | 4,715,692 | | |
The accompanying notes are an integral part of these financial statements.
33
| Shares | | COMMON STOCKS: 101.4% (Continued) | | Value | |
| Gas – Distribution: 3.9% | | | |
| | 994,000 | | | Beijing Enterprises Holdings Ltd. | | $ | 5,964,051 | | |
| Internet Application Software: 3.0% | | | |
| | 231,000 | | | Tencent Holdings Ltd. | | | 4,642,842 | | |
| Machinery – General Industries: 0.7% | | | |
| | 3,510,000 | | | Chen Hsong Holdings † | | | 1,089,164 | | |
| Metal – Copper: 3.0% | | | |
| | 2,142,000 | | | Jiangxi Copper Co., Ltd. - H Shares | | | 4,627,863 | | |
| Oil – Integrated: 4.3% | | | |
| | 5,234,000 | | | PetroChina Co., Ltd. - H Shares | | | 6,516,723 | | |
| Oil – Exploration & Production: 8.8% | | | |
| | 3,913,000 | | | CNOOC Ltd. | | | 6,841,931 | | |
| | 4,676,000 | | | Kunlun Energy Co., Ltd. | | | 6,658,842 | | |
| | | | 13,500,773 | | |
| Power Conversion/Supply Equipment: 3.9% | | | |
| | 2,005,000 | | | Dongfang Electric Corp., Ltd. - H Shares | | | 5,937,605 | | |
| Public Thoroughfares: 1.4% | | | |
| | 4,944,000 | | | Shenzhen Expressway Co., Ltd. - H Shares | | | 2,087,956 | | |
| Real Estate: 4.8% | | | |
| | 11,103,000 | | | Soho China Ltd. | | | 7,390,945 | | |
| Real Estate Management/Service: 2.0% | | | |
| | 5,945,000 | | | Midland Holdings Ltd. | | | 3,092,447 | | |
| Retail – Apparel: 0.1% | | | |
| | 698,000 | | | Glorious Sun Enterprises Ltd. | | | 213,895 | | |
| Telecommunication Equipment: 3.0% | | | |
| | 464,000 | | | VTech Holdings Ltd. | | | 4,648,006 | | |
| Web Portals/ISP: 5.3% | | | |
| | 105,040 | | | Netease.com - ADR* | | | 4,711,044 | | |
| | 67,800 | | | Sohu.com Inc.* | | | 3,390,000 | | |
| | | | 8,101,044 | | |
| | | | | Total Common Stocks
(costs $128,019,692) | | | 155,072,923 | | |
| | | | | Total Investments in Securities
(costs $128,019,692): 101.4% | | | 155,072,923 | | |
| | | | | Liabilities in Excess of Other Assets: (1.4%) | | | (2,113,410 | ) | |
| | | | | Net Assets: 100.0% | | $ | 152,959,513 | | |
* Non-income producing security.
† Illiquid. Illiquid securities represent 0.7% of net assets.
ADR - American Depository Receipt
The accompanying notes are an integral part of these financial statements.
34
GLOBAL ENERGY FUND for the period ended December 31, 2011
1. Performance
AVERAGE ANNUALIZED TOTAL RETURNS
| | | 1 Year
(actual) | | 5 Year | | Since
Inception
June 30, 2004 | |
| Fund | | | -13.16 | % | | | 3.15 | % | | | 13.37 | % | |
| Benchmark Index: | |
| S&P 500 | | | 2.09 | % | | | -0.25 | % | | | 3.41 | % | |
| MSCI World Energy Index | | | 0.72 | % | | | 3.29 | % | | | 10.4 | % | |
The Fund's gross expense ratio is 1.25% per the Summary Prospectus dated May 1, 2011. Guinness Atkinson Asset Management has contractually agreed to waive a portion of its advisory fees so that the Fund's ratio of expenses to average daily net assets will not exceed 1.45% (excluding Acquired Fund Fees and Expenses, interest, taxes, dividends on short positions and extraordinary expenses) through at least June 30, 2012. To the extent that the Advisor waives fees it may seek repayment of a portion or all of such amounts at any time within the three fiscal years after the fiscal year in which such amounts were waived, subject to the applicable cap.
Performance data quoted represents past performance and does not guarantee future results. The investment return and principal value of an investment will fluctuate so that an investor's shares, when redeemed, may be worth more or less than their original cost. Current performance of the Fund may be lower or higher than the performance quoted. Performance data current to the most recent month end may be obtained by visiting www.gafunds.com, or calling (800) 916-6566.
The Fund imposes a 2% redemption fee on shares held less than 30 days. Performance data quoted does not reflect the 2% redemption fee on shares held less than 30 days. Total returns for certain periods reflect a fee waiver in effect and in the absence of this waiver, total returns would have been lower.
The Global Energy Fund in 2011 produced a total return of -13.16%. This compares to the price return of the Morgan Stanley Capital International World Energy Index of 0.72%, and the S&P 500 Index return of 2.09%. It was a challenging year for the Fund.
The best performers over the year as a group were our large integrated oil and gas companies. Chevron was up 17%, Statoil was up 8% and ConocoPhillips was up 7%. The smaller integrated companies struggled, with Hess down 26% and OMV down 27%. The Exploration and Production stocks were similarly bifurcated: Marathon Oil was up 33% and Noble Energy was up 10%, while at the other end of the spectrum Newfield Exploration was down 48% and Forest Oil was down 50%. Amongst our service stocks the best performers were Helix (up 30%) and Unit (flat), while Halliburton underperformed (-15%). International Exploration and Production, solar and our Canadian holdings were all drags on performance, and the structural underweight to the large cap integrated oil and gas companies versus the energy benchmark also hurt us. Exxon, which we did not hold in the fund and represents 15% of the MSCI World Energy Index, was up 19% over the year.
2. Activity
In January we sold a research position, Insignia Energy, and in March we sold two further research positions, Opti Canada and Falkland Oil & Gas. We added to the research portfolio Triangle Petroleum, a US oil domestic oil producer with acreage in the Bakken.
In June we sold our holding in Repsol YPF, the Spanish integrated oil and gas company, following its good performance year to date and we bought two companies in its place; Carrizo Oil & Gas and Penn Virginia. Carrizo is a US-focused natural gas exploration and production company which is transitioning towards greater liquids production. Penn Virginia is also a US-focused exploration and production company, with undervalued natural gas reserves. In June we also bought a half unit in Petrominerales, a Colombian exploration and production company with production predominantly centered in the Llanos Basin in southern Colombia.
In July we bought two new research positions for the fund. We participated in the initial public offering (IPO) of Bayfield Energy, a company with oil producing assets in Trinidad and, we believe, a very strong management team. We also bought Ithaca Energy, which has a portfolio of North Sea assets which we think is significantly undervalued by the market. In November we sold our
35
GLOBAL ENERGY FUND
holding in Bill Barrett and replaced it with Royal Dutch Shell. Barrett had been a good relative performer since we purchased it in 2010, while Royal Dutch Shell offers the combination an extremely attractive free cash flow yield and appealing growth projects in the global liquefied natural gas (LNG) sector. We also sold our position in Coastal Energy in November, the stock having more than doubled in 2011 in response to strong exploration results offshore of Thailand.
3. Portfolio Position
The fund at December 31 2011 was on P/E ratios versus the S&P 500 Index at 1257.60 as set out in the table. (Based on S&P 500 'operating' earnings per share estimates of $49.5 for 2008, $56.9 for 2009, $83.8 for 2010 and $98.0 for 2011). This is shown in the following table:
| | | 2007 | | 2008 | | 2009 | | 2010 | | 2011 | |
| Fund PER | | 8.0 | | 7.2 | | 15.4 | | 10.0 | | 8.6 | |
| S&P 500 PER | | 15.1 | | 25.2 | | 21.9 | | 14.9 | | 12.7 | |
| Premium (+)/Discount (-) | | -47% | | -71% | | -30% | | -33% | | -32% | |
| Average oi price (WTI) $ | | $72.2/bbl | | $99.9/bbl | | $61.9/bbl | | $79.5/bbl | | $95/bbl | |
Source: Standard and Poor's; Guinness Atkinson Asset Management Inc.
The Sector and Geographic weightings of the portfolio at 31 December 2010 and 2011 were as follows:
| Sector Breakdown | |
| | | 31 Dec 2010 | | 31 Dec 2011 | |
| Integrated | | | 42.5 | | | | 39.7 | | |
| Exploration & Production | | | 38.1 | | | | 41.4 | | |
| Drilling | | | 6.5 | | | | 6.0 | | |
| Equipment & Services | | | 5.5 | | | | 6.9 | | |
| Refining & Marketing | | | 3.7 | | | | 4.8 | | |
| Solar | | | 3.3 | | | | 1.2 | | |
| Construction & Engineering | | | 0.4 | | | | — | | |
| Total | | | 100.0 | | | | 100.0 | | |
| Geographic Breakdown | |
| | | 31 Dec 2010 | | 31 Dec 2011 | |
| US | | | 55.2 | | | | 52.3 | | |
| Canada | | | 12.2 | | | | 13.6 | | |
| UK | | | 10.5 | | | | 8.7 | | |
| Europe | | | 18.5 | | | | 18.8 | | |
| China | | | 3.6 | | | | 4.9 | | |
| Russia | | | — | | | | 1.7 | | |
| Total | | | 100.0 | | | | 100.0 | | |
36
GLOBAL ENERGY FUND
4. Market Background
Having averaged $79 in 2010, West Texas Intermediate (WTI) oil averaged $95 in 2011. It traded in a range of $80-100 for most of the year, with a brief period in March and April when it rose as high as $115, which we attribute to unrest in the Middle East and North Africa. The shortfall in Libyan production (1.6m barrels/day) was made up for by Saudi Arabia and others, and by August the price was back in the $80-85 range. 2011 saw a new high for global oil demand at 89m barrels/day: this represented growth of 0.7m barrels/day from 2010, while non-OPEC supply grew by only 0.1m barrels/day. This explains some of the tightening we saw in OECD oil inventories over the course of the year. It is also worth mentioning the significant spread which opened up between WTI and Brent crude during 2011: an oversupply of WTI at the trading hub in Cushing, Oklahoma depressed the WTI price at precisely the moment that Brent moved higher on a shortage of Libyan production – the spread reached $26 during July and August but narrowed to end the year around $10.
The US natural gas price weakened materially in the second half of 2011. The spot price was range-bound between $4 and $5 until August, when it fell steadily to reach $2.98 at year-end. The spot price averaged $4 for the year and the 12-month strip averaged $4.35. The reasons for this weakness are well-known: horizontal drilling, well stimulation and fracturing, and the associated gas from liquids drilling have caused an oversupply of natural gas. This manifests itself in the inventory (storage) number, which is currently 20% higher than the five-year average. We continue to wait for the drop in natural gas production which we need to balance the market: a meaningful fall in the rig count will likely be the leading indicator.
5. Outlook
What is in store for 2012? We expect oil to remain relatively strong and forecast a trading range of $80-$100, with an average for the year of $90. Recent OPEC rhetoric has referred to oil prices at the high end of this range. In the short term, the threat of Iranian conflict continues to bolster the price, while looking further out we expect demand forecasts for 2012 to be scaled back and oil to weaken. We continue to think that the US natural gas price will move up when drilling activity slows and supply drops and that the price move could be meaningful. And above all, we regard the energy sector as cheap relative to the broad market on an earnings basis and we believe we have positioned the fund to take advantage of the commodity price environment outlined above.

Tim Guinness January 2012
Lead Manager
Will Riley, Ian Mortimer & Tom Nelson
Fund investment team
The Fund invests in foreign securities, which involves political, economic and currency risks, greater volatility, and differences in accounting methods. The Fund is non-diversified, meaning its assets may be concentrated in fewer individual holdings than diversified funds. Therefore, the Fund is more exposed to individual stock volatility than diversified funds. The Fund invests in smaller companies, which involves additional risks such as limited liquidity and greater volatility.
The MSCI World Energy Index is an unmanaged index composed of more than 1,400 stocks listed on exchanges in the U.S., Europe, Canada, Australia, New Zealand and the Far East. The Standard & Poor's 500 Index is a market capitalization-weighted index composed of 500 widely held common stocks of U.S. companies. These indices are unmanaged, not available for investment and do not incur expenses.
PER or P/E – Earnings per share (EPS) is calculated by taking the total earnings divided by the number of shares outstanding.
Free Cash Flow – Free cash flow is cash flow available for distribution among all the securities holders of an organization.
Please refer to the Schedule of Investments for details on Fund holdings. Current and future portfolio holdings are subject to risk.
The information provided herein represents the opinion of Guinness Atkinson Management for the period stated and is not intended to be a forecast of future events, a guarantee of future results, or investment advice. Opinions, Fund holdings and sector allocations are subject to change at any time, and are not recommendations to buy or sell any security.
37
GUINNESS ATKINSON GLOBAL ENERGY FUND
Growth of $10,000
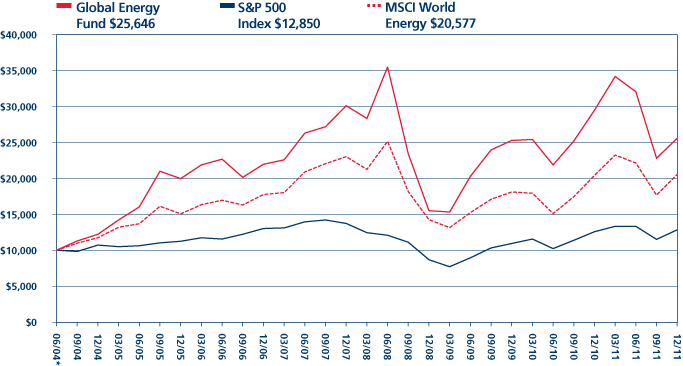
Average Annual Total Return
Periods Ended December 31, 2011
| One Year | | Five Year | | Since Inception
(06/30/04) | |
| | (13.16 | )% | | | 3.15 | % | | | 13.37 | % | |
* Inception date 6/30/04.
Performance data quoted represents past performance and does not guarantee future results. The investment return and principal value of an investment will fluctuate so that an investor's shares, when redeemed, may be worth more or less than their original cost. Current performance of the Fund may be lower or higher than the performance quoted. Performance data current to the most recent month end may be obtained by visiting www.gafunds.com.
Total returns reflect a fee waiver in effect and in the absence of this waiver, the total returns would be lower. The Fund imposes a 2% redemption fee on shares held less than 30 days.
The MSCI World Index is an unmanaged index composed of more than 1,400 stocks listed on exchanges in the U.S., Europe, Canada, Australia, New Zealand and the Far East.
The S&P 500 Index is a broad based unmanaged index of 500 stocks, which is widely recognized as representative of the equity market in general. These indices are unmanaged, not available for investment and do not incur expenses.
38
FUND HIGHLIGHTS at December 31, 2011
GUINNESS ATKINSON GLOBAL ENERGY FUND
| # of Holdings in Portfolio: | | 46 | |
| Portfolio Turnover: | | 28.2% | |
| % of Stocks in Top 10: | | 36.0% | |
| Fund Managers: | |
| Timothy W. N. Guinness | |
| Ian Mortimer, Tom Nelson | |
| Will Riley | |
| Top 10 Holdings (% of net assets) | | | | Sector Breakdown (% of net assets) | | | |
| PetroChina Co., Ltd. - H Shares | | 3.7% | | Oil & Gas - Integrated | | 43.9% | |
| Chevron Corp. | | 3.7% | | Oil & Gas - Exploration & Production | | 38.6% | |
| Total SA | | 3.7% | | Oil & Gas - Field Services | | 7.1% | |
| Halliburton Co. | | 3.6% | | Oil & Gas - Drilling | | 6.1% | |
| Marathon Oil Corp. | | 3.6% | | Oil Refining & Marketing | | 4.8% | |
| Nexen, Inc. | | 3.6% | | Energy - Alternate Sources | | 1.2% | |
| Suncor Energy, Inc. | | 3.6% | | | | | | | |
| Canadian Natural Resources Ltd. | | 3.5% | | | | | | | |
| Apache Corp. | | 3.5% | | | | | | | |
| ConocoPhillips | | 3.5% | | | | | | | |
39
SCHEDULE OF INVESTMENTS
at December 31, 2011
GUINNESS ATKINSON GLOBAL ENERGY FUND
| Shares | | COMMON STOCKS: 101.7% | | Value | |
| Energy – Alternate Source: 1.2% | | | |
| | 557,100 | | | JA Solar Holdings Co. Ltd. - ADR* | | $ | 746,514 | | |
| | 149,600 | | | Trina Solar Ltd. - ADR* | | | 999,328 | | |
| | | | 1,745,842 | | |
| Machinery-General Industries: 0.0% | | | |
| | 91,478 | | | Shandong Molong Petroleum Machinery Co., Ltd. - H Shares | | | 54,887 | | |
| Oil & Gas – Drilling: 6.1% | | | |
| | 165,270 | | | Patterson-UTI Energy, Inc. | | | 3,302,095 | | |
| | 14,930 | | | Transocean Ltd. | | | 573,163 | | |
| | 104,897 | | | Unit Corp.* | | | 4,867,221 | | |
| | | | 8,742,479 | | |
| Oil & Gas – Exploration & Production: 38.6% | | | |
| | 1,712,800 | | | Afren PLC* | | | 2,279,584 | | |
| | 55,909 | | | Apache Corp. | | | 5,064,237 | | |
| | 677,083 | | | Bayfield Energy Holdings PLC * | | | 567,811 | | |
| | 135,600 | | | Canadian Natural Resources Ltd. | | | 5,077,929 | | |
| | 100,270 | | | Carrizo Oil & Gas Inc.* | | | 2,642,115 | | |
| | 207,600 | | | Chesapeake Energy Corp. | | | 4,627,404 | | |
| | 86,460 | | | Coastal Energy Co.* | | | 1,290,004 | | |
| | 75,200 | | | Devon Energy Corp. | | | 4,662,400 | | |
| | 314,550 | | | Dragon Oil PLC | | | 2,236,074 | | |
| | 186,000 | | | Forest Oil Corp.* | | | 2,520,300 | | |
| | 268,900 | | | Ithaca Energy Inc. * | | | 572,774 | | |
| | 575,230 | | | JKX Oil & Gas PLC † | | | 1,214,922 | | |
| | 86,115 | | | Lone Pine Resources, Inc. * | | | 603,666 | | |
| | 129,686 | | | Newfield Exploration Co.* | | | 4,893,053 | | |
| | 320,072 | | | Nexen, Inc. | | | 5,092,874 | | |
| | 52,935 | | | Noble Energy Inc. | | | 4,996,535 | | |
| | 224,000 | | | Pantheon Resources PLC* | | | 36,091 | | |
| | 234,700 | | | Penn Virginia Corp. | | | 1,241,563 | | |
| | 151,100 | | | Petrominerales Ltd. | | | 2,456,163 | | |
| | 514,100 | | | SOCO International PLC* | | | 2,336,092 | | |
| | 80,000 | | | Triangle Petroleum Corp.* | | | 477,600 | | |
| | 362,740 | | | WesternZagros Resources Ltd.* | | | 238,563 | | |
| | | | 55,127,754 | | |
| Oil & Gas – Field Services: 7.1% | | | |
| | 149,800 | | | Halliburton Co. | | | 5,169,598 | | |
| | 275,780 | | | Helix Energy Solutions Group, Inc.* | | | 4,357,324 | | |
| | 84,900 | | | Kentz Corp Ltd. | | | 556,401 | | |
| | | | 10,083,323 | | |
The accompanying notes are an integral part of these financial statements.
40
| Shares | | COMMON STOCKS: 101.7% (Continued) | | Value | |
| Oil & Gas – Integrated: 43.9% | | | |
| | 694,500 | | | BP PLC | | $ | 4,966,723 | | |
| | 49,400 | | | Chevron Corp. | | | 5,256,160 | | |
| | 69,028 | | | ConocoPhillips | | | 5,030,070 | | |
| | 241,300 | | | ENI SpA | | | 4,999,952 | | |
| | 237,100 | | | Gazprom OAO - ADR | | | 2,527,486 | | |
| | 84,343 | | | Hess Corp. | | | 4,790,682 | | |
| | 174,800 | | | Marathon Oil Corp. | | | 5,116,396 | | |
| | 157,038 | | | OMV AG | | | 4,764,086 | | |
| | 4,229,000 | | | PetroChina Co., Ltd. - H Shares | | | 5,265,423 | | |
| | 134,320 | | | Royal Dutch Shell PLC - Class A | | | 4,893,688 | | |
| | 191,350 | | | Statoil ASA | | | 4,911,045 | | |
| | 176,176 | | | Suncor Energy, Inc. | | | 5,080,786 | | |
| | 102,700 | | | Total SA | | | 5,250,307 | | |
| | | | 62,852,804 | | |
| Oil Refining & Marketing: 4.8% | | | |
| | 59,950 | | | Marathon Petroleum Corp. | | | 1,995,736 | | |
| | 233,899 | | | Valero Energy Corp. | | | 4,923,574 | | |
| | | | 6,919,310 | | |
| | | | | Total Common Stocks
(cost $155,785,259) | | | 145,526,399 | | |
| | | | | Total Investments in Securities
(cost $155,785,259): 101.7% | | | 145,526,399 | | |
| | | | | Liabilities in Excess of Other Assets: (1.7%) | | | (2,409,672 | ) | |
| | | | | Net Assets: 100.0% | | $ | 143,116,727 | | |
* Non-income producing security.
† Illiquid. Illiquid securities represent 0.9% of net assets.
ADR - American Depository Receipt
The accompanying notes are an integral part of these financial statements.
41
GLOBAL INNOVATORS FUND for the period ended December 31, 2011
1. Performance
The Global Innovators Fund over the course of 2011 produced a total return of -6.51%.
AVERAGE ANNUALIZED TOTAL RETURNS
| | | 1 Year
(actual) | | 3 Years | | 5 Years | | 10 Years | |
| Fund | | | -6.51 | % | | | 16.67 | % | | | 0.99 | % | | | 3.77 | % | |
| Benchmark Indices | |
| S&P 500 | | | 2.09 | % | | | 14.12 | % | | | -0.25 | % | | | 2.92 | % | |
| NASDAQ Composite | | | -0.79 | % | | | 19.46 | % | | | 2.50 | % | | | 3.74 | % | |
The Fund's gross expense ratio is 1.47% per the Summary Prospectus dated May 1, 2011. Guinness Atkinson Asset Management has contractually agreed to waive a portion of its advisory fees so that the Fund's ratio of expenses to average daily net assets will not exceed 1.55% (excluding Acquired Fund Fees and Expenses, interest, taxes, dividends on short positions and extraordinary expenses) through at least June 30, 2012. To the extent that the Advisor waives fees it may seek repayment of a portion or all of such amounts at any time within the three fiscal years after the fiscal year in which such amounts were waived, subject to the applicable cap.
Performance data quoted represents past performance and does not guarantee future results. The investment return and principal value of an investment will fluctuate so that an investor's shares, when redeemed, may be worth more or less than their original cost. Current performance of the Fund may be lower or higher than the performance quoted. Performance data current to the most recent month end may be obtained by visiting www.gafunds.com, or calling (800) 916-6566.
The Fund imposes a 2% redemption fee on shares held less than 30 days. Performance data quoted does not reflect the 2% redemption fee on shares held less than 30 days. Total returns for certain periods reflect a fee waiver in effect and in the absence of this waiver, total returns would have been lower.
The table below sets out the comparative returns in discrete years since launch.
| | | 2011 | | 2010 | | 2009 | | 2008 | | 2007 | | 2006 | | 2005 | | 2004 | | 2003 | | 2002 | | 2001 | | 2000 | | 1999 | |
| FUND | | -6.51% | | 17.00% | | 45.20% | | -45.42% | | 21.17% | | 18.76% | | 11.82% | | 10.89% | | 35.97% | | -31.13% | | -29.05% | | -16.78% | | 68.68% | |
| Benchmark indices | |
| S&P 500 | | 2.09% | | 15.08% | | 26.47% | | -36.99% | | 5.49% | | 15.79% | | 4.91% | | 10.87% | | 28.67% | | -22.09% | | -11.88% | | -9.10% | | 21.04% | |
| Fund | | below | | above | | above | | below | | above | | above | | above | | above | | above | | below | | below | | below | | above | |
| NASDAQ | | -0.79% | | 18.16% | | 45.36% | | -39.98% | | 10.65% | | 10.39% | | 2.12% | | 9.15% | | 50.77% | | -31.23% | | -20.8% | | -39.18% | | 86.12% | |
| Fund | | below | | below | | below | | below | | above | | above | | above | | above | | below | | above | | below | | above | | below | |
As these tables show, in calendar year 2011 the fund underperformed the S&P 500 by 8.60% and underperformed the NASDAQ by 5.72%. The fund remains ahead of both of these indices over a 10 year period and since the launch of the fund on 12/15/1998.
Our best performing stocks were Netflix (up 35.4%) which we sold at the end of March, Infospace (up 32.4%), Apple (up 16.2%) which we bought in March, Vodafone (up 14.4%) and Roper Industries (up 14.3%). Our worst performing stocks were Research in Motion (down 75.1%) and Nokia (down 50.2%).
Markets started 2011 with some optimism and consequently rallied over the first five months of the year. However, by the summer attention had returned to concerns in the Eurozone with spreads on the sovereign debt of peripheral Eurozone countries reaching extremely high levels and the threat of default on Greek debt becoming a very real concern. The consequent knock-on effect to European banks which held much of this sovereign debt was a reduction in lending as they sought to protect their balance sheets. We think this drying up of credit will most likely have slowed economic growth in the Eurozone over the last quarter of 2011 and
42
GLOBAL INNOVATORS FUND
will likely continue to have knock-on effects into 2012 and potentially beyond. At the same time we saw US government debt downgraded by S&P from its AAA rating. Amid these concerns markets fell sharply over the summer months. The rest of the year saw periods of increased volatility in equity markets with much uncertainty over the future of the Eurozone, Euro currency and the threat of default by Greece. At the same time we started to see encouraging signs of continued economic recovery in the US. Of particular note was the reduction in US unemployment over the fourth quarter, having seemed to have stalled in the middle of 2011, and the improvement in housing starts. Consequently we saw the US market rally towards the end of the year and finish 2011 at a similar level to where it started. Markets in Europe, however, remained depressed in the fourth quarter of 2011.
2. Portfolio Construction and Activity
In the first quarter we sold our positions in Garmin and Netflix and bought Intel and Apple. At the end of the third quarter we sold our positions in Citigroup and AIG.
The sector and geographic breakdown (by country of domicile) of the Fund holdings at the end of December 2011 are set out in the tables below. Geographically the Fund continues to hold the majority of it's holdings in the US (70.7%), with a further 13.3% in Asia. The Fund continues to be most heavily weighted towards the IT sector with 47.4%.
| Geographic Allocation | |
| US | | | 70.67 | % | |
| UK | | | 7.67 | % | |
| Korea | | | 5.77 | % | |
| Taiwan | | | 3.76 | % | |
| Japan | | | 3.73 | % | |
| Israel | | | 3.45 | % | |
| Finland | | | 3.28 | % | |
| Canada | | | 1.67 | % | |
| | | | 100.00 | % | |
| Sector Allocation | | | | | |
| Information Technology | | | 47.40 | % | | Health Care | | | 3.97 | % | |
| Financials | | | 14.66 | % | | Energy | | | 3.80 | % | |
| Industrials | | | 11.22 | % | | Consumer Staples | | | 0.00 | % | |
| Consumer Discretionary | | | 11.16 | % | | Materials | | | 0.00 | % | |
| Telecommunication Services | | | 7.80 | % | | Utilities | | | 0.00 | % | |
| | | | | | | | 100.00 | % | |
For the reporting period, approximately 65% of the Fund's assets are invested in companies that derive more than 40% of their revenues from activities outside the United States, and approximately 75% of the Fund's assets are invested in companies that derive more than 20% of their revenues from activities outside the United States. We consider these companies to be "global" in accordance with the tests set forth in the Fund's Prospectus because they have significant business activities outside the United States.
At the end of December 2011 the portfolio had 28 holdings.
3. Outlook and Strategy
The price to earnings ratio (PER) of the fund at year end 2011 was 10.8x (2012) and 9.9x (2013) compared with the S&P 500's PER of 12.0x (2012) and 10.7x (2013).
43
GLOBAL INNOVATORS FUND
We continue to seek attractive investment opportunities among companies that we have identified as exhibiting strong innovation characteristics.
The basis of our investment approach remains constant: using our multi-factor screening process to select the best 30 or so ideas from our universe of innovative companies and targeting a deliberately low turnover. The four criteria in our screening process are: (a) value (measured by comparing the current market valuation with a valuation derived from a discounted cash flow from existing and future investments); (b) business quality (quantitatively ranking companies for the attractiveness of their return on capital metrics); (c) improving results (based on 1, 3, and 6 month earnings estimates revisions); and (d) good recent stock price performance (looking particularly for above trend momentum and rising volatility). This screening process, combined with a top down "thematic" analysis, is then used to evaluate potential purchases for the fund.
At the end of 2010 we wrote that our outlook for 2011:
"...remains somewhat cautious given unemployment levels in the US, continued concerns over national balance sheets in Europe and inflation in China. In the near term the US economy looks set to continue its recovery thanks to the effect of the extension of tax cuts on consumer spending. If the extension of tax cuts does not start to have a meaningful impact on unemployment by the end of 2011 then markets are likely to react."
At the beginning of 2012 our global outlook remains somewhat cautious, but we note that some progress has been made towards stimulating a recovery in the US. At the same time, however, our concerns over the Eurozone have escalated. We believe the Eurozone crisis is largely a result of a lack of political will to address a very difficult situation. Until certainty can be provided to the market, we think yields on peripheral Eurozone debt will likely remain high, banks will likely continue to reduce lending, and the threat of a default by Greece will mean companies will continue to hoard cash rather than make investments. We therefore expect lower growth, or even recession, in the Eurozone in the short- to medium- term.
Clearly this will have some knock-on effects for the US and emerging market economies, but to what extent is largely in the hands of the European leaders. If the bad debts of peripheral European countries can somehow be renegotiated and ring-fenced, and a stimulus enabled to spur growth in Europe, then the pain felt around the rest of the world is likely to be quite small. Despite various headline grabbing statements there are currently major political differences about how to deal with the crisis and this deadlock seems likely to continue. This increases the real concern of a default by Greece, which could potentially lead to further defaults by other peripheral Eurozone countries, which would spark a significant banking and credit crisis that would be felt worldwide.
While the US economic recovery is encouraging it remains to be seen to what extent this recovery can last, and at what level trend gross domestic product (GDP) growth is likely to settle in the future. The risk is that US trend growth of GDP will be somewhat lower in the short-term than it has been in the past 50 years and markets may anticipate a stronger recovery than actually appears. However, the power of the business cycle is a very strong force which can itself stimulate improved confidence and generate continued economic growth.
As always there are also those risks of which we are not currently aware. 2011 is a case in point. The markets were focused on understanding the scale and consequences of the Eurozone crisis, but no one could have predicted the catastrophic earthquake in Japan, the floods in Australia and Thailand, or the speed at which the Arab Spring spread throughout the Middle East. With the continued heightened uncertainty for the direction of financial markets, and the fine balance between economic growth and recession now seen in many Western economies, we believe the effects of any 'unexpected' events will continue to have an outsized impact and lead to increased volatility across the financial markets.
With this outlook in mind we remain focused on seeking to identify strong businesses that can weather economic uncertainty and who can opportunistically take advantage of any situations that may arise (for example, taking market share or making acquisitions). Balance sheet strength continues to be very important and particularly the amount of cash companies has in reserve.
44
GLOBAL INNOVATORS FUND
We continue to believe innovative companies can ride the economic storms better than the average company and therefore should be well rewarded over the long-term.

Tim Guinness

Matthew Page

Ian Mortimer
The Fund invests in foreign securities, which involves political, economic and currency risks, greater volatility, and differences in accounting methods. The Fund is non-diversified, meaning its assets may be concentrated in fewer individual holdings than diversified funds. Therefore, the Fund is more exposed to individual stock volatility than diversified funds. The Fund invests in smaller companies, which involves additional risks such as limited liquidity and greater volatility.
The Standard & Poor's 500 Index is a market capitalization-weighted index composed of 500 widely held common stocks of U.S. companies. The NASDAQ Composite Index is a market capitalization-weighted index that is designed to represent the performance of the National Market System, which includes over 5,000 stocks traded only over-the-counter and not on an exchange. These indices are unmanaged, not available for investment and do not incur expenses.
PER or P/E – Price to Earnings ratio is calculated by dividing current price of the stock by the company's trailing months' earnings per share.
Cash flow measures the cash generating capability of a company by adding non-cash charges (e.g. depreciation) and interest expense to pretax income.
Please refer to the Schedule of Investments for details on Fund holdings. Current and future portfolio holdings are subject to risk.
45
GUINNESS ATKINSON GLOBAL INNOVATORS FUND
Growth of $10,000
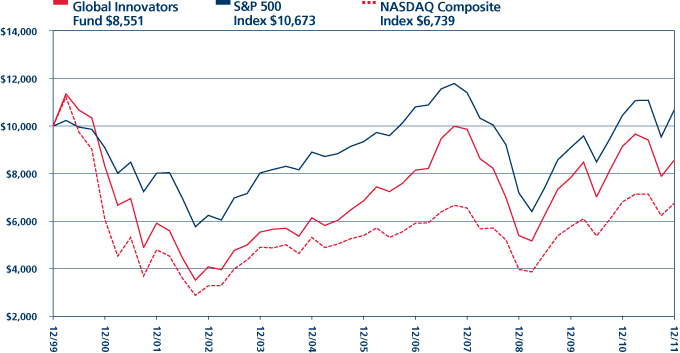
Average Annual Total Return
Periods Ended December 31, 2011
| One Year | | Five Year | | Ten Year | |
| | (6.51 | )% | | | 0.99 | % | | | 3.77 | % | |
Performance data quoted represents past performance and does not guarantee future results. The investment return and principal value of an investment will fluctuate so that an investor's shares, when redeemed, may be worth more or less than their original cost. Current performance of the Fund may be lower or higher than the performance quoted. Performance data current to the most recent month end may be obtained by visiting www.gafunds.com.
Total returns reflect a fee waiver in effect and in the absence of this waiver, the total returns would be lower. The Fund imposes a 2% redemption fee on shares held less than 30 days.
The Standard & Poor's 500 Index is an unmanaged index which is widely regarded as the standard for measuring large cap U.S. Stock market performance. The NASDAQ Composite Index is a market capitalization weighted index that is designed to represent the performance of the National Market System which includes over 5,000 stocks traded only over-the-counter and not on an exchange. The indices referenced in this chart are not available for investment and do not incur expenses.
46
FUND HIGHLIGHTS at December 31, 2011
GUINNESS ATKINSON GLOBAL INNOVATORS FUND
| # of Holdings in Portfolio: | | 28 | |
| Portfolio Turnover: | | 47.4% | |
| % of Stocks in Top 10: | | 40.0% | |
| Fund Managers: | |
| Timothy W. N. Guinness | |
| Matthew Page | |
| Ian Mortimer | |
| Top 10 Holdings (% of net assets) | | | | | | | |
| Samsung Electronics Co., Ltd. - ADR | | 5.7% | | Vodafone Group PLC - ADR | | 3.8% | |
| Apple, Inc. | | 3.9% | | Danaher Corp. | | 3.8% | |
| Gilead Sciences, Inc. | | 3.9% | | Infospace, Inc. | | 3.7% | |
| Intel Corp. | | 3.9% | | BP PLC - ADR | | 3.7% | |
| CenturyLink, Inc. | | 3.9% | | Roper Industries, Inc. | | 3.7% | |
| Sector Breakdown (% of net assets) | | | | | | | |
| Electronics | | 16.7% | | Cable/Satellite TV | | 3.7% | |
| Telecommunications | | 7.7% | | E-Commerce | | 3.7% | |
| Semiconductor | | 7.4% | | Internet Content - Information | | 3.7% | |
| Commercial Banks | | 7.2% | | Machinery | | 3.7% | |
| Prepackaged Software | | 6.5% | | Oil & Gas Producers | | 3.7% | |
| Computers | | 5.6% | | Retail | | 3.6% | |
| Medical - Biomedical | | 3.9% | | Finance - Other Services | | 3.5% | |
| Diversified Manufactured Operations | | 3.8% | | Computer Aided Design | | 3.3% | |
| Finance - Investment Banker/Broker | | 3.7% | | Wireless Equipment | | 3.2% | |
| Automobile Manufacturers | | 3.7% | | | | | | | |
47
SCHEDULE OF INVESTMENTS
at December 31, 2011
GUINNESS ATKINSON GLOBAL INNOVATORS FUND
| Shares | | COMMON STOCKS: 98.3% | | Value | |
| Automobile Manufacturers: 3.7% | | | |
| | 19,940 | | | Honda Motor Co., Ltd. - ADR | | $ | 609,167 | | |
| | 8,740 | | | Toyota Motor Corp. - ADR | | | 577,976 | | |
| | | | 1,187,143 | | |
| Cable/Satellite TV: 3.7% | | | |
| | 50,170 | | | Comcast Corp. - Class A | | | 1,189,531 | | |
| Commercial Banks: 7.2% | | | |
| | 27,500 | | | Capital One Financial Corp. | | | 1,162,975 | | |
| | 29,174 | | | State Street Corp. | | | 1,176,004 | | |
| | | | 2,338,979 | | |
| Computer Aided Design: 3.3% | | | |
| | 58,310 | | | Parametric Technology Corp.* | | | 1,064,741 | | |
| Computers: 5.6% | | | |
| | 3,150 | | | Apple, Inc.* | | | 1,275,750 | | |
| | 36,660 | | | Research In Motion Ltd.* | | | 531,570 | | |
| | | | 1,807,320 | | |
| Diversified Manufacturing Operations: 3.8% | | | |
| | 26,180 | | | Danaher Corp. | | | 1,231,507 | | |
| E-Commerce: 3.7% | | | |
| | 39,140 | | | eBay, Inc.* | | | 1,187,116 | | |
| Electronics: 16.7% | | | |
| | 51,850 | | | Intel Corp. | | | 1,257,362 | | |
| | 17,110 | | | L-3 Communications Holdings, Inc. | | | 1,140,895 | | |
| | 85,395 | | | NVIDIA Corp.* | | | 1,183,575 | | |
| | 3,990 | | | Samsung Electronics Co., Ltd. - GDR | | | 1,838,193 | | |
| | | | 5,420,025 | | |
| Finance – Investment Bank/Broker: 3.7% | | | |
| | 76,080 | | | TD Ameritrade Holding Corp. | | | 1,190,652 | | |
| Finance – Other Services: 3.5% | | | |
| | 9,440 | | | IntercontinentalExchange, Inc.* | | | 1,137,992 | | |
| Internet Content – Information: 3.7% | | | |
| | 110,150 | | | Infospace, Inc.* | | | 1,210,549 | | |
| Machinery: 3.7% | | | |
| | 13,820 | | | Roper Industries, Inc. | | | 1,200,543 | | |
| Medical – Biomedical: 3.9% | | | |
| | 30,850 | | | Gilead Sciences, Inc.* | | | 1,262,691 | | |
| Oil & Gas Producers: 3.7% | | | |
| | 28,280 | | | BP PLC - ADR | | | 1,208,687 | | |
The accompanying notes are an integral part of these financial statements.
48
| Shares | | COMMON STOCKS: 98.3% (Continued) | | Value | |
| Prepackaged Software: 6.5% | | | |
| | 20,890 | | | Check Point Software Technologies* | | $ | 1,097,561 | | |
| | 39,680 | | | Oracle Corp. | | | 1,017,792 | | |
| | | | 2,115,353 | | |
| Retail: 3.6% | | | |
| | 50,330 | | | Best Buy Co., Inc. | | | 1,176,212 | | |
| Semiconductor: 7.4% | | | |
| | 110,990 | | | Applied Materials, Inc. | | | 1,188,703 | | |
| | 92,729 | | | Taiwan Semiconductor Manufacturing Co., Ltd. - ADR | | | 1,197,131 | | |
| | | | 2,385,834 | | |
| Telecommunications: 7.7% | | | |
| | 33,577 | | | CenturyLink, Inc. | | | 1,249,064 | | |
| | 44,045 | | | Vodafone Group PLC - ADR | | | 1,234,581 | | |
| | | | 2,483,645 | | |
| Wireless Equipment: 3.2% | | | |
| | 216,422 | | | Nokia OYJ - ADR | | | 1,043,154 | | |
| | | | | Total Common Stocks
(cost $38,330,481) | | | 31,841,674 | | |
| | | | | Total Investments in Securities
(cost $38,330,481): 98.3% | | | 31,841,674 | | |
| | | | | Other Assets less Liabilities: 1.7% | | | 548,747 | | |
| | | | | Net Assets: 100.0% | | $ | 32,390,421 | | |
* Non-income producing security.
ADR - American Depository Receipt
GDR - Global Depository Receipt
The accompanying notes are an integral part of these financial statements.
49
RENMINBI YUAN & BOND FUND report for the period ended December 31st 2011
1. Performance
| | | Since
Launch
(June 30, 2011) | |
| Fund | | | 0.16 | % | |
| Comparisons: | |
| RMB Cash Offshore (CNH)* | | | 1.91 | %* | |
| RMB Cash Onshore (CNY)* | | | 2.68 | %* | |
| BOCHK Offshore RMB Bond Index (in CNH) | | | -5.42 | % | |
* Net change in Exchange Rate versus U.S. Dollar.
The Fund's gross expense ratio is 0.90% per the Prospectus dated June 30, 2011. Guinness Atkinson Asset Management has contractually agreed to waive a portion of its advisory fees so that the Fund's ratio of expenses to average daily net assets will not exceed 0.90% (excluding Acquired Fund Fees and Expenses, interest, taxes, dividends on short positions and extraordinary expenses) through at least June 30, 2013. To the extent that the Advisor waives fees it may seek repayment of a portion or all of such amounts at any time within the three fiscal years after the fiscal year in which such amounts were waived, subject to the applicable cap.
The Fund was launched on June 30 2011 to give investors the opportunity to participate in the newly developing offshore renminbi market in Hong Kong. In 2010, the Chinese government took a big step toward enabling its currency to be used outside its borders for the first time. China accounted for almost 10%, or US$3.5 trillion, of world trade of goods in 2011. However, only a fraction of this was conducted in China's own currency. Friction with China's trading partners has also arisen as China's currency is generally perceived to be undervalued with some arguing that this has given China an unfair advantage. From China's perspective there are good domestic reasons as well and international ones for bringing the renminbi toward convertibility. We see the offshore renminbi market as a significant step toward this goal.
To make this happen agreements have been struck between the People's Bank of China (PBOC) and the Hong Kong Monetary Authority (HKMA) to permit banks in Hong Kong to conduct renminbi business, to permit the movement of renminbi offshore through Hong Kong and back again into mainland China under strictly controlled conditions. In another significant development permission was granted to Hong Kong residents and corporations anywhere for the first time to buy and hold renminbi directly at a rate of exchange prevailing in the offshore market. This has given rise to two exchange rates: the onshore or official exchange rate (CNY) is available to those for settling trade invoices; the offshore rate (CNH), determined by the supply and demand for renminbi in the offshore market is available to everyone else.
The ability for corporations including investment vehicles to buy renminbi coupled with the build-up of renminbi cash deposits in Hong Kong has created demand for renminbi-denominated interest bearing assets and provided a market for Chinese and foreign companies and banks to raise funds in the offshore renminbi (CNH) market by issuing bonds and (for banks) by issuing certificates of deposit.
The Fund invests in the CNH market with the primary aim of giving investors exposure to the renminbi through direct purchase of renminbi and secondarily to earn some interest on that renminbi cash while seeking to avoid taking on significant credit risk.
During the period the Fund rose 0.16% with the CNH exchange rate up 1.91% against the US dollar while bonds, as referenced by the BOCHK Offshore RMB Bond Index, fell over 5%. We have been very cautious in how we have invested the fund and have constrained the size of the bond portfolio to 35% of the overall portfolio. Furthermore, the bonds held are almost all investment grade issues. The reason for the caution was that we believe yields are, and have been, lower than they might be because the amount of cash held offshore is greater than amount of renminbi denominated issues offshore.
The yields on Chinese corporate bonds saw most of their weakness in the third quarter. In the fourth quarter it was the turn of investment grade issues, both sovereign and corporate, to see an upward shift of around 1%. The move was the result of investors'
50
RENMINBI YUAN & BOND FUND
responses to greater currency volatility in the secondary market and to new issues which needed to be priced more attractively in the light of that currency volatility.
During the period, there were further initiatives to help the offshore market develop further. The quota available to the Bank of China Hong Kong branch for trade settlement was doubled. Further liquidity assurance was provided by a doubling to RMB400 billion of the swap arrangement between PBOC and the HKMA. There was some easing in Hong Kong on banks' collateral requirements to secure short term renminbi funding to enable more rapid development of offshore renminbi lending. Finally, there was some easing of controls over the ability to remit onshore, renminbi that has been raised offshore.
There are those who worry from time to time that China's commitment to the offshore market is either lukewarm or becoming so. The evidence we see is that there is a steady flow of measures to keep the market growing but, at the same time, there is a desire to maintain a measured pace.
2. Portfolio Position
The average duration of the bond portfolio was just over three years. The bond portfolio only accounted for 34% of the Fund, putting the average portfolio duration at 1.02 years.
The allocation reflects our intention to concentrate on providing investors with exposure to renminbi through holding renminbi cash, with the secondary intention of investing some of that renminbi cash in interest-bearing instruments in order to offset the expenses of the Fund. To that end we seek to keep credit risk low.
3. Outlook and Strategy
We believe that the renminbi is still undervalued against the dollar and that there are long term structural drivers that will push further appreciation. There are various methodologies for calculating the fair value of a currency, all subject to big margins of uncertainty ranging from instability and differences in macro linkages within and between countries through to basic problems of measurement. Three methods used by the IMF (Effective Real Exchange Rate, External Sustainability and Macro-economic balance method) suggest the currency is undervalued by 3%, 17% and 23% respectively. Estimates submitted to the US Congress come in a range of 28% to 42% undervalued. Public and private sector estimates cluster around the 20% to 28% range.
For 2012, we believe that lower Chinese inflation will lessen the domestic imperative for rapid appreciation of the currency, but the trade surplus still keeps the pressure on. We expect a more modest appreciation against the US dollar of around 3% this year, rather than the near 5% appreciation in 2011.
The offshore renminbi bond market, the so-called dim sum bond market, is still developing. Maturities are short, with the bulk of issuance, around 80%, clustered around one to three years. The lack of duration is proving to be a stumbling block for infrastructure issuers such as the Hong Kong Airport Authority. The narrow range of issuers, the absence of ratings among most Chinese corporate issuers, and the absence of an offshore government yield curve all make for a fragmented market.

Edmund Harriss
The Fund invests in foreign securities, which involves political, economic and currency risks, greater volatility, and differences in accounting methods. The Fund is non-diversified, meaning that its assets may be concentrated in fewer individual holdings than diversified funds. Therefore, the Fund is more exposed to individual stock volatility than diversified funds. The Fund invests in all market capitalization companies, including companies in emerging markets. Investments in debt securities typically decrease in value when interest rates rise, which can be greater for longer-term debt securities. The Funds may invest in derivatives, which involves risks different from, and in certain cases, greater than the risks presented by traditional investments.
The BOCHK Offshore RMB Bond Index tracks the total return performance of offshore renminbi (RMB)-denominated bonds that (i) are issued outside the Mainland of China; and (ii) satisfy a set of pre-specified and transparent eligibility criteria. It includes RMB-denominated bonds issued in the Hong Kong SAR presently and perhaps in other countries or regions in future. The Index was launched on December 31, 2010 with a base value of 100.
51
RENMINBI YUAN & BOND FUND
Please refer to the Schedule of Investments for details on Fund holdings. Current and future portfolio holdings are subject to risk.
The information provided herein represents the opinion of Guinness Atkinson Management for the period stated and is not intended to be a forecast of future events, a guarantee of future results, or investment advice. Opinions, Fund holdings and sector allocations are subject to change at any time, and are not recommendations to buy or sell any security.
52
GUINNESS ATKINSON RENMINBI YUAN & BOND FUND
Growth of $10,000
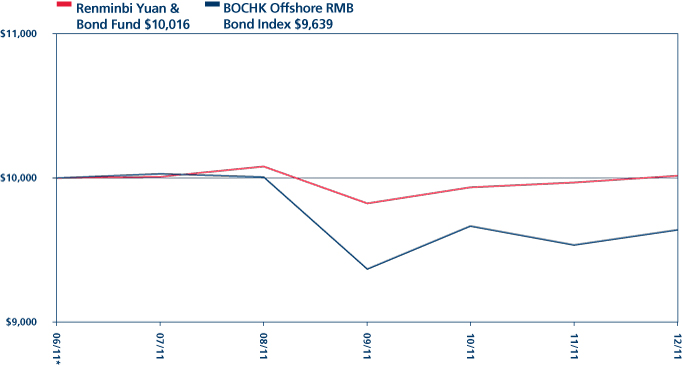
Total Return
Period Ended December 31, 2011
Since Inception
(06/30/11)* | |
| | 0.16 | % | |
* Inception date 6/30/11.
Performance data quoted represents past performance and does not guarantee future results. The investment return and principal value of an investment will fluctuate so that an investor's shares, when redeemed, may be worth more or less than their original cost. Current performance of the Fund may be lower or higher than the performance quoted. Performance data current to the most recent month end may be obtained by visiting www.gafunds.com.
Total returns reflect a fee waiver in effect and in the absence of this waiver, the total returns would be lower. The Fund imposes a 2% redemption fee on shares held less than 30 days.
The BOCHK Offshore RMB Bond Index tracks the total return performance of offshore Renminbi (RMB) denominated bonds which (i) are issued outside the Mainland of China and (ii) satisfy a set of pre-specified and transparent eligibility criteria. It includes RMB denominated bonds issued in the Hong Kong SAR presently and perhaps in other countries or regions in the future. The Index is launched on 31 December 2010 with a base value of 100.
53
FUND HIGHLIGHTS at December 31, 2011
GUINNESS ATKINSON RENMINBI YUAN & BOND FUND
| # of Holdings in Portfolio: | | 10 | |
| Portfolio Turnover: | | 28.5% | |
| % of Top 10 Holdings: | | 56.1% | |
| Fund Managers: | |
| Edmund Harriss | |
| Tim Guinness | |
| Top 10 Holdings (% of net assets) | | | | Classification Breakdown (% of net assets) | | | |
| Bank of China, 1.20%, 04/10/12 | | 11.9% | | China Yuan (Offshore) | | 42.2% | |
| Bank of China, 1.60%, 03/21/12 | | 10.2% | | Multinational | | 26.5% | |
| Air Liquide Finance, 3.00%, 09/19/16 | | 9.9% | | Certificate of Deposit CNH | | 22.1% | |
| Caterpillar Financial Services Corp., 1.35%, 07/12/13 | | 6.0% | | China Corporate | | 7.5% | |
| BP Capital Markets PLC, 1.70%, 09/15/14 | | 5.8% | | | | | |
| CNPC Golden Autumn Ltd, 2.55%, 10/26/13 | | 3.4% | | | | | |
| Global Logistic Properties Ltd, 3.37%, 05/11/16 | | 3.1% | | | | | |
| Volkswagen International Finance NV, 2.15%, 05/23/16 | | 3.0% | | | | | |
| Tesco PLC, 1.75%, 09/01/14 | | 1.8% | | | | | |
| Singamas Container Holdings Ltd, 4.75%, 04/14/14 | | 1.0% | | | | | |
54
SCHEDULE OF INVESTMENTS
at December 31, 2011
GUINNESS ATKINSON RENMINBI YUAN & BOND FUND
| Principal Amount (CNH) | | CORPORATE BONDS: 34.0% | | Value | |
| Auto-Cars/Light Trucks: 3.0% | | | |
| | 18,000,000 | | | Volkswagen International Finance NV, 2.15%, 05/23/16 | | $ | 2,742,572 | | |
| Food-Retail: 1.8% | | | |
| | 10,500,000 | | | Tesco PLC, 1.75%, 09/01/14 | | | 1,632,734 | | |
| Industrial Gases: 9.9% | | | |
| | 60,000,000 | | | Air Liquide Finance, 3.00%, 09/19/16 | | | 9,195,625 | | |
| Machinery: 6.0% | | | |
| | 36,000,000 | | | Caterpillar Financial Services Corp., 1.35%, 07/12/13 | | | 5,587,090 | | |
| Manufacturer: 1.0% | | | |
| | 6,500,000 | | | Singamas Container Holdings Ltd, 4.75%, 04/14/14 | | | 917,943 | | |
| Oil Company – Exploration & Production: 3.4% | | | |
| | 20,000,000 | | | CNPC Golden Autumn Ltd, 2.55%, 10/26/13 | | | 3,154,473 | | |
| Oil Company – Integrated: 5.8% | | | |
| | 35,000,000 | | | BP Capital Markets PLC, 1.70%, 09/15/14 | | | 5,421,487 | | |
| Real Estate Operator/Developer: 3.1% | | | |
| | 18,500,000 | | | Global Logistic Properties Ltd, 3.37%, 05/11/16 | | | 2,840,059 | | |
| | | | | Total Corporate Bonds
(cost $32,122,213) | | | 31,491,983 | | |
| | Short-Term Investments: 22.1% | | | |
| Certificate of Deposits: 22.1% | | | |
| | 60,000,000 | | | Bank of China, 1.60%, 03/21/12 | | | 9,458,501 | | |
| | 70,000,000 | | | Bank of China, 1.20%, 04/10/12 | | | 11,034,917 | | |
| | | | | Total Certificate of Deposits
(cost $20,146,665) | | | 20,493,418 | | |
| | | | | Total Investments in Securities
(cost $52,268,878): 56.1% | | | 51,985,401 | | |
| Cash: 42.2% | | | |
| | 248,061,102 | | | China Yuan (Offshore): 42.2% | | | 39,104,769 | | |
| | | | | Other Assets less Liabilities: 1.7% | | | 1,637,163 | | |
| | | | | Net Assets: 100.0% | | $ | 92,727,333 | | |
The accompanying notes are an integral part of these financial statements.
55
STATEMENTS OF ASSETS AND LIABILITIES
at December 31, 2011
| | | Alternative
Energy
Fund | | Asia
Focus
Fund | | Asia Pacific
Dividend
Fund | | China &
Hong Kong
Fund | |
| Assets | |
| Investments in securities, at cost | | $ | 33,674,278 | | | $ | 40,369,746 | | | $ | 4,244,950 | | | $ | 128,019,692 | | |
| Investments in securities, at value | | $ | 17,351,983 | | | $ | 46,034,015 | | | $ | 4,561,099 | | | $ | 155,072,923 | | |
| Cash | | | — | | | | — | | | | — | | | | — | | |
Cash denominated in foreign currency (cost of $350,390,
$36,398, $2,048, and $68,397, respectively) | | | 339,442 | | | | 35,663 | | | | 2,052 | | | | 68,197 | | |
| Receivables: | |
| Securities sold | | | 904,949 | | | | — | | | | — | | | | 160,245 | | |
| Fund shares sold | | | 13,869 | | | | 43,527 | | | | 416 | | | | 147,730 | | |
| Dividends and interest | | | 64,445 | | | | 24,108 | | | | 14,232 | | | | 60,038 | | |
| Due from Advisor, net | | | — | | | | — | | | | 2,781 | | | | — | | |
| Prepaid expenses | | | 841 | | | | 6,874 | | | | 2,239 | | | | 18,067 | | |
| Total assets | | | 18,675,529 | | | | 46,144,187 | | | | 4,582,819 | | | | 155,527,200 | | |
| Liabilities | |
| Overdraft due to custodian bank | | | 202,521 | | | | 161,437 | | | | 6,789 | | | | 1,932,985 | | |
| Payable for securities purchased | | | 759,187 | | | | — | | | | — | | | | — | | |
| Payable for Fund shares redeemed | | | 61,939 | | | | 21,055 | | | | — | | | | 273,862 | | |
| Due to Advisor, net | | | 16,354 | | | | 39,812 | | | | — | | | | 133,872 | | |
| Accrued administration fees | | | 578 | | | | 2,149 | | | | 411 | | | | 4,472 | | |
| Accrued shareholder servicing plan fees | | | 2,218 | | | | 5,696 | | | | 694 | | | | 24,877 | | |
| Deferred trustees' compensation | | | 20,891 | | | | 41,835 | | | | 12,939 | | | | 84,397 | | |
| Other accrued expenses | | | 51,338 | | | | 55,167 | | | | 30,032 | | | | 113,222 | | |
| Total liabilities | | | 1,115,026 | | | | 327,151 | | | | 50,865 | | | | 2,567,687 | | |
| Net Assets | | $ | 17,560,503 | | | $ | 45,817,036 | | | $ | 4,531,954 | | | $ | 152,959,513 | | |
Number of shares issued and outstanding (unlimited shares
authorized, no par value) | | | 6,024,088 | | | | 2,823,756 | | | | 403,639 | | | | 5,754,387 | | |
| Net asset value per share | | $ | 2.92 | | | $ | 16.23 | | | $ | 11.23 | | | $ | 26.58 | | |
| Composition of Net Assets | |
| Paid-in capital | | $ | 116,800,630 | | | $ | 45,423,509 | | | $ | 8,559,736 | | | $ | 129,769,357 | | |
| Undistributed net investment income (loss) | | | (66,032 | ) | | | 83,648 | | | | (17,496 | ) | | | 959,112 | | |
Accumulated net realized gain (loss) on investments
and foreign currency | | | (82,837,010 | ) | | | (5,350,184 | ) | | | (4,326,466 | ) | | | (4,822,267 | ) | |
| Net unrealized appreciation (depreciation) on: | |
| Investments | | | (16,322,295 | ) | | | 5,664,269 | | | | 316,149 | | | | 27,053,231 | | |
| Foreign currency | | | (14,790 | ) | | | (4,206 | ) | | | 31 | | | | 80 | | |
| Net Assets | | $ | 17,560,503 | | | $ | 45,817,036 | | | $ | 4,531,954 | | | $ | 152,959,513 | | |
The accompanying notes are an integral part of these financial statements.
56
STATEMENTS OF ASSETS AND LIABILITIES
at December 31, 2011
| | | Global
Energy
Fund | | Global
Innovators
Fund | | Renminbi
Yuan & Bond
Fund | |
| Assets | |
| Investments in securities, at cost | | $ | 155,785,259 | | | $ | 38,330,481 | | | $ | 52,268,878 | | |
| Investments in securities, at value | | $ | 145,526,399 | | | $ | 31,841,674 | | | $ | 51,985,401 | | |
| Cash | | | — | | | | 1,798,089 | | | | 1,304,313 | | |
Cash denominated in foreign currency (cost of
$1,482, $0, and $38,702,856, respectively) | | | 1,492 | | | | — | | | | 39,104,769 | | |
| Receivables: | |
| Securities sold | | | 52,833 | | | | — | | | | — | | |
| Fund shares sold | | | 215,063 | | | | 21,377 | | | | 159,950 | | |
| Dividends and interest | | | 104,218 | | | | 68,646 | | | | 235,092 | | |
| Prepaid expenses | | | 20,599 | | | | 7,796 | | | | 22,433 | | |
| Total assets | | | 145,920,604 | | | | 33,737,582 | | | | 92,811,958 | | |
| Liabilities | |
| Overdraft due to custodian bank | | | 165,293 | | | | — | | | | — | | |
| Payable for securities purchased | | | — | | | | 1,205,999 | | | | — | | |
| Payable for Fund shares redeemed | | | 2,434,646 | | | | 11,897 | | | | — | | |
| Due to Advisor, net | | | 91,576 | | | | 21,129 | | | | 42,688 | | |
| Accrued administration fees | | | 5,771 | | | | 1,385 | | | | 3,098 | | |
| Accrued shareholder servicing plan fees | | | 13,709 | | | | 5,160 | | | | 10,132 | | |
| Deferred trustees' compensation | | | 29,414 | | | | 52,812 | | | | 2,100 | | |
| Other accrued expenses | | | 63,468 | | | | 48,779 | | | | 26,607 | | |
| Total liabilities | | | 2,803,877 | | | | 1,347,161 | | | | 84,625 | | |
| Net Assets | | $ | 143,116,727 | | | $ | 32,390,421 | | | $ | 92,727,333 | | |
Number of shares issued and outstanding (unlimited shares
authorized, no par value) | | | 5,565,184 | | | | 1,827,507 | | | | 7,409,211 | | |
| Net asset value per share | | $ | 25.72 | | | $ | 17.72 | | | $ | 12.52 | | |
| Composition of Net Assets | |
| Paid-in capital | | $ | 157,445,868 | | | $ | 50,317,238 | | | $ | 92,691,222 | | |
| Undistributed net investment income (loss) | | | (38,834 | ) | | | (50,573 | ) | | | (83,991 | ) | |
Accumulated net realized gain (loss) on investments
and foreign currency | | | (4,026,970 | ) | | | (11,387,437 | ) | | | — | | |
| Net unrealized appreciation (depreciation) on: | |
| Investments | | | (10,258,860 | ) | | | (6,488,807 | ) | | | (283,477 | ) | |
| Foreign currency | | | (4,477 | ) | | | — | | | | 403,579 | | |
| Net Assets | | $ | 143,116,727 | | | $ | 32,390,421 | | | $ | 92,727,333 | | |
The accompanying notes are an integral part of these financial statements.
57
STATEMENTS OF OPERATIONS
For the year ended December 31, 2011
| | | Alternative
Energy
Fund | | Asia
Focus
Fund | | Asia Pacific
Dividend
Fund | | China &
Hong Kong
Fund | |
| Investment Income | |
| Dividends * | | $ | 928,871 | | | $ | 1,459,104 | | | $ | 255,752 | | | $ | 5,376,377 | | |
| Interest | | | — | | | | — | | | | — | | | | — | | |
| Total income | | | 928,871 | | | | 1,459,104 | | | | 255,752 | | | | 5,376,377 | | |
| Expenses | |
| Advisory fees | | | 318,251 | | | | 587,715 | | | | 58,349 | | | | 2,012,820 | | |
| Shareholder servicing plan fees | | | 54,111 | | | | 106,214 | | | | 10,477 | | | | 399,430 | | |
| Transfer agent fees and expenses | | | 63,126 | | | | 45,001 | | | | 18,998 | | | | 193,906 | | |
| Fund accounting fee and expenses | | | 32,656 | | | | 39,737 | | | | 27,999 | | | | 73,162 | | |
| Administration fees | | | 12,737 | | | | 23,515 | | | | 2,334 | | | | 81,530 | | |
| Custody fees and expenses | | | 10,001 | | | | 30,000 | | | | 10,001 | | | | 58,085 | | |
| Audit fees | | | 17,848 | | | | 24,623 | | | | 17,848 | | | | 24,623 | | |
| Legal fees | | | 9,784 | | | | 21,592 | | | | 2,199 | | | | 72,941 | | |
| Registration fees | | | 13,150 | | | | 16,704 | | | | 16,502 | | | | 30,602 | | |
| Printing | | | 16,958 | | | | 13,560 | | | | 6,968 | | | | 42,001 | | |
| Trustees' fees and expenses | | | 7,001 | | | | 7,002 | | | | 8,501 | | | | 14,500 | | |
| Insurance | | | 2,518 | | | | 4,314 | | | | 361 | | | | 19,418 | | |
| CCO fees and expenses | | | 9,757 | | | | 11,519 | | | | 7,581 | | | | 25,499 | | |
| Miscellaneous | | | 1,312 | | | | 2,500 | | | | 1,500 | | | | 4,000 | | |
| Total expenses | | | 569,210 | | | | 933,996 | | | | 189,618 | | | | 3,052,517 | | |
| Interest expense | | | 7,243 | | | | 528 | | | | 634 | | | | 29,208 | | |
| Less: fees (waived and expenses absorbed)/recaptured | | | — | | | | — | | | | (74,834 | ) | | | — | | |
| Net expenses | | | 576,453 | | | | 934,524 | | | | 115,418 | | | | 3,081,725 | | |
| Net investment income | | | 352,418 | | | | 524,580 | | | | 140,334 | | | | 2,294,652 | | |
| Realized and unrealized gain (loss) on investments and foreign currency | |
| Net realized loss on: | |
| Investments | | | (12,089,642 | ) | | | (1,683,154 | ) | | | (39,788 | ) | | | (4,007,524 | ) | |
| Foreign currency | | | (76,896 | ) | | | (12,420 | ) | | | (4,518 | ) | | | (6,210 | ) | |
| | | | (12,166,538 | ) | | | (1,695,574 | ) | | | (44,306 | ) | | | (4,013,734 | ) | |
| Net unrealized appreciation (depreciation) on: | |
| Investments | | | (2,954,894 | ) | | | (12,954,702 | ) | | | (941,879 | ) | | | (58,741,199 | ) | |
| Foreign currency | | | (153 | ) | | | (1,322 | ) | | | (672 | ) | | | 148 | | |
| | | | (2,955,047 | ) | | | (12,956,024 | ) | | | (942,551 | ) | | | (58,741,051 | ) | |
| Net realized and unrealized loss on investments and foreign currency | | | (15,121,585 | ) | | | (14,651,598 | ) | | | (986,857 | ) | | | (62,754,785 | ) | |
| Net decrease in net assets from operations | | $ | (14,769,167 | ) | | $ | (14,127,018 | ) | | $ | (846,523 | ) | | $ | (60,460,133 | ) | |
* Net of foreign tax withheld of $36,586, $183,760, $27,562, and $241,950, respectively.
The accompanying notes are an integral part of these financial statements.
58
STATEMENTS OF OPERATIONS
For the year ended December 31, 2011
| | | Global
Energy
Fund | | Global
Innovators
Fund | | Renminbi
Yuan & Bond
Fund† | |
| Investment Income | |
| Dividends * | | $ | 2,871,929 | | | $ | 629,411 | | | $ | — | | |
| Interest | | | — | | | | — | | | | 282,607 | | |
| Total income | | | 2,871,929 | | | | 629,411 | | | | 282,607 | | |
| Expenses | |
| Advisory fees | | | 1,261,888 | | | | 281,403 | | | | 164,648 | | |
| Shareholder servicing plan fees | | | 414,266 | | | | 56,839 | | | | 16,828 | | |
| Transfer agent fees and expenses | | | 118,184 | | | | 64,968 | | | | 5,405 | | |
| Fund accounting fee and expenses | | | 61,870 | | | | 27,999 | | | | 12,327 | | |
| Administration fees | | | 66,056 | | | | 14,980 | | | | 11,914 | | |
| Custody fees and expenses | | | 21,002 | | | | 3,110 | | | | 3,393 | | |
| Audit fees | | | 24,623 | | | | 24,623 | | | | 14,578 | | |
| Legal fees | | | 57,123 | | | | 12,501 | | | | 10,521 | | |
| Registration fees | | | 26,346 | | | | 13,713 | | | | 11,657 | | |
| Printing | | | 30,589 | | | | 13,870 | | | | 5,724 | | |
| Trustees' fees and expenses | | | 25,876 | | | | 2,001 | | | | 8,588 | | |
| Insurance | | | 6,833 | | | | 2,518 | | | | 159 | | |
| CCO fees and expenses | | | 20,398 | | | | 10,116 | | | | 4,315 | | |
| Organization expenses | | | — | | | | — | | | | 2,216 | | |
| Miscellaneous | | | 2,000 | | | | 1,499 | | | | 3,898 | | |
| Total expenses | | | 2,137,054 | | | | 530,140 | | | | 276,171 | | |
| Interest expense | | | 5,769 | | | | 886 | | | | 67 | | |
| Less: fees (waived and expenses absorbed)/recaptured | | | — | | | | 9,815 | | | | (5,857 | ) | |
| Net expenses | | | 2,142,823 | | | | 540,841 | | | | 270,381 | | |
| Net investment income | | | 729,106 | | | | 88,570 | | | | 12,226 | | |
| Realized and unrealized gain (loss) on investments and foreign currency | |
| Net realized loss on: | |
| Investments | | | (1,871,232 | ) | | | (5,820,540 | ) | | | (42,819 | ) | |
| Foreign currency | | | (17,768 | ) | | | — | | | | (315,628 | ) | |
| | | | (1,889,000 | ) | | | (5,820,540 | ) | | | (358,447 | ) | |
| Net unrealized appreciation (depreciation) on: | |
| Investments | | | (29,179,143 | ) | | | 3,263,403 | | | | (283,477 | ) | |
| Foreign currency | | | (3,738 | ) | | | — | | | | 403,579 | | |
| | | | (29,182,881 | ) | | | 3,263,403 | | | | 120,102 | | |
| Net realized and unrealized loss on investments and foreign currency | | | (31,071,881 | ) | | | (2,557,137 | ) | | | (238,345 | ) | |
| Net decrease in net assets from operations | | $ | (30,342,775 | ) | | $ | (2,468,567 | ) | | $ | (226,119 | ) | |
* Net of foreign tax withheld of $304,980, $27,948, and $0 respectively.
† For the period June 30, 2011 (inception date) to December 31, 2011.
The accompanying notes are an integral part of these financial statements.
59
STATEMENTS OF CHANGES IN NET ASSETS
| | | Alternative Energy Fund | | Asia Focus Fund | | Asia Pacific Dividend Fund | |
| | | Year Ended
December 31, 2011 | | Year Ended
December 31, 2010 | | Year Ended
December 31, 2011 | | Year Ended
December 31, 2010 | | Year Ended
December 31, 2011 | | Year Ended
December 31, 2010 | |
Increase/(decrease) in
net assets from: | |
| Operations | |
| Net investment income (loss) | | $ | 352,418 | | | $ | (399,072 | ) | | $ | 524,580 | | | $ | 473,024 | | | $ | 140,334 | | | $ | 101,192 | | |
| Net realized gain (loss) on: | |
| Investments | | | (12,089,642 | ) | | | (17,739,567 | ) | | | (1,683,154 | ) | | | (3,400,586 | ) | | | (39,788 | ) | | | (1,457,029 | ) | |
| Foreign currency | | | (76,896 | ) | | | (39,532 | ) | | | (12,420 | ) | | | (35,618 | ) | | | (4,518 | ) | | | (5,880 | ) | |
Net change in unrealized
appreciation (depreciation) on: | |
| Investments | | | (2,954,894 | ) | | | 4,996,585 | | | | (12,954,702 | ) | | | 9,033,587 | | | | (941,879 | ) | | | 2,778,592 | | |
| Foreign currency | | | (153 | ) | | | (30,491 | ) | | | (1,322 | ) | | | (529 | ) | | | (672 | ) | | | 472 | | |
Net increase from payments
by affiliates | | | — | | | | — | | | | — | | | | — | | | | — | | | | 3,561 | | |
Net increase (decrease) in
net assets resulting
from operations | | | (14,769,167 | ) | | | (13,212,077 | ) | | | (14,127,018 | ) | | | 6,069,878 | | | | (846,523 | ) | | | 1,420,908 | | |
| Distributions to shareholders | |
| From net investment income | | | (300,549 | ) | | | — | | | | (300,042 | ) | | | (572,788 | ) | | | (133,958 | ) | | | (110,306 | ) | |
Total distributions to
shareholders | | | (300,549 | ) | | | — | | | | (300,042 | ) | | | (572,788 | ) | | | (133,958 | ) | | | (110,306 | ) | |
| Capital transactions | |
| Proceeds from shares sold | | | 8,147,342 | | | | 10,069,297 | | | | 7,257,517 | | | | 12,244,448 | | | | 827,821 | | | | 1,996,305 | | |
| Reinvestment of distributions | | | 284,072 | | | | — | | | | 280,174 | | | | 540,783 | | | | 125,151 | | | | 105,016 | | |
| Cost of shares repurchased | | | (12,006,381 | ) | | | (22,764,225 | ) | | | (11,255,854 | ) | | | (66,850,051 | ) | | | (2,103,513 | ) | | | (8,128,671 | ) | |
| Redemption fee proceeds | | | 2,041 | | | | 1,484 | | | | 3,670 | | | | 105,030 | | | | — | | | | 382 | | |
Net change in net assets from
capital transactions | | | (3,572,926 | ) | | | (12,693,444 | ) | | | (3,714,493 | ) | | | (53,959,790 | ) | | | (1,150,541 | ) | | | (6,026,968 | ) | |
Total increase (decrease) in
net assets | | | (18,642,642 | ) | | | (25,905,521 | ) | | | (18,141,553 | ) | | | (48,462,700 | ) | | | (2,131,022 | ) | | | (4,716,366 | ) | |
| Net assets | |
| Beginning of period | | | 36,203,145 | | | | 62,108,666 | | | | 63,958,589 | | | | 112,421,289 | | | | 6,662,976 | | | | 11,379,342 | | |
| End of period | | $ | 17,560,503 | | | $ | 36,203,145 | | | $ | 45,817,036 | | | $ | 63,958,589 | | | $ | 4,531,954 | | | $ | 6,662,976 | | |
Accumulated net investment
income (loss) | | $ | (66,032 | ) | | $ | (41,005 | ) | | $ | 83,648 | | | $ | (342,428 | ) | | $ | (17,496 | ) | | $ | (19,354 | ) | |
| Capital share activity | |
| Shares sold | | | 1,550,792 | | | | 1,762,736 | | | | 351,785 | | | | 649,753 | | | | 62,558 | | | | 171,120 | | |
| Shares issued on reinvestment | | | 98,636 | | | | — | | | | 17,316 | | | | 25,789 | | | | 10,924 | | | | 8,752 | | |
| Shares redeemed | | | (2,623,104 | ) | | | (4,151,347 | ) | | | (584,513 | ) | | | (4,013,480 | ) | | | (166,844 | ) | | | (714,792 | ) | |
Net increase (decrease) in
shares outstanding | | | (973,676 | ) | | | (2,388,611 | ) | | | (215,412 | ) | | | (3,337,938 | ) | | | (93,362 | ) | | | (534,920 | ) | |
The accompanying notes are an integral part of these financial statements.
60
STATEMENTS OF CHANGES IN NET ASSETS
| | | China & Hong Kong Fund | | Global Energy Fund | | Global Innovators Fund | |
| | | Year Ended
December 31, 2011 | | Year Ended
December 31, 2010 | | Year Ended
December 31, 2011 | | Year Ended
December 31, 2010 | | Year Ended
December 31, 2011 | | Year Ended
December 31, 2010 | |
Increase/(decrease) in
net assets from: | |
| Operations | |
| Net investment income (loss) | | $ | 2,294,652 | | | $ | 1,516,885 | | | $ | 729,106 | | | $ | 436,276 | | | $ | 88,570 | | | $ | (85,738 | ) | |
| Net realized gain (loss) on: | |
| Investments | | | (4,007,524 | ) | | | 17,407,381 | | | | (1,871,232 | ) | | | 186,740 | | | | (5,820,540 | ) | | | 5,222,171 | | |
| Foreign currency | | | (6,210 | ) | | | (4,720 | ) | | | (17,768 | ) | | | (1,507 | ) | | | — | | | | — | | |
Net change in unrealized
appreciation (depreciation) on: | |
| Investments | | | (58,741,199 | ) | | | 14,274,255 | | | | (29,179,143 | ) | | | 13,497,952 | | | | 3,263,403 | | | | 116,014 | | |
| Foreign currency | | | 148 | | | | (34 | ) | | | (3,738 | ) | | | (1,168 | ) | | | — | | | | — | | |
Net increase (decrease) in
net assets resulting
from operations | | | (60,460,133 | ) | | | 33,193,767 | | | | (30,342,775 | ) | | | 14,118,293 | | | | (2,468,567 | ) | | | 5,252,447 | | |
| Distributions to shareholders | |
| From net investment income | | | (1,088,646 | ) | | | (2,299,441 | ) | | | (600,511 | ) | | | (464,191 | ) | | | (78,408 | ) | | | — | | |
| From net realized gain | | | (7,235,100 | ) | | | (8,282,049 | ) | | | — | | | | — | | | | — | | | | — | | |
Total distributions to
shareholders | | | (8,323,746 | ) | | | (10,581,490 | ) | | | (600,511 | ) | | | (464,191 | ) | | | (78,408 | ) | | | — | | |
| Capital transactions | |
| Proceeds from shares sold | | | 23,988,630 | | | | 103,705,262 | | | | 123,498,806 | | | | 73,188,752 | | | | 6,606,455 | | | | 6,300,056 | | |
| Reinvestment of distributions | | | 8,109,546 | | | | 10,337,379 | | | | 581,198 | | | | 442,902 | | | | 76,261 | | | | — | | |
| Cost of shares repurchased | | | (53,159,985 | ) | | | (134,963,967 | ) | | | (68,102,501 | ) | | | (44,649,340 | ) | | | (9,898,210 | ) | | | (10,124,500 | ) | |
| Redemption fee proceeds | | | 3,671 | | | | 150,436 | | | | 56,298 | | | | 29,907 | | | | 2,515 | | | | 1,448 | | |
Net change in net assets from
capital transactions | | | (21,058,138 | ) | | | (20,770,890 | ) | | | 56,033,801 | | | | 29,012,221 | | | | (3,212,979 | ) | | | (3,822,996 | ) | |
Total increase (decrease) in
net assets | | | (89,842,017 | ) | | | 1,841,387 | | | | 25,090,515 | | | | 42,666,323 | | | | (5,759,954 | ) | | | 1,429,451 | | |
| Net assets | |
| Beginning of period | | | 242,801,530 | | | | 240,960,143 | | | | 118,026,212 | | | | 75,359,889 | | | | 38,150,375 | | | | 36,720,924 | | |
| End of period | | $ | 152,959,513 | | | $ | 242,801,530 | | | $ | 143,116,727 | | | $ | 118,026,212 | | | $ | 32,390,421 | | | $ | 38,150,375 | | |
Accumulated net investment
income (loss) | | $ | 959,112 | | | $ | (1,055,078 | ) | | $ | (38,834 | ) | | $ | (149,661 | ) | | $ | (50,573 | ) | | $ | (60,735 | ) | |
| Capital share activity | |
| Shares sold | | | 690,005 | | | | 2,718,470 | | | | 3,939,920 | | | | 2,813,420 | | | | 331,956 | | | | 365,615 | | |
| Shares issued on reinvestment | | | 305,100 | | | | 267,461 | | | | 22,676 | | | | 14,938 | | | | 4,287 | | | | — | | |
| Shares redeemed | | | (1,504,412 | ) | | | (3,581,923 | ) | | | (2,366,541 | ) | | | (1,802,936 | ) | | | (516,774 | ) | | | (618,199 | ) | |
Net increase (decrease) in
shares outstanding | | | (509,307 | ) | | | (595,992 | ) | | | 1,596,055 | | | | 1,025,422 | | | | (180,531 | ) | | | (252,584 | ) | |
The accompanying notes are an integral part of these financial statements.
61
STATEMENTS OF CHANGES IN NET ASSETS
| | | Renminbi Yuan & Bond Fund | |
| | | For the period June 30, 2011+
to December 31, 2011 | |
| Increase/(decrease) in net assets from: | |
| Operations | |
| Net investment income (loss) | | $ | 12,226 | | |
| Net realized gain (loss) on: | |
| Investments | | | (42,819 | ) | |
| Foreign currency | | | (315,628 | ) | |
| Net change in unrealized appreciation (depreciation) on: | |
| Investments | | | (283,477 | ) | |
| Foreign currency | | | 403,579 | | |
| Net increase (decrease) in net assets resulting from operations | | | (226,119 | ) | |
| Distributions to shareholders | |
| From net investment income | | | — | | |
| From net realized gain | | | — | | |
| Total distributions to shareholders | | | — | | |
| Capital transactions | |
| Proceeds from shares sold | | | 96,086,295 | | |
| Reinvestment of distributions | | | — | | |
| Cost of shares repurchased | | | (3,134,355 | ) | |
| Redemption fee proceeds | | | 1,512 | | |
| Net change in net assets from capital transactions | | | 92,953,452 | | |
| Total increase (decrease) in net assets | | | 92,727,333 | | |
| Net assets | |
| Beginning of period | | | — | | |
| End of period | | $ | 92,727,333 | | |
| Accumulated net investment income (loss) | | $ | (83,991 | ) | |
| Capital share activity | |
| Shares sold | | | 7,660,903 | | |
| Shares issued on reinvestment | | | — | | |
| Shares redeemed | | | (251,692 | ) | |
| Net increase (decrease) in shares outstanding | | | 7,409,211 | | |
+ The Fund commenced operations on June 30, 2011.
The accompanying notes are an integral part of these financial statements.
62
FINANCIAL HIGHLIGHTS
For a capital share outstanding throughout the year
| | | Year Ended December 31, | |
| Alternative Energy Fund | | 2011 | | 2010 | | 2009 | | 2008 | | 2007 | |
| Net asset value, beginning of period | | $ | 5.17 | | | $ | 6.62 | | | $ | 5.14 | | | $ | 16.25 | | | $ | 11.47 | | |
| Income from investment operations: | |
| Net investment income (loss) | | | 0.06 | | | | (0.05 | ) | | | (0.05 | ) | | | (0.10 | ) | | | (0.05 | ) | |
| Net realized and unrealized gain (loss) on investments and foreign currency | | | (2.26 | ) | | | (1.40 | ) | | | 1.77 | | | | (10.64 | ) | | | 4.93 | | |
| Total from investment operations | | | (2.20 | ) | | | (1.45 | ) | | | 1.72 | | | | (10.74 | ) | | | 4.88 | | |
| Less distributions: | |
| From net investment income | | | (0.05 | ) | | | — | | | | — | | | | (0.01 | ) | | | — | | |
| From net realized gain | | | — | | | | — | | | | — | | | | (0.37 | ) | | | (0.11 | ) | |
| Return of capital | | | — | | | | — | | | | (0.24 | ) | | | — | | | | — | | |
| Total distributions | | | (0.05 | ) | | | — | | | | (0.24 | ) | | | (0.38 | ) | | | (0.11 | ) | |
| Redemption fee proceeds | | | — | (1) | | | — | (1) | | | — | (1) | | | 0.01 | | | | 0.01 | | |
| Net asset value, end of period | | $ | 2.92 | | | $ | 5.17 | | | $ | 6.62 | | | $ | 5.14 | | | $ | 16.25 | | |
| Total return | | | (42.53 | )% | | | (21.90 | )% | | | 33.42 | % | | | (66.05 | )% | | | 42.68 | % | |
| Ratios/supplemental data: | |
| Net assets, end of period (millions) | | $ | 17.6 | | | $ | 36.2 | | | $ | 62.1 | | | $ | 47.1 | | | $ | 161.7 | | |
| Ratio of expenses to average net assets: | |
| Before fee waived | | | 1.81 | % | | | 1.76 | % | | | 1.85 | % | | | 1.69 | % | | | 1.64 | % | |
| After fees waived | | | 1.81 | % | | | 1.76 | % | | | 1.85 | % | | | 1.69 | % | | | 1.64 | % | |
| After fees waived excluding interest expense(2) | | | 1.79 | % | | | 1.73 | % | | | 1.85 | % | | | 1.67 | % | | | 1.62 | % | |
| Ratio of net investment income (loss) to average net assets: | |
| Before fees waived | | | 1.11 | % | | | (0.86 | )% | | | (0.98 | )% | | | (0.80 | )% | | | (0.90 | )% | |
| After fees waived | | | 1.11 | % | | | (0.86 | )% | | | (0.98 | )% | | | (0.80 | )% | | | (0.90 | )% | |
| Portfolio turnover rate | | | 43.10 | % | | | 24.74 | % | | | 47.10 | % | | | 94.76 | % | | | 47.41 | % | |
(1) Amount represents less than $0.01 per share.
(2) The Advisor has contractually agreed to limit the operating expenses of the Fund to 1.98%, excluding interest expense, expenses related to dividends on short positions, brokerage commissions, taxes and other extraordinary expenses. See Note 3.
The accompanying notes are an integral part of these financial statements.
63
FINANCIAL HIGHLIGHTS
For a capital share outstanding throughout the year
| | | Year Ended December 31, | |
| Asia Focus Fund | | 2011 | | 2010 | | 2009 | | 2008 | | 2007 | |
| Net asset value, beginning of period | | $ | 21.04 | | | $ | 17.63 | | | $ | 9.52 | | | $ | 23.96 | | | $ | 16.60 | | |
| Income from investment operations: | |
| Net investment income | | | 0.18 | | | | 0.12 | | | | 0.06 | (1) | | | 0.55 | | | | 0.27 | | |
| Net realized and unrealized gain (loss) on investments and foreign currency | | | (4.88 | ) | | | 3.45 | | | | 8.13 | | | | (14.30 | ) | | | 7.35 | | |
| Total from investment operations | | | (4.70 | ) | | | 3.57 | | | | 8.19 | | | | (13.75 | ) | | | 7.62 | | |
| Less distributions: | |
| From net investment income | | | (0.11 | ) | | | (0.19 | ) | | | (0.08 | ) | | | (0.69 | ) | | | (0.28 | ) | |
| Total distributions | | | (0.11 | ) | | | (0.19 | ) | | | (0.08 | ) | | | (0.69 | ) | | | (0.28 | ) | |
| Redemption fee proceeds | | | — | (2) | | | 0.03 | | | | — | (2) | | | — | (2) | | | 0.02 | | |
| Net asset value, end of period | | $ | 16.23 | | | $ | 21.04 | | | $ | 17.63 | | | $ | 9.52 | | | $ | 23.96 | | |
| Total return | | | (22.35 | )% | | | 20.43 | % | | | 86.05 | % | | | (57.38 | )% | | | 46.00 | % | |
| Ratios/supplemental data: | |
| Net assets, end of period (millions) | | $ | 45.8 | | | $ | 64.4 | | | $ | 112.4 | | | $ | 21.8 | | | $ | 78.2 | | |
| Ratio of expenses to average net assets: | |
| Before fees waived | | | 1.59 | % | | | 1.67 | % | | | 1.68 | % | | | 1.75 | % | | | 1.69 | % | |
| After fees waived | | | 1.59 | % | | | 1.67 | % | | | 1.68 | % | | | 1.75 | % | | | 1.69 | % | |
| After fees waived excluding interest expense(3) | | | 1.59 | % | | | 1.65 | % | | | 1.68 | % | | | 1.70 | % | | | 1.63 | % | |
| Ratio of net investment income to average net assets: | |
| Before fees waived | | | 0.89 | % | | | 0.77 | % | | | 0.73 | % | | | 2.55 | % | | | 1.34 | % | |
| After fees waived | | | 0.89 | % | | | 0.77 | % | | | 0.73 | % | | | 2.55 | % | | | 1.34 | % | |
| Portfolio turnover rate | | | 7.79 | % | | | 25.44 | % | | | 31.35 | % | | | 28.89 | % | | | 31.17 | % | |
(1) Based on average shares outstanding during the period.
(2) Amount represents less than $0.01 per share.
(3) The Advisor has contractually agreed to limit the operating expenses of the Fund to 1.98%, excluding interest expense, expenses related to dividends on short positions, brokerage commissions, taxes and other extraordinary expenses. See Note 3.
The accompanying notes are an integral part of these financial statements.
64
FINANCIAL HIGHLIGHTS
For a capital share outstanding throughout the year
| | | Year Ended December 31, | |
| Asia Pacific Dividend Fund | | 2011 | | 2010 | | 2009 | | 2008 | | 2007 | |
| Net asset value, beginning of period | | $ | 13.41 | | | $ | 11.03 | | | $ | 7.00 | | | $ | 16.75 | | | $ | 13.56 | | |
| Income from investment operations: | |
| Net investment income | | | 0.30 | | | | 0.17 | | | | 0.18 | (1) | | | 0.75 | | | | 0.24 | | |
| Net realized and unrealized gain (loss) on investments and foreign currency | | | (2.18 | ) | | | 2.41 | | | | 4.32 | | | | (9.22 | ) | | | 3.32 | | |
| Total from investment operations | | | (1.88 | ) | | | 2.58 | | | | 4.50 | | | | (8.47 | ) | | | 3.56 | | |
| Less distributions: | |
| From net investment income | | | (0.30 | ) | | | (0.20 | ) | | | (0.18 | ) | | | (0.51 | ) | | | (0.27 | ) | |
| From net realized gain | | | — | | | | — | | | | — | | | | (0.78 | ) | | | (0.11 | ) | |
| Return of capital | | | — | | | | — | | | | (0.29 | ) | | | — | | | | — | | |
| Total distributions | | | (0.30 | ) | | | (0.20 | ) | | | (0.47 | ) | | | (1.29 | ) | | | (0.38 | ) | |
| Redemption fee proceeds | | | — | | | | — | (2) | | | — | (2) | | | 0.01 | | | | 0.01 | | |
| Net asset value, end of period | | $ | 11.23 | | | $ | 13.41 | | | $ | 11.03 | | | $ | 7.00 | | | $ | 16.75 | | |
| Total return | | | (14.04 | )% | | | 23.65 | % | | | 64.84 | % | | | (51.74 | )% | | | 26.30 | % | |
| Ratios/supplemental data: | |
| Net assets, end of period (millions) | | $ | 4.5 | | | $ | 6.7 | | | $ | 11.4 | | | $ | 5.3 | | | $ | 31.8 | | |
| Ratio of expenses to average net assets: | |
| Before fees waived | | | 3.26 | % | | | 2.92 | % | | | 2.93 | % | | | 2.33 | % | | | 2.09 | % | |
| After fees waived | | | 1.98 | % | | | 2.01 | % | | | 1.98 | % | | | 2.10 | % | | | 1.98 | % | |
| After fees waived excluding interest expense(3) | | | 1.98 | % | | | 1.98 | % | | | 1.98 | % | | | 1.98 | % | | | 1.92 | % | |
| Ratio of net investment income (loss) to average net assets: | |
| Before fees waived | | | 1.13 | % | | | 0.38 | % | | | 1.23 | % | | | 3.71 | % | | | 2.14 | % | |
| After fees waived | | | 2.41 | % | | | 1.29 | % | | | 2.18 | % | | | 3.94 | % | | | 2.25 | % | |
| Portfolio turnover rate | | | 10.67 | % | | | 27.20 | % | | | 26.03 | % | | | 48.02 | % | | | 40.38 | % | |
(1) Based on average shares outstanding during the period.
(2) Amount represents less than $0.01 per share.
(3) The Advisor has contractually agreed to limit the operating expenses of the Fund to 1.98%, excluding interest expense, expenses related to dividends on short positions, brokerage commissions, taxes and other extraordinary expenses. Additionally, the Advisor reimbursed the Fund for interest expense for the year ended December 31, 2011. See Note 3.
The accompanying notes are an integral part of these financial statements.
65
FINANCIAL HIGHLIGHTS
For a capital share outstanding throughout the year
| | | Year Ended December 31, | |
| China & Hong Kong Fund | | 2011 | | 2010 | | 2009 | | 2008 | | 2007 | |
| Net asset value, beginning of period | | $ | 38.76 | | | $ | 35.13 | | | $ | 18.98 | | | $ | 43.02 | | | $ | 26.48 | | |
| Income from investment operations: | |
| Net investment income | | | 0.39 | | | | 0.27 | | | | 0.15 | | | | 0.68 | | | | 0.28 | | |
| Net realized and unrealized gain (loss) on investments and foreign currency | | | (11.06 | ) | | | 5.10 | | | | 17.44 | | | | (24.13 | ) | | | 16.91 | | |
| Total from investment operations | | | (10.67 | ) | | | 5.37 | | | | 17.59 | | | | (23.45 | ) | | | 17.19 | | |
| Less distributions: | |
| From net investment income | | | (0.20 | ) | | | (0.38 | ) | | | (0.34 | ) | | | (0.53 | ) | | | (0.59 | ) | |
| From net realized gain | | | (1.31 | ) | | | (1.38 | ) | | | (1.11 | ) | | | (0.07 | ) | | | (0.10 | ) | |
| Total distributions | | | (1.51 | ) | | | (1.76 | ) | | | (1.45 | ) | | | (0.60 | ) | | | (0.69 | ) | |
| Redemption fee proceeds | | | — | (1) | | | 0.02 | | | | 0.01 | | | | 0.01 | | | | 0.04 | | |
| Net asset value, end of period | | $ | 26.58 | | | $ | 38.76 | | | $ | 35.13 | | | $ | 18.98 | | | $ | 43.02 | | |
| Total return | | | (27.52 | )% | | | 15.38 | % | | | 92.76 | % | | | (54.47 | )% | | | 65.06 | % | |
| Ratios/supplemental data: | |
| Net assets, end of period (millions) | | $ | 153.0 | | | $ | 242.8 | | | $ | 241.0 | | | $ | 123.3 | | | $ | 293.2 | | |
| Ratio of expenses to average net assets: | |
| Before fees waived | | | 1.53 | % | | | 1.48 | % | | | 1.58 | % | | | 1.52 | % | | | 1.44 | % | |
| After fees waived | | | 1.53 | % | | | 1.48 | % | | | 1.58 | % | | | 1.52 | % | | | 1.44 | % | |
| After fees waived excluding interest expense(2) | | | 1.52 | % | | | 1.47 | % | | | 1.58 | % | | | 1.51 | % | | | 1.44 | % | |
| Ratio of net investment income to average net assets | | | 1.14 | % | | | 0.62 | % | | | 0.62 | % | | | 2.22 | % | | | 1.17 | % | |
| Portfolio turnover rate | | | 7.81 | % | | | 32.35 | % | | | 7.87 | % | | | 26.62 | % | | | 10.00 | % | |
(1) Amount represents less than $0.01 per share.
(2) The Advisor has contractually agreed to limit the operating expenses of the Fund to 1.98%, excluding interest expense, expenses related to dividends on short positions, brokerage commissions, taxes and other extraordinary expenses. See Note 3.
The accompanying notes are an integral part of these financial statements.
66
FINANCIAL HIGHLIGHTS
For a capital share outstanding throughout the year
| | | Year Ended December 31, | |
| Global Energy Fund | | 2011 | | 2010 | | 2009 | | 2008 | | 2007 | |
| Net asset value, beginning of period | | $ | 29.74 | | | $ | 25.60 | | | $ | 15.68 | | | $ | 31.86 | | | $ | 25.54 | | |
| Income from investment operations: | |
| Net investment income | | | 0.14 | | | | 0.12 | | | | 0.11 | | | | 0.22 | | | | 0.05 | | |
| Net realized and unrealized gain (loss) on investments and foreign currency | | | (4.06 | ) | | | 4.13 | | | | 9.80 | | | | (15.71 | ) | | | 9.50 | | |
| Total from investment operations | | | (3.92 | ) | | | 4.25 | | | | 9.91 | | | | (15.49 | ) | | | 9.55 | | |
| Less distributions: | |
| From net investment income | | | (0.11 | ) | | | (0.12 | ) | | | — | | | | — | | | | (0.27 | ) | |
| From net realized gain | | | — | | | | — | | | | — | | | | (0.70 | ) | | | (2.96 | ) | |
| Total distributions | | | (0.11 | ) | | | (0.12 | ) | | | — | | | | (0.70 | ) | | | (3.23 | ) | |
| Redemption fee proceeds | | | 0.01 | | | | 0.01 | | | | 0.01 | | | | 0.01 | | | | — | (1) | |
| Net asset value, end of period | | $ | 25.72 | | | $ | 29.74 | | | $ | 25.60 | | | $ | 15.68 | | | $ | 31.86 | | |
| Total return | | | (13.16 | )% | | | 16.63 | % | | | 63.27 | % | | | (48.56 | )% | | | 37.25 | % | |
| Ratios/supplemental data: | |
| Net assets, end of period (millions) | | $ | 143.1 | | | $ | 118.0 | | | $ | 75.4 | | | $ | 30.2 | | | $ | 69.7 | | |
| Ratio of expenses to average net assets: | |
| Before fees waived | | | 1.27 | % | | | 1.25 | % | | | 1.42 | % | | | 1.31 | % | | | 1.37 | % | |
| After fees waived | | | 1.27 | % | | | 1.25 | % | | | 1.42 | % | | | 1.31 | % | | | 1.37 | % | |
| After fees waived excluding interest expense(2) | | | 1.27 | % | | | 1.25 | % | | | 1.42 | % | | | 1.30 | % | | | 1.35 | % | |
| Ratio of net investment income to average net assets | | | 0.43 | % | | | 0.46 | % | | | 0.82 | % | | | 0.76 | % | | | 0.22 | % | |
| Portfolio turnover rate | | | 28.23 | % | | | 42.08 | % | | | 51.74 | % | | | 74.90 | % | | | 31.13 | % | |
(1) Amount represents less than $0.01 per share.
(2) The Advisor has contractually agreed to limit the operating expenses of the Fund to 1.45%, excluding interest expense, expenses related to dividends on short positions, brokerage commissions, taxes and other extraordinary expenses. See Note 3.
The accompanying notes are an integral part of these financial statements.
67
FINANCIAL HIGHLIGHTS
For a capital share outstanding throughout the year
| | | Year Ended December 31, | |
| Global Innovators Fund | | 2011 | | 2010 | | 2009 | | 2008 | | 2007 | |
| Net asset value, beginning of period | | $ | 19.00 | | | $ | 16.24 | | | $ | 11.21 | | | $ | 21.68 | | | $ | 17.98 | | |
| Income from investment operations: | |
| Net investment income (loss) | | | 0.04 | | | | (0.05 | ) | | | (0.01 | ) | | | 0.62 | | | | 0.08 | | |
| Net realized and unrealized gain (loss) on investments | | | (1.28 | ) | | | 2.81 | | | | 5.08 | | | | (10.48 | ) | | | 3.72 | | |
| Total from investment operations | | | (1.24 | ) | | | 2.76 | | | | 5.07 | | | | (9.86 | ) | | | 3.80 | | |
| Less distributions: | |
| From net investment income | | | (0.04 | ) | | | — | | | | — | | | | (0.61 | ) | | | (0.11 | ) | |
| Return of capital | | | — | | | | — | | | | (0.04 | ) | | | — | | | | — | | |
| Total distributions | | | (0.04 | ) | | | — | | | | (0.04 | ) | | | (0.61 | ) | | | (0.11 | ) | |
| Redemption fee proceeds | | | — | (1) | | | — | (1) | | | — | (1) | | | — | (1) | | | 0.01 | | |
| Net asset value, end of period | | $ | 17.72 | | | $ | 19.00 | | | $ | 16.24 | | | $ | 11.21 | | | $ | 21.68 | | |
| Total return | | | (6.51 | )% | | | 17.00 | % | | | 45.20 | % | | | (45.42 | )% | | | 21.17 | % | |
| Ratios/supplemental data: | |
| Net assets, end of period (millions) | | $ | 32.4 | | | $ | 38.2 | | | $ | 36.7 | | | $ | 29.6 | | | $ | 72.8 | | |
| Ratio of expenses to average net assets: | |
| Before fees waived/recaptured | | | 1.42 | % | | | 1.47 | % | | | 1.68 | % | | | 1.40 | % | | | 1.44 | % | |
| After fees waived/recaptured | | | 1.44 | % | | | 1.55 | % | | | 1.56 | % | | | 1.40 | % | | | 1.44 | % | |
| After fees waived/recapture excluding interest expense(2) | | | 1.44 | % | | | 1.55 | % | | | 1.55 | % | | | 1.39 | % | | | 1.43 | % | |
| Ratio of net investment income (loss) to average net assets: | |
| Before fees waived/recaptured | | | 0.26 | % | | | (0.16 | )% | | | (0.20 | )% | | | 3.07 | % | | | 0.49 | % | |
| After fees waived/recaptured | | | 0.24 | % | | | (0.24 | )% | | | (0.07 | )% | | | 3.07 | % | | | 0.49 | % | |
| Portfolio turnover rate | | | 47.40 | % | | | 56.97 | % | | | 50.54 | % | | | 36.49 | % | | | 25.54 | % | |
(1) Amount represents less than $0.01 per share.
(2) The Advisor has contractually agreed to limit the operating expenses of the Fund to 1.55%, excluding interest expense, expenses related to dividends on short positions, brokerage commissions, taxes and other extraordinary expenses. See Note 3.
The accompanying notes are an integral part of these financial statements.
68
FINANCIAL HIGHLIGHTS
For a capital share outstanding throughout the period
| Renminbi Yuan & Bond Fund | | June 30, 2011(1)
Through
December 31, 2011 | |
| Net asset value, beginning of period | | $ | 12.50 | | |
| Income from investment operations: | |
| Net investment income | | | — | (2) | |
| Net realized and unrealized gain (loss) on investments and foreign currency | | | 0.02 | | |
| Total from investment operations | | | 0.02 | | |
| Redemption fee proceeds | | | — | (2) | |
| Net asset value, end of period | | $ | 12.52 | | |
| Total return | | | 0.16 | %(3) | |
| Ratios/supplemental data: | |
| Net assets, end of period (millions) | | $ | 92.7 | | |
| Ratio of expenses to average net assets: | |
| Before fees waived | | | 0.92 | %(4) | |
| After fees waived | | | 0.90 | %(4) | |
| After fees waived excluding interest expense(5) | | | 0.90 | %(4) | |
| Ratio of net investment income to average net assets: | |
| Before fees waived | | | 0.02 | %(4) | |
| After fees waived | | | 0.04 | %(4) | |
| Portfolio turnover rate | | | 28.45 | %(3) | |
(1) Commencement of Operations.
(2) Amount represents less than $0.01 per share.
(3) Not annualized.
(4) Annualized.
(5) The Advisor has contractually agreed to limit the operating expenses of the Fund to 0.90%, excluding interest expense, expenses related to dividends on short positions, brokerage commissions, taxes and other extraordinary expenses. See Note 3.
The accompanying notes are an integral part of these financial statements.
69
NOTES TO FINANCIAL STATEMENTS
Note 1
Organization
Guinness Atkinson Funds (the "Trust"), was organized on April 28, 1997 as a Delaware business trust and registered under the Investment Company Act of 1940, as amended (the "1940 Act"), as a non-diversified, open-end management investment company. Currently, the Trust offers seven separate series: Guinness Atkinson Alternative Energy Fund (the "Alternative Energy Fund"), Guinness Atkinson Asia Focus Fund (the "Asia Focus Fund"), Guinness Atkinson Asia Pacific Dividend Fund (the "Asia Pacific Dividend Fund"), Guinness Atkinson China & Hong Kong Fund (the "China & Hong Kong Fund"), Guinness Atkinson Global Energy Fund (the "Global Energy Fund"), Guinness Atkinson Global Innovators Fund (the "Global Innovators Fund") and Guinness Atkinson Renminbi Yuan & Bond Fund (the "Renminbi Yuan & Bond Fund"), all of which (each a "Fund" and collectively, the "Funds") are covered by this report. The China & Hong Kong Fund began operations on June 30, 1994, the Asia Focus Fund began operations on April 29, 1996, the Global Innovators Fund began operations on December 15, 1998, the Global Energy Fund began operations on June 30, 2004, the Alternative Energy Fund and the Asia Pacific Dividend Fund began operations on March 31, 2006, and the Renminbi Yuan & Bond Fund began operations on June 30, 2011.
The Alternative Energy Fund and Asia Focus Fund's investment objective is long-term capital appreciation. The Asia Pacific Dividend Fund's investment objective is to provide investors with dividend income and long-term capital growth. The China & Hong Kong Fund's investment objective is long-term capital appreciation primarily through investments in securities of China and Hong Kong. The Global Energy Fund and Global Innovators Fund's investment objective is long-term capital appreciation. The Renminbi Yuan & Bond Fund's investment objective is to seek total return. Total return means the combination of capital appreciation and investment income, which includes changes in the value of the Renminbi, the currency of China of which the Yuan is the unit.
Note 2
Significant accounting policies
The following is a summary of significant accounting policies consistently followed by the Funds. These policies are in conformity with accounting principles generally accepted in the United States of America.
A. Security Valuation. Securities of the Funds that are traded on a principal exchange (U.S. or foreign) or NASDAQ are valued at the official closing price on each day that the exchanges are open for trading. Securities traded on an exchange for which there have been no sales, and other over-the-counter securities are valued at the mean between the bid and asked prices. Securities for which quotations are not readily available are valued at their respective fair values as determined in good faith by the Investment Advisor in accordance with procedures established by the Board of Trustees. Debt securities are valued based on available market quotations received from an independent pricing service approved by the Trust's Board of Trustees which may utilize both transaction data and market information such as yield, prices of securities of comparable quality, coupon rate, maturity, type of issue, trading characteristics and other market data. In determining fair value, the Funds take into account all relevant factors and available information. Consequently, the price of the security used to calculate its Net Asset Value may differ from quoted or published prices for the same security. Fair value pricing involves subjective judgments and there is no single standard for determining a security's fair value. As a result, different mutual funds could reasonably arrive at different fair value for the same security. It is possible that the fair value determined for a security is materially different from the value that could be realized upon the sale of that security or from the values that other mutual funds may determine. Short-term investments are stated at cost, combined with accrued interest, which approximates market value. Realized gains and losses from securities transactions are calculated using the identified cost method.
Foreign securities are recorded in the financial statements after translation to U.S. dollars based on the applicable exchange rate at the end of the period. The Funds do not isolate that portion of the results of operations resulting from changes in the currency exchange rate from the fluctuations resulting from changes in the market prices of investments.
Foreign exchange gain or loss resulting from holding of a foreign currency, expiration of a currency exchange contract, difference in exchange rates between the trade date and settlement date of an investment purchased or sold, and the difference between dividends actually received compared to the amount shown in a Fund's accounting records on the date of receipt are shown as net realized gains or losses on foreign currency transactions in the respective Fund's statement of operations.
B. Forward Foreign Currency Exchange Contracts. The Funds may utilize forward foreign currency exchange contracts ("forward contracts") to hedge against foreign exchange fluctuations on foreign denominated investments under which they are
70
obligated to exchange currencies at specific future dates and at specified rates. All commitments are "marked-to-market" daily and any resulting unrealized gains or losses are included as unrealized appreciation (depreciation) on foreign currency denominated assets and liabilities. The Funds record realized gains or losses at the time the forward contract is settled. Risks may arise upon entering these contracts from the potential inability of a counter party to meet the terms of their contracts and from unanticipated movements in the value of a foreign currency relative to the U.S. dollar or other currencies. Counterparties to these contracts are major U.S. financial institutions. Please refer to Note 7 for further information on Forward Contracts in each Fund.
C. Restricted and Illiquid Securities. A restricted security cannot be resold to the general public without prior registration under the Securities Act of 1933. If the security is subsequently registered and resold, the issuers would typically bear the expense of all registrations at no cost to the Fund. Restricted securities are valued according to the guidelines and procedures adopted by the Funds' Board of Trustees. A security may be considered illiquid if it lacks a readily available market. Securities are generally considered liquid if they can be sold or disposed of in the ordinary course of business within seven days at approximately the price at which the security is valued by a fund. Illiquid securities may be valued under methods approved by the Fund's Board of Trustees as reflecting fair value.
D. Security Transactions, Dividend Income and Distributions. Security transactions are accounted for on the trade date. Dividend income and distributions to shareholders are recorded on the ex-dividend date. Realized gains and losses from securities transactions are calculated using the identified cost method.
E. Allocation of Expenses. Each Fund is charged for those expenses directly attributable to it. Expenses that are not directly attributable to a Fund are allocated among the Funds in proportion to their respective assets or another appropriate method.
F. Concentration of Risk. The Alternative Energy Fund invests substantially in the alternative energy or energy technology sectors. The Asia Focus Fund invests substantially all of its assets in the Asian continent. The Asia Pacific Dividend Fund invests primarily in dividend-producing equity securities of Asia Pacific companies. The China & Hong Kong Fund invests substantially all of its assets in securities that are traded in China or Hong Kong or that are issued by companies that do a substantial part of their business in China. The Global Energy Fund invests substantially in energy companies; the changes in the prices and supplies of oil and other energy fuels may affect the Fund's investments. The Renminbi Yuan & Bond Fund invests in securities issued by companies economically tied to China exposes the Fund to greater market risk and potential monetary losses than if the Fund's assets were diversified among other regions. The consequences of political, social, or economic changes in the countries or business sectors in which the securities are offered or the issuers conduct their operations may affect the market prices of the Funds' investments and any income generated, as well as the Funds' ability to repatriate such amounts.
G. Use of Estimates. The preparation of financial statements in conformity with accounting principles generally accepted in the United States requires management to make estimates and assumptions that affect the reported amounts of assets and liabilities and the disclosure of contingent assets and liabilities at the date of the financial statements. Actual results could differ from those estimates.
H. Reclassifications. Accounting principles generally accepted in the United States require that certain components of net assets be reclassified between financial and tax reporting. These reclassifications have no effect on net assets or net asset value per share. For the year ended December 31, 2011, permanent differences in book and tax accounting have been reclassified to paid-in capital, undistributed net investment income/(loss) and accumulated realized gain/(loss) and accumulated realized gain/(loss) as follows:
| | | Increase (Decrease) | |
| | | Paid in Capital | | Undistributed Net
Investment
Income/(Loss) | | Accumulated
Gains or
(Losses) | |
| Alternative Energy Fund | | $ | — | | | $ | (76,896 | ) | | $ | 76,896 | | |
| Asia Focus Fund | | | — | | | | 201,538 | | | | (201,538 | ) | |
| Asia Pacific Dividend Fund | | | — | | | | (4,518 | ) | | | 4,518 | | |
| China & Hong Kong Fund | | | — | | | | 808,184 | | | | (808,184 | ) | |
| Global Energy Fund | | | | | (17,768 | ) | | | 17,768 | | |
| Global Innovators Fund | | | (8,376,172 | ) | | | — | | | | 8,376,172 | | |
| Renminbi Yuan & Bond Fund | | | (262,230 | ) | | | (96,217 | ) | | | 358,447 | | |
71
I. Indemnifications. Under the Trust's organizational documents, its current and former officers and trustees are indemnified against certain liabilities arising out of the performance of their duties to the Funds. In addition, in the normal course of business, the Funds enter into contracts that contain a variety of representations and warranties that provide general indemnifications. The Funds' maximum exposure under these arrangements is unknown as this would involve future claims that may be made against the Funds that have not yet occurred or that would be covered by other parties.
J. Federal Income Taxes. The Funds intend to comply with the requirements of Subchapter M of the Internal Revenue Code applicable to regulated investment companies, and to distribute all of their taxable income to their shareholders. Therefore, no federal income tax provision is required.
The Funds recognize the tax benefits of uncertain tax positions only where the position is "more likely than not" to be sustained assuming examination by tax authorities. Management has analyzed the Funds' tax positions, and has concluded that no liability for unrecognized tax benefits should be recorded related to uncertain tax positions taken on returns filed for open tax years 2008 through 2010,or expected to be taken in the Funds' 2011 tax returns. The Funds identify their major tax jurisdiction as U.S. Federal, California State and foreign jurisdictions where the Funds make significant investments; however the Funds are not aware of any tax positions for which it is reasonably possible that the total amounts of unrecognized tax benefits will change materially in the next twelve months.
Note 3
Investment Advisory and Other Agreements
The Trust, on behalf of each Fund, entered into an Investment Advisory Agreement with Guinness Atkinson Asset Management, Inc. (the "Advisor"), which provides the Funds with investment management services under an investment advisory agreement. The Advisor furnishes all investment advice, office space, facilities, and most of the personnel needed by the Funds. As compensation for its services, the Advisor is entitled to a monthly fee at the following annual rates based upon the average daily net assets of the Funds:
| Alternative Energy Fund | | | 1.00 | % | |
| Asia Focus Fund | | | 1.00 | % | |
| Asia Pacific Dividend Fund | | | 1.00 | % | |
| China & Hong Kong Fund | | | 1.00 | % | |
| Global Energy Fund | | | 0.75 | % | |
| Global Innovators Fund | | 0.75% on the 1st $500 million, 0.60% thereafter | |
| Renminbi Yuan & Bond Fund | | | 0.55 | % | |
The Funds are responsible for their own operating expenses. The Advisor has contractually agreed to limit each Fund's total operating expenses (excluding interest, dividends on short positions, taxes and extraordinary expenses) by reducing all or a portion of its fees and reimbursing the Fund for expenses so that its ratio of expenses to average daily net assets will not exceed the following levels:
| Alternative Energy Fund | | | 1.98 | % | |
| Asia Focus Fund | | | 1.98 | % | |
| Asia Pacific Dividend Fund | | | 1.98 | % | |
| China & Hong Kong Fund | | | 1.98 | % | |
| Global Energy Fund | | | 1.45 | % | |
| Global Innovators Fund | | | 1.55 | % | |
| Renminbi Yuan & Bond Fund | | | 0.90 | % | |
The expense ratios shown in the financial highlights may exceed these levels due to expenses incurred, but not covered by the expense limitation agreement.
72
To the extent that the Advisor waives fees and/or absorbs expenses it may seek repayment of a portion or all of such amounts at any time within three fiscal years after the fiscal year in which such amounts were waived or absorbed, subject to the applicable cap. For the year ended December 31, 2011, the Advisor waived fees and absorbed expenses of $74,834 and $5,857 in the Asia Pacific Dividend Fund and the Renminbi Yuan & Bond Fund, respectively and recaptured previously waived fees of $9,815 from the Global Innovators Fund.
At December 31, 2011, the Advisor may recapture a portion of the following amounts that had been paid and/or waived on behalf of the Funds no later than the dates as stated below:
| Fund | | December 31, 2012 | | December 31, 2013 | | December 31, 2014 | | Total | |
| Asia Pacific Dividend Fund | | $ | 73,950 | | | $ | 71,467 | | | $ | 74,834 | | | $ | 220,251 | | |
| Renminbi Yuan & Bond Fund | | | — | | | | — | | | | 5,857 | | | | 5,857 | | |
Mutual Fund Administration Corporation (the "Administrator") acts as the Funds' administrator under an administration agreement. The fees paid to the Administrator for the year ended December 31, 2011 are reported on the Statements of Operations.
Quasar Distributors, LLC (the "Distributor") acts as the Funds' principal underwriter in a continuous public offering of the Funds' shares.
Foreside Compliance Services, LLC provides Chief Compliance Officer ("CCO") services to the Funds. The fees paid for CCO services for the year ended December 31, 2011 are reported on the Statements of Operations.
On August 14, 1998, the Trust approved a Deferred Compensation Plan for Trustees (the "Plan"). Trustees can elect to receive payment in cash or defer payments provided for in the Plan. If a trustee elects to defer payment, the Plan provides for the creation of a deferred payment account (Phantom Share Account). This account accumulates the deferred fees earned, and the value of the account is adjusted at the end of each quarter to reflect the value that would have been earned if the account had been invested in designated investments. The Funds recognize as trustee expense amounts accrued as meetings are attended plus the change in value of the Phantom Share Account.
The change in the value of the phantom share account during the year ended December 31, 2011 is shown in the table below. These amounts included any additional contributions to the deferred compensation plan and any appreciation (depreciation) on the underlying investments.
| Alternative Energy Fund | | $ | (2,696 | ) | |
| Asia Focus Fund | | $ | (8,811 | ) | |
| Asia Pacific Dividend Fund | | $ | (1,300 | ) | |
| China & Hong Kong Fund | | $ | (16,769 | ) | |
| Global Energy Fund | | $ | (2,005 | ) | |
| Global Innovators Fund | | $ | (10,879 | ) | |
| Renminbi Yuan & Bond Fund | | $ | 579 | | |
The fees paid to non-interested Trustees for the year ended December 31, 2011 are reported on the Statements of Operations.
Certain officers of the Funds are also officers and/or Directors of the Advisor and the Administrator. None of these officers are compensated directly by the Funds.
Note 4
Shareholder Servicing Plan
Each Fund has adopted a Shareholder Servicing Plan to pay a fee at an annual rate of up to 0.25% of its daily average net assets of shares serviced by shareholder servicing agents who provide administrative and support services to their customers.
The fees paid under the Shareholder Servicing Plan for the year ended December 31, 2011 are reported on the Statements of Operations.
73
Note 5
Investment Transactions
The following table presents purchases and sales of securities during the year ended December 31, 2011, excluding short-term investments, to indicate the volume of transactions in each Fund.
| | | Purchases | | Sales | |
| Alternative Energy Fund | | $ | 13,777,512 | | | $ | 17,058,703 | | |
| Asia Focus Fund | | | 4,511,147 | | | | 7,350,907 | | |
| Asia Pacific Dividend Fund | | | 623,713 | | | | 1,629,630 | | |
| China & Hong Kong Fund | | | 15,936,643 | | | | 40,556,634 | | |
| Global Energy Fund | | | 109,995,782 | | | | 47,152,413 | | |
| Global Innovators Fund | | | 17,673,799 | | | | 20,764,356 | | |
| Renminbi Yuan & Bond Fund | | | 61,860,646 | | | | 9,549,077 | | |
The Funds did not purchase U.S. Government securities as a part of the long-term investment strategy during the year ended December 31, 2011.
Note 6
Fair Value Measurements and Disclosures
The Funds utilize various inputs in determining the value of its investments. These inputs are summarized in the three broad levels listed below:
Level 1 — Unadjusted quoted prices in active markets for identical assets or liabilities that a Fund has the ability to access.
Level 2 — Observable inputs other than quoted prices included in level 1 that are observable for the asset or liability, either directly or indirectly. These inputs may include quoted prices for the identical instrument on an inactive market, prices for similar instruments, interest rates, prepayment speeds, credit risk, yield curves, default rates and similar data.
Level 3 — Unobservable inputs for the asset or liability, to the extent relevant observable inputs are not available, representing the Fund's own assumptions about the assumptions a market participant would use in valuing the asset or liability, and would be based on the best information available.
The availability of observable inputs can vary from security to security and is affected by a wide variety of factors, including for example, the type of security, whether the security is new and not yet established in the marketplace, the liquidity of markets, and other characteristics particular to the security. To the extent that valuation is based on models or inputs that are less observable or unobservable in the market, the determination of fair value requires more judgment. Accordingly the degree of judgment exercised in determining fair value is greatest for instruments categorized in Level 3.
The inputs used to measure fair value may fall into different levels of the fair value hierarchy. In such cases, for disclosure purposes, the level in the fair value hierarchy within which the fair value measurement falls in its entirety, is determined based on the lowest level input that is significant to the fair value measurement in its entirety.
74
The inputs or methodology used for valuing securities are not an indication of the risk associated with investing in those securities. The following is a summary of the inputs used, as of December 31, 2011, in valuing the Funds' assets carried at fair value:
| Alternative Energy Fund | |
| Assets Table | | Level 1 | | Level 2 | | Level 3 | | Total | |
| Investments, at Value | |
| Common Stocks: | |
| Energy | | $ | 7,300,006 | | | $ | — | | | $ | — | | | $ | 7,300,006 | | |
| Industrial | | | 7,731,515 | | | | — | | | | — | (a) | | | 7,731,515 | | |
| Utilities | | | 2,320,462 | | | | — | | | | — | | | | 2,320,462 | | |
| Total Investments, at Value | | | 17,351,983 | | | | — | | | | — | | | | 17,351,983 | | |
| Other Financial Instruments* | | | — | | | | — | | | | — | | | | — | | |
| Total Assets | | $ | 17,351,983 | | | $ | — | | | $ | — | (a) | | $ | 17,351,983 | | |
+ Included in the related amounts on the Statements of Operations.
(a) Applied Intellectual Capital Ltd. fair valued at zero.
75
| Asia Focus Fund | |
| Assets Table | | Level 1 | | Level 2 | | Level 3 | | Total | |
| Investments, at Value | |
| Common Stocks: | |
| Basic Materials | | $ | 4,051,350 | | | $ | — | | | $ | — | | | $ | 4,051,350 | | |
| Communications | | | 5,553,436 | | | | — | | | | — | | | | 5,553,436 | | |
| Consumer, Cyclical | | | 5,603,334 | | | | — | | | | — | | | | 5,603,334 | | |
| Consumer, Non-cyclical | | | 723,859 | | | | — | | | | — | | | | 723,859 | | |
| Energy | | | 12,724,583 | | | | — | | | | — | | | | 12,724,583 | | |
| Exchange Traded Funds ("ETFs") | | | 959,620 | | | | — | | | | — | | | | 959,620 | | |
| Financial | | | 2,109,633 | | | | — | | | | — | | | | 2,109,633 | | |
| Industrial | | | 4,692,528 | | | | — | | | | — | | | | 4,692,528 | | |
| Technology | | | 7,662,720 | | | | — | | | | — | | | | 7,662,720 | | |
| Utilities | | | 1,952,952 | | | | — | | | | — | | | | 1,952,952 | | |
| Total Investments, at Value | | | 46,034,015 | | | | — | | | | — | | | | 46,034,015 | | |
| Other Financial Instruments* | | | — | | | | — | | | | — | | | | — | | |
| Total Assets | | $ | 46,034,015 | | | $ | | | | $ | — | | | $ | 46,034,015 | | |
| Asia Pacific Dividend Fund | |
| Assets Table | | Level 1 | | Level 2 | | Level 3 | | Total | |
| Investments, at Value | |
| Common Stocks: | |
| Basic Materials | | $ | 531,798 | | | $ | — | | | $ | — | | | $ | 531,798 | | |
| Communications | | | 822,181 | | | | — | | | | — | | | | 822,181 | | |
| Consumer, Cyclical | | | 252,541 | | | | — | | | | — | | | | 252,541 | | |
| Consumer, Non-cyclical | | | 354,345 | | | | — | | | | — | | | | 354,345 | | |
| Energy | | | 708,392 | | | | — | | | | — | | | | 708,392 | | |
| Financial | | | 658,530 | | | | — | | | | — | | | | 658,530 | | |
| Industrial | | | 205,314 | | | | — | | | | — | | | | 205,314 | | |
| Technology | | | 605,171 | | | | — | | | | — | | | | 605,171 | | |
| Utilities | | | 422,827 | | | | — | | | | — | | | | 422,827 | | |
| Total Investments, at Value | | | 4,561,099 | | | | — | | | | — | | | | 4,561,099 | | |
| Other Financial Instruments* | | | — | | | | — | | | | — | | | | — | | |
| Total Assets | | $ | 4,561,099 | | | $ | — | | | $ | — | | | $ | 4,561,099 | | |
76
| China & Hong Kong Fund | |
| Assets Table | | Level 1 | | Level 2 | | Level 3 | | Total | |
| Investments, at Value | |
| Common Stocks: | |
| Basic Materials | | $ | 8,009,780 | | | $ | — | | | $ | — | | | $ | 8,009,780 | | |
| Communications | | | 23,265,234 | | | | — | | | | — | | | | 23,265,234 | | |
| Consumer, Cyclical | | | 27,557,174 | | | | — | | | | — | | | | 27,557,174 | | |
| Consumer, Non-cyclical | | | 2,087,956 | | | | — | | | | — | | | | 2,087,956 | | |
| Energy | | | 34,015,706 | | | | — | | | | — | | | | 34,015,706 | | |
| Exchange Traded Funds ("ETFs") | | | 4,715,692 | | | | — | | | | — | | | | 4,715,692 | | |
| Financial | | | 31,279,821 | | | | — | | | | — | | | | 31,279,821 | | |
| Industrial | | | 12,883,192 | | | | — | | | | — | | | | 12,883,192 | | |
| Technology | | | 5,294,317 | | | | — | | | | — | | | | 5,294,317 | | |
| Utilities | | | 5,964,051 | | | | — | | | | — | | | | 5,964,051 | | |
| Total Investments, at Value | | | 155,072,923 | | | | — | | | | — | | | | 155,072,923 | | |
| Other Financial Instruments* | | | — | | | | — | | | | — | | | | — | | |
| Total Assets | | $ | 155,072,923 | | | $ | — | | | $ | — | | | $ | 155,072,923 | | |
| Global Energy Fund | |
| Assets Table | | Level 1 | | Level 2 | | Level 3 | | Total | |
| Investments, at Value | |
| Common Stocks: | |
| Energy | | $ | 145,471,512 | | | $ | — | | | $ | — | | | $ | 145,471,512 | | |
| Industrial | | | 54,887 | | | | — | | | | — | | | | 54,887 | | |
| Total Investments, at Value | | | 145,526,399 | | | | — | | | | — | | | | 145,526,399 | | |
| Other Financial Instruments* | | | — | | | | — | | | | — | | | | — | | |
| Total Assets | | $ | 145,526,399 | | | $ | — | | | $ | — | | | $ | 145,526,399 | | |
77
| Global Innovators Fund | |
| Assets Table | | Level 1 | | Level 2 | | Level 3 | | Total | |
| Investments, at Value | |
| Common Stocks: | |
| Communications | | $ | 7,113,995 | | | $ | — | | | $ | — | | | $ | 7,113,995 | | |
| Consumer, Cyclical | | | 2,363,355 | | | | — | | | | — | | | | 2,363,355 | | |
| Consumer, Non-cyclical | | | 1,262,691 | | | | — | | | | — | | | | 1,262,691 | | |
| Energy | | | 1,208,687 | | | | — | | | | — | | | | 1,208,687 | | |
| Financial | | | 4,667,623 | | | | — | | | | — | | | | 4,667,623 | | |
| Industrial | | | 3,572,945 | | | | — | | | | — | | | | 3,572,945 | | |
| Technology | | | 11,652,378 | | | | — | | | | — | | | | 11,652,378 | | |
| Total Investments, at Value | | | 31,841,674 | | | | — | | | | — | | | | 31,841,674 | | |
| Other Financial Instruments* | | | — | | | | — | | | | — | | | | — | | |
| Total Assets | | $ | 31,841,674 | | | $ | — | | | $ | — | | | $ | 31,841,674 | | |
| Renminbi Yuan & Bond Fund | |
| Assets Table | | Level 1 | | Level 2 | | Level 3 | | Total | |
| Cash | | $ | 39,104,769 | | | $ | — | | | $ | — | | | $ | 39,104,769 | | |
| Investments, at Value | |
| Corporate Bonds | | $ | — | | | $ | 51,985,401 | | | $ | — | | | $ | 51,985,401 | | |
| Total Investments, at Value | | | — | | | | — | | | | — | | | | — | | |
| Other Financial Instruments* | | | — | | | | — | | | | — | | | | — | | |
| Total Assets | | $ | 39,104,769 | | | $ | 51,985,401 | | | $ | — | | | $ | 91,090,170 | | |
* Other financial instruments are derivative instruments not reflected in the Schedule of Investments, such as futures, forwards, and swaps contracts. Futures, forwards, and swap contracts are valued at the unrealized appreciation (depreciation) on the instrument.
All common stocks held in the Fund are Level 1 securities. In accordance with procedures established by, and under the general supervision of, the Fund's Board of Trustees, the values of certain equity securities listed or traded on foreign security exchanges may be adjusted due to a significant change in the value of the U.S.-traded securities, as measured by the S&P 500 Index.
There were no significant transfers between levels 1 and 2 during the period.
Note 7
Derivatives and Hedging Transactions
FASB Accounting Standards Codification 815, Derivatives and Hedging requires enhanced disclosures about the Funds' derivative and hedging activities, including how such activities are accounted for and their effects on the Funds' financial position, performance and cash flows.
Forward Foreign Currency Contracts
In order to hedge their portfolio and to protect them against possible fluctuations in foreign exchange rates pending the settlement of securities transactions, the Funds may enter into forward currency contracts which obligate them to exchange currencies at specified future dates. At the maturity of a forward contract, the Funds may either make delivery of the foreign currency from currency held, if any, or from the proceeds of the portfolio securities sold. It may also terminate its obligation to deliver the foreign currency at any time by purchasing an offsetting contract. The forward value of amounts due are netted against the forward value of the currency to be delivered, and the net amount is shown as a receivable or payable in the financial statements. The Funds did not enter into forward currency contracts during the year ended December 31, 2011 and did not have any outstanding forward contracts as of December 31, 2011.
78
Note 8
Tax Matters
As of December 31, 2011, the tax basis of investments were as follows:
| | Alternative
Energy Fund | | Asia Focus
Fund | | Asia Pacific
Dividend
Fund | | China &
Hong Kong
Fund | | Global
Energy
Fund | | Global
Innovators
Fund | | Renminbi
Yuan & Bond
Fund | |
| Cost of investments for tax purposes | | $ | 33,674,278 | | | $ | 40,369,746 | | | $ | 4,314,088 | | | $ | 128,019,692 | | | $ | 158,035,867 | | | $ | 38,453,704 | | | $ | 52,268,878 | | |
| Gross tax unrealized appreciation | | | 472,356 | | | | 10,998,304 | | | | 637,704 | | | | 48,639,822 | | | | 11,636,406 | | | | 1,225,718 | | | | 389,920 | | |
| Gross tax unrealized (depreciation) | | | (16,794,651 | ) | | | (5,334,035 | ) | | | (390,693 | ) | | | (21,586,591 | ) | | | (24,145,874 | ) | | | (7,837,748 | ) | | | (673,397 | ) | |
Net tax unrealized appreciation
(depreciation) on investments | | | (16,322,295 | ) | | | 5,664,269 | | | | 247,011 | | | | 27,053,231 | | | | (12,509,468 | ) | | | (6,612,030 | ) | | | (283,477 | ) | |
Net tax appreciation (depreciation) on
foreign-currency denominated assets
and liabilities | | | (14,790 | ) | | | (4,206 | ) | | | 31 | | | | 80 | | | | (4,477 | ) | | | — | | | | 403,579 | | |
Net tax unrealized appreciation
(depreciation)* | | | (16,337,085 | ) | | | 5,660,063 | | | | 247,042 | | | | 27,053,311 | | | | (12,513,945 | ) | | | (6,612,030 | ) | | | 120,102 | | |
| Undistributed net ordinary income** | | | 32,330 | | | | 132,660 | | | | 1,942 | | | | 1,044,094 | | | | 807,117 | | | | 2,239 | | | | — | | |
| Undistributed Long-Term Capital Gains | | | — | | | | — | | | | — | | | | — | | | | — | | | | — | | | | — | | |
| Post October loss*** | | | (7,605,515 | ) | | | (7,177 | ) | | | (1,240 | ) | | | (585 | ) | | | (1,050,527 | ) | | | — | | | | (81,891 | ) | |
| Capital loss carryforward | | | (75,303,784 | ) | | | (5,350,184 | ) | | | (4,257,328 | ) | | | (4,822,267 | ) | | | (1,542,372 | ) | | | (11,264,214 | ) | | | — | | |
| Other accumulated gain/(loss) | | | (26,073 | ) | | | (41,835 | ) | | | (18,198 | ) | | | (84,397 | ) | | | (29,414 | ) | | | (52,812 | ) | | | (2,100 | ) | |
| Total accumulated gain/(loss) | | | (99,240,127 | ) | | | 393,527 | | | | (4,027,782 | ) | | | 23,190,156 | | | | (14,329,141 | ) | | | (17,926,817 | ) | | | 36,111 | | |
* The differences between book-basis and tax-basis unrealized appreciation/(depreciation) is attributable primary to the tax deferral of losses on wash sales and passive foreign investment company (PFIC) mark to market adjustments.
** The differences between book-basis and tax basis undistributed net ordinary income is attributed to deferred compensation.
*** Under the current tax law, capital and currency losses realized after October 31 and prior to the Fund's fiscal year end may be deferred as occurring on the first day of the following year.
As of December 31, 2011, the Funds have the following capital loss carryforwards available to offset future realized capital gains:
| Capital losses expiring in: | | Alternative
Energy Fund | | Asia Focus
Fund | | Asia Pacific
Dividend
Fund | | China &
Hong Kong
Fund | | Global
Energy
Fund | | Global
Innovators
Fund | | Renminbi
Yuan & Bond
Fund | |
| 2012 | | $ | — | | | $ | — | | | $ | — | | | $ | — | | | $ | — | | | $ | 4,814,343 | | | $ | — | | |
| 2013 | | | — | | | | — | | | | — | | | | — | | | | — | | | | — | | | | — | | |
| 2014 | | | — | | | | — | | | | — | | | | — | | | | — | | | | — | | | | — | | |
| 2015 | | | — | | | | — | | | | — | | | | — | | | | — | | | | — | | | | — | | |
| 2016 | | | 10,370,865 | | | | — | | | | 1,321,324 | | | | — | | | | — | | | | — | | | | — | | |
| 2017 | | | 40,204,652 | | | | — | | | | 1,115,940 | | | | — | | | | 964,672 | | | | — | | | | — | | |
| 2018 | | | 9,296,377 | | | | 3,440,534 | | | | 1,502,925 | | | | — | | | | — | | | | — | | | | — | | |
| No Expiration Long-term | | | 15,431,890 | | | | 1,152,403 | | | | 264,500 | | | | 1,478,612 | | | | 577,700 | | | | 6,449,871 | | | | — | | |
| No Expiration Short-term | | | — | | | | 757,247 | | | | 52,639 | | | | 3,343,655 | | | | — | | | | — | | | | — | | |
| Total | | $ | 75,303,784 | | | $ | 5,350,184 | | | $ | 4,257,328 | | | $ | 4,822,267 | | | $ | 1,542,372 | | | $ | 11,264,214 | | | $ | — | | |
79
Global Innovators Fund had $8,376,172 of capital loss carryforwards which expired on December 31, 2011.
Under the recently enacted Regulated Investment Company Modernization Act of 2010 (the "Act"), the Funds will be permitted to carryforward capital losses incurred in taxable years beginning after December 22, 2010, for an unlimited period. However, any losses incurred during those future taxable years will be required to be utilized prior to the losses incurred in pre-enactment taxable years. As a result of this ordering rule, pre-enactment capital loss carryforwards may be more likely to expire unused. Additionally, post-enactment capital losses that are carried forward will retain their character as either short-term or long-term capital losses rather than being considered all short-term as under previous law.
The tax character of distributions (other than return of capital dividends) paid during 2011 and 2010 fiscal years are as follows:
| | | 2011 | | 2010 | |
| | | Ordinary
Income | | Long-term
Capital Gain | | Ordinary
Income | | Long-term
Capital Gain | |
| Alternative Energy Fund | | $ | 300,549 | | | $ | — | | | $ | — | | | $ | — | | |
| Asia Focus Fund | | | 300,042 | | | | — | | | | 572,788 | | | | — | | |
| Asia Pacific Dividend Fund | | | 133,958 | | | | — | | | | 110,306 | | | | — | | |
| China & Hong Kong Fund | | | 3,300,031 | | | | 5,023,715 | | | | 2,299,441 | | | | 8,282,049 | | |
| Global Energy Fund | | | 600,511 | | | | — | | | | 464,191 | | | | — | | |
| Global Innovators Fund | | | 78,408 | | | | | | | | |
| Renminbi Yuan & Bond Fund | | | — | | | | — | | | | — | | | | — | | |
Note 9
Improving Disclosures about Fair Value Measurements
In May 2011, the FASB issued ASU No. 2011-04 "Amendments to Achieve Common Fair Value Measurement and Disclosure Requirements" in GAAP and the International Financial Reporting Standards (IFRSs). ASU No. 2011-04 amends FASB ASC Topic 820, Fair Value Measurement and Disclosures, to establish common requirements for measuring fair value and for disclosing information about fair value measurements in accordance with GAAP and IFRSs. ASU No. 2011-04 is effective for fiscal years beginning after December 15, 2011 and for interim periods within those fiscal years. Management is currently evaluating the impact these amendments may have on the Fund's financial statements.
In December 2011, FASB issued ASU No. 2011-11 related to disclosure about offsetting assets and liabilities. The amendments in this ASU require an entity to disclose information about offsetting and related arrangements to enable users of its financial statements to understand the effect of those arrangements on its financial position. The ASU is effective for annual reporting periods beginning on or after January 1, 2013, and interim periods within those annual periods. The guidance requires retrospective application for all comparative periods presented. Management is currently evaluating the impact ASU 2011-11 will have on the financial statement disclosures.
Note 10
Events Subsequent to the Fiscal Period End
The Funds have adopted financial reporting rules regarding subsequent events which requires an entity to recognize in the financial statements the effects of all subsequent events that provide additional evidence about conditions that existed at the date of the balance sheet. Management has evaluated the Funds' related events and transactions and has determined that there were no events or transactions that occurred that would materially impact the amounts or disclosures in the Funds' financial statements.
80
Additional Information (Unaudited)
Proxy Voting Procedures
The Advisor of the Funds votes proxies relating to portfolio securities in accordance with procedures that have been approved by the Board. You may obtain a description of these procedures, free of charge, by calling "toll-free" 1-800-915-6565. This information is also available through the Securities and Exchange Commission's website at http://www.sec.gov.
Proxy Voting Records
Information regarding how the advisor of the Funds voted proxies relating to portfolio securities during the latest 12-month period ended June 30 is available, without charge, by calling toll-free, 1-800-915-6565. This information is also available through the Securities and Exchange Commission's website at http://www.sec.gov.
Form N-Q Disclosure
The Funds file their complete schedule of portfolio holdings with the Securities and Exchange Commission for the first and third quarters of each fiscal year on Form N-Q. The Funds' Form N-Q is available on the Securities and Exchange Commission's website at http://www.sec.gov. The Funds' Form N-Q may be reviewed and copied at the Commission's Public Reference Room in Washington, DC, and information on the operation of the Public Reference Room may be obtained by calling 1-800-SEC-0330. This information is also available, without charge, by calling toll-free, 1-800-915-6565.
Board Consideration of the Trust's Investment Advisory Agreement
In conjunction with the launch of a new series, the Guinness Atkinson Renminbi Yuan & Bond Fund (the "Fund"), the Board of Trustees (the "Trustees" or the "Board") of Guinness Atkinson Funds (the "Trust"), including the trustees who are not "interested persons" of the Trust (the "Independent Trustees") as defined in the Investment Company Act of 1940, as amended (the "1940 Act"), reviewed and unanimously approved an Investment Advisory Agreement (the "Agreement") between the Trust and Guinness Atkinson Asset Management, Inc. (the "Advisor") with respect to the Fund at an in-person meeting held on May 9, 2011. The Fund commenced operations on June 30, 2011.
The discussion regarding the basis of the Board's approval and renewal of the Agreement with respect to the other series of the Trust, the Guinness Atkinson Alternative Energy Fund, the Guinness Atkinson Asia Focus Fund, the Guinness Atkinson Asia Pacific Dividend Fund, the Guinness Atkinson China & Hong Kong Fund, the Guinness Atkinson Global Energy Fund, and the Guinness Atkinson Global Innovators Fund is available in the Trust's Semi-Annual Report dated June 30, 2011.
Background. At the meeting, the Trustees discussed with counsel to the Trust and independent legal counsel to the Independent Trustees their fiduciary duties under the 1940 Act in reviewing the Agreement and their obligation to obtain and review information relevant and necessary to their consideration of the Agreement. The Trustees received a memorandum summarizing the duties of the Trustees under, and the fiduciary standards established by, the 1940 Act and state law, legislative and regulatory guidance, and judicial precedent with respect to evaluating the reasonableness of fees and interpretation of the applicable fiduciary standards. In their deliberations, the Trustees considered the factors summarized below, and in approving the Agreement with respect to the Fund, the Trustees did not identify any single factor, or information provided with respect to any single factor, as controlling.
Nature, Extent and of Quality of Services. The Trustees considered information about the nature, extent and quality of the services provided by the Advisor to the other series of the Trust, including the background and experience of the Advisor's senior management's extensive experience and knowledge of investing in the China region.
Advisory Fee and Expense Ratio. The Trustees reviewed the fee and expense information of the Fund compiled from Morningstar, Inc. data and considered the following factors: (1) the Fund's proposed maximum 0.75% advisory fee was slightly above the median fees but within the range of fees charged to comparable mutual funds in the Morningstar "Emerging Market Bond" category; (2) the Fund's proposed maximum 1.00% total expenses were the same as the average and median expenses of its peers; and (3) the Advisor agreed to limit the Fund's expense ratio for an initial two-year term through June 30, 2013. The Board also noted the Advisor's representation that the final advisory fee and expense cap could be lower than the proposed maximum fee and expenses. The Advisor thereafter lowered the advisory fee to 0.55% and agreed to limit the Fund's total annual operating expenses to 0.90% of the Fund's average daily net assets through June 30, 2013. The Board noted that the Advisor had not previously managed a China fixed-income fund and therefore had not provided any comparable historical performance. The Board determined that the projected fees and expenses for the Fund were reasonable in light of the nature, extent and quality of the services to be provided by the Advisor.
81
Costs of Services and Profitability. The Trustees considered the financial information provided by the Advisor for the other series of the Trust, including the Advisor's profitability in general and the firm's retention of key personnel. The Trustees also noted the expected small asset size of the Fund during the early periods in their consideration of the expected profitability of the Fund to the Advisor.
Economies of Scale. The Trustees considered whether the Fund would realize any economies of scale. They noted that in the Fund's startup period, its asset levels would likely be too low to achieve significant economies of scale and that the matter of such economies would be reviewed in the future as the Fund's assets grow.
Conclusion. After considering the factors described above, the Board and the Independent Trustees separately determined that the overall fee arrangement between the Fund and the Advisor was fair and reasonable and the Agreement was in the best interests of the Fund and its shareholders and accordingly, approved the Agreement for an initial two-year term.
Supplemental Tax Information
For the fiscal year ended December 31, 2011, certain dividends paid by the Funds may be subject to a maximum tax rate of 15%, as provided for by the Jobs and Growth Tax Relief Reconciliation Act of 2003. The percentage of dividends declared from ordinary income designated as qualified dividend income was as follows:
| Alternative Energy Fund | | | 100.00 | % | |
| Asia Focus Fund | | | 100.00 | % | |
| Asia Pacific Dividend Fund | | | 53.09 | % | |
| China & Hong Kong Fund | | | 63.01 | % | |
| Global Energy Fund | | | 100.00 | % | |
| Global Innovators Fund | | | 100.00 | % | |
| Renminbi Yuan & Bond Fund | | | N/A | | |
The China & Hong Kong Fund designates $5,023,715 as long-term capital gains distributions for the year ended December 31, 2011.
Pursuant to Section 853 of the Internal Revenue Code of 1986, as amended, the Funds designate the following income earned from foreign sources and foreign taxes paid for the year ended December 31, 2011:
| | | Foreign Sourced Income | | Foreign Taxes Paid | |
| | | Total
Amount | | Per Share
Amount | | Total
Amount | | Per Share
Amount | |
| Alternative Energy Fund | | $ | 950,210 | | | $ | 0.16 | | | $ | 36,586 | | | $ | 0.01 | | |
| Asia Focus Fund | | | 1,642,864 | | | | 0.58 | | | | 183,760 | | | | 0.06 | | |
| Asia Pacific Dividend Fund | | | 283,314 | | | | 0.70 | | | | 27,562 | | | | 0.07 | | |
| China & Hong Kong Fund | | | 5,627,543 | | | | 0.98 | | | | 241,950 | | | | 0.04 | | |
| Global Energy Fund | | | N/A | | | | N/A | | | | N/A | | | | N/A | | |
| Global Innovators Fund | | | N/A | | | | N/A | | | | N/A | | | | N/A | | |
| Renminbi Yuan & Bond Fund | | | N/A | | | | N/A | | | | N/A | | | | N/A | | |
82
REPORT OF INDEPENDENT REGISTERED
PUBLIC ACCOUNTING FIRM
To the Shareholders and Board of Trustees
Guinness Atkinson Funds
Woodland Hills, California
We have audited the accompanying statements of assets and liabilities, including the schedules of investments, of the Alternative Energy Fund, Asia Focus Fund, Asia Pacific Dividend Fund, China & Hong Kong Fund, Global Energy Fund, Global Innovators Fund and Renminbi Yuan & Bond Fund (the "Funds"), each a series of shares of the Guinness Atkinson Funds, as of December 31, 2011, the related statements of operations for the year then ended, the statements of changes in net assets for each of the two years in the period then ended, and the financial highlights for each of the five years in the period then ended, except for Renminbi Yuan & Bond Fund the related statement of operations, the statement of changes in net assets and the financial highlights for the period June 30, 2011 (commencement of operations) to December 31, 2011. These financial statements and financial highlights are the responsibility of the Funds' management. Our responsibility is to express an opinion on these financial statements and financial highlights based on our audits.
We conducted our audits in accordance with the standards of the Public Company Accounting Oversight Board (United States). Those standards require that we plan and perform the audits to obtain reasonable assurance about whether the financial statements and financial highlights are free of material misstatement. The Funds are not required to have, nor were we engaged to perform, an audit of their internal control over financial reporting. Our audits included consideration of internal control over financial reporting as a basis for designing audit procedures that are appropriate in the circumstances, but not for the purpose of expressing an opinion on the effectiveness of the Funds' internal control over financial reporting. Accordingly, we express no such opinion. An audit includes examining, on a test basis, evidence supporting the amounts and disclosures in the financial statements. Our procedures included confirmation of securities owned as of December 31, 2011, by correspondence with the custodian and brokers or by other appropriate auditing procedures where replies from brokers were not received. An audit also includes assessing the accounting principles used and significant estimates made by management, as well as evaluating the overall financial statement presentation. We believe that our audits provide a reasonable basis for our opinion.
In our opinion, the financial statements and financial highlights referred to above present fairly in all material respects, the financial position of the above mentioned Funds as of December 31, 2011, the results of their operations, the changes in their net assets and the financial highlights for the periods indicated above, in conformity with accounting principles generally accepted in the United States of America.
TAIT, WELLER & BAKER LLP
Philadelphia, Pennsylvania
February 27, 2012
83
TRUSTEE AND OFFICER INFORMATION (Unaudited)
Unless otherwise noted, each Trustee and officer's address is 21550 Oxnard Street, Suite 850, Woodland Hills, California 91367. Trustees and officers of the Trust serve until their resignation, removal or retirement. Additional information about the Trustees is included in the Funds' Statement of Additional Information which is available, without charge, upon request by calling toll-free, 1-800-915-6565 or by visiting the Funds' website at www.gafunds.com.
| Name and Age | | Position(s)
Held with
Trust† | | Year Elected | | Principal Occupation(s) During the
Past 5 Years | | Number of
Portfolios In
Fund Complex
Overseen by
Trustee | | Other Directorships
Held by Trustee
During the Past 5 Years | |
| Non-Interested Trustees | |
|
Dr. Gunter Dufey
(71) | | Trustee | | | 1994 | | | Pacific International Business Associates, a consulting firm in Singapore since 2002. Professor (em.) of Ross School at The University of Michigan, where he served from 1968-2002. | | | 7 | | | Independent director, various subsidiaries of Ally Financial Inc. (formerly GMAC) in the United States and Canada. | |
|
James I. Fordwood
(65) | | Trustee | | | 1994 | | | CFO and Managing Member of Prima Marketing LLC (network of 7-Eleven convenience stores) | | | 7 | | | J.L. Energy, Inc., IDEA2, LLC. | |
|
Dr. Bret A. Herscher
(53) | | Trustee | | | 1994 | | | President of Pacific Consultants, a technical and technology management consulting company serving the Electronic industry and venture capital community that he co-founded. | | | 7 | | | Strawberry Tree Inc. | |
|
J. Brooks Reece, Jr.
(64) | | Trustee and Chairman | | | 1994 | | | Vice President of Adcole Corp. a manufacturer of precision measuring machines and sun angle sensors for space satellites. | | | 7 | | | Adcole Far East Ltd. Adcole Corporation since 2010. | |
|
| Interested Trustee | |
|
Timothy W.N. Guinness*
14 Queen Anne's Gate
London, England
SW1H 9AA
U.K.
(64) | | Trustee | | | 1998 | | | Chairman of Guinness Asset Management Ltd., investment adviser in London, since 2003. Chairman/CIO of Guinness Atkinson, since November 2002. | | | 7 | | | Investec Global Strategy Fund Limited, Investec International Accumulation Fund Limited, Investec Select Funds Plc, Investec High Income Trust Plc, SR Europe Investment Trust Plc. Atlantis Japan Growth Fund Ltd., Brompton Bicycle Ltd., New Boathouse Capital Ltd., Guinness Asset Management Ltd. | |
|
* "Interested person" (as defined in the 1940 Act) of the Funds because of his affiliation with the Funds' Advisor, Guinness Atkinson Asset Management, Inc.
84
| Name and Age | | Position(s)
Held with
Trust† | | Year Elected | | Principal Occupation(s) During the
Past 5 Years | | Number of
Portfolios In
Fund Complex
Overseen by
Trustee | | Other Directorships
Held by Trustee
During the Past 5 Years | |
| Officers | |
|
James Atkinson
(54) | | President | | | 2003 | | | Chief Executive Officer and Director of Guinness Atkinson since November 2002. Principal of Orbis Marketing, a mutual fund marketing and advertising firm since November 2001. | | N/A | | N/A | |
|
Richard F. Cook, Jr.
(60) | | Chief Compliance Officer | | | 2005 | | | Officer of Foreside Fund Services, LLC since November 2005, and Director of Foreside Compliance Services LLC, since January 2006. From 2002, Founder and Managing Member of NorthLake, LLC. From 1985 to 2002, Executive Officer, Director and Shareholder of Century Capital Management, Inc. and Secretary of Century Shares Trust. | | N/A | | N/A | |
|
Rita Dam
(45) | | Treasurer | | | 2009 | | | Vice President, Mutual Fund Administration Corp. | | N/A | | N/A | |
|
Joy Ausili
(45) | | Secretary and Assistant Treasurer | | | 2009 | | | Vice President, Mutual Fund Administration Corp. | | N/A | | N/A | |
|
Sardjono Kadiman
(36) | | Assistant Treasurer | | | 2009 | | | Assistant Vice President, Mutual Fund Administration Corp. (2008 – present); Compliance Officer, U.S. Bancorp Fund Services, LLC, a mutual and hedge fund service provider (2001 – 2008). | | N/A | | N/A | |
|
Lyna Phan
(36) | | Assistant Treasurer | | | 2011 | | | Assistant Vice President, Mutual Fund Administration Corp. (2010 – present); Compliance Officer, U.S. Bancorp Fund Services, LLC, a mutual and hedge fund service provider (2005 – 2010). | | N/A | | N/A | |
|
85
Privacy Notice
Guinness Atkinson Funds and Guinness Atkinson Asset Management, Inc. may collect non-public information about you from the following sources:
• Information we receive about you on applications or other forms;
• Information you give us orally; and
• Information about your transactions with us.
We do not disclose any non-public personal information about our shareholders or former shareholders without the shareholder's authorization, except as required by law or in response to inquiries from governmental authorities. We restrict access to your personal and account information to those employees who need to know that information to provide products and services to you. We also may disclose that information to unaffiliated third parties (such as to brokers or custodians) only as permitted by law and only as needed for us to provide agreed services to you. We maintain physical, electronic and procedural safeguards to guard your non-public personal information.
86
Guinness Atkinson Funds Information
Board of Trustees
| J. Brooks Reece, Jr., Chairman | |
|
| Dr. Gunter Dufey | |
|
| James I. Fordwood | |
|
| Timothy W.N. Guinness | |
|
| Dr. Bret A. Herscher | |
|
Contact Guinness Atkinson Funds
| P.O. Box 701 | |
|
| Milwaukee, WI 53201-0701 | |
|
| Shareholder Services: 800-915-6566 | |
|
| Literature Request: 800-915-6565 | |
|
| Website: www.gafunds.com | |
|
| Email: mail@gafunds.com | |
|
| Guinness Atkinson Funds | |
| Fund | | Cusip | | Ticker | | Fund# | |
| Alternative Energy Fund | | | 402031 50 4 | | | GAAEX | | | 1298 | | |
| Asia Focus Fund | | | 402031 10 8 | | | IASMX | | | 1096 | | |
| Asia Pacific Dividend Fund | | | 402031 60 3 | | | GAADX | | | 1299 | | |
| China & Hong Kong Fund | | | 402031 20 7 | | | ICHKX | | | 1094 | | |
| Global Energy Fund | | | 402031 40 5 | | | GAGEX | | | 1098 | | |
| Global Innovators Fund | | | 402031 30 6 | | | IWIRX | | | 1095 | | |
| Renminbi Yuan & Bond Fund | | | 402031 70 2 | | | GARBX | | | 1099 | | |
Distributed by Quasar Distributors, LLC, Milwaukee, WI 53202
This report is intended for shareholders of the Guinness Atkinson Funds and may not be used as literature unless preceded or accompanied by a current prospectus.
87
Guinness Atkinson Funds
c/o U.S. Bancorp Fund Services, LLC
P.O. Box 701
Milwaukee, WI 53201-0701
123S0204--P
Item 2. Code of Ethics.
The registrant has adopted a code of ethics that applies to the registrant’s principal executive officer and principal financial officer. The registrant has not made any amendments to its code of ethics during the period covered by this report. The registrant has not granted any waivers from any provisions of the code of ethics during the period covered by this report.
The registrant undertakes to provide to any person without charge, upon request, a copy of its code of ethics by mail when they call the registrant at 1-800-915-6565.
Item 3. Audit Committee Financial Expert.
The registrant’s board of trustees has determined that there is at least one audit committee financial expert serving on its audit committee. James I. Fordwood is the “audit committee financial expert” and is considered to be “independent” as each term is defined in Item 3 of Form N-CSR.
Item 4. Principal Accountant Fees and Services.
The registrant has engaged its principal accountant to perform audit services, audit-related services, tax services and other services during the past two fiscal years. “Audit services” refer to performing an audit of the registrant’s annual financial statements or services that are normally provided by the accountant in connection with statutory and regulatory filings or engagements for those fiscal years. “Audit-related services” refer to the assurance and related services by the principal accountant that are reasonably related to the performance of the audit. “Tax services” refer to professional services rendered by the principal accountant for tax compliance, tax advice, and tax planning. There were no “other services” provided by the principal accountant. The following table details the aggregate fees billed or expected to be billed for each of the last two fiscal years for audit fees, audit-related fees, tax fees and other fees by the principal accountant.
| | FYE 12/31/2011 | | FYE 12/31/2010 | |
Audit Fees | | $ | 124,400 | | $ | 109,800 | |
Audit-Related Fees | | N/A | | N/A | |
Tax Fees | | $ | 21,700 | | $ | 18,000 | |
All Other Fees | | N/A | | N/A | |
The audit committee has adopted pre-approval policies and procedures that require the audit committee to pre-approve all audit and non-audit services of the registrant, including services provided to any entity affiliated with the registrant.
The percentage of fees billed by Tait, Weller, & Baker LLP applicable to non-audit services pursuant to waiver of pre-approval requirement were as follows:
| | FYE 12/31/2011 | | FYE 12/31/2010 | |
Audit-Related Fees | | 0 | % | 0 | % |
Tax Fees | | 0 | % | 0 | % |
All Other Fees | | 0 | % | 0 | % |
All of the principal accountant’s hours spent on auditing the registrant’s financial statements were attributed to work performed by full-time permanent employees of the principal accountant.
The following table indicates the non-audit fees billed or expected to be billed by the registrant’s accountant for services to the registrant and to the registrant’s investment adviser (and any other controlling entity, etc.—not sub-adviser) for the last two years. The audit committee of the Board of Trustees has considered whether the provision of non-audit services that were rendered to the registrant’s investment adviser is compatible with maintaining the principal accountant’s independence and has concluded that the provision of such non-audit services by the accountant has not compromised the accountant’s independence.
Non-Audit Related Fees | | FYE 12/31/2011 | | FYE 12/31/2010 | |
Registrant | | N/A | | N/A | |
Registrant’s Investment Advisor | | N/A | | N/A | |
Item 5. Audit Committee of Listed Registrants.
Not applicable to registrants who are not listed issuers (as defined in Rule 10A-3 under the Securities Exchange Act of 1934).
Item 6. Schedule of Investments.
(a) Schedule of Investments is included as part of the report to shareholders filed under Item 1 of this Form.
(b) Not Applicable.
Item 7. Disclosure of Proxy Voting Policies and Procedures for Closed-End Management Investment Companies.
Not Applicable.
Item 8. Portfolio Managers of Closed-End Management Investment Companies.
Not Applicable.
Item 9. Purchases of Equity Securities by Closed-End Management Investment Company and Affiliated Purchasers.
Not Applicable.
Item 10. Submission of Matters to a Vote of Security Holders.
The registrant has not made any material changes to the procedures by which shareholders may recommend nominees to the registrant’s Board of Trustees.
Item 11. Controls and Procedures.
(a) The registrant’s principal executive officer and principal financial officer have evaluated the registrant’s disclosure controls and procedures within 90 days of this filing and have concluded based on such evaluation that the registrant’s disclosure controls and procedures were effective, as of that
date, in ensuring that information required to be disclosed by the registrant in this Form N-CSR was recorded, processed, summarized, and reported within the time periods specified in the Securities and Exchange Commission’s rules and forms.
(b) There were no changes in the registrant’s internal control over financial reporting (as defined in Rule 30a-3(d) under the Investment Company Act of 1940) that occurred during the registrant’s last fiscal quarter that have materially affected, or are reasonably likely to materially affect, the registrant’s internal control over financial reporting.
Item 12. Exhibits.
(a) (1) Any code of ethics or amendment thereto, that is subject of the disclosure required by Item 2, to the extent that the registrant intends to satisfy Item 2 requirements through filing an exhibit. "Incorporated by reference to the Registrant's Form N-CSR filed March 10, 2011."
(2) Certifications pursuant to Section 302 of the Sarbanes-Oxley Act of 2002. Filed herewith.
(3) Any written solicitation to purchase securities under Rule 23c-1 under the Act sent or given during the period covered by the report by or on behalf of the registrant to 10 or more persons. Not applicable to open-end investment companies.
(b) Certification pursuant to Section 906 of the Sarbanes-Oxley Act of 2002. Filed herewith.
SIGNATURES
Pursuant to the requirements of the Securities Exchange Act of 1934 and the Investment Company Act of 1940, the registrant has duly caused this report to be signed on its behalf by the undersigned, thereunto duly authorized.
(Registrant) Guinness Atkinson Funds
| | |
By | /s/ James J. Atkinson | |
Name: | James J. Atkinson | |
Title: | President | |
Date: | March 2, 2012 | |
Pursuant to the requirements of the Securities Exchange Act of 1934 and the Investment Company Act of 1940, this report has been signed by the following persons on behalf of the registrant and in the capacities and on the dates indicated.
| | |
By | /s/ James J. Atkinson | |
Name: | James J. AtkinsonTitle: President | |
Date: | March 2, 2012 | |
| | |
| | |
By | /s/ Rita Dam | |
Name: | Rita DamTitle: Treasurer | |
Date: | March 2, 2012 | |


