UNITED STATES
SECURITIES AND EXCHANGE COMMISSION
Washington, D.C. 20549
FORM N-CSR
CERTIFIED SHAREHOLDER REPORT OF REGISTERED
MANAGEMENT INVESTMENT COMPANIES
Investment Company Act file number | 811-08360 |
|
GUINNESS ATKINSON FUNDS |
(Exact name of registrant as specified in charter) |
|
21550 Oxnard Street, Suite 750
Woodland Hills, CA | |
91367
|
(Address of principal executive offices) | | (Zip code) |
|
James J. Atkinson, Jr.
21550 Oxnard Street, Suite 750
Woodland Hills, CA 91367 |
(Name and address of agent for service) |
|
Registrant’s telephone number, including area code: | (800-915-6566) - | |
|
Date of fiscal year end: | December 31 | |
|
Date of reporting period: | December 31, 2009 | |
| | | | | | | | |
Item 1. Reports to Stockholders.
The registrant’s annual report transmitted to shareholders pursuant to Rule 30e-1 under the Investment Company Act of 1940, as amended (the “Investment Company Act”), is as follows:

Annual
Report
December 31, 2009
• Alternative Energy Fund
• Asia Focus Fund
• Asia Pacific Dividend Fund
• China & Hong Kong Fund
• Global Energy Fund
• Global Innovators Fund
Guinness Atkinson Funds
Annual Report
December 31, 2009
TABLE OF CONTENTS
| | 3 | | | Letter to Shareholders | |
|
| | 6 | | | Expense Example | |
|
| | 7 | | | Alternative Energy Fund | |
|
| | 16 | | | Asia Focus Fund | |
|
| | 22 | | | Asia Pacific Dividend Fund | |
|
| | 28 | | | China & Hong Kong Fund | |
|
| | 35 | | | Global Energy Fund | |
|
| | 43 | | | Global Innovators Fund | |
|
| | 50 | | | Statements of Assets and Liabilities | |
|
| | 52 | | | Statements of Operations | |
|
| | 54 | | | Statements of Changes in Net Assets | |
|
| | 56 | | | Financial Highlights | |
|
| | 62 | | | Notes to Financial Statements | |
|
| | 73 | | | Report of Independent Registered Public Accounting Firm | |
|
| | 75 | | | Trustee and Officer Information | |
|
| | 78 | | | Privacy Notice | |
|
| | 79 | | | Guinness Atkinson Funds Information | |
|
2
Dear Guinness Atkinson Funds Shareholders,
A year ago at this time it looked like the world might end. That may sound like hyperbole, but in fact there were reports in the mainstream media that the financial system might collapse and we know for a fact that many of our industry peers were thinking the end was nigh. We'd be fibbing if we didn't admit that we too were a bit worried (although if you revisit this same letter one year ago you'll see the major theme was optimism). And now, a year later, we see that the sun did indeed rise each and every day and that in fact, the world financial system didn't implode. And, oh, by the way, most markets rose dramatically, and not insignificantly, so too did the Guinness Atkinson Funds; more on that in a moment.
A casual glance at the newspapers today (yes, people still read those things) will reveal any number of worrisome news reports and a continuing cascade of potential world ending themes. Global warming, the threat of terrorism, unfriendly/unstable nuclear powers, the decline of American power (or wealth, or influence, or culture, or political system or civility; take your pick), the lack of natural resources and a host of other long-term themes of a negative nature dominate the media. If you're a student of history, though, you'll see that negativity isn't new...only the specific details change. In the 1960s grammar school students were schooled in the "Duck & Cover" technique as a protection against a nuclear blast. Never mind the fact that hiding under your standard issue plywood and metal tubing desk was hardly a protection against a thermonuclear device. Of more interest is how much time and worry was spent hand wringing over the poss ibility of such an attack. The same can be said for the amount of time wasted worrying about "Communist Infiltrators." The 1970s brought worries about the coming Ice Age.
Clearly the world isn't always a warm and fuzzy place and bad things do indeed happen. The lesson of history though is don't bet against positive progress and don't bet against human creativity and ingenuity. (And, we might add, don't bet against the diverse and creative American economy.)
What is lost in this sea of negativity is that around the world magic is happening. It is impossible to deny that billions of people are being lifted out of poverty and standards of living around the world are being improved. We happen to be alive during one of the most amazing periods of human history and we're worried about, well, everything. Technological advancement, communications, the Internet, advancing human knowledge (and the sharing and access of that knowledge) and the spread of democracy are among the key drivers of the advancement of the human condition. Our view is that we're just at the foothills of this great change and that the best is yet to come.
Fund Performance
Performance data quoted represents past performance and does not guarantee future results. The investment return and principal value of an investment will fluctuate so that an investor's shares, when redeemed, may be worth more or less than the original cost. Current performance of the Funds may be lower or higher than the performance quoted. Performance data current to the most recent month end may be obtained by visiting www.gafunds.com. The funds impose a 2% redemption fee on shares held less than 30 days. Performance data quoted does not reflect this fee. If it had, total return would be lower. Gross Expense Ratios: China & Hong Kong Fund 1.53%, Global Innovators Fund 1.40% and Alternative Energy Fund 1.69%.
Despite the very scary beginning to 2009 it was a very good year. Before we present the total return table for the Guinness Atkinson Funds it is worthwhile to note the outstanding performance of the Global Energy Fund. In the Morningstar Equity Energy category, for the period ending December 31, 2009, the Global Energy Fund was the number one fund over the last five years out of 45 funds based on total returns. (Note, it was number 14 of 79 for the one year period and number 5 of 65 for three year performance.)
The China & Hong Kong Fund had a stellar 2009, finishing the year with a total return of 92.76% which handily beat the benchmark Hang Seng Index which produced a return of 56.44% (the Fund's five and ten year average annualized returns as of 12/31/09 were 16.62% and 9.51% vs. the Hang Seng returns of 12.67% and 5.97%, respectively). The Global Innovators Fund continued to quietly outperform both the S&P 500 as well as the NASDAQ index, beating both indices again in 2009 (the Global Innovator Fund's one, five and ten years average annualized returns as of 12/31/09 were 45.20%, 4.98% and -2.43% vs. the S&P 500 Index returns of 26.47%, 0.42%, -0.95% and the NASDAQ Index returns of 45.36%, 1.71% and -5.08% for the same time period).
We would be remiss, however, if we didn't also mention the laggard in the GA Funds family, the Alternative Energy Fund. Despite a decent 2009 total return of 33.42% (vs. the S&P 500 return of 26.47%), the Fund's from inception (3/31/06) return through 12/31/09 is a negative 12.99% (vs. the S&P 500 return of -1.80%). This despite the fact that the Fund had an excellent run shortly after inception until late 2007. There are more details in the Managers' Report which precedes the financial statements for this
3
Fund, but the short story is that the economic crisis has had a large impact on the entire alternative energy sector. Looking forward, we do believe there are good reasons to believe this Fund has good prospects for recovery as project finance revives, real progress is achieved in reducing costs of alternative energy technologies, fossil fuel prices continue to recover and the various countries increase government support for the sector.
Guinness Atkinson Funds Total Return For Periods Ending December 31, 2009
| Fund (inception date) | | 1-year | | 3-year | | 5-year | | 10-year | | From Inception | | Expense Ratio | |
| Alternative Energy Fund (March 31, 2006) | | | 33.42 | % | | | -13.54 | % | | | N/A | | | | N/A | | | | -12.99 | % | | | 1.69 | % | |
| Asia Focus (April 29, 1996) | | | 86.05 | % | | | 5.00 | % | | | 13.75 | % | | | 7.68 | % | | | 3.57 | % | | | 1.75 | % | |
| Asia Pacific Dividend Fund (March 31, 2006) | | | 64.84 | % | | | 0.16 | % | | | N/A | | | | N/A | | | | 2.85 | % | | 2.33% gross; 2.10% net | |
| China & Hong Kong (June 30, 1994) | | | 92.76 | % | | | 13.15 | % | | | 16.62 | % | | | 9.51 | % | | | 9.63 | % | | | 1.53 | % | |
| Global Energy Fund (June 30, 2004) | | | 63.27 | % | | | 4.85 | % | | | 15.72 | % | | | N/A | | | | 18.39 | % | | | 1.31 | % | |
| Global Innovators Fund (December 15, 1998) | | | 45.20 | % | | | -1.34 | % | | | 4.98 | % | | | -2.43 | % | | | 3.56 | % | | | 1.40 | % | |
Periods of greater than one year are average annualized returns; one year or less are actual returns. All returns are for the periods ending December 31, 2009.
All of the Guinness Atkinson Funds have an expense cap in place and the advisor is contractually obligated to cap the total expenses at least through June 30, 2010.
Expense ratios are from the most recent prospectus (dated May 1, 2009) and are from the most recent audited financials (period ending December 31, 2008) at the time that prospectus was completed.
As with our previous report, our portfolio managers provide commentary for each of the Guinness Atkinson Funds adjacent to each Fund's financial report, and Morningstar ratings data can be found immediately after this letter.
Your investment in the Guinness Atkinson Funds is tangible evidence of the confidence you have in our investment management team. Be assured that we never lose sight of our duty to continue to earn that confidence and appreciate the opportunity to serve you.
Sincerely,


Timothy Guinness James Atkinson
4
Morningstar Ratings
Below is a table listing the Morningstar star ratings as of December 31, 2009 for the six Guinness Atkinson Funds. Parenthetical numbers after the star rating indicate the number of funds in the comparison group.
| Fund | | Category | | Overall | | 3-year | | 5-year | | 10-year | |
Alternative Energy
Fund | | Equity Energy | | 1*
(65 funds) | | 1*
(65 funds) | | | | | | | | | |
Asia Focus
Fund | | Pacific/Asia
Ex-Japan Stk | | 2**
(107 funds) | | 2**
(107 funds) | | 2**
(79 funds) | | | 1*
(66 funds) | | |
Asia Pacific Dividend
Fund | | Pacific/Asia
Ex-Japan Stk | | 2**
(107 funds) | | 2**
(107 funds | | | | | | | | | |
China & Hong Kong
Fund | | Pacific/Asia
Ex-Japan Stk | | 3***
(107 funds) | | 4****
(107 funds) | | 3***
(79 funds) | | | 3***
(66 funds) | | |
Global Energy
Fund | | Equity Energy | | 4****
(65 funds) | | 4****
(65 funds) | | 4****
(45 funds) | | | | | |
Global Innovators
Fund | | Large Growth | | 3***
(1,548 funds) | | 3***
(1,548 funds) | | 4****
(1,276 funds) | | | 2**
(698 funds) | | |
©2010 Morningstar, Inc. All Rights Reserved. The information contained herein: (1) is proprietary to Morningstar and/or its content providers; (2) may not be copied or distributed; and (3) is not warranted to be accurate, complete or timely. Neither Morningstar nor its content providers are responsible for any damages or losses arising from any use of this information. Past performance is no guarantee of future results.
The Funds invest in foreign securities which involves greater volatility and political, economic and currency risks and differences in accounting methods. The Funds are non-diversified meaning their assets may be concentrated in fewer individual holdings than diversified funds. Therefore, the Funds are more exposed to individual stock volatility than diversified funds. The Funds invest in smaller companies, which will involve additional risks such as limited liquidity and greater volatility.
Morningstar Rankings represent a fund's total-return rank relative to all funds that have the same Morningstar Category. The highest rank is 1 and the lowest is based on the total number of funds ranked in the category. It is based on Morningstar total return, which includes both income and capital gains or losses and is not adjusted for sales charges or redemption fees.
For each fund with at least a three-year history, Morningstar calculates a Morningstar Rating(TM) based on a Morningstar Risk-Adjusted Return measure that accounts for variation in a fund's monthly performance (including the effects of sales charges, loads, and redemption fees), placing more emphasis on downward variations and rewarding consistent performance. The top 10% of funds in each category receive 5 stars, the next 22.5% receive 4 stars the next 35% receive 3 stars, the next 22.5% receive 2 stars and the bottom 10% receive 1 star. (Each share class is counted as a fraction of one fund within this scale and rated separately, which may cause slight variations in distribution percentages.)
5
GUINNESS ATKINSON FUNDS
Expense Examples (Unaudited)
As a shareholder of the Funds, you incur two types of costs: (1) redemption fees; and (2) ongoing costs, including advisory fees; and other Fund expenses. The examples below are intended to help you understand your ongoing costs (in dollars) of investing in the Funds and to compare these costs with the ongoing costs of investing in other mutual funds.
The examples are based on an investment of $1,000 invested at the beginning of the period shown and held for the entire period from July 1, 2009 to December 31, 2009.
Actual Expenses
For each Fund, the first line of the table below provides information about actual account values and actual expenses. You may use the information in this line, together with the amount you invested, to estimate the expenses that you paid over the period. Simply divide your account value by $1,000 (for example, an $8,600 account value divided by $1,000 = 8.6), then multiply the result by the number in the first line under the heading entitled "Expenses Paid during Period" to estimate the expenses you paid on your account during this period.
Hypothetical Example for Comparison Purposes
For each Fund, the second line of the table below provides information about hypothetical account values and hypothetical expenses based on the Fund's actual expense ratios and an assumed rate of return of 5% per year before expenses, which is not the Fund's actual return. The hypothetical account values and expenses may not be used to estimate the actual ending account balance or expenses you paid for the period. You may use this information to compare the ongoing costs of investing in the Fund and other funds. To do so, compare this 5% hypothetical example with the 5% hypothetical examples that appear in the shareholder reports of the other funds.
Please note that the expenses shown in the table are meant to highlight your ongoing costs only and do not reflect any redemption fees. Therefore, the second line for each Fund of the table is useful in comparing ongoing costs only, and will not help you determine the relative total costs of owning different funds. In addition, if these redemption fees were included, your costs would have been higher.
| | | Beginning
Account
Value
(07/01/09) | | Ending
Account
Value
(12/31/09) | | Expenses Paid
During Period*
(07/01/09 to
12/31/09) | | Expense Ratios
During Period*
(07/01/09 to
12/31/09) | |
| Guinness Atkinson Alternative Energy Fund Actual | | $ | 1,000.00 | | | $ | 1,111.50 | | | $ | 9.53 | | | | 1.79 | % | |
Guinness Atkinson Alternative Energy Fund Hypothetical
(5% return before expenses) | | $ | 1,000.00 | | | $ | 1,016.18 | | | $ | 9.10 | | | | 1.79 | % | |
| Guinness Atkinson Asia Focus Fund Actual | | $ | 1,000.00 | | | $ | 1,280.70 | | | $ | 9.14 | | | | 1.59 | % | |
Guinness Atkinson Asia Focus Fund Hypothetical
(5% return before expenses) | | $ | 1,000.00 | | | $ | 1,017.19 | | | $ | 8.08 | | | | 1.59 | % | |
| Guinness Atkinson Asia Pacific Dividend Fund Actual | | $ | 1,000.00 | | | $ | 1,227.40 | | | $ | 11.06 | | | | 1.98 | %† | |
Guinness Atkinson Asia Pacific Dividend Fund Hypothetical
(5% return before expenses) | | $ | 1,000.00 | | | $ | 1,015.27 | | | $ | 10.01 | | | | 1.98 | %† | |
| Guinness Atkinson China & Hong Kong Fund Actual | | $ | 1,000.00 | | | $ | 1,378.00 | | | $ | 9.29 | | | | 1.55 | % | |
Guinness Atkinson China & Hong Kong Fund Hypothetical
(5% return before expenses) | | $ | 1,000.00 | | | $ | 1,017.39 | | | $ | 7.88 | | | | 1.55 | % | |
| Guinness Atkinson Global Energy Fund Actual | | $ | 1,000.00 | | | $ | 1,246.30 | | | $ | 7.93 | | | | 1.40 | % | |
Guinness Atkinson Global Energy Fund Hypothetical
(5% return before expenses) | | $ | 1,000.00 | | | $ | 1,018.15 | | | $ | 7.12 | | | | 1.40 | % | |
| Guinness Atkinson Global Innovators Fund Actual | | $ | 1,000.00 | | | $ | 1,250.10 | | | $ | 8.85 | | | | 1.56 | %† | |
Guinness Atkinson Global Innovators Fund Hypothetical
(5% return before expenses) | | $ | 1,000.00 | | | $ | 1,017.34 | | | $ | 7.93 | | | | 1.56 | %† | |
*Expenses are equal to the Funds' annualized expense ratio as indicated, multiplied by the average account value over the period, multiplied by the number of days in most recent fiscal half-year period (184), then divided by the number of days in the fiscal year (365) (to reflect the one-half year period).
†Net of fee waivers and/or expense reimbursements. If those fee waivers and/or expense reimbursements had not been in effect, the Fund's actual expenses would have been higher.
6
ALTERNATIVE ENERGY FUND
1. Performance
AVERAGE ANNUALISED TOTAL RETURNS
| | | 2009
(actual) | | Since inception
March 31, 2006 | |
| Fund | | | 33.42 | % | | | -12.98 | % | |
| Benchmark indices | |
| Wilderhill New Energy Global Innovation Index | | | 41.14 | % | | | -1.28 | % | |
| Wilderhill Clean Energy Index | | | 29.74 | % | | | -16.81 | % | |
| MSCI World Index | | | 30.78 | % | | | -0.84 | % | |
The Fund's gross expense ratio is 1.69% per the Summary Prospectus dated May 1, 2009. Guinness Atkinson Asset Management has contractually agreed to waive a portion of its advisory fees so that the Fund's ratio of expenses to average daily net assets will not exceed 1.98% (excluding Acquired Fund Fees and Expenses, interest, taxes, dividends on short positions and extraordinary expenses) through at least June 30, 2010. To the extent that the Advisor waives fees it may seek repayment of a portion or all of such amounts that any time within three fiscal years after the fiscal year in which such amounts were waived, subject to the applicable cap.
Performance data quoted represents past performance and does not guarantee future results. The investment return and principal value of an investment will fluctuate so that an investor's shares, when redeemed, may be worth more or less than their original cost. Current performance of the Fund may be lower or higher than the performance quoted. Performance data current to the most recent month end may be obtained by visiting www.gafunds.com, or calling (800) 916-6566.
The Fund imposes a 2% redemption fee on shares held less than 30 days. Performance data quoted does not reflect the 2% redemption fee on shares held less than 30 days. Total returns reflect a fee waiver in effect and in the absence of this waiver, the total returns would be lower.
The Alternative Energy Fund in 2009 produced a total return of 33.42%. This compares favourably to the price return of the Wilderhill Clean Energy Index of 29.74% , and is also ahead of the broad market which recovered strongly from March onwards, as exemplified by the MSCI World Index's total return of 30.78% . The year started poorly and the fund bottomed out in March, from where the fund has recovered well.
The main contributors to performance were the wind and solar sectors, with notable outperformance of our Asian solar holdings. Top performing stocks for the year were Trina Solar up 481%, Energy Development Corporation (Philippines geothermal) up 228%, Novera Energy up 161%, SMA Solar Technology up 157% and Canadian Hydro Developers up 107%. The poorest performers were Q-Cells down 49%, LDK Solar down 47%, Solar Fabrik down 33%, Daystar Technologies down 33% and Sunpower down 31% .
Stock performance numbers taken as the price return of the stocks when included in the fund; Source: Bloomberg
2. Portfolio
| Sector | | % of Assets | |
| Solar | | | 48.09 | % | |
| Wind | | | 28.46 | % | |
| Geothermal | | | 7.02 | % | |
| Efficiency | | | 10.06 | % | |
| Biomass Energy | | | 2.26 | % | |
| Hydro | | | 3.26 | % | |
| Biofuel | | | 0.30 | % | |
| Cash | | | 0.55 | % | |
| | | | 100.00 | % | |
7
ALTERNATIVE ENERGY FUND
| Domicile | | % of Assets | |
| Europe | | | 42.91 | % | |
| North America | | | 33.43 | % | |
| Asia | | | 19.43 | % | |
| Latin America | | | 3.26 | % | |
| Australasia | | | 0.42 | % | |
| Cash | | | 0.55 | % | |
| | | | 100.00 | % | |
* region is as per company domicile.
The portfolio is quite concentrated in the wind and solar sectors, with 48.09% in solar and 28.46% in Wind. We believe these sectors have the best long-term growth potential of the alternative energy space.
Within the solar sector we have exposure to thin film solar panel manufacturing via our holding in First Solar and are otherwise invested across the silicon photovoltaic value chain.
For our wind exposure we are invested in turbine manufacturers and wind farm developers.
Efficiency is an area where the Obama stimulus plan will likely provide a wealth of opportunity. However, the biggest beneficiary is the eventual energy user. We have interesting investments in ground source heat pumps, building efficiency and heat recycling, with some exposure to transmission grid growth.
We are invested in three geothermal companies, of which one is the principal builder of systems, Ormat, the second is a Philippine utility and the third (research) position is invested in a hot rock project in Australia. We expect geothermal to become a more important part of alternative energy plans as a result of its low costs and established technology.
Our biomass investment is in one Canadian independent power producer with a portfolio of biomass plants. We think there are some interesting niche biomass projects and we are interested in those companies that do not have constraints on future biomass supply, but are cautious about the upside in the sector at the moment given specific project exposure of the investments available.
We have only a small research holding in biofuels. We monitor the sector closely, but have concerns about overcapacity and negative margins in the US ethanol refining sector.
We have no investments in fuelcells, tidal or wave power companies, but remain interested in these areas.
The Fund has 42.91% of its holdings in companies domiciled in Europe, reflecting the more mature European industry. North America accounts for 33.43% of the Fund of which 8.86% is in Canada. The Fund's 23.11% of emerging markets holdings is principally in Asia, with our investment in Chinese companies making up 16.01% of the Fund.
| Mkt Cap $m | | Positions | | % of Assets | |
| | >1000 | | | | 18 | | | | 56.10 | % | |
| | 500-1000 | | | | 3 | | | | 8.66 | % | |
| | 250-500 | | | | 7 | | | | 21.61 | % | |
| | 100-250 | | | | 4 | | | | 5.91 | % | |
| | 50-100 | | | | 2 | | | | 2.25 | % | |
| | <50 | | | | 6 | | | | 4.92 | % | |
8
ALTERNATIVE ENERGY FUND
| Position size | | Positions | | % of Assets | |
| Full | | | 27 | | | | 87.55 | % | |
| Half | | | 6 | | | | 9.15 | % | |
| Research | | | 7 | | | | 2.74 | % | |
The liquidity of the Fund remains excellent, with 56.10% of the Fund in companies with a market capitalization over US$1,000 million. The Fund now has 27 full units and 6 half units.
3. Activity
The first half of 2009 was relatively quiet, although we continued to rebalance the fund. We sold the remnants of our holdings in Tanfield and Solar Fabrik at the beginning of the year. We sold our research holding in Daystar in the second quarter and switched from Solaria, the Spanish solar developer into PV Crystalox.
In the third quarter, we increased the weightings in both existing and new solar names. We increased our holding in First Solar, the thin film solar manufacturer and Trina Solar, one of the leading Asian solar manufacturers. We bought new positions in Yingli Green Energy and Canadian Solar, two Chinese solar manufacturers and bought a holding in Phoenix Solar, an attractively valued German installer of solar systems. In addition, we increased our Clipper Windpower holding to a full unit as we became more comfortable that while still distressed, the company would manage to get through its current difficulties.
We sold the holdings in Echelon, in Verbund, the Austrian hydro utility, in Wacker Chemie, a German polysilicon refiner, in Q-Cells, the German solar cell manufacturer and in EDF Energies Nouvelles, the French renewable utility.
In the fourth quarter, we sold two holdings in corporate transactions – Canadian Hydro was acquired by Transalta and Novera was acquired by Terra Firma. We bought a holding in STR Holdings, one of the leading manufacturers of solar encapsulents, we bought back into Acciona, the Spanish renewable utility and took a position in LSB industries, which complements the holding in Waterfurnace Renewable Energy to give exposure to the ground source heatpump market.
4. Outlook
We believe that 2010 will be an important year for a number of the alternative energy technologies. 2009 has been a difficult year for all companies, with limited availability of capital for both company balance sheets and projects and cautious end user demand. We believe 2010 will provide the platform for the next growth phase of the alternative energy industry.
Improving economics for the alternative energy industry and the return of financing combined with increasing government subsidies and long term incentive programmes are likely to result in increases in project backlogs and a firming of prices that should be beneficial for alternative energy equity valuations. We think investors will begin to be able to look towards the potential returns from the industry rather than focusing on the problems caused by the slowdown in the world economy.
The long term fundamental drivers of the slow shift away from our dependence on fossil fuels remains intact. We expect the cost of extracting the marginal barrel of oil and the cost of exploration will increase as reserves decline. At the same time the costs of alternative non fossil fuel energy sources are falling. This tangibly improves the economics and growth potential for the alternative energy industry.
Energy security remains an important issue in defining energy policy internationally. Russia and OPEC are able to wield disproportionate influence as a result of their energy reserves and world energy supplies remain vulnerable to geopolitical disruption. It is in all governments' interest to reduce their dependence on other countries for basic resources such as energy.
The last of our major drivers, climate change, will remain the most intangible. The science is based on long term trends and is expected to have long term impacts. However, the complexity of modelling the global climate, with sensitive feedback loops and combinations of effects that can never be completely understood means that debate on the issue will remain open. We think this debate is important and do not feel comfortable with what sometimes feels like religious support for anything remotely linked to climate change. At the same time, we believe that the slightest chance of catastrophic warming of the planet should be taken seriously by everyone.
9
ALTERNATIVE ENERGY FUND
From the broadest perspective, it is clearly a positive idea that we should move towards sources of energy that are not finite and we should move towards using a variety of technologies that provides us with secure, cheap, abundant energy in the long run, and reduces risks from spikes to fossil fuel prices. This long term goal provides the attractive investment opportunity that we are looking to position the fund to profit from.
Looking at what the near term holds, we think that the next five to ten years are particularly exciting in terms of the growth offered. Different technologies are at differing stages of maturity and cost, and we believe that the most exciting opportunities are offered by those that are on the cusp of reaching economic feasibility without subsidies and are as yet unconstrained by grid stability issues and limits of geographic availability.
The solar industry has undergone a traumatic two years, where price targets for modules that were expected in 2015 or beyond are now being reached. This has lead to poor performance in the equities in the space, but now presents an opportunity for the cost and technology leaders to benefit from the next spurt of growth. 2009 was deemed a difficult year, but even in a tough year it appears from estimates that volumes will have grown by approximately 4%. We expect growth of around 50% for 2010, and possibly the same for 2011. This is principally because of the lower prices, which are enabling governments to provide increased support for solar at lower cost.
In Germany, the government is lowering the financial incentives for solar panels because the price of solar panels has fallen by more than half over the last 18 months. Underpinning the solar panel price falls has been a drop in the spot price of silicon to around $50 per kg today. We expect this to reach $35 per kg over the next few years, which will further support the cost reducing efforts of the industry. We believe that the German feed in tariff reductions are being aimed at keeping the German solar industry at over 3GW per annum in solar installations, which will provide a supportive floor as other countries, particularly the US and China catch up. This is in the context of a market of around 6GW in 2009, which we expect to rise to 9GW or above in 2010.
We think that the winners will be the low cost manufacturers, and as with many industries, that means manufacturing in Asia, where the history of semiconductor manufacturing has meant that companies have been able to climb the learning curve fast and deliver a good quality low cost product. Other winners in the long run will be those with differentiated brand and access to customers, and suppliers of some of the critical system parts such as inverters where there is lower competition. As the industry matures we expect the volatility of price caused by supply and demand surges will improve and provide strong returns for investors.
For the wind industry, 2009 was a good year from an installation perspective. The long lead times for turbines meant that 2009 order books were strong and the turbine manufacturers have been busy while able to prepare for any slowdown in the growth rate for the wind industry. As a result of the difficulty in obtaining project financing, fewer new projects have hit the order books over the last 18 months, and we see the prospect of turbine prices falling by 10-15% in 2010.
From a turbine manufacturer perspective, they have been able to lower their material costs and implement further internal cost reduction programmes that should enable them to operate profitably at lower price points. For developers, for whom the project finance markets are now beginning to open up, this creates an exciting opportunity set, particularly as renewable portfolio standards start to be targeted by utilities. For achieving renewable portfolio standards that are now being set by government for 2020 and beyond, wind is one of the easiest non fossil fuel technologies to implement at a fast pace and we expect strong returns from developers over the next five years.
Geothermal is one of the most exciting potential sources of large scale base load electricity. Countries with easy access to the resource e.g., the United States, Iceland, Philippines, Kenya, are looking to maximise their generation from geothermal energy. US developers have received a number of large grants to assist in exploration and development and there are improving subsidy regimes. The drawbacks of the industry are the high exploration risk – like in the oil and gas industry there is always the risk of a "dry hole" – and high valuations on development pipelines. We think that ongoing developments in the oil and gas industry will spill over into improved costs for geothermal drilling. Further out there is also the huge potential from the development of "Enhanced Geothermal Systems" which are not reliant on fault lines, but this is still probably 10 years from offering many public investment opportunities.
In the western world many of the major hydroelectric resources have been developed, and this provides different types of investment opportunities. Assets have long lives, with low operating costs, which mean that increases in electricity prices do not typically have associated cost increases. Growth opportunities are available in developing countries and in portfolios of run of river, smaller hydro opportunities benefiting from renewable portfolio standards and increasing electricity demand.
10
ALTERNATIVE ENERGY FUND
The biofuels market is showing signs of recovery. Deep pocketed energy companies including Shell and Valero have increased their exposure to the sector. These companies will be difficult for independent listed biofuels refining companies to compete with until margins improve but we continue to monitor the sector for opportunities. Some of the next generation technologies may be able to deliver the significantly higher yield per acre needed to address food versus fuel concerns. Concerns over rising food prices mean that we believe that the biofuels space continues to face a policy headwind, with further challenges from oversupply in the US market.
There is a broad spectrum of companies that fall into the "efficiency" bracket. An uplift in spending on electricity transmission grids appears inevitable and we expect a slow shift towards electrification of the vehicle fleet over the next ten years. Within efficiency current areas of research include energy storage, waste heat recovery, heat pumps, building control, demand response and smart metering.
A number of other potentially interesting subsectors such as fuelcells, wave and tidal power are still at an early stage of technological development and make for more challenging investment areas. We will follow the progress of these technologies down the cost curve.
This is a sector that is impacted by moves in the broader markets, and we expect to see continued volatility over 2010, but believe that economies and markets will settle later in 2010 and that the outlook for alternative energy will be brighter as investors start to take a longer term perspective.

Tim Guinness

Edward Guinness

Mathew Page
The Fund invests in foreign securities which will involve political, economic and currency risks, greater volatility, and differences in accounting methods. The Fund is non-diversified meaning its assets may be concentrated in fewer individual holdings than diversified funds. Therefore, the Funds are more exposed to individual stock volatility than diversified funds. The Funds invest in smaller companies, which will involve additional risks such as limited liquidity and greater volatility.
The Wilderhill New Energy Global Innovation Index (NEX) is a modified dollar weighted index of publicly traded companies, which are active in renewable and low-carbon energy, and which stand to benefit from responses to climate change and energy security concern. The Wilderhill Clean Energy Index (ECO) is a modified equal dollar weighted index comprised of publicly traded companies whose businesses stand to benefit substantially from societal transition toward the use of cleaner energy and conservation. The MSCI World Energy Index is an unmanaged index composed of more than 1,400 stocks listed on exchanges in the U.S., Europe, Canada, Australia, New Zealand, and the Far East. These indices are unmanaged, not available for investment and do not incur expenses.
Please refer to the Schedule of Investments for details on fund holdings. Current and future portfolio holdings are subject to risk.
Cash flow measures the cash generating capability of a company by adding non-cash charges (e.g. depreciation) and interest expense to pre-tax income.
The information provided herein represents the opinion of Guinness Atkinson Management for the period stated and is not intended to be a forecast of future events, a guarantee of future results, nor investment advice. Opinions, fund holdings and sector allocations are subject to change at any time and are not recommendations to buy or sell any security.
11
ALTERNATIVE ENERGY FUND
Growth of $10,000
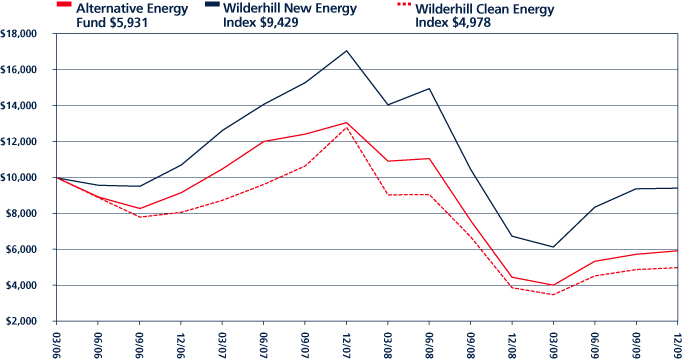
Average Annual Total Return
Periods Ended December 31, 2009
| One Year | | Since Inception
(03/31/06) | |
| | 33.42 | % | | | (12.98 | )% | |
Performance data quoted represents past performance and does not guarantee future results. The investment return and principal value of an investment will fluctuate so that an investor's shares, when redeemed, may be worth more or less than their original cost. Current performance of the Fund may be lower or higher than the performance quoted. Performance data current to the most recent month end may be obtained by visiting www.gafunds.com.
Total returns reflect a fee waiver in effect and in the absence of this waiver, the total returns would be lower. The Fund imposes a 2% redemption fee on shares held less than 30 days.
The Wilderhill New Energy Global Innovations Index (NEX) is a modified dollar weighted index of publicly traded companies, which are active in renewable and low-carbon energy, and which stand to benefit from responses to climate change and energy security concern. The Wilderhill Clean Energy Index (ECO) is a modified equal dollar weighted index comprised of publicly traded companies whose businesses stand to benefit substantially from societal transition toward the use of cleaner energy and conservation.
12
FUND HIGHLIGHTS at December 31, 2009
GUINNESS ATKINSON ALTERNATIVE ENERGY FUND
| # of Holdings in Portfolio: | | | 42 | | |
| Portfolio Turnover: | | | 47.1 | % | |
| % of Stocks in Top 10: | | | 37.7 | % | |
| Fund Managers: | |
| Timothy W. N. Guinness | | | | | |
| Edward Guinness | | | | | |
| Matthew Page | | | | | |
| Top 10 Holdings (% of net assets) | | | | Sector Breakdown (% of Investments) | | | |
| Clipper Windpower PLC | | | 4.7 | % | | Solar | | | 48.3 | % | |
| Phoenix Solar AG | | | 3.9 | % | | Wind | | | 28.6 | % | |
| Trina Solar Ltd. - ADR | | | 3.8 | % | | Efficiency | | | 10.0 | % | |
| Canadian Solar, Inc. | | | 3.8 | % | | Geothermal | | | 7.2 | % | |
| STR Holdings, Inc. | | | 3.8 | % | | Hydro | | | 3.3 | % | |
| LSB Industries, Inc. | | | 3.7 | % | | Biomass | | | 2.3 | % | |
| JA Solar Holdings Co., Ltd. | | | 3.7 | % | | Biofuel | | | 0.3 | % | |
| Energy Development Corp/Philippines | | | 3.5 | % | | | | | | | |
| WaterFurnace Renewable Energy, Inc. | | | 3.4 | % | | | | | | | |
| Hansen Transmissions International NV | | | 3.4 | % | | | | | | | |
| Country Breakdown (% of net assets) | |
| United States | | | 24.5 | % | | Philippines | | | 3.5 | % | |
| China | | | 16.0 | % | | Belgium | | | 3.3 | % | |
| Spain | | | 12.0 | % | | Brazil | | | 3.3 | % | |
| Germany | | | 10.3 | % | | Norway | | | 3.2 | % | |
| Canada | | | 8.9 | % | | France | | | 2.6 | % | |
| Britain | | | 7.2 | % | | Australia | | | 0.4 | % | |
| Denmark | | | 4.3 | % | | | | | | | |
13
SCHEDULE OF INVESTMENTS
December 31, 2009
GUINNESS ATKINSON ALTERNATIVE ENERGY FUND
| Shares | | COMMON STOCKS: 98.8% | | Value | |
| Biofuel: 0.3% | | | |
| | 25,000 | | | FutureFuel Corp | | $ | 167,500 | | |
| Biomass: 2.3% | | | |
| | 151,587 | | | Boralex, Inc.* | | | 1,405,932 | | |
| Efficiency: 10.0% | | | |
| | 146,000 | | | Applied Intellectual Capital Ltd*†^ | | | — | | |
| | 760,987 | | | Carmanah Technologies Corp*† | | | 603,929 | | |
| | 3,699,900 | | | Composite Technology Corp* | | | 980,473 | | |
| | 163,705 | | | LSB Industries, Inc.* | | | 2,308,241 | | |
| | 24,428 | | | Nevaro Capital Corp.*†^ | | | — | | |
| | 60,000 | | | Nevaro Capital Corp.*†^ | | | — | | |
| | 4,445,888 | | | Thermal Energy International, Inc.*† | | | 255,059 | | |
| | 84,200 | | | WaterFurnace Renewable Energy, Inc. | | | 2,090,005 | | |
| | | | 6,237,707 | | |
| Geothermal: 7.1% | | | |
| | 21,648,000 | | | Energy Development Corp/Philippines | | | 2,188,729 | | |
| | 351,369 | | | Geodynamics Ltd* | | | 262,687 | | |
| | 52,119 | | | Ormat Technologies, Inc. | | | 1,972,183 | | |
| | | | 4,423,599 | | |
| Hydro: 3.3% | | | |
| | 111,958 | | | Cia Energetica de Minas Gerais - ADR | | | 2,021,961 | | |
| Solar: 47.4% | | | |
| | 82,000 | | | Canadian Solar, Inc.* | | | 2,363,240 | | |
| | 15,000 | | | First Solar, Inc.* | | | 2,031,000 | | |
| | 401,800 | | | JA Solar Holdings Co Ltd* | | | 2,290,260 | | |
| | 107,100 | | | LDK Solar Co. Ltd - ADR* | | | 750,771 | | |
| | 108,280 | | | MEMC Electronic Materials, Inc.* | | | 1,474,774 | | |
| | 40,030 | | | Phoenix Solar AG | | | 2,444,207 | | |
| | 1,504,001 | | | PV Crystalox Solar PLC | | | 1,492,049 | | |
| | 156,900 | | | Renesola Ltd. - ADR* | | | 746,844 | | |
| | 256,983 | | | Renewable Energy Corp. ASA* | | | 1,983,782 | | |
| | 15,670 | | | SMA Solar Technology AG | | | 2,075,587 | | |
| | 65,854 | | | Solarworld AG | | | 1,445,489 | | |
| | 148,700 | | | STR Holdings, Inc.* | | | 2,336,077 | | |
| | 89,020 | | | SunPower Corp.* | | | 1,864,969 | | |
| | 106,211 | | | Suntech Power Holdings Co. Ltd. - ADR* | | | 1,766,289 | | |
| | 44,200 | | | Trina Solar Ltd. - ADR* | | | 2,385,474 | | |
| | 126,600 | | | Yingli Green Energy Holding Co. Ltd. - ADR* | | | 2,001,546 | | |
| | | | 29,452,358 | | |
The accompanying notes are an integral part of these financial statements.
14
| Shares | | COMMON STOCKS: 98.8% Continued | | Value | |
| Wind: 28.4% | | | |
| | 15,400 | | | Acciona SA | | $ | 2,012,901 | | |
| | 1,052,668 | | | Clipper Windpower PLC* | | | 2,932,958 | | |
| | 181,600 | | | EDP Renovaveis SA* | | | 1,721,812 | | |
| | 99,782 | | | Gamesa Corp Tecnologica SA | | | 1,681,047 | | |
| | 197,700 | | | Greentech Energy Systems* | | | 904,834 | | |
| | 1,182,300 | | | Hansen Transmissions International NV* | | | 2,081,896 | | |
| | 427,400 | | | Iberdrola Renovables SA | | | 2,035,261 | | |
| | 166,980 | | | Innergex Renewable Energy Inc*† | | | 878,128 | | |
| | 392,347 | | | Theolia SA* | | | 1,624,688 | | |
| | 29,415 | | | Vestas Wind Systems A/S* | | | 1,790,867 | | |
| | | | 17,664,392 | | |
| | | | | Total Common Stock
(cost $79,739,669) | | | 61,373,449 | | |
| Warrants: 0.0% | | | |
| | 25,000 | | | FutureFuel Corp. 6.00 Exp 7/12/2010*†^ | | | 17,500 | | |
| | | | | Total Warrants
(cost $30,750) | | | 17,500 | | |
| Par Value | | CONVERTIBLE BONDS: 0.7% | | | |
| Solar: 0.7% | | | |
| $ | 277,500 | | | SAG Solarstrom 7/30/10 6.85%*†^ | | | 397,810 | | |
| | | | | Total Convertible Bonds
(cost $382,326) | | | 397,810 | | |
| | | | | Total Investments in Securities
(cost $80,152,745): 99.5% | | | 61,788,759 | | |
| | | | | Other Assets less Liabilities: 0.5% | | | 319,907 | | |
| | | | | Net Assets: 100% | | $ | 62,108,666 | | |
* Non-income producing security.
† Illiquid. Illiquid securities represent 3.5% of net assets.
^ Fair value under direction of the Board of Trustees. Fair valued securities represent 0.7% of net assets.
ADR - American Depository Receipt
The accompanying notes are an integral part of these financial statements.
15
ASIA FOCUS FUND for the period ended December 31, 2009
1. Performance
AVERAGE ANNUALIZED TOTAL RETURNS
| | | 1 Year
(actual) | | 3 Years | | 5 Years | | 10 Years | |
| Fund | | | 86.05 | % | | | 5.00 | % | | | 13.75 | % | | | 7.68 | % | |
| Benchmark Index: | |
| MSCI AC Far East Free Ex Japan | | | 68.69 | % | | | 4.68 | % | | | 12.88 | % | | | 5.91 | % | |
| S&P 500 | | | 26.47 | % | | | -5.61 | % | | | 0.42 | % | | | -0.95 | % | |
The Fund's gross expense ratio is 1.75% per the Summary Prospectus dated May 1, 2009. Guinness Atkinson Asset Management has contractually agreed to waive a portion of its advisory fees so that the Fund's ratio of expenses to average daily net assets will not exceed 1.98% (excluding Acquired Fund Fees and Expenses, interest, taxes, dividends on short positions and extraordinary expenses) through at least June 30, 2010. To the extent that the Advisor waives fees it may seek repayment of a portion or all of such amounts at any time within the three fiscal years after the fiscal year in which such amounts were waived, subject to the applicable cap.
Performance data quoted represents past performance and does not guarantee future results. The investment return and principal value of an investment will fluctuate so that an investor's shares, when redeemed, may be worth more or less than their original cost. Current performance of the Funds may be lower or higher than the performance quoted. Performance data current to the most recent month end may be obtained by visiting www.gafunds.com, or calling (800) 916-6566.
The Fund imposes a 2% redemption fee on shares held less than 30 days. Performance data quoted does not reflect the 2% redemption fee on shares held less than 30 days. Total Returns for prior periods reflect a fee waiver in effect and in the absence of this waiver, the total return would be lower.
We are pleased to report to shareholders that the Fund had a good year in 2009 and out-performed its benchmark. After a hard year in 2008 Asian markets enjoyed a substantial rebound last year as the region's financial stability combined with substantial government stimulus, especially in China, drew investors back to the region. Overall, the best performing markets in North Asia were South Korea and Taiwan while South-East Asia was led by Indonesia, Singapore and Thailand. The Chinese component of the benchmark was not one of the better performers, but this reflects the skewed nature of the market dominated as it is by a small group of large capitalization companies in Banks, Energy and Telecoms. However, within the China universe there were some strong performers and these were significant contributors to the Fund's performance.
Looking at the last year in terms of sector performance, Consumer Discretionary led the way with auto makers being the most significant group. Car sales improved across the region but in China and South Korea in particular, government incentives for new car purchases generated a huge response. Technology stocks also performed as new orders for laptop computers picked up more quickly than had been expected which was good news not only for the leading manufacturers but also for component suppliers. The price of memory chips, perhaps one of the most commoditized parts of the supply chain, also increased significantly during the year as a combination of financial distress amongst some Taiwanese manufacturers and the transition to next generation chips caused manufacturing capacity to tighten.
The Chinese stimulus effort to boost its domestic economy had perhaps the most profound impact in Asia and further afield as commodity prices rose. A massive increase in new lending and a sharp increase in infrastructure investment combined with tax breaks and other incentives to boost consumption saw Chinese steel production and demand for raw materials hit record highs. Steel producers across the region benefited from rising steel prices while commodity producers such as Australia and Indonesia saw their currencies strengthen as coal and iron ore spot prices rallied. South Korean efforts to support its domestic economy have been similarly successful marking a significant change from the start of the year. Of all the Asian economies, Korea's most resembled the developed world in terms of overall indebtedness. Household finances remain strong however, and the mixture of government spending and other support measures saw consumer confidence h it a seven-year high.
The political environment in Asia was stable in the larger economies. Indonesian elections passed without incident with President Yudhoyono, the incumbent, winning comfortably as was expected. Overall this has been a good year for Indonesia with inflation
16
ASIA FOCUS FUND
and interest rates falling, commodity export prices rising, improving domestic confidence and a stronger currency. The situation in Thailand, by contrast, is much less certain. There remain sharp differences within Thailand between those who support the exiled former Prime Minister Thaksin Shinawatra and present government. Tensions between Thailand and neighbouring Cambodia are also rising.
One of the more intriguing developments this year has been the warming of relations between Taiwan and Mainland China. Negotiations during the course of the year are opening the way not only to direct transport links between the two but also direct financial links with the prospect of investments by Mainland Chinese entities into Taiwanese companies and banks as well as higher level technology transfers by Taiwanese IT manufacturers operating in China. Although it will take time before such matters become concrete the progress made in 2009 represents a significant change in relations between the two.
2. Portfolio Position
The portfolio remains positioned as it was at the beginning of 2009, to potentially benefit from the current recovery in domestic-led economic growth in Asia. The Fund is overweight in Energy, Materials and Industrials and remains underweight in Financials, Real Estate and Technology. The Fund also has more modest overweight positions in consumer stocks and telecoms which were beneficiaries of the increase in consumer spending that we have seen over the course of the year.
3. Outlook
The outlook for the coming year in our opinion will be dominated by policy decisions both in Asia and in the developed world over how and when to withdraw some of the stimulus that was thrown at their economies to stave off the worst effects of the credit crisis. For Asia, the reaction of the Chinese following last year's blow-out credit expansion will be of particular importance. We believe that government concerns have been heightened about rising inflation and the formation of asset bubbles that were the expansion seen in 2009 to continue at the same pace. We still continue to have a positive view on China and believe that measures employed to restrain growth will be moves to preventative rather than reactive.
Outside China, we believe that a gradually improving global economy and increasing corporate spending should benefit exporters especially those in the technology area. In both Korea and Indonesia strength in the domestic economies could offer opportunities amongst financial and consumer stocks. We still feel that Asian economic growth will be better relative to developed nations this year. The fundamentals of a solid economic recovery are in place in Asia, with relatively strong household, corporate and public sector balance sheets supporting our view.

Edmund Harriss
The Fund invests in foreign securities which will involve political, economic and currency risks, greater volatility, and differences in accounting methods. The Fund is non-diversified meaning its assets may be concentrated in fewer individual holdings than diversified funds. Therefore, the Fund is more exposed to individual stock volatility than diversified funds. The Fund invests in smaller companies, which will involve additional risks such as limited liquidity and greater volatility.
The MSCI All Country Far East Free ex-Japan Index (MSCI AC Far East Free ex-Japan Index) is a free float-adjusted, capitalization-weighted index that is designed to measure equity market performance in the Asia region excluding Japan. The Standard & Poor's 500 Index is a market-capitalization weighted index composed of 500 widely held common stocks of U.S. companies. These indices are unmanaged, not available for investment and do not incur expenses.
Please refer to the Schedule of Investments for details on fund holdings. Current and future portfolio holdings are subject to risk.
The information provided herein represents the opinion of Guinness Atkinson Management for the period stated and is not intended to be a forecast of future events, a guarantee of future results, nor investment advice. Opinions, fund holdings and sector allocations are subject to change at any time are not recommendations to buy or sell any security.
17
ASIA FOCUS FUND
Growth of $10,000
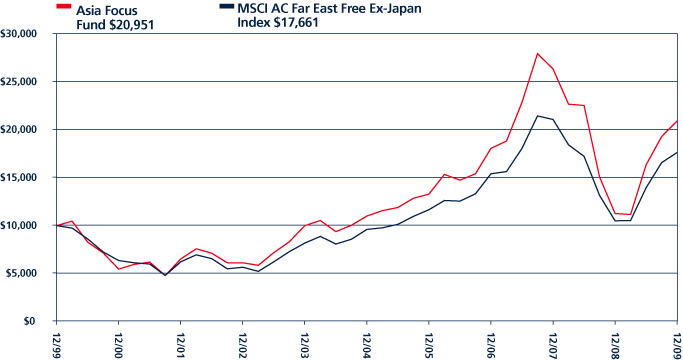
Average Annual Total Return
Periods Ended December 31, 2009
| One Year | | Five Years | | Ten Years | |
| | 86.05 | % | | | 13.75 | % | | | 7.68 | % | |
Performance data quoted represents past performance and does not guarantee future results. The investment return and principal value of an investment will fluctuate so that an investor's shares, when redeemed, may be worth more or less than their original cost. Current performance of the Funds may be lower or higher than the performance quoted. Performance data current to the most recent month end may be obtained by visiting www.gafunds.com.
Total returns reflect a fee waiver in effect and in the absence of this waiver, the total returns would be lower. The Fund imposes a 2% redemption fee on shares held less than 30 days.
The MSCI All Country Far East Free ex-Japan Index (MSCI AC Far East Free ex-Japan Index) is a free float-adjusted, capitalization-weighted index that is designed to measure equity market performance in the Asia region excluding Japan. The index referenced in this chart is not available for investment and does not incur expenses.
18
FUND HIGHLIGHTS at December 31, 2009
GUINNESS ATKINSON ASIA FOCUS FUND
| # of Holdings in Portfolio: | | | 46 | | |
| Portfolio Turnover: | | | 31.4 | % | |
| % of Stocks in Top 10: | | | 33.5 | % | |
| Fund Managers: | |
| Edmund Harriss | | | | | |
| Timothy W. N. Guinness | | | | | |
| Top 10 Holdings (% of net assets) | | | | Country Breakdown (% of net assets) | | | |
| CNPC Hong Kong Ltd. | | | 4.0 | % | | China | | | 26.1 | % | |
| Hyundai Mobis | | | 3.9 | % | | Hong Kong | | | 20.1 | % | |
| Dongfang Electric Corp., Ltd. | | | 3.8 | % | | South Korea | | | 12.6 | % | |
| POSCO | | | 3.5 | % | | Taiwan | | | 11.0 | % | |
| Indo Tambangraya Megah PT | | | 3.4 | % | | Thailand | | | 9.5 | % | |
| Indofood Agri Resources Ltd. | | | 3.2 | % | | Singapore | | | 8.7 | % | |
| Samsung Electronics Co., Ltd. | | | 3.0 | % | | Indonesia | | | 7.5 | % | |
| Angang Steel Co., Ltd. | | | 3.0 | % | | Malaysia | | | 2.1 | % | |
| PetroChina Co., Ltd. | | | 2.9 | % | | | | | | | |
| HSBC Holdings PLC | | | 2.8 | % | | | | | | | |
| Sector Breakdown (% of Investments) | |
| Coal | | | 11.0 | % | | Tobacco | | | 2.2 | % | |
| Steel-Producers | | | 9.0 | % | | Chemicals-Other | | | 2.2 | % | |
| Transportation-Marine | | | 8.0 | % | | Electric-Generation | | | 2.1 | % | |
| Oil Company-Exploration & Production | | | 8.0 | % | | Cellular Telecom | | | 2.0 | % | |
| Telecom Services | | | 6.9 | % | | Internet Content-Entertainment | | | 1.8 | % | |
| Oil Company-Integrated | | | 5.2 | % | | Retail-Apparel/Shoe | | | 1.6 | % | |
| Computers | | | 5.0 | % | | Metal Processors & Fabrica | | | 1.6 | % | |
| Auto/Truck Parts & Equipment | | | 4.0 | % | | Public Thoroughfares | | | 1.6 | % | |
| Power Conversion/Supply Equipment | | | 3.9 | % | | Oil-Field Services | | | 1.4 | % | |
| Agricultural Operations | | | 3.3 | % | | Non-Ferrous Metals | | | 1.4 | % | |
| Electronic Compo-Semicon | | | 3.1 | % | | Web Portals/ISP | | | 1.2 | % | |
| Commercial Banks | | | 2.9 | % | | Agricultural Biotech | | | 1.2 | % | |
| ETFs | | | 2.7 | % | | Engineering/R&D Services | | | 0.8 | % | |
| Metal-Copper | | | 2.6 | % | | Computers-Peripheral Equipment | | | 0.8 | % | |
| Auto-Cars/Light Trucks | | | 2.3 | % | | Machinery-General Industries | | | 0.2 | % | |
19
SCHEDULE OF INVESTMENTS
December 31, 2009
GUINNESS ATKINSON ASIA FOCUS FUND
| Shares | | COMMON STOCKS: 97.6% | | Value | |
| China: 26.1% | | | |
| | 1,524,000 | | | Angang Steel Co., Ltd. | | $ | 3,323,222 | | |
| | 520,000 | | | China Shenhua Energy Co., Ltd. | | | 2,524,234 | | |
| | 1,766,000 | | | China Shipping Development Co., Ltd. | | | 2,626,428 | | |
| | 796,000 | | | Dongfang Electric Corp., Ltd. | | | 4,244,413 | | |
| | 1,548,000 | | | iShares FTSE/Xinhua A50 CHINA Index ETF | | | 2,978,843 | | |
| | 1,220,000 | | | Jiangxi Copper Co., Ltd. | | | 2,853,155 | | |
| | 48,850 | | | Perfect World Co., Ltd. - ADR* | | | 1,926,644 | | |
| | 2,748,000 | | | PetroChina Co., Ltd. | | | 3,266,949 | | |
| | 3,500,000 | | | Shenzhen Expressway Co., Ltd. | | | 1,715,963 | | |
| | 23,250 | | | Sohu.com, Inc.* | | | 1,331,760 | | |
| | 1,174,800 | | | Yanzhou Coal Mining Co., Ltd. | | | 2,569,426 | | |
| | | | 29,361,037 | | |
| Hong Kong: 20.1% | | | |
| | 618,000 | | | Chen Hsong Holdings | | | 174,766 | | |
| | 241,500 | | | China Mobile Ltd. | | | 2,247,036 | | |
| | 1,456,000 | | | CNOOC Ltd. | | | 2,268,355 | | |
| | 3,394,000 | | | CNPC Hong Kong Ltd. | | | 4,475,795 | | |
| | 4,052,000 | | | Denway Motors Ltd. | | | 2,559,741 | | |
| | 265,132 | | | Esprit Holdings Ltd. | | | 1,759,059 | | |
| | 5,336,000 | | | Global Bio-Chem Technology Group Co., Ltd. | | | 1,306,368 | | |
| | 278,466 | | | HSBC Holdings PLC | | | 3,167,532 | | |
| | 609,000 | | | Kingboard Chemical Holdings Ltd. | | | 2,399,397 | | |
| | 3,064,000 | | | Pacific Basin Shipping Ltd. | | | 2,196,023 | | |
| | | | 22,554,072 | | |
| Indonesia: 7.5% | | | |
| | 720,000 | | | Bumi Resources Tbk PT | | | 183,322 | | |
| | 1,146,000 | | | Indo Tambangraya Megah PT | | | 3,873,758 | | |
| | 3,978,000 | | | International Nickel Indonesia Tbk PT | | | 1,537,514 | | |
| | 2,883,000 | | | Telekomunikasi Indonesia Tbk PT | | | 2,869,814 | | |
| | | | 8,464,408 | | |
| Malaysia: 2.1% | | | |
| | 367,700 | | | DiGi.Com Bhd | | | 2,357,006 | | |
| Singapore: 8.7% | | | |
| | 1,897,000 | | | Ausgroup Ltd. | | | 896,209 | | |
| | 2,181,000 | | | Indofood Agri Resources Ltd.* | | | 3,584,674 | | |
| | 1,085,650 | | | Singapore Telecommunications Ltd. | | | 2,391,235 | | |
| | 1,613,000 | | | Straits Asia Resources Ltd. | | | 2,971,222 | | |
| | | | 9,843,340 | | |
| South Korea: 12.6% | | | |
| | 30,055 | | | Hyundai Mobis | | | 4,404,235 | | |
| | 43,500 | | | KT&G Corp | | | 2,406,176 | | |
| | 7,370 | | | POSCO | | | 3,886,728 | | |
| | 4,995 | | | Samsung Electronics Co., Ltd. | | | 3,425,221 | | |
| | | | 14,122,360 | | |
The accompanying notes are an integral part of these financial statements.
20
| Shares | | COMMON STOCKS: 97.6% Continued | | Value | |
| Taiwan: 11.0% | | | |
| | 2,563,550 | | | China Steel Corp. | | $ | 2,643,330 | | |
| | 231,750 | | | HTC Corp. | | | 2,655,062 | | |
| | 575,000 | | | Lite-On Technology Corp. | | | 863,886 | | |
| | 351,469 | | | Shin Zu Shing Co., Ltd. | | | 1,750,395 | | |
| | 823,000 | | | U-Ming Marine Transport Corp. | | | 1,664,598 | | |
| | 1,450,844 | | | Wistron Corp. | | | 2,809,503 | | |
| | | | 12,386,774 | | |
| Thailand: 9.5% | | | |
| | 234,500 | | | Electricity Generating PCL | | | 555,654 | | |
| | 1,734,000 | | | Glow Energy PCL | | | 1,716,317 | | |
| | 2,640,716 | | | Mermaid Maritime PCL* | | | 1,579,147 | | |
| | 467,000 | | | PTT Exploration & Production PCL | | | 2,059,058 | | |
| | 326,700 | | | PTT PCL | | | 2,410,564 | | |
| | 2,865,100 | | | Thoresen Thai Agencies PCL | | | 2,341,751 | | |
| | | | 10,662,491 | | |
| | | | | Total Common Stocks
(cost $100,166,104) | | | 109,751,488 | | |
| | | | | Total Investments in Securities
(cost $100,166,104): 97.6% | | | 109,751,488 | | |
| | | | | Other Assets less Liabilities: 2.4% | | | 2,669,801 | | |
| | | | | Net Assets: 100% | | $ | 112,421,289 | | |
* Non-income producing security.
ADR - American Depository Receipt
The accompanying notes are an integral part of these financial statements.
21
ASIA PACIFIC DIVIDEND FUND for the period ended December 31, 2009
1. Performance
ANNUALIZED TOTAL RETURNS
| | | 1 Year
(actual) | | 3 Year | | Since
Launch | |
| Fund | | | 64.84 | % | | | 0.16 | % | | | 2.85 | % | |
| Benchmark Index: | |
| MSCI Pacific Ex Japan | | | 71.51 | % | | | 4.98 | % | | | 9.97 | % | |
| S&P 500 | | | 26.47 | % | | | -5.61 | % | | | -1.80 | % | |
The Fund's gross expense ratio is 2.33% per the Summary Prospectus dated May 1, 2009. Guinness Atkinson Asset Management has contractually agreed to waive a portion of its advisory fees so that the Fund's ratio of expenses to average daily net assets will not exceed 1.98% (excluding Acquired Fund Fees and Expenses, interest, taxes, dividends on short positions and extraordinary expenses) through at least June 30, 2010. To the extent that the Advisor waives fees it may seek repayment of a portion or all of such amounts at any time within the three fiscal years after the fiscal year in which such amounts were waived, subject to the applicable cap.
Performance data quoted represents past performance and does not guarantee future results. The investment return and principal value of an investment will fluctuate so that an investor's shares, when redeemed, may be worth more or less than their original cost. Current performance of the Funds may be lower or higher than the performance quoted. Performance data current to the most recent month end may be obtained by visiting www.gafunds.com, or calling (800) 916-6566.
The Fund imposes a 2% redemption fee on shares held less than 30 days. Performance data quoted does not reflect the 2% redemption fee on shares held less than 30 days. Total Returns for prior periods reflect a fee waiver in effect and in the absence of this waiver, the total return would be lower.
This year marked a good recovery for equity markets from the lows of 2008, and the second half of 2009 continued the upbeat performance begun in the first half of 2009. 2009 was a decent year for the Fund both on a relative and absolute basis. The Fund underperformed its benchmark, however, this is typical of income-led funds in a rising market.
Looking at the areas which have driven market performance this year, China's monetary and fiscal stimulus packages have been central to China's positive performance, and have driven strong growth in imports to China, particularly of raw materials and energy. The Chinese stimulus has focused on fixed asset investment with loose monetary policy, and in the second half of 2009 a number of projects initiated in the first half of the year kicked off. This meant that demand for goods such as steel, copper and aluminium improved, whilst coal and iron ore imports to China also picked up to support this demand. In addition, in the second half of 2009 there was a pick-up in technology exports from Taiwan and South Korea. This was in line with historical seasonality, but the strength of the recovery in Information Technology has been somewhat better than we had previously expected.
Considering the fundamentals of Asia, we have continued to be pleased at the reasonably low level of non-performing loans reported by banks in the region in the second half of 2009. These have been low relative to the experience of the Asian crisis of 1997/8, and the region has so far avoided the systemic failures which have plagued many developed nations in recent years. Asian consumers have also reacted well to the economic dislocation of 2008, and, for example, retail sales have continued to be decent relative to historical levels in the second half of 2009. Based on this evidence, we remain optimistic that Asia as a region has missed the worst of the economic dislocation from 2008, and can resume economic growth ahead of the developed nations.
Balanced against this positive outlook is the concern that Asia is pulling in liquidity from loose monetary policies elsewhere in the world. This has been manifested so far as strength in currencies which are traditionally seen as relatively high risk, such as the Indonesian Rupiah and the Korean Won. The underlying equity markets in these countries have also done well in the second half. We can also see this liquidity in good relative performance for 'hard' assets such as property. This is clear both in Hong Kong property, which effectively imports low US interest rates through its peg to the US Dollar, and in China, where prices of property in some urban areas has already recovered above 2007 peaks.
22
ASIA PACIFIC DIVIDEND FUND
2. Portfolio Position
The portfolio positioning has been consistent this year, with overweight positions relative to the benchmark, in Hong Kong, Thailand and Singapore. During the second half, the Fund has been underweight in Australia and South Korea. Considering the sector breakdown, the Fund is overweight in sectors with good cashflow characteristics, such as Telecoms and Utilities. The Fund is also overweight in sectors related to China's fixed asset investment, such as Materials. It is most underweight in Financials and real estate stocks.
3. Outlook
Considering the fiscal and monetary stimulus which has taken place in recent quarters, 2010 is likely to be the year in which some of these exceptional policies are unwound. In particular, the monetary stimulus in the developed world could be reduced, with policymakers needing to balance the risks of inflation with the potential for a prolonged period of below-trend growth of the economy. There is still uncertainty as to whether this can be done successfully, avoiding policy errors. In China, the fiscal stimulus substantially took place in 2009, and we infer from the strong imports of basic materials, and the increasing trend in steel prices, that many projects are now underway. There has been a good reaction in economic growth, but now the monetary stimulus is also being withdrawn, and this introduces further risks to growth, if it is withdrawn too quickly. In Asia, we will be closely watching the outlying markets, such as Indonesia, Thaila nd and the Philippines, for signs of a pullback in risk appetite by equity investors.
Given this outlook, we still feel that Asian economic growth could outperform relative to developed nations this year. The fundamentals of a solid economic recovery are in place in Asia, with relatively strong household, corporate and public sector balance sheets underlying our view. We would also highlight that, although it is probably mostly priced in to equities, the fiscal stimulus in China has had the desired effect of improving economic growth in the second half of 2009. This contrasts with the still anaemic growth outlook of the developed world.
For us to have greater confidence for 2010 and beyond, we would like to see more evidence of the recovery of exports from the Asian region. There are still headwinds in terms of slow developed world growth, and the possible further appreciation of Asian currencies, relative to developed world currencies. On balance, we are optimistic that export growth can pick up in 2010. We can already see some signs of recovery in the Information Technology and Semiconductor industries, and we are cognisant that Microsoft has recently launched a new PC operating system which traditionally drives fresh hardware and software spending. In addition, corporate capital expenditure in the developed world is at historically low levels, and we feel there is some potential for a rebound.
To conclude, in our view, Asia is well positioned for 2010 relative to other regions in terms of its economic growth outlook. Risks to global growth remain, principally in poor timing by policy makers in unwinding current economic stimulus measures. Given this background, we can still find attractively valued stocks in Asia paying reasonable dividends, and we are optimistic for 2010.

Edmund Harriss
The Fund invests in foreign securities which will involve political, economic and currency risks, greater volatility, and differences in accounting methods. The Fund is non-diversified meaning its assets may be concentrated in fewer individual holdings than diversified funds. Therefore, the Fund is more exposed to individual stock volatility than diversified funds. The Fund invests in smaller companies, which will involve additional risks such as limited liquidity and greater volatility.
The Standard & Poor's 500 Index is a market-capitalization weighted index composed of 500 widely held common stocks of U.S. companies. The MSCI Pacific ex-Japan Index is a free float-adjusted, capitalization-weighted index that is designed to measure equity market performance in the Pacific region including Japan. These indices are unmanaged, not available for investment and do not incur expenses.
Please refer to the Schedule of Investments for details on fund holdings. Current and future portfolio holdings are subject to risk.
The information provided herein represents the opinion of Guinness Atkinson Management for the period stated and is not intended to be a forecast of future events, a guarantee of future results, nor investment advice. Opinions, fund holdings and sector allocations are subject to change at any time are not recommendations to buy or sell any security.
23
ASIA PACIFIC DIVIDEND FUND
Growth of $10,000
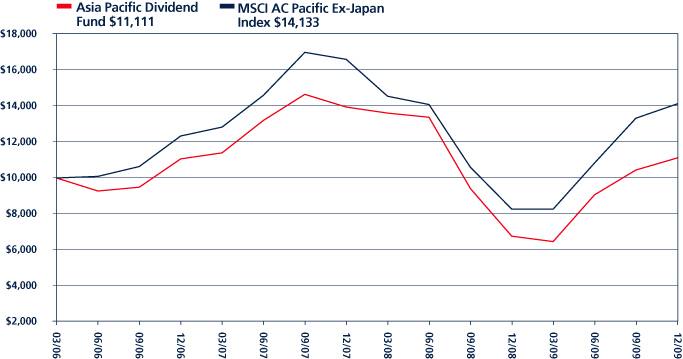
Average Annual Total Return
Periods Ended December 31, 2009
| One Year | | Since Inception
(03/31/06) | |
| | 64.84 | % | | | 2.85 | % | |
Performance data quoted represents past performance and does not guarantee future results. The investment return and principal value of an investment will fluctuate so that an investor's shares, when redeemed, may be worth more or less than their original cost. Current performance of the Funds may be lower or higher than the performance quoted. Performance data current to the most recent month end may be obtained by visiting www.gafunds.com.
Total returns reflect a fee waiver in effect and in the absence of this waiver, the total returns would be lower. The Fund imposes a 2% redemption fee on shares held less than 30 days.
The MSCI All Country Pacific Free ex-Japan Index (MSCI AC Pacific ex-Japan Index) is a free float-adjusted, capitalization-weighted index that is designed to measure equity market performance in the Pacific region including Japan.
24
FUND HIGHLIGHTS at December 31, 2009
GUINNESS ATKINSON ASIA PACIFIC DIVIDEND FUND
| # of Holdings in Portfolio: | | | 36 | | |
| Portfolio Turnover: | | | 26.0 | % | |
| % of Stocks in Top 10: | | | 36.1 | % | |
| Fund Managers: | |
| Edmund Harriss | |
| Timothy W. N. Guinness | |
| Top 10 Holdings (% of net assets) | | | | Country Breakdown (% of net assets) | | | |
| Yanzhou Coal Mining | | | 4.1 | % | | Hong Kong | | | 21.6 | % | |
| Angang New Steel Co. | | | 3.9 | % | | Taiwan | | | 18.7 | % | |
| POSCO | | | 3.9 | % | | China | | | 16.9 | % | |
| Incitec Pivot Ltd. | | | 3.8 | % | | Thailand | | | 13.5 | % | |
| United Overseas Bank | | | 3.7 | % | | South Korea | | | 9.7 | % | |
| CHI Steel Corp. | | | 3.6 | % | | Singapore | | | 6.7 | % | |
| Compal Electronics | | | 3.4 | % | | Australia | | | 3.8 | % | |
| Depo Auto Parts Ind | | | 3.3 | % | | Indonesia | | | 3.2 | % | |
| Vtech Holdings Ltd. | | | 3.3 | % | | Malaysia | | | 3.2 | % | |
| PT Telekomunikasi | | | 3.2 | % | | Philippines | | | 2.8 | % | |
| | | | | | | New Zealand | | | 0.6 | % | |
| Sector Breakdown (% of Investments) | |
| Commercial Banks | | | 12.3 | % | | Diversified Financial Services | | | 3.1 | % | |
| Telecom Services | | | 12.1 | % | | Electric-Generation | | | 3.0 | % | |
| Steel-Producers | | | 11.3 | % | | Petrochemicals | | | 2.8 | % | |
| Transport-Marine | | | 9.9 | % | | Tobacco | | | 2.7 | % | |
| Computers | | | 6.5 | % | | Food-Meat Products | | | 2.7 | % | |
| Oil Company-Integrated | | | 5.7 | % | | Electric-Integrated | | | 2.7 | % | |
| Coal | | | 4.0 | % | | Semiconductor Components-Integrated Circuit | | | 2.6 | % | |
| Agricultural Chemicals | | | 3.7 | % | | Chemicals-Plastics | | | 2.5 | % | |
| Auto/Trucks Parts & Equipment | | | 3.3 | % | | Retail-Hair Salons | | | 1.3 | % | |
| Telecommunication Equipment | | | 3.2 | % | | Computers-Peripher Equip | | | 0.9 | % | |
| Retail-Apparel/Shoe | | | 3.1 | % | | Oil Refining&Marketing | | | 0.6 | % | |
25
SCHEDULE OF INVESTMENTS
December 31, 2009
GUINNESS ATKINSON ASIA PACIFIC DIVIDEND FUND
| Shares | | COMMON STOCKS: 100.7% | | Value | |
| Australia: 3.8% | | | |
| | 135,569 | | | Incitec Pivot Ltd. | | $ | 428,816 | | |
| China: 16.9% | | | |
| | 203,801 | | | Angang Steel Co., Ltd. | | | 444,407 | | |
| | 236,000 | | | China Shipping Development Co., Ltd. | | | 350,984 | | |
| | 698,000 | | | People's Food Holdings Ltd. | | | 308,246 | | |
| | 196,000 | | | PetroChina Co., Ltd. | | | 233,014 | | |
| | 1,060 | | | PetroChina Co., Ltd. - ADR | | | 126,097 | | |
| | 212,000 | | | Yanzhou Coal Mining Co., Ltd. | | | 463,669 | | |
| | | | 1,926,417 | | |
| Hong Kong: 21.6% | | | |
| | 145,500 | | | BOC Hong Kong Holdings Ltd. | | | 326,890 | | |
| | 45,000 | | | CLP Holdings Ltd. | | | 304,540 | | |
| | 53,285 | | | Esprit Holdings Ltd. | | | 353,525 | | |
| | 6,024 | | | HSBC Holdings PLC - ADR | | | 343,910 | | |
| | 146,000 | | | Industrial & Commercial Bank of China Asia Ltd. | | | 316,235 | | |
| | 1,863,000 | | | Modern Beauty Salon Holdings Ltd. | | | 148,398 | | |
| | 414,300 | | | Pacific Basin Shipping Ltd. | | | 296,936 | | |
| | 39,000 | | | VTech Holdings Ltd. | | | 371,976 | | |
| | | | 2,462,410 | | |
| Indonesia: 3.2% | | | |
| | 367,500 | | | Telekomunikasi Indonesia Tbk PT | | | 365,819 | | |
| Malaysia: 3.2% | | | |
| | 56,100 | | | DiGi.Com Bhd | | | 359,609 | | |
| New Zealand: 0.6% | | | |
| | 24,150 | | | New Zealand Refining Co., Ltd. | | | 65,567 | | |
| Philippines: 2.8% | | | |
| | 16,000 | | | Globe Telecom, Inc. | | | 314,661 | | |
| Singapore: 6.7% | | | |
| | 158,000 | | | Singapore Telecommunications Ltd. | | | 348,008 | | |
| | 30,000 | | | United Overseas Bank Ltd. | | | 417,591 | | |
| | | | 765,599 | | |
| South Korea: 9.7% | | | |
| | 6,930 | | | KB Financial Group, Inc. | | | 352,877 | | |
| | 5,680 | | | KT&G Corp. | | | 314,186 | | |
| | 830 | | | POSCO | | | 437,718 | | |
| | | | 1,104,781 | | |
The accompanying notes are an integral part of these financial statements.
26
| Shares | | COMMON STOCKS: 100.7% Continued | | Value | |
| Taiwan: 18.7% | | | |
| | 400,788 | | | China Steel Corp. | | $ | 413,261 | | |
| | 280,388 | | | Compal Electronics, Inc. | | | 387,302 | | |
| | 141,400 | | | Depo Auto Parts Ind Co., Ltd. | | | 372,913 | | |
| | 292,007 | | | Greatek Electronics, Inc. | | | 299,391 | | |
| | 31,700 | | | HTC Corp. | | | 363,173 | | |
| | 70,000 | | | Lite-On Technology Corp. | | | 105,169 | | |
| | 94,000 | | | U-Ming Marine Transport Corp. | | | 190,124 | | |
| | | | 2,131,333 | | |
| Thailand: 13.5% | | | |
| | 342,900 | | | Glow Energy PCL | | | 339,403 | | |
| | 149,300 | | | PTT Chemical PCL | | | 322,423 | | |
| | 39,500 | | | PTT PCL | | | 291,452 | | |
| | 516,300 | | | Thai Plastic & Chemical PCL | | | 284,941 | | |
| | 367,840 | | | Thoresen Thai Agencies PCL | | | 300,649 | | |
| | | | 1,538,868 | | |
| | | | | Total Common Stock
(cost $12,984,444) | | | 11,463,880 | | |
| | | | | Total Investments in Securities
(cost $12,984,444): 100.7% | | | 11,463,880 | | |
| | | | | Liabilities in Excess of Other Assets: (0.7)% | | | (84,538 | ) | |
| | | | | Net Assets: 100% | | $ | 11,379,342 | | |
ADR - American Depository Receipt
The accompanying notes are an integral part of these financial statements.
27
CHINA & HONG KONG FUND for the period ended December 31, 2009
1. Performance
AVERAGE ANNUALIZED TOTAL RETURNS
| | | 1 Year
(actual) | | 3 Years | | 5 Years | | 10 Years | |
| Fund | | | 92.76 | % | | | 13.15 | % | | | 16.62 | % | | | 9.51 | % | |
| Benchmark Index: | |
| Hang Seng Composite | | | 58.61 | % | | | 6.42 | % | | | 14.47 | % | | | N/A | | |
| Hang Seng | | | 56.44 | % | | | 6.42 | % | | | 12.67 | % | | | 5.97 | % | |
| S&P 500 | | | 26.47 | % | | | -5.61 | % | | | -0.42 | % | | | -0.95 | % | |
The Fund's gross expense ratio is 1.53% per the Summary Prospectus dated May 1, 2009. Guinness Atkinson Asset Management has contractually agreed to waive a portion of its advisory fees so that the Fund's ratio of expenses to average daily net assets will not exceed 1.98% (excluding Acquired Fund Fees and Expenses, interest, taxes, dividends on short positions and extraordinary expenses) through at least June 30, 2010. To the extent that the Advisor waives fees it may seek repayment of a portion or all of such amounts at any time within the three fiscal years after the fiscal year in which such amounts were waived, subject to the applicable cap.
Performance data quoted represents past performance and does not guarantee future results. The investment return and principal value of an investment will fluctuate so that an investor's shares, when redeemed, may be worth more or less than their original cost. Current performance of the Funds may be lower or higher than the performance quoted. Performance data current to the most recent month end may be obtained by visiting www.gafunds.com, or calling (800) 916-6566.
The Fund imposes a 2% redemption fee on shares held less than 30 days. Performance data quoted does not reflect the 2% redemption fee on shares held less than 30 days. Total Returns for prior periods reflect a fee waiver in effect and in the absence of this waiver, the total return would be lower.
We are pleased to report to shareholders that the Fund performed strongly during 2009 as China's efforts to reflate the domestic economy restored investors' confidence. The best performing sectors over the year were Consumer, Materials, Industrials and Real Estate. The weakest sectors were Telecommunications and Utilities. There were also strong performances to be found in the Energy sector amongst the coal miners and in the Financial sector amongst the banks whilst insurers moved in line with the broader market.
At the beginning of the crisis the Chinese government mobilized resources to drive growth in the domestic economy in the face of a collapse in external demand for manufactured goods for export and a policy-engineered slow down in real estate activity stemming from sharp house price increases in 2007. The combined effect of these two developments was job losses of 10-20 million making job creation a critical part of any stimulus program.
The announcement in November 2008 of a $586 billion spending program was rapidly augmented by substantial growth in lending, adjustments to taxes and incentives to increase private consumption. Infrastructure spending and investment was supported through the year by new lending from banks that topped $1.4 trillion. Consumer spending was boosted by subsidies offered for purchases of household appliances while subsidies for car purchases pushed total auto sales above those of the US for the first time.
Real estate transactions accelerated from May and by the last quarter of 2009 had pushed down inventories of unsold units to very low levels. The result was a rapid pick up in construction activity in this sector has been the result. It is against this backdrop of rapid increases in domestic investment and construction that we saw steel production pass 600 million tonnes on an annualized basis and is the reason we have seen record imports of iron ore, coal, copper and oil over the past year.
By the end of the year there were market concerns at the pace of expansion. The economy grew 8.7% for the full year but the massive expansion in bank lending has pushed money supply growth to almost 30%, well above the target level at the beginning of the year of 17%. This has given rise to fears of price inflation and asset bubbles. The central bank recognized this and began to temper some of the stimulus policies. Notably, it kept those most directly related to private consumption and first-time home buyers in place.
Longer term structural changes were also proposed during the year which we believe are designed to boost consumption by unlocking household savings and to introduce more flexibility into China's labour market. The proposal to spend up to $125 billion to provide basic health cover to 90% of the population by 2011 is a significant policy step, in terms of the breadth of ambition, to
28
CHINA & HONG KONG FUND
address welfare reform and unlock savings. Changes have also been proposed to workers' pension arrangements as well as to the system of residence permits in China. If enacted, this should lead to much greater flexibility in the movement of labor in China as well as provide extra impetus to the process of urbanization, in our view.
2. Portfolio Position
The portfolio remains positioned towards sectors that should benefit from investment growth such as Industrials, Materials and Energy. The Fund also has exposure to Consumer Discretionary stocks, particularly auto makers. In addition, the Fund also has a meaningful exposure to Technology in the form of computer services, internet and online gaming companies and alternative energy.
3. Outlook
The outlook for the world economy remains highly uncertain in respect of the unprecedented government and central bank intervention to stave off a synchronised global recession. How and when we extricate ourselves from this without either triggering the slump we sought to avoid on the one hand, or on the other avoid staying too long and allowing inflation to take hold are matters of huge debate.
Chinese policy is going to be particularly relevant. The current growth rates in real estate prices, construction activity, steel production and money supply will need to slow to a more sustainable rate. This is something investors will have to come to terms with in the coming year.
We expect that policy adjustments are likely to follow a similar pattern to those employed back in 2006/7, by restricting excess liquidity by means of central bank operations and controls over the quantity and direction of new lending. Consumer price inflation is set to rise we believe in the coming year. We do not expect the rise to be excessive but it might be enough to act as a disincentive for savers to keep cash on deposit and could prompt them to switch into other assets such as property or stocks. This could trigger a rise in interest rates as a means of reducing the likelihood of such a switch; but we do not believe interest rates are a favored tool for restraining growth given the blunt nature of the instrument and the degree to which conditions vary across the economy.
The Chinese government remains supportive of growth given the long term need to create jobs to absorb the estimated 12 million people entering the workforce each year. Policy is also directed toward rebalancing the economy and reducing the role of investment in favour of consumption. The main hurdle is to adjust expectations in 2010 following the massive liquidity expansion in 2009, a process that began in mid-January with introduction of lending restrictions on the banks after a racing start in the first three weeks of the year.
Once such expectations have adjusted we believe that investors will see a positive picture emerge of good growth that could be sustained in 2011.

Edmund Harriss
The Fund invests in foreign securities which will involve political, economic and currency risks, greater volatility, and differences in accounting methods. The Fund is non-diversified meaning its assets may be concentrated in fewer individual holdings than diversified funds. Therefore, the Fund is more exposed to individual stock volatility than diversified funds. The Fund invests in smaller companies, which will involve additional risks such as limited liquidity and greater volatility.
The Hang Seng Composite Index is a market-capitalization weighted index that comprises the top 200 companies listed on the Hong Kong Stock Exchange, based on the average market-capitalization for the past twelve months. The Hang Seng Composite Index commenced on January 3, 2000 and therefore does not have returns since the Fund's inception. The Hang Seng Index is a barometer of the Hong Kong Stock Market whose aggregate market capitalization accounts for about 70% of the total market-capitalization of the Stock Exchange of Hong Kong Limited. The Standard & Poor's 500 Index is a market-capitalization weighted index composed of 500 widely held common stocks of U.S. companies. These indices are unmanaged, not available for investment and do not incur expenses.
Please refer to the Schedule of Investments for details on fund holdings. Current and future portfolio holdings are subject to risk.
The information provided herein represents the opinion of Guinness Atkinson Management for the period stated and is not intended to be a forecast of future events, a guarantee of future results, nor investment advice. Opinions, fund holdings and sector allocations are subject to change at any time and are not recommendations to buy or sell any security.
29
CHINA & HONG KONG FUND
Growth of $10,000
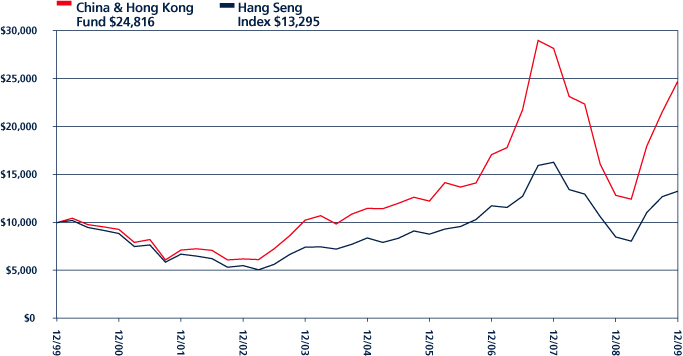
Average Annual Total Return
Periods Ended December 31, 2009
| One Year | | Five Years | | Ten Years | |
| | 92.76 | % | | | 16.62 | % | | | 9.51 | % | |
Performance data quoted represents past performance and does not guarantee future results. The investment return and principal value of an investment will fluctuate so that an investor's shares, when redeemed, may be worth more or less than their original cost. Current performance of the Funds may be lower or higher than the performance quoted. Performance data current to the most recent month end may be obtained by visiting www.gafunds.com.
Total returns reflect a fee waiver in effect and in the absence of this waiver, the total returns would be lower. The Fund imposes a 2% redemption fee on shares held less than 30 days.
The Hang Seng Composite Index is a market-capitalization weighted index that comprises the top 200 companies listed on the Hong Kong Stock Exchange, based on the average market capitalization for the past twelve months. The Fund changed its benchmark from the Hang Seng to the Hang Seng Composite Index to more accurately reflect the market sectors in which the Fund invests. The Hang Seng Composite Index commenced on 01/31/00. The index referenced in this chart is not available for investment and does not incur expenses.
30
FUND HIGHLIGHTS at December 31, 2009
GUINNESS ATKINSON CHINA & HONG KONG FUND
| # of Holdings in Portfolio: | | | 44 | | |
| Portfolio Turnover: | | | 7.9 | % | |
| % of Stocks in Top 10: | | | 40.0 | % | |
| Fund Managers: | |
| Edmund Harriss | |
| Timothy W.N. Guinness | |
| Top 10 Holdings (% of net assets) | | | | Country Breakdown (% of net assets) | | | |
| Yanzhou Coal Mining Co., Ltd. | | | 5.4 | % | | China | | | 54.7 | % | |
| CNOOC Ltd. | | | 4.9 | % | | Hong Kong | | | 45.2 | % | |
| Weichai Power Co., Ltd. | | | 4.8 | % | | | | | | | |
| BYD Co., Ltd. | | | 4.5 | % | | | | | | | |
| China Mobile Ltd. | | | 3.9 | % | | | | | | | |
| CNPC Hong Kong Ltd. | | | 3.4 | % | | | | | | | |
| PetroChina Co., Ltd. | | | 3.4 | % | | | | | | | |
| iShares FTSE/Xinhua A50 CHINA Index ETF | | | 3.3 | % | | | | | | | |
| Beijing Enterprises Holdings Ltd. | | | 3.2 | % | | | | | | | |
| VTech Holdings Ltd. | | | 3.2 | % | | | | | | | |
| Sector Breakdown (% of Investments) | |
| Commercial Banks | | | 14.1 | % | | Computers | | | 2.4 | % | |
| Oil & Gas-Exploration & Production | | | 8.3 | % | | Chemicals-Other | | | 2.2 | % | |
| Coal | | | 7.4 | % | | Real Estate | | | 2.2 | % | |
| Auto/Truck Parts & Equipment | | | 4.8 | % | | Internet Application Software | | | 2.2 | % | |
| Batteries/Battery System | | | 4.5 | % | | Airlines | | | 2.0 | % | |
| Cellular Telecom | | | 3.9 | % | | Steel-Producers | | | 1.9 | % | |
| Transportation-Marine | | | 3.6 | % | | Internet Content-Entertainment | | | 1.8 | % | |
| Oil-Integrated | | | 3.4 | % | | Distribution/Wholesale | | | 1.6 | % | |
| ETFs | | | 3.3 | % | | Agricultural Operations | | | 1.5 | % | |
| Web Portals/ISP | | | 3.3 | % | | Diversified Operations | | | 1.3 | % | |
| Gas-Distribution | | | 3.2 | % | | Retail-Apparel/Shoe | | | 1.3 | % | |
| Telecommunication Equipment | | | 3.2 | % | | Public Thoroughfares | | | 1.1 | % | |
| Power Conversion/Supply Equipment | | | 3.2 | % | | Electronic Components-Semiconductor | | | 1.0 | % | |
| Real Estate Management/Service | | | 2.6 | % | | Agricultural Biotech | | | 0.9 | % | |
| Metal-Copper | | | 2.5 | % | | Machinery-General Industries | | | 0.4 | % | |
| Auto-Cars/Light Trucks | | | 2.4 | % | | Retail-Hair Salons | | | 0.1 | % | |
| Energy-Alternate Sources | | | 2.4 | % | | | | | | | |
31
SCHEDULE OF INVESTMENTS
December 31, 2009
GUINNESS ATKINSON CHINA & HONG KONG FUND
| Shares | | COMMON STOCKS: 99.9% | | Value | |
| Agricultural Biotech: 0.9% | | | |
| | 8,762,000 | | | Global Bio-Chem Technology Group Co., Ltd. | | $ | 2,145,127 | | |
| Agricultural Operations: 1.5% | | | |
| | 3,496,272 | | | Chaoda Modern Agriculture Holdings Ltd. | | | 3,721,739 | | |
| Airlines: 2.0% | | | |
| | 2,556,000 | | | Cathay Pacific Airways Ltd.* | | | 4,746,702 | | |
| Auto/Truck Parts & Equipment: 4.8% | | | |
| | 1,428,800 | | | Weichai Power Co., Ltd. | | | 11,459,221 | | |
| Auto – Cars/Light Trucks: 2.4% | | | |
| | 9,314,000 | | | Denway Motors Ltd. | | | 5,883,867 | | |
| Batteries – Battery System: 4.5% | | | |
| | 1,229,600 | | | BYD Co., Ltd. | | | 10,778,372 | | |
| Cellular Telecom: 3.9% | | | |
| | 1,018,000 | | | China Mobile Ltd. | | | 9,471,980 | | |
| Chemicals – Other: 2.2% | | | |
| | 1,385,000 | | | Kingboard Chemical Holdings Ltd. | | | 5,456,758 | | |
| Coal: 7.4% | | | |
| | 2,615,000 | | | China Coal Energy Co. | | | 4,745,105 | | |
| | 5,953,200 | | | Yanzhou Coal Mining Co., Ltd. | | | 13,020,350 | | |
| | | | 17,765,455 | | |
| Commercial Banks: 14.1% | | | |
| | 2,577,000 | | | BOC Hong Kong Holdings Ltd. | | | 5,789,658 | | |
| | 6,824,000 | | | China Construction Bank Corp. | | | 5,828,661 | | |
| | 244,650 | | | Dah Sing Financial Holdings Ltd. | | | 1,348,093 | | |
| | 377,000 | | | Hang Seng Bank Ltd. | | | 5,546,418 | | |
| | 614,691 | | | HSBC Holdings PLC | | | 6,992,069 | | |
| | 8,123,000 | | | Industrial & Commercial Bank of China | | | 6,689,788 | | |
| | 188,400 | | | Wing Hang Bank Ltd. | | | 1,753,327 | | |
| | | | 33,948,014 | | |
| Computers: 2.4% | | | |
| | 9,310,000 | | | Lenovo Group Ltd. | | | 5,769,549 | | |
| Distribution/Wholesale: 1.6% | | | |
| | 2,835,000 | | | Digital China Holdings Ltd. | | | 3,774,125 | | |
| Diversified Operations: 1.3% | | | |
| | 556,298 | | | Wharf Holdings Ltd. | | | 3,192,597 | | |
| Electronic Components – Semiconductor: 1.0% | | | |
| | 510,800 | | | Renesola Ltd. - ADR* | | | 2,431,408 | | |
The accompanying notes are an integral part of these financial statements.
32
| Shares | | COMMON STOCKS: 99.9% Continued | | Value | |
| Energy – Alternate Sources: 2.4% | | | |
| | 107,700 | | | Trina Solar Ltd. - ADR* | | $ | 5,812,569 | | |
| Exchange Traded Funds (ETFs): 3.3% | | | |
| | 4,146,000 | | | iShares FTSE/Xinhua A50 CHINA Index ETF | | | 7,978,219 | | |
| Gas – Distribution: 3.2% | | | |
| | 1,080,000 | | | Beijing Enterprises Holdings Ltd. | | | 7,822,179 | | |
| Internet Application Software: 2.2% | | | |
| | 242,000 | | | Tencent Holdings Ltd. | | | 5,233,906 | | |
| Internet Content – Entertainment: 1.8% | | | |
| | 107,800 | | | Perfect World Co., Ltd. - ADR* | | | 4,251,632 | | |
| Machinery – General Industries: 0.4% | | | |
| | 3,510,000 | | | Chen Hsong Holdings | | | 992,600 | | |
| Metal – Copper: 2.5% | | | |
| | 2,550,000 | | | Jiangxi Copper Co., Ltd. | | | 5,963,561 | | |
| Oil – Integrated: 3.4% | | | |
| | 6,796,000 | | | PetroChina Co., Ltd. | | | 8,079,399 | | |
| Oil & Gas – Exploration & Production: 8.3% | | | |
| | 7,602,000 | | | CNOOC Ltd. | | | 11,843,429 | | |
| | 6,210,000 | | | CNPC Hong Kong Ltd. | | | 8,189,360 | | |
| | | | 20,032,789 | | |
| Power Conversion/Supply Equipment: 3.2% | | | |
| | 1,426,000 | | | Dongfang Electric Corp., Ltd. | | | 7,603,684 | | |
| Public Thoroughfares: 1.1% | | | |
| | 5,204,000 | | | Shenzhen Expressway Co., Ltd. | | | 2,551,392 | | |
| Real Estate: 2.2% | | | |
| | 9,879,000 | | | Soho China Ltd. | | | 5,307,220 | | |
| Real Estate Management/Service: 2.5% | | | |
| | 7,184,000 | | | Midland Holdings Ltd. | | | 6,170,527 | | |
| Retail – Apparel/Shoe: 1.3% | | | |
| | 431,985 | | | Esprit Holdings Ltd. | | | 2,866,076 | | |
| | 698,000 | | | Glorious Sun Enterprises Ltd. | | | 259,578 | | |
| | | | 3,125,654 | | |
| Retail – Hair Salons: 0.1% | | | |
| | 2,560,000 | | | Modern Beauty Salon Holdings Ltd. | | | 203,918 | | |
| Steel – Producers: 1.9% | | | |
| | 2,081,000 | | | Angang Steel Co., Ltd. | | | 4,537,811 | | |
| Telecommunication Equipment: 3.2% | | | |
| | 819,000 | | | VTech Holdings Ltd. | | | 7,811,492 | | |
| Transportation – Marine: 3.6% | | | |
| | 3,852,000 | | | China Shipping Development Co., Ltd. | | | 5,728,766 | | |
| | 4,240,000 | | | Pacific Basin Shipping Ltd. | | | 3,038,883 | | |
| | | | 8,767,649 | | |
The accompanying notes are an integral part of these financial statements.
33
| Shares | | COMMON STOCKS: 99.9% Continued | | Value | |
| Web Portals/ISP: 3.3% | |
| | 104,540 | | | Netease.com - ADR* | | $ | 3,931,749 | | |
| | 69,900 | | | Sohu.com, Inc. - ADR* | | | 4,003,872 | | |
| | | | 7,935,621 | | |
| | | Total Common Stocks
(cost $169,206,561) | | | 240,726,736 | | |
| | | Total Investments in Securities
(cost $169,206,561): 99.9% | | | 240,726,736 | | |
| | | Other Assets less Liabilities: 0.1% | | | 233,407 | | |
| | | Net Assets: 100% | | $ | 240,960,143 | | |
* Non-income producing security.
ADR - American Depository Receipt
The accompanying notes are an integral part of these financial statements.
34
GLOBAL ENERGY FUND for the period ended December 31, 2009
1. Performance
AVERAGE ANNUALIZED TOTAL RETURNS
| | | 1 Year
(actual) | | 5 Years | | Since
Inception
June 30, 2004 | |
| Fund | | | 63.27 | % | | | 15.72 | % | | | 18.39 | % | |
| Benchmark Index: | |
| S&P 500 | | | 26.47 | % | | | -0.42 | % | | | 1.65 | % | |
| MSCI World Energy Index | | | 26.98 | % | | | 9.66 | % | | | 11.96 | % | |
Source: Bloomberg
The Fund's gross expense ratio is 1.31% per the Summary Prospectus dated May 1, 2009. Guinness Atkinson Asset Management has contractually agreed to waive a portion of its advisory fees so that the Fund's ratio of expenses to average daily net assets will not exceed 1.98% (excluding Acquired Fund Fees and Expenses, interest, taxes, dividends on short positions and extraordinary expenses) through at least June 30, 2010. To the extent that the Advisor waives fees it may seek repayment of a portion or all of such amounts at any time within the three fiscal years after the fiscal year in which such amounts were waived, subject to the applicable cap.
Performance data quoted represents past performance and does not guarantee future results. The investment return and principal value of an investment will fluctuate so that an investor's shares, when redeemed, may be worth more or less than their original cost. Current performance of the Funds may be lower or higher than the performance quoted. Performance data current to the most recent month end may be obtained by visiting www.gafunds.com, or calling (800) 916-6566.
The Fund imposes a 2% redemption fee on shares held less than 30 days. Performance data quoted does not reflect the 2% redemption fee on shares held less than 30 days. Total Returns for prior periods reflect a fee waiver in effect and in the absence of this waiver, the total return would be lower.
2009 was a recovery year for energy stocks after the heavy sell-off in the second half of 2008 and it was pleasing to see a strong outperformance by the fund versus its benchmark. The Global Energy Fund over the course of 2009 produced a total return of 63.27%, an outperformance of 36.29% versus the MSCI World Energy Index (up 26.98%) and of 36.8% versus the S&P 500 Index (up 26.47%).
The star performers over the year have been spread across the different sectors, although the Exploration & Production companies as a group stand out. Pioneer Natural Resources (up 198%), Dragon Oil (up 171%) and Newfield Exploration (up 144%), as well as Canadian Oil Sands producers Suncor (up 84%) and Canadian Natural Resources (up 83%) and deepwater driller Transocean (up 75%) were all significant contributors to performance. All of them benefitted from continued strength in the oil price while the US E&P's also enjoyed a recovery in the US natural gas price. The worst performing holdings have been the integrated companies: Hess, Marathon, ENI, Total and Royal Dutch Shell, which range up from 10% (ENI) to 19% (Total).
2. Activity
Portfolio activity in the early part of the year was relatively light, indeed we made no changes to the portfolio at all in the first quarter. During April we sold our position in Chevron and replaced it with a position in Unit. Chevron had become the most expensive 'super major' we held and a rotation into Unit gave us exposure to a US E&P company with good value reserves. Unit also has a land drilling business which could perform well when the services business cycle begins to recover. We also sold our position in Peabody, the US coal company, and bought a position in Whiting, an 'oily' E&P company with acreage in the US. The outlook for US coal remains weak in light of the supply/demand imbalance and lower international exports and we are cautious on the ability for the coal group to maintain their long-term pricing contracts at current levels. Whiting has good value reserves, a long reserve life and should benefit from any move u p in the oil price.
35
GLOBAL ENERGY FUND
In May we bought one new research position, Falkland Oil and Gas. Falkland is an oil exploration company with offshore acreage to the south of the Falkland Islands. Whilst Falkland has not yet drilled any of its prospects, we believe that given its farm in agreement with BHP Billiton there should be good opportunity over the next 12-24 months for the company to accelerate its development plans.
In July we sold our holding in Addax Petroleum and bought a holding in Forest Oil. Addax had been one of the Fund's best performers this year and was the subject of a takeover bid by China Petroleum and Chemical Corporation (Sinopec), the state-owned integrated oil and gas company, and had been trading close to the bid price at the time of sale. Forest Oil is a US gas-focused E&P with cheap reserves that is trading on low P/E multiples. We also sold our position in the refiner Singapore Petroleum and purchased Valero. Singapore Petroleum performed well this year and was the subject of a takeover bid by PetroChina, the largest of the three Chinese state-owned integrated oil companies. Valero is the largest of the US refiners, a sector which has underperformed over the past 12 months, and was trading at a significant discount to book value.
At the end of July we sold our position in Petroleo Brasileiro (Petrobras) and bought a position in Chevron, the 'supermajor' integrated oil and gas company. Petrobras had been a strong performer in 2009 and had recovered almost in parallel with the oil price rising from $35 to $70. Chevron on the other hand had underperformed this year and was trading at lower P/E multiples than its peers. The final change to the portfolio in July was the sale of Whiting Petroleum, the oil-focused US E&P, and the purchase of Canadian Natural Resources. Whiting's leverage to the oil price had seen it perform strongly over the period we owned it. Canadian Natural Resources production is approximately 50:50 oil:gas and based primarily in Canada. The company also owns the Horizon oil sands project which started production in early 2009 and is ramping up to full production at the end of 2009.
In August we sold our holding in Occidental and bought a holding in Chesapeake. Occidental is oil levered and had been a strong beneficiary of the rise in the oil price from the lows seen this year. Chesapeake is a gas-focused E&P and is the largest producer of natural gas in the US. It was trading on low multiples in both absolute terms and relative to its peers, has good value reserves and should do well in a rising gas price environment. We also saw the completion of two mergers of companies in the portfolio; the acquisition of PetroCanada by Suncor, and the acquisition of Grey Wolf Exploration (a research position) by Insignia. We continue to hold the 'new' Suncor and a research position in Insignia.
In November we switched out of CNOOC and bought PetroChina, the largest of the three Chinese national oil companies. CNOOC had performed very well over 2009 and was trading at a relatively high EV/proved reserve multiple. PetroChina has a much lower EV/proved reserves and should benefit from increasing gas demand in China over the next few years. We invested a half unit of the portfolio in JKX Oil & Gas and Gazprom (together c.1.7% of the portfolio). JKX is an independent exploration and production company producing oil and gas in Ukraine, is trading on low multiples and has cheap reserves. Gazprom is the Russian national oil and gas company which supplies approximately a quarter of European Union gas demand. The company is trading on low P/E multiples, has very cheap reserves and a long reserve life.
We also sold and bought back our position in Dragon Oil during the fourth quarter. We sold our original position in the Caspian Sea-focused E&P in early November following a bid for the company from the Emirates National Oil Company (ENOC). This bid was eventually rejected, causing the share price to fall back, and provided us with a good opportunity to place Dragon Oil back into the portfolio.
Finally we bought a 'research' position in Pantheon Resources (c.0.3% of the portfolio) via a share placing in December. Pantheon Resources is a small capitalization E&P company focusing on oil and gas in East Texas and Louisiana.
3. Portfolio Position
The invested Fund at 31 December 2009 was on a Price Earnings Ratio (2008) of 7.4x (8.1x 2007) with a median PER (2008) of stocks held of 7.2x. By comparison the S&P 500 Index at 1115.1 was on a PER of 22.5x (2008), based on S&P 500 operating earnings per share estimates of $49.51 for 2008.
36
GLOBAL ENERGY FUND
The Sector and Geographic weightings of the portfolio (ignoring cash) at 31 December were as follows:
| Sector Breakdown | |
| | | 31 Dec 2008 | | 31 Dec 2009 | |
| Integrated | | | 54.6 | | | | 48.9 | | |
| Exploration & Production | | | 45.9 | | | | 48.9 | | |
| Drilling | | | 5.1 | | | | 8.7 | | |
| Equipment & Services | | | 6.3 | | | | 5.6 | | |
| Refining & Marketing | | | 2.5 | | | | 3.3 | | |
| Coal & Consumables | | | 2.3 | | | | — | | |
| Construction & Engineering | | | 0.4 | | | | 0.4 | | |
| Total | | | 100.0 | | | | 100.0 | | |
| Geographic Breakdown | |
| | | 31 Dec 2008 | | 31 Dec 2009 | |
| US | | | 46.4 | | | | 52.1 | | |
| Canada | | | 16.2 | | | | 17.2 | | |
| UK | | | 7.1 | | | | 6.3 | | |
| Latin America | | | 4.1 | | | | — | | |
| Europe | | | 17.8 | | | | 20.9 | | |
| China | | | 3.8 | | | | 3.5 | | |
| Other | | | 4.6 | | | | — | | |
| | | | 100.0 | | | | 100.0 | | |
4. Market Background
2009 has been a year of recovery for the oil price. Having ended 2008 at $44 it fell back to $35 in mid-January but moved up handsomely to reach $70 at the end of June. It fell back to $60 in July before moving gradually higher over the third quarter and then up to $80 in October. It ended the year at $79.36, having averaged just under $62 for the year as a whole.
The reasons for this recovery are well-documented. First and foremost, OPEC's combined quota cuts of 4.2m barrels in October and December 2008, and the early compliance with the new quotas (compliance has slipped back to 60%), have done enough to balance the market. Added to this the increasing signs of economic recovery (International Energy Agency global oil demand forecast for 2009 moved up from 83m b/day to 85m b/day), strong imports from China, and index buying combined with a weaker dollar and the animal spirits of traders have moved the oil price back up to a level which remunerates oil producing nations and encourages investment without disrupting the world economy. We now think of the oil price trading range as $60-80.
Looking further ahead we are still anticipating a steadily rising oil price. Non-OPEC supply is forecast by the IEA to grow 0.2m b/day in 2010 which we consider optimistic, and there is little reason to believe that it can grow much in the future. 2009 was billed as the big year for non-OPEC supply and it grew by only 0.6m b/day. In the medium to long term we do not believe that growth in supply from Brazil, the Caspian and the Canadian Oil Sands will be enough to replace the shortfall from Mexico, Russia and the North Sea. On the demand side, alongside our confidence in continued growth from the non-OECD region, we draw considerable comfort from the fact that global oil demand in between 2007-9 fell only 1.8% in the midst of the banking crisis and recession.
37
GLOBAL ENERGY FUND
We are also very focused on the US natural gas price which fell from $13 in mid 2008 to $2 in September 2009. We have positioned ourselves for a strengthening gas price as we expect the fall in the rig count to reduce supply just as demand recovers. This is beginning to play out, helped by some cold winter weather, and natural gas in storage is now back at the five-year average level. This has helped the price up to around $5.50, after averaging $3.95 for 2009.
5. Outlook
How might 2010 treat this fund? My view remains that energy equities represent a good store of value and there is potential for above average returns if the oil price stabilises around the level sought by OPEC ($60 - $80/ barrel) and the gas price recovers to $6-$7. We believe this the most plausible scenario.
We believe energy equities discount an oil price well below $70/barrel, possibly around $55 and a gas price well below our projected $6-$7. Clearly there are risks in our medium term positive analysis of the fundamentals. It may turn out that OPEC have not yet taken enough barrels off the market and that if compliance falters further the market will loosen even more. The US natural gas market may not rebalance as fast as we hope. But we keep coming back to one key proposition: oil and gas are running out and it does seem reasonable to believe that before they do run out they will trade at much higher prices than we have yet seen and shareholders in companies that are part of that world will be duly rewarded.
Overall, the Fund continues to seek to be well placed to benefit from the oil and gas price environment described above.

Tim Guinness 29 January 2010
The Fund invests in foreign securities which will involve political, economic and currency risks, greater volatility, and differences in accounting methods. The Fund is non-diversified meaning their assets may be concentrated in fewer individual holdings than diversified funds. Therefore, the Fund is more exposed to individual stock volatility than diversified funds. The Fund invests in smaller companies, which will involve additional risks such as limited liquidity and greater volatility.
The MSCI World Energy Index is an unmanaged index composed of more than 1,400 stocks listed on exchanges in the U.S., Europe, Canada, Australia, New Zealand and the Far East. The S&P500 Index is a broad based unmanaged index of 500 stocks, which is widely recognized as representative of the equity market in general. These indices are unmanaged, not available for investment and do not incur expenses.
PER or P/E – Price to Earnings ratio is calculated by dividing current price of the stock by the company's trailing months' earnings per share. Cash flow measures the cash generating capability of a company by adding non-cash charges (e.g. depreciation) and interest expense to pretax income.
Book value – net asset value of a company as recorded on the balance sheet. This is calculated by total assets less intangible assets and liabilities.
EV/proved reserve multiple – this is a measure of the value attributed to a company's proved reserves by the market valuation. This is calculated by dividing the Enterprise Value (market capitalization plus net debt) by the oil and gas reserves and gives a number in $/barrel of oil equivalent ($/boe).
Please refer to the Schedule of Investments for details on fund holdings. Current and future portfolio holdings are subject to risk.
The information provided herein represents the opinion of Guinness Atkinson Management for the period stated and is not intended to be a forecast of future events, a guarantee of future results, nor investment advice. Opinions, fund holdings and sector allocations are subject to change at any time and are not recommendations to buy or sell any security.
38
GLOBAL ENERGY FUND
Growth of $10,000
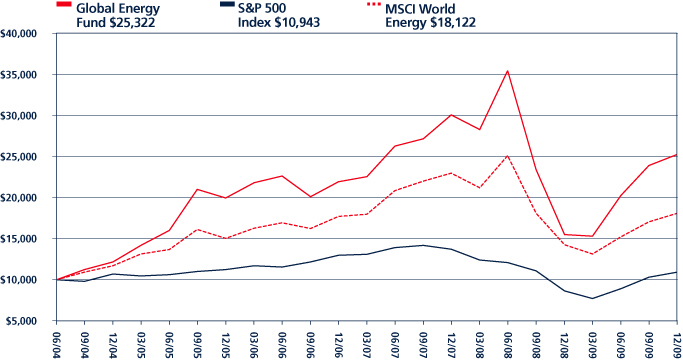
Average Annual Total Return
Periods Ended December 31, 2009
| One Year | | Five Years | | Since Inception
(06/30/04) | |
| | 63.27 | % | | | 15.72 | % | | | 18.39 | % | |
Performance data quoted represents past performance and does not guarantee future results. The investment return and principal value of an investment will fluctuate so that an investor's shares, when redeemed, may be worth more or less than their original cost. Current performance of the Fund may be lower or higher than the performance quoted. Performance data current to the most recent month end may be obtained by visiting www.gafunds.com.
Total returns reflect a fee waiver in effect and in the absence of this waiver, the total returns would be lower. The Fund imposes a 2% redemption fee on shares held less than 30 days.
The MSCI World Index is an unmanaged index composed of more than 1,400 stocks listed on exchanges in the U.S., Europe, Canada, Australia, New Zealand and the Far East.
The S&P 500 Index is a broad based unmanaged index of 500 stocks, which is widely recognized as representative of the equity market in general. These indices are unmanaged, not available for investment and do not incur expenses.
39
FUND HIGHLIGHTS at December 31, 2009
GUINNESS ATKINSON GLOBAL ENERGY FUND
| # of Holdings in Portfolio: | | | 44 | | |
| Portfolio Turnover: | | | 51.7 | % | |
| % of Stocks in Top 10: | | | 32.4 | % | |
| Fund Managers: | |
| Timothy W. N. Guinness | | | | | |
| Edmund Harriss | | | | | |
| Top 10 Holdings (% of net assets) | | | | Sector Breakdown (% of Investments) | | | |
| Canadian Natural Resources Ltd. | | | 3.3 | % | | Oil & Gas-Integrated | | | 46.8 | % | |
| OMV AG | | | 3.3 | % | | Oil & Gas-Exploration & Production | | | 35.3 | % | |
| Hess Corp. | | | 3.3 | % | | Oil & Gas-Drilling | | | 8.7 | % | |
| Suncor Energy, Inc. | | | 3.3 | % | | Oil & Gas-Field Services | | | 5.8 | % | |
| Nexen, Inc. | | | 3.2 | % | | Oil Refining & Marketing | | | 3.2 | % | |
| Imperial Oil Ltd. | | | 3.2 | % | | Machinery-General Industries | | | 0.2 | % | |
| PetroChina Co Ltd. | | | 3.2 | % | | | | | | | |
| Repsol YPF SA | | | 3.2 | % | | | | | | | |
| ConocoPhillips | | | 3.2 | % | | | | | | | |
| Newfield Exploration Co. | | | 3.2 | % | | | | | | | |
| Country Breakdown (% of net assets) | |
| United States | | | 46.6 | % | | France | | | 3.2 | % | |
| Canada | | | 15.9 | % | | Norway | | | 3.2 | % | |
| Britain | | | 5.2 | % | | Switzerland | | | 3.2 | % | |
| China | | | 3.4 | % | | Netherlands | | | 3.1 | % | |
| Austria | | | 3.3 | % | | UAE | | | 1.1 | % | |
| Spain | | | 3.2 | % | | Russia | | | 0.8 | % | |
| Italy | | | 3.2 | % | | Ireland | | | 0.4 | % | |
40
SCHEDULE OF INVESTMENTS
December 31, 2009
GUINNESS ATKINSON GLOBAL ENERGY FUND
| Shares | | COMMON STOCKS: 95.8% | | Value | |
| Machinery – General Industries: 0.2% | | | |
| | 914,780 | | | Shandong Molong Petroleum Machinery Co., Ltd. | | $ | 138,455 | | |
| Oil & Gas – Drilling: 8.3% | | | |
| | 101,270 | | | Patterson-UTI Energy, Inc. | | | 1,554,495 | | |
| | 28,891 | | | Transocean Ltd* | | | 2,392,175 | | |
| | 54,597 | | | Unit Corp.* | | | 2,320,373 | | |
| | | | 6,267,043 | | |
| Oil & Gas – Exploration & Production: 33.8% | | | |
| | 99,000 | | | Afren PLC* | | | 135,519 | | |
| | 25,470 | | | Anadarko Petroleum Corp. | | | 1,589,837 | | |
| | 23,109 | | | Apache Corp. | | | 2,384,156 | | |
| | 34,400 | | | Canadian Natural Resources Ltd. | | | 2,499,785 | | |
| | 36,136 | | | Cenovus Energy, Inc. | | | 915,623 | | |
| | 89,200 | | | Chesapeake Energy Corp. | | | 2,308,496 | | |
| | 91,089 | | | Coastal Energy Co.* | | | 461,607 | | |
| | 130,750 | | | Dragon Oil Plc* | | | 816,026 | | |
| | 25,136 | | | EnCana Corp. | | | 819,801 | | |
| | 75,828 | | | Falkland Oil & Gas Ltd.* | | | 154,921 | | |
| | 52,600 | | | Forest Oil Corp.* | | | 1,170,350 | | |
| | 24,400 | | | Gazprom OAO - ADR | | | 616,151 | | |
| | 2,026 | | | Insignia Energy Ltd.* | | | 4,223 | | |
| | 130,900 | | | JKX Oil & Gas PLC | | | 596,695 | | |
| | 49,786 | | | Newfield Exploration Co.* | | | 2,401,179 | | |
| | 101,121 | | | Nexen, Inc. | | | 2,438,468 | | |
| | 33,235 | | | Noble Energy, Inc. | | | 2,366,997 | | |
| | 199,198 | | | OPTI Canada, Inc.* | | | 386,644 | | |
| | 560,000 | | | Pantheon Resources PLC*† | | | 201,253 | | |
| | 33,320 | | | Pioneer Natural Resources Co. | | | 1,605,024 | | |
| | 64,400 | | | Swift Energy Co.* | | | 1,543,024 | | |
| | 62,740 | | | WesternZagros Resources Ltd.* | | | 46,192 | | |
| | | | 25,461,971 | | |
| Oil & Gas – Field Services: 5.6% | | | |
| | 79,300 | | | Halliburton Co. | | | 2,386,137 | | |
| | 131,480 | | | Helix Energy Solutions Group, Inc.* | | | 1,544,890 | | |
| | 84,900 | | | Kentz Corp Ltd. | | | 272,889 | | |
| | | | 4,203,916 | | |
The accompanying notes are an integral part of these financial statements.
41
| Shares | | COMMON STOCKS: 95.8% Continued | | Value | |
| Oil & Gas – Integrated: 44.8% | | | |
| | 247,985 | | | BP PLC | | $ | 2,394,574 | | |
| | 30,900 | | | Chevron Corp. | | | 2,378,991 | | |
| | 47,028 | | | ConocoPhillips | | | 2,401,720 | | |
| | 94,200 | | | ENI SpA | | | 2,398,868 | | |
| | 40,643 | | | Hess Corp. | | | 2,458,901 | | |
| | 62,607 | | | Imperial Oil Ltd. | | | 2,434,002 | | |
| | 75,800 | | | Marathon Oil Corp. | | | 2,366,476 | | |
| | 56,333 | | | OMV AG | | | 2,471,668 | | |
| | 2,036,000 | | | PetroChina Co., Ltd. | | | 2,420,491 | | |
| | 89,700 | | | Repsol YPF SA | | | 2,407,049 | | |
| | 79,071 | | | Royal Dutch Shell PLC | | | 2,382,558 | | |
| | 95,950 | | | Statoil ASA | | | 2,392,956 | | |
| | 68,776 | | | Suncor Energy, Inc. | | | 2,446,962 | | |
| | 37,300 | | | Total SA | | | 2,395,773 | | |
| | | | 33,750,989 | | |
| Oil Refining & Marketing: 3.1% | | | |
| | 140,399 | | | Valero Energy Corp. | | | 2,351,683 | | |
| | | | | Total Common Stocks
(cost $66,751,726) | | | 72,174,057 | | |
| | | | | Total Investments in Securities
(cost $66,751,726): 95.8% | | | 72,174,057 | | |
| | | | | Other Assets less Liabilities: 4.2% | | | 3,185,832 | | |
| | | | | Net Assets: 100% | | $ | 75,359,889 | | |
* Non-income producing security.
† Illiquid. Illiquid securities represent 0.3% of net assets.
ADR - American Depository Receipt
The accompanying notes are an integral part of these financial statements.
42
GLOBAL INNOVATORS FUND
1. Performance for the period ended December 31, 2009
AVERAGE ANNUALISED TOTAL RETURNS
| | | 1 Year
2009 | | 3 Years
2007 – 2009 | | 5 Years
2003 – 2009 | | 10 Years
1999 – 2009 | | Since Launch
1998(Dec 15) – 2009 | |
| Fund | | | 45.20 | % | | | -1.34 | % | | | 4.98 | % | | | -2.43 | % | | | 3.56 | % | |
| Benchmark Indices | |
| S&P 500 | | | 26.47 | % | | | -5.61 | % | | | 0.42 | % | | | -0.95 | % | | | 1.18 | % | |
| NASDAQ | | | 45.36 | % | | | -1.16 | % | | | 1.71 | % | | | -5.08 | % | | | 1.36 | % | |
The Fund's gross expense ratio is 1.40% per the Summary Prospectus dated May 1, 2009. Guinness Atkinson Asset Management has contractually agreed to waive a portion of its advisory fees so that the Fund's ratio of expenses to average daily net assets will not exceed 1.98% (excluding Acquired Fund Fees and Expenses, interest, taxes, dividends on short positions and extraordinary expenses) through at least June 30, 2010. To the extent that the Advisor waives fees it may seek repayment of a portion or all of such amounts that any time within three fiscal years after the fiscal year in which such amounts were waived, subject to the applicable cap.
Performance data quoted represents past performance and does not guarantee future results. The investment return and principal value of an investment will fluctuate so that an investor's shares, when redeemed, may be worth more or less than their original cost. Current performance of the Fund may be lower or higher than the performance quoted. Performance data current to the most recent month end may be obtained by visiting www.gafunds.com, or calling (800) 916-6566.
The Fund imposes a 2% redemption fee on shares held less than 30 days. Performance data quoted does not reflect the 2% redemption fee on shares held less than 30 days. Total returns reflect a fee waiver in effect and in the absence of this waiver, the total returns would be lower.
The Global Innovators Fund over the course of 2009 produced a total return of 45.20%. The fund outperformed the S&P 500 index which was up 26.47% and just underperformed the NASDAQ index which was up 45.36%. Over the last 5 years the total return continues to exceed that of both its benchmarks.
This table sets out the comparative returns in discrete years since launch
| | | 2009 | | 2008 | | 2007 | | 2006 | | 2005 | | 2004 | | 2003 | | 2002 | | 2001 | | 2000 | | 1999 | |
| FUND | | | 45.20 | % | | | -45.42 | % | | | 20.58 | % | | | 18.76 | % | | | 11.82 | % | | | 10.89 | % | | | 35.97 | % | | | -31.13 | % | | | -29.05 | % | | | -16.78 | % | | | 68.68 | % | |
Benchmark
Indices | |
| S&P500 | | | 26.47 | % | | | -36.99 | % | | | 5.49 | % | | | 15.79 | % | | | 4.91 | % | | | 10.87 | % | | | 28.67 | % | | | -22.09 | % | | | -11.88 | % | | | -9.10 | % | | | 21.04 | % | |
| Fund | | | above | | | | below | | | | above | | | | above | | | | above | | | | above | | | | above | | | | below | | | | below | | | | below | | | | above | | |
| NASDAQ | | | 45.36 | % | | | -39.98 | % | | | 10.65 | % | | | 10.39 | % | | | 2.12 | % | | | 9.15 | % | | | 50.77 | % | | | -31.23 | % | | | -20.8 | % | | | -39.18 | % | | | 86.12 | % | |
| Fund | | | below | | | | below | | | | above | | | | above | | | | above | | | | above | | | | below | | | | above | | | | below | | | | above | | | | below | | |
As these tables show in calendar 2009 the fund outperformed the S&P500 by 18.73% and roughly matched the NASDAQ (it underperformed by a very small margin -0.16%). You can also see the fund remains over 3% per annum ahead of both these indices over the last 5 years on an annualized basis. As one of our objectives (since the fund became actively managed in 2003) is to outperform both the Nasdaq and S&P500 indices over time we are pleased to have achieved this by such a margin. (Investors may recall that prior to 2003 the fund was a passive fund tracking the Wired 40 index and as the above table shows it typically performed between the two indices – we believe our performance since we moved to active management is a demonstration of the case for active management).
43
GLOBAL INNOVATORS FUND
The best performing stocks over the year were Amazon (up 163.32%), Nvidia (Up 131.47%), Samsung Electronics (up 100.00%), Netflix (up 84.31%) and Check Point Software (up 78.41%). Our worst performing stocks were Citigroup (down 50.67%) and Nokia (down 17.63%). The IT Hardware sector recovered some of the ground lost in 2008 as an inventory restocking occurred. Our Internet ecommerce stocks performed well while uncertainty continued to affect the Financial sector.
2 Portfolio Construction and Activity
In the third quarter we sold our positions in Nucor, Schlumberger, Lenovo, and Wind River. We added positions in Capital One Financial, Comcast, Intercontinental Exchange and Research in Motion.
| Sector | | 2009 | | Geographic Breakdown | | 2009 | |
| Consumer Discretionary | | | 44.28 | % | | US | | | 75.75 | % | |
| Consumer Staples | | | 22.04 | % | | Asia ex Japan | | | 7.68 | % | |
| Energy | | | 16.84 | % | | Japan | | | 7.38 | % | |
| Financials | | | 5.69 | % | | UK | | | 5.66 | % | |
| Health Care | | | 3.77 | % | | Europe | | | 3.54 | % | |
| Industrials | | | 3.75 | % | | Latin America | | | 0.00 | % | |
| Information Technology | | | 3.62 | % | | | | | | | |
| Materials | | | 0.00 | % | | | | | | | |
| Telecommunication Services | | | 0.00 | % | | | | | | | |
| Utilities | | | 0.00 | % | | | | | | | |
| Total | | | 100.00 | % | | | | | 100.00 | % | |
At the end of the year the portfolio had 30 holdings.
3 Outlook & Strategy
The PER of the fund at the year end was 19.0X (2009) and 16.4X (2010) compared with the S&P 500's PER of 18.7X (2009) and 14.7X (2010). In addition according to our Holt discounted cash flow metric, the funds' holdings were on average undervalued against the market by some 29% (40% upside). Our objective continues to be to outperform both the S&P500 index and the NASDAQ index.
The Boston Consulting Group Innovation 2009 report has concluded that total shareholders returns on an annualized basis from innovative companies outperformed their peers by 430 basis points over the last three years and by 260 basis points over the last ten years. By taking a small carefully selected universe of companies as a starting point we hope to capture this dynamic in the future.
To achieve this we seek attractive investment opportunities among companies that have once been in the Wired Index and thus that exhibit New Economy characteristics plus those we are now adding each year that we have identified as exhibiting strong innovation characteristics. Our multi-factor screening process applied to this universe to select the best 30 or so ideas and a deliberately low turnover forms the basis of our investment approach. The four criteria in our screening process are: (a) value, meaning a disciplined quantitative methodology used to rank all companies on similar basis projecting their internal cash flows using consensus forecast and historic trend data and applying a common overall market determined discount rate to imply fair value and compare this to actual price); (b) business quality (quantitatively ranking companies for the attractiveness of their return on capital metrics); (c) improving results (1 and 3 month ear nings estimates revisions); and (d) good recent market price performance (looking particularly for above trend momentum and rising volatility). Also top down "thematic" judgements will be used in the process of evaluating potential Fund purchases.
We believe companies with an innovative mindset and a strong balance sheet are well placed to emerge from this economic downturn stronger. Cost cutting has clearly been an important step for companies to take as demand for goods and services have reduced.
44
GLOBAL INNOVATORS FUND
These companies are investing more in rapidly developing economies for both a base for lower cost manufacturing and providers of services. Continued investment in technology should allow well capitalized companies to stay ahead of less well capitalized competition.
The current economic conditions also present opportunities for these companies to acquire other companies at substantially reduced valuations thereby giving them access to intellectual property, market share, products, etc.
Whilst the focus for many companies for 2009 was on cost cutting in 2010 we would expect to see companies looking for opportunities to revamp and grow their businesses through either mergers and acquisitions or new product launches.
On outlook we are optimistic. We believe gloom about the over indebtedness of the US consumer and the time it may take to deleverage/recapitalize the global banking industry is greatly overdone. Both are of course real issues but over focus on them misses the positives that exist – of which two of the most obvious are : (i) China and other emerging countries having slowed sharply for 6 months around December 2008/January 2009 are forging forward again and provide a valuable locomotive for global growth; and (ii) business cycle recovery forces based on an inevitable recovery in e.g. US housing starts ( languishing at 500,000 – 600,000 pa vs. a 40 year average of 1,500,000 pa ) and car sales ( at 11-11.5 million pa vs. 16 million pa 2000-2008 average) should be kicking in soon.
The strong recovery in stock markets in 2009 of course may be followed by a pause in 2010. Or even a correction. We would however regard any material correction as a buying opportunity. Whatever the out turn we believe the current valuation metrics for the stocks of the globally innovative companies we hold to be attractive in relative terms and we believe we have a good chance of delivering a worthwhile and index outperformance for our investors.

Tim Guinness
The Fund invests in foreign securities which will involve political, economic and currency risks, greater volatility, and differences in accounting methods. The Fund is non-diversified meaning its assets may be concentrated in fewer individual holdings than diversified funds. Therefore, the Fund is more exposed to individual stock volatility than diversified funds. The Fund invests in smaller companies, which will involve additional risks such as limited liquidity and greater volatility.
The S&P 500 Index is a broad based unmanaged index of 500 stocks, which is widely recognized as representative of the equity market in general. The NASDAQ Composite Index is a market capitalization weighted index that is designed to represent the performance of the National Market System which includes over 5,000 stocks traded only over-the-counter and not on an exchange. These indices are unmanaged, not available for investment and do not incur expenses.
The Wired® Index was created by Wired® magazine to "...track the growth of the companies that are building the new economy – not just (high tech companies), but a broad range of enterprises that are using technology, networks, and information to reshape the world." (Wired, June 1998)
Price to earnings ratio (PER) is calculated by dividing current price of the stocks by the company's trailing months' earnings per share. Cash flow measures the cash generating capability of a company by adding non-cash charges (e.g. depreciation) and interest expense to pre-tax income.
Return on capital (ROC) is a measure of how effectively a company uses the money (borrowed or owned) invested in its operations. It is calculated by dividing net income by invested capital.
Cash flow measures the cash generating capability of a company by adding non-cash charges (e.g. depreciation) and interest expense to pre-tax income.
Please refer to the Schedule of Investments for details on fund holdings. Current and future portfolio holdings are subject to risk.
The information provided herein represents the opinion of Guinness Atkinson Management for the period stated and is not intended to be a forecast of future events, a guarantee of future results, nor investment advice. Opinions, fund holdings and sector allocations are subject to change at any time and are not recommendations to buy or sell any security.
45
GLOBAL INNOVATORS FUND
Growth of $10,000

Average Annual Total Return
Periods Ended December 31, 2009
| One Year | | Five Years | | Ten Years | |
| | 45.20 | % | | | 4.98 | % | | | (2.43 | )% | |
Performance data quoted represents past performance and does not guarantee future results. The investment return and principal value of an investment will fluctuate so that an investor's shares, when redeemed, may be worth more or less than their original cost. Current performance of the Funds may be lower or higher than the performance quoted. Performance data current to the most recent month end may be obtained by visiting www.gafunds.com.
Total returns reflect a fee waiver in effect and in the absence of this waiver, the total returns would be lower. The Fund imposes a 2% redemption fee on shares held less than 30 days.
The Standard & Poor's 500 Index is an unmanaged index which is widely regarded as the standard for measuring large cap U.S. Stock market performance. The NASDAQ Composite Index is a market capitalization weighted index that is designed to represent the performance of the National Market System which includes over 5,000 stocks traded only over-the-counter and not on an exchange. The indices referenced in this chart are not available for investment and do not incur expenses.
46
FUND HIGHLIGHTS at December 31, 2009
GUINNESS ATKINSON GLOBAL INNOVATORS FUND
| # of Holdings in Portfolio: | | | 30 | | |
| Portfolio Turnover: | | | 50.5 | % | |
| % of Stocks in Top 10: | | | 39.3 | % | |
| Fund Managers: | |
| Timothy W. N. Guinness | | | | | |
| Edmund Harriss | | | | | |
| Top 10 Holdings (% of net assets) | | | | Country Breakdown (% of net assets) | | | |
| NVIDIA Corp. | | | 4.4 | % | | United States | | | 64.4 | % | |
| State Street Corp. | | | 4.0 | % | | Japan | | | 7.4 | % | |
| TD Ameritrade Holding Corp. | | | 3.9 | % | | Britain | | | 5.7 | % | |
| Oracle Corp. | | | 3.9 | % | | Taiwan | | | 3.9 | % | |
| Parametric Technology Corp. | | | 3.9 | % | | Canada | | | 3.9 | % | |
| Taiwan Semiconductor Manufacturing Co., Ltd.-ADR | | | 3.9 | % | | South Korea | | | 3.8 | % | |
| Research In Motion Ltd. | | | 3.9 | % | | Israel | | | 3.7 | % | |
| eBay, Inc. | | | 3.8 | % | | Cayman Islands | | | 3.7 | % | |
| Infospace, Inc. | | | 3.8 | % | | Finland | | | 3.5 | % | |
| IntercontinentalExchange, Inc. | | | 3.8 | % | | | | | | | |
| Sector Breakdown (% of Investments) | |
| Electronics | | | 15.7 | % | | Internet Content-Information | | | 3.8 | % | |
| E-Commerce | | | 11.3 | % | | Finance-Other Services | | | 3.8 | % | |
| Prepackaged Software | | | 9.5 | % | | Oil & Gas-Integrated | | | 3.8 | % | |
| Commercial Banks | | | 8.8 | % | | Automobile Manufacturers | | | 3.8 | % | |
| Semiconductor | | | 7.6 | % | | Retail-Discount | | | 3.6 | % | |
| Telecommunications | | | 5.7 | % | | Audio/Video Products | | | 3.6 | % | |
| Finance-Investment Bank/Broker | | | 3.9 | % | | Cable/Satellite TV | | | 3.5 | % | |
| Computer Aided Design | | | 3.9 | % | | Wireless Equipment | | | 3.5 | % | |
| Computers | | | 3.9 | % | | Multi-line Insurance | | | 0.3 | % | |
47
SCHEDULE OF INVESTMENTS
December 31, 2009
GUINNESS ATKINSON GLOBAL INNOVATORS FUND
| Shares | | COMMON STOCKS: 99.8% | | Value | |
| Audio/Video Products: 3.6% | | | |
| | 45,618 | | | Sony Corp. - ADR | | $ | 1,322,922 | | |
| Automobile Manufacturers: 3.8% | | | |
| | 19,830 | | | Honda Motor Co., Ltd. - ADR | | | 672,237 | | |
| | 8,440 | | | Toyota Motor Corp. - ADR | | | 710,310 | | |
| | | | 1,382,547 | | |
| Cable/Satellite TV: 3.5% | | | |
| | 77,060 | | | Comcast Corp. | | | 1,299,232 | | |
| Commercial Banks: 8.8% | | | |
| | 33,290 | | | Capital One Financial Corp. | | | 1,276,339 | | |
| | 137,850 | | | Citigroup, Inc. | | | 456,284 | | |
| | 34,024 | | | State Street Corp. | | | 1,481,405 | | |
| | | | 3,214,028 | | |
| Computer Aided Design: 3.9% | | | |
| | 87,050 | | | Parametric Technology Corp.* | | | 1,422,397 | | |
| Computers: 3.9% | | | |
| | 21,010 | | | Research In Motion Ltd.* | | | 1,419,015 | | |
| E-Commerce: 11.2% | | | |
| | 10,380 | | | Amazon.com, Inc.* | | | 1,396,318 | | |
| | 59,560 | | | eBay, Inc.* | | | 1,402,042 | | |
| | 24,190 | | | NetFlix, Inc.* | | | 1,333,837 | | |
| | | | 4,132,197 | | |
| Electronics: 15.6% | | | |
| | 43,870 | | | Garmin Ltd. | | | 1,346,809 | | |
| | 86,865 | | | NVIDIA Corp.* | | | 1,622,638 | | |
| | 3,990 | | | Samsung Electronics Co., Ltd. - GDR | | | 1,388,189 | | |
| | 15,830 | | | L-3 Communications Holdings, Inc. | | | 1,376,419 | | |
| | | | 5,734,055 | | |
| Finance – Investment Bank/Broker: 3.9% | | | |
| | 74,380 | | | TD Ameritrade Holding Corp.* | | | 1,441,484 | | |
| Finance – Other Services: 3.8% | | | |
| | 12,450 | | | IntercontinentalExchange, Inc.* | | | 1,398,135 | | |
| Internet Content – Information: 3.8% | | | |
| | 163,490 | | | Infospace, Inc.* | | | 1,401,109 | | |
| Multi-line Insurance: 0.3% | | | |
| | 4,083 | | | American International Group, Inc.* | | | 122,408 | | |
| Oil & Gas Integrated: 3.8% | | | |
| | 23,850 | | | BP PLC | | | 1,382,585 | | |
The accompanying notes are an integral part of these financial statements.
48
| Shares | | COMMON STOCKS: 99.8% Continued | | Value | |
| Prepackaged Software: 9.5% | | | |
| | 40,270 | | | Check Point Software Technologies* | | $ | 1,364,348 | | |
| | 22,408 | | | Microsoft Corp. | | | 683,220 | | |
| | 58,460 | | | Oracle Corp. | | | 1,434,608 | | |
| | | | 3,482,176 | | |
| Retail – Discount: 3.6% | | | |
| | 22,450 | | | Costco Wholesale Corp. | | | 1,328,367 | | |
| Semiconductor: 7.6% | | | |
| | 98,640 | | | Applied Materials, Inc. | | | 1,375,041 | | |
| | 124,119 | | | Taiwan Semiconductor Manufacturing Co., Ltd. - ADR | | | 1,419,921 | | |
| | | | 2,794,962 | | |
| Telecommunications: 5.7% | | | |
| | 29,925 | | | Vodafone Group PLC - ADR | | | 690,968 | | |
| | 331,400 | | | Qwest Communications International, Inc. | | | 1,395,194 | | |
| | | | 2,086,162 | | |
| Wireless Equipment: 3.5% | | | |
| | 100,892 | | | Nokia OYJ | | | 1,296,462 | | |
| | | | | Total Common Stocks
(cost $46,528,467) | | | 36,660,243 | | |
| | | | | Total Investments in Securities
(cost $46,528,467): 99.8% | | | 36,660,243 | | |
| | | | | Other Assets less Liabilities: 0.2% | | | 60,681 | | |
| | | | | Net Assets: 100% | | $ | 36,720,924 | | |
* Non-income producing security.
ADR - American Depository Receipt
GDR - Global Depository Receipt
The accompanying notes are an integral part of these financial statements.
49
STATEMENTS OF ASSETS AND LIABILITIES
at December 31, 2009
| | | Alternative
Energy
Fund | | Asia
Focus
Fund | | Asia Pacific
Dividend
Fund | |
| Assets | |
| Investments in securities, at cost | | $ | 80,152,745 | | | $ | 100,166,104 | | | $ | 12,984,444 | | |
| Investments in securities, at value | | $ | 61,788,759 | | | $ | 109,751,488 | | | $ | 11,463,880 | | |
| Cash | | | — | | | | 2,568,804 | | | | — | | |
Cash denominated in foreign currency (cost of $1,159,558,
$7,316, and $8,946, respectively) | | | 1,151,113 | | | | 7,330 | | | | 8,959 | | |
| Receivables: | |
| Securities sold | | | 1,096,686 | | | | — | | | | 34,332 | | |
| Fund shares sold | | | 109,880 | | | | 230,116 | | | | 49,766 | | |
| Dividends and interest | | | 16,998 | | | | 97,748 | | | | 14,264 | | |
| Prepaid expenses | | | 4,275 | | | | 7,573 | | | | 2,995 | | |
| Total assets | | | 64,167,711 | | | | 112,663,059 | | | | 11,574,196 | | |
| Liabilities | |
| Overdraft due to custodian bank | | | 683,891 | | | | — | | | | 127,310 | | |
| Payable for securities purchased | | | 1,152,230 | | | | — | | | | — | | |
| Payable for Fund shares redeemed | | | 57,305 | | | | 30,188 | | | | 18,633 | | |
| Due to advisor | | | 52,152 | | | | 92,231 | | | | 6,858 | | |
| Accrued administration fees | | | 1,776 | | | | 1,881 | | | | 392 | | |
| Accrued shareholder servicing plan fees | | | 17,158 | | | | 20,277 | | | | 3,361 | | |
| Deferred trustees' compensation | | | 14,691 | | | | 36,335 | | | | 8,439 | | |
| Other accrued expenses | | | 79,842 | | | | 60,858 | | | | 29,861 | | |
| Total liabilities | | | 2,059,045 | | | | 241,770 | | | | 194,854 | | |
| Net Assets | | $ | 62,108,666 | | | $ | 112,421,289 | | | $ | 11,379,342 | | |
| Number of shares issued and outstanding (unlimited shares authorized, no par value) | | | 9,386,374 | | | | 6,377,105 | | | | 1,031,921 | | |
| Net asset value per share | | $ | 6.62 | | | $ | 17.63 | | | $ | 11.03 | | |
| Composition of Net Assets | |
| Paid-in capital | | $ | 133,520,026 | | | $ | 103,492,782 | | | $ | 15,744,704 | | |
| Undistributed net investment income (loss) | | | (55,427 | ) | | | (206,719 | ) | | | (15,380 | ) | |
Accumulated net realized loss on investments
and foreign currency | | | (53,007,801 | ) | | | (447,803 | ) | | | (2,829,649 | ) | |
| Net unrealized appreciation (depreciation) on: | |
| Investments | | | (18,363,986 | ) | | | 9,585,384 | | | | (1,520,564 | ) | |
| Foreign currency | | | 15,854 | | | | (2,355 | ) | | | 231 | | |
| Net Assets | | $ | 62,108,666 | | | $ | 112,421,289 | | | $ | 11,379,342 | | |
The accompanying notes are an integral part of these financial statements.
50
STATEMENTS OF ASSETS AND LIABILITIES
at December 31, 2009
| | | China &
Hong Kong
Fund | | Global
Energy
Fund | | Global
Innovators
Fund | |
| Assets | |
| Investments in securities, at cost | | $ | 169,206,561 | | | $ | 66,751,726 | | | $ | 46,528,467 | | |
| Investments in securities, at value | | $ | 240,726,736 | | | $ | 72,174,057 | | | $ | 36,660,243 | | |
| Cash | | | 51,123 | | | | 2,453,299 | | | | 340,763 | | |
| Cash denominated in foreign currency (cost of $131,050, $10,000, and $0, respectively) | | | 131,050 | | | | 10,000 | | | | — | | |
| Receivables: | |
| Securities sold | | | — | | | | — | | | | — | | |
| Fund shares sold | | | 445,463 | | | | 918,572 | | | | 15,542 | | |
| Dividends and interest | | | 97,344 | | | | 35,242 | | | | 13,435 | | |
| Prepaid expenses | | | 22,882 | | | | 11,722 | | | | 6,472 | | |
| Total assets | | | 241,474,598 | | | | 75,602,892 | | | | 37,036,455 | | |
| Liabilities | |
| Overdraft due to custodian bank | | | — | | | | — | | | | — | | |
| Payable for securities purchased | | | — | | | | — | | | | — | | |
| Payable for Fund shares redeemed | | | 72,359 | | | | 107,689 | | | | 172,881 | | |
| Due to advisor | | | 202,983 | | | | 44,333 | | | | 23,062 | | |
| Accrued administration fees | | | 4,359 | | | | 1,775 | | | | 1,386 | | |
| Accrued shareholder servicing plan fees | | | 44,539 | | | | 15,192 | | | | 8,681 | | |
| Deferred trustees' compensation | | | 72,097 | | | | 18,914 | | | | 49,612 | | |
| Other accrued expenses | | | 118,118 | | | | 55,100 | | | | 59,909 | | |
| Total liabilities | | | 514,455 | | | | 243,003 | | | | 315,531 | | |
| Net Assets | | $ | 240,960,143 | | | $ | 75,359,889 | | | $ | 36,720,924 | | |
| Number of shares issued and outstanding (unlimited shares authorized, no par value) | | | 6,859,687 | | | | 2,943,708 | | | | 2,260,622 | | |
| Net asset value per share | �� | $ | 35.13 | | | $ | 25.60 | | | $ | 16.24 | | |
| Composition of Net Assets | |
| Paid-in capital | | $ | 170,313,840 | | | $ | 72,399,846 | | | $ | 80,609,342 | | |
| Undistributed net investment income (loss) | | | 727,439 | | | | (134,588 | ) | | | (49,612 | ) | |
Accumulated net realized loss on investments
and foreign currency | | | (1,601,277 | ) | | | (2,328,129 | ) | | | (33,970,582 | ) | |
| Net unrealized appreciation (depreciation) on: | |
| Investments | | | 71,520,175 | | | | 5,422,331 | | | | (9,868,224 | ) | |
| Foreign currency | | | (34 | ) | | | 429 | | | | — | | |
| Net Assets | | $ | 240,960,143 | | | $ | 75,359,889 | | | $ | 36,720,924 | | |
The accompanying notes are an integral part of these financial statements.
51
STATEMENTS OF OPERATIONS
For the year ended December 31, 2009
| | | Alternative
Energy
Fund | | Asia
Focus
Fund | | Asia Pacific
Dividend
Fund | |
| Investment Income | |
| Dividends * | | $ | 464,593 | | | $ | 1,407,404 | | | $ | 323,206 | | |
| Interest | | | 27,138 | | | | 2,419 | | | | 1,503 | | |
| Total income | | | 491,731 | | | | 1,409,823 | | | | 324,709 | | |
| Expenses | |
| Advisory fee | | | 561,423 | | | | 585,114 | | | | 78,046 | | |
| Shareholder servicing plan fees | | | 110,354 | | | | 110,913 | | | | 16,279 | | |
| Custody | | | 24,619 | | | | 35,708 | | | | 10,005 | | |
| Audit fees | | | 17,388 | | | | 22,728 | | | | 17,174 | | |
| Legal expenses | | | 26,320 | | | | 21,497 | | | | 2,742 | | |
| Transfer agent fees and expenses | | | 98,585 | | | | 46,640 | | | | 20,697 | | |
| Administration fee | | | 51,315 | | | | 46,813 | | | | 18,290 | | |
| Fund accounting fees and expenses | | | 42,294 | | | | 38,305 | | | | 26,943 | | |
| Registration fees | | | 25,009 | | | | 19,314 | | | | 16,685 | | |
| Printing | | | 35,040 | | | | 14,250 | | | | 5,011 | | |
| Trustees fees and expenses | | | 19,546 | | | | 26,630 | | | | 10,584 | | |
| Insurance | | | 7,667 | | | | 3,578 | | | | 847 | | |
| Miscellaneous | | | 19,175 | | | | 11,388 | | | | 5,178 | | |
| Total expenses | | | 1,038,735 | | | | 982,878 | | | | 228,481 | | |
| Less: fees waived and expenses absorbed | | | — | | | | — | | | | (73,950 | ) | |
| Interest expense | | | 1,367 | | | | — | | | | — | | |
| Net expenses | | | 1,040,102 | | | | 982,878 | | | | 154,531 | | |
| Net investment income (loss) | | | (548,371 | ) | | | 426,945 | | | | 170,178 | | |
| Realized and unrealized gain (loss) on investments and foreign currency | |
| Net realized loss on: | |
| Investments | | | (15,487,017 | ) | | | 2,730,063 | | | | (888,126 | ) | |
| Foreign currency | | �� | (62,413 | ) | | | (99,870 | ) | | | (2,651 | ) | |
| | | | (15,549,430 | ) | | | 2,630,193 | | | | (890,777 | ) | |
| Net unrealized appreciation (depreciation) on: | |
| Investments | | | 32,503,361 | | | | 24,122,291 | | | | 4,221,897 | | |
| Foreign currency | | | 15,961 | | | | (2,161 | ) | | | 421 | | |
| | | | 32,519,322 | | | | 24,120,130 | | | | 4,222,318 | | |
| Net realized and unrealized gain on investments and foreign currency | | | 16,969,892 | | | | 26,750,323 | | | | 3,331,541 | | |
| Net increase in net assets from operations | | $ | 16,421,521 | | | $ | 27,177,268 | | | $ | 3,501,719 | | |
* Net of foreign tax withheld of $69,754, $126,865, $37,820, $183,659, $113,851, and $27,661, respectively.
The accompanying notes are an integral part of these financial statements.
52
STATEMENTS OF OPERATIONS
For the year ended December 31, 2009
| | | China &
Hong Kong
Fund | | Global
Energy
Fund | | Global
Innovators
Fund | |
| Investment Income | |
| Dividends * | | $ | 3,825,974 | | | $ | 992,591 | | | $ | 480,503 | | |
| Interest | | | 83 | | | | 2,144 | | | | 2 | | |
| Total income | | | 3,826,057 | | | | 994,735 | | | | 480,505 | | |
| Expenses | |
| Advisory fee | | | 1,743,510 | | | | 332,622 | | | | 243,393 | | |
| Shareholder servicing plan fees | | | 291,116 | | | | 72,336 | | | | 53,380 | | |
| Custody | | | 60,850 | | | | 16,544 | | | | 5,526 | | |
| Audit fees | | | 23,528 | | | | 22,378 | | | | 22,828 | | |
| Legal expenses | | | 78,065 | | | | 17,416 | | | | 14,212 | | |
| Transfer agent fees and expenses | | | 181,590 | | | | 46,863 | | | | 71,196 | | |
| Administration fee | | | 122,247 | | | | 21,357 | | | | 19,234 | | |
| Fund accounting fees and expenses | | | 74,894 | | | | 31,928 | | | | 29,480 | | |
| Registration fees | | | 23,964 | | | | 21,421 | | | | 19,539 | | |
| Reports to shareholders | | | 39,425 | | | | 11,747 | | | | 18,835 | | |
| Trustees fees and expenses | | | 52,850 | | | | 12,437 | | | | 29,911 | | |
| Insurance | | | 19,831 | | | | 4,578 | | | | 4,692 | | |
| Miscellaneous | | | 39,330 | | | | 18,388 | | | | 11,435 | | |
| Total expenses | | | 2,751,200 | | | | 630,015 | | | | 543,661 | | |
| Less: fees waived and expenses absorbed | | | — | | | | — | | | | (40,902 | ) | |
| Interest expense | | | — | | | | — | | | | 1,882 | | |
| Net expenses | | | 2,751,200 | | | | 630,015 | | | | 504,641 | | |
| Net investment income (loss) | | | 1,074,857 | | | | 364,720 | | | | (24,136 | ) | |
| Realized and unrealized gain (loss) on investments and foreign currency | |
| Net realized loss on: | |
| Investments | | | 6,503,684 | | | | 1,022,108 | | | | 2,275,531 | | |
| Foreign currency | | | (3,287 | ) | | | (38,884 | ) | | | 47 | | |
| | | | 6,500,397 | | | | 983,224 | | | | 2,275,578 | | |
| Net unrealized appreciation (depreciation) on: | |
| Investments | | | 105,157,080 | | | | 18,267,865 | | | | 9,993,061 | | |
| Foreign currency | | | (34 | ) | | | 1,336 | | | | — | | |
| | | | 105,157,046 | | | | 18,269,201 | | | | 9,993,061 | | |
| Net realized and unrealized gain on investments and foreign currency | | | 111,657,443 | | | | 19,252,425 | | | | 12,268,639 | | |
| Net increase in net assets from operations | | $ | 112,732,300 | | | $ | 19,617,145 | | | $ | 12,244,503 | | |
* Net of foreign tax withheld of $183,659, $113,851, and $27,661, respectively.
The accompanying notes are an integral part of these financial statements.
53
STATEMENTS OF CHANGES IN NET ASSETS
| | | Alternative Energy Fund | | Asia Focus Fund | | Asia Pacific Dividend Fund | |
| | | Year Ended
December 31, 2009 | | Year Ended
December 31, 2008 | | Year Ended
December 31, 2009 | | Year Ended
December 31, 2008 | | Year Ended
December 31, 2009 | | Year Ended
December 31, 2008 | |
Increase/(decrease) in
net assets from: | |
| Operations | |
| Net investment income (loss) | | $ | (548,371 | ) | | $ | (906,620 | ) | | $ | 426,945 | | | $ | 1,175,470 | | | $ | 170,178 | | | $ | 750,995 | | |
| Net realized gain (loss) on: | |
| Investments | | | (15,487,017 | ) | | | (35,114,839 | ) | | | 2,730,063 | | | | 466,697 | | | | (888,126 | ) | | | (2,626,075 | ) | |
| Foreign currency | | | (62,413 | ) | | | (705,005 | ) | | | (99,870 | ) | | | 365,724 | | | | (2,651 | ) | | | 606,552 | | |
Net change in unrealized
appreciation (depreciation) on: | |
| Investments | | | 32,503,361 | | | | (68,104,600 | ) | | | 24,122,291 | | | | (37,029,047 | ) | | | 4,221,897 | | | | (6,558,377 | ) | |
| Foreign currency | | | 15,961 | | | | 3,911 | | | | (2,161 | ) | | | (392 | ) | | | 421 | | | | 526 | | |
Net decrease in net assets
resulting from operations | | | 16,421,521 | | | | (104,827,153 | ) | | | 27,177,268 | | | | (35,021,548 | ) | | | 3,501,719 | | | | (7,826,379 | ) | |
| Distributions to shareholders | |
| From net investment income | | | — | | | | (56,152 | ) | | | (513,961 | ) | | | (1,481,421 | ) | | | (171,895 | ) | | | (618,757 | ) | |
| From net realized gains | | | — | | | | (3,209,321 | ) | | | — | | | | — | | | | — | | | | (538,081 | ) | |
| Return of capital | | | (2,159,540 | ) | | | — | | | | — | | | | — | | | | (281,806 | ) | | | — | | |
Total distributions to
shareholders | | | (2,159,540 | ) | | | (3,265,473 | ) | | | (513,961 | ) | | | (1,481,421 | ) | | | (453,701 | ) | | | (1,156,838 | ) | |
| Capital transactions | |
| Proceeds from shares sold | | | 19,239,689 | | | | 80,171,434 | | | | 74,855,418 | | | | 4,969,746 | | | | 5,058,095 | | | | 9,399,423 | | |
| Reinvestment of distributions | | | 2,058,447 | | | | 3,123,216 | | | | 503,425 | | | | 1,393,044 | | | | 440,374 | | | | 1,118,185 | | |
| Cost of shares repurchased | | | (20,602,783 | ) | | | (89,824,819 | ) | | | (11,393,129 | ) | | | (26,261,994 | ) | | | (2,436,707 | ) | | | (28,022,013 | ) | |
| Redemption fee proceeds | | | 6,401 | | | | 47,017 | | | | 13,096 | | | | 7,441 | | | | 1,787 | | | | 4,518 | | |
Net change in net assets from
capital transactions | | | 701,754 | | | | (6,483,152 | ) | | | 63,978,810 | | | | (19,891,763 | ) | | | 3,063,549 | | | | (17,499,887 | ) | |
Total increase (decrease) in
net assets | | | 14,963,735 | | | | (114,575,778 | ) | | | 90,642,117 | | | | (56,394,732 | ) | | | 6,111,567 | | | | (26,483,104 | ) | |
| Net assets | |
| Beginning of period | | | 47,144,931 | | | | 161,720,709 | | | | 21,779,172 | | | | 78,173,904 | | | | 5,267,775 | | | | 31,750,879 | | |
| End of period | | $ | 62,108,666 | | | $ | 47,144,931 | | | $ | 112,421,289 | | | $ | 21,779,172 | | | $ | 11,379,342 | | | $ | 5,267,775 | | |
Accumulated net investment
income (loss) | | $ | (55,427 | ) | | $ | (1,626,044 | ) | | $ | (206,719 | ) | | $ | 19,134 | | | $ | (15,380 | ) | | $ | 383,289 | | |
| Capital share activity | |
| Shares sold | | | 3,439,315 | | | | 6,652,487 | | | | 4,823,789 | | | | 264,117 | | | | 501,073 | | | | 583,170 | | |
| Shares issued on reinvestment | | | 311,414 | | | | 606,398 | | | | 28,734 | | | | 147,255 | | | | 41,932 | | | | 116,776 | | |
| Shares redeemed | | | (3,533,714 | ) | | | (8,040,199 | ) | | | (763,543 | ) | | | (1,386,566 | ) | | | (263,329 | ) | | | (1,843,327 | ) | |
Net increase (decrease) in
shares outstanding | | | 217,015 | | | | (781,314 | ) | | | 4,088,980 | | | | (975,194 | ) | | | 279,676 | | | | (1,143,381 | ) | |
The accompanying notes are an integral part of these financial statements.
54
STATEMENTS OF CHANGES IN NET ASSETS
| | | China & Hong Kong Fund | | Global Energy Fund | | Global Innovators Fund | |
| | | Year Ended
December 31, 2009 | | Year Ended
December 31, 2008 | | Year Ended
December 31, 2009 | | Year Ended
December 31, 2008 | | Year Ended
December 31, 2009 | | Year Ended
December 31, 2008 | |
Increase/(decrease) in
net assets from: | |
| Operations | |
| Net investment income (loss) | | $ | 1,074,857 | | | $ | 4,290,824 | | | $ | 364,720 | | | $ | 482,874 | | | $ | (24,136 | ) | | $ | 1,551,304 | | |
| Net realized gain (loss) on: | |
| Investments | | | 6,503,684 | | | | 7,590,319 | | | | 1,022,108 | | | | (1,301,999 | ) | | | 2,275,531 | | | | 2,723,192 | | |
| Foreign currency | | | (3,287 | ) | | | 213,150 | | | | (38,884 | ) | | | (730,032 | ) | | | 47 | | | | 91,507 | | |
Net change in unrealized
appreciation (depreciation) on: | |
| Investments | | | 105,157,080 | | | | (159,421,621 | ) | | | 18,267,865 | | | | (33,526,117 | ) | | | 9,993,061 | | | | (33,161,655 | ) | |
| Foreign currency | | | (34 | ) | | | (20 | ) | | | 1,336 | | | | (1,629 | ) | | | — | | | | 1,195 | | |
Net decrease in net assets
resulting from operations | | | 112,732,300 | | | | (147,327,348 | ) | | | 19,617,145 | | | | (35,076,903 | ) | | | 12,244,503 | | | | (28,794,457 | ) | |
| Distributions to shareholders | |
| From net investment income | | | (2,242,023 | ) | | | (3,332,293 | ) | | | — | | | | — | | | | — | | | | (1,527,390 | ) | |
| From net realized gain | | | (7,315,000 | ) | | | (477,128 | ) | | | — | | | | (1,305,040 | ) | | | — | | | | — | | |
| Return of capital | | | — | | | | — | | | | — | | | | — | | | | (83,526 | ) | | | — | | |
Total distributions to
shareholders | | | (9,557,023 | ) | | | (3,809,421 | ) | | | — | | | | (1,305,040 | ) | | | (83,526 | ) | | | (1,527,390 | ) | |
| Capital transactions | |
| Proceeds from shares sold | | | 65,170,359 | | | | 77,708,161 | | | | 40,443,719 | | | | 29,358,452 | | | | 2,835,972 | | | | 9,332,518 | | |
| Reinvestment of distributions | | | 9,376,023 | | | | 3,730,751 | | | | — | | | | 1,191,223 | | | | 81,714 | | | | 1,488,756 | | |
| Cost of shares repurchased | | | (60,166,042 | ) | | | (100,248,518 | ) | | | (14,897,300 | ) | | | (33,735,772 | ) | | | (7,971,680 | ) | | | (23,720,926 | ) | |
| Redemption fee proceeds | | | 89,972 | | | | 96,461 | | | | 40,140 | | | | 19,088 | | | | 349 | | | | 1,594 | | |
Net change in net assets from
capital transactions | | | 14,470,312 | | | | (18,713,145 | ) | | | 25,586,559 | | | | (3,167,009 | ) | | | (5,053,645 | ) | | | (12,898,058 | ) | |
Total increase (decrease) in
net assets | | | 117,645,589 | | | | (169,849,914 | ) | | | 45,203,704 | | | | (39,548,952 | ) | | | 7,107,332 | | | | (43,219,905 | ) | |
| Net assets | |
| Beginning of period | | | 123,314,554 | | | | 293,164,468 | | | | 30,156,185 | | | | 69,705,137 | | | | 29,613,592 | | | | 72,833,497 | | |
| End of period | | $ | 240,960,143 | | | $ | 123,314,554 | | | $ | 75,359,889 | | | $ | 30,156,185 | | | $ | 36,720,924 | | | $ | 29,613,592 | | |
Accumulated net investment
income (loss) | | $ | 727,439 | | | $ | 1,897,892 | | | $ | (134,588 | ) | | $ | (311,851 | ) | | $ | (49,612 | ) | | $ | 55,129 | | |
| Capital share activity | |
| Shares sold | | | 2,210,880 | | | | 2,576,016 | | | | 1,747,556 | | | | 929,313 | | | | 214,654 | | | | 516,472 | | |
| Shares issued on reinvestment | | | 268,745 | | | | 198,652 | | | | — | | | | 76,803 | | | | 5,001 | | | | 134,729 | | |
| Shares redeemed | | | (2,117,299 | ) | | | (3,092,551 | ) | | | (727,270 | ) | | | (1,270,482 | ) | | | (600,921 | ) | | | (1,368,355 | ) | |
Net increase (decrease) in
shares outstanding | | | 362,326 | | | | (317,883 | ) | | | 1,020,286 | | | | (264,366 | ) | | | (381,266 | ) | | | (717,154 | ) | |
The accompanying notes are an integral part of these financial statements.
55
FINANCIAL HIGHLIGHTS
For a capital share outstanding throughout the period
| | | Year Ended December 31, | | March 31, 2006(1)
Through | |
| Alternative Energy Fund | | 2009 | | 2008 | | 2007 | | December 31, 2006 | |
| Net asset value, beginning of period | | $ | 5.14 | | | $ | 16.25 | | | $ | 11.47 | | | $ | 12.50 | | |
| Income from investment operations: | |
| Net investment income (loss) | | | (0.05 | ) | | | (0.10 | ) | | | (0.05 | ) | | | (0.11 | ) | |
| Net realized and unrealized gain (loss) on investments and foreign currency | | | 1.77 | | | | (10.64 | ) | | | 4.93 | | | | (0.93 | ) | |
| Total from investment operations | | | 1.72 | | | | (10.74 | ) | | | 4.88 | | | | (1.04 | ) | |
| Less distributions: | |
| From net investment income | | | — | | | | (0.01 | ) | | | — | | | | — | | |
| From net realized gain | | | — | | | | (0.37 | ) | | | (0.11 | ) | | | — | | |
| Return of capital | | | (0.24 | ) | | | — | | | | — | | | | — | | |
| Total distributions | | | (0.24 | ) | | | (0.38 | ) | | | (0.11 | ) | | | — | | |
| Redemption fee proceeds | | | — | (2) | | | 0.01 | | | | 0.01 | | | | 0.01 | | |
| Net asset value, end of period | | $ | 6.62 | | | $ | 5.14 | | | $ | 16.25 | | | $ | 11.47 | | |
| Total return | | | 33.42 | % | | | (66.05 | )% | | | 42.68 | % | | | (8.24 | )%(3) | |
| Ratios/supplemental data: | |
| Net assets, end of period (millions) | | $ | 62.1 | | | $ | 47.1 | | | $ | 161.7 | | | $ | 15.7 | | |
| Ratio of expenses to average net assets: | |
| Before fees waived | | | 1.85 | % | | | 1.69 | % | | | 1.64 | % | | | 2.60 | %(4) | |
| After fees waived | | | 1.85 | % | | | 1.69 | % | | | 1.64 | % | | | 1.98 | %(4) | |
| After fees waived excluding interest expense(5) | | | 1.85 | % | | | 1.67 | % | | | 1.62 | % | | | 1.97 | %(4) | |
| Ratio of net investment loss to average net assets: | |
| Before fees waived | | | (0.98 | )% | | | (0.80 | )% | | | (0.90 | )% | | | (2.18 | )%(4) | |
| After fees waived | | | (0.98 | )% | | | (0.80 | )% | | | (0.90 | )% | | | (1.56 | )%(4) | |
| Portfolio turnover rate | | | 47.10 | % | | | 94.76 | % | | | 47.41 | % | | | 21.71 | %(3) | |
(1) Commencement of Operations.
(2) Amount represents less than $0.01 per share.
(3) Not annualized.
(4) Annualized.
(5) The Advisor has contractually agreed to limit the operating expenses of the Fund to 1.98%, excluding interest expense, expenses related to dividends on short positions, brokerage commissions, taxes and other extraordinary expenses. See Note 3.
The accompanying notes are an integral part of these financial statements.
56
FINANCIAL HIGHLIGHTS
For a capital share outstanding throughout the year
| | | Year Ended December 31, | |
| Asia Focus Fund | | 2009 | | 2008 | | 2007 | | 2006 | | 2005 | |
| Net asset value, beginning of period | | $ | 9.52 | | | $ | 23.96 | | | $ | 16.60 | | | $ | 12.38 | | | $ | 10.40 | | |
| Income from investment operations: | |
| Net investment income | | | 0.06 | (1) | | | 0.55 | | | | 0.27 | | | | 0.24 | | | | 0.16 | | |
Net realized and unrealized gain (loss)
on investments and foreign currency | | | 8.13 | | | | (14.30 | ) | | | 7.35 | | | | 4.18 | | | | 2.00 | | |
| Total from investment operations | | | 8.19 | | | | (13.75 | ) | | | 7.62 | | | | 4.42 | | | | 2.16 | | |
| Less distributions: | |
| From net investment income | | | (0.08 | ) | | | (0.69 | ) | | | (0.28 | ) | | | (0.24 | ) | | | (0.18 | ) | |
| Total distributions | | | (0.08 | ) | | | (0.69 | ) | | | (0.28 | ) | | | (0.24 | ) | | | (0.18 | ) | |
| Redemption fee proceeds | | | — | (2) | | | — | (2) | | | 0.02 | | | | 0.04 | | | | — | (2) | |
| Net asset value, end of period | | $ | 17.63 | | | $ | 9.52 | | | $ | 23.96 | | | $ | 16.60 | | | $ | 12.38 | | |
| Total return | | | 86.05 | % | | | (57.38 | )% | | | 46.00 | % | | | 36.15 | % | | | 20.83 | % | |
| Ratios/supplemental data: | |
| Net assets, end of period (millions) | | $ | 112.4 | | | $ | 21.8 | | | $ | 78.2 | | | $ | 49.3 | | | $ | 36.5 | | |
| Ratio of expenses to average net assets: | |
| Before fees waived | | | 1.68 | % | | | 1.75 | % | | | 1.69 | % | | | 1.84 | % | | | 1.87 | % | |
| After fees waived | | | 1.68 | % | | | 1.75 | % | | | 1.69 | % | | | 1.84 | % | | | 1.87 | % | |
| After fees waived excluding interest expense(3) | | | 1.68 | % | | | 1.70 | % | | | 1.63 | % | | | 1.81 | % | | | 1.86 | % | |
| Ratio of net investment income to average net assets: | |
| Before fees waived | | | 0.73 | % | | | 2.55 | % | | | 1.34 | % | | | 1.48 | % | | | 1.41 | % | |
| After fees waived | | | 0.73 | % | | | 2.55 | % | | | 1.34 | % | | | 1.48 | % | | | 1.41 | % | |
| Portfolio turnover rate | | | 31.35 | % | | | 28.89 | % | | | 31.17 | % | | | 95.68 | % | | | 18.25 | % | |
(1) Based on average shares outstanding during the period.
(2) Amount represents less than $0.01 per share.
(3) The Advisor has contractually agreed to limit the operating expenses of the Fund to 1.98%, excluding interest expense, expenses related to dividends on short positions, borkerage commissions, taxes and other extraordinary expenses. See Note 3.
The accompanying notes are an integral part of these financial statements.
57
FINANCIAL HIGHLIGHTS
For a capital share outstanding throughout the period
| | | Year Ended December 31, | | March 31, 2006(1)
Through | |
| Asia Pacific Dividend Fund | | 2009 | | 2008 | | 2007 | | December 31, 2006 | |
| Net asset value, beginning of period | | $ | 7.00 | | | $ | 16.75 | | | $ | 13.56 | | | $ | 12.50 | | |
| Income from investment operations: | |
| Net investment income | | | 0.18 | (2) | | | 0.75 | | | | 0.24 | | | | 0.25 | | |
| Net realized and unrealized gain (loss) on investments and foreign currency | | | 4.32 | | | | (9.22 | ) | | | 3.32 | | | | 1.03 | | |
| Total from investment operations | | | 4.50 | | | | (8.47 | ) | | | 3.56 | | | | 1.28 | | |
| Less distributions: | |
| From net investment income | | | (0.18 | ) | | | (0.51 | ) | | | (0.27 | ) | | | (0.23 | ) | |
| From net realized gain | | | — | | | | (0.78 | ) | | | (0.11 | ) | | | — | | |
| Return of capital | | | (0.29 | ) | | | — | | | | — | | | | — | | |
| Total distributions | | | (0.47 | ) | | | (1.29 | ) | | | (0.38 | ) | | | (0.23 | ) | |
| Redemption fee proceeds | | | — | (3) | | | 0.01 | | | | 0.01 | | | | 0.01 | | |
| Net asset value, end of period | | $ | 11.03 | | | $ | 7.00 | | | $ | 16.75 | | | $ | 13.56 | | |
| Total return | | | 64.84 | % | | | (51.74 | )% | | | 26.30 | % | | | 10.59 | %(4) | |
| Ratios/supplemental data: | |
| Net assets, end of period (millions) | | $ | 11.4 | | | $ | 5.3 | | | $ | 31.8 | | | $ | 1.1 | | |
| Ratio of expenses to average net assets: | |
| Before fees waived | | | 2.93 | % | | | 2.33 | % | | | 2.09 | % | | | 17.86 | %(5) | |
| After fees waived | | | 1.98 | % | | | 2.10 | % | | | 1.98 | % | | | 1.98 | %(5) | |
| After fees waived excluding interest expense(6) | | | 1.98 | % | | | 1.98 | % | | | 1.92 | % | | | 1.96 | %(5) | |
| Ratio of net investment income (loss) to average net assets: | |
| Before fees waived | | | 1.23 | % | | | 3.71 | % | | | 2.14 | % | | | (13.02 | )%(5) | |
| After fees waived | | | 2.18 | % | | | 3.94 | % | | | 2.25 | % | | | 2.86 | %(5) | |
| Portfolio turnover rate | | | 26.03 | % | | | 48.02 | % | | | 40.38 | % | | | 34.12 | %(4) | |
(1) Commencement of Operations.
(2) Based on average shares outstanding during the period.
(3) Amount represents less than $0.01 per share.
(4) Not annualized.
(5) Annualized.
(6) The Advisor has contractually agreed to limit the operating expenses of the Fund to 1.98%, excluding interest expense, expenses related to dividends on short positions, brokerage commissions, taxes and other extraordinary expenses. See Note 3.
The accompanying notes are an integral part of these financial statements.
58
FINANCIAL HIGHLIGHTS
For a capital share outstanding throughout the year
| | | Year Ended December 31, | |
| China & Hong Kong Fund | | 2009 | | 2008 | | 2007 | | 2006 | | 2005 | |
| Net asset value, beginning of period | | $ | 18.98 | | | $ | 43.02 | | | $ | 26.48 | | | $ | 18.97 | | | $ | 18.57 | | |
| Income from investment operations: | |
| Net investment income | | | 0.15 | | | | 0.68 | | | | 0.28 | | | | 0.43 | | | | 0.37 | | |
Net realized and unrealized gain (loss)
on investments and foreign currency | | | 17.44 | | | | (24.13 | ) | | | 16.91 | | | | 7.09 | | | | 0.86 | | |
| Total from investment operations | | | 17.59 | | | | (23.45 | ) | | | 17.19 | | | | 7.52 | | | | 1.23 | | |
| Less distributions: | |
| From net investment income | | | (0.34 | ) | | | (0.53 | ) | | | (0.59 | ) | | | (0.01 | ) | | | (0.83 | ) | |
| From net realized gain | | | (1.11 | ) | | | (0.07 | ) | | | (0.10 | ) | | | — | | | | — | | |
| Total distributions | | | (1.45 | ) | | | (0.60 | ) | | | (0.69 | ) | | | (0.01 | ) | | | (0.83 | ) | |
| Redemption fee proceeds | | | 0.01 | | | | 0.01 | | | | 0.04 | | | | — | (1) | | | — | (1) | |
| Net asset value, end of period | | $ | 35.13 | | | $ | 18.98 | | | $ | 43.02 | | | $ | 26.48 | | | $ | 18.97 | | |
| Total return | | | 92.76 | % | | | (54.47 | )% | | | 65.06 | % | | | 39.65 | % | | | 6.61 | % | |
| Ratios/supplemental data: | |
| Net assets, end of period (millions) | | $ | 241.0 | | | $ | 123.3 | | | $ | 293.2 | | | $ | 143.0 | | | $ | 111.0 | | |
| Ratio of expenses to average net assets | |
| Before fees waived | | | 1.58 | % | | | 1.52 | % | | | 1.44 | % | | | 1.59 | % | | | 1.63 | % | |
| After fees waived | | | 1.58 | % | | | 1.52 | % | | | 1.44 | % | | | 1.59 | % | | | 1.63 | % | |
| After fees waived excluding interest expense(2) | | | 1.58 | % | | | 1.51 | % | | | 1.44 | % | | | 1.59 | % | | | 1.63 | % | |
| Ratio of net investment income to average net assets | | | 0.62 | % | | | 2.22 | % | | | 1.17 | % | | | 2.01 | % | | | 1.74 | % | |
| Portfolio turnover rate | | | 7.87 | % | | | 26.62 | % | | | 10.00 | % | | | 64.81 | % | | | 12.51 | % | |
(1) Amount represents less than $0.01 per share.
(2) The Advisor has contractually agreed to limit the operating expenses of the Fund to 1.98%, excluding interest expense, expenses related to dividends on short positions, borkerage commissions, taxes and other extraordinary expenses. See Note 3.
The accompanying notes are an integral part of these financial statements.
59
FINANCIAL HIGHLIGHTS
For a capital share outstanding throughout the year
| | | Year Ended December 31, | |
| Global Energy Fund | | 2009 | | 2008 | | 2007 | | 2006 | | 2005 | |
| Net asset value, beginning of period | | $ | 15.68 | | | $ | 31.86 | | | $ | 25.54 | | | $ | 24.62 | | | $ | 15.25 | | |
| Income from investment operations: | |
| Net investment income (loss) | | | 0.11 | | | | 0.22 | | | | 0.05 | | | | 0.01 | | | | (0.02 | ) | |
Net realized and unrealized gain (loss)
on investments and foreign currency | | | 9.80 | | | | (15.71 | ) | | | 9.50 | | | | 2.44 | | | | 9.75 | | |
| Total from investment operations | | | 9.91 | | | | (15.49 | ) | | | 9.55 | | | | 2.45 | | | | 9.73 | | |
| Less distributions: | |
| From net investment income | | | — | | | | — | | | | (0.27 | ) | | | (0.21 | ) | | | — | | |
| From net realized gain | | | — | | | | (0.70 | ) | | | (2.96 | ) | | | (1.34 | ) | | | (0.39 | ) | |
| Total distributions | | | — | | | | (0.70 | ) | | | (3.23 | ) | | | (1.55 | ) | | | (0.39 | ) | |
| Redemption fee proceeds | | | 0.01 | | | | 0.01 | | | | — | (1) | | | 0.02 | | | | 0.03 | | |
| Net asset value, end of period | | $ | 25.60 | | | $ | 15.68 | | | $ | 31.86 | | | $ | 25.54 | | | $ | 24.62 | | |
| Total return | | | 63.27 | % | | | (48.56 | )% | | | 37.25 | % | | | 9.85 | % | | | 63.92 | % | |
| Ratios/supplemental data: | |
| Net assets, end of period (millions) | | $ | 75.4 | | | $ | 30.2 | | | $ | 69.7 | | | $ | 65.0 | | | $ | 98.7 | | |
| Ratio of expenses to average net assets: | |
| Before fees waived | | | 1.42 | % | | | 1.31 | % | | | 1.37 | % | | | 1.45 | % | | | 1.50 | % | |
| After fees waived | | | 1.42 | % | | | 1.31 | % | | | 1.37 | % | | | 1.45 | % | | | 1.45 | % | |
| After fees waived excluding interest expense(2) | | | 1.42 | % | | | 1.30 | % | | | 1.35 | % | | | 1.41 | % | | | 1.42 | % | |
| Ratio of net investment income (loss) to average net assets: | |
| Before fees waived | | | 0.82 | % | | | 0.76 | % | | | 0.22 | % | | | 0.04 | % | | | (0.24 | )% | |
| After fees waived | | | 0.82 | % | | | 0.76 | % | | | 0.22 | % | | | 0.04 | % | | | (0.19 | )% | |
| Portfolio turnover rate | | | 51.74 | % | | | 74.90 | % | | | 31.13 | % | | | 47.22 | % | | | 89.24 | % | |
(1) Amount represents less than $0.01 per share.
(2) The Advisor has contractually agreed to limit the operating expenses of the Fund to 1.45%, excluding interest expense, expenses related to dividends on short positions, brokerage commissions, taxes and other extraordinary expenses. See Note 3.
The accompanying notes are an integral part of these financial statements.
60
FINANCIAL HIGHLIGHTS
For a capital share outstanding throughout the year
| | | Year Ended December 31, | |
| Global Innovators Fund | | 2009 | | 2008 | | 2007 | | 2006 | | 2005 | |
| Net asset value, beginning of period | | $ | 11.21 | | | $ | 21.68 | | | $ | 17.98 | | | $ | 15.14 | | | $ | 13.54 | | |
| Income from investment operations: | |
| Net investment income (loss) | | | (0.01 | ) | | | 0.62 | | | | 0.08 | | | | 0.01 | | | | (0.05 | ) | |
Net realized and unrealized gain (loss)
on investments | | | 5.08 | | | | (10.48 | ) | | | 3.72 | | | | 2.83 | | | | 1.65 | | |
| Total from investment operations | | | 5.07 | | | | (9.86 | ) | | | 3.80 | | | | 2.84 | | | | 1.60 | | |
| Less distributions: | |
| From net investment income | | | — | | | | (0.61 | ) | | | (0.11 | ) | | | — | | | | — | | |
| Return of capital | | | (0.04 | ) | | | — | | | | — | | | | — | | | | — | | |
| Total distributions | | | (0.04 | ) | | | (0.61 | ) | | | (0.11 | ) | | | — | | | | — | | |
| Redemption fee proceeds | | | — | (1) | | | — | (1) | | | 0.01 | | | | — | (1) | | | — | (1) | |
| Net asset value, end of period | | $ | 16.24 | | | $ | 11.21 | | | $ | 21.68 | | | $ | 17.98 | | | $ | 15.14 | | |
| Total return | | | 45.20 | % | | | (45.42 | )% | | | 21.17 | % | | | 18.76 | % | | | 11.82 | %(2) | |
| Ratios/supplemental data: | |
| Net assets, end of period (millions) | | $ | 36.7 | | | $ | 29.6 | | | $ | 72.8 | | | $ | 39.3 | | | $ | 36.4 | | |
| Ratio of expenses to average net assets: | |
| Before fees waived | | | 1.69 | % | | | 1.40 | % | | | 1.44 | % | | | 1.64 | % | | | 1.66 | % | |
| After fees waived | | | 1.56 | % | | | 1.40 | % | | | 1.44 | % | | | 1.55 | % | | | 1.66 | %(2) | |
| After fees waived excluding interest expense(3) | | | 1.55 | % | | | 1.39 | % | | | 1.43 | % | | | 1.53 | % | | | 1.63 | %(2) | |
| Ratio of net investment income (loss) to average net assets: | |
| Before fees waived | | | (0.20 | )% | | | 3.07 | % | | | 0.49 | % | | | 0.00 | % | | | (0.32 | )% | |
| After fees waived | | | (0.07 | )% | | | 3.07 | % | | | 0.49 | % | | | 0.09 | % | | | (0.32 | )% | |
| Portfolio turnover rate | | | 50.54 | % | | | 36.49 | % | | | 25.54 | % | | | 36.53 | % | | | 27.75 | % | |
(1) Amount represents less than $0.01 per share.
(2) The Fund's total operating expense was limited to 1.88% from 4/23/03 to 10/31/05.
(3) The Advisor has contractually agreed to limit the operating expenses of the Fund to 1.55%, excluding interest expense, expenses related to dividends on short positions, borkerage commissions, taxes and other extraordinary expenses. See Note 3.
The accompanying notes are an integral part of these financial statements.
61
NOTES TO FINANCIAL STATEMENTS
Note 1
Organization
Guinness Atkinson Funds (the "Trust"), was organized on April 28, 1997 as a Delaware business trust and registered under the Investment Company Act of 1940, as amended (the "1940 Act"), as a non-diversified, open-end management investment company. Currently, the Trust offers six separate series: Guinness Atkinson Alternative Energy Fund (the "Alternative Energy Fund"), Guinness Atkinson Asia Focus Fund (the "Asia Focus Fund"), Guinness Atkinson Asia Pacific Dividend Fund (the "Asia Pacific Dividend Fund"), Guinness Atkinson China & Hong Kong Fund (the "China & Hong Kong Fund"), Guinness Atkinson Global Energy Fund (the "Global Energy Fund"), and Guinness Atkinson Global Innovators Fund (the "Global Innovators Fund"), all of which (each a "Fund" and collectively, the "Funds") are covered by this report. The China & Hong Kong Fund began operations on June 30, 1994, the Asia Focus Fund began operations on April 29, 1996, the Global Innovators Fund began operations on December 15, 1998, the Global Energy Fund began operations on June 30, 2004, and the Alternative Energy Fund and the Asia Pacific Dividend Fund began operations on March 31, 2006.
The Alternative Energy Fund and Asia Focus Fund's investment objective is long-term capital appreciation. The Asia Pacific Dividend Fund's investment objective is to provide investors with dividend income and long-tern capital growth. The China & Hong Kong Fund's investment objective is long-term capital appreciation primarily through investments in securities of China and Hong Kong. The Global Energy Fund and Global Innovators Fund's investment objective is long-term capital appreciation.
Note 2
Significant accounting policies
The following is a summary of significant accounting policies consistently followed by the Funds. These policies are in conformity with accounting principles generally accepted in the United States of America.
A. Security Valuation. Securities of the Funds that are traded on a principal exchange (U.S. or foreign) or NASDAQ are valued at the official closing price on each day that the exchanges are open for trading. Securities traded on an exchange for which there have been no sales, and other over-the-counter securities are valued at the mean between the bid and asked prices. Securities for which quotations are not readily available are valued at their respective fair values as determined in good faith by the Investment Advisor in accordance with procedures established by the Board of Trustees. In determining fair value, the Funds take into account all relevant factors and available information. Consequently, the price of the security used to calculate its Net Asset Value may differ from quoted or published prices for the same security. Fair value pricing inv olves subjective judgments and there is no single standard for determining a security's fair value. As a result, different mutual funds could reasonably arrive at different fair value for the same security. It is possible that the fair value determined for a security is materially different from the value that could be realized upon the sale of that security or from the values that other mutual funds may determine. Short-term investments are stated at cost, combined with accrued interest, which approximates market value. Realized gains and losses from securities transactions are calculated using the identified cost method.
Foreign securities are recorded in the financial statements after translation to U.S. dollars based on the applicable exchange rate at the end of the period. The Funds do not isolate that portion of the results of operations resulting from changes in the currency exchange rate from the fluctuations resulting from changes in the market prices of investments.
Foreign exchange gain or loss resulting from holding of a foreign currency, expiration of a currency exchange contract, difference in exchange rates between the trade date and settlement date of an investment purchased or sold, and the difference between dividends actually received compared to the amount shown in a Fund's accounting records on the date of receipt are shown as net realized gains or losses on foreign currency transactions in the respective Fund's statement of operations.
B. Forward Foreign Currency Exchange Contracts. The Funds may utilize forward foreign currency exchange contracts ("forward contracts") to hedge against foreign exchange fluctuations on foreign denominated investments under which they are obligated to exchange currencies at specific future dates and at specified rates. All commitments are "marked-to-market" daily and any resulting unrealized gains or losses are included as unrealized appreciation (depreciation) on foreign currency denominated assets and liabilities. The Funds record realized gains or losses at the time the forward contract is settled. Risks may arise upon entering these contracts from the potential inability of a counter party to meet the terms of their contracts and from unanticipated movements in the value of a foreign currency relative to the U.S. dollar or other currencies. Counterp arties to these contracts are major U.S. financial institutions. Please refer to Note 7 for further information on Forward Contracts in each Fund.
62
C. Restricted Securities. A restricted security cannot be resold to the general public without prior registration under the Securities Act of 1933. If the security is subsequently registered and resold, the issuers would typically bear the expense of all registrations at no cost to the Fund. Restricted securities are valued according to the guidelines and procedures adopted by the Funds' Board of Trustees.
D. Security Transactions, Dividend Income and Distributions. Security transactions are accounted for on the trade date. Dividend income and distributions to shareholders are recorded on the ex-dividend date. Realized gains and losses from securities transactions are calculated using the identified cost method.
E. Allocation of Expenses. Each Fund is charged for those expenses directly attributable to it. Expenses that are not directly attributable to a Fund are allocated among the Funds in proportion to their respective assets or another appropriate method.
F. Concentration of Risk. The Alternative Energy Fund invests substantially in the alternative energy or energy technology sectors. The Asia Focus Fund invests substantially all of its assets in the Asian continent. The Asia Pacific Dividend Fund invests primarily in dividend-producing equity securities of Asia Pacific companies. The China & Hong Kong Fund invests substantially all of its assets in securities that are traded in China or Hong Kong or that are issued by companies that do a substantial part of their business in China. The Global Energy Fund invests substantially in energy companies; the changes in the prices and supplies of oil and other energy fuels may affect the Funds' investments. The consequences of political, social, or economic changes in the countries or business sectors in which the securities are offered or the issuers conduc t their operations may affect the market prices of the Funds' investments and any income generated, as well as the Funds' ability to repatriate such amounts.
G. Use of Estimates. The preparation of financial statements in conformity with accounting principles generally accepted in the United States requires management to make estimates and assumptions that affect the reported amounts of assets and liabilities and the disclosure of contingent assets and liabilities at the date of the financial statements. Actual results could differ from those estimates.
H. Reclassifications. Accounting principals generally accepted in the United States require that certain components of net assets be reclassified between financial and tax reporting. These reclassifications have no effect on net assets or net asset value per share. For the year ended December 31, 2009, permanent differences in book and tax accounting have been reclassified to paid-in capital, undistributed net investment income/(loss) and accumulated realized gain/(loss) and accumulated realized gain/(loss) as follows:
| | | Increase (Decrease) | |
| | | Paid in Capital | | Undistributed Net
Investment
Income/(Loss) | | Accumulated
Gains or
(Losses) | |
| Alternative Energy Fund | | $ | (2,049,834 | ) | | $ | 2,118,988 | | | $ | (69,154 | ) | |
| Asia Focus Fund | | | (400,082 | ) | | | (138,837 | ) | | | 538,919 | | |
| Asia Pacific Dividend Fund | | | (290,251 | ) | | | (396,952 | ) | | | 687,203 | | |
| China & Hong Kong Fund | | | | | | | (3,287 | ) | | | 3,287 | | |
| Global Energy Fund | | | 597,684 | | | | (187,457 | ) | | | (410,227 | ) | |
| Global Innovators Fund | | | (8,800,631 | ) | | | (80,605 | ) | | | 8,881,236 | | |
The permanent differences primarily relate to expired capital loss carryovers, lost operating losses, and foreign currency reclasses.
I. Indemnifications. Under the Funds' organizational documents, its current and former officers and trustees are indemnified against certain liabilities arising out of the performance of their duties to the Funds. In addition, in the normal course of business, the Funds enter into contracts that contain a variety of representations and warranties that provide general indemnifications. The Funds' maximum exposure under these arrangements is unknown as this would involve future claims that may be made against the Funds that have not yet occurred or that would be covered by other parties.
J. Federal Income Taxes. The Funds intend to comply with the requirements of Subchapter M of the Internal Revenue Code applicable to regulated investment companies, and to distribute all of their taxable income to their shareholders. Therefore, no federal income tax provision is required.
63
The Funds recognize the tax benefits of uncertain tax positions only where the position is "more likely than not" to be sustained assuming examination by tax authorities. Management has analyzed the Funds' tax positions, and has concluded that no liability for unrecognized tax benefits should be recorded related to uncertain tax positions taken on returns filed for open tax years 2006 through 2008, or expected to be taken in the Funds' 2009 tax returns. The Funds' identify their major tax jurisdiction as U.S. Federal, California State and foreign jurisdictions where the Funds make significant investments; however the Funds are not aware of any tax positions for which it is reasonably possible that the total amounts of unrecognized tax benefits will change materially in the next twelve months.
Note 3
Investment Advisory and Other Agreements
The Trust, on behalf of each Fund, entered into an Investment Advisory Agreement with Guinness Atkinson Asset Management, Inc. (the "Advisor"), which provides the Funds with investment management services. The Advisor furnishes all investment advice, office space, facilities, and most of the personnel needed by the Funds. As compensation for its services, the Advisor is entitled to a monthly fee at the following annual rates based upon the average daily net assets of the Funds:
| Alternative Energy Fund | | 1.00% | |
| Asia Focus Fund | | 1.00% | |
| Asia Pacific Dividend Fund | | 1.00% | |
| China & Hong Kong Fund | | 1.00% | |
| Global Energy Fund | | 0.75% | |
| Global Innovators Fund | | 0.75% on the 1st $500 million, 0.60% thereafter | |
The Funds are responsible for their own operating expenses. The Advisor has contractually agreed to limit each Fund's total operating expenses (excluding interest, dividends on short positions, taxes and extraordinary expenses) by reducing all or a portion of their fees and reimbursing the Fund for expenses so that its ratio of expenses to average daily net assets will not exceed the following levels:
| Alternative Energy Fund | | | 1.98 | % | |
| Asia Focus Fund | | | 1.98 | % | |
| Asia Pacific Dividend Fund | | | 1.98 | % | |
| China & Hong Kong Fund | | | 1.98 | % | |
| Global Energy Fund | | | 1.45 | % | |
| Global Innovators Fund | | | 1.55 | % | |
The expense ratios shown in the financial highlights may exceed these levels due to expenses incurred, but not covered by the expense limitation agreement.
To the extent that the Advisor waives fees and/or absorbs expenses it may seek repayment of a portion or all of such amounts at any time within three fiscal years after the fiscal year in which such amounts were waived or absorbed, subject to the applicable cap. For the year ended December 31, 2009, the Advisor waived fees and absorbed expenses in the following Funds:
| Asia Pacific Dividend Fund | | $ | 73,950 | | |
| Global Innovators Fund | | $ | 40,902 | | |
64
At December 31, 2009 the Advisor may recapture a portion of the following amounts that has been paid and/or waived on behalf of the Funds no later than the dates as stated below:
| Funds: | | December 31, 2010 | | December 31, 2011 | | December 31, 2012 | | Total | |
| Asia Pacific Dividend Fund | | $ | 7,946 | | | $ | 45,959 | | | $ | 73,950 | | | $ | 127,855 | | |
| Global Innovators Fund | | | — | | | | — | | | | 40,902 | | | | 40,902 | | |
Effective September 14, 2009, Mutual Fund Administration Corporation (the "Administrator") acts as the Funds' administrator under an administration agreement. U.S. Bancorp Fund Services, LLC ("USBFS") served as the Funds' administrator prior to September 14, 2009.
Quasar Distributors, LLC (the "Distributor") acts as the Funds' principal underwriter in a continuous public offering of the Funds' shares. The Distributor is an affiliate of USBFS. USBFS is the Funds' Transfer agent.
Foreside Compliance Services, LLC provides Chief Compliance Officer ("CCO") services to the Funds.
On August 14, 1998, the Trust approved a Deferred Compensation Plan for Trustees (the "Plan"). Trustees can elect to receive payment in cash or defer payments provided for in the Plan. If a trustee elects to defer payment, the Plan provides for the creation of a deferred payment account (Phantom Share Account). This account accumulates the deferred fees earned, and the value of the account is adjusted at the end of each quarter to reflect the value that would have been earned if the account had been invested in designated investments. The Funds recognize as trustee expense amounts accrued as meetings are attended plus the change in value of the Phantom Share Account.
The change in the value of the phantom share account during the year ended December 31, 2009 is shown in the table below. These amounts included any additional contributions to the deferred compensation plan and any appreciation (depreciation) on the underlying investments.
| Alternative Energy Fund | | $ | 8,060 | | |
| Asia Focus Fund | | $ | 16,502 | | |
| Asia Pacific Dividend Fund | | $ | 4,662 | | |
| China & Hong Kong Fund | | $ | 32,843 | | |
| Global Energy Fund | | $ | 9,496 | | |
| Global Innovators Fund | | $ | 21,300 | | |
The fees paid to non-interested Trustees for the year ended December 31, 2009 are reported on the Statements of Operations.
Certain officers of the Funds are also officers and/or Directors of the Advisor and the Administrator. None of these officers are compensated directly by the Funds.
Note 4
Shareholder Servicing Plan
Each Fund has adopted a Shareholder Servicing Plan to pay a fee at an annual rate of up to 0.25% of its daily average net assets of shares serviced by shareholder servicing agents who provide administrative and support services to their customers.
The fees paid under the Shareholder Servicing Plan for the year ended December 31, 2009 are reported on the Statements of Operations.
65
Note 5
Investment Transactions
The following table presents purchases and sales of securities during the year ended December 31, 2009, excluding short-term investments, to indicate the volume of transactions in each Fund.
| | | Purchases | | Sales | |
| Alternative Energy Fund | | $ | 25,683,089 | | | $ | 28,866,227 | | |
| Asia Focus Fund | | | 78,503,121 | | | | 17,439,539 | | |
| Asia Pacific Dividend Fund | | | 4,766,494 | | | | 1,978,844 | | |
| China & Hong Kong Fund | | | 34,985,549 | | | | 12,035,317 | | |
| Global Energy Fund | | | 44,958,906 | | | | 22,372,797 | | |
| Global Innovators Fund | | | 16,150,709 | | | | 20,910,433 | | |
The Funds did not purchase U.S. Government securities as a part of the long-term investment strategy during the year ended December 31, 2009.
Note 6
Fair Value Measurements and Disclosures
In September 2006, FASB issued Fair Value Measurements and Disclosures effective for financial statements issued for interim and annual periods beginning after November 15, 2007. Fair Value Measurements and Disclosures clarifies the definition of fair value for financial reporting, establishes a framework for measuring fair value and requires additional disclosure about the use of fair value measurements in an effort to make the measurement of fair value more consistent and comparable. It also provides guidance on determining when there has been a significant decrease in the volume and level of activity for an asset or liability, when a transact ion is not orderly, and how that information must be incorporated into a fair value measurement.
Under Fair Value Measurements and Disclosures, various inputs are used in determining the value of the Funds' investments. These inputs are summarized in the three broad levels listed below:
Level 1 — Unadjusted quoted prices in active markets for identical assets or liabilities that a Fund has the ability to access.
Level 2 — Observable inputs other than quoted prices included in level 1 that are observable for the asset or liability, either directly or indirectly. These inputs may include quoted prices for the identical instrument on an inactive market, prices for similar instruments, interest rates, prepayment speeds, credit risk, yield curves, default rates and similar data.
Level 3 — Unobservable inputs for the asset or liability, to the extent relevant observable inputs are not available, representing the Fund's own assumptions about the assumptions a market participant would use in valuing the asset or liability, and would be based on the best information available.
66
The inputs or methodology used for valuing securities are not an indication of the risk associated with investing in those securities. The following is a summary of the inputs used, as of December 31, 2009, in valuing the Funds' assets carried at fair value:
Alternative Energy Fund
| Assets Table | | Level 1 | | Level 2 | | Level 3 | | Total | |
| Investments, at Value | |
| Common Stocks: | |
| Energy | | $ | 8,395,059 | | | $ | 8,533,064 | | | $ | — | | | $ | 16,298,123 | | |
| Industrial | | | 18,860,088 | | | | 12,086,506 | | | | — | | | | 30,946,594 | | |
| Technology | | | 2,972,389 | | | | 2,937,539 | | | | — | | | | 5,909,928 | | |
| Utilities | | | 5,400,076 | | | | 2,188,728 | | | | — | | | | 7,588,804 | | |
| Warrants: | |
| Energy | | | | | | | 17,500 | | | | | | | | 17,500 | | |
| Corporate Bonds: | |
| Industrial | | | — | | | | — | | | | 397,810 | | | | 397,810 | | |
| Total Investments, at Value | | | 35,627,612 | | | | 25,763,337 | | | | 397,810 | | | | 61,788,759 | | |
| Other Financial Instruments* | | | 1,151,113 | | | | — | | | | — | | | | 1,151,113 | | |
| Total Assets | | $ | 36,778,725 | | | $ | 25,763,337 | | | $ | 397,810 | | | $ | 62,939,872 | | |
Following is a reconciliation of Level 3 assets for which significant unobservable inputs were used to determine fair value.
| Alternative Energy Fund | | Investments, at
value | | Other Financial
Instruments* | |
| Balance as of 12/31/08 | | $ | 385,739 | | | $ | — | | |
| Realized gain (loss) | | | — | | | | | | |
| Change in unrealized appreciation (depreciation) | | | 12,071 | | | | — | | |
| Net purchases (sales) | | | — | | | | — | | |
| Transfers in and/or out of Level 3 | | | — | | | | — | | |
| Balance as of 12/31/09 | | $ | 397,810 | | | $ | — | | |
67
Asia Focus Fund
| Assets Table | | Level 1 | | Level 2 | | Level 3 | | Total | |
| Investments, at Value | |
| Common Stocks: | |
| Basic Materials | | $ | — | | | $ | 16,643,345 | | | $ | — | | | $ | 16,643,345 | | |
| Communications | | | 3,258,404 | | | | 9,865,092 | | | | — | | | | 13,123,496 | | |
| Consumer, Cyclical | | | — | | | | 8,723,036 | | | | — | | | | 8,723,036 | | |
| Consumer, Non-cyclical | | | — | | | | 9,013,181 | | | | — | | | | 9,013,181 | | |
| Energy | | | — | | | | 28,181,831 | | | | — | | | | 28,181,831 | | |
| Exchange Traded Funds ("ETFs") | | | | | | | 2,978,843 | | | | — | | | | 2,978,843 | | |
| Financial | | | — | | | | 3,167,532 | | | | — | | | | 3,167,532 | | |
| Industrial | | | — | | | | 15,894,582 | | | | — | | | | 15,894,582 | | |
| Technology | | | — | | | | 9,753,672 | | | | — | | | | 9,753,672 | | |
| Utilities | | | 2,271,970 | | | | — | | | | — | | | | 2,271,970 | | |
| Total Investments, at Value | | | 8,509,217 | | | | 101,242,271 | | | | — | | | | 109,751,488 | | |
| Other Financial Instruments* | | | 7,330 | | | | — | | | | — | | | | 7,330 | | |
| Total Assets | | $ | 8,516,547 | | | $ | 101,242,271 | | | $ | — | | | $ | 109,758,818 | | |
Asia Pacific Dividend Fund
| Assets Table | | Level 1 | | Level 2 | | Level 3 | | Total | |
| Investments, at Value | |
| Common Stocks: | |
| Basic Materials | | $ | — | | | $ | 2,244,404 | | | $ | — | | | $ | 2,244,404 | | |
| Communications | | | — | | | | 1,653,609 | | | | — | | | | 1,653,609 | | |
| Consumer, Cyclical | | | — | | | | 792,005 | | | | — | | | | 792,005 | | |
| Consumer, Non-cyclical | | | 126,098 | | | | 105,169 | | | | — | | | | 231,267 | | |
| Energy | | | — | | | | 1,862,567 | | | | — | | | | 1,862,567 | | |
| Financial | | | 343,910 | | | | 1,411,544 | | | | — | | | | 1,755,454 | | |
| Industrial | | | — | | | | 1,082,368 | | | | — | | | | 1,082,368 | | |
| Technology | | | — | | | | 1,198,263 | | | | — | | | | 1,198,263 | | |
| Utilities | | | — | | | | 643,943 | | | | — | | | | 643,943 | | |
| Total Investments, at Value | | | 470,008 | | | | 10,993,872 | | | | — | | | | 11,463,880 | | |
| Other Financial Instruments* | | | 8,959 | | | | — | | | | — | | | | 8,959 | | |
| Total Assets | | $ | 478,967 | | | $ | 10,993,872 | | | $ | — | | | $ | 11,472,839 | | |
68
China & Hong Kong Fund
| Assets Table | | Level 1 | | Level 2 | | Level 3 | | Total | |
| Investments, at Value | |
| Common Stocks: | |
| Basic Materials | | $ | — | | | $ | 15,958,130 | | | $ | — | | | $ | 15,958,130 | | |
| Communications | | | 12,187,253 | | | | 22,517,378 | | | | — | | | | 34,704,631 | | |
| Consumer, Cyclical | | | — | | | | 29,193,487 | | | | — | | | | 29,193,487 | | |
| Consumer, Non-cyclical | | | — | | | | 8,418,258 | | | | — | | | | 8,418,258 | | |
| Diversified | | | — | | | | 3,192,597 | | | | — | | | | 3,192,597 | | |
| Energy | | | 5,812,569 | | | | 45,877,643 | | | | — | | | | 51,690,212 | | |
| Exchange Traded Funds ("ETFs") | | | 7,978,219 | | | | — | | | | — | | | | 7,978,219 | | |
| Financial | | | — | | | | 45,425,761 | | | | — | | | | 45,425,761 | | |
| Industrial | | | — | | | | 28,142,305 | | | | — | | | | 28,142,305 | | |
| Technology | | | 2,431,408 | | | | 5,769,549 | | | | — | | | | 8,200,957 | | |
| Utilities | | | — | | | | 7,822,179 | | | | — | | | | 7,822,179 | | |
| Total Investments, at Value | | | 28,409,449 | | | | 212,317,287 | | | | — | | | | 240,726,736 | | |
| Other Financial Instruments* | | | 131,050 | | | | — | | | | — | | | | 131,050 | | |
| Total Assets | | $ | 28,540,499 | | | $ | 212,317,287 | | | $ | — | | | $ | 240,857,786 | | |
Global Energy Fund
| Assets Table | | Level 1 | | Level 2 | | Level 3 | | Total | |
| Investments, at Value | |
| Common Stocks: | |
| Energy | | $ | 50,450,352 | | | $ | 21,583,250 | | | $ | — | | | $ | 72,035,602 | | |
| Industrial | | | — | | | | 138,455 | | | | — | | | | 138,455 | | |
| Total Investments, at Value | | | 50,450,352 | | | | 21,721,705 | | | | — | | | | 72,174,057 | | |
| Other Financial Instruments* | | | 10,000 | | | | — | | | | — | | | | 10,000 | | |
| Total Assets | | $ | 50,460,352 | | | $ | 21,721,705 | | | $ | — | | | $ | 72,184,057 | | |
69
Global Innovators Fund
| Assets Table | | Level 1 | | Level 2 | | Level 3 | | Total | |
| Investments, at Value | |
| Common Stocks: | |
| Communications | | $ | 10,503,964 | | | $ | — | | | $ | — | | | $ | 10,503,964 | | |
| Consumer, Cyclical | | | 2,710,914 | | | | 1,388,189 | | | | — | | | | 4,099,103 | | |
| Energy | | | 1,382,585 | | | | — | | | | — | | | | 1,382,585 | | |
| Financial | | | 6,017,572 | | | | — | | | | — | | | | 6,017,572 | | |
| Industrial | | | 2,723,228 | | | | — | | | | — | | | | 2,723,228 | | |
| Technology | | | 11,933,793 | | | | — | | | | — | | | | 11,933,793 | | |
| Total Investments, at Value | | | 35,272,056 | | | | 1,388,189 | | | | — | | | | 36,660,245 | | |
| Other Financial Instruments* | | | — | | | | — | | | | — | | | | — | | |
| Total Assets | | $ | 35,272,056 | | | $ | 1,388,189 | | | $ | — | | | $ | 36,660,245 | | |
* Other financial instruments are not reflected in the Schedule of Investments, such as foreign currency and foreign currency exchange contracts which are valued at the unrealized appreciation/depreciation on the investments.
Note 7
Derivatives and Hedging Disclosures
In June 2009, FASB issued Derivatives and Hedging effective for financial statements issued for interim and annual periods ending after November 15, 2008. Derivatives and Hedging requires enhanced disclosures about the Funds' derivative and hedging activities, including how such activities are accounted for and their effects on the Funds' financial position, performance and cash flows. As of December 31, 2009 and during the year then ended, the Funds did not hold any securities requiring disclosure.
Note 8
Forward Foreign Currency Contracts
In order to hedge their portfolio and to protect them against possible fluctuations in foreign exchange rates pending the settlement of securities transactions, the Funds may enter into forward currency contracts which obligate them to exchange currencies at specified future dates. At the maturity of a forward contract, the Funds may either make delivery of the foreign currency from currency held, if any, or from the proceeds of the portfolio securities sold. It may also terminate its obligation to deliver the foreign currency at any time by purchasing an offsetting contract. The forward value of amounts due are netted against the forward value of the currency to be delivered, and the net amount is shown as a receivable or payable in the financial statements. The Funds did not have any outstanding forward contracts as of December 31, 2009.
Note 9
Line of Credit
During the eight month period ended August 31, 2009, the Trust had a secured $5,000,000 line of credit with its then custodian, State Street Bank & Trust. Borrowings under this arrangement bear interest at the federal funds rate plus 0.75% per annum. As compensation for holding available the lending commitment, the Trust paid a 0.10% per annum fee on the unused portion of the commitment. The fee was payable quarterly in arrears.
70
Note 10
Tax Matters
As of December 31, 2009, the tax basis of investments and the components of distributable earnings on a tax basis were as follows:
| | Alternative
Energy Fund | | Asia Focus
Fund | | Asia Pacific
Dividend
Fund | | China &
Hong Kong
Fund | | Global
Energy
Fund | | Global
Innovators
Fund | |
| Cost of investments for tax purposes | | $ | 80,721,201 | | | $ | 100,611,694 | | | $ | 13,334,421 | | | $ | 170,691,073 | | | $ | 68,014,519 | | | $ | 47,329,786 | | |
| Gross tax unrealized appreciation | | | 7,506,153 | | | | 13,279,793 | | | | 497,518 | | | | 85,321,780 | | | | 8,277,019 | | | | 1,254,186 | | |
| Gross tax unrealized (depreciation) | | | (26,438,595 | ) | | | (4,139,999 | ) | | | (2,368,059 | ) | | | (15,286,117 | ) | | | (4,117,481 | ) | | | (11,986,729 | ) | |
Net tax unrealized appreciation
(depreciation) on investments | | | (18,932,442 | ) | | | 9,139,794 | | | | (1,870,541 | ) | | | 70,035,663 | | | | 4,159,538 | | | | (10,732,543 | ) | |
Net tax appreciation (depreciation)
on foreign-currency denominated
assets and liabilities | | | 15,854 | | | | (2,355 | ) | | | 231 | | | | (34 | ) | | | 429 | | | | — | | |
Net tax unrealized appreciation
(depreciation)* | | | (18,916,588 | ) | | | 9,137,439 | | | | (1,870,310 | ) | | | 70,035,629 | | | | 4,159,967 | | | | (10,732,543 | ) | |
| Undistributed net ordinary income** | | | — | | | | 222,720 | | | | — | | | | 2,284,103 | | | | — | | | | — | | |
Undistributed Long-Term
Capital Gains | | | — | | | | — | | | | — | | | | 210,593 | | | | — | | | | — | | |
| Post October loss*** | | | (1,569,197 | ) | | | — | | | | (42,944 | ) | | | (1,447,701 | ) | | | (22,880 | ) | | | — | | |
| Capital loss carryforward | | | (50,904,570 | ) | | | (395,317 | ) | | | (2,437,264 | ) | | | — | | | | (1,158,130 | ) | | | (33,106,263 | ) | |
| Capital loss carryforward limitation | | | — | | | | — | | | | — | | | | (364,169 | ) | | | — | | | | — | | |
| Other accumulated gain/(loss) | | | (21,005 | ) | | | (36,335 | ) | | | (14,844 | ) | | | (72,152 | ) | | | (18,914 | ) | | | (49,612 | ) | |
| Total accumulated gain/(loss) | | $ | (71,411,360 | ) | | $ | 8,928,507 | | | $ | (4,365,362 | ) | | $ | 70,646,303 | | | $ | 2,960,043 | | | $ | (43,888,418 | ) | |
* The differences between book-basis and tax-basis unrealized appreciation/(depreciation) is attributable primary to the tax deferral of losses on wash sales and passive foreign investment company (PFIC) mark to market adjustments.
** The differences between book-basis and tax basis undistributed net ordinary income is attributed to deferred compensation.
*** Under the current tax law, capital and currency losses realized after October 31 and prior to the Fund's fiscal year end may be deferred as occurring on the first day of the following year.
As of December 31, 2009, the Funds have the following capital loss carryforwards available to offset future realized capital gains:
| Capital losses expiring in: | | Alternative
Energy Fund | | Asia Focus
Fund | | Asia Pacific
Dividend
Fund | | China &
Hong Kong
Fund | | Global
Energy
Fund | | Global
Innovators
Fund | |
| | 2010 | | | $ | — | | | $ | 395,317 | | | $ | — | | | $ | 364,169 | | | $ | — | | | $ | 19,915,748 | | |
| | 2011 | | | | — | | | | — | | | | — | | | | — | | | | — | | | | 8,376,172 | | |
| | 2012 | | | | — | | | | — | | | | — | | | | — | | | | — | | | | 4,814,343 | | |
| | 2013 | | | | — | | | | — | | | | — | | | | — | | | | — | | | | — | | |
| | 2014 | | | | — | | | | — | | | | — | | | | — | | | | — | | | | — | | |
| | 2015 | | | | — | | | | — | | | | — | | | | — | | | | — | | | | — | | |
| | 2016 | | | | 10,370,865 | | | | — | | | | 1,321,324 | | | | — | | | | — | | | | — | | |
| | 2017 | | | | 40,533,705 | | | | — | | | | 1,115,940 | | | | — | | | | 1,158,130 | | | | — | | |
| | Total | | | $ | 50,904,570 | | | $ | 395,317 | | | $ | 2,437,264 | | | $ | 364,169 | | | $ | 1,158,130 | | | $ | 33,106,263 | | |
71
For the China & Hong Kong Fund, the $364,169 capital loss carryover related to the acquisition of the Investec Mainland China Fund on April 23, 2003.
The tax character of distributions (other than return of capital dividends) paid during 2009 and 2008 fiscal years are as follows:
| | | 2009 | | 2008 | |
| | | Ordinary
Income | | Long-term
Capital Gain | | Ordinary
Income | | Long-term
Capital Gain | |
| Alternative Energy Fund | | $ | — | | | $ | — | | | $ | 3,265,473 | | | $ | — | | |
| Asia Focus Fund | | $ | 513,961 | | | $ | — | | | $ | 1,481,421 | | | $ | — | | |
| Asia Pacific Dividend Fund | | $ | 171,895 | | | $ | — | | | $ | 1,026,186 | | | $ | 130,652 | | |
| China & Hong Kong Fund | | $ | 2,242,023 | | | $ | 7,314,500 | | | $ | 3,332,293 | | | $ | 477,128 | | |
| Global Energy Fund | | $ | — | | | $ | — | | | $ | — | | | $ | 1,305,040 | | |
| Global Innovators Fund | | $ | — | | | $ | — | | | $ | 1,527,390 | | | $ | — | | |
Note 11
Events Subsequent to the Fiscal Period End
The Funds have adopted financial reporting rules regarding subsequent events which requires an entity to recognize in the financial statements the effects of all subsequent events that provide additional evidence about conditions that existed at the date of the balance sheet. In addition, an entity is required to disclose the date through which subsequent events have been evaluated. Management has evaluated the Funds' related events and transactions that occurred subsequent to December 31, 2009, through February 25, 2010, the date of issuance of the Funds' financial statements. There were no events or transactions that occurred during this period that materially impacted the amounts or disclosures in the Funds' financial statements.
72
REPORT OF INDEPENDENT REGISTERED
PUBLIC ACCOUNTING FIRM
To the Shareholders and Board of Trustees
Guinness Atkinson Funds
Woodland Hills, California
We have audited the accompanying statements of assets and liabilities, including the schedules of investments, of the Alternative Energy Fund, Asia Focus Fund, Asia Pacific Dividend Fund, China & Hong Kong Fund, Global Energy Fund and Global Innovators Fund (the "Funds"), each a series of shares of the Guinness Atkinson Funds, as of December 31, 2009, the related statements of operations for the year then ended, the statements of changes in net assets for each of the two years in the period then ended, and the financial highlights for each of the five years in the period then ended (with respect to the Alternative Energy Fund and Asia Pacific Dividend Fund for the three years then ended and the period March 31, 2006 to December 31, 2006). These financial statements and financial highlights are the responsibility of the Funds' management. Our responsibility is to express an opinion on these financial statements and financial highlights ba sed on our audits.
We conducted our audits in accordance with the standards of the Public Company Accounting Oversight Board (United States). Those standards require that we plan and perform the audits to obtain reasonable assurance about whether the financial statements and financial highlights are free of material misstatement. The Funds are not required to have, nor were we engaged to perform, an audit of its internal control over financial reporting. Our audits included consideration of internal control over financial reporting as a basis for designing audit procedures that are appropriate in the circumstances, but not for the purpose of expressing an opinion on the effectiveness of the Funds' internal control over financial reporting. Accordingly, we express no such opinion. An audit includes examining, on a test basis, evidence supporting the amounts and disclosures in the financial statements. Our procedures included confirmation of securities owned as of December 31, 2009, by correspondence with the custodian and brokers or by other appropriate auditing procedures where replies from brokers were not received. An audit also includes assessing the accounting principles used and significant estimates made by management, as well as evaluating the overall financial statement presentation. We believe that our audits provide a reasonable basis for our opinion.
In our opinion, the financial statements and financial highlights referred to above present fairly in all material respects, the financial position of the above mentioned Funds as of December 31, 2009, the results of their operations, the changes in their net assets and the financial highlights for the periods indicated above, in conformity with accounting principles generally accepted in the United States of America.
TAIT, WELLER & BAKER LLP
Philadelphia, Pennsylvania
February 25, 2010
73
Additional Information (Unaudited)
Proxy Voting Procedures
The Advisor of the Funds votes proxies relating to portfolio securities in accordance with procedures that have been approved by the Board. You may obtain a description of these procedures, free of charge, by calling "toll-free" 1-800-915-6565. This information is also available through the Securities and Exchange Commission's website at http://www.sec.gov.
Proxy Voting Records
Information regarding how the advisor of the Funds voted proxies relating to portfolio securities during the latest 12-month period ended June 30 is available, without charge, by calling toll-free, 1-800-915-6565. This information is also available through the Securities and Exchange Commission's website at http://www.sec.gov.
Form N-Q Disclosure
The Funds file their complete schedule of portfolio holdings with the Securities and Exchange Commission for the first and third quarters of each fiscal year on Form N-Q. The Funds' Form N-Q is available on the Securities and Exchange Commission's website at http://www.sec.gov. The Funds' Form N-Q may be reviewed and copied at the Commission's Public Reference Room in Washington, DC, and information on the operation of the Public Reference Room may be obtained by calling 1-800-SEC-0330. This information is also available, without charge, by calling toll-free, 1-800-915-6565.
Supplemental Tax Information
For the fiscal year ended December 31, 2009, certain dividends paid by the Funds may be subject to a maximum tax rate of 15%, as provided for by the Jobs and Growth Tax Relief Reconciliation Act of 2003. The percentage of dividends declared from ordinary income designated as qualified dividend income was as follows:
| Alternative Energy Fund | | | N/A | | |
| Asia Focus Fund | | | 77.26 | % | |
| Asia Pacific Dividend Fund | | | 81.82 | % | |
| China & Hong Kong Fund | | | 67.18 | % | |
| Global Energy Fund | | | N/A | | |
| Global Innovators Fund | | | N/A | | |
The China & Hong Kong Fund designates $7,314,500 as long-term capital gains distributions for the year ended December 31, 2009.
Pursuant to Section 853 of the Internal Revenue Code of 1986, as amended, the Funds designate the following income earned from foreign sources and foreign taxes paid for the year ended December 31, 2009:
| | | Foreign Sourced Income | | Foreign Taxes Paid | |
| | | Total
Amount | | Per Share
Amount | | Total
Amount | | Per Share
Amount | |
| Alternative Energy Fund | | $ | 410,212 | | | $ | 0.04 | | | $ | 69,754 | | | $ | 0.01 | | |
| Asia Focus Fund | | | 1,407,424 | | | | 0.22 | | | | 126,865 | | | | 0.02 | | |
| Asia Pacific Dividend Fund | | | 323,206 | | | | 0.31 | | | | 37,820 | | | | 0.04 | | |
| China & Hong Kong Fund | | | 3,825,974 | | | | 0.56 | | | | 183,659 | | | | 0.03 | | |
| Global Energy Fund | | | 710,781 | | | | 0.24 | | | | 113,851 | | | | 0.04 | | |
| Global Innovators Fund | | | N/A | | | | N/A | | | | N/A | | | | N/A | | |
74
TRUSTEE AND OFFICER INFORMATION (Unaudited)
Unless otherwise noted, each Trustee and officer's address is 21550 Oxnard Street, Suite 750, Woodland Hills, California 91367. Trustees and officers of the Trust serve until their resignation, removal or retirement. Additional information about the Trustees is included in the Funds' Statement of Additional Information which is available, without charge, upon request by calling toll-free, 1-800-915-6565 or by visiting the Funds' website at www.gafunds.com.
| Name and Age | | Position(s) Held with Trust† | | Date Elected | | Principal Occupation(s) During the Past 5 Years | | Number of Portfolios In Fund Complex Overseen by Trustee | | Other Directorships Held by Trustee | |
| Non-Interested Trustees | | | | | | | | | | | |
|
Dr. Gunter Dufey
(69) | | Trustee | | April 1994 | | Pacific International Business Associates, a consulting firm in Singapore since 2002. Professor (em.) of Ross School at The University of Michigan, where he served from 1968-2002. | | 6 | | Independent director, four subsidiaries of GMAC in the United States and Canada. | |
|
James I. Fordwood
(63) | | Trustee | | April 1994 | | CFO and Managing Member of Prima Marketing LLC (network of convenience stores) | | 6 | | J.L. Energy, Inc., Intoil, Inc., Fior D'Italia. | |
|
Dr. Bret A. Herscher
(51) | | Trustee | | April 1994 | | President of Pacific Consultants, a technical and technology management consulting company serving the Electronic industry and venture capital community that he co-founded. | | 6 | | Strawberry Tree Inc. | |
|
J. Brooks Reece, Jr.
(62) | | Trustee and Chairman | | April 1994 | | Vice President of Adcole Corp. a manufacturer of precision measuring machines and sun angle sensors for space satellites. | | 6 | | Adcole Far East Ltd. | |
|
75
| Name and Age | | Position(s) Held with Trust† | | Date Elected | | Principal Occupation(s) During the Past 5 Years | | Number of Portfolios In Fund Complex Overseen by Trustee | | Other Directorships Held by Trustee | |
| Interested Trustee | | | | | | | | | | | |
|
Timothy W.N. Guinness*
14 Queen Anne's Gate
London,
England SW1H 9AA
U.K.
(62) | | Trustee | | August 1998 | | Chairman of Guinness Asset Management Ltd., investment adviser in London, since 2003. Chairman/CIO of Guinness Atkinson, since November 2002. | | 6 | | Investec Global Strategy Fund Limited, Investec International Accumulation Fund Limited, Investec Select Funds Plc, Investec High Income Trust Plc, SR Europe Investment Trust Plc. Atlantis Japan Growth Fund Ltd., Brompton Bicycle Ltd., New Boathouse Capital Ltd., Guinness Asset Management Ltd. | |
|
| Officers | | | | | | | | | | | |
|
James Atkinson
(52) | | President | | April 2003 | | Chief Executive Officer and Director of Guinness Atkinson since November 2002. Principal of Orbis Marketing, a mutual fund marketing and advertising firm since November 2001. | | N/A | | N/A | |
|
Richard F. Cook, Jr.
(58) | | Chief Compliance Officer | | December 2005 | | Officer of Foreside Fund Services, LLC since November 2005, and Director of Foreside Compliance Services LLC, since January 2006. From 2002, Founder and Managing Member of NorthLake, LLC. From 1985 to 2002, Executive Officer, Director and Shareholder of Century Capital Management, Inc. and Secretary of Century Shares Trust. | | N/A | | N/A | |
|
* "Interested person" (as defined in the 1940 Act) of the Funds because of his affiliation with the Funds' Advisor, Guinness Atkinson Asset Management, Inc.
76
| Name and Age | | Position(s) Held with Trust† | | Date Elected | | Principal Occupation(s) During the Past 5 Years | | Number of Portfolios In Fund Complex Overseen by Trustee | | Other Directorships Held by Trustee | |
Rita Dam
(43) | | Treasurer | | September
2009 | | Vice President, Mutual Fund Administration Corp. (2006-present); Vice President, U.S. Bancorp Fund Services, LLC, a mutual and hedge fund service provider (2001-2006), Vice President, the Wadsworth Group, a mutual fund administration and consulting services provider (1994-2001). | | N/A | | N/A | |
|
Joy Ausili
(43) | | Secretary and Assistant Treasurer | | September
2009 | | Vice President, Mutual Fund Administration Corp. (2006-present); Vice President, U.S. Bancorp Fund Services, LLC, a mutual and hedge fund service provider (2001-2006) ; Vice President, the Wadsworth Group, a mutual fund administration and consulting services provider (1997-2001). | | N/A | | N/A | |
|
Sardjono Kadiman
(34) | | Assistant Treasurer | | September
2009 | | Assistant Vice President, Mutual Fund Administration Corp. (2008-present); Compliance Officer, U.S. Bancorp Fund Services, LLC, a mutual and hedge fund service provider (2001-2008). , Senior Fund Administrator, the Wadsworth Group, a mutual fund administration and consulting services provider (1998-2001). | | N/A | | N/A | |
|
77
Privacy Notice
Guinness Atkinson Funds and Guinness Atkinson Asset Management, Inc. may collect non-public information about you from the following sources:
• Information we receive about you on applications or other forms;
• Information you give us orally; and
• Information about your transactions with us.
We do not disclose any non-public personal information about our shareholders or former shareholders without the shareholder's authorization, except as required by law or in response to inquiries from governmental authorities. We restrict access to your personal and account information to those employees who need to know that information to provide products and services to you. We also may disclose that information to unaffiliated third parties (such as to brokers or custodians) only as permitted by law and only as needed for us to provide agreed services to you. We maintain physical, electronic and procedural safeguards to guard your non-public personal information.
78
Guinness Atkinson Funds Information
Board of Trustees
| J. Brooks Reece, Jr., Chairman | |
|
| Dr. Gunter Dufey | |
|
| James I. Fordwood | |
|
| Timothy W.N. Guinness | |
|
| Dr. Bret A. Herscher | |
|
Contact Guinness Atkinson Funds
| P.O. Box 701 | |
|
| Milwaukee, WI 53201-0701 | |
|
| Shareholder Services: 800-915-6566 | |
|
| Literature Request: 800-915-6565 | |
|
| Website: www.gafunds.com | |
|
| Email: mail@gafunds.com | |
|
| Guinness Atkinson Funds | |
| Fund | | Cusip | | Ticker | | Fund# | |
| Alternative Energy Fund | | | 402031 50 4 | | | GAAEX | | | 1298 | | |
| Asia Focus Fund | | | 402031 10 8 | | | IASMX | | | 1096 | | |
| Asia Pacific Dividend Fund | | | 402031 60 3 | | | GAADX | | | 1299 | | |
| China & Hong Kong Fund | | | 402031 20 7 | | | ICHKX | | | 1094 | | |
| Global Energy Fund | | | 402031 40 5 | | | GAGEX | | | 1098 | | |
| Global Innovators Fund | | | 402031 30 6 | | | IWIRX | | | 1095 | | |
Distributed by Quasar Distributors, LLC, Milwaukee, WI 53202
This report is intended for shareholders of the Guinness Atkinson Funds and may not be used as literature unless preceded or accompanied by a current prospectus.
79
Guinness Atkinson Funds
c/o U.S. Bancorp Fund Services, LLC
P.O. Box 701
Milwaukee, WI 53201-0701
123S0204--P
Item 2. Code of Ethics.
The registrant has adopted a code of ethics that applies to the registrant’s principal executive officer and principal financial officer. The registrant has not made any amendments to its code of ethics during the period covered by this report. The registrant has not granted any waivers from any provisions of the code of ethics during the period covered by this report.
A copy of the registrant’s CODE OF CONDUCT FOR PRINCIPAL EXECUTIVE OFFICER AND PRINCIPAL FINANCIAL OFFICER is filed herewith.
Item 3. Audit Committee Financial Expert.
The registrant’s board of trustees has determined that there is at least one audit committee financial expert serving on its audit committee. James I. Fordwood is the “audit committee financial expert” and is considered to be “independent” as each term is defined in Item 3 of Form N-CSR.
Item 4. Principal Accountant Fees and Services.
The registrant has engaged its principal accountant to perform audit services, audit-related services, tax services and other services during the past two fiscal years. “Audit services” refer to performing an audit of the registrant’s annual financial statements or services that are normally provided by the accountant in connection with statutory and regulatory filings or engagements for those fiscal years. “Audit-related services” refer to the assurance and related services by the principal accountant that are reasonably related to the performance of the audit. “Tax services” refer to professional services rendered by the principal accountant for tax compliance, tax advice, and tax planning. There were no “other services” provided by the principal accountant. The following table details the aggregate fees billed or expected to be billed for each of the last two fisc al years for audit fees, audit-related fees, tax fees and other fees by the principal accountant.
| | FYE 12/31/2009 | | FYE 12/31/2008 | |
Audit Fees | | $ | 106,600 | | $ | 103,200 | |
Audit-Related Fees | | N/A | | N/A | |
Tax Fees | | $ | 17,400 | | $ | 16,800 | |
All Other Fees | | N/A | | N/A | |
The audit committee has adopted pre-approval policies and procedures that require the audit committee to pre-approve all audit and non-audit services of the registrant, including services provided to any entity affiliated with the registrant.
The percentage of fees billed by Tait, Weller, & Baker LLP applicable to non-audit services pursuant to waiver of pre-approval requirement were as follows:
| | FYE 12/31/2009 | | FYE 12/31/2008 | |
Audit-Related Fees | | 0 | % | 0 | % |
Tax Fees | | 0 | % | 0 | % |
All Other Fees | | 0 | % | 0 | % |
All of the principal accountant’s hours spent on auditing the registrant’s financial statements were attributed to work performed by full-time permanent employees of the principal accountant.
The following table indicates the non-audit fees billed or expected to be billed by the registrant’s accountant for services to the registrant and to the registrant’s investment adviser (and any other controlling entity, etc.—not sub-adviser) for the last two years. The audit committee of the Board of Trustees has considered whether the provision of non-audit serv ices that were rendered to the registrant’s investment adviser is compatible with maintaining the principal accountant’s independence and has concluded that the provision of such non-audit services by the accountant has not compromised the accountant’s independence.
Non-Audit Related Fees | | FYE 12/31/2009 | | FYE 12/31/2008 | |
Registrant | | N/A | | N/A | |
Registrant’s Investment Advisor | | N/A | | N/A | |
Item 5. Audit Committee of Listed Registrants.
Not applicable to registrants who are not listed issuers (as defined in Rule 10A-3 under the Securities Exchange Act of 1934).
Item 6. Schedule of Investments.
(a) Schedule of Investments is included as part of the report to shareholders filed under Item 1 of this Form.
(b) Not Applicable.
Item 7. Disclosure of Proxy Voting Policies and Procedures for Closed-End Management Investment Companies.
Not Applicable.
Item 8. Portfolio Managers of Closed-End Management Investment Companies.
Not Applicable.
Item 9. Purchases of Equity Securities by Closed-End Management Investment Company and Affiliated Purchasers.
Not Applicable.
Item 10. Submission of Matters to a Vote of Security Holders.
The registrant has not made any material changes to the procedures by which shareholders may recommend nominees to the registrant’s Board of Trustees.
Item 11. Controls and Procedures.
(a) The registrant’s principal executive officer and principal financial officer have evaluated the registrant’s disclosure controls and procedures within 90 days of this filing and have concluded based on such evaluation that the registrant’s disclosure controls and procedures were effective, as of that date, in ensuring that information required to be disclosed by the registrant in this Form N-CSR was recorded, processed, summarized, and reported within the time periods specified in the Securities and Exchange Commission’s rules and forms.
(b) There were no changes in the registrant’s internal control over financial reporting (as defined in Rule 30a-3(d) under the Investment Company Act of 1940) that occurred during the registrant’s last fiscal quarter that have materially affected, or are reasonably likely to materially affect, the registrant’s internal control over financial reporting.
Item 12. Exhibits.
(a) (1) Any code of ethics or amendment thereto, that is subject of the disclosure required by Item 2, to the extent that the registrant intends to satisfy Item 2 requirements through filing an exhibit. Filed herewith.
(2) Certifications pursuant to Section 302 of the Sarbanes-Oxley Act of 2002. Filed herewith.
(3) Any written solicitation to purchase securities under Rule 23c-1 under the Act sent or given during the period covered by the report by or on behalf of the registrant to 10 or more persons. Not applicable to open-end investment companies.
(b) Certification pursuant to Section 906 of the Sarbanes-Oxley Act of 2002. Filed herewith.
SIGNATURES
Pursuant to the requirements of the Securities Exchange Act of 1934 and the Investment Company Act of 1940, the registrant has duly caused this report to be signed on its behalf by the undersigned, thereunto duly authorized.
(Registrant) Guinness Atkinson Funds | |
| | |
| | |
By | /s/ James J. Atkinson | |
| |
Title: President | |
Date: March 8, 2010 | |
Pursuant to the requirements of the Securities Exchange Act of 1934 and the Investment Company Act of 1940, this report has been signed by the following persons on behalf of the registrant and in the capacities and on the dates indicated.
By | /s/ James J. Atkinson | |
| |
Title: President | |
Date: March 8, 2010 | |
| |
| |
By | /s/RITA DAM | |
| |
Title: Treasurer | |
Date: March 8, 2010 | |