As filed with the Securities and Exchange Commission on March 9, 2007
UNITED STATES
SECURITIES AND EXCHANGE COMMISSION
Washington, D.C. 20549
FORM N-CSR
CERTIFIED SHAREHOLDER REPORT OF REGISTERED
MANAGEMENT INVESTMENT COMPANIES
Investment Company Act file number | 811-08360 |
|
GUINNESS ATKINSON FUNDS |
(Exact name of registrant as specified in charter) |
|
21550 Oxnard Street, Suite 750, Woodland Hills, CA | | 91367 |
(Address of principal executive offices) | | (Zip code) |
|
James J. Atkinson, Jr. |
21550 Oxnard Street, Suite 750, Woodland Hills, CA 91367 |
(Name and address of agent for service) |
|
Registrant’s telephone number, including area code: | (800) 915-6566 | |
|
Date of fiscal year end: | December 31 | |
|
Date of reporting period: | December 31, 2006 | |
| | | | | | | | |
Item 1. Report to Stockholders.

Annual
Report
December 31, 2006
• Alternative Energy Fund
• Asia Focus Fund
• Asia Pacific Dividend Fund
• China & Hong Kong Fund
• Global Energy Fund
• Global Innovators Fund
Guinness Atkinson Funds
Annual Report
December 31, 2006
TABLE OF CONTENTS
| | 3 | | | Letter to Shareholders | |
|
| | 6 | | | Alternative Energy Fund | |
|
| | 14 | | | Asia Focus Fund | |
|
| | 22 | | | Asia Pacific Dividend Fund | |
|
| | 29 | | | China & Hong Kong Fund | |
|
| | 35 | | | Global Energy Fund | |
|
| | 42 | | | Global Innovators Fund | |
|
| | 49 | | | Statements of Assets and Liabilities | |
|
| | 51 | | | Statements of Operations | |
|
| | 54 | | | Statements of Changes in Net Assets | |
|
| | 56 | | | Financial Highlights | |
|
| | 62 | | | Notes to Financial Statements | |
|
| | 77 | | | Guinness Atkinson Funds Information | |
|
2
January 29, 2007
Dear Guinness Atkinson Funds Shareholders,
One year ago in this letter we reminded investors that past performance is not indicative of future results and wished we could continue our 2005 performance through 2006. And yet here we are, one year later, with most – but not all – of the Guinness Atkinson Funds producing total returns in 2006 that topped the returns of 2005. Before we get to the performance details we would be remiss if we didn't mention the launch of the two newest Guinness Atkinson Funds, the Asia Pacific Dividend Fund and the Alternative Energy Fund. We welcome the shareholders of these two Funds as well as to the shareholders that joined us in the more seasoned Guinness Atkinson Funds.
Fund Performance
Returns for the periods ending December 31, 2006 are provided in the table below. For the calendar year each of the four funds in existence over the entire period had positive returns. Of these four the laggard for one year performance was the Global Energy Fund which returned 9.80% for the year. The Global Innovators Fund produced a total return of 18.76%; the Asia Focus Fund 36.15% and the China & Hong Kong Fund 39.65%. From their inception on March 31, 2006 the Alternative Energy Fund produced a negative return of 8.24% while the Asia Pacific Dividend Fund produced a positive return of 10.59%.
| Fund (inception date) | | 1-year | | 3-year | | 5-year | | 10-year | | From Inception | |
| Alternative Energy Fund (March 31, 2006) | | | | | | | | | | | | | | | | | -8.24 | % | |
| Asia Focus (April 29, 1996) | | | 36.15 | % | | | 21.86 | % | | | 22.73 | % | | | 2.13 | % | | | 3.17 | % | |
| Asia Pacific Dividend Fund (March 31, 2006) | | | | | | | | | | | | | | | | | 10.59 | % | |
| China & Hong Kong (June 30, 1994) | | | 39.65 | % | | | 18.64 | % | | | 19.19 | % | | | 6.76 | % | | | 8.80 | % | |
| Global Energy Fund (June 30, 2004) | | | 9.85 | % | | | | | | | | | | | | | 36.93 | % | |
| Global Innovators Fund (December 15, 1998) | | | 18.76 | % | | | 13.77 | % | | | 6.64 | % | | | | | 5.45 | % | |
Periods of greater than one year are average annualized returns; one year or less are actual returns. All returns are for the periods ending December 31, 2006.
Performance data quoted represents past performance and does not guarantee future results. The investment return and principal value of an investment will fluctuate so that an investor's shares, when redeemed, may be worth more or less than the original cost. Current performance of the Funds may be lower or higher than the performance quoted. Performance data current to the most recent month end may be obtained by visiting www.gafunds.com.
Each of the Funds impose a 2% redemption fee on shares held less than 30 days. The performance data does not reflect this redemption fee. Had this fee been included, returns would be lower. Total returns reflect a waiver in effect and in the absence of this waiver, the total returns would be lower.
As usual Tim Guinness and Edmund Harriss provide their views on the past year and look ahead to the current year for each of the six Guinness Atkinson Funds. You will find these comments preceding the financial results for the Funds which follow this letter. Also, we've provided a table showing the year-end Morningstar ratings for the three Guinness Atkinson Funds that have a track record of three years or more. That table appears immediately after this letter.
The Big Picture
Each of the six Guinness Atkinson Funds is inextricably linked to one of the major stories unfolding over the course of the 21st century. It is virtually impossible to pick up a newspaper without seeing extensive coverage concerning energy – including oil and alternative energy; China and Asia; or to read about the dynamic nature of business and innovative change. It is indeed an exciting time to be a shareholder in the Guinness Atkinson Funds. With the launch of each of these Funds we were thinking long term.
3
Just as we believe that each of these major forces will have a dramatic impact on the entire planet, so too do we understand that they will take time to unfold. It is very easy to get caught up in the short term headlines (and subsequent price movements). So, we feel the urge to provide some paternalistic advice, specifically, don't let our short-term results distract you from what we consider the much more important long-term. Clearly 2006 was a good if not great period for most of our Funds. But, as we stated last year, recent past performance is not a sufficient reason to invest. We are hopeful that all of our shareholders share our long term vision of the future.
We appreciate the confidence you have placed in us and our management team and appreciate the opportunity to serve you.
Sincerely,


Timothy Guinness James Atkinson
Morningstar Ratings through 12/31/06
Below is a table listing the Morningstar star ratings for the three Guinness Atkinson Funds that have at least a three year history.
| Fund | | Category | | Overall | | 3-year | | 5-year | | 10-year | |
Asia Focus
| | Pacific/Asia
ex-Japan Stk | | 2**
(86 funds) | | 3***
(86 funds) | | 3***
(78 funds) | | 1*
(37 funds) | |
China & Hong Kong
| | Pacific/Asia
ex-Japan Stk | | 2**
(86 funds) | | 1*
(86 funds) | | 2**
(78 funds) | | 3***
(37 funds) | |
Global Innovators Fund
| | Large Growth
| | 4****
(1,405 funds) | | 5*****
(1,405 funds) | | 4****
(1,109 funds) | | N/A
| |
For each fund with at least a three-year history, Morningstar calculates a Morningstar Rating(TM) based on a Morningstar Risk-Adjusted Return measure that accounts for variation in a fund's monthly performance (including the effects of sales charges, loads, and redemption fees), placing more emphasis on downward variations and rewarding consistent performance. The top 10% of funds in each category receive 5 stars, the next 22.5% receive 4 stars the next 35% receive 3 stars, the next 22.5% receive 2 stars and the bottom 10% receive 1 star. (Each share class is counted as a fraction of one fund within this scale and rated separately, which may cause slight variations in distribution percentages.)
©2007 Morningstar, Inc. All Rights Reserved. The information contained herein: (1) is proprietary to Morningstar and/or its content providers; (2) may not be copied or distributed; and (3) is not warranted to be accurate, complete or timely. Neither Morningstar nor its content providers are responsible for any damages or losses arising from any use of this information. Past performance is no guarantee of future results.
The Funds invest in foreign securities which involves greater volatility and political, economic and currency risks and differences in accounting methods.
4
GUINNESS ATKINSON FUNDS
Expense Examples (Unaudited)
As a shareholder of the Funds, you incur two types of costs: (1) redemption fees; and (2) ongoing costs, including advisory fees; and other Fund expenses. The Examples below are intended to help you understand your ongoing costs (in dollars) of investing in the Funds and to compare these costs with the ongoing costs of investing in other mutual funds.
The examples are based on an investment of $1,000 invested at the beginning of the period shown and held for the entire period from July 1, 2006 to December 31, 2006.
Actual Expenses
For each Fund, the first line of the table below provides information about actual account values and actual expenses. You may use the information in this line, together with the amount you invested, to estimate the expenses that you paid over the period. Simply divide your account value by $1,000 (for example, an $8,600 account value divided by $1,000 = 8.6), then multiply the result by the number in the first line under the heading entitled "Expenses Paid During Period" to estimate the expenses you paid on your account during this period.
Hypothetical Example for Comparison Purposes
For each Fund, the second line of the table below provides information about hypothetical account values and hypothetical expenses based on the Fund's actual expense ratio and an assumed rate of return of 5% per year before expenses, which is not the Fund's actual return. The hypothetical account values and expenses may not be used to estimate the actual ending account balance or expenses you paid for the period. You may use this information to compare the ongoing costs of investing in the Fund and other funds. To do so, compare this 5% hypothetical example with the 5% hypothetical examples that appear in the shareholder reports of the other funds.
Please note that the expenses shown in the table are meant to highlight your ongoing costs only and do not reflect any redemption fees. Therefore, the second line for each Fund of the table is useful in comparing ongoing costs only, and will not help you determine the relative total costs of owning different funds. In addition, if these redemption fees were included, your costs would have been higher.
| | | Beginning
Account
Value
(07/01/06) | | Ending
Account
Value
(12/31/06) | | Expenses Paid
During Period*
(07/01/06 to
12/31/06) | | Expense Ratio
During Period*
(07/01/06 to
12/31/06) | |
| Guinness Atkinson Alternative Energy Fund Actual^ | | $ | 1,000.00 | | | $ | 1,026.90 | | | $ | 10.12 | | | | 1.98 | %† | |
Guinness Atkinson Alternative Energy Fund Hypothetical
(5% return before expenses) | | $ | 1,000.00 | | | $ | 1,015.22 | | | $ | 10.06 | | | | 1.98 | %† | |
| Guinness Atkinson Asia Focus Fund Actual | | $ | 1,000.00 | | | $ | 1,225.90 | | | $ | 11.33 | | | | 2.02 | % | |
Guinness Atkinson Asia Focus Fund Hypothetical
(5% return before expenses) | | $ | 1,000.00 | | | $ | 1,015.03 | | | $ | 10.25 | | | | 2.02 | % | |
| Guinness Atkinson Asia Pacific Dividend Fund Actual^ | | $ | 1,000.00 | | | $ | 1,194.50 | | | $ | 10.95 | | | | 1.98 | %† | |
Guinness Atkinson Asia Pacific Dividend Fund Hypothetical
(5% return before expenses) | | $ | 1,000.00 | | | $ | 1,015.22 | | | $ | 10.06 | | | | 1.98 | %† | |
| Guinness Atkinson China & Hong Kong Fund Actual | | $ | 1,000.00 | | | $ | 1,247.20 | | | $ | 8.97 | | | | 1.58 | % | |
Guinness Atkinson China & Hong Kong Fund Hypothetical
(5% return before expenses) | | $ | 1,000.00 | | | $ | 1,017.22 | | | $ | 8.05 | | | | 1.58 | % | |
| Guinness Atkinson Global Energy Fund Actual | | $ | 1,000.00 | | | $ | 968.60 | | | $ | 7.19 | | | | 1.45 | %† | |
Guinness Atkinson Global Energy Fund Hypothetical
(5% return before expenses) | | $ | 1,000.00 | | | $ | 1,017.90 | | | $ | 7.37 | | | | 1.45 | %† | |
| Guinness Atkinson Global Innovators Fund Actual | | $ | 1,000.00 | | | $ | 1,125.90 | | | $ | 8.31 | | | | 1.64 | %† | |
Guinness Atkinson Global Innovators Fund Hypothetical
(5% return before expenses) | | $ | 1,000.00 | | | $ | 1,017.39 | | | $ | 7.88 | | | | 1.64 | %† | |
*Expenses are equal to the Funds' annualized expense ratio as indicated, multiplied by the average account value over the period, multiplied by the number of days in most recent fiscal half-year period (184), then divided by the number of days in the fiscal year (365) (to reflect the one-half year period).
†Net of fee waivers and/or expense reimbursements. If those fee waivers and/or expense reimbursements had not been in effect, the Fund's actual expenses would have been higher.
^The Fund commenced operations on March 31, 2006. Actual expenses shown for the Fund are equal to the annualized expense ratio multiplied by the average account value over the period, multiplied by 275/365 (to reflect the period from March 31, 2006 to December 31, 2006).
5
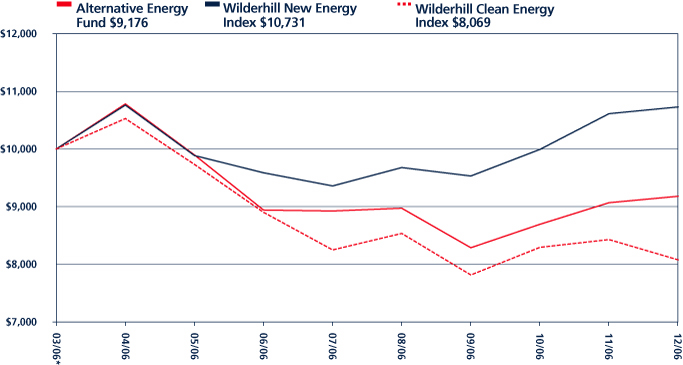
ALTERNATIVE ENERGY FUND for the period ended December 31, 2006
1. Performance
TOTAL RETURNS
| | | Since
Inception
31 March 2006
(actual) | |
| Fund | | | -8.24 | % | |
| Benchmark Index: | |
| Wilderhill Clean Energy Index (ECO) | | | -19.32 | % | |
| Wilderhill New Energy Global Innovation Index (NEX) | | | 7.32 | % | |
Performance data quoted represents past performance and does not guarantee future results. The investment return and principal value of an investment will fluctuate so that an investor's shares, when redeemed, may be worth more or less than their original cost. Current performance of the Funds may be lower or higher than the performance quoted. Performance data current to the most recent month end may be obtained by visiting www.gafunds.com.
The Fund imposes a 2% redemption fee on shares held less than 30 days. Performance data does not reflect the redemption fee. If it had, returns would be lower. Total returns reflect a fee waiver in effect and in the absence of this waiver, the total returns would be lower.
The Alternative Energy Fund was launched 31 March 2006. It has been a volatile first 9 months for the fund. The fund was up 11.28% on the 5th of May but subsequently fell later in May along with global equity markets in general and was down 10.64% at the end of June. By the end of the year the fund had made some further ground and ended down 8.24%. The fund beat the Wilderhill Clean Energy Index (-19.32%) but not the Wilderhill New Energy Global Innovation Index (7.32%).
2. Activity
Our initial portfolio was made up of 45 stocks with the three most represented sectors being Biofuels, Solar and Fuelcells. By the end of the first quarter we had added 5 further stocks from the Biofuels, Solar, Fuelcells and Emissions Trading sectors. We continued to rebalance the portfolio each time flows necessitated dealing and we kept equal weightings in all positions with the exception of one wind stock where we took a double weighted position.
Over the next six months we reduced our exposure to Fuelcells and increased our exposure to the Solar, Wind and Biofuel sectors. At the end of November we sold all our core holdings in ethanol companies. During this period we moved the portfolio towards a model where we held 30 equally weighted units. These 30 units were split whereby we had 12 full positions, 27 stocks each allocated half a unit and 14 research holdings making up 4.5 units.
The best performing sector since launch was the Wind sector with the majority of the stocks up over 50%. The worst performing sector was the Fuelcell sector. While the wind sector continued to grow on strong demand for turbines technological breakthroughs were few and far between in the Fuelcell sector.
6
3. Portfolio Position
| Country | | % of Assets | |
| | | 30-Jun | | 30-Sep | | 29-Dec | |
| Australia | | | 7.70 | % | | | 7.00 | % | | | 6.66 | % | |
| Austria | | | 0.00 | % | | | 0.00 | % | | | 1.92 | % | |
| Brazil | | | 2.00 | % | | | 2.10 | % | | | 1.96 | % | |
| Canada | | | 17.40 | % | | | 19.20 | % | | | 13.62 | % | |
| China | | | 1.90 | % | | | 2.20 | % | | | 3.74 | % | |
| Denmark | | | 2.10 | % | | | 2.10 | % | | | 2.58 | % | |
| France | | | 2.20 | % | | | 2.00 | % | | | 1.66 | % | |
| Germany | | | 14.60 | % | | | 14.40 | % | | | 22.1 | % | |
| Ireland | | | 1.90 | % | | | 1.80 | % | | | 1.52 | % | |
| Malaysia | | | 4.20 | % | | | 1.90 | % | | | 1.58 | % | |
| Spain | | | 2.40 | % | | | 3.10 | % | | | 5.80 | % | |
| Thailand | | | 1.50 | % | | | 2.50 | % | | | 1.24 | % | |
| UK | | | 13.70 | % | | | 16.90 | % | | | 14.26 | % | |
| USA | | | 26.40 | % | | | 22.90 | % | | | 21.12 | % | |
| | | | 100 | % | | | 100 | % | | | 100 | % | |
| Sector | | % of Assets | |
| | | 30-Jun | | 30-Sep | | 29-Dec | |
| Solar | | | 18.60 | % | | | 18.30 | % | | | 21.10 | % | |
| Biofuels | | | 16.40 | % | | | 19.80 | % | | | 20.70 | % | |
| Fuel cells | | | 15.70 | % | | | 14.50 | % | | | 11.70 | % | |
| Wind | | | 12.10 | % | | | 13.20 | % | | | 15.50 | % | |
| Hybrid | | | 8.40 | % | | | 7.50 | % | | | 6.50 | % | |
| Other | | | 8.00 | % | | | 7.90 | % | | | 7.30 | % | |
| Hydro | | | 6.90 | % | | | 7.00 | % | | | 9.40 | % | |
| Palmoil | | | 4.20 | % | | | 1.90 | % | | | 1.60 | % | |
| Storage | | | 4.00 | % | | | 2.50 | % | | | 1.50 | % | |
| Geothermal | | | 3.60 | % | | | 3.40 | % | | | 2.80 | % | |
| Efficiency | | | 2.00 | % | | | 2.40 | % | | | 1.80 | % | |
| | | | 100 | % | | | 100 | % | | | 100 | % | |
7
ALTERNATIVE ENERGY FUND
| Market Capitalization (in $ millions) | | | |
| >1000 | | | 12 | | |
| 500-1000 | | | 5 | | |
| 250-500 | | | 9 | | |
| 100-250 | | | 14 | | |
| 50-100 | | | 11 | | |
| <50 | | | 4 | | |
| Total | | | 55 | | |
The Geographic, Sector and Market Capitalization weightings of the portfolio (ignoring cash) at the end of each quarter are shown above.
4. Investment Approach
In managing the Alternative Energy Fund we normally only invest in companies with a Market Capitalization of at least $50 million and where 50% of their value is derived from Alternative Energy. We see Solar, Biofuels, Wind and Fuelcells as core sectors/themes each offering different opportunities but attractive in its own way. Efficiency is a further sector/theme we are working on building up over the months ahead.
The Wind industry is the most mature of the four. Wind power generating costs are now competitive and capacity globally has gone through 50GW. It is now over 1% of global electricity capacity and has the opportunity to grow its share to 5-10%. It offers manufacturing companies in it 10-20 years of good growth and utility companies that build/acquire generating capacity a prospect of growing returns if energy prices trend higher over time.
Biofuels offering potentially carbon neutral and more secure supplies of transportation fuels have received much publicity since the fund was launched. We are concerned about the recent increase in price of corn squeezing ethanol refiners' margins.
The Solar and Fuelcell industries are at earlier stages of development and are riskier but the upside may be commensurately greater. The fund has exposure to the rapid expansion of photovoltaic cell manufacturing. In the Fuelcell area we have targeted small scale fuel cells (for eg consumer and military applications rather than the transportation sector). When considering stocks for purchase we use a traditional growth at reasonable value approach supported by a four factor screening method in a similar way as for our other funds. We also study sector specific issues and how well placed companies are against their peers.
Other areas in which we are invested are Hydro, Wave Power, Energy Storage and Hybrid vehicles, each of which provides interesting opportunities with differing economics and market dynamics.
We continue to believe that Alternative Energy will be the solution to how we meet rising demand for energy in the face of increasing depletion of fossil fuel reserves and the case for curbing carbon emissions. This means that companies active in this space should enjoy high rates of growth over quite a number of years. We would however warn investors that investing in Alternative Energy should be seen as a long-term investment as there are still limited (albeit growing) pure play public company opportunities in the space and investor interest is considerable meaning valuations are rarely cheap and valuation levels can fluctuate with changing sentiment and changes in eg the long run oil price. The right way to look at an investment in this fund is to think of it as investing in a group of companies which can potentially grow 6x (20% pa) per decade (ie 36X over 20 years) (this is supported if Alternate Energy sources of energy ex Hydro grows from 1% of total energy used to eg 36%). It may be the time scale will be longer than this and/or the amount of penetration achieved less but the direction and order of magnitude seem not implausible. High initial valuations and high volatility are probably an inevitable price to pay for such an opportunity. We see our task being to navigate as best we can the changes in sentiment, new opportunities thrown up by technological breakthroughs, and changing governmental policies and to combine this with trying to pick the winners in the space at moments when they are reasonably valued yet at the same time keeping a well diversified portfolio so we maintain exposure to a good spread of sub sectors.

Tim Guinness 31 January 2007
8
Short-term performance, in particular, is not a good indication of the Fund's future performance and an investment should not be made based solely on returns.
The Fund invests in foreign securities which will involve greater volatility, political, economic and currency risks and differences in accounting methods.
The Wilderhill New Energy Global Innovation Index (NEX) is a modified dollar weighted index of publicly traded companies, which are active in renewable and low-carbon energy, and which stand to benefit from responses to climate change and energy security concern. The Wilderhill Clean Energy Index (ECO) is a modified equal dollar weighted index comprised of publicly traded companies whose businesses stand to benefit substantially from societal transition toward the use of cleaner energy and conservation.
Please refer to the Schedule of Investments for details on fund holdings. Fund holdings and sector allocations are subject to change at any time and are not recommendations to buy or sell any security.
The information provided herein represents the opinion of Guinness Atkinson Management and is not intended to be a forecast of future events, a guarantee of future results, nor investment advice.
9
ALTERNATIVE ENERGY FUND
Growth of $10,000
Total Return
Periods Ended December 31, 2006
Since Inception
(03/31/06) | |
| | -8.24 | % | |
Performance data quoted represents past performance and does not guarantee future results. The investment return and principal value of an investment will fluctuate so that an investor's shares, when redeemed, may be worth more or less than their original.
Total returns reflect a fee waiver in effect and in the absence of this waiver, the total returns would be lower. The Fund imposes a 2% redemption fee on shares held less than 30 days.
The Wilderhill New Energy Global Innovations Index (NEX) is a modified dollar weighted index of publicly traded companies, which are active in renewable and low-carbon energy, and which stand to benefit from responses to climate change and energy security concern. The Wilderhill Clean Energy Index (ECO) is a modified equal dollar weighted index comprised of publicly traded companies whose businesses stand to benefit substantially from societal transition toward the use of cleaner energy and conservation.
10
FUND HIGHLIGHTS at December 31, 2006
GUINNESS ATKINSON ALTERNATIVE ENERGY FUND
| # of Holdings in Portfolio: | | | 55 | | |
| Portfolio Turnover: | | | 31.4 | % | |
| % of Stocks in Top 10: | | | 30.3 | % | |
| Fund Managers: | |
| Timothy W.N. Guinness; | |
| Edmund Harriss | | | | | |
| Top 10 Holdings (% of net assets) | | | | Breakdown (% of Investments) | | | |
| Q-Cells AG | | | 4.0 | % | | Biofuel | | | 24.3 | % | |
| Nordex AG | | | 3.9 | % | | Solar | | | 21.1 | % | |
| Biopetrol Industries AG | | | 3.7 | % | | Wind | | | 15.4 | % | |
| Iberdrola SA | | | 3.7 | % | | Fuelcell | | | 10.0 | % | |
| Environmental Power Corp | | | 3.1 | % | | Hydro | | | 9.0 | % | |
| Vestas Wind Systems A/S | | | 2.5 | % | | Hybrid | | | 6.6 | % | |
| Clipper Windpower PLC | | | 2.5 | % | | Other | | | 5.8 | % | |
| Repower Systems AG | | | 2.5 | % | | Geothermal | | | 2.8 | % | |
| Climate Exchange PLC | | | 2.2 | % | | Efficiency | | | 1.8 | % | |
| Fuel Systems Solutions Inc. | | | 2.2 | % | | Palmoil | | | 1.7 | % | |
| | | | | | | Storage | | | 1.5 | % | |
11
SCHEDULE OF INVESTMENTS IN SECURITIES
at December 31, 2006
GUINNESS ATKINSON ALTERNATIVE ENERGY FUND
| Shares | | COMMON STOCKS: 97.5% | | Value | |
| Biofuel: 20.2% | | | |
| | 843,987 | | | Alkane Energy PLC* | | $ | 322,366 | | |
| | 734,040 | | | Australian Ethanol, Ltd.* | | | 224,995 | | |
| | 147,834 | | | Babcock & Brown Environmental Investments, Ltd.* | | | 174,561 | | |
| | 48,000 | | | Biopetrol Industries AG* | | | 577,995 | | |
| | 54,882 | | | Environmental Power Corporation* | | | 485,706 | | |
| | 25,000 | | | Futurefuel Corporation* | | | 216,500 | | |
| | 25,000 | | | Futurefuel Corporation Warrant* | | | 80,000 | | |
| | 2,354 | | | Green Plains Renewable Energy, Inc.* | | | 58,262 | | |
| | 29,998 | | | GTL Resources PLC* | | | 117,517 | | |
| | 226,667 | | | Natural Fuel, Ltd.* | | | 206,390 | | |
| | 216,147 | | | Novera Energy, Ltd.* | | | 249,793 | | |
| | 197,142 | | | Renewable Power & Light PLC* | | | 299,268 | | |
| | 41,095 | | | Renova Energy, PLC | | | 155,857 | | |
| | | | 3,169,210 | | |
| Efficiency: 1.7% | | | |
| | 34,408 | | | Echelon Corporation* | | | 275,264 | | |
| Fuelcell: 11.3% | | | |
| | 42,088 | | | Ballard Power Systems, Inc.* | | | 239,481 | | |
| | 57,146 | | | Ceres Power Holdings PLC* | | | 245,101 | | |
| | 90,756 | | | CMR Fuel Cells PLC* | | | 287,435 | | |
| | 28,548 | | | FuelCell Energy, Inc.* | | | 184,420 | | |
| | 150,820 | | | Hydrogenics Corporation* | | | 191,608 | | |
| | 111,519 | | | Mechanical Technology, Inc.* | | | 210,771 | | |
| | 140,964 | | | Polyfuel, Inc.* | | | 133,915 | | |
| | 176,142 | | | Quantum Fuel Systems Technologies Worldwide, Inc.* | | | 281,827 | | |
| | | | 1,774,558 | | |
| Geothermal: 2.8% | | | |
| | 234,246 | | | Geodynamics, Ltd.* | | | 161,603 | | |
| | 7,419 | | | Ormat Technologies, Inc. | | | 273,168 | | |
| | | | 434,771 | | |
| Hybrid: 6.4% | | | |
| | 344,865 | | | Azure Dynamics Corporation* | | | 233,867 | | |
| | 15,749 | | | Fuel Systems Solutions, Inc.* | | | 347,738 | | |
| | 107,765 | | | Railpower Technologies Corporation* | | | 139,684 | | |
| | 268,136 | | | Westport Innovations, Inc.* | | | 278,504 | | |
| | | | 999,793 | | |
| Hydro: 9.2% | | | |
| | 30,037 | | | Boralex, Inc.* | | | 268,153 | | |
| | 6,224 | | | Cia Energetica de Minas Gerais – ADR | | | 299,997 | | |
| | 13,189 | | | Iberdrola SA | | | 574,903 | | |
| | 5,490 | | | Oesterreichische Elektrizitaetswirtschafts AG | | | 292,024 | | |
| | | | 1,435,077 | | |
The accompanying notes are an integral part of these financial statements.
12
| Shares | | COMMON STOCKS: 97.5% Continued | | Value | |
| Other: 7.2% | | | |
| | 75,318 | | | AgCert International* | | $ | 235,454 | | |
| | 34,368 | | | Climate Exchange PLC* | | | 348,372 | | |
| | 146,638 | | | Ocean Power Technologies, Inc.* | | | 242,707 | | |
| | 113,420 | | | Trading Emissions PLC* | | | 294,065 | | |
| | | | 1,120,598 | | |
| Palmoil: 1.7% | | | |
| | 1,005,100 | | | Carotech Bhd | | | 258,677 | | |
| Solar: 20.5% | | | |
| | 96,107 | | | Carmanah Technologies Corporation* | | | 243,372 | | |
| | 20,658 | | | Evergreen Solar, Inc.* | | | 156,381 | | |
| | 7,140 | | | MEMC Electronic Materials, Inc.* | | | 279,460 | | |
| | 14,000 | | | Q-Cells AG* | | | 626,731 | | |
| | 86,483 | | | SAG Solarstrom AG* | | | 323,211 | | |
| | 13,340 | | | Solar Millenium AG* | | | 315,905 | | |
| | 18,908 | | | Solar-Fabrik AG* | | | 243,977 | | |
| | 1,537,380 | | | Solartron PLC | | | 185,421 | | |
| | 4,410 | | | Solarworld AG | | | 274,805 | | |
| | 9,411 | | | Suntech Power Holdings Co., Ltd. - ADR* | | | 320,068 | | |
| | 35,399 | | | Xantrex Technology, Inc.* | | | 252,817 | | |
| | | | 3,222,148 | | |
| Storage: 1.5% | | | |
| | 488,561 | | | VRB Power Systems, Inc.* | | | 234,855 | | |
| Wind: 15.0% | | | |
| | 33,737 | | | Clipper Windpower PLC* | | | 392,199 | | |
| | 11,220 | | | Gamesa Corporation Tecnologica SA | | | 307,807 | | |
| | 34,220 | | | Nordex AG* | | | 615,527 | | |
| | 3,773 | | | Repower Systems AG* | | | 388,279 | | |
| | 15,661 | | | Theolia SA* | | | 253,762 | | |
| | 9,335 | | | Vestas Wind Systems A/S* | | | 392,839 | | |
| | | | 2,350,413 | | |
| | | | | Total Common Stocks
(cost $16,804,423) | | | 15,275,364 | | |
| | | | | Total Investments in Securities
(cost $16,804,423): 97.5% | | | 15,275,364 | | |
| | | | | Other Assets less Liabilities: 2.5% | | | 388,368 | | |
| | | | | Net Assets: 100.0% | | $ | 15,663,732 | | |
* Non-income producing security.
ADR American Depository Receipt
The accompanying notes are an integral part of these financial statements
13
ASIA FOCUS FUND for the period ended December 31, 2006
1. Performance
AVERAGE ANNUALIZED TOTAL RETURNS
| | | 1 Year
(actual) | | 3 Years | | 5 Years | | 10 Years | |
| Fund | | | 36.15 | % | | | 21.86 | % | | | 22.73 | % | | | 2.13 | % | |
| Benchmark Index: | |
| MSCI AC Far East Free Ex Japan | | | 31.86 | % | | | 23.18 | % | | | 20.41 | % | | | 2.86 | % | |
| S&P 500 | | | 15.78 | % | | | 10.44 | % | | | 6.19 | % | | | 8.42 | % | |
Performance data quoted represents past performance and does not guarantee future results. The investment return and principal value of an investment will fluctuate so that an investor's shares, when redeemed, may be worth more or less than their original cost. Current performance of the Funds may be lower or higher than the performance quoted. Performance data current to the most recent month end may be obtained by visiting www.gafunds.com.
The Fund imposes a 2% redemption fee on shares held less than 30 days. Performance data quoted does not reflect the redemption fee. If it had, returns would be lower.
Asian markets have had a good 2006 with the regional benchmark index rising 31.86% following on from a rise of 21.13% in 2005. In 2006 the best performing shares were Chinese companies followed by the smaller markets of Indonesia and Philippines.
Most notable has been the increase in Chinese stock valuations where these have been substantially re-rated over the year. Investors now seem to have greater confidence in China's ability to sustain high rates of growth without it leading to a bust. Certainly, China's growth has been impressive. Economic growth is believed to have exceeded 10% again this year and the government has had its work cut out trying to restrain excessive investment. The Chinese have also made significant moves toward financial reform. Three out of the four main banks in China have been listed in Hong Kong. Reforms to the operations of the domestic stock markets in Shanghai and Shenzhen have breathed new life into share prices which had been in the doldrums for years.
Korea and Taiwan had a more difficult year as both countries struggled with weak domestic economies. The problem for them is that while the export companies are no longer the growth driver they once were. Economic growth in Taiwan in 2006 is estimated to have been 4.3% but all of this growth was generated by exports. The difference now is that this exports growth is not driving the domestic economy in the way it once did and in large part this is due to the same "hollowing out" process seen elsewhere in the world. Taiwanese companies are looking for cheaper places to manufacture and for the most part this means China – politics notwithstanding.
The Korean stock market did not perform well in 2006 with earnings believed to have contracted 6% compared to 2005 and perception that prospects for growth were limited. There were bright points however. The shipbuilding sector has continued to grow as the global cycle entered its fourth year. Most of the growth has come from demand for Liquid Natural Gas (LNG) carriers and offshore plant for the oil industry which has taken over from the replacement cycle for container and bulk cargo carriers. As in Taiwan, the weakness has been most glaring in the domestic economy. Consumers remain subdued and after a consumer borrowing binge here (as in Taiwan) there has been little appetite for gearing up.
In South-East Asia, the markets of Indonesia, Malaysia, Singapore and Thailand have had varying fortunes. Both Malaysia and Singapore have had a good year. Malaysia has been an unloved market since the events of 1998 when the previous Prime Minister imposed capital controls to protect the country from the effects of the Asia crisis. While the country was indeed well insulated it also meant there was no impetus to carry out much needed reform. These days Malaysia is moving forward once again with a number of companies restructuring and, more importantly, construction projects which have been on hold for the past three years are now being restarted. The palm oil sector has also been flourishing as crude palm oil prices rise on the back of demand both for foodstuff and also for bio-diesel.
Singapore had another strong year of economic growth with real GDP estimated to have grown 7.7% compared to 6.4% in 2005. Liquidity was plentiful with broad money growth and Foreign Direct Investment reaching record highs. Net immigration is also rising, up 10% in 2006 as the construction boom continues. Singapore is in the process of reconfiguring its economy by boosting its tourism and leisure industry thereby reducing its previous reliance on the highly cyclical electronics industry. The impact is
14
already being felt as although cyclical trade-related activities have slowed materially in recent months (enough in the past to have triggered a recession), growth prospects still look good with 5.1% projected for 2007.
In the weaker economies of Indonesia and Thailand, Indonesia has performed well this year. Interest rates have come down from 12.75% at the start of 2006 to 9.75% by December as inflation fell back from 17% to 6%. The reason for the spike was the government's decision to remove fuel subsidies, which it could no longer afford, and now due to the high base effect we can see that core inflation remained modest. In 2006 we also saw a broader recovery led by net exports. The hope is that this, combined with lower inflation and increased infrastructure spending will lead to a more full-blooded expansion in domestic demand.
Thailand had an extraordinary year in which politics dominated. What started with disapproval of Prime Minister Thaksin gained momentum with his tax-free disposal of his family business to an investment entity owned by the government of Singapore. A snap election was boycotted by most of the opposition parties and was subsequently declared invalid. This was followed by a period of stalemate ending in bloodless coup in September. Finally, the year ended with imposition of wide ranging capital restrictions, which were partially reversed the following day, designed to cope with an appreciating currency (see December 2006 Asia Brief for more detailed discussion). Against this backdrop it was hard for the stock market to make much progress. However, the real economy is not in bad shape with growth of around 4%, inflation at 3.5% and interest rates of 5.25%. Lower interest rates, a resumption of government spending and hopefully an election are wh at the market has to look forward to in 2007.
2. Portfolio Position
Geographically, the portfolio has an overweight position in China, Hong Kong, Malaysia and Thailand relative to the benchmark and is underweight compared to the benchmark in Korea and Singapore. From a sector perspective the Fund's main exposures are to Energy, Technology, Materials and Telecommunication Services. The main underweight exposure at the end of the year was to Banks, Real estate and Utilities.
3. Outlook
It seems hard to believe after all this time, but Asia is only now beginning to emerge from the massive cyclical downturn in 1998, known as the Asia crisis. Over the past eight years Asian countries have been forced to deal with weak domestic demand, excess capacity, depressed asset and property prices and low inflation. It is a core tenet of development economics that emerging nations grow faster than developed nations and that because of the high rate of capital creation through investment, their wealth should grow even faster. This has evidently not been the case for Asia ex Japan over the past ten years, with the notable exceptions of China and India.
The only real functioning driver of growth has been exports and over the last few years we have seen trade balances and foreign exchange reserves move sharply into surplus. And in the past year as the surpluses have grown so large we have seen regional currencies start to appreciate against the Dollar. The rising trade surpluses it should be noted were not due to a massive rise in exports as Asia became super-competitive but instead was the result of an import collapse in 1998/9 and stagnation since led by a drop not in consumption, but in investment.
At last this situation is changing. Asia is now moving from depression economics to normal economics. Construction and investment have ceased their trend declines and have turned positive in the last eighteen months. Domestic oversupply is easing and pushing up property prices across the region and inflation which has averaged around 1-2% is now likely to move back to its normal range of 5-6%. Higher inflation is not only a symptom of renewed activity but can also act as a stimulus for the return of investment.
We believe that Asia is now entering a period of buoyant wealth creation that has been largely absent for ten years. Domestic sectors including banking, construction, and consumer discretionary are all likely to benefit from resurgent domestic growth. Over the next twelve to eighteen months however, Asia still has to contend with the possibility of a global slow down led by the developed markets. Asian market valuations are not stretched either compared to their own history or compared to global peers. Earnings' growth is going to be a key driver from here for most of the region with aggregate growth estimated at 10.74% for 2007 and 12.17% for 2008.

Edmund Harriss February 19, 2007
15
ASIA FOCUS FUND
The Fund invests in foreign securities which involves greater volatility and political, economic and currency risks and differences in accounting methods.
The MSCI AC Far East Free Ex Japan Index is a market-capitalization weighted index of over 450 stocks traded in eight Asian markets, excluding Japan. The Standard & Poor's 500 Index is a market-capitalization weighted index composed of 500 widely held common stocks of U.S. companies. These indices are unmanaged, not available for investment and do not incur expenses.
Please refer to the Schedule of Investments for details on fund holdings. Fund holdings and sector allocations are subject to change at any time are not recommendations to buy or sell any security.
The information provided herein represents the opinion of Guinness Atkinson Management and is not intended to be a forecast of future events, a guarantee of future results, nor investment advice.
16
Growth of $10,000

Average Annual Total Return
Periods Ended December 31, 2006
| One Year | | Five Years | | Ten Years | |
| | 36.15 | % | | | 22.73 | % | | | 2.13 | % | |
Performance data quoted represents past performance and does not guarantee future results. The investment return and principal value of an investment will fluctuate so that an investor's shares, when redeemed, may be worth more or less than their original cost. Current performance of the Funds may be lower or higher than the performance quoted. Performance data current to the most recent month end may be obtained by visiting www.gafunds.com.
Total returns reflect a fee waiver in effect and in the absence of this waiver, the total returns would be lower. The Fund imposes a 2% redemption fee on shares held less than 30 days.
The MSCI AC Far East Free Ex Japan Index is a market capitalization weighted index of over 450 stocks traded in eight Asian markets, excluding Japan. The index referenced in this chart is not available for investment and does not incur expenses.
17
FUND HIGHLIGHTS at December 31, 2006
GUINNESS ATKINSON ASIA FOCUS FUND
| # of Holdings in Portfolio: | | | 48 | | |
| Portfolio Turnover: | | | 95.7 | % | |
| % of Stocks in Top 10: | | | 35.1 | % | |
| Fund Managers: | |
| Edmund Harriss; | |
| Timothy W.N. Guinness | | | | | |
| Top 10 Holdings (% of net assets) | |
| China Mobile Ltd. | | | 4.3 | % | | Telekomunikasi Indonesia Tbk PT | | | 3.3 | % | |
| Angang Steel Co., Ltd. | | | 4.2 | % | | Hon Hai Precision Industry | | | 3.3 | % | |
| Samsung Electronics | | | 3.8 | % | | China Shipping Development Co., Ltd. | | | 3.1 | % | |
| POSCO | | | 3.7 | % | | PetroChina Co., Ltd. | | | 3.1 | % | |
| Wistron Corp. | | | 3.5 | % | | Taiwan Semiconductor Manufacturing Co., Ltd. | | | 2.8 | % | |
| Country Breakdown (% of net assets) | |
| China | | | 24 | % | | Thailand | | | 5 | % | |
| Hong Kong | | | 22 | % | | Indonesia | | | 3 | % | |
| Taiwan | | | 20 | % | | Singapore | | | 3 | % | |
| Korea | | | 16 | % | | Philippines | | | 0 | % | |
| Malaysia | | | 7 | % | | Cash | | | 0 | % | |
| Sector Breakdown (% of Investments) | |
| Steel-Producers | | | 12.5 | % | | Agricultural Operations | | | 2.4 | % | |
| Telecommunication Services | | | 8.3 | % | | Non-Ferrous Metals | | | 2.3 | % | |
| Computers | | | 7.2 | % | | Auto-Cars/Light Trucks | | | 2.1 | % | |
| Oil Exploration & Production | | | 6.2 | % | | Entertainment | | | 2.1 | % | |
| Semiconductors | | | 6.0 | % | | Tobacco | | | 2.0 | % | |
| Oil/Integrated | | | 5.7 | % | | Circuit Boards | | | 1.9 | % | |
| Electronic Components | | | 5.4 | % | | Coal | | | 1.9 | % | |
| Transportation | | | 4.9 | % | | Commercial Banks Non-US | | | 1.7 | % | |
| Real Estate Operation/Development | | | 4.4 | % | | Auto/Truck Parts & Equipment | | | 1.4 | % | |
| Cellular Telecom | | | 4.3 | % | | Chemicals-Other | | | 1.3 | % | |
| Electric Products-Misc | | | 3.8 | % | | Electric-Generation | | | 1.1 | % | |
| Metal Processors & Fabrication | | | 3.7 | % | | Textile-Products | | | 1.0 | % | |
| Distribution/Wholesale | | | 2.8 | % | | Machinery - General Industry | | | 0.8 | % | |
| Power Conv/Supply Equip | | | 2.8 | % | | | | | | | |
18
SCHEDULE OF INVESTMENTS IN SECURITIES
at December 31, 2006
GUINNESS ATKINSON ASIA FOCUS FUND
| Shares | | COMMON STOCKS: 99.9% | | Value | |
| China: 24.6% | | | |
| | 1,428,000 | | | Angang Steel Co., Ltd. | | $ | 2,079,549 | | |
| | 29,000 | | | China Coal Energy Co.* | | | 19,064 | | |
| | 1,374,000 | | | China Petroleum & Chemical Corporation | | | 1,272,664 | | |
| | 1,014,000 | | | China Shipping Development Co., Ltd. | | | 1,552,314 | | |
| | 510,000 | | | Dongfang Electrical Machinery Co., Ltd.^ | | | 1,364,671 | | |
| | 510,000 | | | Guangzhou R&F Properties Co., Ltd. | | | 1,106,171 | | |
| | 207,000 | | | Haitian International Holdings Ltd.* | | | 93,204 | | |
| | 1,306,000 | | | Jiangxi Copper Co., Ltd. | | | 1,323,927 | | |
| | 1,088,000 | | | PetroChina Co., Ltd. | | | 1,550,827 | | |
| | 1,450,000 | | | Shenzhen Expressway Co., Ltd. | | | 871,123 | | |
| | 1,122,800 | | | Yanzhou Coal Mining Co., Ltd. | | | 905,659 | | |
| | | | 12,139,173 | | |
| Hong Kong: 21.7% | | | |
| | 470,000 | | | Chen Hsong Holdings | | | 290,829 | | |
| | 244,000 | | | China Mobile, Ltd. | | | 2,121,930 | | |
| | 1,342,000 | | | CNOOC, Ltd. | | | 1,298,270 | | |
| | 1,752,000 | | | CNPC Hong Kong, Ltd. | | | 962,402 | | |
| | 2,524,000 | | | Denway Motors, Ltd. | | | 1,016,315 | | |
| | 124,840 | | | Esprit Holdings, Ltd. | | | 1,384,381 | | |
| | 1,860,000 | | | Fittec International Group, Ltd. | | | 275,173 | | |
| | 45,892 | | | HSBC Holdings Plc | | | 840,111 | | |
| | 165,000 | | | Kingboard Chemical Holdings, Ltd. | | | 641,040 | | |
| | 7,500 | | | Kingboard Laminates Holdings, Ltd.* | | | 8,095 | | |
| | 468,000 | | | Sino Land Co. | | | 1,081,301 | | |
| | 1,832,000 | | | Solomon Systech International, Ltd. | | | 282,814 | | |
| | 1,307,000 | | | Victory City International Holdings | | | 472,472 | | |
| | | | 10,675,133 | | |
| Indonesia: 3.3% | | | |
| | 1,460,000 | | | Telekomunikasi Indonesia Tbk PT | | | 1,643,448 | | |
| Malaysia: 6.9% | | | |
| | 274,700 | | | Digi.Com Bhd | | | 1,213,456 | | |
| | 223,000 | | | IOI Corp. Bhd | | | 1,161,886 | | |
| | 246,000 | | | Resorts World Bhd | | | 1,010,052 | | |
| | | | 3,385,394 | | |
| Singapore: 3.0% | | | |
| | 323,600 | | | Jurong Technologies Industrial Corporation, Ltd. | | | 227,932 | | |
| | 595,650 | | | Singapore Telecommunications, Ltd. | | | 1,258,662 | | |
| | | | 1,486,594 | | |
The accompanying notes are an integral part of these financial statements.
19
| Shares | | COMMON STOCKS: 99.9% Continued | | Value | |
| South Korea: 15.5% | | | |
| | 7,750 | | | Hyundai Mobis* | | $ | 711,970 | | |
| | 32,100 | | | Hyundai Steel Co.* | | | 1,162,827 | | |
| | 10,820 | | | Korea Zinc Co., Ltd. | | | 1,147,093 | | |
| | 15,920 | | | KT&G Corporation | | | 967,183 | | |
| | 5,450 | | | POSCO | | | 1,801,662 | | |
| | 2,840 | | | Samsung Electronics Co., Ltd. | | | 1,863,064 | | |
| | | | 7,653,799 | | |
| Taiwan: 20.4% | | | |
| | 1,080,328 | | | China Steel Corporation | | | 1,139,055 | | |
| | 519,031 | | | Compal Electronics, Inc. | | | 461,216 | | |
| | 632,082 | | | Coretronic Corp. | | | 821,654 | | |
| | 68,640 | | | High Tech Computer Corporation | | | 1,356,830 | | |
| | 227,115 | | | HON HAI Precision Industry Co., Ltd. | | | 1,624,291 | | |
| | 225,959 | | | Novatek Microelectronics Corporation Ltd. | | | 1,023,020 | | |
| | 77,000 | | | Shin Zu Shing Co., Ltd. | | | 511,695 | | |
| | 675,178 | | | Taiwan Semiconductor Manufacturing Co., Ltd. | | | 1,388,530 | | |
| | 1,160,791 | | | Wistron Corporation | | | 1,726,275 | | |
| | | | 10,052,566 | | |
| Thailand: 4.5% | | | |
| | 199,500 | | | Electricity Generating Pcl | | | 526,824 | | |
| | 1,220,000 | | | Hana Microelectronics Pcl | | | 932,592 | | |
| | 289,000 | | | PTT Exploration & Production Pcl | | | 775,219 | | |
| | | | 2,234,635 | | |
| | | | | Total Common Stocks
(cost $39,821,319) | | | 49,270,742 | | |
| | | | | Total Investments in Securities
(cost $39,821,319): 99.9% | | | 49,270,742 | | |
| | | | | Other Assets less Liabilities: 0.1% | | | 9,196 | | |
| | | | | Net Assets: 100.0% | | $ | 49,279,938 | | |
* Non-income producing security.
^ Fair valued under direction of the Board of Trustees.
The accompanying notes are an integral part of these financial statements.
20
SCHEDULE OF INVESTMENTS BY INDUSTRY
at December 31, 2006
GUINNESS ATKINSON ASIA FOCUS FUND
| Industry | | % of Net Assets | |
| Steel-Producers | | | 12.5 | % | |
| Telecommunication Services | | | 8.4 | | |
| Computers | | | 7.2 | | |
| Oil Exploration & Production | | | 6.2 | | |
| Semiconductors | | | 6.0 | | |
| Oil/Integrated | | | 5.7 | | |
| Electronic Components | | | 5.4 | | |
| Transportation | | | 4.9 | | |
| Real Estate Operation/Development | | | 4.4 | | |
| Cellular Telecom | | | 4.3 | | |
| Electric Products-Misc | | | 3.8 | | |
| Metal Processors & Fabrication | | | 3.7 | | |
| Distribution/Wholesale | | | 2.8 | | |
| Power Conv/Supply Equip | | | 2.8 | | |
| Agricultural Operations | | | 2.4 | | |
| Non-Ferrous Metals | | | 2.3 | | |
| Auto-Cars/Light Trucks | | | 2.1 | | |
| Entertainment | | | 2.0 | | |
| Tobacco | | | 2.0 | | |
| Circuit Boards | | | 1.9 | | |
| Coal | | | 1.9 | | |
| Commercial Banks Non-US | | | 1.7 | | |
| Auto/Truck Parts & Equipment | | | 1.4 | | |
| Chemicals-Other | | | 1.3 | | |
| Electric-Generation | | | 1.1 | | |
| Textile-Products | | | 1.0 | | |
| Machinery-General Industry | | | 0.8 | % | |
| Total Investments in Securities | | | 100.0 | | |
| Other Assets less Liabilities | | | 0.0 | | |
| Net Assets | | | 100.00 | % | |
The accompanying notes are an integral part of these financial statements.
21
ASIA PACIFIC DIVIDEND FUND for the period ended December 31, 2006
1. Performance
TOTAL RETURNS
| | | 6 Months
(actual) | | Since
Inception
31 March 2006
(actual) | |
| Fund | | | 19.36 | % | | | 10.59 | % | |
| Benchmark Index: | |
| MSCI AC Pacific Ex Japan | | | 22.35 | % | | | 23.48 | % | |
| S&P 500 | | | 12.73 | % | | | 11.11 | % | |
Performance data quoted represents past performance and does not guarantee future results. The investment return and principal value of an investment will fluctuate so that an investor's shares, when redeemed, may be worth more or less than their original cost. Current performance of the Funds may be lower or higher than the performance quoted. Performance data current to the most recent month end may be obtained by visiting www.gafunds.com.
The Fund imposes a 2% redemption fee on shares held less than 30 days. Performance data quoted does not reflect the redemption fee. If it had, returns would be lower. Total returns reflect a fee waiver in effect and in the absence of this waiver, the total returns would be lower.
The Fund had a difficult first three months when markets suffered a significant setback in May as investors took fright at signs of increasing inflation concerns coming from the Federal Reserve. The effect was to negate all market gains made in the first half of the year. The second half of the year saw confidence return and the Fund performed very well in the midst of strongly rising markets.
Individual market performances are discussed in greater detail in the Asia Focus Fund report but from this Fund's perspective, holdings in China and Hong Kong performed well as Chinese-related companies made significant gains on greater confidence about growth prospects.
There were also good performances from the Fund's holdings in Malaysia, Indonesia and Singapore. The holdings in Taiwan have been moderate performers which is a reflection of the weak domestic economy. On a sector basis the Fund saw good performance from Materials, especially the steel companies which are held in China, Korea and Taiwan, and from telecom companies held in Indonesia and Malaysia.
The Fund has a significant exposure to Thailand and the extraordinary events there (described in the report for the Asia Focus Fund) including a coup in September and the imposition, followed by a rapid readjustment, of a foreign exchange levy hurt performance at the end of year.
Dividend payouts have been on a rising trend and we have also been seeing more capital restructuring involving the return of cash to shareholders as well as some share buybacks.
2. Portfolio Position
Geographically, the portfolio has an overweight position in Hong Kong, New Zealand, Taiwan and Thailand relative to the benchmark. It is neutrally weighted in China, Indonesia and Malaysia and is underweight compared to the benchmark in Australia, Korea and Singapore. From a sector perspective the Fund has an overweight position in technology, particularly the consumer electronics sector, and is overweight in resources, industrial materials and manufacturing. It has a neutral weight in the consumer sector. The Fund is underweight in telecom and utilities as well as in banks and real estate.
3. Outlook
The following is reproduced from the Asia Focus Fund report:
It seems hard to believe after all this time, but Asia is only now beginning to emerge from the massive cyclical downturn in 1998, known as the Asia crisis. Over the past eight years Asian countries have been forced to deal with weak domestic demand, excess
22
capacity, depressed asset and property prices and low inflation. It is a core tenet of development economics that emerging nations grow faster than developed nations and that because of the high rate of capital creation through investment, their wealth should grow even faster. This has evidently not been the case for Asia ex Japan over the past ten years, with the notable exceptions of China and India.
The only real functioning driver of growth has been exports and over the last few years we have seen trade balances and foreign exchange reserves move sharply into surplus. And in the past year as the surpluses have grown so large we have seen regional currencies start to appreciate against the Dollar. The rising trade surpluses it should be noted were not due to a massive rise in exports as Asia became super-competitive but instead was the result of an import collapse in 1998/9 and stagnation since led by a drop not in consumption, but in investment.
At last this situation is changing. Asia is now moving from depression economics to normal economics. Construction and investment have ceased their trend declines and have turned positive in the last eighteen months. Domestic oversupply is easing and pushing up property prices across the region and inflation which has averaged around 1-2% is now likely to move back to its normal range of 5-6%. Higher inflation is not only a symptom of renewed activity but can also act as a stimulus for the return of investment.
We believe that Asia is now entering a period of buoyant wealth creation that has been largely absent for ten years. Domestic sectors including banking, construction, and consumer discretionary are all likely to benefit from resurgent domestic growth. Over the next twelve to eighteen months however, Asia still has to contend with the possibility of a global slow down led by the developed markets. Asian market valuations are not stretched either compared to their own history or compared to global peers. Earnings' growth is going to be a key driver from here for most of the region with aggregate growth estimated at 10.74% for 2007 and 12.17% for 2008.
From the specific perspective of this fund, we believe that investors should look forward with confidence for the next ten years at least. Asia looks well balanced financially and is on the verge of a domestic led recovery which is now starting to become apparent. Companies have improved and moved on from the previous approach of garnering market share at any cost. There has been a steady increase in dividend payout ratios and a general expectation that companies ought to pay dividends as a sign of awareness of their obligations to shareholders.

Edmund Harriss February 19, 2007
Short-term performance, in particular, is not a good indication of the Fund's future performance and an investment should not be made based solely on returns.
The Fund invests in foreign securities which involves greater volatility and political, economic and currency risks and differences in accounting methods.
The MSCI AC Far East Free Ex Japan Index is a market-capitalization weighted index of over 450 stocks traded in eight Asian markets, excluding Japan. The Standard & Poor's 500 Index is a market-capitalization weighted index composed of 500 widely held common stocks of U.S. companies. These indices are unmanaged, not available for investment and do not incur expenses.
Please refer to the Schedule of Investments for details on fund holdings. Fund holdings and sector allocations are subject to change at any time are not recommendations to buy or sell any security.
The information provided herein represents the opinion of Guinness Atkinson Management and is not intended to be a forecast of future events, a guarantee of future results, nor investment advice.
23
ASIA PACIFIC DIVIDEND FUND
Growth of $10,000

Total Return
Periods Ended December 31, 2006
Since Inception
(03/31/06) | |
| | 10.67 | % | |
Performance data quoted represents past performance and does not guarantee future results. The investment return and principal value of an investment will fluctuate so that an investor's shares, when redeemed, may be worth more or less than their original cost. Current performance of the Funds may be lower or higher than the performance quoted. Performance data current to the most recent month end may be obtained by visiting www.gafunds.com.
Total returns reflect a fee waiver in effect and in the absence of this waiver, the total returns would be lower. The Fund imposes a 2% redemption fee on shares held less than 30 days.
The MSCI AC Far East Free Ex Japan Index is a market capitalization weighted index of over 450 stocks traded in eight Asian markets, excluding Japan. The index referenced in this chart is not available for investment and does not incur expenses.
24
FUND HIGHLIGHTS at December 31, 2006
GUINNESS ATKINSON ASIA PACIFIC DIVIDEND FUND
| # of Holdings in Portfolio: | | | 37 | | |
| Portfolio Turnover: | | | 49.3 | % | |
| % of Stocks in Top 10: | | | 36.7 | % | |
| Fund Managers: | |
| Edmund Harriss; | |
| Timothy W.N. Guinness | | | | | |
| Top 10 Holdings (% of net assets) | |
| Vtech Holdings Ltd | | | 4.4 | % | | High Tech Computer Corp | | | 3.5 | % | |
| Angang Steel Co Ltd | | | 4.4 | % | | China Steel Corp | | | 3.4 | % | |
| Incitec Pivot Ltd | | | 3.9 | % | | United Overseas Bank Ltd | | | 3.3 | % | |
| Telekomunikasi Tbk PT | | | 3.8 | % | | China Shipping Development Co Ltd | | | 3.2 | % | |
| Digi.Com Bhd | | | 3.6 | % | | HSBC Holdings PLC | | | 3.2 | % | |
| Country Breakdown (% of net assets) | |
| Hong Kong | | | 19 | % | | New Zealand | | | 5 | % | |
| Taiwan | | | 18 | % | | Korea | | | 4 | % | |
| China | | | 13 | % | | Indonesia | | | 4 | % | |
| Thailand | | | 13 | % | | Malaysia | | | 4 | % | |
| Australia | | | 11 | % | | Singapore | | | 3 | % | |
| Cash | | | 6 | % | | | | | | | |
| Sector Breakdown (% of Investments) | |
| Commer Banks Non-US | | | 15.7 | % | | Electronic Components | | | 2.6 | % | |
| Steel-Producers | | | 14.4 | % | | Forestry | | | 2.5 | % | |
| Telecommunication | | | 12.6 | % | | Oil Refining & Marketing | | | 2.4 | % | |
| Semiconductors | | | 8.1 | % | | Auto/Truck Parts & Equipment Replacement | | | 2.2 | % | |
| Transportation | | | 6.2 | % | | Finance-Commercial | | | 2.1 | % | |
| Computers | | | 5.8 | % | | Electric-Integrated | | | 1.4 | % | |
| Building & Construction Production | | | 5.7 | % | | Metal Processors & Fabrications | | | 1.2 | % | |
| Agricultural Chemicals | | | 4.2 | % | | Tobacco | | | 1.0 | % | |
| Oil/Integrated | | | 3.2 | % | | Machinery-General Industry | | | 0.2 | % | |
| Distribution/Wholesale | | | 3.1 | % | | Food-Meat Products | | | 0.1 | % | |
| Circuit Boards | | | 2.6 | % | | Coal | | | 0.1 | % | |
| Chemicals-Plastics | | | 2.6 | % | | | | | | | |
25
SCHEDULE OF INVESTMENTS IN SECURITIES
at December 31, 2006
GUINNESS ATKINSON ASIA PACIFIC DIVIDEND FUND
| Shares | | COMMON STOCKS: 94.2% | | Value | |
| Australia: 11.2% | | | |
| | 9,150 | | | CSR, Ltd. | | $ | 27,151 | | |
| | 12,100 | | | Great Southern Plantations | | | 27,001 | | |
| | 1,600 | | | Incitec Pivot, Ltd. | | | 44,642 | | |
| | 7,800 | | | Onesteel, Ltd. | | | 28,886 | | |
| | | | 127,680 | | |
| China: 13.6% | | | |
| | 34,000 | | | Angang Steel Co., Ltd. | | | 49,513 | | |
| | 1,000 | | | China Coal Energy Co.* | | | 657 | | |
| | 24,000 | | | China Shipping Development Co., Ltd. | | | 36,741 | | |
| | 5,000 | | | Haitian International Holdings, Ltd.* | | | 2,251 | | |
| | 1,000 | | | People's Food Holdings, Ltd. | | | 809 | | |
| | 24,000 | | | PetroChina Co., Ltd. | | | 34,209 | | |
| | 50,000 | | | Shenzhen Expressway Co., Ltd. | | | 30,039 | | |
| | | | 154,219 | | |
| Hong Kong: 19.1% | | | |
| | 5,600 | | | Bank of East Asia, Ltd. | | | 30,762 | | |
| | 2,000 | | | CLP Holdings, Ltd. | | | 14,730 | | |
| | 3,000 | | | Esprit Holdings, Ltd. | | | 33,268 | | |
| | 400 | | | HSBC Holdings Plc - ADR | | | 36,613 | | |
| | 16,000 | | | Industrial and Commercial Bank of China Asia, Ltd. | | | 30,710 | | |
| | 144,000 | | | Solomon Systech International, Ltd. | | | 22,230 | | |
| | 8,000 | | | Vtech Holdings, Ltd. | | | 49,760 | | |
| | | | 218,073 | | |
| Indonesia: 3.8% | | | |
| | 38,500 | | | Telekomunikasi Indonesia Tbk PT | | | 43,338 | | |
| Malaysia: 3.7% | | | |
| | 9,400 | | | Digi.Com Bhd | | | 41,523 | | |
| New Zealand: 5.3% | | | |
| | 4,400 | | | Fletcher Building, Ltd. | | | 34,321 | | |
| | 5,600 | | | New Zealand Refining Co., Ltd. | | | 25,695 | | |
| | | | 60,016 | | |
| Singapore: 3.3% | | | |
| | 3,000 | | | United Overseas Bank, Ltd | | | 37,762 | | |
| South Korea: 4.2% | | | |
| | 180 | | | KT&G Corporation | | | 10,935 | | |
| | 110 | | | POSCO | | | 36,364 | | |
| | | | 47,299 | | |
The accompanying notes are an integral part of these financial statements.
26
| Shares | | COMMON STOCKS: 94.2% Continued | | Value | |
| Taiwan: 17.8% | | | |
| | 36,910 | | | China Steel Corporation | | $ | 38,916 | | |
| | 25,734 | | | Compal Electronics, Inc. | | | 22,867 | | |
| | 8,400 | | | Depo Auto Parts Ind Co., Ltd. | | | 23,695 | | |
| | 23,096 | | | Greatek Electronics, Inc. | | | 30,590 | | |
| | 2,000 | | | High Tech Computer Corporation | | | 39,535 | | |
| | 7,549 | | | Novatek Microelectronics Corporation, Ltd. | | | 34,178 | | |
| | 2,000 | | | Shin Zu Shing Co., Ltd. | | | 13,291 | | |
| | | | 203,072 | | |
| Thailand: 12.2% | | | |
| | 58,200 | | | Delta Electronics Thai | | | 27,664 | | |
| | 36,800 | | | Hana Microelectronics Pcl | | | 28,131 | | |
| | 98,000 | | | Krung Thai Bank Pcl | | | 32,145 | | |
| | 58,600 | | | Thai Plastic & Chemical Pcl | | | 27,854 | | |
| | 59,300 | | | Thanachart Captial Pcl | | | 22,747 | | |
| | | | 138,541 | | |
| | | | | Total Common Stocks
(cost $991,114) | | | 1,071,523 | | |
| | | | | Total Investments in Securities
(cost $991,114): 94.2% | | | 1,071,523 | | |
| | | | | Other Assets less Liabilities: 5.8% | | | 66,415 | | |
| | | | | Net Assets: 100.0% | | $ | 1,137,938 | | |
* Non-income producing security.
ADR American Depository Receipt
The accompanying notes are an integral part of these financial statements.
27
SCHEDULE OF INVESTMENTS BY INDUSTRY
at December 31, 2006
GUINNESS ATKINSON ASIA PACIFIC DIVIDEND FUND
| Industry | | % of Net Assets | |
| Commer Banks Non-US | | | 14.8 | % | |
| Steel-Producers | | | 13.5 | | |
| Telecommunication Services | | | 11.8 | | |
| Semiconductors | | | 7.6 | | |
| Transportation | | | 5.9 | | |
| Computers | | | 5.5 | | |
| Building & Construction Production | | | 5.4 | | |
| Agricultural Chemicals | | | 3.9 | | |
| Oil/Integrated | | | 3.0 | | |
| Distribution/Wholesale | | | 2.9 | | |
| Circuit Boards | | | 2.5 | | |
| Chemicals-Plastics | | | 2.4 | | |
| Electronic Components | | | 2.4 | | |
| Forestry | | | 2.4 | | |
| Oil Refining & Marketing | | | 2.2 | | |
| Auto/Truck Parts & Equipment Replacement | | | 2.1 | | |
| Finance-Commercial | | | 2.0 | | |
| Electric-Integrated | | | 1.3 | | |
| Metal Processors & Fabrications | | | 1.2 | | |
| Tobacco | | | 1.0 | | |
| Machinery-General Industry | | | 0.2 | | |
| Food-Meat Products | | | 0.1 | | |
| Coal | | | 0.1 | | |
| Total Investments in Securities | | | 94.2 | | |
| Other Assets less Liabilities | | | 5.8 | | |
| Net Assets | | | 100.00 | % | |
The accompanying notes are an integral part of these financial statements.
28
CHINA & HONG KONG FUND for the period ended December 31, 2006
1. Performance
AVERAGE ANNUALIZED TOTAL RETURNS
| | | 1 Year
(actual) | |
3 Years | |
5 Years | |
10 Years | |
| Fund | | | 39.65 | % | | | 18.64 | % | | | 19.19 | % | | | 6.76 | % | |
| Benchmark Index: | |
| Hang Seng Composite | | | 47.87 | % | | | 23.84 | % | | | 19.93 | % | | | N/A | | |
| Hang Seng | | | 38.51 | % | | | 20.79 | % | | | 16.09 | % | | | 7.49 | % | |
| S&P 500 | | | 15.78 | % | | | 10.44 | % | | | 6.19 | % | | | 8.42 | % | |
Performance data quoted represents past performance and does not guarantee future results. The investment return and principal value of an investment will fluctuate so that an investor's shares, when redeemed, may be worth more or less than their original cost. Current performance of the Funds may be lower or higher than the performance quoted. Performance data current to the most recent month end may be obtained by visiting www.gafunds.com.
The Fund imposes a 2% redemption fee on shares held less than 30 days. Performance data quoted does not reflect the redemption fee. If it had, returns would be lower.
Shares in China and Hong Kong had a strong year overall in 2006 although in truth most of the gains were made in the second half of the year. The year opened with strong equity markets but in May investors took fright concerned that inflation pressures in the US and elsewhere would precipitate more severe monetary tightening. Most markets gave up whatever gains they had made and retreated to levels at which they began the year. When these fears subsided then investors' enthusiasm returned in earnest.
Chinese shares including H shares, Red Chips and other China-related companies were substantially re-rated. This was fuelled by a belief that China's economic growth is now sufficiently robust to withstand periodic overheating of some sectors and that policymakers have sufficient control over the economy to make the necessary adjustment without precipitating a sharp overall downturn.
Another driving factor is the clear decision to allow the currency to appreciate against the US Dollar. The trade surplus and the accumulation of foreign exchange reserves have now reached levels that pose economic concerns as well as political and trade tensions. It seems very likely that this ballooning surplus is a temporary phenomenon and has more to do with policymakers' efforts to slow hot domestic investment, resulting in a substantial fall in imports in 2005 and 2006, rather than a structural issue. Investment will definitely pick up again but the challenge will be to ensure this is directed productively rather than to yet another steel mill or aluminium smelter. In the meantime, a trend of appreciation in the currency is expected to continue.
Two sectors that performed especially well in the year were Chinese financial companies, including banks and insurance, and real estate companies. China has now listed three of the big four commercial banks, the most recent being the $21 billion offering of the Industrial and Commercial Bank of China (ICBC). There has also been a series of smaller regional banks coming to the market.
It is worth pointing out that the Fund has not been invested in this area, other than to take a small initial position in ICBC at the offering. The financial sector is one of the last remaining areas in China where pricing is regulated. Banks cannot price deposits above a certain level and cannot offer loans below a certain level. In the same way life assurance products cannot offer guaranteed returns above a level broadly equivalent to deposit rates. This means that profitability is ensured by regulated pricing. What we also know is that China is moving, with plenty of encouragement from the US, toward restructuring its financial markets, weaning banks away from interest income toward fee-based products such as bank assurance and introducing flexibility to the currency. This will mean de-regulation and opening intense competition between banks and insurers which is presently officially contained.
Hong Kong also performed well in 2006. For a number of years since the downturn in 1998 the market has been hobbling along, either held back or overshadowed by China and trying to come to terms with collapse in property prices and the subsequent overhang of excess real estate supply. Construction activity has been weak and inflation has been slow to turn positive after a long period of falling prices. However, this year things have come good. Property prices have moved higher and stayed higher as the supply overhang looks ready to clear. Wage growth has picked up and is expected to accelerate into 2007; and as inflation picks up from around 1% to 2% in 2006 to 3% on average in 2007 real interest rates will come down. The government too is feeling more confident as a rising corporate tax take improves the budget and has encouraged it to increase spending.
29
CHINA & HONG KONG FUND
2. Portfolio Position
At the end of the year 72% of the portfolio was invested in H Shares, red Chips and China Plays and 26% was invested in Hong Kong companies. On a sector basis the key exposures were to consumer stocks, industrial companies including steel, metals and manufacturers and to resources, namely coal and oil. The Fund also had an overweight position in the transport sector and had a significant position on mobile telephony. The Fund had an underweight position in the financials sector both in Hong Kong and China.
3. Outlook
The strong performance we have seen in Chinese companies is welcome inasmuch as it reflects what we believe to be the case, namely that China's economy has moved on in the last five years to become a broader and more balanced economy and one that no long depends on Central Government pump-priming. The success that China has had in slowing certain sectors while allowing others to continue to flourish, without it all grinding to a halt as in the recent past is testimony to how far it has come.
However, just as we have seen certain economic sectors overheat so too we have seen certain market sectors become heavily over-valued, in our opinion. It is unfortunate that the sectors where this is most apparent are also those that are most opaque and the least free in the scope of their operations and the most vulnerable to regulatory changes. These sectors are also in the firing line for the most challenging stage of China's journey to a true market-based economy. Secretary Paulson has made the point that financial reform is crucial not only to address global imbalances but also to address China's own domestic imbalances. In that respect the efficient allocation of capital is of key importance.
We do not believe that investors should be put off by the foregoing but that it is important to understand what needs to happen in China and how best to benefit from it. Investment growth in China is still substantial with major power, resources and infrastructure projects (especially rail projects) planned or underway. China's manufacturing base is becoming more sophisticated and lower end labour intensive businesses are already moving away to countries like Vietnam and Bangladesh. At the same time there are still 200 million rural labourers yet to be absorbed into the manufacturing economy. This story has a long way to run.
In the meantime we would like to thank investors for choosing this Fund and to assure investors that we are firm believers in the China story. At the same time we will continue to serve what we believe to be investors' best interests by focusing on those companies that offer value, whose businesses are more predictable and that we believe will be the prime beneficiaries of this extraordinary social, cultural and economic transformation.

Edmund Harriss February 19, 2007
The Hang Seng Composite Index is a market-capitalization weighted index that comprises the top 200 companies listed on the Hong Kong Stock Exchange, based on the average market-capitalization for the past twelve months. The Hang Seng Composite Index commenced on January3, 2000 and therefore does not have five-year returns or returns since the Fund's inception. The Hang Seng Index is a barometer of the Hong Kong Stock Market which comprises 33 constituent stocks, whose aggregate market-capitalization accounts for about 70% of the total market-capitalization of the Stock Exchange of Hong Kong Limited. The Standard & Poor's 500 Index is a market-capitalization weighted index composed of 500 widely held common stocks of U.S. companies. These indices are unmanaged, not available for investment and do not incur expenses.
The Fund invests in foreign securities which involves greater volatility and political, economic and currency risks and differences in accounting methods.
Please refer to the Schedule of Investments for details on fund holdings. Fund holdings and sector allocations are subject to change at any time and are not recommendations to buy or sell any security.
The information provided herein represents the opinion of Guinness Atkinson Management and is not intended to be a forecast of future events, a guarantee of future results, nor investment advice.
30
Growth of $10,000

Average Annual Total Return
Periods Ended December 31, 2006
| One Year | | Five Years | | Ten Years | |
| | 39.65 | % | | | 19.19 | % | | | 6.76 | % | |
Performance data quoted represents past performance and does not guarantee future results. The investment return and principal value of an investment will fluctuate so that an investor's shares, when redeemed, may be worth more or less than their original cost. Current performance of the Funds may be lower or higher than the performance quoted. Performance data current to the most recent month end may be obtained by visiting www.gafunds.com.
Total returns reflect a fee waiver in effect and in the absence of this waiver, the total returns would be lower. The Fund imposes a 2% redemption fee on shares held less than 30 days.
The Hang Seng Composite Index is a market-capitalization weighted index that comprises the top 200 companies listed on the Hong Kong Stock Exchange, based on the average market capitalization for the past twelve months. The Fund changed its benchmark from the Hang Seng to the Hang Seng Composite Index to more accurately reflect the market sectors in which the Fund invests. The Hang Seng Composite Index commenced on 01/31/00. The index referenced in this chart is not available for investment and does not incur expenses.
31
FUND HIGHLIGHTS at December 31, 2006
Guinness Atkinson China & Hong Kong Fund
| # of Holdings in Portfolio: | | | 42 | | |
| Portfolio Turnover: | | | 64.8 | % | |
| % of Stocks in Top 10: | | | 53.7 | % | |
| Fund Managers: | |
| Edmund Harriss; | |
| Timothy W.N. Guinness | |
| Top 10 Holdings (% of net assets) | |
| PetroChina Co Ltd. | | | 8.2 | % | | HSBC Holdings PLC | | | 4.6 | % | |
| China Mobile Ltd. | | | 8.1 | % | | Esprit Holdings Ltd. | | | 4.0 | % | |
| CNOOC Ltd. | | | 7.4 | % | | Dongfang Electrical Machinery Co., Ltd. | | | 4.0 | % | |
| Angang Steel Co., Ltd. | | | 5.5 | % | | China Petroleum & Chemical Corp. | | | 3.6 | % | |
| China Shipping Development Co., Ltd. | | | 4.8 | % | | Guangzhou R&F Properties Co., Ltd. | | | 3.5 | % | |
| Country Breakdown (% of net assets) | |
| China | | | 72.0 | % | | Hong Kong | | | 26.0 | % | |
| Sector Breakdown (% of Investments) | |
| Oil & Gas | | | 18.4 | % | | Auto - Cars/Light Trucks | | | 2.7 | % | |
| Telecommunications | | | 10.4 | % | | Electronics | | | 2.7 | % | |
| Real Estate | | | 9.8 | % | | Electric - Integrated | | | 2.3 | % | |
| Commercial Banks | | | 7.5 | % | | Techtronic Industries Co. | | | 2.0 | % | |
| Transportation | | | 7.1 | % | | Agricultural Operations | | | 1.8 | % | |
| Steel Producers | | | 5.6 | % | | Machinery - Diversified | | | 1.7 | % | |
| Diversified Operations | | | 5.3 | % | | Semiconductor Components - Integrated Circuits | | | 1.6 | % | |
| Distribution/Wholesale | | | 4.1 | % | | Rental Auto/Equipment | | | 1.6 | % | |
| Power Conversion/Supply Equipment | | | 4.0 | % | | Textiles | | | 1.4 | % | |
| Petrochemicals | | | 3.7 | % | | Retail | | | 0.2 | % | |
| Metal - Processors & Fabricators | | | 3.1 | % | | Electronic Components - Miscellaneous | | | 0.0 | % | |
| Coal | | | 3.0 | % | | | | | | | |
32
SCHEDULE OF INVESTMENTS IN SECURITIES
at December 31, 2006
GUINNESS ATKINSON CHINA & HONG KONG FUND
| Shares | | COMMON STOCKS: 98.0% | | Value | |
| Agricultural Operations: 1.8% | | | |
| | 3,984,000 | | | Chaoda Modern Agriculture | | $ | 2,567,743 | | |
| Auto – Cars/Light Trucks: 2.6% | | | |
| | 9,314,000 | | | Denway Motors, Ltd. | | | 3,750,379 | | |
| Coal: 3.0% | | | |
| | 81,000 | | | China Coal Energy Co.* | | | 53,248 | | |
| | 5,155,200 | | | Yanzhou Coal Mining Co., Ltd. | | | 4,158,222 | | |
| | | | 4,211,470 | | |
| Commercial Banks: 7.3% | | | |
| | 253,850 | | | Dah Sing Financial Holdings, Ltd. | | | 2,297,396 | | |
| | 358,363 | | | HSBC Holdings Plc | | | 6,560,284 | | |
| | 145,400 | | | Wing Hang Bank, Ltd. | | | 1,644,174 | | |
| | | | 10,501,854 | | |
| Distribution/Wholesale: 4.0% | | | |
| | 519,071 | | | Esprit Holdings, Ltd. | | | 5,756,104 | | |
| Diversified Operations: 5.2% | | | |
| | 249,500 | | | Swire Pacific, Ltd - Class A | | | 2,638,378 | | |
| | 3,724,000 | | | Tianjin Development Holdings, Ltd. | | | 2,644,498 | | |
| | 579,000 | | | Wharf Holdings, Ltd. | | | 2,130,292 | | |
| | | | 7,413,168 | | |
| Electric – Integrated: 2.2% | | | |
| | 431,000 | | | CLP Holdings, Ltd. | | | 3,174,295 | | |
| Electronic Components - Miscellaneous: 0.0% | | | |
| | 100 | | | Surface Mount Technology Holdings, Ltd., warrants, Exp 8/29/09* | | | 1 | | |
| Electronics: 2.6% | | | |
| | 950,000 | | | Kingboard Chemicals Holdings, Ltd. | | | 3,690,839 | | |
| | 43,181 | | | Kingboard Laminates Holdings, Ltd.* | | | 46,607 | | |
| | | | 3,737,446 | | |
| Machinery – Diversified: 1.7% | | | |
| | 3,510,000 | | | Chen Hsong Holdings, Ltd. | | | 2,171,935 | | |
| | 588,000 | | | Haitian International Holdings, Ltd.* | | | 264,752 | | |
| | | | 2,436,687 | | |
| Machinery Tools & Related Products: 1.9% | | | |
| | 2,110,000 | | | Techtronic Industries Co. | | | 2,730,706 | | |
| Medical – Drugs: 0.0% | | | |
| | 1,240,000 | | | Far East Pharmaceutical Technology*†^ | | | — | | |
| Metal – Processors & Fabercations: 3.1% | | | |
| | 4,316,000 | | | Jiangxi Copper Co., Ltd. | | | 4,375,243 | | |
The accompanying notes are an integral part of these financial statements.
33
GUINNESS ATKINSON CHINA & HONG KONG FUND
| Shares | | COMMON STOCKS: 98.0% Continued | | Value | �� |
| Oil & Gas: 18.0% | | | |
| | 10,957,000 | | | CNOOC, Ltd. | | $ | 10,599,956 | | |
| | 6,210,000 | | | CNPC Hong Kong, Ltd. | | | 3,411,254 | | |
| | 8,256,000 | | | PetroChina Co., Ltd. | | | 11,768,037 | | |
| | | | 25,779,247 | | |
| Petrochemicals: 3.6% | | | |
| | 5,570,000 | | | China Petroleum & Chemical Corporation | | | 5,159,199 | | |
| Power Conversion/Supply Equipment: 4.0% | | | |
| | 2,114,000 | | | Dongfang Electrical Machinery Co., Ltd.^ | | | 5,656,697 | | |
| Real Estate: 9.6% | | | |
| | 2,302,000 | | | Guangzhou R&F Properties Holdings, Ltd. | | | 4,992,953 | | |
| | 200,000 | | | Hopewell Holdings, Ltd. | | | 695,972 | | |
| | 3,600,000 | | | Midland Holdings, Ltd. | | | 1,829,339 | | |
| | 1,624,000 | | | Sino Land Co. | | | 3,752,208 | | |
| | 1,330,000 | | | Wheelock & Co., Ltd. | | | 2,515,148 | | |
| | | | 13,785,620 | | |
| Rental Auto/Equipment: 1.5% | | | |
| | 925,000 | | | Cosco Pacific, Ltd. | | | 2,184,786 | | |
| Retail: 0.2% | | | |
| | 698,000 | | | Glorious Sun Enterprises, Ltd. | | | 325,056 | | |
| Semiconductor Components – Integrated Circuits: 1.6% | | | |
| | 7,070,000 | | | FITTEC International Group, Ltd. | | | 1,045,952 | | |
| | 7,816,000 | | | Solomon Systech International, Ltd. | | | 1,206,592 | | |
| | | | 2,252,544 | | |
| Steel Producers: 5.5% | | | |
| | 5,366,000 | | | Angang New Steel Co., Ltd. | | | 7,814,329 | | |
| Telecommunications: 10.2% | | | �� |
| | 1,335,000 | | | China Mobile, Ltd. | | | 11,609,741 | | |
| | 473,000 | | | Vtech Holdings, Ltd. | | | 2,942,065 | | |
| | | | 14,551,806 | | |
| Textiles: 1.4% | | | |
| | 5,512,000 | | | Victory City International Holdings, Ltd. | | | 1,992,554 | | |
| Transportation: 7.0% | | | |
| | 2,621,000 | | | China Shipping Container Lines Co., Ltd. | | | 704,706 | | |
| | 4,510,000 | | | China Shipping Development Co., Ltd. | | | 6,904,275 | | |
| | 3,784,000 | | | Shenzhen Expressway Co., Ltd. | | | 2,273,331 | | |
| | 235,050 | | | Tianjin Port Development Holdings, Ltd.* | | | 74,083 | | |
| | | | 9,956,395 | | |
| | | | | Total Common Stocks
(cost $100,368,643) | | | 140,113,329 | | |
| | | | | Total Investments in Securities
(cost $100,368,643): 98.0% | | | 140,113,329 | | |
| | | | | Other Assets less Liabilities: 2.0% | | | 2,865,349 | | |
| | | | | Net Assets: 100.0% | | $ | 142,978,678 | | |
* Non-income producing security.
^ Fair valued under direction of the Board of Trustees.
† Illiquid
The accompanying notes are an integral part of these financial statements.
34
GLOBAL ENERGY FUND for the period ended December 31, 2006
1. Performance
AVERAGE ANNUALIZED TOTAL RETURNS
| | |
1 Year
(actual) | | Since
Inception
30 June 2004 | |
| Fund | | | 9.85 | % | | | 36.93 | % | |
| Benchmark Index: | |
| S&P 500 | | | 15.84 | % | | | 11.14 | % | |
| MSCI World Energy Index* | | | 15.85 | %* | | | 23.51 | %* | |
*Price return, excludes dividends
Source: Bloomberg
Performance data quoted represents past performance and does not guarantee future results. The investment return and principal value of an investment will fluctuate so that an investor's shares, when redeemed, may be worth more or less than their original cost. Current performance of the Funds may be lower or higher than the performance quoted. Performance data current to the most recent month end may be obtained by visiting www.gafunds.com.
The Fund imposes a 2% redemption fee on shares held less than 30 days. Performance data quoted does not reflect the redemption fee. If it had, returns would be lower. Total returns reflect a fee waiver in effect and in the absence of this waiver, the total returns would be lower.
The Global Energy Fund over the course of 2006 produced a total return of 9.85%. This compared to the MSCI World Energy Index return of 15.85% and the S&P500 Index return of 15.84%. However since over the 30 months since launch the fund is up 104.3% (37.02% pa) whilst the MSCI World Energy Index is up 69.5% (23.51%pa)(price only) the satisfactory longer term performance of the Fund remains intact. Essentially 2006 was a year in which a quarter of the previous 18 months outperformance against the index was given back. Much of the 2006 underperformance during the year was due to the strong performance of Exxon which constitutes 16% of the index and was not held by the Fund. Another significant contributory factor was not reducing the Fund's exposure to US natural gas by enough at the beginning of the year.
2. Activity
Although there was some buying and selling throughout the year, it was mainly concentrated into two periods. In January we sold three gas-oriented US E&P stocks (Burlington, Chesapeake and Devon), sensing that the gas price (unlike the oil price) was likely to average 10% less in 2006 than 2005. We also started to sell off our position in Abbot Group, a UK oil services stock, which was up 30% since June. We finished this sale in March. In their place we bought six oil services stocks: we bought a unit each of Helix (formerly CalDive), Global SantaFe and Patterson, and a third unit each of Todco, Unit Corp and Ensign. Global SantaFe and Todco are offshore drillers; Patterson, Ensign and Unit Corp are onshore drillers, while Helix offers subsea oilfield services. Ensign is a Canadian stock, while the other five are all US companies.
At the end of April we acquired half a holding in CNOOC, which was trading at an all-time discount to Petrochina. This was financed by selling half of our holding in Shell Canada.
The second big change came in late October and November, when we made three changes. We sold our holding in Repsol, which had moved up 20% in a month. In its place we bought BP, which underperformed the market last year and looked cheap. We also took profit on Shell Canada, which rose 47% between October 3rd and October 27th, and CNOOC, which was up 26% year to date. These two half units were replaced with a full unit of Imperial Oil, which was the cheapest Oil Sands company on a pure Price/NAV basis. We also switched half of our Canadian Oil Sands Trust holding into Suncor. The Trust had outperformed the oil sands group and Suncor, like Imperial Oil, looked better value on a Price/NAV basis.
Over the year we also added three small holdings to the 'research' portfolio. In March we bought a holding in Encore Oil, a North Sea exploration company with an interesting acreage position and proven management. In September we added Petroworld (now Coastal Energy Company), a small independent exploration and production company with a focus on oil and gas reserves within Thailand. In December we took a small position in China Coal Corporation. This was the Hong Kong Listing of the former national coal corporation, now the second biggest coal producer in the PRC.
35
GLOBAL ENERGY FUND
3. Portfolio Position
The Portfolio at December 31st 2006 consisted of 29 core holdings, each broadly equally weighted, comprising c.98% of the portfolio (ignoring cash) and 10 "research" holdings in small cap stocks comprising in aggregate a little under 2%. Of the 29 core holdings, 27 were whole units and two were split: one was 50/50 Suncor/Canadian Oil Sands Trust, while the other was one third Todco, one third Unit Corp, and one third Ensign.
The portfolio on the 31st December, by our calculations, had a PER (2006) of 10.5X. By comparison, the S&P500 Index at 1418.30 was on a PER of 16.7X (2006), based on S&P500 2006 eps estimate of 85.14.
The better performing holdings over the year were Petrochina, Marathon, Petrobras, Canadian Oil Sands Trust, Chevron, ConocoPhillips, Occidental and Global SantaFe all of which returned over 20%. It is interesting that two of the top three performers, Petrochina and Petrobras, which returned 72% and 45% respectively, are emerging market stocks and national champions, and that six of our top eight are 'integrated' oil companies. The worst performing holdings were Patterson-UTI, Ensign, Unit Corp, Pioneer Natural Resources, and Sunoco. The first three are all land drillers and thus highly sensitive to the gas price, which averaged $6.74 per Mcf in 2006 versus $8.89 in 2005.
The Sector and Geographic weightings of the portfolio (ignoring cash) at 31st December were as follows:
Sector Breakdown
| | | 31 Dec 2006 | | 31 Dec 2005 | |
| Integrated | | | 23.6 | | | | 20.6 | | |
| E&P/Refining | | | 6.7 | | | | 6.9 | | |
| Sub total integrated | | | 30.3 | | | | 27.5 | | |
| Emerging Markets | | | 10.8 | | | | 14.2 | | |
| Sub total Emerging Markets | | | 10.8 | | | | 14.2 | | |
| E&P Oil Sands | | | 18.0 | | | | 17.8 | | |
| E&P | | | 17.6 | | | | 27.4 | | |
| Sub total E&P | | | 35.6 | | | | 45.2 | | |
| Oil Services & Equipment | | | 13.3 | | | | 2.8 | | |
| Refining | | | 6.7 | | | | 6.9 | | |
| Coal | | | 3.3 | | | | 3.4 | | |
| Total | | | 100.0 | | | | 100.0 | | |
Geographic Breakdown
| | | 31 Dec 2006 | | 31 Dec 2005 | |
| US | | | 55.9 | | | | 54.7 | | |
| Canada | | | 22.8 | | | | 21.4 | | |
| UK | | | 7.1 | | | | 6.3 | | |
| Latin America | | | 3.4 | | | | 7.0 | | |
| Europe | | | 3.6 | | | | 3.4 | | |
| China | | | 3.6 | | | | 3.5 | | |
| South Africa | | | 3.3 | | | | 3.5 | | |
| Other | | | 0.3 | | | | 0.2 | | |
| | | | 100.0 | | | | 100.0 | | |
36
There have been significant sectoral and geographical shifts. The changes early in the year saw a move out of E&P into Oil Services and the sales of Repsol and CNOOC have cut our exposure to Emerging Markets. Similarly, the sale of Repsol has halved our interests in Latin America.
4. Market Background
The oil price (WTI) opened at $61.04 on January 3rd and closed at $61.05 on December 29th but it was anything but a straight line in between. The average price over the year was c$66, compared with c$56.5 in 2005, with a high of $77.03 in mid-July and a low of $55.81 in mid-November.
The underlying story was of a strong run-up in the first half of the year, and a sharp fall in the second. The run-up was caused by several geopolitical factors: tension between the US and Iran over Iran's uranium enrichment program, conflict in the Middle East between Israel and Lebanon, and continued unrest in Nigeria. There was also the very real supply shut-in at Prudhoe Bay, the largest oil field in the US, and the more speculative fear of hurricanes and the opening up of long positions on Nymex. However, the fall from $77 was every bit as dramatic. The hurricane season was benign, peace returned to the Middle East, and speculators closed out their long positions, with the result that WTI fell $20 in three months. Only when OPEC promised to cut twice in quick succession did the oil price find some support, and indeed it rallied in November and December on the news.
The gas price (Henry Hub) averaged $6.74 over the year, down from an average of $8.89 in 2005. With the exception of a bounce in July driven by a spell of very hot weather, the price fell consistently from $9.52 at the start of the year to $3.63 at the end of September. This was caused by unusually warm weather in January and February which meant that the gas in storage was never worked off. As a consequence, storage was almost full again by September, long before the first winter draw. There were some encouraging withdrawals in October and November which drove the price back up to $8, but a warm December saw it fall back to $5.50 where it ended the year.
5. Outlook
Whilst in the very short term the big factor may be the weather in the medium term it will continue to be OPEC. With two production cuts in two months OPEC has taken centre stage, and with Angola (1.4 million barrels per day) joining the cartel in 2007 the importance of OPEC's price monitoring will be more important than ever. Historically they have been slow to react to price movements, and their discipline is sure to be tested in the coming 12 months just as it has been in the past. My feeling is that they are keen to defend a floor of $50; whether or not they can is another matter but my view is that in the end they normally succeed. Of course important other factors will be developing world demand (expected by us to be over 1m b/d) and non OPEC supply growth (expected by us to fall slightly short of demand growth again).
Looking further ahead, we believe the future for oil and gas companies over the next 30 years is bright. The growth in demand should continue to outstrip the growth in supply and the companies should benefit accordingly. The challenge we face is to identify the companies best placed to take advantage of this opportunity.
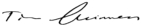
Tim Guinness January 25, 2007
The MSCI World Index is an unmanaged index composed of more than 1,400 stocks listed on exchanges in the U.S., Europe, Canada, Australia, New Zealand and the Far East. The S&P 500 Index is a broad based unmanaged index of 500 stocks, which is widely recognized as representative of the equity market in general. These indices are unmanaged, not available for investment and do not incur expenses.
PER – Price to Earnings ratio is calculated by dividing current price of the stock by the company's trailing months' earnings per share. EPS – Earnings per Share ratio is the total earnings divided by the number of shares outstanding.
The Fund invests in foreign securities which will involve greater volatility, political, economic and currency risks and differences in accounting methods.
The Fund invests in smaller companies, which involve additional risks such as limited liquidity and greater volatility.
Please refer to the Schedule of Investments for details on fund holdings. Fund holdings and sector allocations are subject to change at any time and are not recommendations to buy or sell any security.
The information provided herein represents the opinion of Guinness Atkinson Management and is not intended to be a forecast of future events, a guarantee of future results, nor investment advice.
37
GLOBAL ENERGY FUND
Growth of $10,000
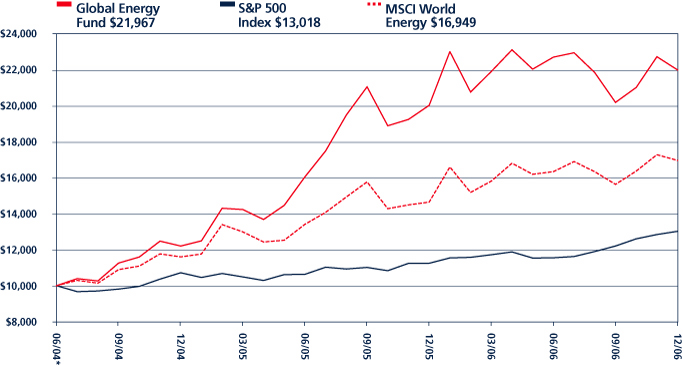
Average Annual Total Return
Periods Ended December 31, 2006
| One Year | | Since Inception (06/30/04) | |
| | 9.80 | % | | | 36.93 | % | |
Performance data quoted represents past performance and does not guarantee future results. The investment return and principal value of an investment will fluctuate so that an investor's shares, when redeemed, may be worth more or less than their original.
Total returns reflect a fee waiver in effect and in the absence of this waiver, the total returns would be lower. The Fund imposes a 2% redemption fee on shares held less than 30 days.
"The MSCI World Index is an unmanaged index composed of more than 1,400 stocks listed on exchanges in the U.S., Europe, Canada, Australia, New Zealand and the Far East.
The S&P 500 Index is a broad based unmanaged index of 500 stocks, which is widely recognized as representative of the equity market in general. These indices are unmanaged, not available for investment and do not incur expenses.
38
FUND HIGHLIGHTS at December 31, 20067
GUINNESS ATKINSON GLOBAL ENERGY FUND
| # of Holdings in Portfolio: | | | 42 | | |
| Portfolio Turnover: | | | 47.2 | % | |
| % of Stocks in Top 10: | | | 34.1 | % | |
| Fund Managers: | |
| Timothy W.N. Guinness; | |
| Edmund Harriss | |
| Top 10 Holdings (% of net assets) | |
| OPTI Canada Inc. | | | 3.5 | % | | OMV AG | | | 3.4 | % | |
| PetroChina Co., Ltd. | | | 3.5 | % | | Anadarko Petroleum Corp. | | | 3.4 | % | |
| Imperial Oil Ltd. | | | 3.5 | % | | Marathon Oil Corp. | | | 3.4 | % | |
| Nexen Inc. | | | 3.4 | % | | Tesoro Corp. | | | 3.3 | % | |
| Petroleo Brasileiro SA | | | 3.4 | % | | Apache Corp. | | | 3.3 | % | |
| Country Breakdown (% of net assets) | |
| United States | | | 55.3 | % | | Austria | | | 3.4 | % | |
| Canada | | | 22.3 | % | | Netherlands | | | 3.3 | % | |
| Britain | | | 3.9 | % | | South Africa | | | 3.3 | % | |
| China | | | 3.7 | % | | Cayman Islands | | | 0.3 | % | |
| Brazil | | | 3.4 | % | | Ireland | | | 0.2 | % | |
| Sector Breakdown (% of Investments) | |
| Oil & Gas-Exploration & Production | | | 27.4 | % | | Oil Refining & Marketing | | | 6.7 | % | |
| Oil & Gas-Producers | | | 23.7 | % | | Coal | | | 3.3 | % | |
| Oil/Integrated | | | 15.2 | % | | Oil & Gas-Field Services | | | 3.3 | % | |
| Oil & Gas | | | 10.2 | % | | Machinery-General Industry | | | 0.2 | % | |
| Oil & Gas-Drilling | | | 10.0 | % | | | | | | | |
39
SCHEDULE OF INVESTMENTS IN SECURITIES
at December 31, 2006
GUINNESS ATKINSON GLOBAL ENERGY FUND
| Shares | | COMMON STOCKS: 99.0% | | Value | |
| Coal: 3.3% | | | |
| | 29,000 | | | China Coal Energy Co.* | | $ | 18,831 | | |
| | 52,900 | | | Peabody Energy Corporation | | | 2,137,689 | | |
| | | | 2,156,520 | | |
| Machinery – General Industry: 0.2% | | | |
| | 299,356 | | | Shandong Molong Petroleum Machinery Co., Ltd. | | | 110,086 | | |
| Oil & Gas: 10.1% | | | |
| | 29,396 | | | Chevron Corporation | | | 2,161,488 | | |
| | 23,558 | | | Marathon Oil Corporation | | | 2,179,115 | | |
| | 23,785 | | | Petroleo Brasileiro SA - ADR | | | 2,223,422 | | |
| | | | 6,564,025 | | |
| Oil & Gas – Drilling: 9.9% | | | |
| | 45,042 | | | Ensign Energy Services, Inc. | | | 711,037 | | |
| | 36,510 | | | GlobalSantaFe Corporation | | | 2,146,058 | | |
| | 92,880 | | | Patterson-UTI Energy, Inc. | | | 2,157,602 | | |
| | 20,830 | | | Todco* | | | 711,761 | | |
| | 14,680 | | | Unit Corporation* | | | 711,246 | | |
| | | | 6,437,704 | | |
| Oil & Gas – Exploration & Production: 27.1% | | | |
| | 99,000 | | | Afren PLC* | | | 109,034 | | |
| | 50,140 | | | Anadarko Petroleum Corporation | | | 2,182,093 | | |
| | 32,649 | | | Apache Corporation | | | 2,171,485 | | |
| | 39,708 | | | Canadian Oil Sands Trust | | | 1,111,535 | | |
| | 364,358 | | | Coastal Energy Co.* | | | 168,894 | | |
| | 31,759 | | | Dragon Oil PLC* | | | 107,394 | | |
| | 46,316 | | | EnCana Corporation | | | 2,133,410 | | |
| | 308,000 | | | EnCore Oil PLC* | | | 150,824 | | |
| | 67,091 | | | Granby Oil & Gas PLC* | | | 120,683 | | |
| | 6,200 | | | Grey Wolf Exploration, Inc.* | | | 16,073 | | |
| | 600 | | | Imperial Energy Corporation PLC* | | | 7,490 | | |
| | 40,644 | | | Nexen, Inc. | | | 2,239,903 | | |
| | 132,278 | | | OPTI Canada, Inc.* | | | 2,245,984 | | |
| | 45,310 | | | Plains Exploration & Production Co.* | | | 2,153,584 | | |
| | 42,200 | | | Synenco Energy, Inc.* | | | 518,376 | | |
| | 46,441 | | | Whiting Petroleum Corporation* | | | 2,164,151 | | |
| | | | 17,600,913 | | |
| Oil & Gas – Field Services: 3.3% | | | |
| | 67,840 | | | Helix Energy Solutions Group, Inc.* | | | 2,128,141 | | |
The accompanying notes are an integral part of these financial statements.
40
| Shares | | COMMON STOCKS: 99.0% Continued | | Value | |
| Oil & Gas – Producers: 23.5% | | | |
| | 30,158 | | | ConocoPhillips | | $ | 2,169,869 | | |
| | 44,278 | | | Occidental Petroleum Corporation | | | 2,162,095 | | |
| | 38,863 | | | OMV AG | | | 2,203,411 | | |
| | 52,690 | | | Petro-Canada | | | 2,159,704 | | |
| | 1,593,000 | | | PetroChina Co., Ltd. | | | 2,245,470 | | |
| | 54,310 | | | Pioneer Natural Resources Co. | | | 2,155,564 | | |
| | 58,557 | | | Sasol, Ltd. | | | 2,148,146 | | |
| | | | 15,244,259 | | |
| Oil Refining & Marketing: 6.6% | | | |
| | 34,430 | | | Sunoco, Inc. | | | 2,147,055 | | |
| | 33,040 | | | Tesoro Corporation | | | 2,173,041 | | |
| | | | 4,320,096 | | |
| Oil/Integrated: 15.0% | | | |
| | 192,525 | | | BP Plc | | | 2,147,705 | | |
| | 42,913 | | | Hess Corporation | | | 2,127,197 | | |
| | 60,863 | | | Imperial Oil, Ltd. | | | 2,242,879 | | |
| | 61,551 | | | Royal Dutch Shell PLC | | | 2,168,354 | | |
| | 13,934 | | | Suncor Energy, Inc. | | | 1,097,903 | | |
| | | | 9,784,038 | | |
| | | | | Total Common Stocks
(cost $55,831,757) | | | 64,345,782 | | |
| | | | | Total Investments in Securities
(cost $55,831,757): 99.0% | | | 64,345,782 | | |
| | | | | Other Assets less Liabilities: 1.0% | | | 644,679 | | |
| | | | | Net Assets: 100.0% | | $ | 64,990,461 | | |
* Non-income producing.
ADR American Depository Receipt
The accompanying notes are an integral part of these financial statements.
41
GLOBAL INNOVATORS FUND for the period ended December 31, 2006
1. Performance
AVERAGE ANNUALIZED TOTAL RETURNS
| | | 1 Year
(Actual) | | 3 Years | | 5 Years | | Since
Inception
15 December 1998 | |
| Fund | | | 18.76 | % | | | 13.77 | % | | | 6.64 | % | | | 5.45 | % | |
| Benchmark Indices: | |
| S&P 500 | | | 15.79 | % | | | 10.45 | % | | | 6.19 | % | | | 3.85 | % | |
| NASDAQ | | | 10.39 | % | | | 7.17 | % | | | 4.99 | % | | | 2.32 | % | |
Performance data quoted represents past performance and does not guarantee future results. The investment return and principal value of an investment will fluctuate so that an investor's shares, when redeemed, may be worth more or less than their original cost. Current performance of the Funds may be lower or higher than the performance quoted. Performance data current to the most recent month end may be obtained by visiting www.gafunds.com.
The Fund imposes a 2% redemption fee on shares held less than 30 days. Performance data quoted does not reflect the redemption fee. If it had, returns would be lower. Total returns reflect a fee waiver in effect and in the absence of this waiver, the total returns would be lower.
The Global Innovators Fund over the course of 2006 performance produced a total return of 18.76%. This compared favourably to the total return of the broader market which as measured by the S&P500 was 15.79% and as measured by the NASDAQ was 10.39%.
This table sets out the comparative returns in discrete years since launch
| | | 2006 | | 2005 | | 2004 | | 2003 | | 2002 | | 2001 | | 2000 | | 1999 | |
| Fund | | | 18.76 | % | | | 11.82 | % | | | 10.89 | % | | | 35.97 | % | | | -31.13 | % | | | -29.05 | % | | | -16.78 | % | | | 68.68 | % | |
| Benchmark Indices | |
| S&P 500 | | | 15.79 | % | | | 4.91 | % | | | 10.87 | % | | | 28.67 | % | | | -22.09 | % | | | -11.88 | % | | | -9.10 | % | | | 21.04 | % | |
| Fund | | | above | | | | above | | | | above | | | | above | | | | below | | | | below | | | | below | | | | above | | |
| NASDAQ | | | 10.39 | % | | | 2.12 | % | | | 9.15 | % | | | 50.77 | % | | | -31.23 | % | | | -20.8 | % | | | -39.18 | % | | | 86.12 | % | |
| Fund | | | above | | | | above | | | | above | | | | below | | | | above | | | | below | | | | above | | | | below | | |
For the third year running the fund has out performed both the S&P500 and the NASDAQ whereas in the five previous years the fund normally turned in a performance between that of the S&P500 and the NASDAQ.
2 Portfolio Construction and Activity
Dealing in the first half of the year was limited to dealing on flows and rebalancing the portfolio.
In the third quarter Wired Magazine published the 2006 Wired 40. New companies that entered the list were Sunpower, Infospace, Verizon, Dupont and Lenovo. In August we made a number of changes to the portfolio. We sold our holdings in Dell, WPP and First Data and we bought Lenovo, Infospace, Parametric Technology and Applied Materials. In September after the oil price had come back from its record highs we bought Schlumberger.
In October we made two switches. We sold Apple and Acxiom and bought TD Ameritrade and Ebay.
Successful stocks over the year were Nvidia (up 102%), Nucor (up 64%), Qwest (up 48%), Cable and Wireless (up 48%) and Oracle (up 40%). Our worst performing stock was Amazon (down 16%).
42
The sector allocation at the beginning and end of the year; and for comparison at the end of 2002 to 2004 was as follows:
| Sector | | 29 Dec 2006 | | 31 Dec 2005 | | 31 Dec 2004 | | 31 Dec 2003 | | 31 Dec 2002 | | 2006 vs 2005 | |
| Telecommunications | | | 17.0 | | | | 14.2 | | | | 14.4 | | | | 17.8 | | | | 15.3 | | | | + | | |
| I T Hardware | | | 14.5 | | | | 21.2 | | | | 16.8 | | | | 15.9 | | | | 11.8 | | | | -- | | |
| Financial | | | 11.5 | | | | 7.8 | | | | 10.0 | | | | 13.3 | | | | 13.2 | | | | + | | |
| I T Software | | | 12.1 | | | | 13.4 | | | | 14.8 | | | | 13.3 | | | | 13.6 | | | | – | | |
| Media/Entertainment | | | 7.5 | | | | 12.8 | | | | 15.1 | | | | 12.3 | | | | 12.5 | | | | -- | | |
| Services | | | – | | | | 4.3 | | | | 5.5 | | | | 7.8 | | | | 11.0 | | | | – | | |
| Healthcare | | | 1.8 | | | | 2.2 | | | | 1.0 | | | | 4.9 | | | | 4.3 | | | | = | | |
| Consumer | | | 4.1 | | | | 4.1 | | | | 7.9 | | | | 3.7 | | | | 2.9 | | | | = | | |
| Retail | | | 7.1 | | | | 7.8 | | | | 4.0 | | | | 3.5 | | | | 3.9 | | | | = | | |
| I T Internet | | | 10.4 | | | | 0.0 | | | | 0.0 | | | | 3.5 | | | | 9.2 | | | | ++ | | |
| Basic Materials | | | 7.0 | | | | 8.3 | | | | 10.0 | | | | 2.9 | | | | 2.5 | | | | – | | |
| Energy | | | 7.0 | | | | 3.9 | | | | – | | | | – | | | | – | | | | + | | |
| | | | 100 | | | | 100 | | | | 99.5 | | | | 98.9 | | | | 100.3 | | | | | | |
Note: = means change less than 1%; -- or ++ means change over 5%.
At the end of the year the portfolio had 30 holdings.
3 Outlook & Strategy
The PER of the fund at the year end was 17.9X (2006) compared with the S&P 500's PER of 16.7X. Earnings of the Funds stocks are, however, projected to grow by 18% in 2007 bringing the PER (2007) down to 15.2X. In addition according to our Holt discounted cashflow metric, the funds holdings were on average undervalued against the market by some 20% (25% upside). Our objective continues to be to out perform both the S&P500 index and the NASDAQ index.
To achieve this we continue to seek attractive investment opportunities among companies that have once been in the Wired Index and thus that exhibit New Economy characteristics. Our four factor screening process forms the basis of our investment approach. These four factors are: (a) value, meaning a disciplined quantitative methodology used to rank all companies on similar basis projecting their internal cash flows using consensus forecast and historic trend data and applying a common overall market determined discount rate to imply fair value and compare this to actual price); (b) business quality (quantitatively ranking companies for the attractiveness of their return on capital metrics); (c) improving results (1 and 3 month earnings estimates revisions); and (d) good recent market price performance (looking particularly for above trend momentum and rising volatility). This screening approach is supported by appropriate due diligence both on the quality of the quantitative inputs to the screening process, and of a more traditional form. Also top down "thematic" judgements will be used in the process of evaluating potential Fund purchases and a regular sell discipline involving review of large movers in the portfolio is also employed.
We hope that over the months and years to come investors will find their faith in our fund management approach and the prospects for this fund with its focus on the future in particular.

Tim Guinness January 25, 2007
43
GLOBAL INNOVATORS FUND
The S&P 500 Index is a broad based unmanaged index of 500 stocks, which is widely recognized as representative of the equity market in general. The NASDAQ Composite Index is a market capitalization weighted index that is designed to represent the performance of the National Market System which includes over 5,000 stocks traded only over-the-counter and not on an exchange. These indices are unmanaged, not available for investment and do not incur expenses.
PER – Price to Earnings ratio is calculated by dividing current price of the stock by the company's trailing months' earnings per share.
The Fund invests in foreign securities which will involve greater volatility, political, economic and currency risks and differences in accounting methods.
Please refer to the Schedule of Investments for details on fund holdings. Fund holdings and sector allocations are subject to change at any time and are not recommendations to buy or sell any security.
The information provided herein represents the opinion of Guinness Atkinson Management and is not intended to be a forecast of future events, a guarantee of future results, nor investment advice.
44
Growth of $10,000
Average Annual Total Return
Periods Ended December 31, 2006
| One Year | | Five Years | | Since Inception (12/15/98) | |
| | 18.76 | % | | | 6.64 | % | | | 5.45 | % | |
Performance data quoted represents past performance and does not guarantee future results. The investment return and principal value of an investment will fluctuate so that an investor's shares, when redeemed, may be worth more or less than their original cost. Current performance of the Funds may be lower or higher than the performance quoted. Performance data current to the most recent month end may be obtained by visiting www.gafunds.com.
Total returns reflect a fee waiver in effect and in the absence of this waiver, the total returns would be lower. The Fund imposes a 2% redemption fee on shares held less than 30 days.
The Standard & Poor's 500 Index is an unmanaged index which is widely regarded as the standard for measuring large cap U.S. Stock market performance. The NASDAQ Composite Index is a market capitalization weighted index that is designed to represent the performance of the National Market System which includes over 5,000 stocks traded only over-the-counter and not on an exchange. The indices referenced in this chart are not available for investment and do not incur expenses.
45
FUND HIGHLIGHTS at December 31, 2006
GUINNESS ATKINSON GLOBAL INNOVATORS FUND
| # of Holdings in Portfolio: | | | 30 | | |
| Portfolio Turnover: | | | 36.5 | % | |
| % of Stocks in Top 10: | | | 37.0 | % | |
| Fund Managers: | |
| Timothy W.N. Guinness; | |
| Edmund Harriss | |
| Top 10 Holdings (% of net assets) | |
| Cable & Wireless PLC | | | 4.0 | % | | Applied Materials Inc. | | | 3.6 | % | |
| Citigroup Inc. | | | 3.8 | % | | Cemex SAB de CV | | | 3.6 | % | |
| Nvidia Corp. | | | 3.8 | % | | Taiwan Semiconductor Manufacturing Co., Ltd. | | | 3.6 | % | |
| State Street Corp. | | | 3.7 | % | | L-3 Communications Holdings Inc. | | | 3.6 | % | |
| American International Group Inc. | | | 3.7 | % | | Nokia Corp. | | | 3.6 | % | |
| Country Breakdown (% of net assets) | |
| United States | | | 62.7 | % | | Taiwan | | | 3.6 | % | |
| Britain | | | 9.3 | % | | Finland | | | 3.6 | % | |
| Japan | | | 7.4 | % | | Israel | | | 3.6 | % | |
| Mexico | | | 3.6 | % | | South Korea | | | 3.5 | % | |
| Sector Breakdown (% of Investments) | |
| Prepackaged Software | | | 12.1 | % | | Communications Equipment | | | 3.7 | % | |
| Semiconductors | | | 11.4 | % | | Radio & TV Communications Equipment | | | 3.6 | % | |
| Commercial Banks | | | 11.3 | % | | Internet Content/Information | | | 3.6 | % | |
| Oil & Gas Producers | | | 7.0 | % | | Electrical Components & Equipment | | | 3.6 | % | |
| E-Commerce/Products | | | 7.0 | % | | Telecommunications | | | 3.5 | % | |
| Telecommunication Services | | | 4.1 | % | | Electronic Computers | | | 3.5 | % | |
| Auto Manufacturers | | | 4.0 | % | | Variety Store | | | 3.4 | % | |
| Fire, Marine, and Casualty Insurance | | | 3.8 | % | | Blast Furn/Mill | | | 3.3 | % | |
| Ready-Mixed Concrete | | | 3.7 | % | | Radiotelephone Communications | | | 2.0 | % | |
| Aerospace/Defense | | | 3.7 | % | | Pharmaceuticals | | | 1.7 | % | |
46
SCHEDULE OF INVESTMENTS IN SECURITIES
at December 31, 2006
GUINNESS ATKINSON GLOBAL INNOVATORS FUND
| Shares | | COMMON STOCKS: 97.3% | | Value | |
| Aerospace/Defense: 3.6% | | | |
| | 17,340 | | | L-3 Communications Holdings, Inc. | | $ | 1,418,065 | | |
| Auto Manufacturers: 3.9% | | | |
| | 19,090 | | | Honda Motor Company - ADR | | | 754,819 | | |
| | 5,680 | | | Toyota Motor Corporation - ADR | | | 762,881 | | |
| | | | 1,517,700 | | |
| Blast Furn/Mill: 3.2% | | | |
| | 22,990 | | | Nucor Corporation | | | 1,256,633 | | |
| Commercial Banks: 10.9% | | | |
| | 26,970 | | | Citigroup, Inc. | | | 1,502,229 | | |
| | 21,734 | | | State Street Corporation | | | 1,465,741 | | |
| | 83,330 | | | TD Ameritrade Holding Corporation | | | 1,348,279 | | |
| | | | 4,316,249 | | |
| Communications Equipment: 3.6% | | | |
| | 69,582 | | | Nokia Corporation - ADR | | | 1,413,906 | | |
| E-Commerce/Products: 6.8% | | | |
| | 35,790 | | | Amazon.Com, Inc.* | | | 1,412,273 | | |
| | 41,820 | | | eBay, Inc.* | | | 1,257,527 | | |
| | | | 2,669,800 | | |
| Electrical Components & Equipment: 3.5% | | | |
| | 4,190 | | | Samsung Electronics Co., Ltd. - GDR 144A | | | 1,378,510 | | |
| Electronic Computers: 3.4% | | | |
| | 3,294,000 | | | Lenovo Group, Ltd. | | | 1,336,910 | | |
| Fire, Marine, and Casualty Insurance: 3.7% | | | |
| | 20,225 | | | American International Group, Inc. | | | 1,449,324 | | |
| Internet Content/Information: 3.5% | | | |
| | 67,560 | | | Infospace, Inc.* | | | 1,385,656 | | |
| Oil & Gas Producers: 6.9% | | | |
| | 20,030 | | | BP PLC - ADR | | | 1,344,013 | | |
| | 21,380 | | | Schlumberger, Ltd. | | | 1,350,361 | | |
| | | | 2,694,374 | | |
| Pharmaceuticals: 1.7% | | | |
| | 25,120 | | | Pfizer, Inc. | | | 650,608 | | |
| Prepackaged Software: 11.8% | | | |
| | 63,640 | | | Check Point Software Technologies, Ltd.* | | | 1,394,989 | | |
| | 23,698 | | | Microsoft Corporation | | | 707,622 | | |
| | 75,140 | | | Oracle Corporation* | | | 1,287,900 | | |
| | 69,340 | | | Parametric Technology Corporation* | | | 1,249,507 | | |
| | | | 4,640,018 | | |
The accompanying notes are an integral part of these financial statements.
47
GUINNESS ATKINSON GLOBAL INNOVATORS FUND
| Shares | | COMMON STOCKS: 97.3% Continued | | Value | |
| Radio & TV Communications Equipment: 3.5% | | | |
| | 32,408 | | | Sony Corporation ADR | | $ | 1,388,035 | | |
| Radiotelephone Communications: 1.9% | | | |
| | 27,795 | | | Vodafone Group PLC. ADR | | | 772,145 | | |
| Ready-Mixed Concrete: 3.6% | | | |
| | 42,074 | | | Cemex SA de CV - ADR* | | | 1,423,363 | | |
| Semiconductors: 11.1% | | | |
| | 77,530 | | | Applied Materials, Inc. | | | 1,430,429 | | |
| | 40,510 | | | Nvidia Corporation* | | | 1,499,275 | | |
| | 129,902 | | | Taiwan Semiconductor Manufacturing Co., Ltd. - ADR | | | 1,419,829 | | |
| | | | 4,349,533 | | |
| Telecommunication Services: 4.0% | | | |
| | 505,200 | | | Cable & Wireless PLC | | | 1,554,857 | | |
| Telecommunications: 3.4% | | | |
| | 160,330 | | | Qwest Communications International, Inc.* | | | 1,341,962 | | |
| Variety Store: 3.3% | | | |
| | 24,860 | | | Costco Wholesale Corporation | | | 1,314,348 | | |
| | | | | Total Common Stocks
(cost $29,953,688) | | | 38,271,996 | | |
| | | | | Total Investments in Securities
(cost $29,953,688): 97.3% | | | 38,271,996 | | |
| | | | | Other Assets less Liabilities: 2.7% | | | 1,049,929 | | |
| | | | | Net Assets: 100.0% | | $ | 39,321,925 | | |
* Non-income producing.
† Rule 144A, Section 4(2) or other security which is restricted as to resale to insitutional investors.
ADR American Depository Receipt
GDR Global Depository Receipt
The accompanying notes are an integral part of these financial statements.
48
STATEMENTS OF ASSETS AND LIABILITIES
at December 31, 2006
| | | Alternative
Energy
Fund | | Asia
Focus
Fund | | Asia Pacific
Dividend
Fund | |
| Assets | |
| Investments in securities, at cost | | $ | 16,804,423 | | | $ | 39,821,319 | | | $ | 991,114 | | |
| Investments in securities, at value | | $ | 15,275,364 | | | $ | 49,270,742 | | | $ | 1,071,523 | | |
| Cash | | | 377,710 | | | | — | | | | 92,585 | | |
Cash denominated in foreign currency (cost of $0, $215,763,
$9,646 respectively) | | | — | | | | 217,677 | | | | 9,633 | | |
| Receivables: | |
| Fund shares sold | | | 88,403 | | | | 54,993 | | | | 500 | | |
| Dividends and interest | | | 4,563 | | | | 33,131 | | | | 3,858 | | |
| Tax Reclaim | | | 174 | | | | — | | | | — | | |
| Prepaid expenses | | | 12,042 | | | | 4,062 | | | | 10,388 | | |
| Total assets | | | 15,758,256 | | | | 49,580,605 | | | | 1,188,487 | | |
| Liabilities | |
| Payables: | |
| Loans | | | — | | | | 133,606 | | | | — | | |
| Fund shares redeemed | | | 30,000 | | | | 31,923 | | | | 2,184 | | |
| Due to advisor | | | 28,675 | | | | 40,715 | | | | 21,178 | | |
| Accrued administration expense | | | 1,699 | | | | 4,069 | | | | 1,700 | | |
| Accrued shareholder servicing plan fees | | | 1,650 | | | | 8,310 | | | | 96 | | |
| Other accrued expenses | | | 31,725 | | | | 54,809 | | | | 24,746 | | |
| Deferred trustees' compensation | | | 775 | | | | 27,235 | | | | 645 | | |
| Total liabilities | | | 94,524 | | | | 300,667 | | | | 50,549 | | |
| Net Assets | | $ | 15,663,732 | | | $ | 49,279,938 | | | $ | 1,137,938 | | |
| Number of shares issued and outstanding (unlimited shares authorized no par value) | | | 1,365,500 | | | | 2,968,139 | | | | 83,892 | | |
| Net asset value per share | | $ | 11.47 | | | $ | 16.60 | | | $ | 13.56 | | |
| Components of Net Assets | |
| Paid-in capital | | $ | 17,536,454 | | | $ | 52,584,553 | | | $ | 1,080,716 | | |
| Accumulated net investment income (loss) | | | (57,143 | ) | | | (3,938 | ) | | | (632 | ) | |
Accumulated net realized loss on investments
and foreign currency | | | (286,525 | ) | | | (12,752,186 | ) | | | (22,544 | ) | |
| Net unrealized appreciation (depreciation) on: | |
| Investments | | | (1,529,059 | ) | | | 9,449,423 | | | | 80,409 | | |
| Foreign Currency | | | 5 | | | | 2,086 | | | | (11 | ) | |
| Net Assets | | $ | 15,663,732 | | | $ | 49,279,938 | | | $ | 1,137,938 | | |
The accompanying notes are an integral part of these financial statements.
49
STATEMENTS OF ASSETS AND LIABILITIES
at December 31, 2006
| | | China &
Hong Kong
Fund | | Global
Energy
Fund | | Global
Innovators
Fund | |
| Assets | |
| Investments in securities, at cost | | $ | 100,368,643 | | | $ | 55,831,757 | | | $ | 29,953,688 | | |
| Investments in securities, at value | | $ | 140,113,329 | | | $ | 64,345,782 | | | $ | 38,271,996 | | |
| Cash | | | 2,766,518 | | | | — | | | | 1,144,228 | | |
Cash denominated in foreign currency (cost of $0, $4,309,
$0 respectively) | | | — | | | | 4,285 | | | | — | | |
| Receivables: | |
| Securities sold | | | — | | | | 1,738,916 | | | | — | | |
| Fund shares sold | | | 118,931 | | | | 104,218 | | | | 6,543 | | |
| Dividends and interest | | | 288,320 | | | | 90,352 | | | | 56,753 | | |
| Tax Reclaim | | | — | | | | 8,887 | | | | 5,688 | | |
| Prepaid expenses | | | 6,495 | | | | 8,852 | | | | 6,658 | | |
| Total assets | | | 143,293,593 | | | | 66,301,292 | | | | 39,491,866 | | |
| Liabilities | |
| Payables: | |
| Securities purchased | | | — | | | | 419,923 | | | | — | | |
| Loans | | | — | | | | 602,250 | | | | — | | |
| Unrealized loss on forward foreign currency contracts | | | — | | | | 1,900 | | | | — | | |
| Fund shares redeemed | | | 35,854 | | | | 175,900 | | | | 43,741 | | |
| Due to advisor | | | 115,835 | | | | 28,638 | | | | 22,319 | | |
| Accrued administration expense | | | 10,035 | | | | 2,636 | | | | 1,753 | | |
| Accrued shareholder servicing plan fees | | | 19,963 | | | | 11,172 | | | | 4,844 | | |
| Other accrued expenses | | | 81,459 | | | | 60,078 | | | | 55,442 | | |
| Deferred trustees' compensation | | | 51,769 | | | | 8,334 | | | | 41,842 | | |
| Total liabilities | | | 314,915 | | | | 1,310,831 | | | | 169,941 | | |
| Net Assets | | $ | 142,978,678 | | | $ | 64,990,461 | | | $ | 39,321,925 | | |
| Number of shares issued and outstanding (unlimited shares authorized no par value) | | | 5,399,668 | | | | 2,544,325 | | | | 2,186,981 | | |
| Net asset value per share | | $ | 26.48 | | | $ | 25.54 | | | $ | 17.98 | | |
| Components of Net Assets | |
| Paid-in capital | | $ | 103,823,351 | | | $ | 56,297,792 | | | $ | 82,962,207 | | |
| Accumulated net investment income (loss) | | | 2,301,043 | | | | (535,545 | ) | | | (65 | ) | |
Accumulated net realized gain (loss) on investments
and foreign currency | | | (2,890,407 | ) | | | 715,770 | | | | (51,958,905 | ) | |
| Net unrealized appreciation (depreciation) on: | |
| Investments | | | 39,744,686 | | | | 8,514,025 | | | | 8,318,308 | | |
| Foreign Currency | | | 5 | | | | (1,581 | ) | | | 380 | | |
| Net Assets | | $ | 142,978,678 | | | $ | 64,990,461 | | | $ | 39,321,925 | | |
The accompanying notes are an integral part of these financial statements.
50
STATEMENTS OF OPERATIONS
For the year ended December 31, 2006
| | | Alternative
Energy
Fund† | | Asia
Focus
Fund | | Asia Pacific
Dividend
Fund† | |
| Investment Income | |
| Income | |
| Dividends* | | $ | 16,577 | | | $ | 1,596,730 | | | $ | 27,816 | | |
| Interest | | | 21,641 | | | | 14,871 | | | | 1,461 | | |
| Total income | | | 38,218 | | | | 1,611,601 | | | | 29,277 | | |
| Expenses | |
| Advisory fees (Note 3) | | | 92,406 | | | | 485,993 | | | | 6,044 | | |
| Administration fees (Note 3) | | | 15,106 | | | | 48,599 | | | | 15,070 | | |
| Transfer agent fees | | | 15,540 | | | | 59,905 | | | | 7,344 | | |
| Custody fees | | | 8,795 | | | | 47,129 | | | | 4,940 | | |
| Fund accounting fees | | | 21,669 | | | | 32,565 | | | | 16,423 | | |
| Audit fees | | | 13,750 | | | | 21,814 | | | | 13,750 | | |
| Legal fees | | | 9,716 | | | | 29,756 | | | | 3,660 | | |
| Organization costs | | | 13,484 | | | | — | | | | 13,602 | | |
| Trustees' fees | | | 4,663 | | | | 19,020 | | | | 3,995 | | |
| Shareholder servicing plan fees (Note 4) | | | 15,106 | | | | 80,585 | | | | 686 | | |
| Reports to shareholders | | | 5,425 | | | | 19,298 | | | | 2,625 | | |
| Registration expense | | | 15,703 | | | | 18,214 | | | | 14,875 | | |
| Interest expense | | | 631 | | | | 10,935 | | | | 113 | | |
| Insurance expense | | | 2,267 | | | | 4,649 | | | | 161 | | |
| Miscellaneous | | | 5,727 | | | | 13,748 | | | | 4,650 | | |
| Total expenses | | | 239,988 | | | | 892,210 | | | | 107,938 | | |
| Plus: Expenses recouped (Note 3) | | | — | | | | — | | | | — | | |
| Less: Fees waived and expenses absorbed (Note 3) | | | (57,011 | ) | | | — | | | | (95,970 | ) | |
| Net expenses | | | 182,977 | | | | 892,210 | | | | 11,968 | | |
| Net investment income (loss) | | | (144,759 | ) | | | 719,391 | | | | 17,309 | | |
| Realized and unrealized gain (loss) on investments and foreign currency | |
| Net realized gain (loss) on: | |
| Investments | | | (286,525 | ) | | | 14,472,198 | | | | (22,544 | ) | |
| Foreign currency | | | (49,988 | ) | | | 3,852 | | | | (3,282 | ) | |
| Change in unrealized appreciation (depreciation) on: | |
| Investments | | | (1,529,059 | ) | | | (3,158,169 | ) | | | 80,409 | | |
| Foreign currency | | | 5 | | | | (843 | ) | | | (11 | ) | |
| Net realized and unrealized gain (loss) on investments and foreign currency | | | (1,865,567 | ) | | | 11,317,038 | | | | 54,572 | | |
| Net increase (decrease) in net assets resulting from operations | | $ | (2,010,326 | ) | | $ | 12,036,429 | | | $ | 71,881 | | |
* Net of foreign tax withheld of $624 for Alternative Energy Fund, $137,907 for Asia Focus Fund and $2,431 for the Asia Pacific Dividend Fund.
† Commenced operations on March 31, 2006.
The accompanying notes are an integral part of these financial statements.
51
STATEMENTS OF OPERATIONS
For the year ended December 31, 2006
| | | China &
Hong Kong
Fund | | Global
Energy
Fund | | Global
Innovators
Fund | |
| Investment Income | |
| Income | |
| Dividends* | | $ | 4,357,490 | | | $ | 1,358,740 | | | $ | 580,596 | | |
| Interest | | | 57,352 | | | | 14,193 | | | | 17,673 | | |
| Total income | | | 4,414,842 | | | | 1,372,933 | | | | 598,269 | | |
| Expenses | |
| Advisory fees (Note 3) | | | 1,227,490 | | | | 690,328 | | | | 273,890 | | |
| Administration fees (Note 3) | | | 111,374 | | | | 46,660 | | | | 21,440 | | |
| Transfer agent fees | | | 105,747 | | | | 116,745 | | | | 89,104 | | |
| Custody fees | | | 64,001 | | | | 47,489 | | | | 12,538 | | |
| Fund accounting fees | | | 49,636 | | | | 35,048 | | | | 26,173 | | |
| Audit fees | | | 22,024 | | | | 23,538 | | | | 22,015 | | |
| Legal fees | | | 73,359 | | | | 60,621 | | | | 22,953 | | |
| Trustees' fees | | | 33,458 | | | | 19,736 | | | | 20,742 | | |
| Shareholder servicing plan fees (Note 4) | | | 165,708 | | | | 107,267 | | | | 43,120 | | |
| Reports to shareholders | | | 38,764 | | | | 31,895 | | | | 23,254 | | |
| Registration expense | | | 19,606 | | | | 18,955 | | | | 18,058 | | |
| Interest expense | | | 2,143 | | | | 39,182 | | | | 8,699 | | |
| Insurance expense | | | 13,487 | | | | 11,872 | | | | 4,678 | | |
| Miscellaneous | | | 23,807 | | | | 21,679 | | | | 11,708 | | |
| Total expenses | | | 1,950,604 | | | | 1,271,015 | | | | 598,372 | | |
| Plus: Expenses recouped (Note 3) | | | — | | | | 64,811 | | | | — | | |
| Less: Fees waived and expenses absorbed (Note 3) | | | — | | | | — | | | | (32,356 | ) | |
| Net expenses | | | 1,950,604 | | | | 1,335,826 | | | | 566,016 | | |
| Net investment income | | | 2,464,238 | | | | 37,107 | | | | 32,253 | | |
| Realized and unrealized gain (loss) on investments and foreign currency | |
| Net realized gain (loss) on: | |
| Investments | | | 39,656,354 | | | | 5,090,808 | | | | 4,513,701 | | |
| Foreign currency | | | (6,011 | ) | | | (97,532 | ) | | | (1,863 | ) | |
| Change in unrealized appreciation (depreciation) on: | |
| Investments | | | (701,396 | ) | | | 1,659,735 | | | | 1,768,758 | | |
| Foreign currency | | | 123 | | | | 2,087 | | | | 380 | | |
| Net realized and unrealized gain on investments and foreign currency | | | 38,949,070 | | | | 6,655,098 | | | | 6,280,976 | | |
| Net increase in net assets resulting from operations | | $ | 41,413,308 | | | $ | 6,692,205 | | | $ | 6,313,229 | | |
*Net of foreign tax withheld of $0 for China & Hong Kong Fund, $91,724 for Global Energy Fund and $6,270 for the Global Innovators Fund.
The accompanying notes are an integral part of these financial statements.
52
(This page is Intentionally Left Blank)
53
STATEMENTS OF CHANGES IN NET ASSETS
| | | Altnerative
Energy
Fund | |
Asia Focus Fund | | Asia Pacific
Dividend
Fund | |
China & Hong Kong Fund | |
| | | March 31, 2006#
Through
December 31, 2006 | | Year Ended
December 31, 2006 | | Year Ended
December 31, 2005 | | March 31, 2006#
Through
December 31, 2006 | |
Year Ended
December 31, 2006 | |
Year Ended
December 31, 2005 | |
| Increase (decrease) in net assets from: | |
| Operations | |
| Net investment income (loss) | | $ | (144,759 | ) | | $ | 719,391 | | | $ | 468,933 | | | $ | 17,309 | | | $ | 2,464,238 | | | $ | 1,959,799 | | |
| Net realized gain (loss) on: | |
| Investments | | | (286,525 | ) | | | 14,472,198 | | | | 2,607,185 | | | | (22,544 | ) | | | 39,656,354 | | | | 8,257,990 | | |
| Foreign currency | | | (49,988 | ) | | | 3,852 | | | | (9,152 | ) | | | (3,282 | ) | | | (6,011 | ) | | | 26,777 | | |
| Change in net unrealized appreciation (depreciation) on: | |
| Investments | | | (1,529,059 | ) | | | (3,158,169 | ) | | | 3,088,697 | | | | 80,409 | | | | (701,396 | ) | | | (3,246,442 | ) | |
| Foreign currency | | | 5 | | | | (843 | ) | | | 683 | | | | (11 | ) | | | 123 | | | | (154 | ) | |
| Net increase in net assets resulting from operations | | | (2,010,326 | ) | | | 12,036,429 | | | | 6,156,346 | | | | 71,881 | | | | 41,413,308 | | | | 6,997,970 | | |
| Distributions to shareholders | |
| From net investment income | | | — | | | | (710,741 | ) | | | (531,257 | ) | | | (15,132 | ) | | | (53,575 | ) | | | (4,726,043 | ) | |
| From net realized cap gain | | | — | | | | — | | | | — | | | | — | | | | — | | | | — | | |
| Decrease in net assets from distributions | | | — | | | | (710,741 | ) | | | (531,257 | ) | | | (15,132 | ) | | | (53,575 | ) | | | (4,726,043 | ) | |
| Capital share transactions | |
| Proceeds from shares sold | | | 24,624,826 | | | | 26,349,696 | | | | 7,546,892 | | | | 1,608,465 | | | | 16,755,268 | | | | 15,987,251 | | |
| Proceeds from shares reinvested | | | — | | | | 685,617 | | | | 513,947 | | | | 14,632 | | | | 52,062 | | | | 4,595,099 | | |
| Cost of shares redeemed | | | (6,968,508 | ) | | | (25,714,104 | ) | | | (7,783,657 | ) | | | (542,943 | ) | | | (26,229,433 | ) | | | (24,180,299 | ) | |
| Redemption fee proceeds (Note 3) | | | 17,740 | | | | 105,032 | | | | 14,346 | | | | 1,035 | | | | 14,361 | | | | 28,955 | | |
| Net increase from capital share transactions | | | 17,674,058 | | | | 1,426,241 | | | | 291,528 | | | | 1,081,189 | | | | (9,407,742 | ) | | | (3,568,994 | ) | |
| Total increase (decrease) in net assets | | | 15,663,732 | | | | 12,751,929 | | | | 5,916,617 | | | | 1,137,938 | | | | 31,951,991 | | | | (1,297,067 | ) | |
| Net assets | |
| Beginning of period | | | — | | | | 36,528,009 | | | | 30,611,392 | | | | — | | | | 111,026,687 | | | | 112,323,754 | | |
| End of period | | $ | 15,663,732 | | | $ | 49,279,938 | | | $ | 36,528,009 | | | $ | 1,137,938 | | | $ | 142,978,678 | | | $ | 111,026,687 | | |
| Accumulated net investment income (loss) | | $ | (57,143 | ) | | $ | (3,938 | ) | | $ | (16,440 | ) | | $ | (632 | ) | | $ | 2,301,043 | | | $ | (2,052,070 | ) | |
| Capital share activity | |
| Shares sold | | | 1,988,420 | | | | 1,883,119 | | | | 654,707 | | | | 128,257 | | | | 753,713 | | | | 832,145 | | |
| Shares issued on reinvestment | | | — | | | | 43,726 | | | | 42,758 | | | | 1,237 | | | | 2,122 | | | | 242,230 | | |
| Shares redeemed | | | (622,920 | ) | | | (1,908,625 | ) | | | (690,744 | ) | | | (45,602 | ) | | | (1,208,738 | ) | | | (1,271,184 | ) | |
| Net increase (decrease) in shares outstanding | | | 1,365,500 | | | | 18,220 | | | | 6,721 | | | | 83,892 | | | | (452,903 | ) | | | (196,809 | ) | |
# Commencement of operations.
The accompanying notes are an integral part of these financial statements.
54
| | |
Global Energy Fund | |
Global Innovators Fund | |
| | |
Year Ended
December 31, 2006 | |
Year Ended
December 31, 2005 | |
Year Ended
December 31, 2006 | |
Year Ended
December 31, 2005 | |
| Increase (decrease) in net assets from: | |
| Operations | |
| Net investment income (loss) | | $ | 37,107 | | | $ | (80,393 | ) | | $ | 32,253 | | | $ | (118,095 | ) | |
| Net realized gain (loss) on: | |
| Investments | | | 5,090,808 | | | | 854,293 | | | | 4,513,701 | | | | 2,269,309 | | |
| Foreign currency | | | (97,532 | ) | | | (214,533 | ) | | | (1,863 | ) | | | — | | |
| Change in net unrealized appreciation (depreciation) on: | |
| Investments | | | 1,659,735 | | | | 6,722,876 | | | | 1,768,758 | | | | 1,721,322 | | |
| Foreign currency | | | 2,087 | | | | (2,980 | ) | | | 380 | | | | — | | |
| Net increase in net assets resulting from operations | | | 6,692,205 | | | | 7,279,263 | | | | 6,313,229 | | | | 3,872,536 | | |
| Distributions to shareholders | |
| From net investment income | | | (525,608 | ) | | | — | | | | — | | | | — | | |
| From net realized cap gain | | | (3,372,424 | ) | | | (1,590,636 | ) | | | — | | | | — | | |
| Decrease in net assets from distributions | | | (3,898,032 | ) | | | (1,590,636 | ) | | | — | | | | — | | |
| Capital share transactions | |
| Proceeds from shares sold | | | 57,559,663 | | | | 150,338,858 | | | | 4,754,293 | | | | 951,723 | | |
| Proceeds from shares reinvested | | | 3,620,028 | | | | 1,524,399 | | | | — | | | | — | | |
| Cost of shares redeemed | | | (97,775,898 | ) | | | (60,588,462 | ) | | | (8,112,735 | ) | | | (10,513,339 | ) | |
| Redemption fee proceeds (Note 3) | | | 53,811 | | | | 140,523 | | | | 534 | | | | 806 | | |
| Net increase from capital share transactions | | | (36,542,396 | ) | | | 91,415,318 | | | | (3,357,908 | ) | | | (9,560,810 | ) | |
| Total increase (decrease) in net assets | | | (33,748,223 | ) | | | 97,103,945 | | | | 2,955,321 | | | | (5,688,274 | ) | |
| Net assets | |
| Beginning of period | | | 98,738,684 | | | | 1,634,739 | | | | 36,366,604 | | | | 42,054,878 | | |
| End of period | | $ | 64,990,461 | | | $ | 98,738,684 | | | $ | 39,321,925 | | | $ | 36,366,604 | | |
| Accumulated net investment income (loss) | | $ | (535,545 | ) | | $ | (24,465 | ) | | $ | (65 | ) | | $ | (30,455 | ) | |
| Capital share activity | |
| Shares sold | | | 2,129,926 | | | | 6,458,941 | | | | 277,904 | | | | 69,056 | | |
| Shares issued on reinvestment | | | 137,181 | | | | 59,921 | | | | — | | | | — | | |
| Shares redeemed | | | (3,733,778 | ) | | | (2,615,032 | ) | | | (493,563 | ) | | | (772,796 | ) | |
| Net increase (decrease) in shares outstanding | | | (1,466,671 | ) | | | 3,903,830 | | | | (215,659 | ) | | | (703,740 | ) | |
55
FINANCIAL HIGHLIGHTS
For a capital share outstanding throughout the period
| Alternative Energy Fund | | March 31, 2006(1)
Through
December 31, 2006 | |
| Net asset value, beginning of period | | $ | 12.50 | | |
| Income from investment operations: | |
| Net investment loss | | | (0.11 | ) | |
| Net realized and unrealized loss on investments and foreign currency | | | (0.93 | ) | |
| Total from investment operations | | | (1.04 | ) | |
| Redemption fee proceeds | | | 0.01 | | |
| Net asset value, end of period | | $ | 11.47 | | |
| Total return | | | (8.24 | )%(2) | |
| Ratios/supplemental data: | |
| Net assets, end of period (millions) | | $ | 15.7 | | |
| Ratio of expenses to average net assets: | |
| Before fees waived/expenses recouped | | | 2.60 | %(3) | |
| After fees waived/expenses recouped | | | 1.98 | %(3) | |
| Ratio of net investment loss to average net assets: | |
| Before fees waived/expenses recouped | | | (2.18 | )%(3) | |
| After fees waived/expenses recouped | | | (1.56 | )%(3) | |
| Portfolio turnover rate | | | 21.71 | %(2) | |
(1) Commencement of Operations.
(2) Not annualized.
(3) Annualized.
The accompanying notes are an integral part of these financial statements.
56
FINANCIAL HIGHLIGHTS
For a capital share outstanding throughout the year
| | | Year Ended December 31, | |
| Asia Focus Fund | | 2006 | | 2005 | | 2004 | | 2003 | | 2002 | |
| Net asset value, beginning of year | | $ | 12.38 | | | $ | 10.40 | | | $ | 9.51 | | | $ | 5.80 | | | $ | 6.18 | | |
| Income from investment operations: | |
| Net investment income (loss) | | | 0.24 | | | | 0.16 | | | | 0.06 | | | | 0.06 | | | | (0.05 | ) | |
| Net realized and unrealized gain (loss) on investments and foreign currency | | | 4.18 | | | | 2.00 | | | | 0.89 | | | | 3.61 | | | | (0.37 | ) | |
| Total from investment operations | | | 4.42 | | | | 2.16 | | | | 0.95 | | | | 3.67 | | | | (0.42 | ) | |
| Less distributions: | |
| From net investment income | | | (0.24 | ) | | | (0.18 | ) | | | (0.06 | ) | | | — | | | | — | | |
| Total distributions | | | (0.24 | ) | | | (0.18 | ) | | | (0.06 | ) | | | — | | | | — | | |
| Redemption fee proceeds | | | 0.04 | | | | — | (1) | | | — | (1) | | | 0.04 | | | | 0.04 | | |
| Net asset value, end of year | | $ | 16.60 | | | $ | 12.38 | | | $ | 10.40 | | | $ | 9.51 | | | $ | 5.80 | | |
| Total return | | | 36.15 | % | | | 20.83 | % | | | 10.01 | % | | | 63.97 | % | | | (6.15 | )% | |
| Ratios/supplemental data: | |
| Net assets, end of year (millions) | | $ | 49.3 | | | $ | 36.5 | | | $ | 30.6 | | | $ | 36.2 | | | $ | 16.5 | | |
| Ratio of expenses to average net assets: | |
| Before fees waived/expenses recouped | | | 1.84 | % | | | 1.81 | % | | | 2.04 | % | | | 2.16 | % | | | 2.62 | % | |
| After fees waived/expenses recouped | | | 1.84 | % | | | 1.87 | % | | | 1.98 | % | | | 1.95 | % | | | 1.98 | % | |
| Ratio of net investment income (loss) to average net assets: | |
| Before fees waived/expenses recouped | | | 1.48 | % | | | 1.47 | % | | | 0.51 | % | | | 0.75 | % | | | (1.26 | )% | |
| After fees waived/expenses recouped | | | 1.48 | % | | | 1.41 | % | | | 0.57 | % | | | 0.96 | % | | | (0.62 | )% | |
| Portfolio turnover rate | | | 95.68 | % | | | 18.25 | % | | | 32.41 | % | | | 114.90 | % | | | 188.96 | % | |
(1) Amount represents less than $0.01 per share.
The accompanying notes are an integral part of these financial statements.
57
FINANCIAL HIGHLIGHTS
For a capital share outstanding throughout the period
| Asia Pacific Dividend Fund | | March 31, 2006(1)
Through
December 31, 2006 | |
| Net asset value, beginning of period | | $ | 12.50 | | |
| Income from investment operations: | |
| Net investment income | | | 0.25 | | |
Net realized and unrealized gain on investments and
foreign currency | | | 1.03 | | |
| Total from investment operations | | | 1.28 | | |
| Less distributions: | |
| From net investment income | | | (0.23 | ) | |
| Total distributions | | | (0.23 | ) | |
| Redemption fee proceeds | | | 0.01 | | |
| Net asset value, end of period | | $ | 13.56 | | |
| Total return | | | 10.59 | %(2) | |
| Ratios/supplemental data: | |
| Net assets, end of period (millions) | | $ | 1.1 | | |
| Ratio of expenses to average net assets: | |
| Before fees waived | | | 17.86 | %(3) | |
| After fees waived | | | 1.98 | %(3) | |
| Ratio of net investment income (loss) to average net assets: | |
| Before fees waived | | | (13.02 | )%(3) | |
| After fees waived | | | 2.86 | %(3) | |
| Portfolio turnover rate | | | 34.12 | %(2) | |
(1) Commencement of Operations.
(2) Not annualized.
(3) Annualized.
The accompanying notes are an integral part of these financial statements.
58
FINANCIAL HIGHLIGHTS
For a capital share outstanding throughout the year
| | | Year Ended December 31, | |
| China & Hong Kong Fund | | 2006 | | 2005 | | 2004 | | 2003 | | 2002 | |
| Net asset value, beginning of year | | $ | 18.97 | | | $ | 18.57 | | | $ | 16.81 | | | $ | 10.17 | | | $ | 11.67 | | |
| Income from investment operations: | |
| Net investment income | | | 0.43 | | | | 0.37 | | | | 0.25 | | | | 0.20 | | | | 0.13 | | |
| Net realized and unrealized gain (loss) on investments and foreign currency | | | 7.09 | | | | 0.86 | | | | 1.78 | | | | 6.44 | | | | (1.66 | ) | |
| Total from investment operations | | | 7.52 | | | | 1.23 | | | | 2.03 | | | | 6.64 | | | | (1.53 | ) | |
| Less distributions: | |
| From net investment income | | | (0.01 | ) | | | (0.83 | ) | | | (0.27 | ) | | | — | | | | — | | |
| Total distributions | | | (0.01 | ) | | | (0.83 | ) | | | (0.27 | ) | | | — | | | | — | | |
| Redemption fee proceeds | | | — | (1) | | | — | (1) | | | — | (1) | | | — | (1) | | | 0.03 | | |
| Net asset value, end of year | | $ | 26.48 | | | $ | 18.97 | | | $ | 18.57 | | | $ | 16.81 | | | $ | 10.17 | | |
| Total return | | | 39.65 | % | | | 6.61 | % | | | 12.16 | % | | | 65.29 | % | | | (12.85 | )% | |
| Ratios/supplemental data: | |
| Net assets, end of year (millions) | | $ | 143.0 | | | $ | 111.0 | | | $ | 112.3 | | | $ | 116.5 | | | $ | 56.9 | | |
| Ratio of expenses to average net assets | | | 1.59 | % | | | 1.63 | % | | | 1.67 | % | | | 1.81 | % | | | 2.02 | % | |
| Ratio of net investment income to average net assets | | | 2.01 | % | | | 1.74 | % | | | 1.26 | % | | | 2.01 | % | | | 1.08 | % | |
| Portfolio turnover rate | | | 64.81 | % | | | 12.51 | % | | | 15.37 | % | | | 28.57 | % | | | 60.95 | % | |
(1) Amount represents less than $0.01 per share.
The accompanying notes are an integral part of these financial statements.
59
FINANCIAL HIGHLIGHTS
For a capital share outstanding throughout the period
| | | Year Ended December 31, | | June 30, 2004(1)
Through | |
| Global Energy Fund | | 2006 | | 2005 | | December 31, 2004 | |
| Net asset value, beginning of period | | $ | 24.62 | | | $ | 15.25 | | | $ | 12.50 | | |
| Income from investment operations: | |
| Net investment income (loss) | | | 0.01 | | | | (0.02 | ) | | | — | (2) | |
| Net realized and unrealized gain on investments and foreign currency | | | 2.44 | | | | 9.75 | | | | 2.70 | | |
| Total from investment operations | | | 2.45 | | | | 9.73 | | | | 2.70 | | |
| Less distributions: | |
| From net investment income | | | (0.21 | ) | | | — | | | | — | | |
| From net realized gain | | | (1.34 | ) | | | (0.39 | ) | | | — | | |
| Total distributions | | | (1.55 | ) | | | (0.39 | ) | | | — | | |
| Redemption fee proceeds | | | 0.02 | | | | 0.03 | | | | 0.05 | | |
| Net asset value, end of period | | $ | 25.54 | | | $ | 24.62 | | | $ | 15.25 | | |
| Total return | | | 9.85 | % | | | 63.92 | % | | | 22.00 | %(3) | |
| Ratios/supplemental data: | |
| Net assets, end of period (millions) | | $ | 65.0 | | | $ | 98.7 | | | $ | 1.6 | | |
| Ratio of expenses to average net assets: | |
| Before fees waived/expenses recouped | | | 1.38 | % | | | 1.50 | % | | | 17.36 | %(4) | |
| After fees waived/expenses recouped | | | 1.45 | % | | | 1.45 | % | | | 1.45 | %(4) | |
| Ratio of net investment income (loss) to average net assets: | |
| Before fees waived/expenses recouped | | | 0.11 | % | | | (0.24 | )% | | | (15.84 | )%(4) | |
| After fees waived/expenses recouped | | | 0.04 | % | | | (0.19 | )% | | | 0.07 | %(4) | |
| Portfolio turnover rate | | | 47.22 | % | | | 89.24 | % | | | 9.96 | %(3) | |
(1) Commencement of Operations.
(2) Amount represents less than $0.01 per share.
(3) Not annualized.
(4) Annualized.
The accompanying notes are an integral part of these financial statements.
60
FINANCIAL HIGHLIGHTS
For a capital share outstanding throughout the year
| | | Year Ended December 31, | |
| Global Innovators Fund | | 2006 | | 2005 | | 2004 | | 2003 | | 2002 | |
| Net asset value, beginning of year | | $ | 15.14 | | | $ | 13.54 | | | $ | 12.21 | | | $ | 8.98 | | | $ | 13.04 | | |
| Income from investment operations: | |
| Net investment gain (loss) | | | 0.01 | | | | (0.05 | ) | | | (0.02 | ) | | | (0.08 | ) | | | (0.08 | ) | |
| Net realized and unrealized gain (loss) on investments | | | 2.83 | | | | 1.65 | | | | 1.35 | | | | 3.31 | | | | (3.98 | ) | |
| Total from investment operations | | | 2.84 | | | | 1.60 | | | | 1.33 | | | | 3.23 | | | | (4.06 | ) | |
| Redemption fee proceeds | | | — | (1) | | | — | (1) | | | — | (1) | | | — | (1) | | | — | (1) | |
| Net asset value, end of year | | $ | 17.98 | | | $ | 15.14 | | | $ | 13.54 | | | $ | 12.21 | | | $ | 8.98 | | |
| Total return | | | 18.76 | % | | | 11.82 | %(2) | | | 10.89 | % | | | 35.97 | % | | | (31.13 | )% | |
| Ratios/supplemental data: | |
| Net assets, end of year (millions) | | $ | 39.3 | | | $ | 36.4 | | | $ | 42.1 | | | $ | 49.8 | | | $ | 45.9 | | |
| Ratio of expenses to average net assets: | |
| Before fees waived | | | 1.64 | % | | | 1.66 | % | | | 1.68 | % | | | 1.76 | % | | | 2.03 | % | |
| After fees waived | | | 1.55 | % | | | 1.66 | %(2) | | | 1.68 | %(2) | | | 1.56 | %(2) | | | 1.35 | % | |
| Ratio of net investment income (loss) to average net assets: | |
| Before fees waived | | | (0.00 | )% | | | (0.32 | )% | | | (0.17 | )% | | | (0.90 | )% | | | (1.34 | )% | |
| After fees waived | | | 0.09 | % | | | (0.32 | )% | | | (0.17 | )% | | | (0.70 | )% | | | (0.66 | )% | |
| Portfolio turnover rate | | | 36.53 | % | | | 27.75 | % | | | 50.57 | % | | | 0.00 | % | | | 54.15 | % | |
(1) Amount represents less than $0.01 per share.
(2) The Fund's total operating expense was limited at 1.88% from 4/23/03 to 10/31/05. It was limited to 1.35% prior to 4/26/03.
The accompanying notes are an integral part of these financial statements.
61
NOTES TO FINANCIAL STATEMENTS
Note 1
Organization
Guinness Atkinson Funds (the "Trust"), was organized on April 28, 1997 as a Delaware business trust and registered under the Investment Company Act of 1940, as amended (the "1940 Act"), as a non-diversified, open-end management investment company. Currently, the Trust offers six separate series all of whose long-term objective is capital appreciation: Guinness Atkinson Alternative Energy Fund (the "Alternative Energy Fund"), Guinness Atkinson Asia Focus Fund (the "Asia Focus Fund"), Guinness Atkinson Asia Pacific Dividend Fund (the "Asia Pacific Dividend Fund"), Guinness Atkinson China & Hong Kong Fund (the "China & Hong Kong Fund"), Guinness Atkinson Global Energy Fund (the "Global Energy Fund"), and Guinness Atkinson Global Innovators Fund ("the Global Innovators Fund"), all of which (each a "Fund" and collectively, the "Funds") are covered by this report. The China & Hong Kong Fund began operations on June 30, 1994, the Asia F ocus Fund began operations on April 29, 1996, the Global Innovators Fund began operations on December 15, 1998, the Global Energy Fund began operations on June 30, 2004, and the Alternative Energy Fund and the Asia Pacific Dividend Fund began operations on March 31, 2006.
The Alternative Energy Fund and Asia Focus Fund's investment objective is long-term capital appreciation. The Asia Pacific Dividend Fund's investment objective is to provide investors with dividend income and long-tern capital growth. The China & Hong Kong Fund's investment objective is long-term capital appreciation primarily through investments in securities of China and Hong Kong. The Global Energy Fund and Global Innovators Fund's investment objective is long-term capital appreciation.
Note 2
Significant accounting policies
The following is a summary of significant accounting policies consistently followed by the Funds. These policies are in conformity with accounting principles generally accepted in the United States of America.
A. Security Valuation. Securities of the Alternative Energy, Global Energy and Global Innovators Funds that are traded on a principal exchange (U.S. or foreign) or Nasdaq are valued at the official closing price on each day that the exchanges are open for trading. Securities of Asia Focus, Asia Pacific Dividend and China & Hong Kong Funds are valued at 12:30 a.m. Eastern Time on each day the NYSE is open for trading. Securities traded on an exchange for which there have been no sales, and other over-the-counter securities are valued at the mean between the bid and asked prices. Securities for which quotations are not readily available are valued at their respective fair values as determined in good faith by the Investment Advisor in accordance with procedures established by the Board of Trustees. In determining fair value, the Funds take into accoun t all relevant factors and available information. Consequently, the price of the security used to calculate its Net Asset Value may differ from quoted or published prices for the same security. Fair Value pricing involves subjective judgments and there is no single standard for determining a security's fair value. As a result, different mutual funds could reasonably arrive at different fair value for the same security. It is possible that the fair value determined for a security is materially different from the value that could be realized upon the sale of that security or from the values that other mutual funds may determine. Short-term investments are stated at cost, combined with accrued interest, approximates market value. Realized gains and losses from securities transactions are calculated using the identified cost method.
Foreign securities are recorded in the financial statements after translation to U.S. dollars based on the applicable exchange rate at the end of the period. The Funds do not isolate that portion of the results of operations resulting from changes in the currency exchange rate from the fluctuations resulting from changes in the market prices of investments.
Foreign exchange gain or loss resulting from holding of a foreign currency, expiration of a currency exchange contract, difference in exchange rates between the trade date and settlement date of an investment purchased or sold, and the difference between dividends actually received compared to the amount shown in a Fund's accounting records on the date of receipt are shown as net realized gains or losses on foreign currency transactions in the respective Fund's statement of operations.
B. Forward Foreign Currency Exchange Contracts. The Funds may utilize forward foreign currency exchange contracts ("forward contracts") to hedge against foreign exchange fluctuations on foreign denominated investments under which they are obligated to exchange currencies at specific future dates and at specified rates. All commitments are "marked-to-market" daily and any resulting unrealized gains or losses are included as unrealized appreciation (depreciation) on foreign currency denominated assets and liabilities. The Funds record realized gains or losses at the time the forward contract is settled. Risks may arise upon entering these contracts from the potential inability of a counter party to meet the terms of their contracts and from unanticipated movements in the value of a foreign currency relative to the U.S. dollar or other currencies. Counterp arties
62
to these contracts are major U.S. financial institutions. Please refer to Note 6 for further information on Forward Contracts in each Fund.
C. Restricted Securities. A restricted security cannot be resold to the general public without prior registration under the Securities Act of 1933. If the security is subsequently registered and resold, the issuers would typically bear the expense of all registrations at no cost to the Fund. Restricted securities are valued according to the guidelines and procedures adopted by the Funds' Board of Trustees.
D. Security Transactions, Dividend Income and Distributions. Security transactions are accounted for on the trade date. Dividend income and distributions to shareholders are recorded on the ex-dividend date. Realized gains and losses from securities transactions are calculated using the identified cost method.
E. Allocation of Expenses. Each Fund is charged for those expenses directly attributable to it. Expenses that are not directly attributable to a Fund are allocated among the Funds in proportion to their respective assets or another appropriate method.
F. Concentration of Risk. The Alternative Energy Fund invests substantially in the alternative energy or energy technology sectors. The Asia Focus Fund invests substantially all of its assets in the Asian continent. The Asia Pacific Dividend Fund invests primarily in dividend-producing equity securities of Asia Pacific companies. The China & Hong Kong Fund invests substantially all of its assets in securities that are traded in China or Hong Kong or that are issued by companies that do a substantial part of their business in China. The Global Energy Fund invests substantially in energy companies, the changes in the prices and supplies of oil and other energy fuels may affect the Fund's investments. The consequences of political, social, or economic changes in the countries or business sectors in which the securities are offered or the issuers conduc t their operations may affect the market prices of the Funds' investments and any income generated, as well as the Funds' ability to repatriate such amounts.
G. Organization Costs. In accordance with Statement of Position 98-5, Reporting on the Costs of Start-Up Activities, organization costs for the Alternative Energy Fund and the Asia Pacific Dividend Fund, which commenced operations on March 31, 2006, were expensed as incurred. Offering costs are deferred and amortized over twelve months on a straight-line basis.
H. Use of Estimates. The preparation of financial statements in conformity with accounting principles generally accepted in the United States requires management to make estimates and assumptions that affect the reported amounts of assets and liabilities and the disclosure of contingent assets and liabilities at the date of the financial statements. Actual results could differ from those estimates.
I. Reclassifications. Accounting principals generally accepted in the United States require that certain components of net assets be reclassified between financial and tax reporting. These reclassifications have no effect on net assets or net asset value per share. For the year ended December 31, 2006, permanent differences in book and tax accounting have been reclassified to paid-in capital, undistributed net investment income/(loss) and accumulated realized gain(loss) as follows:
| | | Increase (Decrease) | |
| | |
Paid-in-Capital | | Undistributed Net
Investment
Income/(Loss) | | Accumulated
Realized
Gain / (Loss) | |
| Alternative Energy Fund | | | (137,604 | ) | | | 87,616 | | | | 49,988 | | |
| Asia Focus Fund | | | (48,382,531 | ) | | | 3,852 | | | | 48,378,679 | | |
| Asia Pacific Dividend Fund | | | (473 | ) | | | (2,809 | ) | | | 3,282 | | |
| China & Hong Kong Fund | | | — | | | | 1,942,450 | | | | (1,942,450 | ) | |
| Global Energy Fund | | | — | | | | (22,579 | ) | | | 22,579 | | |
| Global Innovators Fund | | | — | | | | (1,863 | ) | | | 1,863 | | |
J. Indemnifications. Under the Funds' organizational documents, its current and former officers and trustees are indemnified against certain liabilities arising out of the performance of their duties to the Funds. In addition, in the normal course of business, the Funds enter into contracts that contain a variety of representations and warranties that provide general indemnifications. The Funds' maximum exposure under these arrangements is unknown as this would involve future claims that may be made against the Funds that have not yet occurred or that would be covered by other parties.
63
Note 3
Investment Advisory and Other Agreements
The Trust, on behalf of each Fund, entered into an Investment Advisory Agreement with Guinness Atkinson Asset Management, Inc. (the "Advisor"), which provided the Funds with investment management services under an investment advisory agreement. The Advisor furnishes all investment advice, office space, facilities, and most of the personnel needed by the Funds. As compensation for its services, the Advisor is entitled to a monthly fee at the following annual rates based upon the average daily net assets of the Funds:
| Alternative Energy Fund | | | 1.00 | % | |
| Asia Pacific Dividend Fund | | | 1.00 | % | |
| Asia Focus Fund | | | 1.00 | % | |
| China & Hong Kong Fund | | | 1.00 | % | |
| Global Energy Fund | | | 0.75 | % | |
| Global Innovators Fund | | | 0.75 | % | |
The Funds are responsible for their own operating expenses. The Advisor has contractually agreed to limit the Funds' total operating expenses by reducing all or a portion of their fees and reimbursing the Funds' for expenses so that its ratio of expenses to average daily net assets will not exceed the following levels:
| Alternative Energy Fund | | | 1.98 | % | |
| Asia Pacific Dividend Fund | | | 1.98 | % | |
| Asia Focus Fund | | | 1.98 | % | |
| China & Hong Kong Fund | | | 1.98 | % | |
| Global Energy Fund | | | 1.45 | % | |
| Global Innovators Fund | | | 1.55 | % | |
To the extent that the Advisor waives fees and/or absorbs expenses it may seek repayment of a portion or all of such amounts at any time within three fiscal years after the fiscal year in which such amounts were waived or absorbed, subject to the applicable cap. For the year ended December 31, 2006, the Advisor waived fees and absorbed expenses of $57,011, $95,970 and $32,356 in the Alternative Energy Fund, Asia Pacific Dividend Fund and the Global Innovators Fund, respectively. The Advisor recovered previously waived expenses of $64,811 from the Global Energy Fund during the year ended December 31, 2006.
At December 31, 2006, the Advisor may recapture a portion of the following amounts that has been paid and/or waived on behalf of the Funds no later than the dates as stated below:
| Funds: | | December 31, 2008 | | December 31, 2009 | | Total | |
| Alternative Energy Fund | | $ | — | | | $ | 57,011 | | | $ | 57,011 | | |
| Asia Pacific Dividend Fund | | $ | — | | | $ | 95,970 | | | $ | 95,970 | | |
| Global Energy Fund | | $ | 14,993 | | | $ | — | | | $ | 14,993 | | |
| Global Innovators Fund | | $ | 590 | | | $ | 32,356 | | | $ | 32,946 | | |
U.S. Bancorp Fund Services, LLC (the "Administrator") acts as the Funds' administrator under an administration agreement. The Administrator prepares various federal and state regulatory filings, reports and returns for the Funds; prepares reports and materials to be supplied to the Trustees; monitors the activities of the Funds' custodian, transfer agent and accountants; coordinates the preparation and payment of the Funds' expenses and reviews the Funds' expense accruals.
64
During the year ended December 31, 2006, the following Administration fees were incurred:
| Alternative Energy Fund | | $ | 15,106 | | |
| Asia Focus Fund | | | 48,599 | | |
| Asia Pacific Dividend Fund | | | 15,070 | | |
| China & Hong Kong Fund | | | 111,374 | | |
| Global Innovators Fund | | | 21,440 | | |
| Global Energy Fund | | | 46,660 | | |
Quasar Distributors, LLC (the "Distributor") acts as the Funds' principal underwriter in a continuous public offering of the Funds' shares. The Distributor is an affiliate of the Administrator.
Investors Bank & Trust Company is the Funds' Custodian. U.S. Bancorp Fund Services, LLC is the Funds' Transfer agent.
On August 14, 1998, the Trust approved a Deferred Compensation Plan for Trustees (the "Plan"). Trustees can elect to receive payment in cash or defer payments provided for in the Plan. If a trustee elects to defer payment, the Plan provides for the creation of a deferred payment account (Phantom Share Account). This account accumulates the deferred fees earned, and the value of the account is adjusted at the end of each quarter to reflect the value that would have been earned if the account had been invested in designated investments. The Funds recognize as trustee expense amounts accrued as meetings are attended plus the change in value of the Phantom Share Account.
During the year ended December 31, 2006, the change in the value of the phantom share account included unrealized appreciation were as follows:
| Alternative Energy Fund | | $ | (9 | ) | |
| Asia Focus Fund | | $ | 6,715 | | |
| Asia Pacific Dividend Fund | | $ | 9 | | |
| China & Hong Kong Fund | | $ | 12,772 | | |
| Global Energy Fund | | $ | 2,603 | | |
| Global Innovators Fund | | $ | 9,858 | | |
Certain officers of the Funds are also officers and/or Directors of the Advisor, Administrator and another party providing the services of the Funds' Chief Compliance Officer ("CCO"). None of these officers are compensated directly by the Funds.
During the year ended December 31, 2006, the following fees were paid for the services of the CCO:
| Alternative Energy Fund | | $ | 4,582 | | |
| Asia Focus Fund | | $ | 10,578 | | |
| Asia Pacific Dividend Fund | | $ | 3,633 | | |
| China & Hong Kong Fund | | $ | 18,620 | | |
| Global Energy Fund | | $ | 15,327 | | |
| Global Innovators Fund | | $ | 9,355 | | |
65
Note 4
Shareholder Servicing Plan
Each Fund has adopted a Shareholder Servicing Plan to pay a fee at an annual rate of up to 0.25% of its daily average net assets of shares serviced by shareholder servicing agents who provide administrative and support services to their customers.
During the year ended December 31, 2006, the following fees were paid to the shareholder servicing agents:
| AAlternative Energy Fund | | $ | 15,106 | | |
| Asia Focus Fund | | $ | 80,585 | | |
| Asia Pacific Dividend Fund | | $ | 686 | | |
| China & Hong Kong Fund | | $ | 165,708 | | |
| Global Energy Fund | | $ | 107,267 | | |
| Global Innovators Fund | | $ | 43,120 | | |
Note 5
Investment Transactions
The following table presents purchases and sales of securities during the year ended December 31, 2006, excluding short-term investments, to indicate the volume of transactions in each Fund.
| Fund | | Purchases | | Sales | |
| Alternative Energy Fund | | $ | 19,831,617 | | | $ | 2,740,670 | | |
| Asia Focus Fund | | | 47,866,709 | | | | 45,827,132 | | |
| Asia Pacific Dividend Fund | | | 1,285,991 | | | | 272,334 | | |
| China & Hong Kong Fund | | | 78,731,906 | | | | 88,221,352 | | |
| Global Energy Fund | | | 43,323,692 | | | | 83,441,738 | | |
| Global Innovators Fund | | | 13,284,487 | | | | 17,199,323 | | |
The Funds did not purchase U.S. Government securities as a part of the long-term investment strategy during the year ended December 31, 2006.
Note 6
Forward foreign currency contracts
In order to hedge their portfolio and to protect them against possible fluctuations in foreign exchange rates pending the settlement of securities transactions, the Funds may enter into forward currency contracts which obligate them to exchange currencies at specified future dates. At the maturity of a forward contract, the Funds may either make delivery of the foreign currency from currency held, if any, or from the proceeds of the portfolio securities sold. It may also terminate its obligation to deliver the foreign currency at any time by purchasing an offsetting contract. The forward value of amounts due are netted against the forward value
66
of the currency to be delivered, and the net amount is shown as a receivable or payable in the financial statements. Open forward contracts at December 31, 2006 were as follows:
| Funds | | Currency | | Amount | | Currency
Receivable
(Deliverable) | | Delivery
Date | | Unrealized
Gain/(Loss) | |
| Global Energy Fund | | US$
| | $ | 396,152 |
| | Canadian
Dollar (460,030) | | 01/02/07
| | $ | 212 |
| |
| Global Energy Fund | | US$ | | $ | 121,109 | | | Euro (91,756) | | 01/02/07 | | $ | (725 | ) | |
| Global Energy Fund | | US$ | | $ | 122,734 | | | Euro (92,988) | | 01/03/07 | | $ | (735 | ) | |
| Global Energy Fund | | US$ | | $ | 125,672 | | | GBP (64,159) | | 01/02/07 | | $ | (170 | ) | |
| Global Energy Fund | | US$
| | $ | 573 |
| | Hong Kong
Dollar (4,454) | | 01/02/07
| | $ | (0 | )
| |
| Global Energy Fund | | US$
| | $ | 238,334 |
| | South Africa
Rand (1,677,449) | | 01/05/07
| | $ | (482 | )
| |
| | | | | | | | | | | | | $ | (1,900 | ) | |
The Alternative Energy Fund, the Asia Focus Fund, the Asia Pacific Dividend Fund, the China & Hong Kong Fund and the Global Innovators Fund, did not have any outstanding forward contracts as of December 31, 2006.
Note 7
Tax Matters
As of December 31, 2006, the tax basis of investments were as follows:
| | | Alternative
Energy Fund | | Asia Focus
Fund | | Asia Pacific
Dividend
Fund | | China &
Hong Kong
Fund | | Global
Energy
Fund | | Global
Innovators
Fund | |
| Cost of investment for tax purposes | | $ | 16,804,428 | | | $ | 39,823,233 | | | $ | 997,312 | | | $ | 100,847,862 | | | $ | 57,136,060 | | | $ | 30,804,082 | | |
| Gross tax unrealized appreciation | | | 1,315,566 | | | | 11,024,502 | | | | 148,783 | | | | 44,069,916 | | | | 11,138,159 | | | | 8,577,500 | | |
| Gross tax unrealized (depreciation) | | | (2,844,630 | ) | | | (1,576,993 | ) | | | (74,572 | ) | | | (4,804,449 | ) | | | (3,928,437 | ) | | | (1,109,586 | ) | |
Net tax unrealized appreciation
(depreciation) on investment | | | (1,529,064 | ) | | | 9,447,509 | | | | 74,211 | | | | 39,265,467 | | | | 7,209,722 | | | | 7,467,914 | | |
Net tax appreciation on derivatives
and foreign-currency denominated
assets and liabilities | | | 5 | | | | 2,086 | | | | (11 | ) | | | 5 | | | | (1,581 | ) | | | 380 | | |
| Net tax unrealized appreciation** | | $ | (1,529,059 | ) | | $ | 9,449,595 | | | $ | 74,200 | | | $ | 39,265,472 | | | $ | 7,208,141 | | | $ | 7,468,294 | | |
| Undistributed net ordinary income*** | | | — | | | | 25,211 | | | | — | | | | 2,832,031 | | | | 90,223 | | | | 41,777 | | |
| Undistributed Longterm-Captial Gains | | | — | | | | — | | | | — | | | | 656,425 | | | | 1,418,567 | | | | — | | |
| Post October loss* | | | (146,472 | ) | | | — | | | | (1,163 | ) | | | (1,905,287 | ) | | | (17,583 | ) | | | — | | |
| Capital loss carryforward | | | (196,436 | ) | | | (12,100,757 | ) | | | (15,170 | ) | | | — | | | | — | | | | (48,872,665 | ) | |
| Capital loss carryforward limitation | | | — | | | | (651,429 | ) | | | — | | | | (1,641,545 | ) | | | — | | | | (2,235,846 | ) | |
| Other accumulated gain/(loss) | | | (755 | ) | | | (27,235 | ) | | | (645 | ) | | | (51,769 | ) | | | (6,409 | ) | | | (41,842 | ) | |
| Total accumulated gain/(loss) | | $ | (1,872,722 | ) | | $ | (3,304,615 | ) | | $ | 57,222 | | | $ | 39,155,327 | | | $ | 8,692,939 | | | $ | (43,640,282 | ) | |
* Under the current tax law, capital and currency losses realized after October 31 and prior to the Fund's fiscal year end may be deferred as occurring on the first day of the following year.
** The differences between book-basis and tax-basis unrealized appreciation/(depreciation) is attributable primary to the tax deferral of losses on wash sales and passive foreign investment company (PFIC) market to market adjustments.
*** The differences between book-basis and tax basis undistributed net ordinary income is attributed to deferred compensation.
67
As of December 31, 2006, the following funds have capital loss carryforwards available to offset future realized capital gains:
| Capital losses expiring in: | | Alternative
Energy Fund | | Asia Focus
Fund | | Asia Pacific
Dividend
Fund | | China &
Hong Kong
Fund | | Global
Energy
Fund | | Global
Innovators
Fund | |
| | 2007 | | | $ | — | | | $ | (8,668,574 | ) | | $ | — | | | $ | — | | | $ | — | | | $ | — | | |
| | 2008 | | | | — | | | | — | | | | — | | | | — | | | | — | | | | — | | |
| | 2009 | | | | — | | | | (2,794,130 | ) | | | — | | | | — | | | | — | | | | (15,766,402 | ) | |
| | 2010 | | | | — | | | | (638,053 | ) | | | — | | | | — | | | | — | | | | (19,915,748 | ) | |
| | 2011 | | | | — | | | | — | | | | — | | | | — | | | | — | | | | (8,376,172 | ) | |
| | 2012 | | | | — | | | | — | | | | — | | | | — | | | | — | | | | — | | |
| | 2013 | | | | — | | | | — | | | | — | | | | — | | | | — | | | | — | | |
| | 2014 | | | | (196,436 | ) | | | — | | | | (15,170 | ) | | | — | | | | — | | | | (4,814,343 | ) | |
| | Total | | | $ | (196,436 | ) | | $ | (12,100,757 | ) | | $ | (15,170 | ) | | $ | — | | | $ | — | | | $ | (48,872,665 | ) | |
For the Asia Focus Fund, $651,429 of capital loss carryover related to the acquistion of Asia New Economy Fund on January 25, 2002 is remaining to be recognized over the next three years. This amount is subject to an annual limitation of $217,143 under tax rules.
For the Global Innovators Fund, $2,235,846 of capital loss carryover related to the acquisition of the Investec Internet.com fund and the Wireless World Fund on January 25, 2002 is remaining to be recognized over the next three years. The amount is subject to an annual limitation of $798,362 over the next two years and $559,122 on the third year under tax rules.
Note 8
Distribution to Shareholders
The tax character of distributions paid during 2006 and 2005 was as follows:
| | | Asia Focus | | Asia Pacific Dividend | | China & Hong Kong | | Global Energy | |
| | | 2006 | | 2005 | | 2006 | | 2005 | | 2006 | | 2005 | | 2006 | | 2005 | |
| Distributions paid from: | |
| Ordinary Income | | $ | 710,741 | | | $ | 531,257 | | | $ | 15,132 | | | $ | — | | | $ | 53,575 | | | $ | 4,726,043 | | | $ | 2,810,556 | | | $ | 1,511,163 | | |
| Long-term capital gain | | | — | | | | — | | | | — | | | | — | | | | — | | | | — | | | | 1,087,476 | | | | 79,473 | | |
| Total | | $ | 710,741 | | | $ | 531,257 | | | $ | 15,132 | | | $ | — | | | $ | 53,575 | | | $ | 4,726,043 | | | $ | 3,898,032 | | | $ | 1,590,636 | | |
Note 9
Line of Credit
The Trust has a secured $5,000,000 line of credit with its custodian. Borrowings under this arrangement bear interest at the federal funds rate plus 0.75% per annum. As compensation for holding available the lending commitment, the Trust pays a 0.10% per annum fee on the unused portion of the commitment, which is allocated among the Funds based on their relative net assets. The fee is payable quarterly in arrears. The average interest rate charged and the average outstanding loan payable to Investors Bank & Trust for the year ended December 31, 2006 was as follows:
| Fund | | Average Interest Rate | | Average Outstanding Loan Payable | |
| Asia Focus Fund | | | 6.00 | % | | $ | 122,423 | | |
| Global Energy Fund | | | 6.00 | % | | $ | 597,213 | | |
68
Note 10
Accounting Pronouncements
Federal Income Taxes. The Funds intend to comply with the requirements of Subchapter M of the Internal Revenue Code applicable to regulated investment companies, and to distribute all of their taxable income to their shareholders. Therefore, no federal income tax provision is required.
In December, 2005, the Financial Accounting Standards Board ("FASB") released Financial Accounting Standard Board Statement No. 157 Fair Value Measurements ("SFAS 157"). SFAS 157 establishes a fair valuation hierarchy to increase consistency and comparability in fair value measurements and related disclosures. The fair value hierarchy prioritizes the inputs to valuation techniques used to measure fair value into three broad levels. The fair value hierarchy gives the highest priority to quoted prices (unadjusted) in active markets for identical assets or liabilities (Level 1) and the lowest priority to unobservable inputs (Level 3). SFAS 157 is effective for financial statements issued for fiscal years beginning after November 15, 2007. At this time, management is evaluating the implications of FIN 48 and its impact on the financial statements has not yet been determined.
On July 13, 2006, the Financial Accounting Standards Board ("FASB") released FASB Interpretation No. 48 "Accounting for Uncertainty in Income Taxes" ("FIN 48"). FIN 48 provides guidance for how uncertain tax positions should be recognized, measured, presented and disclosed in the financial statements. FIN 48 requires the evaluation of tax positions taken or expected to be taken in the course of preparing the Fund's tax returns to determine whether the tax positions are "more-likely-than-not" of being sustained by the applicable tax authority. Tax positions not deemed to meet the more-likely-than-not threshold would be recorded as a tax benefit or expense in the current year. Adoption of FIN 48 is required as of the last Net Asset Value ("NAV") calculation in the first required financial statement reporting period for fiscal years beginning after December 15, 2006 and is to be applied to all open tax years as of the effective date. On Decembe r 22, 2006, the SEC granted a six-month delay in the required implementation of FIN 48 for Mutual Funds. At this time, management is evaluating the implications of FIN 48 and its impact in the financial statements has not yet been determined.
Additional Information (Unaudited)
Proxy Voting Procedures
The Advisor of the Funds votes proxies relating to portfolio securities in accordance with procedures that have been approved by the Board. You may obtain a description of these procedures, free of charge, by calling "toll-free" 1-800-915-6565. This information is also available through the Securities and Exchange Commission's website at http://www.sec.gov.
Proxy Voting Records
Information regarding how the advisor of the Funds voted proxies relating to portfolio securities during the latest 12-month period ended June 30 is available, without charge, by calling toll-free, 1-800-915-6565. This information is also available through the Securities and Exchange Commission's website at http://www.sec.gov.
Form N-Q Disclosure
The Funds file their complete schedule of portfolio holdings with the Securities and Exchange Commission for the first and third quarters of each fiscal year on Form N-Q. The Funds' Form N-Q is available on the Securities and Exchange Commission's website at http://www.sec.gov. The Funds' Form N-Q may be reviewed and copied at the Commission's Public Reference Room in Washington, DC, and information on the operation of the Public Reference Room may be obtained by calling 1-202-551-8090. This information is also available, without charge, by calling toll-free, 1-800-915-6565.
Supplemental Tax Information (Unaudited)
For the Fiscal year ended December 31, 2006, certain dividends paid by the Funds may be subject to a maximum tax rate of 15%, as provided for by the Jobs and Growth Tax Relief Reconciliation Act of 2003. The percentage of dividends declared from ordinary income designated as qualified dividend income was as follows:
| Alternative Energy Fund | | | N/A | | |
| Asia Focus Fund | | | 100.00 | % | |
| Asia Pacific Dividend Fund | | | 100.00 | % | |
| China & Hong Kong Fund | | | 100.00 | % | |
| Global Energy Fund | | | 46.55 | % | |
| Global Innovators Fund | | | N/A | | |
69
For corporate shareholders, the percentage of ordinary income distributions qualifying for the corporate dividends received deduction for the fiscal year ended December 31, 2006, was as follows:
| Alternative Energy Fund | | N/A | |
| Asia Focus Fund | | N/A | |
| Asia Pacific Dividend Fund | | N/A | |
| China & Hong Kong Fund | | N/A | |
| Global Energy Fund | | 16.50% | |
| Global Innovators Fund | | N/A | |
The percent of ordinary income distributions designated as interest related dividends under the Internal Revenue Code Section 871(k)(1) applicable to foreign shareholders only for the fiscal year ended December 31, 2006, was as follows:
| Alternative Energy Fund | | | N/A | | |
| Asia Focus Fund | | | 0.84 | % | |
| Asia Pacific Dividend Fund | | | 5.02 | % | |
| China & Hong Kong Fund | | | 1.20 | % | |
| Global Energy Fund | | | 0.33 | % | |
| Global Innovators Fund | | | N/A | | |
For the year ended December 31, 2006, the Guinness Atkinson Asia Focus Fund earned foreign source income and paid foreign taxes which they intend to pass through to their shareholders pursuant to Section 853 of the Internal Revenue Code as follows:
| Country | | Gross Dividend
Per Share | | Taxes Withheld
Per Share | |
| Bermuda | | | 0.0318 | | | | — | | |
| Hong Kong | | | 0.0647 | | | | — | | |
| Cayman Islands | | | 0.0262 | | | | — | | |
| Singapore | | | 0.0395 | | | | — | | |
| China | | | 0.1527 | | | | | | |
| Indonesia | | | 0.0144 | | | | 0.0022 | | |
| South Korea | | | 0.0732 | | | | 0.0121 | | |
| Malaysia | | | 0.0139 | | | | — | | |
| Britain | | | 0.0133 | | | | — | | |
| Thailand | | | 0.0262 | | | | 0.0013 | | |
| Taiwan | | | 0.1286 | | | | 0.0256 | | |
70
For the year ended December 31, 2006, the Guinness Atkinson Asia Pacific Dividend Fund earned foreign source income and paid foreign taxes which they intend to pass through to their shareholders pursuant to Section 853 of the Internal Revenue Code as follows:
| Country | | Gross Dividend
Per Share | | Taxes Withheld
Per Share | |
| Australia | | | 0.0426 | | | | — | | |
| Bermuda | | | 0.0695 | | | | — | | |
| Indonesia | | | 0.0025 | | | | 0.0004 | | |
| New Zealand | | | 0.0225 | | | | — | | |
| Cayman Islands | | | 0.0079 | | | | — | | |
| Singapore | | | 0.0145 | | | | — | | |
| China | | | 0.0390 | | | | — | | |
| Thailand | | | 0.0332 | | | | 0.0024 | | |
| Taiwan | | | 0.0974 | | | | 0.0191 | | |
| Britain | | | 0.0098 | | | | — | | |
| Hong Kong | | | 0.0189 | | | | — | | |
| South Korea | | | 0.0027 | | | | 0.0005 | | |
71
REPORT OF INDEPENDENT REGISTERED
PUBLIC ACCOUNTING FIRM
To the Shareholders of and Board of Trustees
Guinness Atkinson Funds
Glendora, California
We have audited the accompanying statements of assets and liabilities, including the schedules of investments, of the Asia Focus Fund, China & Hong Kong Fund, Global Innovators Fund, Global Energy Fund, Alternative Energy Fund and Asia Pacific Dividend Fund, each a series of shares of the Guinness Atkinson Funds, as of December 31, 2006, the related statements of operations for the year then ended, the statements of changes in net assets for each of the two years in the period then ended (with respect to the Alternative Energy Fund and Asia Pacific Dividend Fund for the period March 31, 2006 to December 31, 2006), and the financial highlights for each of the four years in the period then ended (with respect to the Alternative Energy Fund and Asia Pacific Dividend Fund for the period March 31, 2006 to December 31, 2006, and Global Energy Fund for each of the two years in the period then ended and the period June 30, 2004 to D ecember 31, 2004). These financial statements and financial highlights are the responsibility of the Funds' management. Our responsibility is to express an opinion on these financial statements and financial highlights based on our audits. The financial highlights for the year ended December 31, 2002 were audited by other auditors whose report dated February 21, 2003 expressed an unqualified opinion on such financial highlights.
We conducted our audits in accordance with the standards of the Public Company Accounting Oversight Board (US). Those standards require that we plan and perform the audits to obtain reasonable assurance about whether the financial statements and financial highlights are free of material misstatement. The Fund is not required to have, nor were we engaged to perform, an audit of its internal control over financial reporting. Our audits included consideration of internal control over financial reporting as a basis for designing audit procedures that are appropriate in the circumstances, but not for the purpose of expressing an opinion on the effectiveness of the Funds' internal control over financial reporting. Accordingly, we express no such opinion. An audit includes examining, on a test basis, evidence supporting the amounts and disclosures in the financial statements. Our procedures included confirmation of securities owned as of December 31, 2006, by correspondence with the custodian and brokers. An audit also includes assessing the accounting principles used and significant estimates made by management, as well as evaluating the overall financial statement presentation. We believe that our audits provide a reasonable basis for our opinion.
In our opinion, the financial statements and financial highlights referred to above present fairly in all material respects, the financial position of the above mentioned Funds as of December 31, 2006, the results of their operations, the changes in their net assets and the financial highlights for the periods indicated above, in conformity with accounting principles generally accepted in the United States of America.

Philadelphia, Pennsylvania
February 2, 2007
72
TRUSTEE AND OFFICER INFORMATION (Unaudited)
Name, Address,
and Age | | Position(s) Held with Trusts | | Date Elected† | | Principal Occupation(s) During the Past 5 Years | | Number of Portfolios In Fund Complex Overseen by Trustee | | Other Directorships Held by Trustee | |
Timothy W.N.
Guinness
14 Queen Anne's Gate Westminster,
London SW1H 9AA
U.K.
(59) | | Trustee | | August 1998 | | Chairman of Guinness Asset Management Ltd., investment adviser in London, since 2003. Chairman/CIO of Guinness Atkinson, since November 2002. Joint Chairman of Investec Asset Management Ltd. September 1998 to March 2003. | | | 6 | | | Investec Global Strategy Fund Limited, Investec International Accumulation Fund Limited, Investec Select Funds Plc, Investec High Income Trust Plc, SR Europe Investment Trust Plc. Atlantis Japan Growth Fund Ltd., New Boathouse Capital Ltd. Guinness Asset Management Ltd. | |
|
James I. Fordwood*
21550 Oxnard Street,
Suite 750
Woodland Hills, CA
91367
(60) | | Trustee | | April 1994 | | CFO and Managing Member of Prima Marketing LLC (network of convenience stores) | | | 6 | | | J.L. Energy, Inc., Intoil, Inc., Fior D'Italia. | |
|
Dr. Gunter Dufey*
21550 Oxnard Street,
Suite 750
Woodland Hills, CA
91367
(67) | | Trustee | | April 1994 | | Pacific International Business Associates, a consulting firm in Singapore since 2002. Professor (em.) of Ross School at The University of Michigan, where he served from 1968-2002. | | | 6 | | | Independent director, four subsidiaries of GMAC in the United States and Canada. | |
|
Dr. Bret A. Herscher*
21550 Oxnard Street,
Suite 750
Woodland Hills, CA 91367
(47) | | Trustee | | April 1994 | | President of Pacific Consultants, a technical and technology management consulting company serving the Electronic industry and venture capital community that he co-founded. | | | 6 | | | Strawberry Tree Inc. | |
|
J. Brooks Reece, Jr.*
21550 Oxnard Street,
Suite 750
Woodland Hills, CA
91367
(60) | | Trustee and Chairman | | April 1994 | | Vice President of Adcole Corp. a manufacturer of precision measuring machines and sun angle sensors for space satellites. | | | 6 | | | Adcole Far East Ltd. | |
|
* Not an "interested person", as defined in the 1940 Act of the Funds.
† Trustees and officers of the Fund serve until their resignation, removal or retirement.
73
Name, Address,
and Age | | Position(s) Held with Trusts | | Date Elected† | | Principal Occupation(s) During the Past 5 Years | | Number of Portfolios In Fund Complex Overseen by Trustee | | Other Directorships Held by Trustee | |
Jim Atkinson
21550 Oxnard Street,
Suite 750
Woodland Hills, CA
91367
(49) | | President | | April 2003 | | Chief Executive Officer and Director of Guinness Atkinson since November 2002. Principal of ORBIS Marketing, a mutual fund marketing and advertising firm since November 2001. President of MAXfunds.com from September 2000 to March 2001. Managing Director of Guinness Flight Global Asset Management US (1993-2000). | | N/A | | N/A | |
|
Richard F. Cook, Jr.
2 Portland Square Portland, ME 04101
(55) | | Chief Compliance Officer | | December
2005 | | Officer of Foresides Fund Services LLC since November 2005, and Director of Foreside Compliance Services LLC since January 2006. From 2002, Founder and Managing Member of NorthLake, LLC. From 1985 – 2002, Executive Officer, Director and Shareholder of Century Capital Management, Inc. and Secretary of Century Shares Trust. | | N/A | | N/A | |
|
Michael Ricks
2020 E. Financial Way,
Suite 100
Glendora, CA
91741
(29) | | Treasurer | | September
2006 | | Assistant Vice-President U.S. Bancorp Fund Services LLC since 2001. From 2000 – 2001, Mutual Fund Accounting Specialist at Strong Capital Management | | N/A | | N/A | |
|
Keith Shintani
2020 E. Financial Way,
Suite 100
Glendora, CA
91741
(43) | | Secretary | | September
2006 | | Vice President of Relationship Management for U. S. Bancorp Fund Services, LLC since 2001. From 1998 to 2001, Vice President of Investment Company Administration Corporation, a predecessor to U.S. Bancorp Fund Services, LLC until its acquisition in 2001. | | N/A | | N/A | |
|
† Trustees and officers of the Fund serve until their resignation, removal or retirement.
74
Privacy Notice
Guinness Atkinson Funds and Guinness Atkinson Asset Management, Inc. may collect non-public information about you from the following sources:
• Information we receive about you on applications or other forms;
• Information you give us orally; and
• Information about your transactions with us.
We do not disclose any non-public personal information about our shareholders or former shareholders without the shareholder's authorization, except as required by law or in response to inquiries from governmental authorities. We restrict access to your personal and account information to those employees who need to know that information to provide products and services to you. We also may disclose that information to unaffiliated third parties (such as to brokers or custodians) only as permitted by law and only as needed for us to provide agreed services to you. We maintain physical, electronic and procedural safeguards to guard your non-public personal information.
75
76
Guinness Atkinson Funds Information
Board of Trustees
| J. Brooks Reece, Jr., Chairman | |
|
| Dr. Gunter Dufey | |
|
| James I. Fordwood | |
|
| Timothy W.N. Guinness | |
|
| Dr. Bret A. Herscher | |
|
Contact Guinness Atkinson Funds
| P.O. Box 701 | |
|
| Milwaukee, WI 53201-0701 | |
|
| Shareholder Services: 800-915-6566 | |
|
| Literature Request: 800-915-6565 | |
|
| Website: www.gafunds.com | |
|
| Email: mail@gafunds.com | |
|
| Guinness Atkinson Funds | |
| Fund | | Cusip | | Ticker | | Fund# | |
| Alternative Energy Fund | | | 402031 50 4 | | | GAAEX | | | 1298 | | |
| Asia Focus Fund | | | 402031 10 8 | | | IASMX | | | 1096 | | |
| Asia Pacific Dividend Fund | | | 402031 60 3 | | | GAADX | | | 1299 | | |
| China & Hong Kong Fund | | | 402031 20 7 | | | ICHKX | | | 1094 | | |
| Global Energy Fund | | | 402031 40 5 | | | GAGEX | | | 1098 | | |
| Global Innovators Fund | | | 402031 30 6 | | | IWIRX | | | 1095 | | |
.
Distributed by Quasar Distributors, LLC, Milwaukee, WI 53202
This report is intended for shareholders of the Guinness Atkinson Funds and may not be used as literature unless preceded or accompanied by a current prospectus.
77
78
79
Guinness Atkinson Funds
c/o U.S. Bancorp Fund Services, LLC
P.O. Box 701
Milwaukee, WI 53201-0701
123S0204--P
Item 2. Code of Ethics.
The registrant has adopted a code of ethics that applies to the registrant’s principal executive officer and principal financial officer. The registrant has not made any amendments to its code of ethics during the period covered by this report. The registrant has not granted any waivers from any provisions of the code of ethics during the period covered by this report.
A copy of the registrant’s Code of Ethics is filed herewith.
Item 3. Audit Committee Financial Expert.
The registrant’s board of trustees has determined that there is at least one audit committee financial expert serving on its audit committee. Hamish Fordwood is the “audit committee financial expert” and is considered to be “independent” as each term is defined in Item 3 of Form N-CSR.
Item 4. Principal Accountant Fees and Services.
The registrant has engaged its principal accountant to perform audit services, audit-related services, tax services and other services during the past two fiscal years. “Audit services” refer to performing an audit of the registrant’s annual financial statements or services that are normally provided by the accountant in connection with statutory and regulatory filings or engagements for those fiscal years. “Audit-related services” refer to the assurance and related services by the principal accountant that are reasonably related to the performance of the audit. “Tax services” refer to professional services rendered by the principal accountant for tax compliance, tax advice, and tax planning. The following table details the aggregate fees billed or expected to be billed for each of the last two fiscal years for audit fees, audit-related fees, tax fees and other fees by the principal accountant.
| | FYE 12/31/2006 | | FYE 12/31/2005 | |
Audit Fees | | $ | 90,400 | | $ | 59,500 | |
Audit-Related Fees | | None | | None | |
Tax Fees | | $ | 15,600 | | $ | 10,000 | |
All Other Fees | | None | | None | |
The audit committee has adopted pre-approval policies and procedures that require the audit committee to pre-approve all audit and non-audit services of the registrant, including services provided to any entity affiliated with the registrant. All of the principal accountant’s hours spent on auditing the registrant’s financial statements were attributed to work performed by full-time permanent employees of the principal accountant. (If more than 50 percent of the accountant’s hours were spent to audit the registrant’s financial statements for the most recent fiscal year, state how many hours were attributed to work performed by persons other than the principal accountant’s full-time, permanent employees.)
The following table indicates the non-audit fees billed or expected to be billed by the registrant’s accountant for services to the registrant and to the registrant’s investment adviser (and any
1
other controlling entity, etc.—not sub-adviser) for the last two years. The audit committee of the board of trustees/directors has considered whether the provision of non-audit services that were rendered to the registrant’s investment adviser is compatible with maintaining the principal accountant’s independence and has concluded that the provision of such non-audit services by the accountant has not compromised the accountant’s independence.
Non-Audit Related Fees | | FYE 12/31/2003 | | FYE 12/31/2002 | |
Registrant | | None | | None | |
Registrant’s Investment Adviser | | None | | None | |
Item 5. Audit Committee of Listed Registrants.
Not applicable to registrants who are not listed issuers (as defined in Rule 10A-3 under the Securities Exchange Act of 1934).
Item 6. Schedule of Investments.
Schedule of Investments is included as part of the report to shareholders filed under Item 1 of this Form.
Item 7. Disclosure of Proxy Voting Policies and Procedures for Closed-End Management Investment Companies.
Not applicable to open-end investment companies.
Item 8. Portfolio Managers of Closed-End Management Investment Companies.
Not applicable to open-end investment companies.
Item 9. Purchases of Equity Securities by Closed-End Management Investment Company and Affiliated Purchasers.
Not applicable to open-end investment companies.
Item 10. Submission of Matters to a Vote of Security Holders.
Not Applicable
Item 11. Controls and Procedures.
(a) The Registrant’s President/Chief Executive Officer and Treasurer/Chief Financial Officer have reviewed the Registrant’s disclosure controls and procedures (as defined in Rule 30a-3(c) under the Investment Company Act of 1940 (the “Act”)) as of a date within 90 days of the filing of this report, as required by Rule 30a-3(b) under the Act and Rules 13a-15(b) or 15d-15(b) under the Securities Exchange Act of 1934. Based on their review, such officers have concluded that the disclosure controls and procedures are effective in ensuring that information required to be disclosed in this report is appropriately recorded, processed, summarized and reported and made known to them by others within the Registrant and by the Registrant’s service provider.
2
(b) There were no changes in the Registrant’s internal control over financial reporting (as defined in Rule 30a-3(d) under the Act) that occurred during the second fiscal quarter of the period covered by this report that has materially affected, or is reasonably likely to materially affect, the Registrant’s internal control over financial reporting.
Item 12. Exhibits.
(a) (1) Any code of ethics or amendment thereto, that is subject of the disclosure required by Item 2, to the extent that the registrant intends to satisfy Item 2 requirements through filing an exhibit. Filed herewith.
(2) Certifications pursuant to Section 302 of the Sarbanes-Oxley Act of 2002. Filed herewith.
(3) Any written solicitation to purchase securities under Rule 23c-1 under the Act sent or given during the period covered by the report by or on behalf of the registrant to 10 or more persons. Not applicable to open-end investment companies.
(b) Certification pursuant to Section 906 of the Sarbanes-Oxley Act of 2002. Furnished herewith.
3
SIGNATURES
Pursuant to the requirements of the Securities Exchange Act of 1934 and the Investment Company Act of 1940, the registrant has duly caused this report to be signed on its behalf by the undersigned, thereunto duly authorized.
(Registrant) | Guinness Atkinson Funds | |
| |
By (Signature and Title)* | | /s/ James J. Atkinson | |
| James J. Atkinson, Jr., President | |
| | |
Date | | 3/9/2007 | | |
| | | | | | | | |
Pursuant to the requirements of the Securities Exchange Act of 1934 and the Investment Company Act of 1940, this report has been signed below by the following persons on behalf of the registrant and in the capacities and on the dates indicated.
By (Signature and Title) | | /s/ James J. Atkinson | |
| James J. Atkinson, Jr., President | |
| | |
Date | | 3/9/2007 | |
| | |
By (Signature and Title) | /s/ Michael J. Ricks | |
| Michael J. Ricks, Treasurer | |
| | |
Date | 3/6/2007 | |
| | | | | | | |
4