As filed with the Securities and Exchange Commission on March 10, 2008
UNITED STATES
SECURITIES AND EXCHANGE COMMISSION
Washington, D.C. 20549
FORM N-CSR
CERTIFIED SHAREHOLDER REPORT OF REGISTERED
MANAGEMENT INVESTMENT COMPANIES
Investment Company Act file number | 811-08360 |
|
GUINNESS ATKINSON FUNDS |
(Exact name of registrant as specified in charter) |
|
21550 Oxnard Street, Suite 750, Woodland Hills, CA | | 91367 |
(Address of principal executive offices) | | (Zip code) |
|
James J. Atkinson, Jr. 21550 Oxnard Street, Suite 750, Woodland Hills, CA 91367 |
(Name and address of agent for service) |
|
Registrant’s telephone number, including area code: | (800) 915-6566 | |
|
Date of fiscal year end: | December 31 | |
|
Date of reporting period: | December 31, 2007 | |
| | | | | | | |
Item 1. Report to Stockholders.

Annual
Report
December 31, 2007
• Alternative Energy Fund
• Asia Focus Fund
• Asia Pacific Dividend Fund
• China & Hong Kong Fund
• Global Energy Fund
• Global Innovators Fund
Guinness Atkinson Funds
Annual Report
December 31, 2007
TABLE OF CONTENTS
| | 3 | | | Letter to Shareholders | |
|
| | 6 | | | Expense Example | |
|
| | 7 | | | Alternative Energy Fund | |
|
| | 16 | | | Asia Focus Fund | |
|
| | 23 | | | Asia Pacific Dividend Fund | |
|
| | 30 | | | China & Hong Kong Fund | |
|
| | 36 | | | Global Energy Fund | |
|
| | 44 | | | Global Innovators Fund | |
|
| | 51 | | | Statements of Assets and Liabilities | |
|
| | 53 | | | Statements of Operations | |
|
| | 55 | | | Statements of Changes in Net Assets | |
|
| | 57 | | | Financial Highlights | |
|
| | 63 | | | Notes to Financial Statements | |
|
| | 73 | | | Report of Independent Registered Public Accounting Firm | |
|
| | 74 | | | Trustee and Officier Information | |
|
| | 76 | | | Privacy Notice | |
|
| | 77 | | | Guinness Atkinson Funds Information | |
|
2
Dear Guinness Atkinson Funds Shareholders,
We realize that when you read this letter we'll be well into 2008 and, let's face it, 2008 is not starting off in a manner that might suggest it will be a banner year. But this letter and annual report are meant to cover 2007 so we won't hesitate to mention that 2007 was a stellar year for all six of the Guinness Atkinson Funds. If you've been reading these letters the last few years you'll note that we've started recent editions of this letter lamenting that the coming year would have difficulty matching the previous year. Once again we're pleased to report that we erred; 2007 has proven to be another great year to be a shareholder in the Guinness Atkinson Funds. The 2007 total return for each of the Guinness Atkinson Funds bested the total return each Fund achieved in 2006. The leading Guinness Atkinson Fund for 2007 was the China & Hong Kong Fund which produced a total return of 65.06%. At the other end of the spectrum, the Global Inn ovators Fund produced a total return of 21.17% for the year. Returns for all of the Funds are listed below.
Fund Performance
Returns for the periods ending December 31, 2007 for the Guinness Atkinson Funds:
| Fund (inception date) | | 1-year | | 3-year | | 5-year | | 10-year | | From Inception | |
| Alternative Energy Fund (March 31, 2006) | | | 42.68 | % | | | | | | | | | | | | | 16.61 | % | |
| Asia Focus (April 29, 1996) | | | 46.00 | % | | | 33.92 | % | | | 34.07 | % | | | 10.04 | % | | | 6.29 | % | |
| Asia Pacific Dividend Fund (March 31, 2006) | | | 26.30 | % | | | | | | | | | | | | | 20.95 | % | |
| China & Hong Kong (June 30, 1994) | | | 65.06 | % | | | 34.94 | % | | | 35.43 | % | | | 14.82 | % | | | 12.21 | % | |
| Global Energy Fund (June 30, 2004) | | | 37.25 | % | | | 35.20 | % | | | | | | | | | 37.02 | % | |
| Global Innovators Fund (December 15, 1998) | | | 21.17 | % | | | 17.18 | % | | | 19.39 | % | | | | | 7.08 | % | |
Periods of greater than one year are average annualized returns; one year or less are actual returns. All returns are for the periods ending December 31, 2007.
Performance data quoted represents past performance and does not guarantee future results. The investment return and principal value of an investment will fluctuate so that an investor's shares, when redeemed, may be worth more or less than the original cost. Current performance of the Funds may be lower or higher than the performance quoted. Performance data current to the most recent month end may be obtained by visiting www.gafunds.com, or calling (800) 916-6566.
Each of the Funds impose a 2% redemption fee on shares held less than 30 days. The performance data does not reflect this 2% redemption fee on shares held less than 30 days. Total returns reflect a waiver in effect and in the absence of this waiver, the total returns would be lower.
Expense ratio information: The gross and, if applicable, net expense (after expense reimbursement) ratios as stated in the most recent prospectus (April 30, 2007) for the Funds are as follows:
| Fund | | 2006 Expense Ratio | |
| Alternative Energy Fund | | 2.60% gross; 1.98% net | |
| Asia Focus Fund | | 1.84% | |
| Asia Pacific Dividend Fund | | 17.86% gross; 1.98% net | |
| China & Hong Kong Fund | | 1.59% | |
| Global Energy Fund | | 1.38% gross; 1.45% net | |
| Global Innovators Fund | | 1.64% gross; 1.55% net | |
3
All of the Guinness Atkinson Funds have an expense cap in place and the advisor is contractually obligated to cap the total expenses at least through June 30, 2008.
Astute readers will notice that the expense ratios listed above are different than those presented elsewhere in this report. This discrepancy is a function of the rule which requires the presentation of the expense ratios from the most recent prospectus whenever performance data is provided. The prospectus for the Guinness Atkinson Funds is produced at the end of April each year and cites the performance and expense ratios from the previous year's annual report. This means that the expense ratios listed above are for the period ending December 31, 2006 even though these audited financial statements provide expense ratios through December 31, 2007. The bottom line: the expense ratios for 2007 are lower than the out of date figures above. Here are the expense ratios for 2007:
| Fund | | 2007 Expense Ratio | |
| Alternative Energy Fund | | 1.64% | |
| Asia Focus Fund | | 1.69% | |
| Asia Pacific Dividend Fund | | 2.09% gross; 1.98% net | |
| China & Hong Kong Fund | | 1.44% | |
| Global Energy Fund | | 1.37% | |
| Global Innovators Fund | | 1.44% | |
As usual our fund managers provide their views on the past year and look ahead to the current year for each of the six Guinness Atkinson Funds. You will find these comments preceding the financial results for the Funds which follow this letter. Also, we've provided a table showing the year-end Morningstar ratings for the four Guinness Atkinson Funds that have a track record of three years or more. That table appears immediately after this letter.
Change is Changing
Central to our purpose at Guinness Atkinson is to put investors smack in the middle of the amazing change that is the hallmark of the 21st century. We've already seen dramatic change in virtually every aspect of modern life in the last 35 years and the rapid pace of change suggests more is on the way. And while we can't see the future as clearly as we might like, it is not hard to recognize that the pace of change is accelerating and is likely to continue. We can see that China and Asia are experiencing rapid growth and that the region is becoming a leading force in the world economy. We can see that there are changes underway in the energy markets and the way in which the world powers itself. We are all aware of the impact that innovation is having on our personal and business lives. What is more difficult to see is how all of this fits together and how individuals, businesses, society and culture will respond. The fact that all six of the Guinness Atkinson Funds produced stellar returns in 2007 has much to do with the focus on the concept of change and provides some evidence that the Guinness Atkinson Funds have correctly targeted some of the more important long-term themes. That said, we're the first to recognize that these themes are long-term and to remind investors not to focus on the short-term results.
We appreciate the confidence you have placed in us and our management team and appreciate the opportunity to serve you.
Sincerely,


Timothy Guinness James Atkinson
January 30, 2008
4
Morningstar Ratings
Below is a table listing the Morningstar star ratings as of December 31, 2007 for the four Guinness Atkinson Funds that have at least a three year history. Parenthetical numbers after the star rating indicate the number of funds in the comparison group.
| Fund | | Category | | Overall | | 3-year | | 5-year | | 10-year | |
Asia Focus
Fund | | Pacific/Asia
Ex-Japan Stk | | 2**
(83 funds) | | 3***
(83 funds) | | 3***
(69 funds) | | 1*
(48 funds) | |
China & Hong Kong
Fund | | Pacific/Asia
Ex-Japan Stk | | 3***
(83 funds) | | 3***
(83 funds) | | 3***
(69 funds) | | 3***
(48 funds) | |
Global Energy
Fund | | Specialty
Natural Resources | | 4****
(135 funds) | | 4****
(135 funds) | | | | | |
Global Innovators
Fund | | Large Growth | | 5*****
(1,449 funds) | | 5*****
(1,449 funds) | | 5*****
(1,215 funds) | | | |
©2008 Morningstar, Inc. All Rights Reserved. The information contained herein: (1) is proprietary to Morningstar and/or its content providers; (2) may not be copied or distributed; and (3) is not warranted to be accurate, complete or timely. Neither Morningstar nor its content providers are responsible for any damages or losses arising from any use of this information. Past performance is no guarantee of future results.
The Funds invest in foreign securities which involves greater volatility and political, economic and currency risks and differences in accounting methods. The Funds are non-diversified meaning their assets may be concentrated in fewer individual holdings than diversified funds. Therefore, the Funds are more exposed to individual stock volatility than diversified funds. The Funds invest in smaller companies, which will involve additional risks such as limited liquidity and greater volatility.
For each fund with at least a three-year history, Morningstar calculates a Morningstar RatingTM based on a Morningstar Risk-Adjusted Return measure that accounts for variation in a fund's monthly performance (including the effects of sales charges, loads, and redemption fees), placing more emphasis on downward variations and rewarding consistent performance. The top 10% of funds in each category receive 5 stars, the next 22.5% receive 4 stars the next 35% receive 3 stars, the next 22.5% receive 2 stars and the bottom 10% receive 1 star. (Each share class is counted as a fraction of one fund within this scale and rated separately, which may cause slight variations in distribution percentages.)
5
GUINNESS ATKINSON FUNDS
Expense Examples
As a shareholder of the Funds, you incur two types of costs: (1) redemption fees; and (2) ongoing costs, including advisory fees; and other Fund expenses. The examples below are intended to help you understand your ongoing costs (in dollars) of investing in the Funds and to compare these costs with the ongoing costs of investing in other mutual funds.
The examples are based on an investment of $1,000 invested at the beginning of the period shown and held for the entire period from July 1, 2007 to December 31, 2007.
Actual Expenses
For each Fund, the first line of the table below provides information about actual account values and actual expenses. You may use the information in this line, together with the amount you invested, to estimate the expenses that you paid over the period. Simply divide your account value by $1,000 (for example, an $8,600 account value divided by $1,000 = 8.6), then multiply the result by the number in the first line under the heading entitled "Expenses Paid During Period" to estimate the expenses you paid on your account during this period.
Hypothetical Example for Comparison Purposes
For each Fund, the second line of the table below provides information about hypothetical account values and hypothetical expenses based on the Fund's actual expense ratio and an assumed rate of return of 5% per year before expenses, which is not the Fund's actual return. The hypothetical account values and expenses may not be used to estimate the actual ending account balance or expenses you paid for the period. You may use this information to compare the ongoing costs of investing in the Fund and other funds. To do so, compare this 5% hypothetical example with the 5% hypothetical examples that appear in the shareholder reports of the other funds.
Please note that the expenses shown in the table are meant to highlight your ongoing costs only and do not reflect any redemption fees. Therefore, the second line for each Fund of the table is useful in comparing ongoing costs only, and will not help you determine the relative total costs of owning different funds. In addition, if these redemption fees were included, your costs would have been higher.
| | | Beginning
Account
Value
(07/01/07) | | Ending
Account
Value
(12/31/07) | | Expenses Paid
During Period*
(07/01/07 to
12/31/07) | | Expense Ratio
During Period*
(07/01/07 to
12/31/07) | |
| Guinness Atkinson Alternative Energy Fund Actual | | $ | 1,000.00 | | | $ | 1,088.10 | | | $ | 8.52 | | | | 1.62 | % | |
Guinness Atkinson Alternative Energy Fund Hypothetical
(5% return before expenses) | | $ | 1,000.00 | | | $ | 1,017.04 | | | $ | 8.23 | | | | 1.62 | % | |
| Guinness Atkinson Asia Focus Fund Actual | | $ | 1,000.00 | | | $ | 1,153.00 | | | $ | 8.88 | | | | 1.64 | % | |
Guinness Atkinson Asia Focus Fund Hypothetical
(5% return before expenses) | | $ | 1,000.00 | | | $ | 1,016.96 | | | $ | 8.32 | | | | 1.64 | % | |
| Guinness Atkinson Asia Pacific Dividend Fund Actual | | $ | 1,000.00 | | | $ | 1,057.10 | | | $ | 10.27 | | | | 1.98 | %† | |
Guinness Atkinson Asia Pacific Dividend Fund Hypothetical
(5% return before expenses) | | $ | 1,000.00 | | | $ | 1,015.22 | | | $ | 10.06 | | | | 1.98 | %† | |
| Guinness Atkinson China & Hong Kong Fund Actual | | $ | 1,000.00 | | | $ | 1,296.20 | | | $ | 8.11 | | | | 1.40 | % | |
Guinness Atkinson China & Hong Kong Fund Hypothetical
(5% return before expenses) | | $ | 1,000.00 | | | $ | 1,018.14 | | | $ | 7.13 | | | | 1.40 | % | |
| Guinness Atkinson Global Energy Fund Actual | | $ | 1,000.00 | | | $ | 1,144.10 | | | $ | 7.00 | | | | 1.29 | % | |
Guinness Atkinson Global Energy Fund Hypothetical
(5% return before expenses) | | $ | 1,000.00 | | | $ | 1,018.68 | | | $ | 6.59 | | | | 1.29 | % | |
| Guinness Atkinson Global Innovators Fund Actual | | $ | 1,000.00 | | | $ | 1,040.40 | | | $ | 7.34 | | | | 1.43 | % | |
Guinness Atkinson Global Innovators Fund Hypothetical
(5% return before expenses) | | $ | 1,000.00 | | | $ | 1,018.01 | | | $ | 7.26 | | | | 1.43 | % | |
*Expenses are equal to the Funds' annualized expense ratio as indicated, multiplied by the average account value over the period, multiplied by the number of days in most recent fiscal half-year period (184), then divided by the number of days in the fiscal year (365) (to reflect the one-half year period).
†Net of fee waivers and/or expense reimbursements. If those fee waivers and/or expense reimbursements had not been in effect, the Fund's actual expenses would have been higher.
6
ALTERNATIVE ENERGY FUND
1. Performance
AVERAGE ANNUALIZED TOTAL RETURNS
| | | 2007
(actual) | | Since inception
March 31, 2006 | |
| Fund | | | 42.68 | % | | | 16.61 | % | |
| Benchmark indices (see page 11): | |
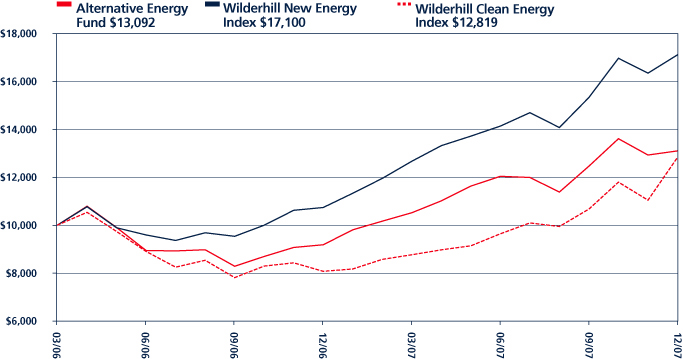
| Wilderhill New Energy Global Innovation Index | | | 59.38 | % | | | 34.54 | % | |
| Wilderhill Clean Energy Index | | | 58.88 | % | | | 15.21 | % | |
| MSCI World Energy Index | | | 30.67 | % | | | 19.54 | % | |
The Fund's gross expense ratio is 2.60% per the Prospectus dated April 30, 2007. Guinness Atkinson Asset Management has contractually agreed to waive a portion of its advisory fees so that the Fund's ratio of expenses to average daily net assets will not exceed 1.98% through at least June 30, 2008. To the extent that the Advisor waives fees it may seek repayment of a portion or all of such amounts at any time within the three fiscal years after the fiscal year in which such amounts were waived, subject to the applicable cap.
Performance data quoted represents past performance and does not guarantee future results. The investment return and principal value of an investment will fluctuate so that an investor's shares, when redeemed, may be worth more or less than their original cost. Current performance of the Funds may be lower or higher than the performance quoted. Performance data current to the most recent month end may be obtained by visiting www.gafunds.com, or calling (800) 916-6566.
The Fund imposes a 2% redemption fee on shares held less than 30 days. Performance data does not reflect the 2% redemption fee on shares held less than 30 days. Total return since inception reflect a fee waiver in effect and in the absence of this waiver, the total returns would be lower.
The Alternative Energy Fund had a strong year in 2007 which produced a total return of 42.68%. This was well ahead of the MSCI World Energy Index, which was up 30.67% in 2007. The fund underperformed the two Wilderhill benchmark indices primarily as a function of the structure of the fund and our more conservative approach.
2. Portfolio
| Sector | | % of Assets | |
| Solar | | | 34.7 | % | |
| Wind | | | 30.2 | % | |
| Hydro | | | 10.2 | % | |
| Efficiency | | | 8.2 | % | |
| Geothermal | | | 6.4 | % | |
| Biofuel | | | 2.8 | % | |
| Fuelcell | | | 2.6 | % | |
| Biomass Energy | | | 1.5 | % | |
| Wave/Tidal | | | 0.1 | % | |
Solar remains the highest weighted sector with 34.7% of the assets of the fund. We think that the next 5 years should carry the solar industry to a position where the holy grail of grid parity is achievable. Investments in solar cover all elements of the value chain from silicon producers to cell and module manufacturers. We have remained in the stocks where we can see valuation upside – there are a number of highly volatile solar stocks where the valuation is challenging in our view (and which we do not hold).
7
ALTERNATIVE ENERGY FUND
We hold 30.2% in wind and our positions in wind are split almost evenly between turbine manufacturers and wind farm developers. We believe in our view, turbine manufacturers are benefiting from tight market conditions, and wind farm developers are well placed because of faster approval cycles and increasing asset values.
We believe in our view, Hydro forms a lower risk bedrock to the portfolio. The overarching idea behind holding hydro stocks is because of their low operating cost, which mean that increases in electricity prices and payments for carbon credits go straight to the bottom line.
We view Geothermal power as having similar dynamics, and similarly location constrained, but it is at a much earlier stage of implementation.
We remain circumspect about biofuels which account for 2.8% of the fund now, although we are monitoring valuations carefully for an attractive re-entry point. We prefer biofuels stocks that have some form of vertical integration. We believe biofuel refining stocks have most potential as shorter term trading ideas.
We think Fuelcells remain some way from mass commercialization and we currently hold only niche investments which we hope will give us access to some of the early winners. Biomass Energy accounts for 1.5% of the fund. There are a number of opportunities in this space, but we see growth potential and returns as less attractive.
Wave/Tidal power has very few investment opportunities to date, but we are following the sector keenly. Our only holding is a small research position.
| | | % NAV | | Operator | | Manufacturer | | Electricity | | Fuel | |
| Solar | | | 34.7 | % | | | 0 | % | | | 100 | % | | | 100 | % | | | 0 | % | |
| Wind | | | 30.2 | % | | | 55 | % | | | 45 | % | | | 100 | % | | | 0 | % | |
| Hydro | | | 10.2 | % | | | 100 | % | | | 0 | % | | | 100 | % | | | 0 | % | |
| Efficiency | | | 8.2 | % | | | 0 | % | | | 100 | % | | | 59 | % | | | 41 | % | |
| Geothermal | | | 6.4 | % | | | 100 | % | | | 0 | % | | | 100 | % | | | 0 | % | |
| Biofuel | | | 2.8 | % | | | 100 | % | | | 0 | % | | | 0 | % | | | 100 | % | |
| Fuelcell | | | 2.6 | % | | | 0 | % | | | 100 | % | | | 2 | % | | | 98 | % | |
| Biomass Energy | | | 1.5 | % | | | 100 | % | | | 0 | % | | | 100 | % | | | 0 | % | |
| Wave/Tidal | | | 0.1 | % | | | 0 | % | | | 100 | % | | | 100 | % | | | 0 | % | |
| | | | | | | | 37 | % | | | 60 | % | | | 88 | % | | | 9 | % | |
This table shows that 37% of the portfolio is invested in companies which are producers of electricity or fuel ("operators") with 60% in companies which manufacture the equipment for that.
Most notably, this table shows 88% invested in companies which relate more to electricity than fuel. We think this shows how high oil prices are only a small part of the story here.
With the way the industry is progressing, we are likely in the very long term to see electricity form some part of the eventual substitution for fuel, whether that be through electric vehicles, hydrogen powered vehicles, solar powered vehicles or some other method.
8
ALTERNATIVE ENERGY FUND
| Region | | % of Assets | |
| Europe | | | 55.9 | % | |
| North America | | | 22.0 | % | |
| Asia | | | 9.2 | % | |
| Australia/NZ | | | 5.3 | % | |
| Latin America | | | 4.3 | % | |
Europe accounts for 55.9% of the assets in the fund versus 22.0% in North America. This reflects the earlier development of the European wind and solar industries. We have 18.8% in Asia, Australia and Latin America and are continually looking for international opportunities that are under the United States investor's radar screen.
| Mkt Cap $m | | Positions | | % of Assets | |
| >1000 | | | 26 | | | | 62.2 | % | |
| 500-1000 | | | 4 | | | | 7.1 | % | |
| 250-500 | | | 10 | | | | 12.8 | % | |
| 100-250 | | | 11 | | | | 8.6 | % | |
| 50-100 | | | 5 | | | | 3.4 | % | |
| <50 | | | 6 | | | | 1.4 | % | |
| Cash | | | | | | | 1.2 | % | |
We think the liquidity of the portfolio remains good. The percentage of the portfolio held in stocks with a market capitalization of over $1 billion is now 62.2% and only 1.4% of the portfolio is invested in stocks with a market capitalization below $50 million.
We think in our view, the universe of high quality, large cap alternative energy stocks is growing fast, both organically and from new issues. We endeavour to maintain a balance between holding larger capitalization more liquid stocks and positions in smaller capitalization less liquid stocks where the value and growth opportunity might be greater.
| Position size | | Positions | | % of Assets | |
| Full | | | 16 | | | | 48.2 | % | |
| Half | | | 29 | | | | 41.9 | % | |
| Research | | | 17 | | | | 5.4 | % | |
| Cash | | | | | | | 1.2 | % | |
At the beginning of the year we changed the way in which we managed the structure of the fund. All holdings are now classified as either full units, half units or research positions. We currently hold 16 full units and 29 half units, with a further 17 research positions. We also believe this enables us to benefit from a strict rebalancing discipline. A breakdown of the portfolio under this structure is shown in the table above.
3. Activity
Over the year we have increased our exposure to solar stocks, with additional purchases including Solon, Sunpower, Conergy, Jetion, REC, Solaria, Motech and E-Ton Solar.
The main additions to our wind stocks has been from investing in developers including EDF Energies Nouvelles, Acciona, Greentech, Iberdrola Renovables, Innergex and Babcock and Brown Wind Partners. Of the turbine manufacturers, we sold our holding in Repower when the company was acquired by Suzlon and bought a half unit in Composite Technologies, an emerging wind turbine developer.
9
ALTERNATIVE ENERGY FUND
Of other interesting purchases, we bought a full unit in PNOC Development, a Philippine geothermal company and a half unit in WFI, a Canadian firm that makes ground source heat pumps. We acquired a half unit in Contact Energy, a New Zealand utility, with significant hydro and geothermal assets and we acquired CPFL Energia, a Brazilian utility with hydro assets.
At the beginning of the year we completed our move out of ethanol which we began at the beginning of December 2006, leaving our only exposure in research stocks which we have also further reduced. We have been reducing our positions over the year in fuelcells, including exiting our positions in Ballard Power and Fuelcell Energy. We have traded in and out of a number of solar and wind stocks on valuation opportunities. Other sells have included Climate Exchange, Trading Emissions and Environmental Power.
As a matter of good housekeeping, we cleared out our research portfolio of a number of stocks where the initial premise or reason for interest was no longer valid, or where the size of the company and its prospects made it unlikely to make it into the main portfolio.
4. Outlook
2007 was a good year for the alternative energy industry where public market prices responded to higher energy prices and awareness increased of the growth potential for the industry. Government support continues to increase, with the change of government in Australia bringing one of the main opponents to within the Kyoto fold, and many individual States in the United States signing up to reduce carbon emissions independently of the Federal Government.
The wind turbine market is so strong that wind turbine manufacturers are operating at maximum capacity and growing at their maximum capacity. The growth rate in production is limited by the scale of manufacturing facilities required, and we believe that growth of more than 20-25% per annum would be difficult to achieve from an engineering perspective. The pipeline for wind developers remains good and approval processes are slowly becoming more streamlined.
The solar market had a capacity constrained where bottlenecks in silicon supply meant that silicon module prices remained firm. This has enabled leading companies with reserved silicon supply to improve their margins whilst growing capacity. Cost reductions are expected to continue, whilst silicon supply will remain tight for 2008. Demand is difficult to predict, but we expect demand from Germany and Spain to remain strong and for the United States to begin to gain traction.
The hydro market stands to benefit from slowly improving electricity prices, although the lead time for new projects will hamper fast growth. Opportunities are emerging for smaller scale Run of River projects, particularly in Canada. Geothermal power continues to hold attractions, but growth is slowed by time to permit. We expect to see more enthusiasm for geothermal as base load renewable power becomes more valuable to balance the intermittent nature of other sources.
The market for biofuels is expected to remain tough in 2008, with ever higher feedstock prices not matched by an increase in fuel prices. There has been a marked slowdown in plans for further plants and this will have a knock on effect in the equipment supply area. It will be interesting to see how this plays out for feedstocks this year. The great unknown in biofuels is whether legislation will be enacted in the United States (or elsewhere) which would dramatically alter the industry economics. The best opportunities here will remain with the lowest cost producers and businesses relating to feedstock production.
We are not expecting fuelcells to gain much traction, although we might see more prototype devices installed. Efficiency will provide further investments, although by its very nature, we expect this to remain a collection of niche market opportunities. We continue to look for interesting ways to invest in the alternative energy theme.
2008 has started with a healthy correction to many alternative energy sector stocks triggered by the fall in broad market indices in January. What the rest of the year will hold will likely depend on a number of factors external to the alternative energy sector itself – notably the continued performance of broad market indices and whether the anglosphere has a subprime/ housing price correction induced slowdown or full recession and whether this infects wider global markets and particularly Asian economies.
Our view tends to the more optimistic end of the spectrum on both counts and we look to markets and economies recovering in the second half of 2008. We have tried to position the fund to participate in such a recovery. In the longer run we believe many of our investee companies can grow for quite a long time and our intention is that the fund should be a beneficiary of such long growth.

Tim Guinness February 2008
10
ALTERNATIVE ENERGY FUND
The Funds invest in foreign securities which will involve political, economic and currency risks, greater volatility, and differences in accounting methods. The Funds are non-diversified meaning their assets may be concentrated in fewer individual holdings than diversified funds. Therefore, the Funds are more exposed to individual stock volatility than diversified funds. The Funds invest in smaller companies, which will involve additional risks such as limited liquidity and greater volatility.
The Wilderhill New Energy Global Innovation Index (NEX) is a modified dollar weighted index of publicly traded companies, which are active in renewable and low-carbon energy, and which stand to benefit from responses to climate change and energy security concern. The Wilderhill Clean Energy Index (ECO) is a modified equal dollar weighted index comprised of publicly traded companies whose businesses stand to benefit substantially from societal transition toward the use of cleaner energy and conservation. The MSCI World Energy Index is an unmanaged index composed of more than 1,400 stocks listed on exchanges in the U.S., Europe, Canada, Australia, New Zealand, and the Far East. These indices are unmanaged, not available for investment and do not incur expenses.
Please refer to the Schedule of Investments for details on fund holdings.
The information provided herein represents the opinion of Guinness Atkinson Management for the period stated and is not intended to be a forecast of future events, a guarantee of future results, nor investment advice. Opinions, fund holdings and sector allocations are subject to change at any time and are not recommendations to buy or sell any security.
11
ALTERNATIVE ENERGY FUND
Growth of $10,000
Total Return
Periods Ended December 31, 2007
| One Year | | Since Inception
(03/31/06) | |
| | 42.68 | % | | | 16.61 | % | |
Performance data quoted represents past performance and does not guarantee future results. The investment return and principal value of an investment will fluctuate so that an investor's shares, when redeemed, may be worth more or less than their original.
Total returns reflect a fee waiver in effect and in the absence of this waiver, the total returns would be lower. The Fund imposes a 2% redemption fee on shares held less than 30 days.
The Wilderhill New Energy Global Innovations Index (NEX) is a modified dollar weighted index of publicly traded companies, which are active in renewable and low-carbon energy, and which stand to benefit from responses to climate change and energy security concern. The Wilderhill Clean Energy Index (ECO) is a modified equal dollar weighted index comprised of publicly traded companies whose businesses stand to benefit substantially from societal transition toward the use of cleaner energy and conservation.
12
FUND HIGHLIGHTS at December 31, 2007
GUINNESS ATKINSON ALTERNATIVE ENERGY FUND
| # of Holdings in Portfolio: | | | 62 | | |
| Portfolio Turnover: | | | 47.4 | % | |
| % of Stocks in Top 10: | | | 34.2 | % | |
| Fund Managers: | |
| Timothy W.N. Guinness | |
| Edward Guinness | |
| Matthew Page | | | | | |
| Top 10 Holdings (% of net assets) | |
| Vestas Wind Systems A/S | | | 4.0 | % | |
| Q-Cells AG | | | 3.8 | % | |
| Suntech Power Holdings Co., Ltd. | | | 3.6 | % | |
| Theolia SA | | | 3.4 | % | |
| Gamesa Corporation Tecnologica SA | | | 3.4 | % | |
| Iberdrola Renovables | | | 3.3 | % | |
| Verbund - Oesterreichische Elektrizitaetswirtschafts AG | | | 3.2 | % | |
| Conergy AG | | | 3.2 | % | |
| Ormat Technologies, Inc. | | | 3.2 | % | |
| Clipper Windpower PLC | | | 3.1 | % | |
| Country Breakdown (% of net assets) | |
| Germany | | | 21.7 | % | |
| United States | | | 15.8 | % | |
| Spain | | | 9.7 | % | |
| Denmark | | | 6.6 | % | |
| Canada | | | 6.2 | % | |
| France | | | 4.8 | % | |
| Brazil | | | 4.3 | % | |
| Australia | | | 4.0 | % | |
| Britain | | | 4.0 | % | |
| China | | | 3.6 | % | |
| Austria | | | 3.2 | % | |
| Norway | | | 3.0 | % | |
| Philippines | | | 2.8 | % | |
| Taiwan | | | 2.7 | % | |
| Ireland | | | 1.5 | % | |
| New Zealand | | | 1.3 | % | |
| Virgin Islands (BR) | | | 1.2 | % | |
| United Kingdom | | | 0.2 | % | |
| Malaysia | | | 0.1 | % | |
| Sector Breakdown (% of Investments) | |
| Solar | | | 36.0 | % | |
| Wind | | | 31.2 | % | |
| Hydro | | | 10.5 | % | |
| Efficiency | | | 8.5 | % | |
| Geothermal | | | 6.6 | % | |
| Biofuel | | | 2.9 | % | |
| Fuelcell | | | 2.7 | % | |
| Biomass Energy | | | 1.5 | % | |
| Wave/Tidal | | | 0.1 | % | |
13
SCHEDULE OF INVESTMENTS IN SECURITIES
at December 31, 2007
GUINNESS ATKINSON ALTERNATIVE ENERGY FUND
| Shares | | COMMON STOCKS: 96.7% | | Value | |
| Biofuel: 2.8% | | | |
| | 2,754,737 | | | Babcock & Brown Environmental Investments, Ltd.* | | $ | 1,194,649 | | |
| | 1,005,100 | | | Carotech Bhd | | | 155,057 | | |
| | 25,000 | | | Futurefuel Corporation* | | | 200,000 | | |
| | 1,200,000 | | | Maple Energy PLC* | | | 2,376,777 | | |
| | 4,018,737 | | | Natural Fuel, Ltd.* | | | 525,469 | | |
| | | | 4,451,952 | | |
| Biomass: 1.5% | | | |
| | 843,987 | | | Alkane Energy PLC* | | | 283,107 | | |
| | 1,964,155 | | | Novera Energy PLC* | | | 2,135,582 | | |
| | | | 2,418,689 | | |
| Efficiency: 8.2% | | | |
| | 3,243 | | | AgCert International* | | | 72 | | |
| | 146,000 | | | Applied Intellectual Capital* | | | 731,683 | | |
| | 760,987 | | | Carmanah Technologies Corporation* | | | 917,549 | | |
| | 113,448 | | | Echelon Corporation* | | | 2,341,567 | | |
| | 136,469 | | | Fuel Systems Solutions, Inc.* | | | 1,950,142 | | |
| | 488,561 | | | VRB Power Systems, Inc.* | | | 99,004 | | |
| | 1,200,000 | | | VRB Power Systems, Inc.*(a) | | | 243,173 | | |
| | 921,946 | | | Westport Innovations, Inc.* | | | 2,662,289 | | |
| | 85,500 | | | WFI Industries, Ltd. | | | 2,252,394 | | |
| | 223,059 | | | Xantrex Technology, Inc.* | | | 2,081,537 | | |
| | | | 13,279,410 | | |
| Fuelcell: 2.6% | | | |
| | 1,803,180 | | | Hydrogenics Corporation* | | | 1,685,973 | | |
| | 610,000 | | | ITM Power PLC* | | | 1,411,615 | | |
| | 140,964 | | | Polyfuel, Inc.* | | | 66,568 | | |
| | 2,132,352 | | | Quantum Fuel Systems Technologies Worldwide, Inc.* | | | 1,023,529 | | |
| | | | 4,187,685 | | |
| Geothermal: 6.4% | | | |
| | 312,328 | | | Geodynamics, Ltd.* | | | 543,743 | | |
| | 93,719 | | | Ormat Technologies, Inc. | | | 5,155,483 | | |
| | 29,707,000 | | | PNOC Energy Development Corporation | | | 4,621,749 | | |
| | | | 10,320,975 | | |
| Hydro: 10.2% | | | |
| | 133,287 | | | Boralex, Inc.* | | | 2,329,602 | | |
| | 260,142 | | | Cia Energetica de Minas Gerais - ADR | | | 4,802,221 | | |
| | 329,300 | | | Contact Energy, Ltd. | | | 2,084,546 | | |
| | 36,600 | | | CPFL Energia SA - ADR | | | 2,073,756 | | |
| | 74,620 | | | Verbund - Oesterreichische Elektrizitaetswirtschafts AG | | | 5,187,031 | | |
| | | | 16,477,156 | | |
The accompanying notes are an integral part of these financial statements.
14
| Shares | | COMMON STOCKS: 96.7% Continued | | Value | |
| Solar: 34.7% | | | |
| | 144,210 | | | Conergy AG | | $ | 5,183,968 | | |
| | 200,000 | | | Daystar Technologies, Inc.* | | | 1,250,000 | | |
| | 229,500 | | | E-Ton Solar Tech Co., Ltd. | | | 2,185,414 | | |
| | 1,037,251 | | | Jetion Holdings, Ltd.* | | | 1,980,341 | | |
| | 33,980 | | | MEMC Electronic Materials, Inc.* | | | 3,006,890 | | |
| | 239,388 | | | Motech Industries | | | 2,175,692 | | |
| | 43,150 | | | Q-Cells AG* | | | 6,123,633 | | |
| | 98,790 | | | Renewable Energy Corporation AS* | | | 4,955,160 | | |
| | 310,166 | | | SAG Solarstrom AG | | | 1,499,791 | | |
| | 277,500 | | | SAG Solarstrom AG (Convertible Bond)* | | | 405,719 | | |
| | 572,000 | | | Solar Integrated Technologies* | | | 1,107,016 | | |
| | 38,000 | | | Solar Millennium* | | | 1,920,475 | | |
| | 133,817 | | | Solar-Fabrik AG | | | 3,097,050 | | |
| | 83,700 | | | Solaria Energy Y NPV* | | | 2,613,318 | | |
| | 78,754 | | | Solarworld AG | | | 4,780,483 | | |
| | 19,578 | | | Solon AG Fuer Solartechnik* | | | 2,028,146 | | |
| | 28,000 | | | SunPower Corporation* | | | 3,650,920 | | |
| | 70,611 | | | Suntech Power Holdings Co., Ltd.* | | | 5,812,698 | | |
| | 8,800 | | | Wacker Chemie AG | | | 2,538,387 | | |
| | | | 56,315,101 | | |
| Wave/Tidal: 0.1% | | | |
| | 14,663 | | | Ocean Power Technologies, Inc. | | | 231,370 | | |
| Wind: 30.2% | | | |
| | 7,620 | | | Acciona SA | | | 2,400,834 | | |
| | 1,393,543 | | | Babcock & Brown Wind Partners | | | 2,066,394 | | |
| | 358,877 | | | Clipper Windpower PLC* | | | 5,060,685 | | |
| | 1,804,800 | | | Composite Technology Corporation* | | | 2,508,672 | | |
| | 31,120 | | | EDF Energies Nouvelles SA | | | 2,170,408 | | |
| | 116,882 | | | Gamesa Corporation Tecnologica SA | | | 5,408,191 | | |
| | 221,200 | | | Greentech Energy Systems* | | | 4,322,579 | | |
| | 650,000 | | | Iberdrola Renovables* | | | 5,369,380 | | |
| | 400,000 | | | Innergex Renewable Energy, Inc.* | | | 5,053,954 | | |
| | 55,000 | | | Nordex AG* | | | 2,498,726 | | |
| | 188,647 | | | Theolia SA* | | | 5,560,868 | | |
| | 59,215 | | | Vestas Wind Systems A/S* | | | 6,394,080 | | |
| | | | 48,814,771 | | |
| | | | | Total Common Stocks
(cost $139,311,575) | | | 156,497,109 | | |
| Warrants: 0.1% | | | |
| | 25,000 | | | Futurefuel Corporation* | | | 70,750 | | |
| | 39,041 | | | Geodynamics, Ltd.* | | | 16,797 | | |
| | | | 87,547 | | |
| | | | | Total Warrants
(cost $35,828) | | | 87,547 | | |
| | | | | Total Investments in Securities
(cost $139,347,403): 96.8% | | | 156,584,656 | | |
| | | | | Other Assets less Liabilities: 3.2% | | | 5,136,053 | | |
| | | | | Net Assets: 100.0% | | $ | 161,720,709 | | |
* Non-income producing security.
(a) Restricted Security.
ADR American Depository Receipt
The accompanying notes are an integral part of these financial statements.
15
ASIA FOCUS FUND for the period ended December 31, 2007
1. Performance
AVERAGE ANNUALIZED TOTAL RETURNS
| | | 1 Year
(actual) | | 3 Years | | 5 Years | | 10 Years | |
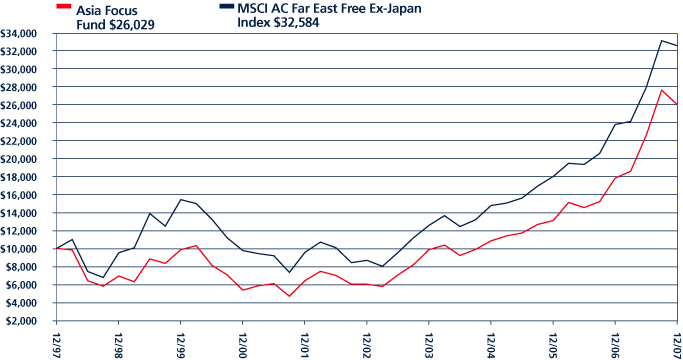
| Fund | | | 46.00 | % | | | 33.92 | % | | | 34.07 | % | | | 10.04 | % | |
| Benchmark Index (see page 17): | |
| MSCI AC Far East Free Ex Japan | | | 36.53 | % | | | 29.69 | % | | | 29.77 | % | | | 9.76 | % | |
| S&P 500 | | | 5.49 | % | | | 8.62 | % | | | 12.82 | % | | | 5.90 | % | |
The Fund's gross expense ratio is 1.84% per the Prospectus dated April 30, 2007. Guinness Atkinson Asset Management has contractually agreed to waive a portion of its advisory fees so that the Fund's ratio of expenses to average daily net assets will not exceed 1.98% through at least June 30, 2008. To the extent that the Advisor waives fees it may seek repayment of a portion or all of such amounts at any time within the three fiscal years after the fiscal year in which such amounts were waived, subject to the applicable cap.
Performance data quoted represents past performance and does not guarantee future results. The investment return and principal value of an investment will fluctuate so that an investor's shares, when redeemed, may be worth more or less than their original cost. Current performance of the Funds may be lower or higher than the performance quoted. Performance data current to the most recent month end may be obtained by visiting www.gafunds.com, or calling (800) 916-6566.
The Fund imposes a 2% redemption fee on shares held less than 30 days. Performance data quoted does not reflect the 2% redemption fee on shares held less than 30 days. Total Returns for prior periods reflect a fee waiver in effect and in the absence of this waiver, the total return would be lower.
For the year as a whole the Asia Focus Fund has performed well returning 46.00% as compared to the benchmark return of 36.53%. The last two months of the year however were weak as the credit crunch in the United States began to bite. The last two months of 2007 saw equity markets sell off hard and Asia did not escape. This is in spite of our belief that Asia, with its high savings, low levels of indebtedness, ample liquidity and banks' low exposure to United States sub-prime debt, is in a very different position from the developed markets. Strong performers over the year include the Fund's Chinese holdings, resources stocks including oil, coal and palm oil and stocks related to these namely shippers, shipbuilders and steel companies.
In our view, economic conditions across Asia have been, and continue to be, relatively benign. National finances across the region appear healthy with all countries running surpluses, in contrast to the developed world. Inflation has for the most part been modest and has not resulted in monetary tightening although we have seen rising costs of food and labor in China.
There has been much talk recently about whether or not Asia is decoupled from the United States and what this means for investors. We should be clear what decoupled means. We would argue that an economy is decoupled if the impact of a United States or global slowdown is limited to the export sector with the domestic sector behaving more or less independently. Across Asia the more insulated countries include China, India, Indonesia, the Philippines and Thailand. Those traditionally more exposed include Hong Kong, Korea, Taiwan, Malaysia and Singapore.
This year however, we have seen much stronger evidence of resurgent domestic activity across Asia rather than just China. This is important when we consider that during the last global downturn following the end of the technology boom Asian growth was very hard hit because in the aftermath of Asian financial crisis there was nothing to take the place of exports. Now we have seen sharp recoveries in domestic asset prices and new investment in Indonesia, Malaysia, the Philippines and Singapore as well as in China. Economic growth since 2002 has meant there is now a need for new capacity in roads, power, water and housing; and it has also provided the funds to pay for this investment.
This recovery in domestic investment is expected to herald a broader recovery in domestic Asia which has been largely absent since the crisis. Stock market performance in 2007 has reflected some of these changes with some domestic plays in Indonesia and Malaysia rising strongly, particularly those involved in construction and construction materials.
16
ASIA FOCUS FUND
2. Portfolio Position
Geographically, the portfolio has an overweight position in China, Hong Kong, Indonesia, Malaysia, Taiwan and Thailand relative to the benchmark. It is underweight compared to the benchmark in Korea, the Philippines and Singapore. On a sector basis the portfolio is overweight in consumer stocks, energy companies and materials including steel and chemicals.
3. Outlook
Markets hate uncertainty and the uncertainties now swirling around the world's largest economy mean that we are in for a choppy ride over the next few months. However, we do believe that Asia, while exposed to slower exports, is in a substantively strong position to weather the storm of 2008.
We believe stock markets in Asia will bounce around as the United States stock market seeks to find its level against a backdrop of uncertainties in the banking sector, the housing sector and the outlook for consumer demand. But investing in Asia means investment in economies that are at the early stages of a domestic upswing and that have the capital and resources to sustain that upswing through what is going to be a difficult time in the global economy.
Asia has more than enough to support their own investment needs; they can even spare funds to support the largest Wall Street institutions. In that light, maybe Asia isn't quite the high risk investment that some would have us believe.
We are looking at companies with a domestic Asian focus and we continue to like those sectors where demand is likely to remain strong – energy, resources and industrial materials. Chinese domestic demand is likely to remain buoyant in our view, and while growth is likely to slow it is our opinion that it needs to. We continue to focus on companies that offer value by virtue of strong cash flow and margins and those that are leaders in their sectors.
We expect that inflation in most of the region will remain subdued but we are conscious that food prices are moving higher and that in a developing region like Asia such moves are very visible and keenly felt, in the same way that gasoline price movements in the United States are visible to consumers. Economically, the region is on a sound footing and we believe that Asia continues to offer diversification benefits as well as higher growth opportunities to investors.

Edmund Harriss January 2008
The Funds invest in foreign securities which will involve political, economic and currency risks, greater volatility, and differences in accounting methods. The Funds are non-diversified meaning their assets may be concentrated in fewer individual holdings than diversified funds. Therefore, the Funds are more exposed to individual stock volatility than diversified funds. The Funds invest in smaller companies, which will involve additional risks such as limited liquidity and greater volatility.
The MSCI All Country Far East Free ex-Japan Index (MSCI AC Far East Free ex-Japan Index) is a free float-adjusted, capitalization-weighted index that is designed to measure equity market performance in the Asia region excluding Japan. The Standard & Poor's 500 Index is a market-capitalization weighted index composed of 500 widely held common stocks of U.S. companies. These indices are unmanaged, not available for investment and do not incur expenses.
Cash flow measures the cash generating capability of a company by adding non-cash charges (e.g. depreciation) and interest expense to pre-tax income.
Please refer to the Schedule of Investments for details on fund holdings.
The information provided herein represents the opinion of Guinness Atkinson Management for the period stated and is not intended to be a forecast of future events, a guarantee of future results, nor investment advice. Opinions, fund holdings and sector allocations are subject to change at any time are not recommendations to buy or sell any security.
17
ASIA FOCUS FUND
Growth of $10,000
Average Annual Total Return
Periods Ended December 31, 2007
| One Year | | Five Years | | Ten Years | |
| | 46.00 | % | | | 34.07 | % | | | 10.04 | % | |
Performance data quoted represents past performance and does not guarantee future results. The investment return and principal value of an investment will fluctuate so that an investor's shares, when redeemed, may be worth more or less than their original cost. Current performance of the Funds may be lower or higher than the performance quoted. Performance data current to the most recent month end may be obtained by visiting www.gafunds.com.
Total returns reflect a fee waiver in effect and in the absence of this waiver, the total returns would be lower. The Fund imposes a 2% redemption fee on shares held less than 30 days.
The MSCI All Country Far East Free ex-Japan Index (MSCI AC Far East Free ex-Japan Index) is a free float-adjusted, capitalization-weighted index that is designed to measure equity market performance in the Asia region excluding Japan. The index referenced in this chart is not available for investment and does not incur expenses.
18
FUND HIGHLIGHTS at December 31, 2007
GUINNESS ATKINSON ASIA FOCUS FUND
| # of Holdings in Portfolio: | | | 49 | | |
| Portfolio Turnover: | | | 31.2 | % | |
| % of Stocks in Top 10: | | | 30.0 | % | |
| Fund Managers: | |
| Edmund Harriss | |
| Timothy W.N. Guinness | |
| Top 10 Holdings (% of net assets) | |
| IOI Corporation Bhd | | | 3.6 | % | |
| Esprit Holdings, Ltd. | | | 3.2 | % | |
| Digi.Com Bhd | | | 3.2 | % | |
| Yanzhou Coal Mining Co., Ltd. | | | 3.0 | % | |
| PTT PCL | | | 2.9 | % | |
| Wistron Corporation | | | 2.9 | % | |
| CNOOC, Ltd. | | | 2.9 | % | |
| POSCO | | | 2.8 | % | |
| Resorts World Bhd | | | 2.8 | % | |
| International Nickel Indonesia Tbk PT | | | 2.7 | % | |
| Country Breakdown (% of net assets) | |
| Taiwan | | | 19.2 | % | |
| Hong Kong | | | 17.6 | % | |
| China | | | 17.2 | % | |
| South Korea | | | 16.3 | % | |
| Malaysia | | | 9.5 | % | |
| Thailand | | | 8.4 | % | |
| Singapore | | | 6.1 | % | |
| Indonesia | | | 6.0 | % | |
| Sector Breakdown (% of Investments) | |
| Telecommunication Services | | | 9.8 | % | |
| Electronic Components | | | 8.5 | % | |
| Oil & Gas | | | 6.7 | % | |
| Steel-Producers | | | 6.6 | % | |
| Computers | | | 5.8 | % | |
| Non-Ferrous Metals | | | 5.2 | % | |
| Coal | | | 4.2 | % | |
| Transportation | | | 4.0 | % | |
| Semiconductors | | | 3.8 | % | |
| Metal Processors & Fabrication | | | 3.8 | % | |
| Agricultural Operations | | | 3.6 | % | |
| Distribution/Wholesale | | | 3.2 | % | |
| Oil/Integrated | | | 2.9 | % | |
| Entertainment | | | 2.8 | % | |
| Oil Refining & Marketing | | | 2.6 | % | |
| Auto-Cars/Light Trucks | | | 2.5 | % | |
| Electric-Generation | | | 2.5 | % | |
| Diversified Financial Services | | | 2.4 | % | |
| Building & Construction | | | 2.3 | % | |
| Shipbuilding | | | 2.3 | % | |
| Tobacco | | | 2.2 | % | |
| Power Conv/Supply Equip | | | 1.9 | % | |
| Real Estate Operation/Development | | | 1.9 | % | |
| Commercial Banks Non-US | | | 1.8 | % | |
| Oil Exploration & Production | | | 1.8 | % | |
| Networking Products | | | 1.8 | % | |
| Circuit Boards | | | 1.2 | % | |
| Food-Misc/Diversified | | | 1.0 | % | |
| Machinery - General Industry | | | 0.5 | % | |
| Textile-Products | | | 0.4 | % | |
19
SCHEDULE OF INVESTMENTS IN SECURITIES
at December 31, 2007
GUINNESS ATKINSON ASIA FOCUS FUND
| Shares | | COMMON STOCKS: 100.3% | | Value | |
| China: 17.2% | | | |
| | 554,000 | | | Angang Steel Co., Ltd. | | $ | 1,485,188 | | |
| | 596,000 | | | China Shipping Development Co., Ltd. | | | 1,547,627 | | |
| | 178,000 | | | Dongfang Electrical Machinery Co., Ltd. | | | 1,487,502 | | |
| | 422,000 | | | Guangzhou R&F Properties Co., Ltd. | | | 1,480,113 | | |
| | 666,000 | | | Jiangxi Coper Co., Ltd. | | | 1,594,124 | | |
| | 1,088,000 | | | PetroChina Co., Ltd. | | | 1,916,339 | | |
| | 1,450,000 | | | Shenzhen Expressway Co., Ltd. | | | 1,575,027 | | |
| | 1,196,800 | | | Yanzhou Coal Mining Co., Ltd. | | | 2,321,245 | | |
| | | | 13,407,165 | | |
| Hong Kong: 17.6% | | | |
| | 618,000 | | | Chen Hsong Holdings | | | 367,615 | | |
| | 118,000 | | | China Mobile, Ltd. | | | 2,054,910 | | |
| | 1,342,000 | | | CNOOC, Ltd. | | | 2,253,716 | | |
| | 1,752,000 | | | CNPC Hong Kong, Ltd. | | | 1,105,798 | | |
| | 3,098,000 | | | Denway Motors, Ltd. | | | 1,966,694 | | |
| | 171,840 | | | Esprit Holdings, Ltd. | | | 2,530,389 | | |
| | 84,090 | | | HSBC Holdings PLC | | | 1,413,902 | | |
| | 299,000 | | | Kingboard Chemicals Holdings, Ltd. | | | 1,766,408 | | |
| | 1,071,000 | | | Victory City International Holdings | | | 330,948 | | |
| | | | 13,790,380 | | |
| Indonesia: 6.0% | | | |
| | 490,000 | | | Indo Tambangray PT* | | | 985,999 | | |
| | 210,000 | | | International Nickel Indonesia Tbk PT | | | 2,121,685 | | |
| | 1,460,000 | | | Telekomunikasi Indonesia Tbk PT | | | 1,545,614 | | |
| | | | 4,653,298 | | |
| Malaysia: 9.5% | | | |
| | 329,700 | | | Digi.Com Bhd | | | 2,460,361 | | |
| | 1,209,250 | | | IOI Corporation Bhd | | | 2,813,646 | | |
| | 1,872,000 | | | Resorts World Bhd | | | 2,181,694 | | |
| | | | 7,455,701 | | |
| Singapore: 6.1% | | | |
| | 479,000 | | | Indofood Agri Resources, Ltd. | | | 796,090 | | |
| | 896,480 | | | Jurong Technologies Industrial Corporation, Ltd. | | | 269,376 | | |
| | 388,000 | | | Singapore Petroleum Co., Ltd. | | | 2,025,582 | | |
| | 595,650 | | | Singapore Telecommunications, Ltd. | | | 1,638,792 | | |
| | | | 4,729,840 | | |
| South Korea: 16.3% | | | |
| | 5,900 | | | Hyundai Mipo Dockyard* | | | 1,790,997 | | |
| | 14,080 | | | Korea Zinc Co., Ltd.* | | | 1,942,530 | | |
| | 19,920 | | | KT&G Corporation* | | | 1,691,080 | | |
| | 3,650 | | | POSCO | | | 2,205,258 | | |
| | 68,700 | | | Samho International Co., Ltd.* | | | 1,832,060 | | |
| | 2,390 | | | Samsung Electronics Co., Ltd. | | | 1,406,509 | | |
| | 32,610 | | | Shinhan Financial Group., Ltd.* | | | 1,849,796 | | |
| | | | 12,718,230 | | |
The accompanying notes are an integral part of these financial statements.
20
| Shares | | COMMON STOCKS: 100.3% Continued | | Value | |
| Taiwan: 19.2% | | | |
| | 1,142,607 | | | China Steel Corporation | | $ | 1,519,975 | | |
| | 521,626 | | | Compal Electronics, Inc. | | | 567,989 | | |
| | 1,091,723 | | | Coretronic Corporation | | | 1,455,007 | | |
| | 791,040 | | | D-Link Corporation | | | 1,379,049 | | |
| | 283,938 | | | HON HAI Precision Industry Co., Ltd. | | | 1,750,045 | | |
| | 1,723,225 | | | Mitac International Corporation | | | 1,676,055 | | |
| | 477,477 | | | Novatek Microelectronics Corporation, Ltd. | | | 1,810,679 | | |
| | 221,250 | | | Shin Zu Shing Co., Ltd. | | | 1,348,406 | | |
| | 678,553 | | | Taiwan Semiconductor Manufacturing Co., Ltd. | | | 1,286,528 | | |
| | 1,237,172 | | | Wistron Corporation | | | 2,272,292 | | |
| | | | 15,066,025 | | |
| Thailand: 8.4% | | | |
| | 199,500 | | | Electricity Generating PCL | | | 679,637 | | |
| | 1,270,000 | | | Glow Energy | | | 1,263,025 | | |
| | 1,507,000 | | | Hana Microelectronics PCL | | | 966,341 | | |
| | 289,000 | | | PTT Exploration & Production PCL | | | 1,407,036 | | |
| | 204,500 | | | PTT PCL | | | 2,282,678 | | |
| | | | 6,598,717 | | |
| | | | | Total Common Stocks
(cost $55,927,216) | | | 78,419,356 | | |
| | | | | Total Investments in Securities
(cost $55,927,216): 100.3% | | | 78,419,356 | | |
| | | | | Liabilities in Excess of Other Assets: (0.3)% | | | (245,452 | ) | |
| | | | | Net Assets: 100.0% | | $ | 78,173,904 | | |
* Non-income producing security.
The accompanying notes are an integral part of these financial statements.
21
SCHEDULE OF INVESTMENTS BY INDUSTRY
at December 31, 2007
GUINNESS ATKINSON ASIA FOCUS FUND
| Industry | | % of Net Assets | |
| Telecommunication Services | | | 9.8 | % | |
| Electronic Components | | | 8.5 | | |
| Oil & Gas | | | 6.7 | | |
| Steel-Producers | | | 6.7 | | |
| Computers | | | 5.8 | | |
| Non-Ferrous Metals | | | 5.2 | | |
| Coal | | | 4.2 | | |
| Transportation | | | 4.0 | | |
| Semiconductors | | | 4.0 | | |
| Metal Processors & Fabrication | | | 3.8 | | |
| Agricultural Operations | | | 3.6 | | |
| Distribution/Wholesale | | | 3.2 | | |
| Oil/Integrated | | | 2.9 | | |
| Entertainment | | | 2.8 | | |
| Oil Refining & Marketing | | | 2.6 | | |
| Auto-Cars/Light Trucks | | | 2.5 | | |
| Electric-Generation | | | 2.5 | | |
| Diversified Financial Services | | | 2.4 | | |
| Building & Construction | | | 2.3 | | |
| Shipbuilding | | | 2.3 | | |
| Tobacco | | | 2.2 | | |
| Power Conv/Supply Equip | | | 1.9 | | |
| Real Estate Operation/Development | | | 1.9 | | |
| Commercial Banks Non-US | | | 1.8 | | |
| Oil Exploration & Production | | | 1.8 | | |
| Networking Products | | | 1.8 | | |
| Circuit Boards | | | 1.2 | | |
| Food-Misc/Diversified | | | 1.0 | | |
| Machinery - General Industry | | | 0.5 | | |
| Textile-Products | | | 0.4 | | |
| Total Investments in Securities | | | 100.3 | | |
| Liabilities in Excess of Other Assets | | | (0.3 | ) | |
| Net Assets | | | 100.00 | % | |
The accompanying notes are an integral part of these financial statements.
22
ASIA PACIFIC DIVIDEND FUND for the period ended December 31, 2007
1. Performance
AVERAGE ANNUALIZED TOTAL RETURNS
| | | 1 Year
(actual) | | Since
Inception
March 31, 2006 | |
| Fund | | | 26.30 | % | | | 20.95 | % | |
| Benchmark Index (see page 24): | |
| MSCI AC Pacific Ex Japan | | | 34.63 | % | | | 33.63 | % | |
| S&P 500 | | | 5.53 | % | | | 9.48 | % | |
The Fund's gross expense ratio is 17.86% per the Prospectus dated April 30, 2007 Guinness Atkinson Asset Management has contractually agreed to waive a portion of its advisory fees so that the Fund's ratio of expenses to average daily net assets will not exceed 1.98% through at least June 30, 2008. To the extent that the Advisor waives fees it may seek repayment of a portion or all of such amounts at any time within the three fiscal years after the fiscal year in which such amounts were waived, subject to the applicable cap.
Performance data quoted represents past performance and does not guarantee future results. The investment return and principal value of an investment will fluctuate so that an investor's shares, when redeemed, may be worth more or less than their original cost. Current performance of the Funds may be lower or higher than the performance quoted. Performance data current to the most recent month end may be obtained by visiting www.gafunds.com, or calling (800) 916-6566.
The Fund imposes a 2% redemption fee on shares held less than 30 days. Performance data quoted does not reflect the 2% redemption fee on shares held less than 30 days. Total returns reflect a fee waiver in effect and in the absence of this waiver, the total returns would be lower.
The Fund performed well over the full year, returning 26.30%. The emphasis we place on higher yielding stocks leads us toward more conservative investments and thus the under-performance relative the benchmark over the year is to be expected. However, the return was achieved with lower volatility and we expect that the higher dividend payments and cash generation should provide a cushion in more difficult market conditions. The last two months of 2007 however were weak as the credit crunch in the United States began to bite. This led to equity markets selling off hard across the world, and Asia did not escape.
However, we think economic conditions across Asia in fact continue to be relatively good, especially when compared those in the developed world: national finances are healthy with all countries running surpluses, there is abundant liquidity and banks are relatively unexposed to United States sub prime debt. These conditions have led to a strong resurgence of domestic economies both in terms of infrastructure spending by governments and from consumers. While it is too early to say that Asia has decoupled from the United States we can look to domestic economies to provide some support.
Our overweight position in Thailand performed particularly well during the final quarter and this was in part because Thailand is one of the least export oriented economies in the region, and so is expected to be one of the most insulated from a global slowdown, and in part because it seems likely that the tense political situation that has existed there since the coup in September 2006 may soon be resolved. We believe has led foreign investors to start moving back into the market at the very attractive valuations that are on offer.
Indonesia, Malaysia and the Philippines were also relatively strong performers and the Fund benefited from its exposure to rising personal spending with its holdings in higher growth cellular phone businesses. In Hong Kong banking stocks performed particularly well as the Hong Kong interest rates came down in line with those of the United States leading to expectations of asset price inflation and rising mortgage demand.
Dividend payouts have been sustained at more than 40% on a regional basis. Korean payouts remain among the lowest. On a country by country basis, our holdings in Thailand, Taiwan and Singapore paid some of the highest dividends both from high cash generation and from capital restructuring while the Chinese stocks, after a very strong year for share prices had the lowest overall yield but we have been encouraged to see more Chinese companies paying out dividends and that they are moving gradually to increase the proportion of earnings paid out to shareholders.
23
ASIA PACIFIC DIVIDEND FUND
2. Portfolio Position
Geographically, the portfolio has its largest overweight position in Thailand, and is also overweight relative to the index in Hong Kong and Singapore. Its largest underweight position is in Australia, followed by Korea and China. On a sector basis, the fund had overweight positions in Telecoms, Materials and Energy stocks, and had the largest underweight position in Financials and then in Industrials.
3. Outlook
Markets hate uncertainty and the uncertainties now swirling around the world's largest economy mean that we are in for a choppy ride over the next few months. However, we do believe that Asia, while exposed to slower exports, is in a substantively strong position to weather the storm of 2008.
Currently Asian markets are experiencing high volatility as investor sentiment veers between risk aversion leading to funds being taken away from equities and belief in the decoupling theory leading to funds flooding back in. It is our belief that the fundamentally strong domestic demand story in Asia will, eventually, win out.
To this end we are looking at companies with a domestic Asian focus and we continue to like those sectors where demand is most likely to remain strong – energy, resources and industrial materials. Chinese domestic demand is likely to remain buoyant in our view, and while growth is likely to slow it is our opinion that it needs to. We continue to focus on companies that offer value by virtue of strong cash flow and margins and those that are leaders in their sectors.
Asia generally has been willing to increase dividend payments in the years following the financial crisis and technology slump because of favourable cyclical conditions as well as an improved approach to corporate governance. This same period has also been characterised by a period of low corporate investment as companies concentrated on working their existing assets harder and using up spare capacity rather than investing heavily to try and grab market share, at the expense of short term profitability.
The dividend policy that is widespread in Asia is to pay out a proportion of earnings each year rather than focus on an absolute dividend payment per share. This means that dividends will go up and down in line with profits and introduces a cyclical element that we look to minimise. We also have to remember that while company investment levels have remained low there has been excess cash available for distribution. Now there are signs that capacity has grown tighter and the investment cycle may be beginning to turn, if not in the export sector then certainly on the domestic side.
We are alive to these risks to dividends and therefore reiterate that in this Fund we are looking for those businesses that are less cyclical in nature, where additional investment if required is modest in extent and where management have a track record in running a tight business which keeps our confidence in their ability to sustain an income stream. This we believe may provide a cushion for those investors who are looking to participate in the Asian growth story while going some way to mitigating the volatility.

Edmund Harriss January 2008
The Funds invest in foreign securities which will involve political, economic and currency risks, greater volatility, and differences in accounting methods. The Funds are non-diversified meaning their assets may be concentrated in fewer individual holdings than diversified funds. Therefore, the Funds are more exposed to individual stock volatility than diversified funds. The Funds invest in smaller companies, which will involve additional risks such as limited liquidity and greater volatility.
The MSCI All Country Pacific Free ex-Japan Index (MSCI AC Pacific ex-Japan Index) is a free float-adjusted, capitalization-weighted index that is designed to measure equity market performance in the Pacific region including Japan. The Standard & Poor's 500 Index is a market-capitalization weighted index composed of 500 widely held common stocks of U.S. companies. These indices are unmanaged, not available for investment and do not incur expenses.
Cash flow measures the cash generating capability of a company by adding non-cash charges (e.g. depreciation) and interest expense to pre-tax income.
Please refer to the Schedule of Investments for details on fund holdings.
The information provided herein represents the opinion of Guinness Atkinson Management for the period stated and is not intended to be a forecast of future events, a guarantee of future results, nor investment advice. Opinions, fund holdings and sector allocations are subject to change at any time are not recommendations to buy or sell any security.
24
ASIA PACIFIC DIVIDEND FUND
Growth of $10,000

Total Return
Periods Ended December 31, 2007
| One Year | | Since Inception
(03/31/06) | |
| | 26.30 | % | | | 20.95 | % | |
Performance data quoted represents past performance and does not guarantee future results. The investment return and principal value of an investment will fluctuate so that an investor's shares, when redeemed, may be worth more or less than their original cost. Current performance of the Funds may be lower or higher than the performance quoted. Performance data current to the most recent month end may be obtained by visiting www.gafunds.com.
Total returns reflect a fee waiver in effect and in the absence of this waiver, the total returns would be lower. The Fund imposes a 2% redemption fee on shares held less than 30 days.
The MSCI All Country Pacific Free ex-Japan Index (MSCI AC Pacific ex-Japan Index) is a free float-adjusted, capitalization-weighted index that is designed to measure equity market performance in the Pacific region including Japan.
25
FUND HIGHLIGHTS at December 31, 2007
GUINNESS ATKINSON ASIA PACIFIC DIVIDEND FUND
| # of Holdings in Portfolio: | | | 41 | | |
| Portfolio Turnover: | | | 40.4 | % | |
| % of Stocks in Top 10: | | | 27.8 | % | |
| Fund Managers: | |
| Edmund Harriss | |
| Timothy W.N. Guinness | |
| Top 10 Holdings (% of net assets) | |
| Modern Beauty Salon Holdings, Ltd. | | | 3.1 | % | |
| Globe TeleCom, Inc. | | | 2.8 | % | |
| China Steel Corporation | | | 2.8 | % | |
| U-Ming Marine Transport Corporation | | | 2.8 | % | |
| Singapore TeleCommunications, Ltd. | | | 2.8 | % | |
| Esprit Holdings, Ltd. | | | 2.7 | % | |
| PTT Chemical PCL | | | 2.7 | % | |
| OneSteel, Ltd. | | | 2.7 | % | |
| PTT PCL | | | 2.7 | % | |
| CLP Holdings, Ltd. | | | 2.7 | % | |
| Country Breakdown (% of net assets) | |
| Thailand | | | 20.8 | % | |
| Hong Kong | | | 18.6 | % | |
| Taiwan | | | 17.5 | % | |
| Singapore | | | 10.5 | % | |
| China | | | 10.2 | % | |
| South Korea | | | 7.6 | % | |
| Australia | | | 5.2 | % | |
| Philippines | | | 2.9 | % | |
| Malaysia | | | 2.6 | % | |
| New Zealand | | | 2.5 | % | |
| Indonesia | | | 2.5 | % | |
| Sector Breakdown (% of Investments) | |
| Telecommunication Services | | | 15.6 | % | |
| Commercial Banks Non-US | | | 15.4 | % | |
| Steel-Producers | | | 7.2 | % | |
| Electronic Components | | | 5.0 | % | |
| Oil Refining & Marketing | | | 5.0 | % | |
| Transportation | | | 4.8 | % | |
| Semiconductors | | | 4.5 | % | |
| Retail | | | 3.0 | % | |
| Distribution/Wholesale | | | 2.7 | % | |
| Petrochemicals | | | 2.7 | % | |
| Oil/Integrated | | | 2.7 | % | |
| Electric-Integrated | | | 2.7 | % | |
| Chemicals-Plastics | | | 2.6 | % | |
| Finance-Commercial | | | 2.6 | % | |
| Auto/Truck Parts & Equipment Replacement | | | 2.6 | % | |
| Electric-Generation | | | 2.5 | % | |
| Networking Products | | | 2.5 | % | |
| Tobacco | | | 2.5 | % | |
| Agricultural Chemicals | | | 2.5 | % | |
| Circuit Boards | | | 2.4 | % | |
| Food-Meat Products | | | 2.3 | % | |
| Computers | | | 2.2 | % | |
| Coal | | | 2.1 | % | |
| Oil & Gas | | | 1.9 | % | |
26
SCHEDULE OF INVESTMENTS IN SECURITIES
at December 31, 2007
GUINNESS ATKINSON ASIA PACIFIC DIVIDEND FUND
| Shares | | COMMON STOCKS: 100.9% | | Value | |
| Australia: 5.2% | | | |
| | 7,700 | | | Incitec Pivot, Ltd. | | $ | 786,170 | | |
| | 159,740 | | | Onesteel, Ltd. | | | 856,725 | | |
| | | | 1,642,895 | | |
| China: 10.2% | | | |
| | 231,801 | | | Angang Steel Co., Ltd. | | | 621,422 | | |
| | 246,000 | | | China Shipping Development Co., Ltd. | | | 638,786 | | |
| | 951,000 | | | People's Food Holdings, Ltd. | | | 724,146 | | |
| | 346,000 | | | PetroChina Co., Ltd. | | | 609,424 | | |
| | 340,000 | | | Yanzhou Coal Mining Co., Ltd. | | | 659,444 | | |
| | | | 3,253,222 | | |
| Hong Kong: 18.6% | | | |
| | 294,500 | | | BOC Hong Kong Holdings, Ltd. | | | 816,567 | | |
| | 125,500 | | | CLP Holdings, Ltd. | | | 852,649 | | |
| | 59,000 | | | Esprit Holdings, Ltd. | | | 868,791 | | |
| | 9,400 | | | HSBC Holdings PLC - ADR | | | 786,874 | | |
| | 313,000 | | | Industrial and Commercial Bank of China (Asia), Ltd. | | | 835,618 | | |
| | 38,555 | | | Industrial and Commercial Bank of China (Asia), Ltd. Warrants* | | | 15,575 | | |
| | 2,050,000 | | | Modern Beauty Salon Holdings, Ltd. | | | 975,280 | | |
| | 103,000 | | | Vtech Holdings, Ltd. | | | 732,306 | | |
| | | | 5,883,660 | | |
| Indonesia: 2.5% | | | |
| | 742,500 | | | Telekomunikasi Indonesia Tbk PT | | | 786,040 | | |
| Malaysia: 2.6% | | | |
| | 112,000 | | | Digi.Com Bhd | | | 835,791 | | |
| New Zealand: 2.5% | | | |
| | 129,800 | | | New Zealand Refining Co., Ltd. | | | 801,677 | | |
| Philippines: 2.9% | | | |
| | 23,830 | | | Globe Telecom, Inc. | | | 901,532 | | |
| Singapore: 10.5% | | | |
| | 2,728,700 | | | Jurong Technologies Industrial Corporation, Ltd. | | | 819,924 | | |
| | 154,000 | | | Singapore Petroleum Co., Ltd. | | | 803,968 | | |
| | 317,000 | | | Singapore Telecommunications, Ltd. | | | 872,152 | | |
| | 62,000 | | | United Overseas Bank, Ltd. | | | 849,110 | | |
| | | | 3,345,154 | | |
| South Korea: 7.6% | | | |
| | 11,140 | | | Kookmin Bank* | | | 821,174 | | |
| | 9,430 | | | KT&G Corporation* | | | 800,547 | | |
| | 1,320 | | | POSCO | | | 797,518 | | |
| | | | 2,419,239 | | |
The accompanying notes are an integral part of these financial statements.
27
| Shares | | COMMON STOCKS: 100.9% Continued | | Value | |
| Taiwan: 17.5% | | | |
| | 672,247 | | | China Steel Corporation | | $ | 894,269 | | |
| | 661,282 | | | Compal Electronics, Inc. | | | 720,058 | | |
| | 236,400 | | | Depo Auto Parts Industrial Co., Ltd. | | | 818,573 | | |
| | 461,000 | | | D-Link Corporation | | | 803,678 | | |
| | 572,223 | | | Greatek Electronics, Inc. | | | 694,013 | | |
| | 194,479 | | | Novatek Microelectronics Corporation, Ltd. | | | 737,499 | | |
| | 326,000 | | | U-Ming Marine Transport Corporation | | | 890,521 | | |
| | | | 5,558,611 | | |
| Thailand: 20.8% | | | |
| | 1,217,500 | | | Delta Electronics (Thailand) PCL | | | 787,932 | | |
| | 811,000 | | | Glow Energy | | | 806,546 | | |
| | 1,215,400 | | | Hana Microelectronics PCL | | | 779,357 | | |
| | 2,724,900 | | | Krung Thai Bank PCL | | | 832,198 | | |
| | 234,700 | | | PTT Chemical PCL | | | 863,969 | | |
| | 76,400 | | | PTT PCL | | | 852,795 | | |
| | 1,426,400 | | | Thai Plastic & Chemical PCL | | | 842,671 | | |
| | 1,900,200 | | | Thanachart Captial PCL | | | 823,599 | | |
| | | | 6,589,067 | | |
| | | | | Total Common Stocks
(cost $31,200,972) | | | 32,016,888 | | |
| | | | | Total Investments in Securities
(cost $31,200,972): 100.9% | | | 32,016,888 | | |
| | | | | Liabilities in Excess of Other Assets: (0.9)% | | | (266,009 | ) | |
| | | | | Net Assets: 100.0% | | $ | 31,750,879 | | |
* Non-income producing security.
ADR American Depository Receipt
The accompanying notes are an integral part of these financial statements.
28
SCHEDULE OF INVESTMENTS BY INDUSTRY
at December 31, 2007
GUINNESS ATKINSON ASIA PACIFIC DIVIDEND FUND
| Industry | | % of Net Assets | |
| Telecommunication Services | | | 15.7 | % | |
| Commercial Banks Non-US | | | 15.6 | | |
| Steel-Producers | | | 7.3 | | |
| Electronic Components | | | 5.1 | | |
| Oil Refining & Marketing | | | 5.1 | | |
| Transportation | | | 4.8 | | |
| Semiconductors | | | 4.5 | | |
| Retail | | | 3.1 | | |
| Distribution/Wholesale | | | 2.7 | | |
| Petrochemicals | | | 2.7 | | |
| Oil/Integrated | | | 2.7 | | |
| Electric-Integrated | | | 2.7 | | |
| Chemicals-Plastics | | | 2.7 | | |
| Finance-Commercial | | | 2.6 | | |
| Auto/Truck Parts & Equipment Replacement | | | 2.6 | | |
| Electric-Generation | | | 2.5 | | |
| Networking Products | | | 2.5 | | |
| Tobacco | | | 2.5 | | |
| Agricultural Chemicals | | | 2.5 | | |
| Circuit Boards | | | 2.4 | | |
| Food-Meat Products | | | 2.3 | | |
| Computers | | | 2.3 | | |
| Coal | | | 2.1 | | |
| Oil & Gas | | | 1.9 | | |
| Total Investments in Securities | | | 100.9 | | |
| Liabilities in Excess of Other Assets | | | (0.9 | ) | |
| Net Assets | | | 100.00 | % | |
The accompanying notes are an integral part of these financial statements.
29
CHINA & HONG KONG FUND for the period ended December 31, 2007
1. Performance
AVERAGE ANNUALIZED TOTAL RETURNS
| | | 1 Year
(actual) | | 3 Years | | 5 Years | | 10 Years | |
| Fund | | | 65.06 | % | | | 34.94 | % | | | 35.43 | % | | | 14.82 | % | |
| Benchmark Index (see page 31): | |
| Hang Seng Composite | | | 44.69 | % | | | 33.16 | % | | | 32.74 | % | | | N/A | | |
| Hang Seng | | | 43.22 | % | | | 29.24 | % | | | 28.95 | % | | | 13.65 | % | |
| S&P 500 | | | 5.49 | % | | | 8.61 | % | | | 12.81 | % | | | 5.90 | % | |
The Fund's gross expense ratio is 1.59% per the Prospectus dated April 30, 2007. Guinness Atkinson Asset Management has contractually agreed to waive a portion of its advisory fees so that the Fund's ratio of expenses to average daily net assets will not exceed 1.98% through at least June 30, 2008. To the extent that the Advisor waives fees it may seek repayment of a portion or all of such amounts at any time within the three fiscal years after the fiscal year in which such amounts were waived, subject to the applicable cap.
Performance data quoted represents past performance and does not guarantee future results. The investment return and principal value of an investment will fluctuate so that an investor's shares, when redeemed, may be worth more or less than their original cost. Current performance of the Funds may be lower or higher than the performance quoted. Performance data current to the most recent month end may be obtained by visiting www.gafunds.com, or calling (800) 916-6566.
The Fund imposes a 2% redemption fee on shares held less than 30 days. Performance data quoted does not reflect the 2% redemption fee on shares held less than 30 days. Total Returns for prior period reflect a fee waiver in effect and in the absence of this waiver, total returns would be lower.
This past year has been another strong one for China and Hong Kong stocks. Chinese stocks listed in Hong Kong, which is where the Fund invests the bulk of its assets, rose on the back of continued strong economic growth and on the back of rising stock markets in Shanghai and Shenzhen. Expectations later in the year that Mainland Chinese investors would be allowed to invest in Hong Kong-listed stocks pushed prices up further although they fell back as the plan appeared to stall. In spite of the weakness at the end of the year the Fund performed well over the year returning over 65%.
We think strong economic growth in China continues to present opportunities and problems to investors and policymakers alike. Strong investment growth has increased demand for oil and coal and also for raw materials. Companies in these sectors including oil and coal producers, copper and aluminium smelters and steel and cement producers have all had a good year. Transportation companies have also seen good growth on the back of this demand.
However, faster demand growth has also been accompanied by rising costs of materials, of labor and of land. Increasing food costs have also been evident in the second half of the year. Food accounts a third of the inflation basket reflecting its high relative importance to consumers. A prolonged period of rising food and housing costs may start to feed into inflation expectations. This makes for a tough environment for manufacturers who are faced with rising costs which they are unable to pass on into a highly competitive domestic market. Export manufacturers have met with more success in raising prices but in a weakening external environment they too may find life becoming harder.
In our view, economic growth in China has been given extra impetus in the last two years by excess liquidity in the system caused in part by strong exports but more importantly by comparatively weaker demand for imports of heavy industrial goods. The resulting growth in China's trade surplus has increased the pool of liquidity in China which the Central Bank has sought to neutralize. Thus in the course of 2007 we have seen a steady increase in interest rates and a steady increase in the commercial banks' reserve requirement (money that must be deposited with Central bank and thus is not available to lend). Policy therefore has been geared toward mopping up liquidity and preventing growth from accelerating but there has not been a move to tighten policy across the economy.
We think Hong Kong has benefited from the spill over effects of Chinese growth. Hong Kong's economy has been boosted by higher trade activity, buoyant capital markets activity with a steady stream of Chinese companies seeking a stock market listing as well as from higher tourist arrivals. Lower US interest rates, mirrored by lower Hong Kong interest rates under the currency board system meant good performance by the banks and property companies in Hong Kong.
30
CHINA & HONG KONG FUND
2. Portfolio Position
At year end, 67% of the portfolio was invested in China, with a mix of H shares, red chips and China plays. The balance is invested in Hong Kong companies which have a degree of exposure to China but also to other parts of the world. We prefer to invest in companies traded on the Hong Kong Stock Exchange because of the broad range of choice. Hong Kong-listed stocks also trade more cheaply than those listed in Shanghai and Shenzhen as well as offering greater liquidity and transparency of information. Across sectors the portfolio is concentrated in energy and resources, materials and industrial stocks.
3. Outlook & Strategy
We believe the outlook for the Chinese and Hong Kong economies is pretty good, with plenty of liquidity in the system and growing domestic demand. In our view, a slow down in the US will be hard for Chinese exporters but could still help China by bringing down foreign exchange inflows and help bring excess liquidity under control. This would then serve to slow economic growth and reduce some of the inflationary pressures.
We would expect that an external slowdown will have some effect on Chinese growth, but not so much on the domestic side. China's trade exposure has not changed much over the past five years and employs around 7% of the workforce and accounts for around 5% of fixed asset investment. We would expect that slower exports could cut as much as 1.5% from overall economic growth but that this will come from the net export contribution and not from the domestic side. This then has implications for how we invest the Fund in the coming year.
We have highlighted that rising costs for domestic manufacturers cannot be passed through to domestic customers because of intense competition. It is likely that slower exports demand will result in similar problems for export manufacturers. However, infrastructure investment in power, transport links, water supply and energy resources remains as strong as ever. Indeed with recent reports of fuel shortages and supply bottlenecks, the need for more investment is pressing.
Inflation is a concern in coming months. Although it has so far been limited to food prices, and specifically to pork and poultry, while core inflation has remained much lower, it did jump to 1.4% in November from less than 1%. This is still a far cry from the situation in 1995-6 when high inflation sparked aggressive tightening measures and China is a very different place from ten years ago. Nevertheless, rigidities still exist between the regulated sectors including banking, electricity and refined product prices and the rest of the economy which is market driven.
We continue to focus our attention on investing in companies that are in a stronger position to set prices, protect margins and are strong cash generators.

Edmund Harriss January 2008
The Funds invest in foreign securities which will involve political, economic and currency risks, greater volatility, and differences in accounting methods. The Funds are non-diversified meaning their assets may be concentrated in fewer individual holdings than diversified funds. Therefore, the Funds are more exposed to individual stock volatility than diversified funds. The Funds invest in smaller companies, which will involve additional risks such as limited liquidity and greater volatility.
The Hang Seng Composite Index is a market-capitalization weighted index that comprises the top 200 companies listed on the Hong Kong Stock Exchange, based on the average market-capitalization for the past twelvemonths. The Hang Seng Composite Index commenced on January 3, 2000 and therefore does not have five-year returns or returns since the Fund's inception. The Hang Seng Index is a barometer of the Hong Kong Stock Market whose aggregate market capitalization accounts for about 70% of the total market-capitalization of the Stock Exchange of Hong Kong Limited. The Standard & Poor's 500 Index is a market-capitalization weighted index composed of 500 widely held common stocks of U.S. companies. These indices are unmanaged, not available for investment and do not incur expenses.
Please refer to the Schedule of Investments for details on fund holdings.
The information provided herein represents the opinion of Guinness Atkinson Management for the period stated and is not intended to be a forecast of future events, a guarantee of future results, nor investment advice. Opinions, fund holdings and sector allocations are subject to change at any time and are not recommendations to buy or sell any security.
31
CHINA & HONG KONG FUND
Growth of $10,000
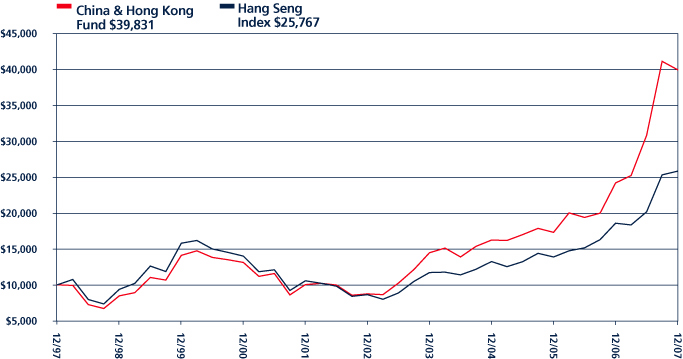
Average Annual Total Return
Periods Ended December 31, 2007
| One Year | | Five Years | | Ten Years | |
| | 65.06 | % | | | 35.43 | % | | | 14.82 | % | |
Performance data quoted represents past performance and does not guarantee future results. The investment return and principal value of an investment will fluctuate so that an investor's shares, when redeemed, may be worth more or less than their original cost. Current performance of the Funds may be lower or higher than the performance quoted. Performance data current to the most recent month end may be obtained by visiting www.gafunds.com.
Total returns reflect a fee waiver in effect and in the absence of this waiver, the total returns would be lower. The Fund imposes a 2% redemption fee on shares held less than 30 days.
The Hang Seng Composite Index is a market-capitalization weighted index that comprises the top 200 companies listed on the Hong Kong Stock Exchange, based on the average market capitalization for the past twelve months. The Fund changed its benchmark from the Hang Seng to the Hang Seng Composite Index to more accurately reflect the market sectors in which the Fund invests. The Hang Seng Composite Index commenced on 01/31/00. The index referenced in this chart is not available for investment and does not incur expenses.
32
FUND HIGHLIGHTS at December 31, 2007
GUINNESS ATKINSON CHINA & HONG KONG FUND
| # of Holdings in Portfolio: | | | 49 | | |
| Portfolio Turnover: | | | 10.0 | % | |
| % of Stocks in Top 10: | | | 46.8 | % | |
| Fund Managers: | |
| Edmund Harriss | |
| Timothy W.N. Guinness | |
| Top 10 Holdings (% of net assets) | |
| China Mobile, Ltd. | | | 7.0 | % | |
| CNOOC, Ltd. | | | 6.3 | % | |
| Angang Steel Co., Ltd. | | | 5.7 | % | |
| PetroChina Co., Ltd. | | | 5.0 | % | |
| Yanzhou Coal Mining Co., Ltd. | | | 4.4 | % | |
| China Shipping Container Lines Co., Ltd. | | | 4.0 | % | |
| Dongfang Electrical Machinery Co., Ltd. | | | 3.7 | % | |
| Midland Holdings, Ltd. | | | 3.6 | % | |
| HSBC Holdings PLC | | | 3.6 | % | |
| Hang Seng Bank | | | 3.5 | % | |
| Country Breakdown (% of net assets) | |
| Hong Kong | | | 58.9 | % | |
| China | | | 36.1 | % | |
| United States | | | 2.8 | % | |
| Cayman Islands | | | 1.4 | % | |
| Singapore | | | 0.2 | % | |
| Sector Breakdown (% of Investments) | |
| Real Estate Operation/Development | | | 12.9 | % | |
| Oil & Gas | | | 12.6 | % | |
| Commercial Banks Non-US | | | 11.9 | % | |
| Telecommunication Services | | | 9.3 | % | |
| Transportation | | | 7.9 | % | |
| Diversified Operations | | | 7.1 | % | |
| Steel-Producers | | | 5.7 | % | |
| Coal | | | 4.5 | % | |
| Power Conv/Supply Equip | | | 3.7 | % | |
| Distribution/Wholesale | | | 3.4 | % | |
| Metal Processors & Fabrication | | | 3.3 | % | |
| Petrochemicals | | | 2.8 | % | |
| Computers | | | 2.8 | % | |
| Auto-Cars/Light Trucks | | | 2.8 | % | |
| Electronic Components | | | 2.6 | % | |
| Batteries/Battery System | | | 1.9 | % | |
| Agricultural Operations | | | 1.2 | % | |
| Electric-Integrated | | | 1.0 | % | |
| Water Treatment Systems | | | 0.7 | % | |
| Machinery-General Industry | | | 0.7 | % | |
| Textile-Products | | | 0.6 | % | |
| Retail | | | 0.6 | % | |
| Medical-Drugs | | | 0.0 | % | |
33
SCHEDULE OF INVESTMENTS IN SECURITIES
at December 31, 2007
GUINNESS ATKINSON CHINA & HONG KONG FUND
| Shares | | COMMON STOCKS: 99.4% | | Value | |
| Agricultural Operations: 1.2% | | | |
| | 4,033,800 | | | Chaoda Modern Agriculture | | $ | 3,608,780 | | |
| Auto – Cars/Light Trucks: 2.8% | | | |
| | 12,872,000 | | | Denway Motors, Ltd. | | | 8,171,493 | | |
| Batteries/Battery System: 1.9% | | | |
| | 857,000 | | | BYD Co., Ltd. | | | 5,593,601 | | |
| Coal: 4.5% | | | |
| | 81,000 | | | China Coal Energy Co. | | | 249,751 | | |
| | 6,653,200 | | | Yanzhou Coal Mining Co., Ltd. | | | 12,904,164 | | |
| | | | 13,153,915 | | |
| Commercial Banks: 11.8% | | | |
| | 498,000 | | | Hang Seng Bank | | | 10,193,907 | | |
| | 324,650 | | | Dah Sing Financial Holdings, Ltd. | | | 3,195,158 | | |
| | 2,842,000 | | | BOC Hong Kong Holdings, Ltd. | | | 7,880,078 | | |
| | 632,486 | | | HSBC Holdings PLC | | | 10,634,718 | | |
| | 188,400 | | | Wing Hang Bank, Ltd. | | | 2,804,507 | | |
| | | | 34,708,368 | | |
| Computers: 2.8% | | | |
| | 9,310,000 | | | Lenovo Group, Ltd. | | | 8,174,618 | | |
| Distribution/Wholesale: 3.4% | | | |
| | 671,071 | | | Esprit Holdings, Ltd. | | | 9,881,698 | | |
| Diversified Operations: 6.9% | | | |
| | 893,000 | | | Shanghai Industrial Holdings, Ltd. | | | 3,861,257 | | |
| | 249,500 | | | Swire Pacific, Ltd. - Class A | | | 3,418,927 | | |
| | 3,724,000 | | | Tianjin Development Holdings, Ltd. | | | 4,384,595 | | |
| | 1,675,000 | | | Wharf Holdings, Ltd. | | | 8,664,809 | | |
| | | | 20,329,588 | | |
| Electric – Integrated: 1.0% | | | |
| | 431,000 | | | CLP Holdings, Ltd. | | | 2,928,221 | | |
| Electronics: 2.6% | | | |
| | 1,278,000 | | | Kingboard Chemicals Holdings, Ltd. | | | 7,550,066 | | |
| | 43,181 | | | Kingboard Laminates Holding, Ltd. | | | 28,818 | | |
| | | | 7,578,884 | | |
| Machinery – Diversified: 0.7% | | | |
| | 3,510,000 | | | Chen Hsong Holdings, Ltd. | | | 2,087,911 | | |
| Medical – Drugs: 0.0% | | | |
| | 1,240,000 | | | Far East Pharmaceutical Technology*†^ | | | — | | |
| Metal – Processors & Fabercations: 3.2% | | | |
| | 3,945,000 | | | Jiangxi Copper Co., Ltd. | | | 9,442,673 | | |
The accompanying notes are an integral part of these financial statements.
34
| Shares | | COMMON STOCKS: 99.4% Continued | | Value | |
| Oil & Gas: 12.6% | | | |
| | 10,957,000 | | | CNOOC, Ltd. | | $ | 18,400,872 | | |
| | 6,210,000 | | | CNPC Hong Kong, Ltd. | | | 3,919,524 | | |
| | 8,256,000 | | | PetroChina Co., Ltd. | | | 14,541,632 | | |
| | | | 36,862,028 | | |
| Petrochemicals: 2.8% | | | |
| | 5,570,000 | | | China Petroleum & Chemical Corporation | | | 8,257,237 | | |
| Power Conversion/Supply Equipment: 3.7% | | | |
| | 1,284,000 | | | Dongfang Electrical Machinery Co., Ltd. | | | 10,730,072 | | |
| Real Estate: 12.8% | | | |
| | 1,628,000 | | | Guangzhou R&F Properties Holdings, Ltd. | | | 5,710,008 | | |
| | 748,000 | | | Hopewell Holdings, Ltd. | | | 3,429,495 | | |
| | 6,878,000 | | | Midland Holdings, Ltd. | | | 10,732,536 | | |
| | 2,409,000 | | | Sino Land Co. | | | 8,435,821 | | |
| | 3,876,000 | | | Soho China, Ltd.* | | | 4,001,565 | | |
| | 1,774,000 | | | Wheelock & Co., Ltd. | | | 5,431,997 | | |
| | | | 37,741,422 | | |
| Retail: 0.6% | | | |
| | 698,000 | | | Glorious Sun Enterprise, Ltd. | | | 422,945 | | |
| | 2,560,000 | | | Modern Beauty Salon Holdings, Ltd. | | | 1,217,911 | | |
| | | | 1,640,856 | | |
| Steel Producers: 5.7% | | | |
| | 6,234,000 | | | Angang New Steel Co., Ltd. | | | 16,712,382 | | |
| Telecommunications: 9.3% | | | |
| | 1,183,000 | | | China Mobile, Ltd. | | | 20,601,348 | | |
| | 919,000 | | | Vtech Holdings, Ltd. | | | 6,533,877 | | |
| | | | 27,135,225 | | |
| Textiles: 0.6% | | | |
| | 5,512,000 | | | Victory City International Holdings, Ltd. | | | 1,703,254 | | |
| Transportation: 7.8% | | | |
| | 4,510,000 | | | China Shipping Container Lines Co., Ltd. | | | 11,711,072 | | |
| | 5,162,550 | | | China Shipping Development Co., Ltd. | | | 2,997,793 | | |
| | 925,000 | | | Cosco Pacific, Ltd. | | | 2,436,460 | | |
| | 5,204,000 | | | Shenzhen Expressway Co., Ltd. | | | 5,652,718 | | |
| | 235,050 | | | Tianjin Port Development Holdings, Ltd. | | | 177,348 | | |
| | | | 22,975,391 | | |
| Water Treatment Systems: 0.7% | | | |
| | 2,628,000 | | | Bio-Treat Technology, Ltd. | | | 1,410,313 | | |
| | 1,126,000 | | | Sinomem Technology, Ltd. | | | 690,619 | | |
| | | | 2,100,932 | | |
| | | | | Total Common Stocks
(cost $166,021,148) | | | 291,518,549 | | |
| Warrants: 0.1% | | | |
| | 209,375 | | | Wharf Holdings, Ltd. | | | 287,315 | | |
| | 8,930 | | | Wing Fat Print* | | | — | | |
| | 100 | | | Surface Mount Technology Holdings, Ltd.* | | | — | | |
| | | | 287,315 | | |
| | | | | Total Investments in Securities
(cost $166,021,148): 99.5% | | | 291,805,864 | | |
| | | | | Other Assets less Liabilities: 0.5% | | | 1,358,604 | | |
| | | | | Net Assets: 100.0% | | $ | 293,164,468 | | |
* Non-income producing security.
^ Fair valued under direction of the Board of Trustees.
† Illiquid
The accompanying notes are an integral part of these financial statements.
35
GLOBAL ENERGY FUND
1. Performance
AVERAGE ANNUALIZED TOTAL RETURNS
| | | 1 Year
(Actual) | | 3 Year | | Since
Inception
June 30, 2004 | |
| Fund | | | 37.25 | % | | | 35.20 | % | | | 37.02 | % | |
| Benchmark Index (see page 39): | |
| S&P 500 | | | 5.46 | % | | | 26.11 | % | | | 9.48 | % | |
| MSCI World Energy Index | | | 30.67 | % | | | 8.61 | % | | | 27.69 | % | |
Source: Bloomberg
The Fund's gross expense ratio is 1.38% per the Prospectus dated April 30, 2007. Guinness Atkinson Asset Management has contractually agreed to waive a portion of its advisory fees so that the Fund's ratio of expenses to average daily net assets will not exceed 1.45% through at least June 30, 2008. To the extent that the Advisor waives fees it may seek repayment of a portion or all of such amounts at any time within the three fiscal years after the fiscal year in which such amounts were waived, subject to the applicable cap.
Performance data quoted represents past performance and does not guarantee future results. The investment return and principal value of an investment will fluctuate so that an investor's shares, when redeemed, may be worth more or less than their original cost. Current performance of the Funds may be lower or higher than the performance quoted. Performance data current to the most recent month end may be obtained by visiting www.gafunds.com, or calling (800) 916-6566.
The Fund imposes a 2% redemption fee on shares held less than 30 days. Performance data quoted does not reflect the 2% redemption fee on shares held less than 30 days. Total Returns for prior period reflect a fee waiver in effect and in the absence of this waiver, total returns would be lower.
The Global Energy Fund over the course of 2007 produced a total return of 37.25%. This was a pleasing return, especially when compared to the MSCI World Energy Index which returned 30.67% and the S&P 500 Index which returned 5.46%. Moreover, the Fund is still some way ahead of both indices since inception, as shown in the table above.
2. Activity
The changes to the portfolio were concentrated in January and July. In January 2007 we sold Marathon Oil, an integrated United States company which had gone up 55% in 2006, and replaced it with Statoil, the Norwegian national oil and gas company. We felt that Statoil's purchase of Norsk Hydro's oil and gas assets in December gave them a strong platform for future growth, and at 9.5 X 2007 earnings the stock looked cheap. We also switched out of Petrochina and into CNOOC. Petrochina was up 81% in 2006, and the long term price ratio of the two stock prices had moved from 1.2 to 1 at the start of the year to around 1.5 to 1 in early 2007. Finally, we took profits on our small research holding in China Coal, which had gone up 40% since the IPO.
We made some more significant changes to the portfolio in July. We sold our two independent refiners, Tesoro and Sunoco, which had both performed strongly on the back of high refining margins which we felt were unsustainable. We also sold CNOOC, which was up almost 40% year to date, buoyed by very strong Asian equity markets. In their place we bought Exxon Mobil, Total and ENI. The Integrated sector had underperformed the MSCI World Energy Index year to date and trading at between 10 and 12.5x 2007 earnings we thought these three represented excellent value.
Further to these changes we also altered the weightings within the portfolio. We increased our holdings in 9 integrated companies to 1.22 of a unit, because the group was trading at a significant discount to the broad market and we felt that this gap would narrow. We also thought that they would offer significant downside protection if there was a marked move down in the oil price which was then around $75. The nine integrated companies were BP, ENI, Royal Dutch Shell, Total, Statoil, Chevron, Conoco Phillips, Exxon and Occidental.
We also lightened our exposure to the weak United States natural gas price by trimming our gas levered positions to 2/3 of a unit. These companies were Anadarko, Apache, Pioneer, Patterson, Peabody and Encana. Peabody's exposure is by virtue of the fact that when gas gets very cheap there is fuel switching away from coal.
36
GLOBAL ENERGY FUND
We made one further change to the portfolio at the end of 2007, selling our half unit of Canadian Oil Sands Trust in December. We felt that the oil price was at the high end of its likely trading range – a sensible moment to lighten up exposure to oil price sensitive sectors such as Canadian oil sands. This stock had performed well and was the most highly valued on discounted cash flow metrics versus its peers.
The merger of Transocean and Global SantaFe, in which we held a position, was completed at the end of November. We have maintained our position in the new company following the completion of this merger.
3. Portfolio Position
The Portfolio at December 31, 2007 consisted of 29 core holdings comprising just over 97% of the portfolio (ignoring cash) and 9 "research" holdings in small cap stocks comprising in aggregate a little under 3%. Of the 29 core holdings, 12 were whole units, 9 were 1.22 of a unit, 6 were 0.67 of a unit, one was a half unit (Suncor) and one was split one third Hercules, one third Unit Corp, and one third Ensign.
The invested fund at December 31, 2007 was on a Price Earnings Ratio (2007) of 13.9X (13.5X 2006) with a median PER (2007) of stocks held of 13.3X. By comparison the S&P 500 Index at 1468.36 was on a PER of 19.1X (2007) based on S&P500 earnings per share estimates of 76.82 for 2007.
The better performing holdings over the year were Petrobras, Hess, Transocean, Apache, Occidental, Peabody, Imperial Oil and Anadarko, all of which returned over 50%. Petrobras and Hess were both up over 100%, both as beneficiaries of the potential 8 billion barrel Tupi discovery offshore Brazil. The worst performing holdings were Patterson-UTI, Hercules, Unit, Ensign, and Opti Canada. The first four of these are United States-focused drillers and thus highly sensitive to the United States gas price, which was relatively weak again, averaging $6.91 per Mcf for the year.
The Sector and Geographic weightings of the portfolio (ignoring cash) at December 31st were as follows:
| Sector Breakdown | |
| | | Dec 31 2006 | | Dec 31 2007 | |
| Integrated | | | 23.6 | | | | 42.4 | | |
| E&P/Refining | | | 6.7 | | | | 4.8 | | |
| Sub Total Integrated | | | 30.3 | | | | 47.2 | | |
| Emerging Markets | | | 10.8 | | | | 10.5 | | |
| Sub Total Emerging Markets | | | 10.8 | | | | 10.5 | | |
| E&P Oil Sands | | | 18.0 | | | | 13.9 | | |
| E&P | | | 17.6 | | | | 15.5 | | |
| Sub Total E&P | | | 35.6 | | | | 29.4 | | |
| Oil Services & Equipment | | | 13.3 | | | | 10.6 | | |
| Refining | | | 6.7 | | | | — | | |
| Coal | | | 3.3 | | | | 2.3 | | |
| Total | | | 100.0 | | | | 100.0 | | |
37
GLOBAL ENERGY FUND
| Geographic Breakdown | |
| | | Dec 31 2006 | | Dec 31 2007 | |
| US | | | 55.9 | | | | 48.2 | | |
| Canada | | | 22.8 | | | | 18.9 | | |
| UK | | | 7.1 | | | | 8.2 | | |
| Latin America | | | 3.4 | | | | 5.7 | | |
| Europe | | | 3.6 | | | | 14.3 | | |
| China | | | 3.6 | | | | 0.3 | | |
| South Africa | | | 3.3 | | | | 3.9 | | |
| Other | | | 0.3 | | | | 0.5 | | |
| | | | 100.0 | | | | 100.0 | | |
There have been significant sectoral and geographical shifts. The move into the large Integrateds is reflected both as a sector switch and as a geographical move from the United States and China into Europe and the United Kingdom.
4. Market Background
The oil price (WTI) opened at $61.05 on January 3rd and closed at $96.00 on December 28th. After falling to $50.48 by January 18th the price moved up steadily all year, hitting a high of $98.88 in November. The front month future contract breached the $100 level in December but quickly fell back. The average price over the year was $72.19, compared with $66.07 in 2006, but 2007 will go down as the first year that saw $100 WTI.
We believe there were various factors behind this strong run-up. On the geopolitical side we saw a stand-off between Iran and the United Kingdom at the end of March after 15 British sailors were taken prisoner by Iranian forces in the Shatt al-Arab waterway. There was an ongoing dispute later in the year between Turkey and the Kurdistan Workers Party (PKK) in Northen Iraq which threatened to escalate, as well as continued unrest in Nigeria, while United States worries about Iran's nuclear program were there in the background. Add to this a fairly active hurricane season on both sides of the Gulf of Mexico and a November fire in an Enbridge pipeline which supplies 1.5 million barrels per day of heavy crude to the United States from Canada (15% of total United States imports) and you have plenty of geopolitical culprits for a supportive backdrop to the price rise.
Market supply and demand, however, were the main factors which drove the price up: the IEA demand forecasts for 2007 and 2008 remained extremely robust in the face of high prices and broader economic uncertainty, and the Medium Term Oil Market Report released in July predicted an average demand growth of 2.2% p.a. for six years, reaching 95.8 m barrels per day in 2012. More significantly, OECD stocks have been tightening markedly since July and are now as tight as they have been for 10 years. Added to this, OPEC's quotas were net flat for the year: February 1st saw a 500,000 barrel per day cut (announced December 2006), and September saw a 500,000 barrel per day increase, effective November 1st. Meanwhile, non-OPEC supply growth was an anaemic 0.4m b/d, well below the forecast before the year began.
The last factor in the price increase was the activity on Nymex. The net non-commercial open position was short in January and by the end of July had reached 127,000 contracts long, an all time high by some distance. Over the rest of the year the open position averaged 58,000 contracts long and never got lower than 25,000 long.
The gas price (Henry Hub) averaged $6.91 over the year, up from an average of $6.74 in 2006. There were some quite dramatic price swings over the course of the year, caused by the usual factors: weather, storage, domestic production, imports and demand. At the start of the year the gas price was $5.40 per Mcf and by February 15th this had risen 65% to $8.92, on the back of cold late winter weather in the United States. After ending the withdrawal season at 1,511 Bcf (well below last year's 1,696 but still the second highest level since 1994), the price traded in a $7-$8 range until July. In the second half of the year the price weakened, trading in a $6-$7.50 range. Supporting the price were weaker imports from Canada, higher demand from Canada, and smaller shipments of LNG reaching the United States after the Japanese earthquake in July damaged their largest nuclear facility at Kashiwazaki-Kariwa. However, these appeared to be outweighed by weaker demand due to a mild Summer, and by the strong growth in United States onshore gas production, up 4.5% from 55.7 Bcf per day in January to 58.2 Bcf per day in September. The gas price ended the year at $7.16 per Mcf.
38
GLOBAL ENERGY FUND
5. Outlook
So where does that leave us for 2008? I think that the trading range for oil has now moved up from $60-$80 to $70-$100, and that the $90 spot price we see at the moment represents the top of the range for the time being. OPEC's management will be critical for while OECD stocks are tight and the United States are asking for more oil there is every chance that OECD demand will be flat in 2008 and that developing world demand will be significantly lower than forecast (perhaps 1-1.2 million barrels per day). OPEC will be keen to be seen to be keeping the market well-supplied, although second quarter demand is traditionally the weakest.
Long term we continue to believe in high energy prices and are positioning the fund with the potential to take full advantage.
Tim Guinness January 22, 2008
The Funds invest in foreign securities which will involve political, economic and currency risks, greater volatility, and differences in accounting methods. The Funds are non-diversified meaning their assets may be concentrated in fewer individual holdings than diversified funds. Therefore, the Funds are more exposed to individual stock volatility than diversified funds. The Funds invest in smaller companies, which will involve additional risks such as limited liquidity and greater volatility.
The MSCI World Index is an unmanaged index composed of more than 1,400 stocks listed on exchanges in the U.S., Europe, Canada, Australia, New Zealand and the Far East. The S&P 500 Index is a broad based unmanaged index of 500 stocks, which is widely recognized as representative of the equity market in general. These indices are unmanaged, not available for investment and do not incur expenses.
PER – Price to Earnings ratio is calculated by dividing current price of the stock by the company's trailing months' earnings per share. Cash flow measures the cash generating capability of a company by adding non-cash charges (e.g. depreciation) and interest expense to pretax income.
Please refer to the Schedule of Investments for details on fund holdings.
The information provided herein represents the opinion of Guinness Atkinson Management for the period stated and is not intended to be a forecast of future events, a guarantee of future results, nor investment advice. Opinions, fund holdings and sector allocations are subject to change at any time and are not recommendations to buy or sell any security.
39
GLOBAL ENERGY FUND
Growth of $10,000

Average Annual Total Return
Periods Ended December 31, 2007
| One Year | | Since Inception (06/30/04) | |
| | 37.25 | % | | | 37.02 | % | |
Performance data quoted represents past performance and does not guarantee future results. The investment return and principal value of an investment will fluctuate so that an investor's shares, when redeemed, may be worth more or less than their original.
Total returns reflect a fee waiver in effect and in the absence of this waiver, the total returns would be lower. The Fund imposes a 2% redemption fee on shares held less than 30 days.
The MSCI World Index is an unmanaged index composed of more than 1,400 stocks listed on exchanges in the U.S., Europe, Canada, Australia, New Zealand and the Far East.
The S&P 500 Index is a broad based unmanaged index of 500 stocks, which is widely recognized as representative of the equity market in general. These indices are unmanaged, not available for investment and do not incur expenses.
40
FUND HIGHLIGHTS at December 31, 2007
GUINNESS ATKINSON GLOBAL ENERGY FUND
| # of Holdings in Portfolio: | | | 40 | | |
| Portfolio Turnover: | | | 31.1 | % | |
| % of Stocks in Top 10: | | | 42.0 | % | |
| Fund Managers: | |
| Timothy W.N. Guinness | |
| Edmund Harriss | |
| Top 10 Holdings (% of net assets) | |
| Petroleo Brasileiro SA | | | 5.5 | % | |
| Occidental Petroleum Corp | | | 4.8 | % | |
| Hess Corp | | | 4.7 | % | |
| ConocoPhillips | | | 4.0 | % | |
| Exxon Mobil Corp | | | 3.9 | % | |
| Royal Dutch Shell PLC | | | 3.9 | % | |
| Chevron Corp | | | 3.8 | % | |
| Imperial Oil Ltd | | | 3.8 | % | |
| Sasol Ltd | | | 3.8 | % | |
| Transocean Inc New | | | 3.8 | % | |
| Country Breakdown (% of net assets) | |
| United States | | | 43.1 | % | |
| Canada | | | 17.8 | % | |
| Brazil | | | 5.5 | % | |
| Cayman Islands | | | 4.4 | % | |
| Netherlands | | | 3.9 | % | |
| South Africa | | | 3.8 | % | |
| Norway | | | 3.5 | % | |
| France | | | 3.5 | % | |
| United Kingdom | | | 3.5 | % | |
| Italy | | | 3.5 | % | |
| Austria | | | 3.4 | % | |
| Britain | | | 0.9 | % | |
| Ireland | | | 0.3 | % | |
| China | | | 0.3 | % | |
| Sector Breakdown (% of Investments) | |
| Oil/Integrated | | | 66.8 | % | |
| Oil & Gas - Exploration & Production | | | 24.0 | % | |
| Oil & Gas - Field Services | | | 3.7 | % | |
| Oil & Gas - Drilling | | | 3.0 | % | |
| Coal | | | 2.3 | % | |
| Machinery-General Industry | | | 0.2 | % | |
41
SCHEDULE OF INVESTMENTS IN SECURITIES
at December 31, 2007
GUINNESS ATKINSON GLOBAL ENERGY FUND
| Shares | | COMMON STOCKS: 97.4% | | Value | |
| Coal: 2.3% | | | |
| | 25,630 | | | Peabody Energy Corporation | | $ | 1,579,833 | | |
| Machinery – General Industry: 0.3% | | | |
| | 914,780 | | | Shandong Molong Petroleum Machinery Co., Ltd. | | | 177,123 | | |
| Oil & Gas – Drilling: 7.4% | | | |
| | 35,282 | | | Ensign Energy Services, Inc. | | | 545,165 | | |
| | 21,763 | | | Hercules Offshore, Inc.* | | | 517,524 | | |
| | 48,070 | | | Patterson-UTI Energy, Inc. | | | 938,326 | | |
| | 18,491 | | | Transocean, Inc. | | | 2,646,987 | | |
| | 11,310 | | | Unit Corporation* | | | 523,088 | | |
| | | | 5,171,090 | | |
| Oil & Gas – Exploration & Production: 23.7% | | | |
| | 99,000 | | | Afren PLC* | | | 209,331 | | |
| | 26,470 | | | Anadarko Petroleum Corporation | | | 1,738,814 | | |
| | 16,309 | | | Apache Corporation | | | 1,753,870 | | |
| | 91,089 | | | Coastal Energy Co.* | | | 401,476 | | |
| | 31,759 | | | Dragon Oil PLC* | | | 217,642 | | |
| | 23,536 | | | EnCana Corporation | | | 1,609,686 | | |
| | 308,000 | | | EnCore Oil PLC* | | | 310,670 | | |
| | 67,091 | | | Granby Oil & Gas PLC* | | | 101,102 | | |
| | 6,200 | | | Grey Wolf Exploration, Inc.* | | | 10,554 | | |
| | 600 | | | Imperial Energy Corporation PLC* | | | 18,749 | | |
| | 60,029 | | | Nexen, Inc. | | | 1,952,410 | | |
| | 95,888 | | | OPTI Canada, Inc.* | | | 1,612,788 | | |
| | 25,320 | | | Pioneer Natural Resources Co. | | | 1,236,629 | | |
| | 43,630 | | | Plains Exploration & Production Co.* | | | 2,356,020 | | |
| | 42,200 | | | Synenco Energy, Inc. - Class A* | | | 360,877 | | |
| | 45,211 | | | Whiting Petroleum Corporation* | | | 2,606,866 | | |
| | | | 16,497,484 | | |
| Oil & Gas – Field Services: 2.9% | | | |
| | 48,080 | | | Helix Energy Solutions Group, Inc.* | | | 1,995,320 | | |
The accompanying notes are an integral part of these financial statements.
42
| Shares | | COMMON STOCKS: 97.4% Continued | | Value | |
| Oil/Integrated: 60.8% | | | |
| | 199,285 | | | BP PLC* | | $ | 2,435,306 | | |
| | 28,726 | | | Chevron Corporation | | | 2,680,997 | | |
| | 31,328 | | | Conoco Phillips | | | 2,766,262 | | |
| | 66,300 | | | Eni SPA | | | 2,419,706 | | |
| | 29,000 | | | Exxon Mobil Corporation | | | 2,717,010 | | |
| | 32,243 | | | Hess Corporation | | | 3,252,029 | | |
| | 48,107 | | | Imperial Oil, Ltd. | | | 2,662,348 | | |
| | 43,608 | | | Occidental Petroleum Corporation | | | 3,357,380 | | |
| | 29,133 | | | OMV AG | | | 2,351,735 | | |
| | 44,630 | | | Petro-Canada | | | 2,407,972 | | |
| | 40,030 | | | Petroleo Brasileiro SA - ADR | | | 3,851,687 | | |
| | 64,271 | | | Royal Dutch Shell PLC | | | 2,709,439 | | |
| | 53,447 | | | Sasol, Ltd. | | | 2,648,484 | | |
| | 79,700 | | | Statoil ASA | | | 2,458,806 | | |
| | 11,399 | | | Suncor Energy, Inc. | | | 1,246,331 | | |
| | 29,500 | | | Total SA | | | 2,442,610 | | |
| | | | 42,408,102 | | |
| | | | | Total Common Stocks
(cost $47,148,369) | | | 67,828,952 | | |
| | | | | Total Investments in Securities
(cost $47,148,369): 97.4% | | | 67,828,952 | | |
| | | | | Other Assets less Liabilities: 2.6% | | | 1,876,185 | | |
| | | | | Net Assets: 100.0% | | $ | 69,705,137 | | |
* Non-income producing security.
ADR American Depository Receipt
The accompanying notes are an integral part of these financial statements.
43
GLOBAL INNOVATORS FUND
1. Performance
AVERAGE ANNUALIZED TOTAL RETURNS
| | | 1 Year | | 3 Years | | 5 Years | | Since Inception
December 15, 1998 | |
| Fund | | | 21.17 | % | | | 17.18 | % | | | 19.39 | % | | | 7.08 | % | |
| Benchmark Indices (see page 46): | |
| S&P 500 | | | 5.49 | % | | | 8.61 | % | | | 12.81 | % | | | 2.69 | % | |
| NASDAQ | | | 10.65 | % | | | 7.65 | % | | | 15.46 | % | | | 3.20 | % | |
The Fund's gross expense ratio is 1.64% per the Prospectus dated April 30, 2007. Guinness Atkinson Asset Management has contractually agreed to waive a portion of its advisory fees so that the Fund's ratio of expenses to average daily net assets will not exceed 1.55% through at least June 30, 2008. To the extent that the Advisor waives fees it may seek repayment of a portion or all of such amounts at any time within the three fiscal years after the fiscal year in which such amounts were waived, subject to the applicable cap.
Performance data quoted represents past performance and does not guarantee future results. The investment return and principal value of an investment will fluctuate so that an investor's shares, when redeemed, may be worth more or less than their original cost. Current performance of the Funds may be lower or higher than the performance quoted. Performance data current to the most recent month end may be obtained by visiting www.gafunds.com, or calling (800) 916-6566.
The Fund imposes a 2% redemption fee on shares held less than 30 days. Performance data quoted does not reflect the 2% redemption fee on shares held less than 30 days. Total returns for prior period reflect a fee waiver in effect and in the absence of this waiver; the total returns would be lower.
The Global Innovators Fund over the course of 2007 produced a total return of 21.17%. This compared favourably to the total return of the broader market which as measured by the S&P 500 was 5.49% and as measured by the NASDAQ was 10.65%.
This table sets out the comparative returns in discrete years since inception:
| | | 2007 | | 2006 | | 2005 | | 2004 | | 2003 | | 2002 | | 2001 | | 2000 | | 1999 | |
| Fund | | | 21.17 | % | | | 18.76 | % | | | 11.82 | % | | | 10.89 | % | | | 35.97 | % | | | -31.13 | % | | | -29.05 | % | | | -16.78 | % | | | 68.68 | % | |
| Benchmark Indices (see page 46): | |
| S&P 500 | | | 5.49 | % | | | 15.79 | % | | | 4.91 | % | | | 10.87 | % | | | 28.67 | % | | | -22.09 | % | | | -11.88 | % | | | -9.10 | % | | | 21.04 | % | |
| Fund | | | above | | | | above | | | | above | | | | above | | | | above | | | | below | | | | below | | | | below | | | | above | | |
| NASDAQ | | | 10.65 | % | | | 10.39 | % | | | 2.12 | % | | | 9.15 | % | | | 50.77 | % | | | -31.23 | % | | | -20.8 | % | | | -39.18 | % | | | 86.12 | % | |
| Fund | | | above | | | | above | | | | above | | | | above | | | | below | | | | above | | | | below | | | | above | | | | below | | |
For the fourth year running the fund has out performed both the S&P 500 and the NASDAQ whereas in the five previous years the fund normally turned in a performance between that of the S&P 500 and the NASDAQ.
2. Portfolio Construction and Activity
In February we sold our position in Nucor and took a profit after the stock had a steady run over the previous 12 months. In March Wired Magazine published the 2007 Wired 40. New stocks entering the list were Nintendo, Baidu, Level 3, Garmin, NTT DoCoMo, Intercontinental Exchange, Disney, Boeing and Corning.
At the end of April we took a position in Garmin. In early May we sold our position in Pfizer and later that month we took a position in Netflix.
Dealing in the second half of the year was limited to dealing on flows and rebalancing the portfolio.
44
GLOBAL INNOVATORS FUND
Successful stocks over the year were Amazon (up 135%), Lenovo (up 122%), Nokia (up 89%), Schlumberger (up 56%), Nvidia (up 38%). Our worst performing stock was Citigroup (down 47%).
The sector allocations for the last six years are shown below:
| Sector | | Dec 31 2007 | | Dec 29 2006 | | Dec 31 2005 | | Dec 31 2004 | | Dec 31 2003 | | Dec 31 2002 | | 2007 vs 2006 | |
| I T Hardware | | | 20.7 | | | | 14.5 | | | | 21.2 | | | | 16.8 | | | | 15.9 | | | | 11.8 | | | | ++ | | |
| Telecommunications | | | 15.9 | | | | 17.0 | | | | 14.2 | | | | 14.4 | | | | 17.8 | | | | 15.3 | | | | — | | |
| Financial | | | 13.7 | | | | 11.5 | | | | 7.8 | | | | 10.0 | | | | 13.3 | | | | 13.2 | | | | + | | |
| I T Software | | | 12.7 | | | | 12.1 | | | | 13.4 | | | | 14.8 | | | | 13.3 | | | | 13.6 | | | | = | | |
| I T Internet | | | 11.1 | | | | 10.4 | | | | 0.0 | | | | 0.0 | | | | 3.5 | | | | 9.2 | | | | = | | |
| Retail | | | 7.5 | | | | 7.1 | | | | 7.8 | | | | 4.0 | | | | 3.5 | | | | 3.9 | | | | = | | |
| Energy | | | 7.3 | | | | 7.0 | | | | 3.9 | | | | — | | | | — | | | | — | | | | = | | |
| Media/Entertainment | | | 4.3 | | | | 7.5 | | | | 12.8 | | | | 15.1 | | | | 12.3 | | | | 12.5 | | | | — | | |
| Consumer | | | 3.6 | | | | 4.1 | | | | 4.1 | | | | 7.9 | | | | 3.7 | | | | 2.9 | | | | = | | |
| Basic Materials | | | 3.2 | | | | 7.0 | | | | 8.3 | | | | 10.0 | | | | 2.9 | | | | 2.5 | | | | + | | |
| Services | | | — | | | | — | | | | 4.3 | | | | 5.5 | | | | 7.8 | | | | 11.0 | | | | = | | |
| Healthcare | | | — | | | | 1.8 | | | | 2.2 | | | | 1.0 | | | | 4.9 | | | | 4.3 | | | | — | | |
| | | | 100 | | | | 100 | | | | 100 | | | | 99.5 | | | | 98.9 | | | | 100.3 | | | | | | |
Note: = means change less than 1%; — or ++ means change over 5%.
At the end of the year the portfolio had 30 holdings.
3. Outlook & Strategy
The PER of the fund at the year end was 19.2X (2007) compared with the S&P 500's PER of 19.1X. Earnings of the Funds stocks are, however, projected to grow by 20% in 2008 bringing the PER (2007) down to 15.8X. In addition according to our Holt discounted cashflow metric, the funds holdings were on average undervalued against the market by some 28% (22% upside). Our objective continues to be to out perform both the S&P 500 index and the NASDAQ index.
To achieve this we continue to seek attractive investment opportunities among companies that have once been in the Wired Index and thus that exhibit New Economy characteristics. Our multi-factor screening process forms the basis of our investment approach. These four criteria are: (a) value, meaning a disciplined quantitative methodology used to rank all companies on similar basis projecting their internal cash flows using consensus forecast and historic trend data and applying a common overall market determined discount rate to imply fair value and compare this to actual price); (b) business quality (quantitatively ranking companies for the attractiveness of their return on capital metrics); (c) improving results (1 and 3 month earnings estimates revisions); and (d) good recent market price performance (looking particularly for above trend momentum and rising volatility). This screening approach is supported by appropriate due diligence bot h on the quality of the quantitative inputs to the screening process, and of a more traditional form. Also top down "thematic" judgements will be used in the process of evaluating potential Fund purchases and a regular sell discipline involving review of large movers in the portfolio is also employed.
We hope that over the months and years to come investors will find their faith in our fund management approach and the prospects for this Fund with its focus on the future in particular.

Tim Guinness February 2008
45
GLOBAL INNOVATORS FUND
The Funds invest in foreign securities which will involve political, economic and currency risks, greater volatility, and differences in accounting methods. The Funds are non-diversified meaning their assets may be concentrated in fewer individual holdings than diversified funds. Therefore, the Funds are more exposed to individual stock volatility than diversified funds. The Funds invest in smaller companies, which will involve additional risks such as limited liquidity and greater volatility.
The S&P 500 Index is a broad based unmanaged index of 500 stocks, which is widely recognized as representative of the equity market in general. The NASDAQ Composite Index is a market capitalization weighted index that is designed to represent the performance of the National Market System which includes over 5,000 stocks traded only over-the-counter and not on an exchange. These indices are unmanaged, not available for investment and do not incur expenses.
PER – Price to Earnings ratio is calculated by dividing current price of the stock by the company's trailing months' earnings per share. Cash flow measures the cash generating capability of a company by adding non-cash charges (e.g. depreciation) and interest expense to pre-tax income.
Please refer to the Schedule of Investments for details on fund holdings.
The information provided herein represents the opinion of Guinness Atkinson Management for the period stated and is not intended to be a forecast of future events, a guarantee of future results, nor investment advice. Opinions, fund holdings and sector allocations are subject to change at any time and are not recommendations to buy or sell any security.
46
GLOBAL INNOVATORS FUND
Growth of $10,000
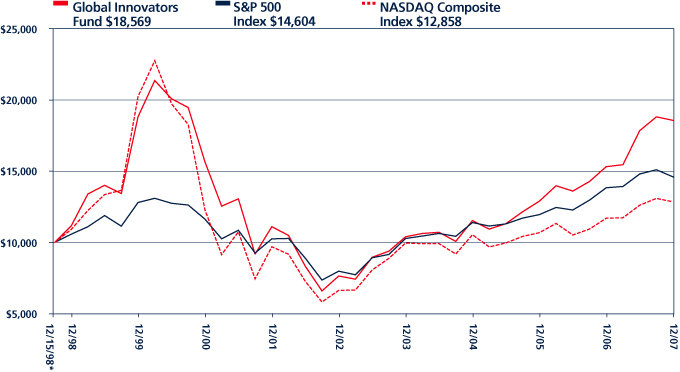
Average Annual Total Return
Periods Ended December 31, 2007
| One Year | | Five Years | | Since Inception (12/15/98) | |
| | 21.17 | % | | | 19.39 | % | | | 7.08 | % | |
Performance data quoted represents past performance and does not guarantee future results. The investment return and principal value of an investment will fluctuate so that an investor's shares, when redeemed, may be worth more or less than their original cost. Current performance of the Funds may be lower or higher than the performance quoted. Performance data current to the most recent month end may be obtained by visiting www.gafunds.com.
Total returns reflect a fee waiver in effect and in the absence of this waiver, the total returns would be lower. The Fund imposes a 2% redemption fee on shares held less than 30 days.
The Standard & Poor's 500 Index is an unmanaged index which is widelyregarded as the standard for measuring large cap U.S. Stock marketperformance. The NASDAQ Composite Index is a market capitalization weightedindex that is designed to represent the performance of the National MarketSystem which includes over 5,000 stocks traded only over-the-counter and not onan exchange. The indices referenced in this chart are not available for investmentand do not incur expenses.
47
FUND HIGHLIGHTS at December 31, 2007
GUINNESS ATKINSON GLOBAL INNOVATORS FUND
| # of Holdings in Portfolio: | | | 30 | | |
| Portfolio Turnover: | | | 25.5 | % | |
| % of Stocks in Top 10: | | | 39.1 | % | |
| Fund Managers: | |
| Timothy W.N. Guinness | |
| Edmund Harriss | |
| Top 10 Holdings (% of net assets) | |
| Sony Corp | | | 4.3 | % | |
| NetFlix Inc | | | 4.2 | % | |
| State Street Corp | | | 4.0 | % | |
| Oracle Corp | | | 3.9 | % | |
| TD Ameritrade Holding Corp | | | 3.9 | % | |
| Costco Wholesale Corp | | | 3.8 | % | |
| Samsung Electronics | | | 3.8 | % | |
| Nokia OYJ | | | 3.8 | % | |
| Taiwan Semiconductor Manufacturing Co Ltd | | | 3.7 | % | |
| Amazon.Com Inc | | | 3.7 | % | |
| Country Breakdown (% of net assets) | |
| United States | | | 62.4 | % | |
| Japan | | | 7.9 | % | |
| Britain | | | 5.5 | % | |
| South Korea | | | 3.8 | % | |
| Finland | | | 3.8 | % | |
| Taiwan | | | 3.7 | % | |
| United Kingdom | | | 3.6 | % | |
| Mexico | | | 3.2 | % | |
| Cayman Islands | | | 3.0 | % | |
| Israel | | | 3.0 | % | |
| Sector Breakdown (% of Investments) | |
| E-Commerce/Products | | | 14.8 | % | |
| Prepackaged Software | | | 12.7 | % | |
| Commerical Banks | | | 10.4 | % | |
| Semiconductors | | | 10.2 | % | |
| Oil & Gas Producers | | | 7.3 | % | |
| Electronics | | | 6.9 | % | |
| Telecommunications | | | 4.9 | % | |
| Audio/Video Products | | | 4.3 | % | |
| Variety Store | | | 3.8 | % | |
| Telecommunication Equip | | | 3.8 | % | |
| Aerospace/Defense | | | 3.7 | % | |
| Auto Manufacturers | | | 3.6 | % | |
| Computers | | | 3.5 | % | |
| Telecommunication Services | | | 3.5 | % | |
| Multi-line Insurance | | | 3.4 | % | |
| Ready-Mixed Concrete | | | 3.2 | % | |
48
SCHEDULE OF INVESTMENTS IN SECURITIES
at December 31, 2007
GUINNESS ATKINSON GLOBAL INNOVATORS FUND
| Shares | | COMMON STOCKS: 99.9% | | Value | |
| Aerospace/Defense: 3.7% | | | |
| | 25,450 | | | L-3 Communications Holdings, Inc. | | $ | 2,696,173 | | |
| Auto Manufacturers: 3.6% | | | |
| | 40,170 | | | Honda Motor Company - ADR | | | 1,331,234 | | |
| | 12,290 | | | Toyota Motor Corporation - ADR | | | 1,304,829 | | |
| | | | 2,636,063 | | |
| Commerical Banks: 10.4% | | | |
| | 61,820 | | | Citigroup, Inc. | | | 1,819,981 | | |
| | 35,614 | | | State Street Corporation | | | 2,891,857 | | |
| | 141,160 | | | TD Ameritrade Holding Corporation* | | | 2,831,670 | | |
| | | | 7,543,508 | | |
| Communications Equipment: 3.8% | | | |
| | 71,292 | | | Nokia Corporation - ADR | | | 2,736,900 | | |
| Computers: 3.6% | | | |
| | 2,916,000 | | | Lenovo Group, Ltd. | | | 2,621,535 | | |
| E-Commerce/Products: 14.8% | | | |
| | 29,110 | | | Amazon.Com, Inc.* | | | 2,696,750 | | |
| | 72,570 | | | eBay, Inc.* | | | 2,408,598 | | |
| | 137,900 | | | Infospace, Inc. | | | 2,592,520 | | |
| | 114,790 | | | NetFlix, Inc.* | | | 3,055,710 | | |
| | | | 10,753,578 | | |
| Electronics: 6.9% | | | |
| | 23,230 | | | Garmin, Ltd. | | | 2,253,310 | | |
| | 9,390 | | | Samsung Electronics Co., Ltd. - GDR | | | 2,748,923 | | |
| | | | 5,002,233 | | |
| Multi-line Insurance: 3.3% | | | |
| | 41,885 | | | American International Group, Inc. | | | 2,441,896 | | |
| Oil & Gas Producers: 7.3% | | | |
| | 35,810 | | | BP PLC - ADR | | | 2,620,218 | | |
| | 27,200 | | | Schlumberger, Ltd. | | | 2,675,664 | | |
| | | | 5,295,882 | | |
| Prepackaged Software: 12.7% | | | |
| | 99,800 | | | Check Point Software Technologies, Ltd.* | | | 2,191,607 | | |
| | 43,358 | | | Microsoft Corporation | | | 1,543,545 | | |
| | 126,310 | | | Oracle Corporation* | | | 2,852,080 | | |
| | 149,250 | | | Parametric Technology Corporation* | | | 2,664,113 | | |
| | | | 9,251,345 | | |
| Radio & TV Communications Equipment: 4.3% | | | |
| | 57,758 | | | Sony Corporation - ADR | | | 3,136,259 | | |
The accompanying notes are an integral part of these financial statements.
49
GUINNESS ATKINSON GLOBAL INNOVATORS FUND
| Shares | | COMMON STOCKS: 99.9% Continued | | Value | |
| Ready-Mixed Concrete: 3.1% | | | |
| | 88,878 | | | Cemex SA de CV - ADR* | | $ | 2,297,496 | | |
| Semiconductors: 10.2% | | | |
| | 130,250 | | | Applied Materials, Inc. | | | 2,313,240 | | |
| | 70,055 | | | Nvidia Corporation | | | 2,383,271 | | |
| | 272,518 | | | Taiwan Semiconductor Manufacturing Co., Ltd. - ADR | | | 2,714,279 | | |
| | | | 7,410,790 | | |
| Telecommunications: 8.4% | | | |
| | 706,725 | | | Cable & Wireless PLC* | | | 2,616,661 | | |
| | 312,700 | | | Qwest Communications International, Inc.* | | | 2,192,027 | | |
| | 36,185 | | | Vodafone Group PLC - ADR | | | 1,350,424 | | |
| | | | 6,159,112 | | |
| Variety Store: 3.8% | | | |
| | 39,830 | | | Costco Wholesale Corporation | | | 2,778,541 | | |
| | | | | Total Common Stocks
(cost $59,460,941) | | | 72,761,311 | | |
| | | | | Total Investments in Securities
(cost $59,460,941): 99.9% | | | 72,761,311 | | |
| | | | | Other Assets less Liabilities: 0.1% | | | 72,186 | | |
| | | | | Net Assets: 100.0% | | $ | 72,833,497 | | |
* Non-income producing security.
ADR American Depository Receipt
GDR Global Depository Receipt
The accompanying notes are an integral part of these financial statements.
50
STATEMENTS OF ASSETS AND LIABILITIES
at December 31, 2007
| | | Alternative
Energy
Fund | | Asia
Focus
Fund | | Asia Pacific
Dividend
Fund | |
| Assets | |
| Investments in securities, at cost | | $ | 139,347,403 | | | $ | 55,927,216 | | | $ | 31,200,972 | | |
| Investments in securities, at value | | $ | 156,584,656 | | | $ | 78,419,356 | | | $ | 32,016,888 | | |
| Cash | | | 3,507,073 | | | | 946,744 | | | | — | | |
Cash denominated in foreign currency (cost of $504,952, $20,097,
$532,977 respectively) | | | 488,665 | | | | 20,087 | | | | 531,453 | | |
| Receivables: | |
| Securities sold | | | — | | | | — | | | | 526,506 | | |
| Fund shares sold | | | 2,902,061 | | | | 81,800 | | | | 65,519 | | |
| Dividends and interest | | | 111,390 | | | | 43,711 | | | | 21,785 | | |
| Tax Reclaim | | | 4,188 | | | | — | | �� | | — | | |
| Prepaid expenses | | | 16,772 | | | | 7,163 | | | | 22,841 | | |
| Total assets | | | 163,614,805 | | | | 79,518,861 | | | | 33,184,992 | | |
| Liabilities | |
| Payables: | |
| Loans | | | — | | | | — | | | | 1,233,552 | | |
| Securities purchased | | | 1,450,325 | | | | 782,835 | | | | — | | |
| Fund shares redeemed | | | 155,675 | | | | 342,825 | | | | 89,477 | | |
| Due to advisor | | | 129,382 | | | | 67,375 | | | | 14,987 | | |
| Accrued administration expense | | | 10,671 | | | | 7,570 | | | | 1,699 | | |
| Accrued shareholder servicing plan fees | | | 9,448 | | | | 16,751 | | | | 6,314 | | |
| Other accrued expenses | | | 132,664 | | | | 86,962 | | | | 84,166 | | |
| Deferred trustees' compensation | | | 5,931 | | | | 40,639 | | | | 3,918 | | |
| Total liabilities | | | 1,894,096 | | | | 1,344,957 | | | | 1,434,113 | | |
| Net Assets | | $ | 161,720,709 | | | $ | 78,173,904 | | | $ | 31,750,879 | | |
| Number of shares issued and outstanding (unlimited shares authorized no par value) | | | 9,950,673 | | | | 3,263,319 | | | | 1,895,626 | | |
| Net asset value per share | | $ | 16.25 | | | $ | 23.96 | | | $ | 16.75 | | |
| Components of Net Assets | |
| Paid-in capital | | $ | 143,510,798 | | | $ | 59,805,817 | | | $ | 30,319,133 | | |
| Accumulated net investment income (loss) | | | 42,436 | | | | (40,639 | ) | | | 78,532 | | |
Accumulated net realized gain (loss) on investments
and foreign currency | | | 934,240 | | | | (4,083,612 | ) | | | 538,014 | | |
| Net unrealized appreciation (depreciation) on: | |
| Investments | | | 17,237,253 | | | | 22,492,140 | | | | 815,916 | | |
| Foreign Currency | | | (4,018 | ) | | | 198 | | | | (716 | ) | |
| Net Assets | | $ | 161,720,709 | | | $ | 78,173,904 | | | $ | 31,750,879 | | |
The accompanying notes are an integral part of these financial statements.
51
STATEMENTS OF ASSETS AND LIABILITIES
at December 31, 2007
| | | China &
Hong Kong
Fund | | Global
Energy
Fund | | Global
Innovators
Fund | |
| Assets | |
| Investments in securities, at cost | | $ | 166,021,148 | | | $ | 47,148,369 | | | $ | 59,460,941 | | |
| Investments in securities, at value | | $ | 291,805,864 | | | $ | 67,828,952 | | | $ | 72,761,311 | | |
| Cash | | | 1,570,435 | | | | 1,995,226 | | | | — | | |
| Receivables: | |
| Fund shares sold | | | 1,280,186 | | | | 316,104 | | | | 383,584 | | |
| Dividends and interest | | | 149,336 | | | | 73,505 | | | | 74,663 | | |
| Tax Reclaim | | | — | | | | 10,867 | | | | 5,688 | | |
| Prepaid expenses | | | 13,112 | | | | 8,462 | | | | 9,673 | | |
| Total assets | | | 294,818,933 | | | | 70,233,116 | | | | 73,234,919 | | |
| Liabilities | |
| Payables: | |
| Loans | | | — | | | | — | | | | 39,858 | | |
| Fund shares redeemed | | | 1,161,579 | | | | 377,225 | | | | 178,239 | | |
| Due to advisor | | | 255,333 | | | | 42,957 | | | | 46,572 | | |
| Accrued administration expense | | | 10,700 | | | | 2,585 | | | | 2,862 | | |
| Accrued shareholder servicing plan fees | | | 24,105 | | | | 9,858 | | | | 7,103 | | |
| Other accrued expenses | | | 124,893 | | | | 80,486 | | | | 66,501 | | |
| Deferred trustees' compensation | | | 77,855 | | | | 14,868 | | | | 60,287 | | |
| Total liabilities | | | 1,654,465 | | | | 527,979 | | | | 401,422 | | |
| Net Assets | | $ | 293,164,468 | | | $ | 69,705,137 | | | $ | 72,833,497 | | |
| Number of shares issued and outstanding (unlimited shares authorized no par value) | | | 6,815,244 | | | | 2,187,788 | | | | 3,359,042 | | |
| Net asset value per share | | $ | 43.02 | | | $ | 31.86 | | | $ | 21.68 | | |
| Components of Net Assets | |
| Paid-in capital | | $ | 167,155,538 | | | $ | 48,749,157 | | | $ | 107,445,202 | | |
| Accumulated net investment income (loss) | | | 963,233 | | | | (520,676 | ) | | | (60,292 | ) | |
Accumulated net realized gain (loss) on investments
and foreign currency | | | (739,039 | ) | | | 795,351 | | | | (47,850,588 | ) | |
| Net unrealized appreciation on: | |
| Investments | | | 125,784,716 | | | | 20,680,583 | | | | 13,300,370 | | |
| Foreign Currency | | | 20 | | | | 722 | | | | (1,195 | ) | |
| Net Assets | | $ | 293,164,468 | | | $ | 69,705,137 | | | $ | 72,833,497 | | |
The accompanying notes are an integral part of these financial statements.
52
STATEMENTS OF OPERATIONS
For the year ended December 31, 2007
| | | Alternative
Energy
Fund | | Asia
Focus
Fund | | Asia Pacific
Dividend
Fund | |
| Investment Income | |
| Income | |
| Dividends* | | $ | 557,760 | | | $ | 1,935,778 | | | $ | 800,114 | | |
| Interest | | | 116,258 | | | | 19,933 | | | | 16,935 | | |
| Total income | | | 674,018 | | | | 1,955,711 | | | | 817,049 | | |
| Expenses | |
| Advisory fees (Note 3) | | | 904,488 | | | | 644,632 | | | | 192,972 | | |
| Administration fees (Note 3) | | | 88,255 | | | | 66,263 | | | | 20,098 | | |
| Transfer agent fees | | | 57,967 | | | | 64,140 | | | | 20,132 | | |
| Custody fees | | | 63,177 | | | | 37,297 | | | | 40,808 | | |
| Fund accounting fees | | | 24,642 | | | | 37,509 | | | | 22,143 | | |
| Audit fees | | | 15,257 | | | | 20,414 | | | | 15,576 | | |
| Legal fees | | | 21,915 | | | | 18,757 | | | | 4,321 | | |
| Organization costs (Note 2) | | | 1,561 | | | | — | | | | 1,444 | | |
| Trustees' fees | | | 10,247 | | | | 7,690 | | | | 7,000 | | |
| Shareholder servicing plan fees (Note 4) | | | 151,941 | | | | 102,295 | | | | 37,474 | | |
| Reports to shareholders | | | 29,607 | | | | 21,834 | | | | 6,730 | | |
| Registration expense | | | 28,220 | | | | 19,049 | | | | 19,703 | | |
| Interest expense | | | 18,504 | | | | 39,453 | | | | 10,634 | | |
| Insurance expense | | | 1,625 | | | | 4,137 | | | | 91 | | |
| Miscellaneous | | | 12,550 | | | | 8,539 | | | | 3,653 | | |
| Total expenses | | | 1,429,956 | | | | 1,092,009 | | | | 402,779 | | |
| Plus: Expenses recouped (Note 3) | | | 57,011 | | | | — | | | | — | | |
| Less: Fees waived and expenses absorbed (Note 3) | | | — | | | | — | | | | (20,695 | ) | |
| Net expenses | | | 1,486,967 | | | | 1,092,009 | | | | 382,084 | | |
| Net investment income (loss) | | | (812,949 | ) | | | 863,702 | | | | 434,965 | | |
| Realized and unrealized gain (loss) on investments and foreign currency | |
| Net realized gain (loss) on: | |
| Investments | | | 2,352,743 | | | | 8,274,586 | | | | 777,197 | | |
| Foreign currency | | | 920,540 | | | | (30,987 | ) | | | 139,291 | | |
| Change in unrealized appreciation (depreciation) on: | |
| Investments | | | 18,766,312 | | | | 13,042,718 | | | | 735,506 | | |
| Foreign currency | | | (4,023 | ) | | | (1,889 | ) | | | (704 | ) | |
| Net realized and unrealized gain on investments and foreign currency | | | 22,035,572 | | | | 21,284,428 | | | | 1,651,290 | | |
| Net increase in net assets resulting from operations | | $ | 21,222,623 | | | $ | 22,148,130 | | | $ | 2,086,255 | | |
* Net of foreign tax withheld of $93,074 for Alternative Energy Fund, $212,884 for Asia Focus Fund and $99,980 for the Asia Pacific Dividend Fund.
The accompanying notes are an integral part of these financial statements.
53
STATEMENTS OF OPERATIONS
For the year ended December 31, 2007
| | | China &
Hong Kong
Fund | | Global
Energy
Fund | | Global
Innovators
Fund | |
| Investment Income | |
| Income | |
| Dividends* | | $ | 5,340,238 | | | $ | 938,607 | | | $ | 1,041,005 | | |
| Interest | | | 114,593 | | | | 26,844 | | | | 47,515 | | |
| Total income | | | 5,454,831 | | | | 965,451 | | | | 1,088,520 | | |
| Expenses | |
| Advisory fees (Note 3) | | | 2,088,567 | | | | 454,815 | | | | 422,756 | | |
| Administration fees (Note 3) | | | 152,513 | | | | 30,321 | | | | 28,166 | | |
| Transfer agent fees | | | 127,854 | | | | 73,228 | | | | 85,330 | | |
| Custody fees | | | 75,183 | | | | 24,444 | | | | 11,688 | | |
| Fund accounting fees | | | 58,401 | | | | 32,412 | | | | 30,446 | | |
| Audit fees | | | 21,015 | | | | 21,881 | | | | 21,062 | | |
| Legal fees | | | 59,444 | | | | 18,363 | | | | 16,027 | | |
| Trustees' fees | | | 23,180 | | | | 9,723 | | | | 11,068 | | |
| Shareholder servicing plan fees (Note 4) | | | 285,773 | | | | 70,801 | | | | 86,906 | | |
| Reports to shareholders | | | 44,409 | | | | 28,024 | | | | 32,194 | | |
| Registration expense | | | 23,623 | | | | 22,880 | | | | 18,780 | | |
| Interest expense | | | 4,233 | | | | 10,614 | | | | 1,738 | | |
| Insurance expense | | | 12,216 | | | | 6,226 | | | | 3,561 | | |
| Miscellaneous | | | 29,792 | | | | 10,957 | | | | 7,458 | | |
| Total expenses | | | 3,006,203 | | | | 814,689 | | | | 777,180 | | |
| Plus: Expenses recouped (Note 3) | | | — | | | | 14,993 | | | | 32,946 | | |
| Net expenses | | | 3,006,203 | | | | 829,682 | | | | 810,126 | | |
| Net investment income | | | 2,448,628 | | | | 135,769 | | | | 278,394 | | |
| Realized and unrealized gain (loss) on investments and foreign currency | |
| Net realized gain on: | |
| Investments | | | 2,808,325 | | | | 6,392,252 | | | | 4,108,317 | | |
| Foreign currency | | | 182,369 | | | | 60,032 | | | | 8,501 | | |
| Change in unrealized appreciation (depreciation) on: | |
| Investments | | | 86,040,030 | | | | 12,166,558 | | | | 4,982,062 | | |
| Foreign currency | | | 15 | | | | 2,303 | | | | (1,575 | ) | |
| Net realized and unrealized gain on investments and foreign currency | | | 89,030,739 | | | | 18,621,145 | | | | 9,097,305 | | |
| Net increase in net assets resulting from operations | | $ | 91,479,367 | | | $ | 18,756,914 | | | $ | 9,375,699 | | |
* Net of foreign tax withheld of $0 for China & Hong Kong Fund, $71,324 for Global Energy Fund and $22,552 for the Global Innovators Fund.
The accompanying notes are an integral part of these financial statements.
54
STATEMENTS OF CHANGES IN NET ASSETS
| | | Alternative Energy Fund | | Asia Focus Fund | | Asia Pacific Dividend Fund | |
| | | Year Ended
December 31, 2007 | | March 31, 2006(1)
Through
December 31, 2006 | | Year Ended
December 31, 2007 | | Year Ended
December 31, 2006 | | Year Ended
December 31, 2007 | | March 31, 2006(1)
Through
December 31, 2006 | |
Increase (decrease) in
net assets from: | |
| Operations | |
| Net investment income (loss) | | $ | (812,949 | ) | | $ | (144,759 | ) | | $ | 863,702 | | | $ | 719,391 | | | $ | 434,965 | | | $ | 17,309 | | |
| Net realized gain (loss) on: | |
| Investments | | | 2,352,743 | | | | (286,525 | ) | | | 8,274,586 | | | | 14,472,198 | | | | 777,197 | | | | (22,544 | ) | |
| Foreign currency | | | 920,540 | | | | (49,988 | ) | | | (30,987 | ) | | | 3,852 | | | | 139,291 | | | | (3,282 | ) | |
Change in net unrealized
appreciation (depreciation) on: | |
| Investments | | | 18,766,312 | | | | (1,529,059 | ) | | | 13,042,718 | | | | (3,158,169 | ) | | | 735,506 | | | | 80,409 | | |
| Foreign currency | | | (4,023 | ) | | | 5 | | | | (1,889 | ) | | | (843 | ) | | | (704 | ) | | | (11 | ) | |
Net increase (decrease) in
net assets resulting
from operations | | | 21,222,623 | | | | (2,010,326 | ) | | | 22,148,130 | | | | 12,036,429 | | | | 2,086,255 | | | | 71,881 | | |
| Distributions to shareholders | |
| From net investment income | | | — | | | | — | | | | (894,936 | ) | | | (710,741 | ) | | | (494,606 | ) | | | (15,132 | ) | |
| From net realized gain | | | (1,131,978 | ) | | | — | | | | — | | | | — | | | | (216,639 | ) | | | — | | |
Decrease in net assets
from distributions | | | (1,131,978 | ) | | | — | | | | (894,936 | ) | | | (710,741 | ) | | | (711,245 | ) | | | (15,132 | ) | |
| Capital share transactions | |
| Proceeds from shares sold | | | 185,753,545 | | | | 24,624,826 | | | | 31,189,339 | | | | 26,349,696 | | | | 43,895,733 | | | | 1,608,465 | | |
| Proceeds from shares reinvested | | | 1,075,744 | | | | — | | | | 859,849 | | | | 685,617 | | | | 684,173 | | | | 14,632 | | |
| Cost of shares redeemed | | | (60,941,763 | ) | | | (6,968,508 | ) | | | (24,458,520 | ) | | | (25,714,104 | ) | | | (15,360,574 | ) | | | (542,943 | ) | |
| Redemption fee proceeds (Note 3) | | | 78,806 | | | | 17,740 | | | | 50,104 | | | | 105,032 | | | | 18,599 | | | | 1,035 | | |
Net increase from
capital share transactions | | | 125,966,332 | | | | 17,674,058 | | | | 7,640,772 | | | | 1,426,241 | | | | 29,237,931 | | | | 1,081,189 | | |
| Total increase in net assets | | | 146,056,977 | | | | 15,663,732 | | | | 28,893,966 | | | | 12,751,929 | | | | 30,612,941 | | | | 1,137,938 | | |
| Net assets | |
| Beginning of period | | | 15,663,732 | | | | — | | | | 49,279,938 | | | | 36,528,009 | | | | 1,137,938 | | | | — | | |
| End of period | | $ | 161,720,709 | | | $ | 15,663,732 | | | $ | 78,173,904 | | | $ | 49,279,938 | | | $ | 31,750,879 | | | $ | 1,137,938 | | |
Accumulated net investment
income (loss) | | $ | 42,436 | | | $ | (57,143 | ) | | $ | (40,639 | ) | | $ | (3,938 | ) | | $ | 78,532 | | | $ | (632 | ) | |
| Capital share activity | |
| Shares sold | | | 12,704,799 | | | | 1,988,420 | | | | 1,417,514 | | | | 1,883,119 | | | | 2,685,639 | | | | 128,257 | | |
| Shares issued on reinvestment | | | 65,755 | | | | — | | | | 35,933 | | | | 43,726 | | | | 39,758 | | | | 1,237 | | |
| Shares redeemed | | | (4,185,381 | ) | | | (622,920 | ) | | | (1,158,267 | ) | | | (1,908,625 | ) | | | (913,663 | ) | | | (45,602 | ) | |
Net increase (decrease) in
shares outstanding | | | 8,585,173 | | | | 1,365,500 | | | | 295,180 | | | | 18,220 | | | | 1,811,734 | | | | 83,892 | | |
(1) Commencement of operations.
The accompanying notes are an integral part of these financial statements.
55
STATEMENTS OF CHANGES IN NET ASSETS
| | | China & Hong Kong Fund | | Global Energy Fund | | Global Innovators Fund | |
| | | Year Ended
December 31, 2007 | | Year Ended
December 31, 2006 | | Year Ended
December 31, 2007 | | Year Ended
December 31, 2006 | | Year Ended
December 31, 2007 | | Year Ended
December 31, 2006 | |
Increase (decrease) in
net assets from: | |
| Operations | |
| Net investment income | | $ | 2,448,628 | | | $ | 2,464,238 | | | $ | 135,769 | | | $ | 37,107 | | | $ | 278,394 | | | $ | 32,253 | | |
| Net realized gain (loss) on: | |
| Investments | | | 2,808,325 | | | | 39,656,354 | | | | 6,392,252 | | | | 5,090,808 | | | | 4,108,317 | | | | 4,513,701 | | |
| Foreign currency | | | 182,369 | | | | (6,011 | ) | | | 60,032 | | | | (97,532 | ) | | | 8,501 | | | | (1,863 | ) | |
Change in net unrealized
appreciation (depreciation) on: | |
| Investments | | | 86,040,030 | | | | (701,396 | ) | | | 12,166,558 | | | | 1,659,735 | | | | 4,982,062 | | | | 1,768,758 | | |
| Foreign currency | | | 15 | | | | 123 | | | | 2,303 | | | | 2,087 | | | | (1,575 | ) | | | 380 | | |
Net increase in net assets
resulting from operations | | | 91,479,367 | | | | 41,413,308 | | | | 18,756,914 | | | | 6,692,205 | | | | 9,375,699 | | | | 6,313,229 | | |
| Distributions to shareholders | |
| From net investment income | | | (3,968,807 | ) | | | (53,575 | ) | | | (542,776 | ) | | | (525,608 | ) | | | (358,091 | ) | | | — | | |
| From net realized gain | | | (656,957 | ) | | | — | | | | (5,950,827 | ) | | | (3,372,424 | ) | | | — | | | | — | | |
Decrease in net assets
from distributions | | | (4,625,764 | ) | | | (53,575 | ) | | | (6,493,603 | ) | | | (3,898,032 | ) | | | (358,091 | ) | | | — | | |
| Capital share transactions | |
| Proceeds from shares sold | | | 159,552,350 | | | | 16,755,268 | | | | 23,259,657 | | | | 57,559,663 | | | | 39,986,701 | | | | 4,754,293 | | |
| Proceeds from shares reinvested | | | 4,527,640 | | | | 52,062 | | | | 5,934,815 | | | | 3,620,028 | | | | 351,067 | | | | — | | |
| Cost of shares redeemed | | | (101,013,368 | ) | | | (26,229,433 | ) | | | (36,752,697 | ) | | | (97,775,898 | ) | | | (15,862,301 | ) | | | (8,112,735 | ) | |
| Redemption fee proceeds (Note 3) | | | 265,565 | | | | 14,361 | | | | 9,590 | | | | 53,811 | | | | 18,497 | | | | 534 | | |
Net increase (decrease) from
capital share transactions | | | 63,332,187 | | | | (9,407,742 | ) | | | (7,548,635 | ) | | | (36,542,396 | ) | | | 24,493,964 | | | | (3,357,908 | ) | |
Total increase (decrease)
in net assets | | | 150,185,790 | | | | 31,951,991 | | | | 4,714,676 | | | | (33,748,223 | ) | | | 33,511,572 | | | | 2,955,321 | | |
| Net assets | |
| Beginning of year | | | 142,978,678 | | | | 111,026,687 | | | | 64,990,461 | | | | 98,738,684 | | | | 39,321,925 | | | | 36,366,604 | | |
| End of year | | $ | 293,164,468 | | | $ | 142,978,678 | | | $ | 69,705,137 | | | $ | 64,990,461 | | | $ | 72,833,497 | | | $ | 39,321,925 | | |
Accumulated net investment
income (loss) | | $ | 963,233 | | | $ | 2,301,043 | | | $ | (520,676 | ) | | $ | (535,545 | ) | | $ | (60,292 | ) | | $ | (65 | ) | |
| Capital share activity | |
| Shares sold | | | 3,900,290 | | | | 753,713 | | | | 779,723 | | | | 2,129,926 | | | | 1,926,899 | | | | 277,904 | | |
| Shares issued on reinvestment | | | 105,835 | | | | 2,122 | | | | 184,253 | | | | 137,181 | | | | 16,059 | | | | — | | |
| Shares redeemed | | | (2,590,549 | ) | | | (1,208,738 | ) | | | (1,320,513 | ) | | | (3,733,778 | ) | | | (770,897 | ) | | | (493,563 | ) | |
Net increase (decrease) in
shares outstanding | | | 1,415,576 | | | | (452,903 | ) | | | (356,537 | ) | | | (1,466,671 | ) | | | 1,172,061 | | | | (215,659 | ) | |
The accompanying notes are an integral part of these financial statements.
56
FINANCIAL HIGHLIGHTS
For a capital share outstanding throughout the period
| Alternative Energy Fund | | Year Ended
December 31, 2007 | | March 31, 2006(1)
Through
December 31, 2006 | |
| Net asset value, beginning of period | | $ | 11.47 | | | $ | 12.50 | | |
| Income from investment operations: | |
| Net investment loss | | | (0.05 | ) | | | (0.11 | ) | |
| Net realized and unrealized gain (loss) on investments and foreign currency | | | 4.93 | | | | (0.93 | ) | |
| Total from investment operations | | | 4.88 | | | | (1.04 | ) | |
| Less distributions: | |
| From net realized gain | | | (0.11 | ) | | | — | | |
| Total distributions | | | (0.11 | ) | | | — | | |
| Redemption fee proceeds | | | 0.01 | | | | 0.01 | | |
| Net asset value, end of period | | $ | 16.25 | | | $ | 11.47 | | |
| Total return | | | 42.68 | % | | | (8.24 | )%(2) | |
| Ratios/supplemental data: | |
| Net assets, end of period (millions) | | $ | 161.7 | | | $ | 15.7 | | |
| Ratio of expenses to average net assets: | |
| Before fees waived | | | 1.64 | % | | | 2.60 | %(3) | |
| After fees waived | | | 1.64 | % | | | 1.98 | %(3) | |
| Ratio of net investment loss to average net assets: | |
| Before fees waived | | | (0.90 | )% | | | (2.18 | )%(3) | |
| After fees waived | | | (0.90 | )% | | | (1.56 | )%(3) | |
| Portfolio turnover rate | | | 47.41 | % | | | 21.71 | %(2) | |
(1) Commencement of Operations.
(2) Not annualized.
(3) Annualized.
The accompanying notes are an integral part of these financial statements.
57
FINANCIAL HIGHLIGHTS
For a capital share outstanding throughout the year
| | | Year Ended December 31, | |
| Asia Focus Fund | | 2007 | | 2006 | | 2005 | | 2004 | | 2003 | |
| Net asset value, beginning of year | | $ | 16.60 | | | $ | 12.38 | | | $ | 10.40 | | | $ | 9.51 | | | $ | 5.80 | | |
| Income from investment operations: | |
| Net investment income | | | 0.27 | | | | 0.24 | | | | 0.16 | | | | 0.06 | | | | 0.06 | | |
Net realized and unrealized gain
on investments and foreign currency | | | 7.35 | | | | 4.18 | | | | 2.00 | | | | 0.89 | | | | 3.61 | | |
| Total from investment operations | | | 7.62 | | | | 4.42 | | | | 2.16 | | | | 0.95 | | | | 3.67 | | |
| Less distributions: | |
| From net investment income | | | (0.28 | ) | | | (0.24 | ) | | | (0.18 | ) | | | (0.06 | ) | | | — | | |
| Total distributions | | | (0.28 | ) | | | (0.24 | ) | | | (0.18 | ) | | | (0.06 | ) | | | — | | |
| Redemption fee proceeds | | | 0.02 | | | | 0.04 | | | | — | (1) | | | — | (1) | | | 0.04 | | |
| Net asset value, end of year | | $ | 23.96 | | | $ | 16.60 | | | $ | 12.38 | | | $ | 10.40 | | | $ | 9.51 | | |
| Total return | | | 46.00 | % | | | 36.15 | % | | | 20.83 | % | | | 10.01 | % | | | 63.97 | % | |
| Ratios/supplemental data: | |
| Net assets, end of year (millions) | | $ | 78.2 | | | $ | 49.3 | | | $ | 36.5 | | | $ | 30.6 | | | $ | 36.2 | | |
| Ratio of expenses to average net assets: | |
| Before fees waived | | | 1.69 | % | | | 1.84 | % | | | 1.87 | % | | | 2.04 | % | | | 2.16 | % | |
| After fees waived | | | 1.69 | % | | | 1.84 | % | | | 1.87 | % | | | 1.98 | % | | | 1.95 | % | |
| Ratio of net investment income to average net assets: | |
| Before fees waived | | | 1.34 | % | | | 1.48 | % | | | 1.41 | % | | | 0.51 | % | | | 0.75 | % | |
| After fees waived | | | 1.34 | % | | | 1.48 | % | | | 1.41 | % | | | 0.57 | % | | | 0.96 | % | |
| Portfolio turnover rate | | | 31.17 | % | | | 95.68 | % | | | 18.25 | % | | | 32.41 | % | | | 114.90 | % | |
(1) Amount represents less than $0.01 per share.
The accompanying notes are an integral part of these financial statements.
58
FINANCIAL HIGHLIGHTS
For a capital share outstanding throughout the period
| Asia Pacific Dividend Fund | | Year Ended
December 31, 2007 | | March 31, 2006(1)
Through
December 31, 2006 | |
| Net asset value, beginning of period | | $ | 13.56 | | | $ | 12.50 | | |
| Income from investment operations: | |
| Net investment income | | | 0.24 | | | | 0.25 | | |
| Net realized and unrealized gain on investments and foreign currency | | | 3.32 | | | | 1.03 | | |
| Total from investment operations | | | 3.56 | | | | 1.28 | | |
| Less distributions: | |
| From net investment income | | | (0.27 | ) | | | (0.23 | ) | |
| From net realized gain | | | (0.11 | ) | | | | | |
| Total distributions | | | (0.38 | ) | | | (0.23 | ) | |
| Redemption fee proceeds | | | 0.01 | | | | 0.01 | | |
| Net asset value, end of period | | $ | 16.75 | | | $ | 13.56 | | |
| Total return | | | 26.30 | % | | | 10.59 | %(2) | |
| Ratios/supplemental data: | |
| Net assets, end of period (millions) | | $ | 31.8 | | | $ | 1.1 | | |
| Ratio of expenses to average net assets: | |
| Before fees waived | | | 2.09 | % | | | 17.86 | %(3) | |
| After fees waived | | | 1.98 | % | | | 1.98 | %(3) | |
| Ratio of net investment income (loss) to average net assets: | |
| Before fees waived | | | 2.14 | % | | | (13.02 | )%(3) | |
| After fees waived | | | 2.25 | % | | | 2.86 | %(3) | |
| Portfolio turnover rate | | | 40.38 | % | | | 34.12 | %(2) | |
(1) Commencement of Operations.
(2) Not annualized.
(3) Annualized.
The accompanying notes are an integral part of these financial statements.
59
FINANCIAL HIGHLIGHTS
For a capital share outstanding throughout the year
| | | Year Ended December 31, | |
| China & Hong Kong Fund | | 2007 | | 2006 | | 2005 | | 2004 | | 2003 | |
| Net asset value, beginning of year | | $ | 26.48 | | | $ | 18.97 | | | $ | 18.57 | | | $ | 16.81 | | | $ | 10.17 | | |
| Income from investment operations: | |
| Net investment income | | | 0.28 | | | | 0.43 | | | | 0.37 | | | | 0.25 | | | | 0.20 | | |
Net realized and unrealized gain
on investments and foreign currency | | | 16.91 | | | | 7.09 | | | | 0.86 | | | | 1.78 | | | | 6.44 | | |
| Total from investment operations | | | 17.19 | | | | 7.52 | | | | 1.23 | | | | 2.03 | | | | 6.64 | | |
| Less distributions: | |
| From net investment income | | | (0.59 | ) | | | (0.01 | ) | | | (0.83 | ) | | | (0.27 | ) | | | — | | |
| From net realized gain | | | (0.10 | ) | | | — | | | | — | | | | — | | | | — | | |
| Total distributions | | | (0.69 | ) | | | (0.01 | ) | | | (0.83 | ) | | | (0.27 | ) | | | — | | |
| Redemption fee proceeds | | | 0.04 | | | | — | (1) | | | — | (1) | | | — | (1) | | | — | (1) | |
| Net asset value, end of year | | $ | 43.02 | | | $ | 26.48 | | | $ | 18.97 | | | $ | 18.57 | | | $ | 16.81 | | |
| Total return | | | 65.06 | % | | | 39.65 | % | | | 6.61 | % | | | 12.16 | % | | | 65.29 | % | |
| Ratios/supplemental data: | |
| Net assets, end of year (millions) | | $ | 293.2 | | | $ | 143.0 | | | $ | 111.0 | | | $ | 112.3 | | | $ | 116.5 | | |
| Ratio of expenses to average net assets | | | 1.44 | % | | | 1.59 | % | | | 1.63 | % | | | 1.67 | % | | | 1.81 | % | |
| Ratio of net investment income to average net assets | | | 1.17 | % | | | 2.01 | % | | | 1.74 | % | | | 1.26 | % | | | 2.01 | % | |
| Portfolio turnover rate | | | 10.00 | % | | | 64.81 | % | | | 12.51 | % | | | 15.37 | % | | | 28.57 | % | |
(1) Amount represents less than $0.01 per share.
The accompanying notes are an integral part of these financial statements.
60
FINANCIAL HIGHLIGHTS
For a capital share outstanding throughout the period
| | | Year Ended December 31, | | June 30, 2004(1)
Through | |
| Global Energy Fund | | 2007 | | 2006 | | 2005 | | December 31, 2004 | |
| Net asset value, beginning of period | | $ | 25.54 | | | $ | 24.62 | | | $ | 15.25 | | | $ | 12.50 | | |
| Income from investment operations: | |
| Net investment income (loss) | | | 0.05 | | | | 0.01 | | | | (0.02 | ) | | | — | (2) | |
| Net realized and unrealized gain on investments and foreign currency | | | 9.50 | | | | 2.44 | | | | 9.75 | | | | 2.70 | | |
| Total from investment operations | | | 9.55 | | | | 2.45 | | | | 9.73 | | | | 2.70 | | |
| Less distributions: | |
| From net investment income | | | (0.27 | ) | | | (0.21 | ) | | | — | | | | — | | |
| From net realized gain | | | (2.96 | ) | | | (1.34 | ) | | | (0.39 | ) | | | — | | |
| Total distributions | | | (3.23 | ) | | | (1.55 | ) | | | (0.39 | ) | | | — | | |
| Redemption fee proceeds | | | — | | | | 0.02 | | | | 0.03 | | | | 0.05 | | |
| Net asset value, end of period | | $ | 31.86 | | | $ | 25.54 | | | $ | 24.62 | | | $ | 15.25 | | |
| Total return | | | 37.25 | % | | | 9.85 | % | | | 63.92 | % | | | 22.00 | %(3) | |
| Ratios/supplemental data: | |
| Net assets, end of period (millions) | | $ | 69.7 | | | $ | 65.0 | | | $ | 98.7 | | | $ | 1.6 | | |
| Ratio of expenses to average net assets: | |
| Before fees waived | | | 1.37 | % | | | 1.45 | % | | | 1.50 | % | | | 17.36 | %(4) | |
| After fees waived | | | 1.37 | % | | | 1.45 | % | | | 1.45 | % | | | 1.45 | %(4) | |
| Ratio of net investment income (loss) to average net assets: | |
| Before fees waived | | | 0.22 | % | | | 0.04 | % | | | (0.24 | )% | | | (15.84 | )%(4) | |
| After fees waived | | | 0.22 | % | | | 0.04 | % | | | (0.19 | )% | | | 0.07 | %(4) | |
| Portfolio turnover rate | | | 31.13 | % | | | 47.22 | % | | | 89.24 | % | | | 9.96 | %(3) | |
(1) Commencement of Operations.
(2) Amount represents less than $0.01 per share.
(3) Not annualized.
(4) Annualized.
The accompanying notes are an integral part of these financial statements.
61
FINANCIAL HIGHLIGHTS
For a capital share outstanding throughout the year
| | | Year Ended December 31, | |
| Global Innovators Fund | | 2007 | | 2006 | | 2005 | | 2004 | | 2003 | |
| Net asset value, beginning of year | | $ | 17.98 | | | $ | 15.14 | | | $ | 13.54 | | | $ | 12.21 | | | $ | 8.98 | | |
| Income from investment operations: | |
| Net investment income (loss) | | | 0.08 | | | | 0.01 | | | | (0.05 | ) | | | (0.02 | ) | | | (0.08 | ) | |
Net realized and unrealized gain (loss)
on investments | | | 3.72 | | | | 2.83 | | | | 1.65 | | | | 1.35 | | | | 3.31 | | |
| Total from investment operations | | | 3.80 | | | | 2.84 | | | | 1.60 | | | | 1.33 | | | | 3.23 | | |
| Less distributions: | |
| From net investment income | | | (0.11 | ) | | | — | | | | — | | | | — | | | | — | | |
| Total distributions | | | (0.11 | ) | | | — | | | | — | | | | — | | | | — | | |
| Redemption fee proceeds | | | 0.01 | | | | — | (1) | | | — | (1) | | | — | (1) | | | — | (1) | |
| Net asset value, end of year | | $ | 21.68 | | | $ | 17.98 | | | $ | 15.14 | | | $ | 13.54 | | | $ | 12.21 | | |
| Total return | | | 21.17 | % | | | 18.76 | % | | | 11.82 | %(2) | | | 10.89 | % | | | 35.97 | % | |
| Ratios/supplemental data: | |
| Net assets, end of year (millions) | | $ | 72.8 | | | $ | 39.3 | | | $ | 36.4 | | | $ | 42.1 | | | $ | 49.8 | | |
| Ratio of expenses to average net assets: | |
| Before fees waived | | | 1.44 | % | | | 1.64 | % | | | 1.66 | % | | | 1.68 | % | | | 1.76 | % | |
| After fees waived | | | 1.44 | % | | | 1.55 | % | | | 1.66 | %(2) | | | 1.68 | %(2) | | | 1.56 | %(2) | |
| Ratio of net investment income (loss) to average net assets: | |
| Before fees waived | | | 0.49 | % | | | (0.00 | )% | | | (0.32 | )% | | | (0.17 | )% | | | (0.90 | )% | |
| After fees waived | | | 0.49 | % | | | 0.09 | % | | | (0.32 | )% | | | (0.17 | )% | | | (0.70 | )% | |
| Portfolio turnover rate | | | 25.54 | % | | | 36.53 | % | | | 27.75 | % | | | 50.57 | % | | | 0.00 | % | |
(1) Amount represents less than $0 .01 per share.
(2) The Fund's total operating expense was limited at 1.88% from 4/23/03 to 10/31/05. It was limited to 1.35% prior to 4/26/03.
The accompanying notes are an integral part of these financial statements.
62
NOTES TO FINANCIAL STATEMENTS - December 31, 2007
Note 1
Organization
Guinness Atkinson Funds (the "Trust"), was organized on April 28, 1997 as a Delaware business trust and registered under the Investment Company Act of 1940, as amended (the "1940 Act"), as a non-diversified, open-end management investment company. Currently, the Trust offers six separate series: Guinness Atkinson Alternative Energy Fund (the "Alternative Energy Fund"), Guinness Atkinson Asia Focus Fund (the "Asia Focus Fund"), Guinness Atkinson Asia Pacific Dividend Fund (the "Asia Pacific Dividend Fund"), Guinness Atkinson China & Hong Kong Fund (the "China & Hong Kong Fund"), Guinness Atkinson Global Energy Fund (the "Global Energy Fund") and Guinness Atkinson Global Innovators Fund (the "Global Innovators Fund"), all of which (each a "Fund" and collectively, the "Funds") are covered by this report. The China & Hong Kong Fund began operations on June 30, 1994, the Asia Focus Fund began operations on April 29, 1996, the Global I nnovators Fund began operations on December 15, 1998, the Global Energy Fund began operations on June 30, 2004 and the Alternative Energy Fund and the Asia Pacific Dividend Fund began operations on March 31, 2006.
The Alternative Energy Fund and Asia Focus Fund's investment objective is long-term capital appreciation. The Asia Pacific Dividend Fund's investment objective is to provide investors with dividend income and long-term capital growth. The China & Hong Kong Fund's investment objective is long-term capital appreciation primarily through investments in securities of China and Hong Kong. The Global Energy Fund and Global Innovators Fund's investment objective is long-term capital appreciation.
Note 2
Significant accounting policies
The following is a summary of significant accounting policies consistently followed by the Funds. These policies are in conformity with accounting principles generally accepted in the United States of America.
A. Security Valuation. Securities of the Funds that are traded on a principal exchange (U.S. or foreign) or NASDAQ are valued at the official closing price on each day that the exchanges are open for trading. Securities traded on an exchange for which there have been no sales, and other over-the-counter securities are valued at the mean between the bid and asked prices. Securities for which quotations are not readily available are valued at their respective fair values as determined in good faith by the Investment Advisor in accordance with procedures established by the Board of Trustees. In determining fair value, the Funds take into account all relevant factors and available information. Consequently, the price of the security used to calculate its Net Asset Value may differ from quoted or published prices for the same security. Fair value pricing inv olves subjective judgments and there is no single standard for determining a security's fair value. As a result, different mutual funds could reasonably arrive at different fair value for the same security. It is possible that the fair value determined for a security is materially different from the value that could be realized upon the sale of that security or from the values that other mutual funds may determine. Short-term investments are stated at cost, combined with accrued interest, which approximates market value. Realized gains and losses from securities transactions are calculated using the identified cost method.
Foreign securities are recorded in the financial statements after translation to U.S. dollars based on the applicable exchange rate at the end of the period. The Funds do not isolate that portion of the results of operations resulting from changes in the currency exchange rate from the fluctuations resulting from changes in the market prices of investments.
Foreign exchange gain or loss resulting from holding of a foreign currency, expiration of a currency exchange contract, difference in exchange rates between the trade date and settlement date of an investment purchased or sold, and the difference between dividends actually received compared to the amount shown in a Fund's accounting records on the date of receipt are shown as net realized gains or losses on foreign currency transactions in the respective Fund's statement of operations.
B. Forward Foreign Currency Exchange Contracts. The Funds may utilize forward foreign currency exchange contracts ("forward contracts") to hedge against foreign exchange fluctuations on foreign denominated investments under which they are obligated to exchange currencies at specific future dates and at specified rates. All commitments are "marked-to-market" daily and any resulting unrealized gains or losses are included as unrealized appreciation (depreciation) on foreign currency denominated assets and liabilities. The Funds record realized gains or losses at the time the forward contract is settled. Risks may arise upon entering these contracts from the potential inability of a counter party to meet the terms of their contracts and from unanticipated movements in the value of a foreign currency relative to the U.S. dollar or other currencies. Counterp arties to these contracts are major U.S. financial institutions. Please refer to Note 6 for further information on Forward Contracts in each Fund.
63
C. Restricted Securities. A restricted security cannot be resold to the general public without prior registration under the Securities Act of 1933. If the security is subsequently registered and resold, the issuers would typically bear the expense of all registrations at no cost to the Fund. Restricted securities are valued according to the guidelines and procedures adopted by the Funds' Board of Trustees.
D. Security Transactions, Dividend Income and Distributions. Security transactions are accounted for on the trade date. Dividend income and distributions to shareholders are recorded on the ex-dividend date. Realized gains and losses from securities transactions are calculated using the identified cost method.
E. Allocation of Expenses. Each Fund is charged for those expenses directly attributable to it. Expenses that are not directly attributable to a Fund are allocated among the Funds in proportion to their respective assets or another appropriate method.
F. Concentration of Risk. The Alternative Energy Fund invests substantially in the alternative energy or energy technology sectors. The Asia Focus Fund invests substantially all of its assets in the Asian continent. The Asia Pacific Dividend Fund invests primarily in dividend-producing equity securities of Asia Pacific companies. The China & Hong Kong Fund invests substantially all of its assets in securities that are traded in China or Hong Kong or that are issued by companies that do a substantial part of their business in China. The Global Energy Fund invests substantially in energy companies; the changes in the prices and supplies of oil and other energy fuels may affect the Funds' investments. The consequences of political, social, or economic changes in the countries or business sectors in which the securities are offered or the issuers conduc t their operations may affect the market prices of the Funds' investments and any income generated, as well as the Funds' ability to repatriate such amounts.
G. Organization Costs. In accordance with Statement of Position 98-5, Reporting on the Costs of Start-Up Activities, organization costs for the Alternative Energy Fund and the Asia Pacific Dividend Fund, which commenced operations on March 31, 2006, were expensed as incurred. Offering costs are deferred and amortized over twelve months on a straight-line basis.
H. Use of Estimates. The preparation of financial statements in conformity with accounting principles generally accepted in the United States requires management to make estimates and assumptions that affect the reported amounts of assets and liabilities and the disclosure of contingent assets and liabilities at the date of the financial statements. Actual results could differ from those estimates.
I. Reclassifications. Accounting principals generally accepted in the United States require that certain components of net assets be reclassified between financial and tax reporting. These reclassifications have no effect on net assets or net asset value per share. For the year ended December 31, 2007, permanent differences in book and tax accounting have been reclassified to paid-in capital, undistributed net investment income/(loss) and accumulated realized gain(loss) as follows:
| | | Increase (Decrease) | |
| | | Paid in Capital | | Undistributed Net
Investment
Income/(Loss) | | Accumulated
Gains or
(Losses) | |
| Alternative Energy Fund | | | 8,012 | | | | 912,528 | | | | (920,540 | ) | |
| Asia Focus Fund | | | (419,508 | ) | | | (5,467 | ) | | | 424,975 | | |
| Asia Pacific Dividend Fund | | | 486 | | | | 138,805 | | | | (139,291 | ) | |
| China & Hong Kong Fund | | | 0 | | | | 182,369 | | | | (182,369 | ) | |
| Global Energy Fund | | | 0 | | | | 421,876 | | | | (421,876 | ) | |
| Global Innovators Fund | | | (10,969 | ) | | | 19,470 | | | | (8,501 | ) | |
The permanent differences primarily relate to expired capital loss carryovers, lost operating losses, foreign currency reclasses and adjustments for the sale of PFICS.
J. Indemnifications. Under the Funds' organizational documents, its current and former officers and trustees are indemnified against certain liabilities arising out of the performance of their duties to the Funds. In addition, in the normal course of business, the Funds enter into contracts that contain a variety of representations and warranties that provide general indemnifications. The Funds' maximum exposure under these arrangements is unknown as this would involve future claims that may be made against the Funds that have not yet occurred or that would be covered by other parties.
K. Federal Income Taxes. The Funds intend to comply with the requirements of Subchapter M of the Internal Revenue Code applicable to regulated investment companies, and to distribute all of their taxable income to their shareholders. Therefore, no federal income tax provision is required.
64
On July 13, 2006, the Financial Accounting Standards Board (FASB) released FASB Interpretation No. 48 "Accounting for Uncertainty in Income Taxes" (FIN 48). FIN 48 provides guidance for how uncertain tax positions should be recognized, measured, presented and disclosed in the financial statements. FIN 48 requires the evaluation of tax positions taken or expected to be taken in the course of preparing the Funds' tax returns to determine whether the tax positions are "more likely than not" of being sustained by the applicable tax authority. Tax positions not deemed to meet the more-likely-than-not threshold would be recorded as a tax benefit or expense in the current year. On June 29, 2007, the Funds implemented the provision of FIN 48. Management of the Funds has reviewed the tax positions for each of the open tax years 2004 through 2007 and has determined that the implementation of FIN 48 did not have a material impact on the Funds' financia l statements.
Note 3
Investment Advisory and Other Agreements
The Trust, on behalf of each Fund, entered into an Investment Advisory Agreement with Guinness Atkinson Asset Management, Inc. (the "Advisor"), which provided the Funds with investment management services under an investment advisory agreement. The Advisor furnishes all investment advice, office space, facilities, and most of the personnel needed by the Funds. As compensation for its services, the Advisor is entitled to a monthly fee at the following annual rates based upon the average daily net assets of the Funds:
| Alternative Energy Fund | | | 1.00 | % | |
| Asia Pacific Dividend Fund | | | 1.00 | % | |
| Asia Focus Fund | | | 1.00 | % | |
| China & Hong Kong Fund | | | 1.00 | % | |
| Global Energy Fund | | | 0.75 | % | |
| Global Innovators Fund | | | 0.75 | % | |
The Funds are responsible for their own operating expenses. The Advisor has contractually agreed to limit the Funds' total operating expenses by reducing all or a portion of their fees and reimbursing the Funds' for expenses so that its ratio of expenses to average daily net assets will not exceed the following levels:
| Alternative Energy Fund | | | 1.98 | % | |
| Asia Pacific Dividend Fund | | | 1.98 | % | |
| Asia Focus Fund | | | 1.98 | % | |
| China & Hong Kong Fund | | | 1.98 | % | |
| Global Energy Fund | | | 1.45 | % | |
| Global Innovators Fund | | | 1.55 | % | |
To the extent that the Advisor waives fees and/or absorbs expenses it may seek repayment of a portion or all of such amounts at any time within three fiscal years after the fiscal year in which such amounts were waived or absorbed, subject to the applicable cap. For the year ended December 31, 2007, the Advisor waived fees and absorbed expenses of $8,020 from the Asia Pacific Dividend Fund. The Advisor recovered previously waived expenses of $57,011, $14,993 and $32,946 from the Alternative Energy Fund, Global Energy Fund and Global Innovators Fund respectively during the year ended December 2007.
At December 31, 2007 the Advisor may recapture a portion of the following amounts that has been paid and/or waived on behalf of the Funds no later than the dates as stated below:
| Funds: | | December 31, 2008 | | December 31, 2009 | | December 31, 2010 | | Total | |
| Asia Pacific Dividend Fund | | $ | — | | | $ | 95,970 | | | $ | 7,946 | | | $ | 103,916 | | |
U.S. Bancorp Fund Services, LLC (the "Administrator") acts as the Funds' administrator under an administration agreement.
Quasar Distributors, LLC (the "Distributor") acts as the Funds' principal underwriter in a continuous public offering of the Funds' shares. The Distributor is an affiliate of the Administrator.
State Street Bank & Trust is the Funds' Custodian and Fund Accounting Agent. U.S. Bancorp Fund Services, LLC is the Funds' Transfer agent.
65
On August 14, 1998, the Trust approved a Deferred Compensation Plan for Trustees (the "Plan"). Trustees can elect to receive payment in cash or defer payments provided for in the Plan. If a trustee elects to defer payment, the Plan provides for the creation of a deferred payment account (Phantom Share Account). This account accumulates the deferred fees earned, and the value of the account is adjusted at the end of each quarter to reflect the value that would have been earned if the account had been invested in designated investments. The Funds recognize as trustee expense amounts accrued as meetings are attended plus the change in value of the Phantom Share Account.
During the year ended December 31, 2007, the change in the value of the phantom share account included unrealized appreciation were as follows:
| Alternative Energy Fund | | $ | 1,691 | | |
| Asia Focus Fund | | $ | 9,994 | | |
| Asia Pacific Dividend Fund | | $ | 936 | | |
| China & Hong Kong Fund | | $ | 19,103 | | |
| Global Energy Fund | | $ | 3,605 | | |
| Global Innovators Fund | | $ | 14,897 | | |
Certain officers of the Funds are also officers and/or Directors of the Advisor, Administrator and another party providing the services of the Funds' Chief Compliance Officer ("CCO"). None of these officers are compensated directly by the Funds.
Note 4
Shareholder Servicing Plan
Each Fund has adopted a Shareholder Servicing Plan to pay a fee at an annual rate of up to 0.25% of its daily average net assets of shares service by shareholder servicing agents who provide administrative and support services to their customers.
During the year ended December 31, 2007, the following fees were paid to the shareholder servicing agents:
| Alternative Energy Fund | | $ | 151,941 | | |
| Asia Focus Fund | | $ | 102,295 | | |
| Asia Pacific Dividend Fund | | $ | 37,474 | | |
| China & Hong Kong Fund | | $ | 285,773 | | |
| Global Energy Fund | | $ | 70,801 | | |
| Global Innovators Fund | | $ | 86,906 | | |
Note 5
Investment Transactions
The following table presents purchases and sales of securities during the year ended December 31, 2007, excluding short-term investments, to indicate the volume of transactions in each Fund.
| Fund | | Purchases | | Sales | |
| Alternative Energy Fund | | $ | 161,723,569 | | | $ | 42,612,147 | | |
| Asia Focus Fund | | | 28,005,060 | | | | 20,180,876 | | |
| Asia Pacific Dividend Fund | | | 36,828,307 | | | | 7,567,462 | | |
| China & Hong Kong Fund | | | 84,331,524 | | | | 20,837,847 | | |
| Global Energy Fund | | | 18,882,645 | | | | 34,081,894 | | |
| Global Innovators Fund | | | 39,725,850 | | | | 14,241,622 | | |
66
The Funds did not purchase U.S. Government securities as a part of the long-term investment strategy during the year ended December 31, 2007.
Note 6
Forward foreign currency contracts
In order to hedge their portfolio and to protect them against possible fluctuations in foreign exchange rates pending the settlement of securities transactions, the Funds may enter into forward currency contracts which obligate them to exchange currencies at specified future dates. At the maturity of a forward contract, the Funds may either make delivery of the foreign currency from currency held, if any, or from the proceeds of the portfolio securities sold. It may also terminate its obligation to deliver the foreign currency at any time by purchasing an offsetting contract. The forward value of amounts due are netted against the forward value of the currency to be delivered, and the net amount is shown as a receivable or payable in the financial statements.
The Funds did not have any outstanding forward contracts as of December 31, 2007.
Note 7
Tax Matters
As of December 31, 2007, the tax basis of investments and the components of distributable earnings on a tax basis were as follows:
| | | Alternative
Energy Fund | | Asia Focus
Fund | | Asia Pacific
Dividend
Fund | | China &
Hong Kong
Fund | | Global
Energy
Fund | | Global
Innovators
Fund | |
| Cost of investment for tax purposes | | $ | 139,727,837 | | | $ | 55,927,216 | | | $ | 31,200,972 | | | $ | 166,500,367 | | | $ | 48,163,693 | | | $ | 60,488,239 | | |
| Gross tax unrealized appreciation | | | 31,637,672 | | | | 25,436,103 | | | | 3,102,470 | | | | 129,763,754 | | | | 21,698,993 | | | | 15,009,604 | | |
| Gross tax unrealized (depreciation) | | | (14,780,853 | ) | | | (2,943,963 | ) | | | (2,286,554 | ) | | | (4,458,257 | ) | | | (2,033,734 | ) | | | (2,736,532 | ) | |
Net tax unrealized appreciation
on investment | | | 16,856,819 | | | | 22,492,140 | | | | 815,916 | | | | 125,305,497 | | | | 19,665,259 | | | | 12,273,072 | | |
Net tax appreciation (depreciation) on
derivatives and foreign-currency
denominated assets and liabilities | | | (4,018 | ) | | | 198 | | | | (716 | ) | | | 20 | | | | 722 | | | | (1,195 | ) | |
| Net tax unrealized appreciation** | | $ | 16,852,801 | | | $ | 22,492,338 | | | $ | 815,200 | | | $ | 125,305,517 | | | $ | 19,665,981 | | | $ | 12,271,877 | | |
| Undistributed net ordinary income*** | | | 3,264,431 | | | | — | | | | 497,363 | | | | 1,520,307 | | | | 21,108 | | | | — | | |
| Undistributed Long-Term Capital Gains | | | — | | | | — | | | | 130,652 | | | | 476,714 | | | | 1,283,759 | | | | — | | |
| Post October loss* | | | (1,893,944 | ) | | | — | | | | — | | | | — | | | | — | | | | (6 | ) | |
| Capital loss carryforward | | | — | | | | (3,649,326 | ) | | | — | | | | — | | | | — | | | | (45,425,805 | ) | |
| Capital loss carryforward limitation | | | — | | | | (434,286 | ) | | | — | | | | (1,215,753 | ) | | | — | | | | (1,397,484 | ) | |
| Other accumulated gain/(loss) | | | (13,377 | ) | | | (40,639 | ) | | | (11,469 | ) | | | (77,855 | ) | | | (14,868 | ) | | | (60,287 | ) | |
| Total accumulated gain/(loss) | | $ | 18,209,911 | | | $ | 18,368,087 | | | $ | 1,431,746 | | | $ | 126,008,930 | | | $ | 20,955,980 | | | $ | (34,611,705 | ) | |
* Under the current tax law, capital and currency losses realized after October 31 and prior to the Fund's fiscal year end may be deferred as occurring on the first day of the following year.
** The differences between book-basis and tax-basis unrealized appreciation/(depreciation) is attributable primary to the tax deferral of losses on wash sales and passive foreign investment company (PFIC) mark to market adjustments.
*** The differences between book-basis and tax basis undistributed net ordinary income is attributed to deferred compensation.
Because tax adjustments are calculated annually, the above table reflects the components of distributable earning at the Fund's previous fiscal year end.
67
As of December 31, 2007, the following funds have capital loss carryforwards available to offset future realized capital gains:
| Capital losses expiring in: | | Alternative
Energy Fund | | Asia Focus
Fund | | Asia Pacific
Dividend
Fund | | China &
Hong Kong
Fund | | Global
Energy
Fund | | Global
Innovators
Fund | |
| | 2009 | | | $ | — | | | $ | 3,445,559 | | | $ | — | | | $ | — | | | $ | — | | | $ | 13,717,026 | | |
| | 2010 | | | | — | | | | 638,053 | | | | — | | | | 1,215,753 | | | | — | | | | 19,915,748 | | |
| | 2011 | | | | — | | | | — | | | | — | | | | — | | | | — | | | | 8,376,172 | | |
| | 2012 | | | | — | | | | — | | | | — | | | | — | | | | — | | | | 4,814,343 | | |
| | Total | | | $ | — | | | $ | 4,083,612 | | | $ | — | | | $ | 1,215,753 | | | $ | — | | | $ | 46,823,289 | | |
For the Asia Focus Fund, $434,286 of capital loss carryover related to the acquistion of New Economy Fund on January 25, 2002 is remaining to be recognized over the next two years. This amount is subject to an annual limitation of $217,143 under tax rules.
For the China & Hong Kong Fund, $1,215,753 of capital loss carryover related to the acquisition of the Investec Mainland China Fund on April 23,2003 is remaining to be recognized over the next three years. This amount is subject to an annual limitation of $425,792 over the next two years and $364,169 on the third year under tax rules.
For the Global Innovators Fund, $1,397,484 of capital loss carryover related to the acquisition of the Investec Internet.com Fund and the Wireless World Fund on January 25, 2002 is remaining to be recognized over the next two years. The amount is subject to an annual limitation of $838,362 over the next year and $559,122 on the second year under tax rules.
Distributions to Shareholders
The tax character of distributions paid during 2007 and 2006 fiscal years are as follows:
| | | Alternative
Energy Fund | | Asia
Focus Fund | | Asia Pacific
Dividend Fund | | China &
Hong Kong
Fund | |
Global
Energy Fund | | Global
Innovators
Fund | |
| | | 2007 | | 2006 | | 2007 | | 2006 | | 2007 | | 2006 | | 2007 | | 2006 | | 2007 | | 2006 | | 2007 | | 2006 | |
| Distributions paid from: | |
| Oridinary income | | $ | 1,131,978 | | | $ | — | | | $ | 894,936 | | | $ | 710,741 | | | $ | 548,060 | | | $ | 15,132 | | | $ | 3,968,807 | | | $ | 53,575 | | | $ | 1,211,643 | | | $ | 2,810,556 | | | $ | 358,091 | | | $ | — | | |
| Long term capital gain | | | — | | | | — | | | | — | | | | — | | | | 163,185 | | | | — | | | | 656,957 | | | | — | | | | 5,281,960 | | | | 1,087,476 | | | | — | | | | — | | |
| Return of capital | | | — | | | | — | | | | — | | | | — | | | | — | | | | — | | | | — | | | | — | | | | — | | | | — | | | | — | | | | — | | |
| Total distributions paid | | $ | 1,131,978 | | | $ | — | | | $ | 894,936 | | | $ | 710,741 | | | $ | 711,245 | | | $ | 15,132 | | | $ | 4,625,764 | | | $ | 53,575 | | | $ | 6,493,603 | | | $ | 3,898,032 | | | $ | 358,091 | | | $ | — | | |
The Funds designated as long-term capital gain dividend, pursuant to Internal Revenue Code Section 852(b)(3), the amount necessary to reduce earnings and profits of the Funds related to net capital gain to zero for the tax year ended 12/31/07.
68
Note 8
Line of Credit
The Trust has a secured $5,000,000 line of credit with its custodian. Borrowings under this arrangement bear interest at the federal funds rate plus 0.75% per annum. As compensation for holding available the lending commitment, the Trust pays a 0.10% per annum fee on the unused portion of the commitment, which is allocated among the Funds based on their relative net assets. The fee is payable quarterly in arrears. The average interest rate charged and the average outstanding loan payable to State Street Bank for the year ended December 31, 2007 was as follows:
| Fund | | Average Interest Rate | | Average Outstanding Loan Payable | |
| Alternative Energy Fund | | | 6.00 | % | | $ | 127,357 | | |
| Asia Focus Fund | | | 6.00 | % | | $ | 649,362 | | |
| Asia Pacific Dividend Fund | | | 6.00 | % | | $ | 176,828 | | |
| China & Hong Kong Fund | | | 6.00 | % | | $ | 67,906 | | |
| Global Energy Fund | | | 6.00 | % | | $ | 165,896 | | |
| Global Innovators Fund | | | 6.00 | % | | $ | 19,237 | | |
Note 9
Accounting Pronouncements
In September 2006, the Financial Accounting Standards Board ("FASB") released Financial Accounting Standard Board Statement No. 157 Fair Value Measurements ("SFAS 157"). SFAS 157 establishes a fair valuation hierarchy to increase consistency and comparability in fair value measurements and related disclosures. The fair value hierarchy prioritizes the inputs to valuation techniques used to measure fair value into three broad levels. The fair value hierarchy gives the highest priority to quoted prices (unadjusted) in active markets for identical assets or liabilities (Level 1) and the lowest priority to unobservable inputs (Level 3). SFAS 157 is effective for financial statements issued for fiscal years beginning after November 15, 2007. Management of the Funds believes that the adoption of SFAS 157 will not have a material impact on the Funds' financial statements.
Additional Information (Unaudited)
Proxy Voting Procedures
The Advisor of the Funds votes proxies relating to portfolio securities in accordance with procedures that have been approved by the Board. You may obtain a description of these procedures, free of charge, by calling "toll-free" 1-800-915-6565. This information is also available through the Securities and Exchange Commission's website at http://www.sec.gov.
Proxy Voting Records
Information regarding how the advisor of the Funds voted proxies relating to portfolio securities during the latest 12-month period ended June 30 is available, without charge, by calling toll-free, 1-800-915-6565. This information is also available through the Securities and Exchange Commission's website at http://www.sec.gov.
Form N-Q Disclosure
The Funds file their complete schedule of portfolio holdings with the Securities and Exchange Commission for the first and third quarters of each fiscal year on Form N-Q. The Funds' Form N-Q is available on the Securities and Exchange Commission's website at http://www.sec.gov. The Funds' Form N-Q may be reviewed and copied at the Commission's Public Reference Room in Washington, DC, and information on the operation of the Public Reference Room may be obtained by calling 1-800-SEC-0330. This information is also available, without charge, by calling toll-free, 1-800-915-6565.
69
Supplemental Tax Information (Unaudited)
For the Fiscal year ended December 31, 2007, certain dividends paid by the Funds may be subject to a maximum tax rate of 15%, as provided for by the Jobs and Growth Tax Relief Reconciliation Act of 2003. The percentage of dividends declared from ordinary income designated as qualified dividend income was as follows:
| Alternative Energy Fund | | | 5.77 | % | |
| Asia Focus Fund | | | 43.84 | % | |
| Asia Pacific Dividend Fund | | | 21.99 | % | |
| China & Hong Kong Fund | | | 78.44 | % | |
| Global Energy Fund | | | 83.69 | % | |
| Global Innovators Fund | | | 88.33 | % | |
For corporate shareholders, the percentage of ordinary income distributions qualifying for the corporate dividends received deduction for the fiscal year ended December 31, 2007, was as follows:
| Alternative Energy Fund | | | 0.32 | % | |
| Asia Focus Fund | | | N/A | | |
| Asia Pacific Dividend Fund | | | N/A | | |
| China & Hong Kong Fund | | | N/A | | |
| Global Energy Fund | | | 28.13 | % | |
| Global Innovators Fund | | | 59.62 | % | |
For the year ended December 31, 2007, the Guinness Atkinson Alternative Energy Fund earned foreign source income and paid foreign taxes which they intend to pass through to their shareholders pursuant to Section 853 of the Internal Revenue Code as follows:
| | | Gross Income | | Foreign Tax
Paid | |
| Austria | | | 4.949 | % | | | 5.577 | % | |
| Australia | | | 22.584 | % | | | 39.825 | % | |
| Brazil | | | 27.108 | % | | | 0.269 | % | |
| Canada | | | 5.757 | % | | | 6.487 | % | |
| France | | | 0.463 | % | | | 0.603 | % | |
| Germany | | | 1.931 | % | | | 2.176 | % | |
| Malaysia | | | 0.341 | % | | | 0.000 | % | |
| New Zealand | | | 6.249 | % | | | 0.000 | % | |
| Philippines | | | 6.138 | % | | | 11.527 | % | |
| Spain | | | 14.308 | % | | | 16.403 | % | |
| Taiwan | | | 10.172 | % | | | 17.133 | % | |
| | | | 100.00 | % | | | 100.00 | % | |
70
For the year ended December 31, 2007, the Guinness Atkinson Asia Focus Fund earned foreign source income and paid foreign taxes which they intend to pass through to their shareholders pursuant to Section 853 of the Internal Revenue Code as follows:
| | | Gross Income | | Foreign Tax
Paid | |
| Bermuda | | | 5.952 | % | | | 0.000 | % | |
| Hong Kong | | | 6.513 | % | | | 0.000 | % | |
| Cayman Islands | | | 1.799 | % | | | 0.000 | % | |
| Singapore | | | 7.238 | % | | | 0.000 | % | |
| China | | | 15.660 | % | | | 0.000 | % | |
| Indonesia | | | 13.712 | % | | | 26.815 | % | |
| South Korea | | | 6.884 | % | | | 14.808 | % | |
| Malaysia | | | 13.713 | % | | | 0.000 | % | |
| Britain | | | 2.176 | % | | | 0.000 | % | |
| Thailand | | | 5.100 | % | | | 5.075 | % | |
| Taiwan | | | 21.254 | % | | | 53.301 | % | |
| | | | 100.00 | % | | | 100.00 | % | |
For the year ended December 31, 2007, the Guinness Atkinson Asia Pacific Fund earned foreign source income and paid foreign taxes which they intend to pass through to their shareholders pursuant to Section 853 of the Internal Revenue Code as follows:
| | | Gross Income | | Foreign Tax
Paid | |
| Australia | | | 9.255 | % | | | 2.434 | % | |
| Bermuda | | | 8.537 | % | | | 0.000 | % | |
| Hong Kong | | | 5.875 | % | | | 0.000 | % | |
| Cayman Islands | | | 3.186 | % | | | 0.000 | % | |
| Singapore | | | 11.307 | % | | | 0.000 | % | |
| China | | | 2.447 | % | | | 0.000 | % | |
| Indonesia | | | 2.327 | % | | | 3.965 | % | |
| South Korea | | | 0.410 | % | | | 0.769 | % | |
| Malaysia | | | 7.986 | % | | | 0.000 | % | |
| New Zealand | | | 1.443 | % | | | 0.000 | % | |
| Philippines | | | 5.779 | % | | | 16.418 | % | |
| Britain | | | 2.054 | % | | | 0.000 | % | |
| Thailand | | | 9.180 | % | | | 10.158 | % | |
| Taiwan | | | 30.213 | % | | | 66.256 | % | |
| | | | 100 | % | | | 100 | % | |
71
For the year ended December 31, 2007, the Guinness Atkinson Global Energy Fund earned foreign source income and paid foreign taxes which they intend to pass through to their shareholders pursuant to Section 853 of the Internal Revenue Code as follows:
| | | Gross Income | | Foreign Tax
Paid | |
| Austria | | | 5.560 | % | | | 8.747 | % | |
| Brazil | | | 10.363 | % | | | 4.504 | % | |
| Britain | | | 10.706 | % | | | 0.000 | % | |
| Canada | | | 18.903 | % | | | 26.421 | % | |
| Cayman Islands | | | 1.753 | % | | | 0.000 | % | |
| China | | | 0.104 | % | | | 0.000 | % | |
| France | | | 5.854 | % | | | 9.209 | % | |
| Hong Kong | | | 4.836 | % | | | 0.000 | % | |
| Italy | | | 7.632 | % | | | 12.006 | % | |
| Netherlands | | | 11.462 | % | | | 18.030 | % | |
| Norway | | | 13.402 | % | | | 21.082 | % | |
| South Africa | | | 9.424 | % | | | 0.000 | % | |
| | | | 100 | % | | | 100 | % | |
For the year ended December 31, 2007, the Guinness Atkinson Global Innovators Fund earned foreign source income and paid foreign taxes which they intend to pass through to their shareholders pursuant to Section 853 of the Internal Revenue Code as follows:
| | | Gross Income | | Foreign Tax
Paid | |
| Britain | | | 46.244 | % | | | 0.000 | % | |
| Cayman Islands | | | 4.255 | % | | | 0.000 | % | |
| Finland | | | 9.658 | % | | | 27.167 | % | |
| Hong Kong | | | 5.634 | % | | | 0.000 | % | |
| Japan | | | 12.221 | % | | | 12.823 | % | |
| South Korea | | | 2.722 | % | | | 8.574 | % | |
| Netherlands | | | 4.190 | % | | | 0.000 | % | |
| Taiwan | | | 15.075 | % | | | 51.436 | % | |
| | | | 100 | % | | | 100 | % | |
72
REPORT OF INDEPENDENT REGISTERED
PUBLIC ACCOUNTING FIRM
To the Shareholders and Board of Trustees
Guinness Atkinson Funds
Glendora, California
We have audited the accompanying statements of assets and liabilities, including the schedules of investments, of the Alternative Energy Fund, Asia Focus Fund, Asia Pacific Dividend Fund, China & Hong Kong Fund, Global Energy Fund and Global Innovators Fund (the "Funds"), each a series of shares of the Guinness Atkinson Funds, as of December 31, 2007, the related statements of operations for the year then ended, the statements of changes in net assets for each of the two years in the period then ended (with respect to the Alternative Energy Fund and Asia Pacific Dividend Fund for the year then ended and the period March 31, 2006 to December 31, 2006), and the financial highlights for each of the five years in the period then ended (with respect to the Alternative Energy Fund and Asia Pacific Dividend Fund for the year then ended and the period March 31, 2006 to December 31, 2006, and with respect to Global Energy Fund for ea ch of the three years in the period then ended and the period June 30, 2004 to December 31, 2004). These financial statements and financial highlights are the responsibility of the Funds' management. Our responsibility is to express an opinion on these financial statements and financial highlights based on our audits.
We conducted our audits in accordance with the standards of the Public Company Accounting Oversight Board (US). Those standards require that we plan and perform the audits to obtain reasonable assurance about whether the financial statements and financial highlights are free of material misstatement. The Funds are not required to have, nor were we engaged to perform, an audit of its internal control over financial reporting. Our audits included consideration of internal control over financial reporting as a basis for designing audit procedures that are appropriate in the circumstances, but not for the purpose of expressing an opinion on the effectiveness of the Funds' internal control over financial reporting. Accordingly, we express no such opinion. An audit includes examining, on a test basis, evidence supporting the amounts and disclosures in the financial statements. Our procedures included confirmation of securities owned a s of December 31, 2007, by correspondence with the custodian and brokers or by other appropriate procedures where replies from the brokers were not received. An audit also includes assessing the accounting principles used and significant estimates made by management, as well as evaluating the overall financial statement presentation. We believe that our audits provide a reasonable basis for our opinion.
In our opinion, the financial statements and financial highlights referred to above present fairly in all material respects, the financial position of the above mentioned Funds as of December 31, 2007, the results of their operations, the changes in their net assets and the financial highlights for the periods indicated above, in conformity with accounting principles generally accepted in the United States of America.

Philadelphia, Pennsylvania
February 25, 2008
73
TRUSTEE AND OFFICER INFORMATION (Unaudited)
Name, Address,
and Age | | Position(s) Held with Trusts | | Date Elected† | | Principal Occupation(s) During the Past 5 Years | | Number of Portfolios In Fund Complex Overseen by Trustee | | Other Directorships Held by Trustee | |
Timothy W.N.
Guinness
14 Queen Anne's Gate Westminster,
London SW1H 9AA
U.K.
(60) | | Trustee | | August 1998 | | Chairman of Guinness Asset Management Ltd., investment adviser in London, since 2003. Chairman/CIO of Guinness Atkinson, since November 2002. Joint Chairman of Investec Asset Management Ltd. September 1998 to March 2003. | | | 6 | | | Investec Global Strategy Fund Limited, Investec International Accumulation Fund Limited, Investec Select Funds Plc, Investec High Income Trust Plc, SR Europe Investment Trust Plc. Atlantis Japan Growth Fund Ltd., New Boathouse Capital Ltd. Guinness Asset Management Ltd. | |
|
James I. Fordwood*
21550 Oxnard Street,
Suite 750
Woodland Hills, CA
91367
(61) | | Trustee | | April 1994 | | CFO and Managing Member of Prima Marketing LLC (network of convenience stores) | | | 6 | | | J.L. Energy, Inc., Intoil, Inc., Fior D'Italia. | |
|
Dr. Gunter Dufey*
21550 Oxnard Street,
Suite 750
Woodland Hills, CA
91367
(68) | | Trustee | | April 1994 | | Pacific International Business Associates, a consulting firm in Singapore since 2002. Professor (em.) of Ross School at The University of Michigan, where he served from 1968-2002. | | | 6 | | | Independent director, four subsidiaries of GMAC in the United States and Canada. | |
|
Dr. Bret A. Herscher*
21550 Oxnard Street,
Suite 750
Woodland Hills, CA 91367
(48) | | Trustee | | April 1994 | | President of Pacific Consultants, a technical and technology management consulting company serving the Electronic industry and venture capital community that he co-founded. | | | 6 | | | Strawberry Tree Inc. | |
|
J. Brooks Reece, Jr.*
21550 Oxnard Street,
Suite 750
Woodland Hills, CA
91367
(61) | | Trustee and Chairman | | April 1994 | | Vice President of Adcole Corp. a manufacturer of precision measuring machines and sun angle sensors for space satellites. | | | 6 | | | Adcole Far East Ltd. | |
|
* Not an "interested person", as defined in the 1940 Act of the Funds.
† Trustees and officers of the Fund serve until their resignation, removal or retirement.
74
Name, Address,
and Age | | Position(s) Held with Trusts | | Date Elected† | | Principal Occupation(s) During the Past 5 Years | | Number of Portfolios In Fund Complex Overseen by Trustee | | Other Directorships Held by Trustee | |
Jim Atkinson
21550 Oxnard Street,
Suite 750
Woodland Hills, CA
91367
(50) | | President | | April 2003 | | Chief Executive Officer and Director of Guinness Atkinson since November 2002. Principal of ORBIS Marketing, a mutual fund marketing and advertising firm since November 2001. President of MAXfunds.com from September 2000 to March 2001. Managing Director of Guinness Flight Global Asset Management US (1993-2000). | | N/A | | N/A | |
|
Richard F. Cook, Jr.
2 Portland Square Portland, ME 04101
(56) | | Chief Compliance Officer | | December
2005 | | Director of Foreside Compliance Services LLC since January 2006. Officer of Foresides Fund Services LLC from November 2005 to January 2006. From 2002, Founder and Managing Member of NorthLake, LLC. From 1985 – 2002, Executive Officer, Director and Shareholder of Century Capital Management, Inc. and Secretary of Century Shares Trust. | | N/A | | N/A | |
|
Michael Ricks
2020 E. Financial Way,
Suite 100
Glendora, CA
91741
(30) | | Treasurer | | September
2006 | | Assistant Vice-President U.S. Bancorp Fund Services LLC since 2001. | | N/A | | N/A | |
|
Keith Shintani
2020 E. Financial Way,
Suite 100
Glendora, CA
91741
(44) | | Secretary | | September
2006 | | Vice President of Relationship Management for U. S. Bancorp Fund Services, LLC since 2001. | | N/A | | N/A | |
|
† Trustees and officers of the Fund serve until their resignation, removal or retirement.
75
Privacy Notice
Guinness Atkinson Funds and Guinness Atkinson Asset Management, Inc. may collect non-public information about you from the following sources:
• Information we receive about you on applications or other forms;
• Information you give us orally; and
• Information about your transactions with us.
We do not disclose any non-public personal information about our shareholders or former shareholders without the shareholder's authorization, except as required by law or in response to inquiries from governmental authorities. We restrict access to your personal and account information to those employees who need to know that information to provide products and services to you. We also may disclose that information to unaffiliated third parties (such as to brokers or custodians) only as permitted by law and only as needed for us to provide agreed services to you. We maintain physical, electronic and procedural safeguards to guard your non-public personal information.
76
Guinness Atkinson Funds Information
Board of Trustees
| J. Brooks Reece, Jr., Chairman | |
|
| Dr. Gunter Dufey | |
|
| James I. Fordwood | |
|
| Timothy W.N. Guinness | |
|
| Dr. Bret A. Herscher | |
|
Contact Guinness Atkinson Funds
| P.O. Box 701 | |
|
| Milwaukee, WI 53201-0701 | |
|
| Shareholder Services: 800-915-6566 | |
|
| Literature Request: 800-915-6565 | |
|
| Website: www.gafunds.com | |
|
| Email: info@gafunds.com | |
|
| Guinness Atkinson Funds | |
| Fund | | Cusip | | Ticker | | Fund# | |
| Alternative Energy Fund | | | 402031 50 4 | | | GAAEX | | | 1298 | | |
| Asia Focus Fund | | | 402031 10 8 | | | IASMX | | | 1096 | | |
| Asia Pacific Dividend Fund | | | 402031 60 3 | | | GAADX | | | 1299 | | |
| China & Hong Kong Fund | | | 402031 20 7 | | | ICHKX | | | 1094 | | |
| Global Energy Fund | | | 402031 40 5 | | | GAGEX | | | 1098 | | |
| Global Innovators Fund | | | 402031 30 6 | | | IWIRX | | | 1095 | | |
.
Distributed by Quasar Distributors, LLC, Milwaukee, WI 53202
This report is intended for shareholders of the Guinness Atkinson Funds and may not be used as literature unless preceded or accompanied by a current prospectus.
77
78
79
Guinness Atkinson Funds
c/o U.S. Bancorp Fund Services, LLC
P.O. Box 701
Milwaukee, WI 53201-0701
123S0204--P
Item 2. Code of Ethics.
The registrant has adopted a code of ethics that applies to the registrant’s principal executive officer and principal financial officer. The registrant has not made any amendments to its code of ethics during the period covered by this report. The registrant has not granted any waivers from any provisions of the code of ethics during the period covered by this report.
A copy of the registrant’s Code of Ethics is filed herewith.
Item 3. Audit Committee Financial Expert.
The registrant’s board of trustees has determined that there is at least one audit committee financial expert serving on its audit committee. Hamish Fordwood is the “audit committee financial expert” and is considered to be “independent” as each term is defined in Item 3 of Form N-CSR.
Item 4. Principal Accountant Fees and Services.
The registrant has engaged its principal accountant to perform audit services, audit-related services, tax services and other services during the past two fiscal years. “Audit services” refer to performing an audit of the registrant’s annual financial statements or services that are normally provided by the accountant in connection with statutory and regulatory filings or engagements for those fiscal years. “Audit-related services” refer to the assurance and related services by the principal accountant that are reasonably related to the performance of the audit. “Tax services” refer to professional services rendered by the principal accountant for tax compliance, tax advice, and tax planning. The following table details the aggregate fees billed or expected to be billed for each of the last two fiscal years for audit fees, audit-related fees, tax fees and other fees by the principal accountant.
| | FYE 12/31/2007 | | FYE 12/31/2006 | |
Audit Fees | | $ | 98,400 | | $ | 90,400 | |
Audit-Related Fees | | None | | None | |
Tax Fees | | $ | 15,600 | | $ | 15,600 | |
All Other Fees | | None | | None | |
The audit committee has adopted pre-approval policies and procedures that require the audit committee to pre-approve all audit and non-audit services of the registrant, including services provided to any entity affiliated with the registrant. All of the principal accountant’s hours spent on auditing the registrant’s financial statements were attributed to work performed by full-time permanent employees of the principal accountant. (If more than 50 percent of the accountant’s hours were spent to audit the registrant’s financial statements for the most recent fiscal year, state how many hours were attributed to work performed by persons other than the principal accountant’s full-time, permanent employees.)
The following table indicates the non-audit fees billed or expected to be billed by the registrant’s accountant for services to the registrant and to the registrant’s investment adviser (and any
1
other controlling entity, etc.—not sub-adviser) for the last two years. The audit committee of the board of trustees/directors has considered whether the provision of non-audit services that were rendered to the registrant’s investment adviser is compatible with maintaining the principal accountant’s independence and has concluded that the provision of such non-audit services by the accountant has not compromised the accountant’s independence.
Non-Audit Related Fees | | FYE 12/31/2003 | | FYE 12/31/2002 | |
Registrant | | None | | None | |
Registrant’s Investment Adviser | | None | | None | |
Item 5. Audit Committee of Listed Registrants.
Not applicable to registrants who are not listed issuers (as defined in Rule 10A-3 under the Securities Exchange Act of 1934).
Item 6. Schedule of Investments.
Schedule of Investments is included as part of the report to shareholders filed under Item 1 of this Form.
Item 7. Disclosure of Proxy Voting Policies and Procedures for Closed-End Management Investment Companies.
Not applicable to open-end investment companies.
Item 8. Portfolio Managers of Closed-End Management Investment Companies.
Not applicable to open-end investment companies.
Item 9. Purchases of Equity Securities by Closed-End Management Investment Company and Affiliated Purchasers.
Not applicable to open-end investment companies.
Item 10. Submission of Matters to a Vote of Security Holders.
Not Applicable
Item 11. Controls and Procedures.
(a) | The Registrant’s President/Chief Executive Officer and Treasurer/Chief Financial Officer have reviewed the Registrant’s disclosure controls and procedures (as defined in Rule 30a-3(c) under the Investment Company Act of 1940 (the “Act”)) as of a date within 90 days of the filing of this report, as required by Rule 30a-3(b) under the Act and Rules 13a-15(b) or 15d-15(b) under the Securities Exchange Act of 1934. Based on their review, such officers have concluded that the disclosure controls and procedures are effective in ensuring that information required to be disclosed in this report is appropriately recorded, processed, summarized and reported and made known to them by others within the Registrant and by the Registrant’s service provider. |
2
(b) | There were no changes in the Registrant’s internal control over financial reporting (as defined in Rule 30a-3(d) under the Act) that occurred during the second fiscal quarter of the period covered by this report that has materially affected, or is reasonably likely to materially affect, the Registrant’s internal control over financial reporting. |
Item 12. Exhibits.
(a) (1) Any code of ethics or amendment thereto, that is subject of the disclosure required by Item 2, to the extent that the registrant intends to satisfy Item 2 requirements through filing an exhibit. Filed herewith.
(2) Certifications pursuant to Section 302 of the Sarbanes-Oxley Act of 2002. Filed herewith.
(3) Any written solicitation to purchase securities under Rule 23c-1 under the Act sent or given during the period covered by the report by or on behalf of the registrant to 10 or more persons. Not applicable to open-end investment companies.
(b) Certification pursuant to Section 906 of the Sarbanes-Oxley Act of 2002. Furnished herewith.
3
SIGNATURES
Pursuant to the requirements of the Securities Exchange Act of 1934 and the Investment Company Act of 1940, the registrant has duly caused this report to be signed on its behalf by the undersigned, thereunto duly authorized.
(Registrant) | Guinness Atkinson Funds | |
|
By | /s/ James J. Atkinson | |
| James J. Atkinson, Jr., President | |
|
Date | March 7th, 2008 | |
| | | | | | |
Pursuant to the requirements of the Securities Exchange Act of 1934 and the Investment Company Act of 1940, this report has been signed below by the following persons on behalf of the registrant and in the capacities and on the dates indicated.
By (Signature and Title) | /s/ James J. Atkinson | |
| James J. Atkinson, Jr., President | | |
| | |
Date | March 7th, 2008 | | | |
| | | | | |
By (Signature and Title) | /s/ Michael J. Ricks | |
| Michael J. Ricks, Treasurer | |
4