UNITED STATES
SECURITIES AND EXCHANGE COMMISSION
Washington, D.C. 20549
FORM N-CSR
CERTIFIED SHAREHOLDER REPORT OF REGISTERED
MANAGEMENT INVESTMENT COMPANIES
Investment Company Act file number | 811-08360 |
|
GUINNESS ATKINSON FUNDS |
(Exact name of registrant as specified in charter) |
|
225 South Lake Avenue, Suite 216 Pasadena, CA | | 91101 |
(Address of principal executive offices) | | (Zip code) |
|
James J. Atkinson, Jr. 225 South Lake Avenue, Suite 216 Pasadena, CA 91101 |
(Name and address of agent for service) |
|
Registrant’s telephone number, including area code: | (800-915-6566) | |
|
Date of fiscal year end: | December 31 | |
|
Date of reporting period: | December 31, 2018 | |
| | | | | | | | |
Item 1. Reports to Stockholders.
The registrant’s annual report transmitted to shareholders pursuant to Rule 30e-1 under the Investment Company Act of 1940, as amended (the “Investment Company Act”), is as follows:
2
Guinness AtkinsonTM Funds
Annual Report
December 31, 2018
TABLE OF CONTENTS
| | 5 | | | Letter to Shareholders | |
| | 7 | | | Expense Examples | |
| | 8 | | | Alternative Energy Fund | |
| | 16 | | | Asia Focus Fund | |
| | 23 | | | Asia Pacific Dividend Builder Fund | |
| | 30 | | | China & Hong Kong Fund | |
| | 37 | | | Dividend Builder Fund | |
| | 48 | | | Global Energy Fund | |
| | 58 | | | Global Innovators Fund | |
| | 67 | | | Renminbi Yuan & Bond Fund | |
| | 72 | | | Statements of Assets and Liabilities | |
| | 74 | | | Statements of Operations | |
| | 76 | | | Statements of Changes in Net Assets | |
| | 81 | | | Financial Highlights | |
| | 90 | | | Notes to Financial Statements | |
| | 103 | | | Report of Independent Registered Public Accounting Firm | |
| | 106 | | | Trustee and Officer Information | |
| | 109 | | | Privacy Notice | |
| | 110 | | | Guinness Atkinson Funds Information | |
3
The table below provides total return data for each of the Funds over the one, three, five, ten-years and since inception periods through December 31, 2018. Also included in the table is the expense ratio data from the most recent prospectus dated May 1, 2018.
Fund (inception date) | | 1-year | | 3-year | | 5-year | | 10-year | | Since Inception | | Expense Ratio | |
Alternative Energy Fund (March 31, 2006) | | | -15.49 | % | | | -5.47 | % | | | -8.49 | % | | | -6.22 | % | | | -10.77 | % | | | 2.74 | % gross; 1.98% net | |
Asia Focus Fund (April 29, 1996) | | | -20.45 | % | | | 8.52 | % | | | 2.87 | % | | | 7.60 | % | | | 2.65 | % | | | 2.22 | % gross 1.98% net | |
Asia Pacific Dividend Builder Fund
(March 31, 2006) | | | -16.42 | % | | | 7.53 | % | | | 5.27 | % | | | 10.60 | % | | | 4.93 | % | | | 3.48 | % gross; 1.12% net | |
China & Hong Kong Fund (June 30, 1994) | | | -20.21 | % | | | 6.93 | % | | | 2.07 | % | | | 8.08 | % | | | 6.51 | % | | | 1.64 | % | |
Dividend Builder Fund (March 30, 2012) | | | -4.14 | % | | | 7.51 | % | | | 4.69 | % | | | — | | | | 8.29 | % | | | 2.06 | % Gross; 0.68% net | |
Global Energy Fund (June 30, 2004) | | | -18.92 | % | | | 0.63 | % | | | -9.77 | % | | | 2.46 | % | | | 4.81 | % | | | 1.62 | % gross 1.45% net | |
Global Innovators Fund Investor Class
(December 15, 1998) | | | -16.80 | % | | | 7.08 | % | | | 6.03 | % | | | 14.00 | % | | | 6.83 | % | | | 1.33 | % gross; 1.24% net | |
Global Innovators Fund Institutional Class
(December 31, 2015) | | | -16.59 | % | | | 7.35 | % | | | 6.19 | % | | | 14.09 | % | | | 6.87 | % | | | 1.17 | % gross; 0.99% net | |
Renminbi Yuan & Bond Fund (June 30, 2011) | | | -2.12 | % | | | 1.21 | % | | | -0.29 | % | | | — | | | | 1.02 | % | | | 4.17 | % gross; 0.90% net | |
Periods of greater than one year are average annualized returns; one year and shorter period returns are actual returns. All returns are for the periods ended December 31, 2018.
Performance data shown for the Global Innovators, Institutional Class (GINNX), prior to its launch date on December 31, 2015, uses performance data from the Global Innovators, Investor Class (IWIRX).
Performance data quoted represents past performance and does not guarantee future results. The investment return and principal value of an investment will fluctuate so that an investor's shares, when redeemed, may be worth more or less than the original cost. Current performance of the Funds may be lower or higher than the performance quoted. Performance data current to the most recent month end may be obtained by visiting www.gafunds.com.
Expense ratios are from the most recent prospectus (dated May 1, 2018) and are from the most recent audited financials (period ended December 31, 2017) at the time that prospectus was completed.
4
Dear Guinness Atkinson Funds Shareholders,
You don't need us to tell you that 2018 was a bad year. Maybe that was to be expected given the returns over the previous ten years which were mostly positive in the aftermath of the financial crisis. As a result, all of the Guinness Atkinson Funds were down for the year. In this letter a year ago we were remarking that the MSCI World Index didn't experience a single negative month for calendar year 2017. 2018 will be remembered for its high levels of volatility and for a particularly nasty fourth quarter.
The best performing Guinness Atkinson Fund was the Renminbi Yuan & Bond Fund which produced a negative 2.12% return for the year. This was followed by the Dividend Builder which produced a total return of negative 4.14% for the year. The laggard in the family for the year was the Asia Focus Fund, down 20.45%. We noted a year ago that the worst performing Guinness Atkinson Fund for 2016 was the best performing of the group for 2017. That may not be a very good predictor for 2018 but it is worth noting that these calendar year figures can look very different year over year. You can see from the longer-term performance periods for the Funds that despite the 2018 setback most of the Funds have done quite well over the longer-term periods.
The longer-term performance is what, we hope, is of most importance to our shareholders. We've written about having a long-term outlook in past letters with some consistency – and indeed we manage the Funds with generally low levels of turnover and practice a buy and hold philosophy.
Fortunately, global markets have begun 2019 with a spring in their step. And while we are not great fans of the volatility or negative returns, we know the major themes that underpin the Guinness Atkinson Funds are still in place. We believe the world has an energy problem with growing demand and a need to switch to alternative energy. We believe that Asia and China will continue on their path to become economic powers and centers of influence that a region that one might expect given that one-third of the world's population is based in Asia. We believe innovative companies have a competitive edge and that competitive edge can be seen in their financial results.
Our investment team has provided a detailed commentary for each of the Guinness Atkinson Funds adjacent to each Fund's financial results.
As usual, we appreciate the confidence you have placed in us and our management team and we are hopeful that 2019 will be significantly better that 2018.
We encourage you to visit gafunds.com for the latest news and announcements on the Guinness Atkinson Funds.
Sincerely, | | | |

| | 
| |
Timothy Guinness | | James Atkinson | |
The views in this letter and in the commentaries delivered by our portfolio managers, were as of December 31, 2018 and may not necessarily reflect the same views on the date this letter is first published or any time thereafter. These views are intended to help shareholders in understanding the Funds' investment methodology and do not constitute investment advice. Portfolio manager views may change at any time and should not be considered a forecast or guarantee of future events or investment results. We do not have any obligation to, and we do not, update or alter forward-looking statements contained in this report. Forward-looking statements include predictions, projections and other statements describing expectations about future events. There is no guarantee that forward-looking statements will prove accurate.
5
Morningstar Ratings Through December 31, 2018
Fund | | Category | | Overall | | 3-year | | 5-year | | 10-year | |
Alternative Energy | | Foreign Small/ | | | 1 | * | | | 1 | * | | | 1 | * | | | 1 | * | |
| | Mid Value | | | (53 | funds) | | | (53 | funds) | | | (43 | funds) | | | (22 | funds) | |
Asia Focus | | Pacific/Asia | | | 2 | ** | | | 4 | **** | | | 2 | ** | | | 1 | * | |
| | ex-Japan | | | (81 | funds) | | | (81 | funds) | | | (60 | funds) | | | (29 | funds) | |
Asia Pacific Dividend | | Pacific/Asia | | | 4 | **** | | | 3 | *** | | | 5 | ***** | | | 4 | **** | |
Builder | | ex-Japan | | | (81 | funds) | | | (81 | funds) | | | (60 | funds) | | | (29 | funds) | |
China & Hong Kong | | China Region | | | 3 | *** | | | 4 | **** | | | 3 | *** | | | 2 | ** | |
| | | | | (81 | funds) | | | (81 | funds) | | | (73 | funds) | | | (41 | funds) | |
Dividend Builder | | World Stock | | | 4 | **** | | | 4 | **** | | | 4 | **** | | | — | | |
| | | | | (729 | funds) | | | (729 | funds) | | | (618 | funds) | | | |
Global Energy | | Energy Equity | | | 3 | *** | | | 4 | **** | | | 3 | *** | | | 3 | *** | |
| | | | | (91 | funds) | | | (91 | funds) | | | (76 | funds) | | | (58 | funds) | |
Global Innovators | | Large Blend | | | 3 | *** | | | 2 | ** | | | 2 | ** | | | 4 | **** | |
| | | | | (1,208 | funds) | | | (1,208 | funds) | | | (1,071 | funds) | | | (805 | funds) | |
Renminbi Yuan & Bond | | Emerging Markets | | | 3 | *** | | | 1 | * | | | 4 | **** | | | — | | |
| | Local Currency Bond | | | (69 | funds) | | | (69 | funds) | | | (56 | funds) | | | |
Morningstar Ratings Disclosure
Global Innovators Fund ratings shown were given for the Investor Share Class.
Mutual fund investing involves risk. Principal loss is possible. The Funds invest in foreign securities, which involves greater volatility and political, economic and currency risks and differences in accounting methods. These risks are greater for emerging markets countries. Non-diversified Funds' assets may be concentrated in fewer individual holdings than diversified funds. Therefore, these Funds are more exposed to individual issuer volatility than diversified funds. Investments in smaller companies involve additional risks such as limited liquidity and greater volatility. Investments in debt securities typically decrease in value when interest rates rise, which can be greater for longer-term debt securities. Investments in derivatives involve risks different from, and in certain cases, greater than the risks presented by traditional investments. Investments focused in a single geographic region may be exposed to greater risk than investments diversified among various geographies. Investments focused on the energy sector may be exposed to greater risk than an investment diversified among various sectors.
Past performance is not a guarantee of future results. The Morningstar RatingTM for funds, or "star rating", is calculated for managed products (including mutual funds, variable annuity and variable life subaccounts, exchange-traded funds, closed-end funds, and separate accounts) with at least a three-year history. Exchange-traded funds and open-ended mutual funds are considered a single population for comparative purposes. It is calculated based on a Morningstar Risk-Adjusted Return measure that accounts for variation in a managed product's monthly excess performance, placing more emphasis on downward variations and rewarding consistent performance. The top 10% of products in each product category receive 5 stars, the next 22.5% receive 4 stars, the next 35% receive 3 stars, the next 22.5% receive 2 stars, and the bottom 10% receive 1 star. The Overall Morningstar Rating for a managed product is derived from a weighted average of the performance figures associated with its three-, five-, and 10-year (if applicable) Morningstar Rating metrics. The weights are: 100% three-year rating for 36-59 months of total returns, 60% five-year rating/40% three-year rating for 60-119 months of total returns, and 50% 10-year rating/30% five-year rating/20% three-year rating for 120 or more months of total returns. While the 10-year overall star rating formula seems to give the most weight to the 10-year period, the most recent three-year period actually has the greatest impact because it is included in all three rating periods.
©2019 Morningstar, Inc. All Rights Reserved. The information contained herein (1) is proprietary to Morningstar (2) may not be copied or distributed and (3) is not warranted to be accurate, complete or timely. Neither Morningstar nor its content providers are responsible for any damages or losses arising from any use of this information.
6
Expense Examples (Unaudited)
As a shareholder of the Funds, you incur two types of costs: (1) redemption fees (applicable to the Asia Focus Fund, the Asia Pacific Dividend Builder Fund, the China & Hong Kong Fund, and the Renminbi Yuan & Bond Fund); and (2) ongoing costs, including advisory fees and other Fund expenses. The examples below are intended to help you understand your ongoing costs (in dollars) of investing in the Funds and to compare these costs with the ongoing costs of investing in other mutual funds.
The examples are based on an investment of $1,000 invested at the beginning of the period shown and held for the entire period from July 1, 2018 to December 31, 2018.
Actual Expenses
For each Fund, the first line of the table below provides information about actual account values and actual expenses. You may use the information in this line, together with the amount you invested, to estimate the expenses that you paid over the period. Simply divide your account value by $1,000 (for example, an $8,600 account value divided by $1,000 = 8.6), then multiply the result by the number in the first line under the heading entitled "Expenses Paid during Period" to estimate the expenses you paid on your account during this period.
Hypothetical Example for Comparison Purposes
For each Fund, the second line of the table below provides information about hypothetical account values and hypothetical expenses based on the Fund's actual expense ratios and an assumed rate of return of 5% per year before expenses, which is not the Fund's actual return. The hypothetical account values and expenses may not be used to estimate the actual ending account balance or expenses you paid for the period. You may use this information to compare the ongoing costs of investing in the Fund and other funds. To do so, compare this 5% hypothetical example with the 5% hypothetical examples that appear in the shareholder reports of the other funds.
Please note that the expenses shown in the table are meant to highlight your ongoing costs only and do not reflect any redemption fees. Therefore, the second line for each Fund of the table is useful in comparing ongoing costs only, and will not help you determine the relative total costs of owning different funds. In addition, if these redemption fees were included, your costs would have been higher.
| | | Beginning
Account
Value
(07/01/18) | | Ending
Account
Value
(12/31/18) | | Expenses Paid
During Period*
(07/01/18 to
12/31/18) | | Expense Ratios
During Period*
(07/01/18 to
12/31/18) | |
Guinness Atkinson Alternative Energy Fund Actual | | $ | 1,000.00 | | | $ | 874.10 | | | $ | 9.35 | | | | 1.98 | %† | |
Guinness Atkinson Alternative Energy Fund Hypothetical
(5% return before expenses) | | $ | 1,000.00 | | | $ | 1,015.22 | | | $ | 10.06 | | | | 1.98 | %† | |
Guinness Atkinson Asia Focus Fund Actual | | $ | 1,000.00 | | | $ | 835.90 | | | $ | 9.21 | | | | 1.99 | %† | |
Guinness Atkinson Asia Focus Fund Hypothetical
(5% return before expenses) | | $ | 1,000.00 | | | $ | 1,015.17 | | | $ | 10.11 | | | | 1.99 | %† | |
Guinness Atkinson Asia Pacific Dividend Builder Fund Actual | | $ | 1,000.00 | | | $ | 896.30 | | | $ | 5.31 | | | | 1.11 | %† | |
Guinness Atkinson Asia Pacific Dividend Builder Fund Hypothetical
(5% return before expenses) | | $ | 1,000.00 | | | $ | 1,019.61 | | | $ | 5.65 | | | | 1.11 | %† | |
Guinness Atkinson China & Hong Kong Fund Actual | | $ | 1,000.00 | | | $ | 821.70 | | | $ | 6.75 | | | | 1.47 | % | |
Guinness Atkinson China & Hong Kong Fund Hypothetical
(5% return before expenses) | | $ | 1,000.00 | | | $ | 1,017.79 | | | $ | 7.48 | | | | 1.47 | % | |
Guinness Atkinson Dividend Builder Fund Actual | | $ | 1,000.00 | | | $ | 960.70 | | | $ | 3.36 | | | | 0.68 | %† | |
Guinness Atkinson Dividend Builder Fund Hypothetical
(5% return before expenses) | | $ | 1,000.00 | | | $ | 1,021.78 | | | $ | 3.47 | | | | 0.68 | %† | |
Guinness Atkinson Global Energy Fund Actual | | $ | 1,000.00 | | | $ | 728.70 | | | $ | 6.32 | | | | 1.45 | %† | |
Guinness Atkinson Global Energy Fund Hypothetical
(5% return before expenses) | | $ | 1,000.00 | | | $ | 1,017.90 | | | $ | 7.38 | | | | 1.45 | %† | |
Guinness Atkinson Global Innovators Fund – Investor Class Actual | | $ | 1,000.00 | | | $ | 830.00 | | | $ | 5.81 | | | | 1.26 | %† | |
Guinness Atkinson Global Innovators Fund – Investor Class Hypothetical
(5% return before expenses) | | $ | 1,000.00 | | | $ | 1,018.85 | | | $ | 6.41 | | | | 1.26 | %† | |
Guinness Atkinson Global Innovators Fund – Institutional Class Actual | | $ | 1,000.00 | | | $ | 831.20 | | | $ | 4.66 | | | | 1.01 | %† | |
Guinness Atkinson Global Innovators Fund – Institutional Class Hypothetical
(5% return before expenses) | | $ | 1,000.00 | | | $ | 1,020.11 | | | $ | 5.14 | | | | 1.01 | %† | |
Guinness Atkinson Renminbi Yuan & Bond Fund Actual | | $ | 1,000.00 | | | $ | 987.20 | | | $ | 4.81 | | | | 0.96 | %† | |
Guinness Atkinson Renminbi Yuan & Bond Fund Hypothetical
(5% return before expenses) | | $ | 1,000.00 | | | $ | 1,020.37 | | | $ | 4.89 | | | | 0.96 | %† | |
*Expenses are equal to the Funds' annualized expense ratio as indicated, multiplied by the average account value over the period, multiplied by the number of days in most recent fiscal half-year period (184), then divided by the number of days in the fiscal year (365) (to reflect the one-half year period).
†Net of fee waivers and/or expense reimbursements. If those fee waivers and/or expense reimbursements had not been in effect, the Fund's actual expenses would have been higher.
7
GUINNESS ATKINSON ALTERNATIVE ENERGY FUND for the period ended December 31, 2018
1. Performance
AVERAGE ANNUAL TOTAL RETURNS
| | | 1 Year | | 3 Years | | 5 Years | | 10 Years | |
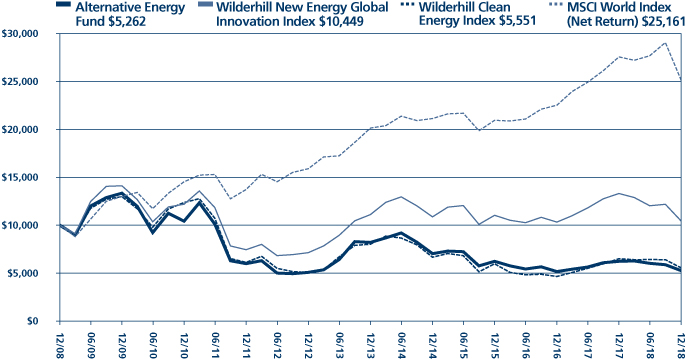
Fund | | | -15.49 | % | | | -5.47 | % | | | -8.49 | % | | | -6.22 | % | |
Benchmark Indices: | |
Wilderhill Clean Energy Index | | | -14.57 | % | | | -2.38 | % | | | -7.08 | % | | | -5.71 | % | |
Wilderhill New Energy Global Innovation Index | | | -19.12 | % | | | -1.05 | % | | | -0.90 | % | | | 0.44 | % | |
MSCI World Index (Net Return) | | | -8.71 | % | | | 6.30 | % | | | 4.56 | % | | | 9.66 | % | |
For the Fund's current one-year expense ratios, please refer to the Financial Highlights section of this report.
Performance data quoted represents past performance and does not guarantee future results. The investment return and principal value of an investment in the Fund will fluctuate so that an investor's shares, when redeemed, may be worth more or less than their original cost. Current performance of the Fund may be lower or higher than the performance quoted. Performance data current to the most recent month-end may be obtained by visiting www.gafunds.com, or calling (800) 915-6565.
The Fund was down 15.49% in 2018. The Fund was particularly weak in the second half of 2018 when weakness in the broad markets weighed on the portfolio. The Fund was down 3.31% for the first half of the year and down 12.59% for the second half of the year. The Fund outperformed the Wilderhill New Energy Index which was down 19.12% in 2018, and underperformed against the Wilderhill Clean Energy Index, which was down 14.57% in 2018.
The Fund's renewables holdings performed materially worse than the Fund's holdings that related to the consumption of energy. Within the renewables holdings the grid and renewable installation equipment manufacturers materially underperformed. The overarching driver of the weak fund performance was the weakness in global equity markets.
The Fund's holdings related to consumption can be broadly divided into those which relate to displacement of fossil fuel consumption and those that relate to electrification of consumption. Building efficiency improvements create displacement of energy consumption and the fund's holding in Nibe, who are the leading global provider of heat pumps were one of the fund's few positive performance. Johnson Controls and Acuity Brands were relatively weak, particularly in the fourth quarter as concerns about the US economy weighed on stocks. Kingspan, the insulation manufacturer was flat for the year. Cosan is (among other things) a leading distributor of ethanol in the Brazilian market and suffered from strikes and weak Brazilian equity markets.
Electrification is exemplified by Battery and Electric Vehicle companies. The Fund's holding in Tianneng Power International, a Chinese vehicle battery producer performed well and was well sold in the middle of the year. LG Chem's battery business is moving towards profitability but saw some weakness amid concerns about how long it will take to get there. Sensata are potential beneficiaries of the shift to electric vehicles as leading providers of electric sensors, but suffered along with the whole US market. Ricardo was a disappointment. As a provider of engineering services to the automotive industry, they should be a key facilitator for companies looking to improve engine efficiency and shift to electric, but weak second half results weighed on the stock.
The Fund's exposure to renewables is split between generating companies and equipment manufacturers. The Fund holds five Chinese renewable asset owners which between them did not contribute significantly to the weak fund performance. This reflects improving payment timing in China and a move to lower levels of curtailment of renewable production. The other generation holdings are in biomass, geothermal and hydroelectricity. Despite the geothermal company, Ormat running into operational problems relating to volcanic eruption at a facility in Hawaii, it has performed in line with the rest of the portfolio.
The Fund has had exposure to wind, solar and grid equipment manufacturing companies in 2018. The wind companies – TPI Composites and Vestas have been bright spots of performance for 2018, reflecting solid balance sheets and good operational performance. This is in marked contract to the solar manufacturers who have suffered from the surprise withdrawal by China of a number of its subsidy supports, which caused major weakness in stock prices. Grid equipment companies were relatively weak in 2018, with Prysmian struggling to digest its General Cable acquisition and Schneider Electric underperforming amid concerns in a slowdown in general infrastructure spending that is not necessarily warranted. Wasion, the Chinese metering company performed well as previously delayed contracts were executed leading to better earnings.
8
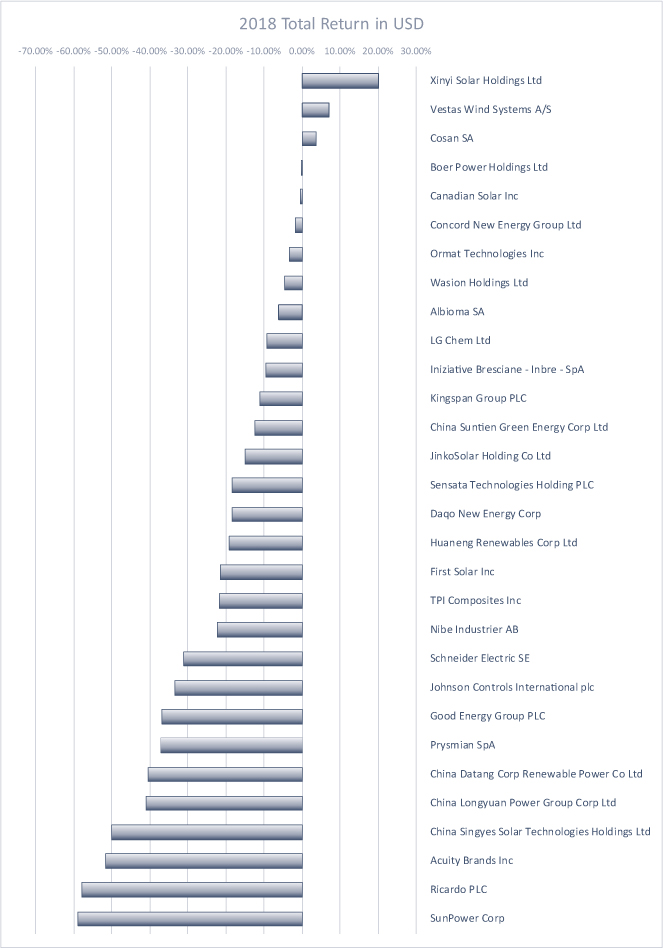
Performance chart shows the performance of companies held in the portfolio at the end of 2018 over the period held in the portfolio. Source: Bloomberg, Guinness Atkinson.
9
2. Activity
In the first quarter the Fund sold its positions in Boralex, Senvion and JA Solar, replacing them with Acuity Brands, Vestas and Daqo.
The Fund sold its position in Boralex base on a view that the stock was fully valued. Boralex operates in Canada and France, where favourable feed-in tariff levels for new projects are being replaced by competitive auction pricing which is likely to lead to deterioration in returns on future projects.
The Fund acquired a position in Acuity Brands based on its low valuation and attractive market positioning. Acuity Brands provides lighting and building efficiency solutions, where evolving technologies including LEDs offer an attractive growth trajectory.
The Fund sold its position in Senvion based on relative valuation and concerns about deterioration of the German market for wind turbines. The Fund had acquired the position in Senvion due to the large discount that it traded at compared to its peer group.
The Fund replaced the position in Senvion with a position in Vestas which had seen stock price weakness despite a leading market position and scoring well in the Fund's screening.
In the second quarter, the Fund was the beneficiary of two buyout offers. The Fund sold its position in JA Solar as a result of a management buyout and replaced it with a position in Daqo, a Chinese polysilicon supplier. Daqo has strengthened its balance sheet over the last two years with high levels of operating cashflow and capital raises. Within the silicon market Daqo is focusing on the raw materials for mono-crystalline silicon solar cells, a subsector of the solar module market that is set to grow at a faster rate than the overall solar market and relies on higher purity polysilicon.
The Fund sold its position in Mytrah Energy which was bought out by its chairman. The offered price was at a 64% premium to the closing price at the time of announcement.
The Fund sold its position in Tianneng Power International. This bicycle battery business in China had reached the valuation targeted on acquiring the position. Furthermore there were concerns about price competition in their core market as witnessed by weak trading at competitors.
In the third quarter the Fund acquired a position in Albioma, an international biomass energy producer in the Francophone world.
The Fund made no changes to portfolio membership in the fourth quarter but benefited from judicious rebalancing.
3. Portfolio Position
The Fund's largest country exposures were to China, the United States, Canada, Italy, the United Kingdom and Brazil. With China contributing half of the annual installations of wind and solar, over three-quarters of solar manufacturing capacity and over half of wind turbine manufacturing capacity, investing in China is a key part of the current investment opportunity.
At the end of 2018, the Fund held 27.16% in companies that produce power, 25.68% in companies that manufacture and install renewable installations, 13.19% in companies that improve building efficiency and 11.78% in electric grid related companies. The smaller exposures are to Electric Vehicles (6.33%), Renewables Developers (3.53%), Battery companies (3.33%) and Biofuels (3.29%) and Green Utility companies (1.34%).
4. Outlook
While sector and global equity markets performance was weak in 2018, there are good signs that the outlook for the alternative energy sector is improving. Renewables are becoming cost competitive without subsidies and volumes installed continue to grow. At the point where subsidies fall away, the growth should no longer be constrained by falling and sclerotic government support. Despite the surprise removal of subsidies for solar in China, they are actively supporting unsubsidised, often on site generation projects and there are good signs that the Chinese solar market is already recovering from this shock. The wind market continues to evolve, with offshore wind becoming materially more important for a number of manufacturers. Most importantly the markets for both wind and solar are now truly global, which again provides a better support base and more opportunities for best practises to be learnt and exported internationally.
While biofuels are not a global growth story, there remain attractive investment opportunities in specific regions and also provides a meaningful displacement for fossil fuels where implemented. The areas of most potential excitement continue to be batteries and electric vehicles. The rest of the car manufacturing world are catching up with Tesla (not owned) and it still remains to be
10
seen which car companies will create the successful vehicle models and technical innovations that expand the opportunity to the mass market. There are a number of attractive investment opportunities in companies that are model agnostic and will be part of the overall shift.
The Fund remains well positioned for growth of the alternative energy sector, and there are signs that the sector is maturing to provide investment opportunities with sustainable earnings growth. Thank you for your support.

Edward Guinness
The Fund invests in foreign securities, which involves political, economic and currency risks, greater volatility, and differences in accounting methods. These risks are greater for emerging markets. The Fund is non-diversified, meaning that its assets may be concentrated in fewer individual holdings than diversified funds. Therefore, the Fund is more exposed to individual stock volatility than diversified funds. Investments focused in a single geographic region may be exposed to greater risk and more volatility than investments diversified among various geographies. The Fund invests in smaller companies, which involves additional risks such as limited liquidity and greater volatility.
The Wilderhill New Energy Global Innovation Index is a modified US dollar-weighted index of publicly traded companies, which are active in renewable and low-carbon energy, and which stand to benefit from responses to climate change and energy security concern. The Wilderhill Clean Energy Index is a modified equal US dollar-weighted index of publicly traded companies whose businesses stand to benefit substantially from societal transition toward the use of cleaner energy and conservation. These indices are unmanaged, not available for investment and do not incur expenses. The MSCI World Index (Net Return) is a free float-adjusted market capitalization weighted index that is designed to measure the equity market performance of developed markets. Net Return reflects deduction for withholding tax but reflects no deduction for fees and expenses. Net Return is net of local withholding taxes that any investor would pay. This index is unmanaged, not available for investment and does not incur expenses.
Please refer to the Schedule of Investments for details on Fund holdings. Current and future portfolio holdings are subject to risk.
The information provided herein represents the opinion of Guinness Atkinson Asset Management, Inc. for the period stated and is not intended to be a forecast of future events, a guarantee of future results, or investment advice. Opinions, Fund holdings and sector allocations are subject to change at any time, and are not recommendations to buy or sell any security.
11
Growth of $10,000
Average Annual Total Return
Periods Ended December 31, 2018
| One Year | | Five Years | | Ten Years | |
| | -15.49 | % | | | -8.49 | % | | | -6.22 | % | |
Performance data quoted represents past performance and does not guarantee future results. The investment return and principal value of an investment will fluctuate so that an investor's shares, when redeemed, may be worth more or less than their original cost. Current performance of the Fund may be lower or higher than the performance quoted. Performance data current to the most recent month end may be obtained by visiting www.gafunds.com.
Total returns for certain periods reflect a fee waiver in effect and in the absence of this waiver, the total returns would be lower. Returns reflect the reinvestment of distributions made by the Fund, if any. The graph and the performance table above do not reflect the deduction of taxes that a shareholder would pay on Fund distribution or the redemption of Fund shares.
The Wilderhill New Energy Global Innovation Index is a modified dollar weighted index of publicly traded companies, which are active in renewable and low-carbon energy, and which stand to benefit from responses to climate change and energy security concern. The Wilderhill Clean Energy Index is a modified equal dollar weighted index comprised of publicly traded companies whose businesses stand to benefit substantially from societal transition toward the use of cleaner energy and conservation. The MSCI World Index (Net Return) is a free float-adjusted market capitalization weighted index that is designed to measure the equity market performance of developed markets. Net Return reflects deduction for withholding tax but reflects no deduction for fees and expenses. Net Return is net of local withholding taxes that any investor would pay.
12
FUND HIGHLIGHTS at December 31, 2018
GUINNESS ATKINSON ALTERNATIVE ENERGY FUND
# of Holdings in Portfolio: | | 30 | |
Portfolio Turnover: | | 36.5% | |
% of Stocks in Top 10: | | 37.3% | |
Fund Manager: | | | |
Edward Guinness | | | |
Top 10 Holdings (% of net assets) | | | | Industry Breakdown (% of net assets) | | | |
Wasion Group Holdings Ltd. | | | 4.0 | % | | Efficiency | | | 35.7 | % | |
China Suntien Green Energy Corp. Ltd. - H Shares | | | 3.8 | % | | Solar | | | 27.1 | % | |
Albioma SA | | | 3.8 | % | | Wind | | | 26.2 | % | |
JinkoSolar Holding Co., Ltd. - ADR | | | 3.7 | % | | Geothermal | | | 3.7 | % | |
China Datang Corp. Renewable Power Co., Ltd. - H Shares | | | 3.7 | % | | Biofuel | | | 3.4 | % | |
Ormat Technologies Inc. | | | 3.7 | % | | Hydro | | | 2.5 | % | |
Huaneng Renewables Corp. Ltd. - H Shares | | | 3.7 | % | | | | | | | |
Nibe Industrier AB - B Shares | | | 3.7 | % | | | | | | | |
China Singyes Solar Technologies Holdings Ltd. | | | 3.6 | % | | | | | | | |
Sensata Technologies Holding | | | 3.6 | % | | | | | | | |
13
SCHEDULE OF INVESTMENTS
at December 31, 2018
GUINNESS ATKINSON ALTERNATIVE ENERGY FUND
Shares | | COMMON STOCKS: 98.6% | | Value | |
Biofuel: 3.4% | | | |
| | 31,000 | | | Cosan SA Industria e Comercio | | $ | 267,628 | | |
Efficiency: 35.7% | | | |
| | 2,300 | | | Acuity Brands Inc. | | | 264,385 | | |
| | 1,274,000 | | | Boer Power Holdings* | | | 102,425 | | |
| | 8,502 | | | Johnson Controls International PLC | | | 252,085 | | |
| | 6,240 | | | Kingspan Group PLC | | | 268,154 | | |
| | 870 | | | LG Chem Ltd. | | | 270,381 | | |
| | 27,975 | | | Nibe Industrier AB - B Shares | | | 287,627 | | |
| | 13,236 | | | Prysmian SpA | | | 257,187 | | |
| | 28,470 | | | Ricardo PLC | | | 227,376 | | |
| | 4,140 | | | Schneider Electric SE | | | 284,450 | | |
| | 6,400 | | | Sensata Technologies Holding* | | | 286,976 | | |
| | 644,000 | | | Wasion Group Holdings Ltd. | | | 313,344 | | |
| | | | | | | | 2,814,390 | | |
Geothermal: 3.7% | | | |
| | 5,559 | | | Ormat Technologies Inc. | | | 290,736 | | |
Hydro: 2.5% | | | |
| | 9,144 | | | Iniziative Bresciane - Inbre - SpA† | | | 199,058 | | |
Solar: 27.1% | | | |
| | 13,700 | | | Albioma SA | | | 297,255 | | |
| | 19,000 | | | Canadian Solar Inc.* | | | 272,460 | | |
| | 1,045,400 | | | China Singyes Solar Technologies Holdings Ltd.† | | | 287,033 | | |
| | 10,500 | | | Daqo New Energy Corp.* | | | 245,700 | | |
| | 6,100 | | | First Solar Inc.* | | | 258,976 | | |
| | 29,800 | | | Jinkosolar Holdings Co., Ltd. - ADR* | | | 294,722 | | |
| | 41,550 | | | SunPower Corp. - Class B* | | | 206,504 | | |
| | 774,200 | | | Xinyi Solar Holdings Ltd. | | | 271,351 | | |
| | | | | | | | 2,134,001 | | |
The accompanying notes are an integral part of these financial statements.
14
Shares | | COMMON STOCKS: 98.6% (Continued) | | Value | |
Wind: 26.2% | | | |
| | 2,448,000 | | | China Datang Corp. Renewable Power Co., Ltd. - H Shares | | $ | 291,241 | | |
| | 408,000 | | | China Longyuan Power Group Corp. - H Shares | | | 277,607 | | |
| | 1,179,000 | | | China Suntien Green Energy Corp. Ltd. - H Shares | | | 302,345 | | |
| | 6,670,000 | | | Concord New Energy Group Ltd. | | | 261,549 | | |
| | 91,167 | | | Good Energy Group PLC† | | | 108,648 | | |
| | 1,084,000 | | | Huaneng Renewables Corp. Ltd. - H Shares | | | 288,645 | | |
| | 10,900 | | | TPI Composites Inc.* | | | 267,922 | | |
| | 3,565 | | | Vestas Wind Systems A/S | | | 270,085 | | |
| | | | | | | | 2,068,042 | | |
| | | | | Total Common Stocks
(cost $11,310,533) | | | 7,773,855 | | |
| | | | | Total Investments in Securities
(cost $11,310,533): 98.6% | | | 7,773,855 | | |
| | | | | Other Assets less Liabilities: 1.4% | | | 113,721 | | |
| | | | | Net Assets: 100.0% | | $ | 7,887,576 | | |
* Non-income producing security.
ADR - American Depository Receipt
PLC - Public Limited Company
† The Advisor has determined these securities to be Illiquid. As of December 31, 2018, the total market value of these illiquid securities represent 7.5% of net assets. The total market value of these illiquid securities is $594,739.
The accompanying notes are an integral part of these financial statements.
15
GUINNESS ATKINSON ASIA FOCUS FUND for the period ended December 31, 2018
1. Performance
AVERAGE ANNUAL TOTAL RETURNS
| | | 1 Year | | 3 Years | | 5 Years | | 10 Years | |
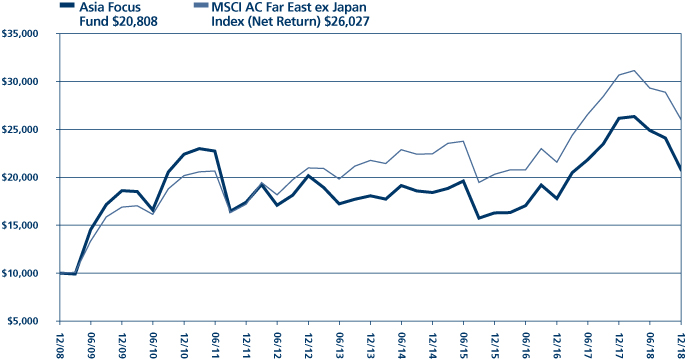
Fund | | | -20.45 | % | | | 8.52 | % | | | 2.87 | % | | | 7.60 | % | |
Benchmark Index: | |
MSCI AC Far East ex Japan Index (Net Return) | | | -15.14 | % | | | 8.61 | % | | | 3.64 | % | | | 10.03 | % | |
(All performance data given in USD terms)
For the Fund's current one-year expense ratio, please refer to the Financial Highlights section of this report.
Performance data quoted represents past performance and does not guarantee future results. The investment return and principal value of an investment in the Fund will fluctuate so that an investor's shares, when redeemed, may be worth more or less than their original cost. Current performance of the Fund may be lower or higher than the performance quoted. Performance data current to the most recent month-end may be obtained by visiting www.gafunds.com, or calling (800) 915-6565.
After a strong year 2017 for Asian equities, in 2018, Asian markets fell 15.14% (as measured by the MSCI AC Far East ex Japan Index). The Fund underperformed in the weaker market conditions, falling 20.45%.
The best-performing sector in 2018, as measured by the sector indices within the MSCI AC Far East ex Japan Index in USD terms – and the only one to generate a positive return – was Utilities +5%. Other sectors that performed relatively well were Energy – 2%, Communication Services – 6%, Real Estate – 9%, and Financials – 9%. Weaker sectors were Consumer Discretionary – 32%, Information Technology – 21%, Health Care – 17%, Materials – 13%, Industrials – 12%, and Consumer Staples – 11%.
All countries in the region (as measured by their respective MSCI country indices) fell, with Thailand – 5% falling the least, closely followed by Malaysia – 6%, Hong Kong – 8% and Taiwan – 8%. The worst performing countries were Korea – 21%, China – 19% and Philippines – 16%.
In the case of China and Korea, much of the weakness is attributable to the rise in trade tensions witnessed over the course of the year, particularly in respect of the US-China trade relationship. The dispute, which essentially began with the imposition of tariffs over imported steel and aluminium in the US, escalated over the course of the year with the imposition of tariffs by the US on a much greater array of goods, accompanied by the threat to increase tariff rates at the beginning of 2019. China reciprocated by targeting imports of US agricultural products. Trade talks continued in an on-off fashion throughout the latter part of the year, but failed to quell the uncertainty in the markets. As the tariffs began to take effect, activity was initially pulled forwards, but then slowed signs of slowing towards the end of the year – this was one of the significant contributing factors behind the market sell-offs in the fourth quarter.
Ongoing negotiations are complex – the narrative from the US side has shifted from wanting to address the overall trade imbalance to tackling a variety of issues: intellectual property transfer, market access, and state subsidisation. But we expect China to continue to fight for its own interests fiercely. China is approaching a delicate point in its economic development, as what were demographic tailwinds are gradually shifting to becoming headwinds, as the population ages over time. Made in China 2025, and the associated advances in industrial capabilities, are the Chinese authorities' efforts to move up the income curve in order to combat the changing composition of its population.
Our Technology holdings were generally weak, particularly those companies operating in the smartphone supply chain. Technology was the best performing sector last year, so to some extent this represents giving back some of the gains made in 2017, as investors scaled back their overly-optimistic projections. The companies also suffered as a result of weaker demand for smartphones, a theme that was observed early in the year, and continued throughout. A hoped-for source of demand from the latest iPhone product cycle released in the Autumn ultimately proved rather lacklustre and disappointed relative to expectations. Nevertheless, we are positive on these companies' prospects for two reasons. First, we expect the next wave of new features and technologies (5G and folding screens, for example) to serve as a catalyst for future phone upgrades and stronger consumer demand. Second, the companies we are investing in are often the market leaders in their respective niches, and as such command a degree of pricing power (see our comments on AAC below).
16
The best performing stock this year was Novatek Microelectronics, which rose 28%. The company is a designer of integrated circuits, used primarily in flat-screen displays, in a variety of applications including TVs, tablets, smartphones and cars. Novatek has recently benefited from greater adoption of its chips within TFT panels especially for Touch and Display Driver integrated chips. Competitors have struggled this year but Novatek's leading position has enabled it to obtain priority at chip foundries, where capacity has been tight. They have also been able to pass on higher raw materials costs and so reported higher margins than the market expected.
The weakest stock in the portfolio was Li & Fung, which fell 67%. The company faced a difficult year. It has been making progress in in its restructuring programme, but this is being worked on at a time when the environment for some its main customers has been poor. US retailers have been closing stores to reduce their footprint, and correspondingly have reduced stock levels. Trade tensions have added an extra dimension of uncertainty and the market is not prepared to take a chance on a business in this segment that is in transition. However, Li & Fung specialised in diversified supply chains and complex supply chain management and so there is scope for the company to benefit as higher tariffs prompt businesses to make changes to their existing supply chains. Conditions are likely to remain tough. As long as trade tensions linger, we expect some of Li & Fung's customers to be cautious about taking on new supply chain solutions. At the same time, the company remains committed to re-modelling its digital platform which it sees as essential to the long-term prosperity of the business, but it will mean incurring extra costs. In this case, what is good for the company in the long term may not be so good for the shares in the short term.
AAC Technologies was weak, also falling 67%, following last year in which the stock was among our best performers. Earnings forecasts have been cut and are expected to be 20% down on last year. The share price fall has been exacerbated by its high valuation. It was one of the few stocks in the portfolio that included a significant portion of future growth expectations in its valuation which has now come out. While we are confident in the company and its operational outlook, we ought to have been more alive to this risk. At this point we continue to hold on and add. It is a company in the smartphone supply chain which, due to its constant innovation, has real pricing power. For example, in 2018 AAC has been promoting its new "Super Linear Structure" (SLS) product which produces greater audio volume for the same sized speaker. These products have an average selling price that is 30-50% higher than existing products.
2. Portfolio Position
Compared to the benchmark, on a sector basis the Fund is most overweight in Information Technology and Health Care, with a 6% overweight to both sectors. The Fund is also 3% overweight Utilities and 2% overweight Consumer Discretionary stocks. The Fund is most underweight Real Estate and Financials, with underweights of 7% and 6%, respectively.
On a country basis the Fund is overweight Australia, Thailand, China (including Macau) and Taiwan. The Fund is underweight Hong Kong, Korea, Indonesia, Philippines and Singapore.
3. Outlook
The fund trades (on a price to earnings basis) at a level we believe to represent a compelling valuation, both on an absolute basis (trading at 10.4x 2018 earnings and 9.9x 2019 earnings) and on a relative basis (trading at a discount to the benchmark on both historic and forecast earnings).
Sentiment towards Asian markets is undeniably weak, and valuations are at levels not seen for several years. The difference this time is that economies are coming from a period of strength, and despite some recent weakness in earnings estimates, respectable levels of growth at the portfolio level are still forecast for 2019 and 2020.
If Asian corporations continue to report earnings that meet market expectations, then the prospects for investors look bright. Valuations at these levels augur for attractive shareholder returns in future. The main risks are a significant decline in Chinese economic activity, or potentially a wider global economic slowdown. Nevertheless, Asian equities appear attractive, particularly in the context of higher valuations elsewhere in the world.

Edmund Harriss
The Fund invests in foreign securities, which involves political, economic and currency risks, greater volatility, and differences in accounting methods. These risks are greater for emerging markets. The Fund is non-diversified, meaning that its assets may be concentrated in fewer individual holdings than diversified funds. Therefore, the Fund is more
17
exposed to individual stock volatility than diversified funds. Investments focused in a single geographic region may be exposed to greater risk and more volatility than investments diversified among various geographies. The Fund invests in smaller companies, which involves additional risks such as limited liquidity and greater volatility.
The MSCI AC (All Country) Far East ex Japan Index (Net Return) is a free float-adjusted market capitalization-weighted index that is designed to measure equity market performance of the Far East, excluding Japan. Net Return reflects deduction for withholding tax but reflects no deduction for fees and expenses. Net Return is net of local withholding taxes that any investor would pay. This index is unmanaged, not available for investment and does not incur expenses.
Please refer to the Schedule of Investments for details on Fund holdings. Current and future portfolio holdings are subject to risk.
The information provided herein represents the opinion of Guinness Atkinson Asset Management, Inc. for the period stated and is not intended to be a forecast of future events, a guarantee of future results, or investment advice. Opinions, Fund holdings and sector allocations are subject to change at any time, and are not recommendations to buy or sell any security.
18
Growth of $10,000
Average Annual Total Return
Periods Ended December 31, 2018
| One Year | | Five Years | | Ten Years | |
| | -20.45 | % | | | 2.87 | % | | | 7.60 | % | |
Performance data quoted represents past performance and does not guarantee future results. The investment return and principal value of an investment will fluctuate so that an investor's shares, when redeemed, may be worth more or less than their original cost. Current performance of the Fund may be lower or higher than the performance quoted. Performance data current to the most recent month end may be obtained by visiting www.gafunds.com.
Total returns for certain periods reflect a fee waiver in effect and in the absence of this waiver, the total returns would be lower. Returns reflect the reinvestment of distributions made by the Fund, if any. The graph and the performance table above do not reflect the deduction of taxes that a shareholder would pay on Fund distribution or the redemption of Fund shares. The Fund imposes a 2% redemption fee on shares held less than 30 days.
The MSCI All Country Far East ex-Japan Index (Net Return) is a free float-adjusted, capitalization-weighted index that is designed to measure equity market performance of the Far East region excluding Japan. The index referenced in this chart is not available for investment and does not incur expenses. Net Return reflects deduction for withholding tax but reflects no deduction for fees and expenses. Net Return is net of local withholding taxes that any investor would pay.
19
FUND HIGHLIGHTS at December 31, 2018
GUINNESS ATKINSON ASIA FOCUS FUND
# of Holdings in Portfolio: | | 35 | |
Portfolio Turnover: | | 32.0% | |
% of Stocks in Top 10: | | 34.3% | |
Fund Manager: | | | |
Edmund Harriss | | | |
Top 10 Holdings (% of net assets) | | | | | | | |
Taiwan Semiconductor Manufacturing Co., Ltd. | | 3.7% | | Sonic Healthcare Ltd. | | 3.4% | |
Hanon Systems | | 3.6% | | DBS Group Holdings Ltd. | | 3.4% | |
Electricity Generating PCL/Foreign | | 3.4% | | QUALCOMM Inc. | | 3.4% | |
NetEase Inc. - ADR | | 3.4% | | China Construction Bank Corp. - H Shares | | 3.3% | |
Corporate Travel Management Ltd. | | 3.4% | | Glow Energy PCL /Foreign | | 3.3% | |
Industry Breakdown (% of net assets) | | | | | | | |
Commercial Banks | | 15.5% | | Public Thoroughfares | | 3.1% | |
Semiconductor Components - Integrated Circuits | | 10.2% | | Optical Supplies | | 3.0% | |
Electric - Generation | | 6.7% | | Building & Construction Products - Miscellaneous | | 2.9% | |
Electronic Component Miscellaneous | | 4.6% | | E-Commerce/Services | | 2.8% | |
Auto/Truck Parts & Equipment | | 3.6% | | Internet Application Software | | 2.8% | |
Entertainment Software | | 3.4% | | Web Portals | | 2.7% | |
Travel Services | | 3.4% | | Auto - Cars/Light Trucks | | 2.6% | |
MRI/Medical Diagnostic Imaging | | 3.4% | | Photo Equipment & Supplies | | 2.4% | |
Investment Management/Advisor Sevices | | 3.2% | | Pharmaceuticals | | 2.4% | |
Building Products - Cement/Aggregates | | 3.2% | | Metal Processors & Fabricators | | 2.3% | |
Oil Company - Integrated | | 3.2% | | Distribution/Wholesale | | 2.3% | |
Tobacco | | 3.2% | | Schools | | 2.2% | |
Electronic Components - Semiconductor | | 3.1% | | | | | |
20
SCHEDULE OF INVESTMENTS
at December 31, 2018
GUINNESS ATKINSON ASIA FOCUS FUND
Shares | | COMMON STOCKS: 98.2% | | Value | |
Australia: 6.8% | | | |
| | 34,090 | | | Corporate Travel Management Ltd. | | $ | 515,604 | | |
| | 33,141 | | | Sonic Healthcare Ltd. | | | 515,200 | | |
| | | | | | | | 1,030,804 | | |
China: 39.5% | | | |
| | 40,000 | | | AAC Technologies Holdings Inc. | | | 231,796 | | |
| | 98,000 | | | Anhui Conch Cement Co., Ltd. - H Shares | | | 475,189 | | |
| | 5,400 | | | Autohome Inc. | | | 422,442 | | |
| | 2,600 | | | Baidu Inc.* | | | 412,360 | | |
| | 610,000 | | | China Construction Bank Corp. - H Shares | | | 503,598 | | |
| | 888,000 | | | China Lesso Group Holdings Ltd. | | | 443,399 | | |
| | 113,000 | | | China Merchants Bank Co., Ltd. - H Shares | | | 414,679 | | |
| | 640,200 | | | China Minsheng Banking Corp. Ltd. - H Shares | | | 440,877 | | |
| | 220,000 | | | Geely Automobile Holdings Ltd. | | | 387,502 | | |
| | 2,200 | | | NetEase Inc. - ADR | | | 517,814 | | |
| | 6,000 | | | New Oriental Education & Technology Group Inc. - ADR | | | 328,860 | | |
| | 11,200 | | | Noah Holdings Ltd.* | | | 485,184 | | |
| | 422,000 | | | Shenzhen Expressway Co., Ltd. - H Shares | | | 465,322 | | |
| | 10,500 | | | Tencent Holdings Ltd. | | | 420,274 | | |
| | 3 | | | Tencent Music Entertainment Group | | | 36 | | |
| | | | | | | | 5,949,332 | | |
Hong Kong: 4.7% | | | |
| | 2,155,000 | | | Li & Fung Ltd. | | | 338,329 | | |
| | 556,000 | | | Sino Biopharmaceutical Ltd. | | | 364,523 | | |
| | | | | | | | 702,852 | | |
Malaysia: 3.1% | | | |
| | 78,300 | | | Public Bank Bhd | | | 468,894 | | |
Singapore: 3.4% | | | |
| | 29,279 | | | DBS Group Holdings Ltd. | | | 508,250 | | |
South Korea: 9.9% | | | |
| | 56,100 | | | Hanon Systems | | | 542,223 | | |
| | 5,210 | | | KT&G Corp. | | | 474,472 | | |
| | 13,550 | | | Samsung Electronics Co., Ltd. | | | 469,426 | | |
| | | | | | | | 1,486,121 | | |
Taiwan: 17.6% | | | |
| | 48,000 | | | Catcher Technology Co., Ltd. | | | 350,909 | | |
| | 212,000 | | | Elite Material Co., Ltd. | | | 453,445 | | |
| | 3,500 | | | Largan Precision Co., Ltd. | | | 366,672 | | |
| | 102,000 | | | Novatek Microelectronics Corp. | | | 472,897 | | |
| | 2 | | | Shin Zu Shing Co., Ltd. | | | 6 | | |
| | 26,000 | | | St Shine Optical Co., Ltd. | | | 456,061 | | |
| | 75,000 | | | Taiwan Semiconductor Manufacturing Co., Ltd. | | | 549,405 | | |
| | | | | | | | 2,649,395 | | |
The accompanying notes are an integral part of these financial statements.
21
Shares | | COMMON STOCKS: 98.2% (Continued) | | Value | |
Thailand: 9.8% | | | |
| | 68,100 | | | Electricity Generating PCL/Foreign | | $ | 518,287 | | |
| | 178,700 | | | Glow Energy PCL/Foreign | | | 488,731 | | |
| | 336,000 | | | PTT PCL/Foreign | | | 474,929 | | |
| | | | | | | | 1,481,947 | | |
United States: 3.4% | | | |
| | 8,900 | | | QUALCOMM Inc. | | | 506,499 | | |
| | | | | Total Common Stocks
(cost $12,293,583) | | | 14,784,094 | | |
| | | | | Total Investments in Securities
(cost $12,293,583): 98.2% | | | 14,784,094 | | |
| | | | | Other Assets less Liabilities: 1.8% | | | 274,398 | | |
| | | | | Net Assets: 100.0% | | $ | 15,058,492 | | |
* Non-income producing security.
ADR - American Depository Receipt
The accompanying notes are an integral part of these financial statements.
22
GUINNESS ATKINSON ASIA PACIFIC DIVIDEND BUILDER FUND for the period ended December 31, 2018
1. Performance
AVERAGE ANNUAL TOTAL RETURNS
| | | 1 Year | | 3 Years | | 5 Years | | 10 Years | |
Fund | | | -16.42 | % | | | 7.53 | % | | | 5.27 | % | | | 10.60 | % | |
Benchmark Index: | |
MSCI AC Pacific ex Japan Index (Net Return) | | | -14.51 | % | | | 7.94 | % | | | 2.90 | % | | | 9.81 | % | |
(All performance data given in USD terms)
For the Fund's current one-year expense ratio, please refer to the Financial Highlights section of this report.
Performance data quoted represents past performance and does not guarantee future results. The investment return and principal value of an investment in the Fund will fluctuate so that an investor's shares, when redeemed, may be worth more or less than their original cost. Current performance of the Fund may be lower or higher than the performance quoted. Performance data current to the most recent month-end may be obtained by visiting www.gafunds.com, or calling (800) 915-6565.
The Fund fell 16.42% in 2018 compared to the benchmark which fell 14.51%. The Fund was ahead of the benchmark at the end of October, but the last two months saw a significant rise in volatility and ended the year with a sharp sell-off.
When considering the performance of the portfolio we think in terms of the contributions from profits, dividends and valuation multiples (of earnings) to the total return. There was a continual tension between performance drivers during the year; macro conditions competed with underlying operating performance from individual companies for dominance.
In the second and fourth quarters, macro factors won out with China trade issues and Federal Reserve interest rate policy being major issues. In these periods the Fund did not defend as well as we normally expect and instead, we saw a compression in stock valuations. In the other periods, when macro concerns were dialled down, the operating performances of the underlying companies, which support profits and dividends, reasserted themselves as performance drivers and the Fund outperformed.
The major talking points for Asia centered for the most part, as ever, on China. Chinese economic growth is on a decelerating glidepath, as it should be as the economy shifts from investment-led to consumption and services-led growth. The perennial question is whether this is a process which can be managed alongside unwinding of debt built up during the investment phase, without significant disruption. The process has been made more difficult by the sharp rise in trade tensions but despite gloomy forecasts, China continues to do so effectively.
The technology sector has also had a more difficult year, especially in hardware manufacturing and assembly. The focus has been on smartphones and slower sales for Apple, especially in China. However, the smartphone picture in China is not so straightforward: Apple blamed weaker Chinese sales on a slowing Chinese economy, but the suspicion is this more of an Apple problem than a China problem. Smartphone sales volume in China declined last year but local Chinese smartphone brands did much better than Apple. We note the big improvements in the build quality of these devices leaving consumers less willing to pay Apple's premium pricing. Regardless of reasoning however, stocks in the Apple supply chain did not do well in 2018 and for the Fund this meant AAC Technologies, Catcher Technology and Hon Hai Precision fell heavily especially at the end of the year.
There were twenty-two stocks out of thirty-six holdings which out-performed in 2018 drawn from retail, ship building, technology, banking, real estate, telecommunications and energy operating in Australia, China, Malaysia, Singapore, Taiwan and Thailand. In all cases, for outperformers and underperformers alike, we have selected companies whose superior profitability has been sustained for many years and whose stock prices under-value the persistence of profitability that we believe is likely.
2. Portfolio Changes
We made two changes to the portfolio, both during the first half of the year. The first switch we made was to sell Relo Holdings in Japan (held December 2013 – April 2018) and to buy Corporate Travel Management in Australia.
Relo, the one Japanese-listed stock in the portfolio, had been an excellent performer in the fund, but the yield contribution from the stock had fallen to a low level as the stock price had risen, accompanied by an increase in valuation multiples. While we thought the prospects for the company were good, we felt there were more attractive opportunities from an income and valuation perspective.
23
ASIA PACIFIC DIVIDEND BUILDER FUND
Corporate Travel Management (CTM) is an Australian company that provides travel management services for corporate clients in Australia, the US, Europe and Asia. In its most recent half-year results the company reported 15% growth in revenue and 32% growth in underlying EBITDA (earnings before interest, tax, depreciation and amortization). The dividend was also increased 25%. We like the client proposition that CTM offers: reducing travel costs for its clients while making it easier to arrange and manage bookings. The founder and Managing Director owns a significant equity stake in the business. As with Relo, we expect a significant proportion of our total return as shareholders to come from continued earnings growth in the business, leading to growth in the income stream from dividends.
The second switch we made was to sell LPN Development in Thailand (held March 2013 – April 2018*) and to buy Public Bank in Malaysia.
LPN Development had been a disappointing performer in recent times. The company, a Thai real estate developer centred around Bangkok, reported poor 2017 results, and had seen downgrades to 2018 earnings over a sustained period. LPN struggled with a build-up of inventory, a slower level of new project launches and a difficult market environment for condos. With doubts surrounding the company's ability to adapt its strategy to circumstances we decided there were better opportunities elsewhere, and we sold the position.
In its place, we purchased Public Bank, a pure-play Malaysian bank exposed to improving consumer confidence in the country. The bank has generated good returns on equity since 1999, following the Asian crisis. Public Bank provides a modest dividend yield, but one that has been growing at a steady rate over the last six years, which we find attractive. Expectations of faster earnings growth, with positive revisions to estimates, were also supportive of our decision to buy.
3. Portfolio Position
The portfolio is overweight Consumer Discretionary, Real Estate, Financials, Information Technology and Health Care. It is underweight Industrials, Consumer Staples, Energy, and Communication Services. The Fund has no exposure to Materials or Utilities. On a country basis it is overweight Taiwan and Thailand, and underweight China, Indonesia, South Korea and Australia. The Fund also holds two positions in US listed stocks (Aflac and Qualcomm) which derive over 50% of revenues from the region. It is worth emphasising that our focus on individual stock selection means these exposures are an outcome rather than the product of a top-down allocation process.
4. Outlook
We believe the outlook for Asia, and for stocks more broadly, favors an active approach focused on identifying companies that can demonstrate sustainable competitive advantages that they can convert into superior profitability over time. We think that buying into companies that could benefit from favourable macro conditions, or in other words depend on factors outside their control to make money, will be a riskier proposition over the next few years.
The Asian region offers structural themes (consumption, life-style upgrading, rising manufacturing skills) that will continue to develop despite the current trade dispute between the US and China. However, the capture of these long-term themes is best done through investment in companies that have demonstrated a long-term track record of turning these into superior profitability and delivered dividend growth, in our opinion.
If Asian corporations continue to report earnings that meet market expectations, then the prospects for investors look bright. Valuations at these levels augur for attractive shareholder returns in future. The main risks are a significant decline in Chinese economic activity, or potentially a wider global economic slowdown. Nevertheless, Asian equities appear attractive, particularly in the context of higher valuations elsewhere in the world.

Edmund Harriss
The Fund invests in foreign securities, which will involve greater volatility and political, economic and currency risks and differences in accounting methods. These risks are greater for emerging markets. The Fund is non-diversified, meaning its assets may be invested in fewer individual holdings than diversified funds. Therefore, the Fund is more exposed to
*Trade executed with a price limit over the course of 20 trading days
24
ASIA PACIFIC DIVIDEND BUILDER FUND
individual stock volatility than diversified funds. The Fund invests in smaller companies, which involves additional risks such as limited liquidity and greater volatility.
The MSCI AC Pacific ex-Japan Index (Net Return) is a market capitalization weighted index that monitors the performance of stocks from the Pacific region, excluding Japan. Net Return reflects deduction for withholding tax but reflects no deduction for fees and expenses. Net Return is net of local withholding taxes that any investor would pay. The index is unmanaged and not available for investment, and do not incur expenses.
Please refer to the Schedule of Investments for details on Fund holdings. Current and future portfolio holdings are subject to risk.
The information provided herein represents the opinion of Guinness Atkinson Asset Management, Inc. for the period stated and it is not intended to be a forecast of future events, a guarantee of future results, or investment advice. Opinions, Fund holdings and sector allocations are subject to change at any time, and are not recommendations to buy or sell any security.
25
ASIA PACIFIC DIVIDEND BUILDER FUND
Growth of $10,000

Average Annual Total Return
Periods Ended December 31, 2018
| One Year | | Five Years | | Ten Years | |
| | -16.42 | % | | | 5.27 | % | | | 10.60 | % | |
Performance data quoted represents past performance and does not guarantee future results. The investment return and principal value of an investment will fluctuate so that an investor's shares, when redeemed, may be worth more or less than their original cost. Current performance of the Fund may be lower or higher than the performance quoted. Performance data current to the most recent month end may be obtained by visiting www.gafunds.com.
Total returns reflect a fee waiver in effect and in the absence of this waiver, the total returns would be lower. Returns reflect the reinvestment of distributions made by the Fund, if any. The graph and the performance table above do not reflect the deduction of taxes that a shareholder would pay on Fund distribution or the redemption of Fund shares. The Fund imposes a 2% redemption fee on shares held less than 30 days.
The MSCI All Country Pacific ex-Japan Index (Net Return) is a free float-adjusted, capitalization-weighted index that is designed to measure equity market performance in the Pacific region including Japan. Net Return reflects deduction for withholding tax but reflects no deduction for fees and expenses. Net Return is net of local withholding taxes that any investor would pay.
26
FUND HIGHLIGHTS at December 31, 2018
GUINNESS ATKINSON ASIA PACIFIC DIVIDEND BUILDER FUND
# of Holdings in Portfolio: | | 36 | |
Portfolio Turnover: | | 23.4% | |
% of Stocks in Top 10: | | 29.6% | |
Fund Manager: | | | |
Edmund Harriss | |
Top 10 Holdings (% of net assets) | | | | | | | |
Novatek Microelectronics Corp. | | | 3.1 | % | | China Construction Bank Corp. - H Shares | | | 2.9 | % | |
Taiwan Semiconductor Manufacturing Co., Ltd. | | | 3.0 | % | | China Mobile Ltd. | | | 2.9 | % | |
DBS Group Holdings Ltd. | | | 3.0 | % | | Hanon Systems | | | 2.9 | % | |
Delta Electronics Thailand PCL/Foreign | | | 3.0 | % | | Tisco Financial Group PCL/Foreign | | | 2.9 | % | |
St Shine Optical Co., Ltd. | | | 3.0 | % | | China Lilang Ltd. | | | 2.9 | % | |
Industry Breakdown (% of net assets) | | | | | | | |
Commercial Banks | | | 19.5 | % | | Life/Health Insurance | | | 2.7 | % | |
Electronic Component - Miscellaneous | | | 10.3 | % | | REITS - Diversified | | | 2.7 | % | |
Semiconductor Components - Integrated Circuits | | | 8.8 | % | | Retail - Consumer Electronics | | | 2.7 | % | |
REITS - Shopping Centers | | | 5.4 | % | | Travel Services | | | 2.6 | % | |
Optical Supplies | | | 3.0 | % | | Investment Management/Advisor Sevices | | | 2.6 | % | |
Cellular Telecommunications | | | 2.9 | % | | Tobacco | | | 2.6 | % | |
Auto/Truck Parts & Equipment | | | 2.9 | % | | Oil Company - Integrated | | | 2.6 | % | |
Diversified Financial Services | | | 2.9 | % | | Textile - Products | | | 2.6 | % | |
Retail - Apparel/Shoe | | | 2.9 | % | | Computers | | | 2.5 | % | |
Shipbuilding | | | 2.8 | % | | Photo Equipment & Supplies | | | 2.5 | % | |
MRI/Medical Diagnostic Imaging | | | 2.8 | % | | Distribution/Wholesale | | | 2.3 | % | |
Retail - Jewelry | | | 2.8 | % | | Metal Processors & Fabricators | | | 2.3 | % | |
27
SCHEDULE OF INVESTMENTS
at December 31, 2018
GUINNESS ATKINSON ASIA PACIFIC DIVIDEND BUILDER FUND
Shares | | COMMON STOCKS: 97.7% | | Value | |
Australia: 10.7% | | | |
| | 7,280 | | | Corporate Travel Management Ltd. | | $ | 110,109 | | |
| | 5,336 | | | Janus Henderson Group PLC | | | 109,080 | | |
| | 7,137 | | | JB Hi-Fi Ltd. | | | 110,728 | | |
| | 7,498 | | | Sonic Healthcare Ltd. | | | 116,562 | | |
| | | | | | | | 446,479 | | |
China: 21.9% | | | |
| | 17,000 | | | AAC Technologies Holdings Inc. | | | 98,513 | | |
| | 148,000 | | | China Construction Bank Corp. - H Shares | | | 122,184 | | |
| | 141,000 | | | China Lilang Ltd. | | | 118,946 | | |
| | 29,000 | | | China Merchants Bank Co., Ltd. - H Shares | | | 106,422 | | |
| | 162,680 | | | China Minsheng Banking Corp. Ltd. - H Shares | | | 112,030 | | |
| | 12,500 | | | China Mobile Ltd. | | | 120,252 | | |
| | 162,000 | | | Industrial & Commercial Bank of China Ltd. - H Shares | | | 115,621 | | |
| | 129,600 | | | Yangzijiang Shipbuilding Holdings Ltd. | | | 118,056 | | |
| | | | | | | | 912,024 | | |
Hong Kong: 13.1% | | | |
| | 30,500 | | | BOC Hong Kong Holdings Ltd. | | | 113,000 | | |
| | 623,000 | | | Li & Fung Ltd. | | | 97,809 | | |
| | 11,000 | | | Link REIT/The | | | 111,299 | | |
| | 41,000 | | | Luk Fook Holdings International Ltd. | | | 116,251 | | |
| | 120,000 | | | Pacific Textiles Holdings Ltd. | | | 106,717 | | |
| | | | | | | | 545,076 | | |
Malaysia: 2.8% | | | |
| | 19,500 | | | Public Bank Bhd | | | 116,774 | | |
Singapore: 8.4% | | | |
| | 60,000 | | | Ascendas Real Estate Investment Trust - REIT | | | 113,027 | | |
| | 68,400 | | | CapitaLand Mall Trust - REIT | | | 113,225 | | |
| | 7,164 | | | DBS Group Holdings Ltd. | | | 124,359 | | |
| | | | | | | | 350,611 | | |
South Korea: 5.5% | | | |
| | 12,440 | | | Hanon Systems | | | 120,236 | | |
| | 1,190 | | | KT&G Corp. | | | 108,373 | | |
| | | | | | | | 228,609 | | |
Taiwan: 21.3% | | | |
| | 16,000 | | | Asustek Computer Inc. | | | 104,964 | | |
| | 13,000 | | | Catcher Technology Co., Ltd. | | | 95,038 | | |
| | 46,000 | | | Elite Material Co., Ltd. | | | 98,389 | | |
| | 46,517 | | | Hon Hai Precision Industry Co., Ltd. | | | 107,184 | | |
| | 1,000 | | | Largan Precision Co., Ltd. | | | 104,764 | | |
| | 28,000 | | | Novatek Microelectronics Corp. | | | 129,815 | | |
| | 7,000 | | | St Shine Optical Co., Ltd. | | | 122,786 | | |
| | 17,000 | | | Taiwan Semiconductor Manufacturing Co., Ltd. | | | 124,532 | | |
| | | | | | | | 887,472 | | |
The accompanying notes are an integral part of these financial statements.
28
Shares | | COMMON STOCKS: 97.7% (Continued) | | Value | |
Thailand: 8.5% | | | |
| | 57,800 | | | Delta Electronics Thailand PCL/Foreign | | $ | 123,432 | | |
| | 76,500 | | | PTT PCL/Foreign | | | 108,131 | | |
| | 50,000 | | | Tisco Financial Group PCL/Foreign | | | 120,096 | | |
| | | | | | | | 351,659 | | |
United States: 5.5% | | | |
| | 2,500 | | | Aflac Inc. | | | 113,900 | | |
| | 2,000 | | | QUALCOMM Inc. | | | 113,820 | | |
| | | | | | | | 227,720 | | |
| | | | | Total Common Stocks
(cost $4,399,992) | | | 4,066,424 | | |
| | | | | Total Investments in Securities
(cost $4,399,992): 97.7% | | | 4,066,424 | | |
| | | | | Other Assets less Liabilities: 2.3% | | | 94,143 | | |
| | | | | Net Assets: 100.0% | | $ | 4,160,567 | | |
REIT - Real Estate Investment Trust
The accompanying notes are an integral part of these financial statements.
29
GUINNESS ATKINSON CHINA & HONG KONG FUND for the period ended December 31, 2018
1. Performance
AVERAGE ANNUAL TOTAL RETURNS
| | | 1 Year | | 3 Years | | 5 Years | | 10 Years | |
Fund | | | -20.21 | % | | | 6.93 | % | | | 2.07 | % | | | 8.08 | % | |
Benchmark Index: | |
Hang Seng Composite Index | | | -14.15 | % | | | 7.76 | % | | | 4.43 | % | | | 9.02 | % | |
For the Fund's current one-year expense ratio, please refer to the Financial Highlights section of this report.
Performance data quoted represents past performance and does not guarantee future results. The investment return and principal value of an investment in the Fund will fluctuate so that an investor's shares, when redeemed, may be worth more or less than their original cost. Current performance of the Fund may be lower or higher than the performance quoted. Performance data current to the most recent month-end may be obtained by visiting www.gafunds.com, or calling (800) 915-6565.
In 2018 the Fund fell 20.21% compared to the Hang Seng Composite Index which fell 14.15%.
This was a turbulent year for equity and bond markets. Political policy unpredictability and uncertainty has been evident in all regions with the US, of course, being the most influential. In financial markets, the US Federal Reserve has shown its determination to normalise interest rates and has been remarkably successful. Since the middle of 2017 there have been eight increases, from 0.5% to 2.5%, and underlying economic growth in the US does not appear to have suffered significantly in the process. The strength of the US dollar in 2018 was a surprise compared to market expectations at the start of the year and can be attributed in part to rising US interest rates (thereby narrowing the gap between the US and elsewhere) but also to a lack of confidence in prospects for Europe and China.
The Chinese economy is slowing down. This is inevitable if China is to rebalance away from the old investment-led model to one led by consumption. However, the ongoing trade dispute as well as the consequences of the deleveraging campaign meant economic activity significantly decelerated in the second half of 2018, by more than the rebalancing process implies. The official Purchasing Managers' Index (PMI), an indicator of economic activity, weakened over the course of the year and fell below 50.0 in December, indicating contracting economic activity. Industrial profit growth, year-on-year, decelerated in the second half of the year and turned slightly negative in November for the first time since 2015.
The government has responded to the slowdown with looser fiscal and monetary policy. Tax rules have been changed to encourage consumption; for example, personal allowances increased and deductions permitted for expenses like education and healthcare. The deleveraging campaign has slowed in order to reduce stress on small and medium businesses, some of whom are finding it harder to obtain credit from large state-owned banks. The required reserve ratio was cut several times over the year. But this is no broad based monetary easing as was the case following the financial crisis. The government does not want banks to lend for speculative purposes. For example, in December the National Reform and Development Commission (NDRC) announced that large firms could issue bonds to help refinance their debt. But there are several criteria that must be met: the liabilities to total assets ratio must be less than 85%; the firm cannot invest the proceeds into property development; the firm cannot raise funds in defined industries with excess capacity. The intention here is clear – the economy needs support but there the mistakes of the past cannot be repeated. Policymakers are aware of the trade-off between looser monetary policy and greater financial risks, and we believe are erring on the side of caution.
The Fund's performance for 2018 has been disappointing but we must compare what the share price of our holdings is implying against the actual conditions of our businesses. This involves looking at the historical return on capital that our businesses have achieved against the market implied return. For many of our holdings we are seeing big disconnects and much of this may have been driven by the valuation compression for stocks which did particularly well in 2017. Based on estimated 2019 earnings, the fund's discount to the broader market is 31%, its widest in recent years. We expect this gap to close over time.
The best performing stocks were Shenzhen Expressway, CNOOC and China Overseas Land & Investment. Shenzhen Expressway operates toll roads in the provinces of Guangdong, Hunan, Hubei and Jiangsu. It reported third results which showed continued growth across the vast majority of its roads. CNOOC, one of China's largest oil companies, benefited from rising oil prices for most of the year. The rise over the first three quarters compensated for the weaker fourth quarter when oil prices fell, meaning relative to the performance of weak Chinese markets, CNOOC was an outperformer. China Overseas Land & Investment (COLI) is one of
30
the more conservative real estate developers in China. It has managed to sustain a high return on capital over time without stretching its balance sheet. COLI has exposure to the higher margin tier one and two cities where demand is more resilient compared to the rest of the country. Given the relatively low gearing on the balance sheet, COLI benefits from lower financing costs. If its competitors were to face pressure (e.g. from high refinancing costs or discounting), COLI does have the capacity to raise funds and take advantage of other firms' distress.
The weakest stocks were AAC Technologies, Tongda Group and China Medical System. Weakness in the Chinese smartphone market and weaker than expected sales of the new iPhones led to weakness for companies in the smartphone supply chain. AAC Technologies' earnings forecasts have been cut and are expected to be down 20% on last year. The share price fall has been exacerbated by the company's high valuation at the beginning of the year. It was one of the few stocks in the portfolio that included a significant portion of future growth expectations in its valuation which has now come out. While we are confident in the company and its operational outlook, we ought to have been more alive to this risk. At this point we continue to hold on and add. It is a company in the smartphone supply chain which, due to its constant innovation, has real pricing power. For example, in 2018 AAC has been promoting its new Super Linear Structure (SLS) product which produces greater volume for the same sized speaker. These products have an average selling price that is 30-50% higher than existing products.
Tongda's margins were lower than usual in the first half period because Tongda is producing more plastic-like casings for its major client Xiaomi. Management argue that in the initial ramp-up for these newer plastic casings the margin will be lower, but as production increases the company will benefit from economies of scale and the margins will end up higher than those on metal casings. We believe the share price of Tongda does not currently reflect the efficiency and quality of the business, which has returned a 10% return on capital since 2010 and is likely to do so in 2018. The waterproof components division, though relatively small, does supply Apple and has higher margins than the rest of the business. This should act as a buffer against the more volatile Chinese market, even taking into account Apple's recent guidance. Tongda's stock trades at 4.3x FY18 earnings – more than two standard deviation below its fifteen-year average. It is one of the cheapest stocks in the smartphone supply chain.
After touching an all-time high in May, China Medical System's (CMS) share price fell significantly due to several headwinds. In 2015 CMS took a 15.7% stake in Faron Pharmaceuticals in a bid to diversify the business away from generics and towards innovative drugs. Faron's main product, Traumakine, failed its phase II trial in May. Assuming CMS' stake in Faron is completely written off, we estimate the actual reduction in FY17 earnings to be only ~2%. CMS' share price fell further in September following a new government central procurement trial, focusing on 11 cities. The first major tender was conducted in December and on average, prices fell 45%. For now none of CMS' products are on the list but management expects two of CMS' drugs, Deanxit (treats hypertension) and Plendil (treats depression and anxiety), to be added eventually. Total revenue could fall by 5% if the two drugs were to be included in the trial and in a worst-case scenario, up to 15% of revenue could be affected. Management argues that for many of its remaining products, competitors have not passed the bioequivalence test. For some products management does not see any competitor likely doing so which should limit price cuts. We think the share price implies a worst-case scenario for CMS but we think it can defend its position. We await details of the final policy.
2. Activity
Five switches were made. In the first quarter we initiated a new position in Dali Foods which is a manufacturer of food and beverages. It has traditionally focused on breads, crisps, biscuits and teas. The company is expanding into soymilk and energy drinks which are relatively new in China.
In the second quarter, we sold the entire position in Lenovo, PICC and China Mobile. These were replaced by Autohome, Noah Holdings and Baidu. Autohome is an automotive classified advertising business which has a dominant market share in China. On average 10.1 million people used its app daily in the first quarter of 2018. Its revenue comes from adverts and from the fees it charges to dealers to list on the website. Baidu's search engine is dominant in China with a market share of over 75%. In the past Baidu has been guilty of unsuccessfully throwing money at new businesses without realising a positive return. As a result, its cash return on investment has fallen from 30% in the 2007-2012 period to 12% in 2017. But we believe the business is a better allocator of capital today than it was in the past. Its operating system, DuerOS is being developed so it can be used on any hardware from any manufacturer. Over the next decade, as consumer electronics become more connected, Baidu's OS could become an integral part of each household in the same way its search function became an integral part of everyday life. Noah is a wealth and asset manager targeting high network individuals. It distributes onshore and offshore products across China. As Chinese financial markets mature investors are becoming more accustomed to the idea of diversified asset allocation. So in addition to equity offerings Noah also gives investors access to fixed income, private equity and fund-of-funds products denominated in RMB and
31
USD. The recent improvement in rules around the asset management industry, which brings it closer to global standards, should serve Noah well as it already positions and operates itself as a sophisticated asset manager.
The fund sold its small position in Chen Hsong in the third quarter, which has been held in the Fund for over 15 years and which we have deemed illiquid, following a pick up in the share price and higher volume.
3. Outlook
These have been testing times for investors and it seems likely that the same worries will persist into 2019. We are still very positive, but then we would say that. However, our confidence stems from the disconnect between the local conditions that the market is pricing in, and the conditions that actually prevail.
We believe China has the resilience to face the current slowdown. Policymakers are using counter cyclical fiscal and monetary policy to address the weaker operating environment. We believe policymakers have no intention of launching broad scale monetary stimulus because the costs of doing so are now too great. This leaves the trade dispute as the biggest unknown factor. We think it is in both the US' and China's interest to come sort of an arrangement but whether this is done by March is another question. A more likely scenario is an extended truce to give both sides more time to negotiate, with compliance to a final agreement likely to be the most important factor. In the midst of the negative headlines, it is easy to forget China's incredible long-term potential. For example, only 18 passenger vehicles per thousand people were sold in China in 2017 compared to 53 in the US, 45 in Germany and 36 in Korea. As China grows, even at slower rates, expect this ratio to catch up.
The Fund is focused on investing in businesses that we believe have a long-term role to play in China. The businesses we choose from have demonstrated success, which we measure using return on capital compared to the cost of capital over at least the last eight years. We believe that the current situation presents a very good opportunity to buy into these businesses. We believe that with sentiment so poor on a twelve-month horizon the market is undervaluing the long-term operational superiority of these businesses over the next three, five and 10 years. We believe that so long as we invest in businesses that make things that people want to buy, can grow steadily and can continue do so profitably, our investors should be confident in spite of market conditions today.

Edmund Harriss
The Fund invests in foreign securities, which involve political, economic and currency risks, greater volatility, and differences in accounting methods. These risks are greater for emerging markets. The Fund is non-diversified, meaning that its assets may be concentrated in fewer individual holdings than diversified funds. Therefore, the Fund is more exposed to individual stock volatility than diversified funds. Investments focused in a single geographic region may be exposed to greater risk and more volatility than investments diversified among various geographies. The Fund invests in smaller companies, which involve additional risks such as limited liquidity and greater volatility.
The Hang Seng Composite Index is a market capitalization weighted index that covers about 95% of the total market capitalization of companies listed on the main board of the Hong Kong Stock Exchange. This index is unmanaged, not available for investment and does not incur expenses.
Please refer to the Schedule of Investments for details on Fund holdings. Current and future portfolio holdings are subject to risk.
The information provided herein represents the opinion of Guinness Atkinson Asset Management, Inc. for the period stated and it is not intended to be a forecast of future events, a guarantee of future results, or investment advice. Opinions, Fund holdings and sector allocations are subject to change at any time, and are not recommendations to buy or sell any security.
32
Growth of $10,000
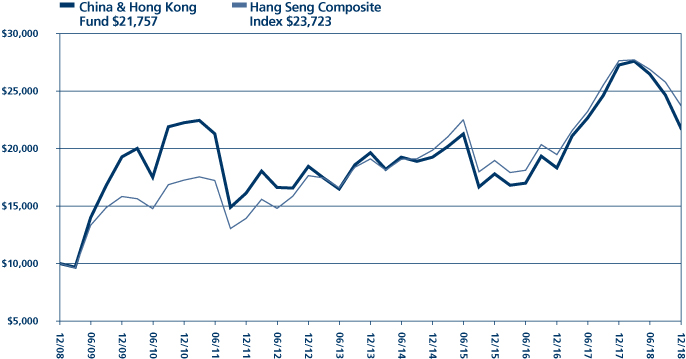
Average Annual Total Return
Periods Ended December 31, 2018
| One Year | | Five Years | | Ten Years | |
| | -20.21 | % | | | 2.07 | % | | | 8.08 | % | |
Performance data quoted represents past performance and does not guarantee future results. The investment return and principal value of an investment will fluctuate so that an investor's shares, when redeemed, may be worth more or less than their original cost. Current performance of the Fund may be lower or higher than the performance quoted. Performance data current to the most recent month end may be obtained by visiting www.gafunds.com.
Total returns for certain periods reflect a fee waiver in effect and in the absence of this waiver, the total returns would be lower. Returns reflect the reinvestment of distributions made by the Fund, if any. The graph and the performance table above do not reflect the deduction of taxes that a shareholder would pay on Fund distribution or the redemption of Fund shares. The Fund imposes a 2% redemption fee on shares held less than 30 days.
The Hang Seng Composite Index is a market-capitalization weighted index that comprises the top 200 companies listed on the Hong Kong Stock Exchange, based on the average market capitalization for the past twelve months. The index referenced in this chart is not available for investment and does not incur expenses.
33
FUND HIGHLIGHTS at December 31, 2018
GUINNESS ATKINSON CHINA & HONG KONG FUND
# of Holdings in Portfolio: | | 33 | |
Portfolio Turnover: | | 22.3% | |
% of Stocks in Top 10: | | 37.7% | |
Fund Manager: | | | |
Edmund Harriss | | | |
Top 10 Holdings (% of net assets) | | | | | | | |
CNOOC Ltd. | | 4.4% | | China Minsheng Banking Corp. Ltd. - H Shares | | 3.6% | |
China Overseas Land & Investments Ltd. | | 4.1% | | NetEase Inc. - ADR | | 3.6% | |
China Construction Bank Corp. - H Shares | | 3.9% | | Industrial & Commercial Bank of China Ltd. - H Shares | | 3.6% | |
China Merchants Bank Co., Ltd. - H Shares | | 3.8% | | Hollysys Automation Technologies Ltd. | | 3.5% | |
Ping An Insurance Group Company of China Ltd. - H Shares | | 3.7% | | Weichai Power Co., Ltd. - H Shares | | 3.5% | |
Industry Breakdown (% of net assets) | | | | | | | |
Commercial Banks | | 17.8% | | Internet Application Software | | 3.2% | |
Building Products | | 6.4% | | Textile - Products | | 3.1% | |
Oil Company - Exploration & Production | | 4.4% | | Semiconductor Components - Integrated Circuits | | 3.1% | |
Pharmaceuticals | | 4.3% | | Investment Management/Advisor Sevices | | 3.1% | |
Real Estate Operations/Development | | 4.1% | | Appliances | | 3.0% | |
Insurance | | 3.7% | | E-Commerce/Services | | 2.9% | |
Internet Content - Entertainment | | 3.6% | | Casino Hotels | | 2.8% | |
Industrial Automation | | 3.5% | | Web Portals | | 2.8% | |
Auto/Truck Parts & Equipment | | 3.5% | | Schools | | 2.7% | |
Electronic Component - Miscellaneous | | 3.3% | | Retail - Apparel/Shoe | | 2.7% | |
Shipbuilding | | 3.2% | | Telecommunication Equipment | | 2.4% | |
Public Thoroughfares | | 3.2% | | Auto - Cars/Light Trucks | | 2.3% | |
Food - Confectionery | | 3.2% | | | | | |
34
SCHEDULE OF INVESTMENTS
at December 31, 2018
GUINNESS ATKINSON CHINA & HONG KONG FUND
Shares | | COMMON STOCKS: 98.3% | | Value | |
Appliances: 3.0% | | | |
| | 694,000 | | | Haier Electronics Group Co., Ltd. | | $ | 1,705,968 | | |
Auto/Cars – Light Trucks: 2.3% | | | |
| | 741,000 | | | Geely Automobile Holdings Ltd. | | | 1,305,177 | | |
Auto/Truck Parts & Equipment: 3.5% | | | |
| | 1,715,480 | | | Weichai Power Co., Ltd. - H Shares | | | 1,961,478 | | |
Building Products: 6.4% | | | |
| | 384,000 | | | Anhui Conch Cement Co., Ltd. - H Shares | | | 1,861,965 | | |
| | 3,569,000 | | | China Lesso Group Holdings Ltd. | | | 1,782,086 | | |
| | | | | | | | 3,644,051 | | |
Casino Hotels: 2.8% | | | |
| | 257,000 | | | Galaxy Entertainment Group Ltd. | | | 1,620,591 | | |
Commercial Banks: 17.8% | | | |
| | 455,000 | | | BOC Hong Kong Holdings Ltd. | | | 1,685,741 | | |
| | 2,661,670 | | | China Construction Bank Corp. - H Shares | | | 2,197,395 | | |
| | 585,500 | | | China Merchants Bank Co., Ltd. - H Shares | | | 2,148,622 | | |
| | 2,971,200 | | | China Minsheng Banking Corp. Ltd. - H Shares | | | 2,046,131 | | |
| | 2,827,330 | | | Industrial & Commercial Bank of China Ltd. - H Shares | | | 2,017,896 | | |
| | | | | | | | 10,095,785 | | |
E-Commerce/Services: 2.9% | | | |
| | 21,300 | | | Autohome Inc. | | | 1,666,299 | | |
Electronic Component – Miscellaneous: 3.3% | | | |
| | 154,500 | | | AAC Technologies Holdings Inc. | | | 895,311 | | |
| | 10,000,000 | | | Tongda Group Holdings Ltd. | | | 998,981 | | |
| | | | | | | | 1,894,292 | | |
Food – Confectionery: 3.2% | | | |
| | 2,432,500 | | | Dali Foods Group Co., Ltd. | | | 1,807,271 | | |
Industrial Automation: 3.5% | | | |
| | 113,200 | | | Hollysys Automation Technologies Ltd. | | | 1,982,132 | | |
Insurance: 3.7% | | | |
| | 238,000 | | | Ping An Insurance Group Company of China Ltd. - H Shares | | | 2,103,435 | | |
Internet Application Software: 3.2% | | | |
| | 44,600 | | | Tencent Holdings Ltd. | | | 1,785,166 | | |
| | 11 | | | Tencent Music Entertainment Group | | | 151 | | |
| | | | | | | | 1,785,317 | | |
Internet Content – Entertainment: 3.6% | | | |
| | 8,575 | | | NetEase Inc. - ADR | | | 2,018,298 | | |
The accompanying notes are an integral part of these financial statements.
35
Shares | | COMMON STOCKS: 98.3% (Continued) | | Value | |
Investment Management/Advisor Services: 3.1% | | | |
| | 39,900 | | | Noah Holdings Ltd.* | | $ | 1,728,468 | | |
Oil Company – Exploration & Production: 4.4% | | | |
| | 1,620,000 | | | CNOOC Ltd. | | | 2,492,204 | | |
Pharmaceuticals: 4.3% | | | |
| | 1,522,000 | | | China Medical System Holdings | | | 1,418,149 | | |
| | 1,527,000 | | | Sino Biopharmaceutical Ltd. | | | 1,001,126 | | |
| | | | | | | | 2,419,275 | | |
Public Thoroughfares: 3.2% | | | |
| | 1,650,000 | | | Shenzhen Expressway Co., Ltd. - H Shares | | | 1,819,386 | | |
Real Estate Operations/Development: 4.1% | | | |
| | 682,000 | | | China Overseas Land & Investments Ltd. | | | 2,342,916 | | |
Retail – Apparel/Shoe: 2.7% | | | |
| | 1,790,000 | | | China Lilang Ltd. | | | 1,510,018 | | |
Schools: 2.7% | | | |
| | 27,900 | | | New Oriental Education & Technology Group Inc. - ADR | | | 1,529,199 | | |
Semiconductor Component – Integrated Circut: 3.1% | | | |
| | 30,500 | | | QUALCOMM Inc. | | | 1,735,755 | | |
Shipbuilding: 3.2% | | | |
| | 2,000,700 | | | Yangzijiang Shipbuilding Holdings Ltd. | | | 1,822,482 | | |
Telecommunication Equipment: 2.4% | | | |
| | 166,600 | | | VTech Holdings Ltd. | | | 1,377,947 | | |
Textile – Products: 3.1% | | | |
| | 1,958,000 | | | Pacific Textiles Holdings Ltd. | | | 1,741,268 | | |
Web Portals: 2.8% | | | |
| | 9,800 | | | Baidu Inc.* | | | 1,554,280 | | |
| | | | | Total Common Stocks
(cost $48,131,590) | | | 55,663,292 | | |
| | | | | Total Investments in Securities
(cost $48,131,590): 98.3% | | | 55,663,292 | | |
| | | | | Other Assets less Liabilities: 1.7% | | | 951,189 | | |
| | | | | Net Assets: 100.0% | | $ | 56,614,481 | | |
* Non-income producing security.
ADR - American Depository Receipt
The accompanying notes are an integral part of these financial statements.
36
GUINNESS ATKINSON DIVIDEND BUILDER FUND for the period ended December 31, 2018
1. Performance
AVERAGE ANNUAL TOTAL RETURNS
| | | 1 Year | | 3 Years | | 5 Years | | Since
Inception
(March 30, 2012) | |
Fund | | | -4.14 | % | | | 7.51 | % | | | 4.69 | % | | | 8.29 | % | |
Benchmark Index: | |
MSCI World Index (Net Return) | | | -8.71 | % | | | 6.30 | % | | | 4.56 | % | | | 7.63 | % | |
For the Fund's current one year expense ratio, please refer to the Financial Highlights section of this report.
Performance data quoted represents past performance and does not guarantee future results. The investment return and principal value of an investment in the Fund will fluctuate so that an investor's shares, when redeemed, may be worth more or less than their original cost. Current performance of the Fund may be lower or higher than the performance quoted. Performance data current to the most recent month-end may be obtained by visiting www.gafunds.com, or calling (800) 915-6565.
In 2018 the Guinness Atkinson Dividend Builder Fund produced a total return of -4.14%, compared to the MSCI World Index return of -8.71%. The Fund therefore outperformed the Index by 4.57%.
2018 provided a firm reminder that geopolitics matter. In stark contrast to the conditions of 2017, the past year was characterized by weaker markets and a return of volatility. Markets were no longer immune to uncertainty, and thus were prone to turbulence as investors digested the various economic, corporate, and political news releases. 2018 marked the worst year since 2008, and had a negative return of -8.2% (gross TR in USD). Prior to the fall, stock markets were in the midst of their longest bull run in history, which began when the market troughed in March 2009.
During 2018, the Guinness Atkinson Dividend Builder Fund performed as we would expect; the Fund is positioned with the aim to preserve capital during falling markets and keep up with growing markets. Over the course of the year this is generally the outcome we saw, and the Fund outperformed the MSCI World Index overall.
There were only two months which saw the MSCI World Index return greater than 3%: January and July. The Fund performed broadly in line with the market in January, and in fact outperformed in July due to particularly strong stock selection. We also saw three months in which the Index fell more than -4% (in USD): February, October and December. In each of these, the Fund outperformed the market.
At the start of 2018, global equity markets surged ever higher on optimism over the strength of the world economy, big US tax cuts, and upbeat corporate earnings releases. This was, however, followed by the largest ever one-day spike in the CBOE Volatility (VIX) Index; the first 10% market correction since early 2016; and a subsequent 8% rebound (all in USD). February's sell-off was triggered by an unexpected acceleration in wage growth in the US, strengthening the prospect of more aggressive rate hikes.
This was all before March, a month in which the year's early optimism faced increasingly strong headwinds from rising inflationary pressures, Federal Reserve (FED) rate hikes, and protectionist threats. These headwinds would go on to dominate the rhetoric for much of the year that followed. As many anticipated, the FED did indeed raise rates by 25 basis points in March, June, September and December – ending the year at a range of 2.25-2.5%. This had severe knock-on effects on equity markets, particularly in the third quarter, after FED chair Jay Powell contributed to a sharp sell-off by saying interest rates were "a long way from neutral". This hinted that the central bank could well continue monetary tightening despite inadvertently slowing economic growth. That triggered a stock market tremor that grew in intensity and culminated in a sell-off dubbed "Red October".
October in fact became the pivotal month when the outperformance of growth companies shifted to outperformance of value. This bias towards "value" contributes to explaining the Fund's outperformance in each of the last 3 months of the year. We also saw a shift in the market, with investors switching from Cyclical sectors to Defensive ones. Strong performance seen in the first three quarters of the year from sectors such as IT and Consumer Discretionary, experienced some of the largest reversals during the final quarter of the year.
By the end of the year, utilities and healthcare were the only two sectors in positive territory. Healthcare stocks have had a persistently strong run in 2018 after many stocks surpassed analyst's earnings and revenue growth expectations. Being overweight here benefitted the Fund's performance.
37
In a rare occurrence, Utilities were the best performing over the year. Power companies surged in the sell-offs in the year, particularly in October when they had their best month relative to the market since 2001 – the sector rallied more than 3% in October and beat the S&P 500 by 12%. Such an outperformance has occurred only four times previously, all surrounding market crashes. Although the fund has zero exposure to the sector, the drag on active performance was minimal considering that Utilities make up only 3% of the MSCI World Index (Net Return).
Among the worst performing sectors were Materials and Financials. These are traditionally referred to as "cyclical" sectors as demand for the goods and services they supply is typically dependent on the health of the economy: the better the outlook, the better they should perform. The Fund holds no positions in Materials, which benefited performance, and also holds no banks.
Banks and asset managers notably underperformed due to cyclical concerns and contagion from rising bond yields. Our Financials' exposure comes from security exchanges (NEX Group, CME Group, Deutsche Boerse) and insurance (Arthur Gallagher, Aflac), which all performed well overall. In fact, NEX Group (UK domicile, Financials sector) was the best performer in the fund over the year after it was bid for by CME Group at the end of Q1 2018. NEX share price had an initial increase of ~50% and with the probability of another bid decreasing, we saw an opportunity to take profits from our position in NEX later in the year. The valuation at time of sale stood at ~30x on a 1-year forward price-to-earnings basis, compared to a 10-year average of 12x.
Energy also underperformed this year, and the Fund was somewhat immune given it only holds one position in the sector. The price of oil peaked in October at around US$85 a barrel and then started its rather rapid decline in November, tumbling to 15-month lows mid-December. The weakness was driven by concerns over demand not meeting expectations as global growth concerns increased. Furthermore, investors fretted over increases in supply as shale oil production in the US continued to grow rapidly, and OPEC seemed unwilling to cut production, all of which had a negative impact on the sector's performance.
The Fund's largest overweight is to Consumer Staples (~16% vs the MSCI World Index Net Return) and this did not meaningfully add nor subtract from Fund performance relative to the benchmark over the year. There was outperformance in shorter periods such as the sell-off in October, which was led by technology stocks and higher growth companies, though there was some underperformance when the market rallied from mid-February onwards.
IT – the star performer of 2017 – started the year strongest before tailing off. Though the Fund is underweight, stock selection in the sector contributed positively. The fund did not have exposure to the 'high flying' FAANG-type stocks and therefore did not suffer in the sell-offs. Long term holdings Microsoft and Cisco continued to perform well, CA was subject to a bid (from Broadcom) and was subsequently sold. Following the bid, Broadcom fell ~20% (as the market saw a bid for a software company as tangential to Broadcom's core semi-conductor business) and the Fund took advantage by initiating a new position in the stock. Broadcom subsequently rallied and has added to fund performance over the short term.
Looking at the year from a geographical standpoint, performance was influenced heavily by political drama and global equities were particularly rocked by fears of a global trade war. The outcome of the US-China trade discussions – if any – remains one of the biggest uncertainties going into the new year. Amid the tensions, Chinese growth has disappointed throughout the year and left the region as one of the worst performing in 2018 (MSCI China Index (Net Return) returned -18.7% in USD in 2018). In contrast the US was the best performer (MSCI US Index returned -4.5% in USD in 2018).
The US was supported by robust corporate profitability leading on from the initial tax cuts, as well as strong economic growth numbers. Though the Fund is currently around 20% underweight the US, there was not any meaningful effect on performance. Any drag on the allocation effect was somewhat offset by good stock selection. In fact, out of the top 10 performing stocks in the fund, 8 were US domiciled.
Asia and Emerging Markets performed particularly poorly due to the uncertainty surrounding trade tariffs and the persistently strong US Dollar that characterized much of the year. Europe also faced its fair share of issues. The European Central Bank began to unwind its Quantitative Easing programme and markets have been treading sluggishly due to the various political events in Italy, Germany, Spain, France and Turkey.
In the UK, the year has been characterized by Brexit developments. A withdrawal pact was agreed between the UK and the EU, however amid considerable criticism from both the Conservative and Labor parties, Prime Minister Theresa May was forced to defer a meaningful Parliamentary vote on the agreement. Many protests and senior resignations eventually sparked a no confidence vote in the PM's leadership of the Conservative Party, which she eventually won. The uncertainty surrounding the Brexit strategy continues to negatively impact the UK market, and it remains to be seen what will actually be achieved before the looming March 29th deadline.
38
Stock Performance
When we look at how individual companies within the portfolio performed in 2018, we see that out of the top five, we have two IT, two financial, and one healthcare stock. This is testament to the bottom-up philosophy of the Guinness Atkinson Dividend Builder Fund focusing on quality companies at attractive valuations. It is also worth noting that the fund is benchmark and sector agnostic – positions are based on high conviction, bottom-up fundamental analysis.
NEX Group, CA Inc, CME Group and Broadcom (all amongst the top performers) were all involved with merger and acquisition (M&A) activity, and the other two stocks that had stand out performance were Merck (+40% in USD) and Microsoft (+21% in USD).
Merck, the global healthcare company, was the second-best performer in the year. Best-selling drugs in the Pharmaceutical segment include type 2 diabetes drug Januvia, which brings in about $4 billion in revenues annually. Strong performance in the year came after Merck's lung cancer drug, Keytruda, won a string of clinical trials and place it in the top spot for treating lung cancer. Estimates suggest that Keytruda could bring in $12.5 billion by 2022; the clinical trials proved a huge positive for Merck, as it continues to expand its drug portfolio with its R&D efforts.
Microsoft also performed very well in the year; it was the software maker's cloud transformation that has seen buoyant demand. Azure cloud services, used to store and run customers' applications in Microsoft's data centers, is number two in the cloud sector behind Amazon Web Services, though the market is growing fast enough to lift both companies' revenue. We have held Microsoft in the Fund since launch in 2012.
The worst performing stocks in the year included the 3 tobacco names we own: British American Tobacco (-50% in USD), Imperial Brands (-24% in USD) and Japan Tobacco (-22% in USD). The market's confidence in the tobacco industry was dented by news that the US Food and Drug Administration plans to pursue a ban on menthol cigarettes. The US is the industry's largest and most profitable market, and increased regulation would be expected to impact sales in the country.
Each of the 3 companies has a high cashflow return on investment, consistently ~20% and above for the last 10 years. Valuations, based on 2-year forward PE multiples, currently stand below respective, historical 10-year averages. These companies are expected to grow earnings in the high single digits for the next 2 years and have been increasing their dividends every year for at least the last 20 years, and that too at an annualised rate of close to 10%. The current trailing dividend yields have been market leading; at 7.8%, 7.7%, 5.7% for British American Tobacco, Imperial Brands and Japan Tobacco respectively. We also find the valuation compelling given that these companies have been able to sustain very high gross margins and grow year-on-year revenues for the last 3 years. This is despite the numerous concerns – regulatory pressure, government pressure/activism, rising interest rates, competition – which we believe have been overplayed in the market.
Another company, held in the Fund, that has faced a difficult 2018 is WPP (-37% in USD). We have held a position since Q3 2015; after 18 months of good performance (+47% in USD till Q1 2017), the company has over the last year faced both internal and external challenges. Stock market value fell after losses of large global clients, with the most recent including Ford, American Express and United Airlines. This forced management to announce lower sales guidance from -0.5% decline to -1.0% decline. WPP's CEO, Mark Read, who was confirmed in charge in September, faces an uphill task though new strategies underway seem to focus on merging advertising networks and selling lower growth parts of the business to become more streamlined overall. Further, the return on capital profile is high and stable, operating margins are around 20%, the company has historically had positive sales growth every year since 2002 (including 2009), the dividend is well covered, and the balance sheet is strong. We therefore maintain our holding: the company's shares trade on a 1-year forward price-to-earnings multiple of 7.9x – almost 2 standard deviations below its 10-year average – and at a discount to its peers (Publicis and Omnicom). The current dividend yield also has been close to 7%.
General Dynamics (GD), the diversified military defense company, has been held in the fund since launch and been a stand-out performer with a holding period return of 217% (in USD). GD is a prime military contractor to the Pentagon (the US government accounts for about 60% of sales). We decided to take profits on GD after strong performance led to a 1-year forward P/E Ratio of 16.7 (much higher than its historical 10-year average) and dividend yield fell to 1.9%.
TSMC is a pure-play foundry business and manufactures integrated circuits. At the time of purchase, we were fond of the company's very low debt to equity ratio of 12%, its attractive dividend yield of 3% and double digit earnings and profit growth estimates. Bought with a 2-year forward P/E Ratio of 14.5, we saw the company as attractively valued given its above-market-average growth forecasts. The company's leadership in manufacturing technology, along with GlobalFoundries' decision to
39
suspend its 7-nanometer product development, will allow TSMC to solidify its market share in high-performance computing chips and to pursue maintaining its industry-leading profit margin.
Broadcom announced that it would buy CA Technologies for US$18.9bn. Broadcom manufactures digital and analogue semiconductors. With a history of successfully integrating acquisitions, Broadcom has been able to grow revenues and gross profits every year consistently. At time of purchase, the stock was trading on a 1-year forward price-to-earnings ratio of 10.6x, which is significantly cheaper compared to history and versus the market. Upon announcement of the CA acquisition, Broadcom sold off due to market pessimism; CA's legacy software assets were seen as highly tangential to Broadcom's core business. This provided an attractive entry point.
CA Technologies was one of the best performers in the year (+34% in USD in our holding period in 2018) after the takeover bid from Broadcom led to a strong share price rally in July. This presented a good profit-taking opportunity. We initiated a position in CA at the end of 2015 and it since returned 63% (in USD). The software company's revenues and gross profit have been falling in recent years mainly due to a lack of organic growth and a decrease in software subscriptions. The bid from Broadcom led to a 18% rise in CA's share price and this provided an attractive sell opportunity.
Nestlé, the Swiss multi-national is the largest food company in the world by revenue and active in almost every country. 29 of Nestlé's brands have annual sales of over 1 billion USD. In recent years Nestlé has struggled to lift revenues due to sluggish consumer spending in Europe and the US as well as changes in consumer tastes. In fiscal 2017 sales growth was close to zero, however last year the company made significant strides by investing in high-growth businesses like bottled water, coffee, infant nutrition, and pet care. It recently bought the rights to sell Starbucks packaged coffees and teas worldwide, and also acquired Atrium, a Canadian manufacturer of OTC health supplements. Strategy has also consisted of many divestitures including the $2.8 billion sale of its famous candy business to Ferrero. We believe that market pessimism allowed us an attractive entry point into a business that is highly cash-generative, has a very strong balance sheet, and has provided an attractive 3% dividend yield.
As part of our one-in-out policy, we sold a position in NEX Group (our best performing stock of the year, up 62% in USD in our holding period in 2018). The financial technology firm, which provides electronic trading platforms, will be CME Group's largest overseas acquisition. CME Group, which we also own in the fund, owns and operates both the Chicago Board of Trade and the Chicago Mercantile Exchange. After the CME bid was announced at the end of Q1 2018, NEX share price had an initial increase of ~50%. The new price level was sustained and with the probability of another bid decreasing, we saw an opportunity to take profits from our position in NEX. The valuation at time of sale stood at ~30x on a 1-year forward price-to-earnings basis, compared to a 10-year average of 12x.
CME Group (+32% in USD) was also rewarded by the market over its NEX bid and after seeing an increase in average daily trading volumes in the year. CME is also particularly well-placed to benefit from increased interest-rate hedging around FED rate hikes and rising U.S. oil exports thanks to its dominant FED Funds and WTI futures contracts. The company has largely opted to pursue an organic growth strategy, and this has meant low debt-to-equity at 10% with returns on capital increasing every year for the last five.
Walmart – the world's largest retailer – has been held in the fund since the beginning of 2016 and is the second time we have held a position over the life of the Fund. At purchase in 2016 the company was trading at its highest ever dividend yield (>3.2%) and market was very pessimistic about the growth opportunity. However, the company has returned over 50% (in USD) over the holding period and has been seen making the right moves to further its online competitiveness. Though it has been rewarded for this, falling cashflow returns on investment, slower sales growth and narrower margins led us to sell our holding for a more compelling idea in the form of Paychex.
Paychex is a leading US provider of payroll processing and related HR services to small and medium-sized businesses. Over 50% of revenues come from payroll outsourcing – a task for which smaller firms are very willing to use a specialist. Once integrated into a client's business, renewal rates are extremely high, and so the cashflows that back the recent 3.1% dividend yield have been very stable as a result. Paychex is an asset light business that requires minimal capital expenditure, it has no long-term debt and has consecutively grown its revenues and earnings for the past 3 years at an average rate of 7% and 10% respectively. The recent market sell-offs, particularly concerning the IT sector, gave us an attractive entry point.
40
2. Activity
In 2018 we sold four positions and bought four new positions, leaving the portfolio with 35 positions at the end of the year.
In the first quarter, we made no changes to the portfolio.
In the second quarter, we made one change, whereby we replaced General Dynamics Corporation with Taiwan Semiconductor Manufacturing Company (TSMC).
In the third quarter, we made two changes to the portfolio. We bought new positions in Broadcom and Nestle, and sold our holdings in CA Technologies and NEX Group.
In the fourth quarter of the year, we made one additional change. We sold Walmart and bought Paychex.
3. Portfolio Positioning
The major effect of the changes we made to the portfolio in 2018 was to increase our exposure to IT, after market sell-offs provided us attractive entry opportunities.
In terms of sector weightings, the fund continues to have a zero weighting to utilities, materials, and real estate.
The largest overweight positions are to consumer staples, industrials and healthcare.
Sector Allocation at 12/31/2018 | |
Consumer Discretionary | | | 5.7 | % | |
Consumer Staples | | | 25.3 | % | |
Energy | | | 2.9 | % | |
Financials | | | 11.7 | % | |
Health Care | | | 17.3 | % | |
Industrials | | | 16.5 | % | |
Information Technology | | | 14.6 | % | |
Materials | | | 0.0 | % | |
Communication Services | | | 5.8 | % | |
Utilities | | | 0.0 | % | |
Real Estate | | | 0.0 | % | |
Cash | | | 0.2 | % | |
41
4. Dividend
The trailing twelve months dividend distributed by the Fund was $0.452 per share. Using the closing price of the fund at the yearend ($16.91) gives a trailing dividend yield of 2.7%. As of December 31, 2018, the Subsidized 30-day SEC Yield was 3.11% and the Unsubsidized 30-day SEC Yield was 1.29%.
The table below shows all the dividends distributed by the fund since launch.
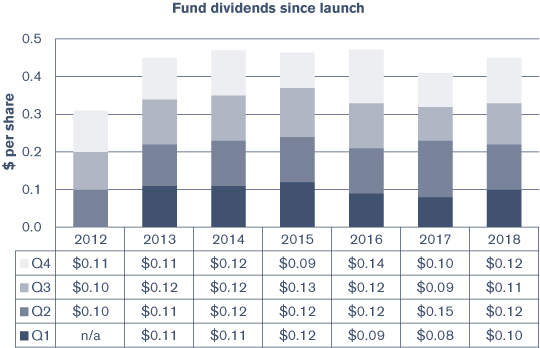
5. Outlook
The four key tenets to our approach are: quality, value, dividend, and conviction. We follow these metrics at the portfolio level to make sure we are providing what we say we will.
At the year end, we are pleased to report that the portfolio continues to deliver on all four of our tenets (quality, value, dividend, and conviction) relative to the benchmark MSCI World Index (Net Return). Based on the measures, holistically, the high-conviction fund has companies which are on average better quality at better value verses the index. The fund at the end of the year was trading on 13.7x 2019 expected price to earnings; a discount of 4.4% to the broad market. Additionally, on a free cashflow basis, the fund trades at a 20% discount to the market. This is impressive given that the expected growth rate of the fund is higher than the benchmark, based on earnings expectations at the turn of the year.
As 2019 brings with it more sensitive markets and many uncertainties – interest rates, trade tariffs, Government shutdowns, Brexit, elections, recessions, and many more unknown-unknowns. These risks should be considered in the context that global equities now trade below their 10-year average price-to-earnings multiple, and our Fund is at a discount to the market despite holding higher quality companies. Our perpetual approach of focusing on the quality of the underlying companies we own should stand us in good stead in our search for rising income streams and long-term capital growth.

| | 
| | | | | |
Matthew Page | | Ian Mortimer | | December 2018 | |
The Fund invests in foreign securities, which involve political, economic and currency risks, greater volatility, and differences in accounting methods. These risks are greater for emerging markets. The Fund invests in small- or mid-cap companies, which involve additional risks such as limited liquidity and greater volatility.
42
The MSCI World Index (Net Return) is a free float-adjusted market capitalization weighted index that is designed to measure the equity market performance of developed markets. Net Return reflects deduction for withholding tax but reflects no deduction for fees and expenses. Net Return is net of local withholding taxes that any investor would pay. This index is unmanaged, not available for investment and does not incur expenses.
PER or P/E – Price to Earnings ratio is calculated by dividing current price of the stock by the company's trailing months' earnings per share.
Earnings growth is not a measure of the Fund's future performance.
Subsidized 30-Day SEC Yield is based on a 30-day period ending on the last day of the previous month and is computed by dividing the net investment income per share earned during the period by the maximum offering price per share on the last day of the period. The subsidized yield is based on the net expenses of the Fund. The yield would be lower without the waivers in effect. Unsubsidized 30 Day SEC Yield is based on total expenses of the Fund. One cannot invest directly in an index.
Diversification does not assure a profit nor protect against loss in a declining market.
Please refer to the Schedule of Investments for details on Fund holdings. Current and future portfolio holdings are subject to risk.
The information provided herein represents the opinion of Guinness Atkinson Asset Management, Inc. for the period stated and is not intended to be a forecast of future events, a guarantee of future results, or investment advice. Opinions, Fund holdings and sector allocations are subject to change at any time, and are not recommendations to buy or sell any security.
43
Growth of $10,000
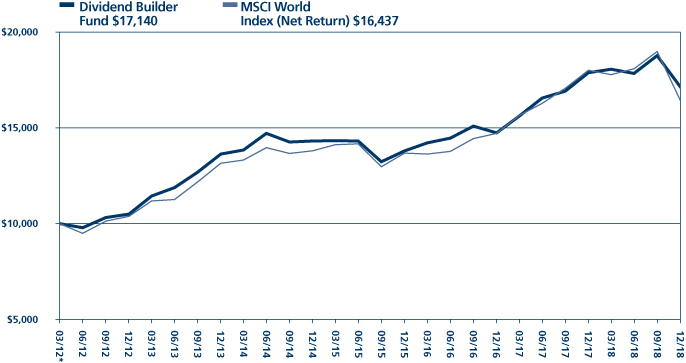
Average Annual Total Return
Periods Ended December 31, 2018
| One Year | | Five Years | | Since Inception
(03/30/12) | |
| | -4.14 | % | | | 4.69 | % | | | 8.29 | % | |
*Inception date 03/30/12.
Performance data quoted represents past performance and does not guarantee future results. The investment return and principal value of an investment will fluctuate so that an investor's shares, when redeemed, may be worth more or less than their original cost. Current performance of the Fund may be lower or higher than the performance quoted. Performance data current to the most recent month end may be obtained by visiting www.gafunds.com.
Total returns reflect a fee waiver in effect and in the absence of this waiver, the total returns would be lower. Returns reflect the reinvestment of distributions made by the Fund, if any. The graph and the performance table above do not reflect the deduction of taxes that a shareholder would pay on Fund distribution or the redemption of Fund shares.
The MSCI World Index (Net Return) is a free float-adjusted market capitalization weighted index that is designed to measure the equity market performance of developed markets. Net Return reflects deduction for withholding tax but reflects no deduction for fees and expenses. Net Return is net of local withholding taxes that any investor would pay.
44
FUND HIGHLIGHTS at December 31, 2018
GUINNESS ATKINSON DIVIDEND BUILDER FUND
# of Holdings in Portfolio: | | 35 | |
Portfolio Turnover: | | 23.7% | |
% of Stocks in Top 10: | | 30.3% | |
Fund Managers: | | | |
Dr. Ian Mortimer | | | |
Matthew Page | | | |
Top 10 Holdings (% of net assets) | | | | | |
Vodacom Group Ltd. | | | 3.4 | % | | AbbVie Inc. | | | 3.0 | % | |
ANTA Sports Products Ltd. | | | 3.2 | % | | Imperial Tobacco Group PLC | | | 2.9 | % | |
Arthur J Gallagher & Co. | | | 3.1 | % | | Randstad Holding NV | | | 2.9 | % | |
Taiwan Semiconductor Manufacturing Co., Ltd. | | | 3.0 | % | | Danone SA | | | 2.9 | % | |
Reckitt Benckiser Group PLC | | | 3.0 | % | | Merck & Co., Inc. | | | 2.9 | % | |
Industry Breakdown (% of net assets) | | | | | |
Pharmaceuticals | | | 14.4 | % | | Aerospace/Defense | | | 2.9 | % | |
Tobacco | | | 8.6 | % | | Electronic Components - Semiconductor | | | 2.9 | % | |
Food - Miscellaneous/Diversified | | | 5.7 | % | | Feminine Health Care Products | | | 2.8 | % | |
Finance - Other Services | | | 5.7 | % | | Networking Products | | | 2.8 | % | |
Diversified Manufacturing Operations | | | 5.5 | % | | Data Processing/Management | | | 2.8 | % | |
Cosmetics & Toiletries | | | 5.5 | % | | Applications Software | | | 2.8 | % | |
Cellular Telecommunications | | | 3.4 | % | | Oil Company - Integrated | | | 2.8 | % | |
Retail - Apparel/Shoe | | | 3.3 | % | | Advertising Agencies | | | 2.8 | % | |
Insurance Brokers | | | 3.1 | % | | MRI/Medical Diagnostic Imaging | | | 2.6 | % | |
Semiconductor Components - Integrated Circuits | | | 3.0 | % | | Apparel Manufacturers | | | 2.6 | % | |
Soap & Cleaning Preparation | | | 3.0 | % | | Power Conversion/Supply Equipment | | | 2.6 | % | |
Human Resources | | | 2.9 | % | | Aerospace/Defense Equipment | | | 2.5 | % | |
Life/Health Insurance | | | 2.9 | % | | | | | |
45
SCHEDULE OF INVESTMENTS
at December 31, 2018
GUINNESS ATKINSON DIVIDEND BUILDER FUND
Shares | | COMMON STOCKS: 99.9% | | Value | |
Australia: 2.6% | | | |
| | 14,323 | | | Sonic Healthcare Ltd. | | $ | 222,661 | | |
China: 6.1% | | | |
| | 57,000 | | | ANTA Sports Products Ltd. | | | 274,083 | | |
| | 33,500 | | | Hengan International Group Co. | | | 241,411 | | |
| | | | | | | | 515,494 | | |
Denmark: 2.8% | | | |
| | 5,200 | | | Novo Nordisk A/S | | | 238,885 | | |
France: 5.5% | | | |
| | 3,480 | | | Danone SA | | | 245,368 | | |
| | 3,190 | | | Schneider Electric SE | | | 219,178 | | |
| | | | | | | | 464,546 | | |
Germany: 2.8% | | | |
| | 1,980 | | | Deutsche Boerse AG | | | 238,519 | | |
Japan: 2.9% | | | |
| | 10,300 | | | Japan Tobacco Inc. | | | 245,163 | | |
Netherlands: 5.7% | | | |
| | 5,340 | | | Randstad Holding NV | | | 245,939 | | |
| | 7,960 | | | Royal Dutch Shell PLC - Class A | | | 234,212 | | |
| | | | | | | | 480,151 | | |
South Africa: 3.4% | | | |
| | 31,580 | | | Vodacom Group Ltd. | | | 289,784 | | |
Switzerland: 5.6% | | | |
| | 2,900 | | | Nestle SA | | | 235,846 | | |
| | 960 | | | Roche Holding AG | | | 238,860 | | |
| | | | | | | | 474,706 | | |
Taiwan: 3.0% | | | |
| | 35,000 | | | Taiwan Semiconductor Manufacturing Co., Ltd. | | | 256,389 | | |
United Kingdom: 17.1% | | | |
| | 41,300 | | | BAE Systems PLC | | | 242,214 | | |
| | 7,330 | | | British American Tobacco PLC | | | 234,401 | | |
| | 8,150 | | | Imperial Tobacco Group PLC | | | 247,141 | | |
| | 3,300 | | | Reckitt Benckiser Group PLC | | | 253,225 | | |
| | 4,390 | | | Unilever PLC | | | 230,276 | | |
| | 21,550 | | | WPP PLC | | | 233,214 | | |
| | | | | | | | 1,440,471 | | |
The accompanying notes are an integral part of these financial statements.
46
Shares | | COMMON STOCKS: 99.9% (Continued) | | Value | |
United States: 42.4% | | | |
| | 2,720 | | | AbbVie Inc. | | $ | 250,757 | | |
| | 5,320 | | | Aflac Inc. | | | 242,379 | | |
| | 3,550 | | | Arthur J Gallagher & Co. | | | 261,635 | | |
| | 950 | | | Broadcom Inc. | | | 241,566 | | |
| | 5,520 | | | Cisco Systems Inc. | | | 239,181 | | |
| | 1,290 | | | CME Group Inc. | | | 242,675 | | |
| | 3,350 | | | Eaton Corp. PLC | | | 230,011 | | |
| | 1,880 | | | Illinois Tool Works Inc. | | | 238,177 | | |
| | 1,890 | | | Johnson & Johnson | | | 243,904 | | |
| | 3,210 | | | Merck & Co., Inc. | | | 245,276 | | |
| | 2,340 | | | Microsoft Corp. | | | 237,674 | | |
| | 3,660 | | | Paychec Inc. | | | 238,449 | | |
| | 2,580 | | | Procter & Gamble Co/The | | | 237,154 | | |
| | 1,970 | | | United Technologies Corp. | | | 209,766 | | |
| | 3,100 | | | VF Corp. | | | 221,154 | | |
| | | | | | | | 3,579,758 | | |
| | | | | Total Common Stocks
(cost $7,699,733) | | | 8,446,527 | | |
| | | | | Total Investments in Securities
(cost $7,699,733): 99.9% | | | 8,446,527 | | |
| | | | | Other Assets less Liabilities: 0.1% | | | 10,677 | | |
| | | | | Net Assets: 100.0% | | $ | 8,457,204 | | |
PLC - Public Limited Company
The accompanying notes are an integral part of these financial statements.
47
GUINNESS ATKINSON GLOBAL ENERGY FUND for the period ended December 31, 2018
1. Performance
AVERAGE ANNUAL TOTAL RETURNS
| | | 1 Year | | 3 Years | | 5 Years | | 10 Years | |
Fund | | | -18.92 | % | | | 0.63 | % | | | -9.77 | % | | | 2.46 | % | |
Benchmark Index: | |
MSCI World Energy Index (Net Return) | | | -15.84 | % | | | 3.79 | % | | | -5.26 | % | | | 2.65 | % | |
For the Fund's current one-year expense ratio, please refer to the Financial Highlights section of this report.
Performance data quoted represents past performance and does not guarantee future results. The investment return and principal value of an investment in the Fund will fluctuate so that an investor's shares, when redeemed, may be worth more or less than their original cost. Current performance of the Fund may be lower or higher than the performance quoted. Performance data current to the most recent month-end may be obtained by visiting www.gafunds.com, or calling (800) 915-6565.
After a strong first three-quarters of the year for energy equities in 2018, the commodity price weakness in the fourth quarter led the sector (MSCI World Energy Index) to finish -15.84%, and behind the broad market. It was noticeable that energy equities did not react to the increasing spot oil price in the beginning of 2018. It was only when the long-dated oil price started to move up, in the second quarter of 2018, that the sector started to gain traction (the MSCI World Energy Index was up 10%, 8% ahead of the MSCI World index, by the end of May 2018). However, the severity of the spot price decline at the end of the year reversed the outperformance, and more. Valuation appears subdued relative to the improving levels of free cash flow and return on capital employed from our portfolio of energy equities and the sharp energy equity correction in the fourth quarter only served to increase the market's scepticism towards the improving return on capital and free cash flow generation of the sector.
As ever, the performance of the MSCI World Energy Index (Net Return) was only part of the story, with 2018 being a year of extreme divergence between the energy equity subsectors.
A quick tour of some of the main energy sub-sectors paints a picture for the overall performance of energy equities in 2018:
• Integrated oil and gas companies again delivered above average performance. Emerging Market integrated companies outperformed the developed market integrated companies, and all were strong versus other subsectors. On average, the big '5' supermajors (Exxon, Chevron, Royal Dutch Shell, TOTAL and BP) delivered a total return of -8% as their improving underlying financial profitability (and commitment to capital discipline, growing dividends and share buybacks) provided relative support against an extremely weak fourth quarter environment.
• Oil refiners also delivered relatively better share price performance, reflecting the generally strong oil product demand environment, and an eye to the expanded distillate margins resulting from International Maritime Organization (IMO) 2020 regulations. European refining was the strongest of the three regions.
• Renewables delivered a mixed bag of performance with those companies involved in the generation of renewable energy delivering small positive returns while those involved in the electrification of energy demand (including those companies involved in the electric vehicle supply chain) delivered negative returns of -20% to -30%.
• Exploration and production was a poorer performer. Typically, non-North American E&Ps (Exploration & Production) fared a little better, being exposed to global Brent oil prices rather than WTI prices, but were still down by around 20%. The worst returns were delivered from the North American onshore E&P sector, with both oil and gas-oriented E&Ps based in both Canada and the United States delivering returns of -40% to -50% range over the year. The Bakken-oriented E&Ps were the better performers in the region but were still down 25% over the year.
• Energy services were also particularly weak. North American onshore oil services providers and pressure pumpers fell by 60% or more, as excess capacity trumped the rise in activity. Even the large cap diversified service providers (e.g. Halliburton, Schlumberger and Baker Hughes GE) declined by over 40%. The international service industry fared slightly better but even the best performing sub sectors here (diversified offshore services and engineering & construction companies) were down by 24%.
48
Indicative portfolio contribution analysis
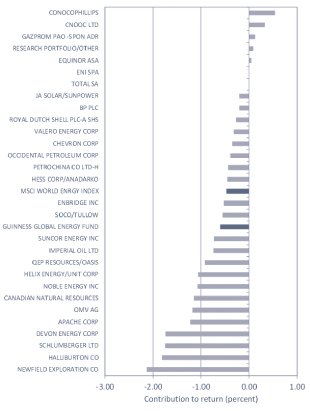
(source: Bloomberg)
The underperformance of the Fund versus the Index is disappointing and can be explained in broad terms by the Index's heavy composition bias (approximately 50% vs 15% in our portfolio) towards the big five 'super-major' oil and gas companies (Exxon, Chevron, Royal Dutch Shell, TOTAL and BP). The average total return for a super-major in 2018 was -8%, compared to -42% for the E&P sector, -44% for the energy services sector and -19% for the refining sector. This explanation has been used often over the last five years and, put simply, in the energy bear market that has persisted since 2014, large defensive integrated oil & gas companies have offered a defensive haven that other sectors have not come close to matching.
On a stock by stock basis in the fund, we saw particularly strong peer-relative performance from ConocoPhillips (+16%) as the market rewarded the delivery of growth together with dividend and share buyback increases and from Equinor (previously Statoil, +2%) as capex was restrained and the economics of new projects continued to improve. CNOOC and Gazprom performed well (+12% and +13% respectively), Gazprom enjoying elevated European gas prices, whilst ENI and TOTAL were the best of our developed market integrated oils.
It was a very poor year for our two diversified oil services companies (Schlumberger and Halliburton) that were both down by 45%. Given the positive long-term outlook for the North American onshore oil and gas industry, we were surprised to see such severe equity weakness. Devon Energy and Newfield Exploration (-45% and -54% respectively) were noticeably weak within the
49
poorly performing US onshore E&P sector with their underperformance reflecting a combination of weak regional pricing, negative regional politics or poorly performing assets.
2. Activity
In May we sold our position in Hess Corporation and switched to a holding in Anadarko. Hess is a US listed exploration and production company with, today, focus on US unconventional oil production in the Bakken (North Dakota), and international oil developments offshore Guyana. The company had enjoyed strong share price performance over the previous twelve months, thanks to a string of exploration discoveries in Guyanese waters, and high operational leverage to the rising oil price. However, we felt these factors became fully priced into the stock, prompting our decision to sell.
We switched into Anadarko, also a large diversified E&P company, but one with a more attractive asset mix than Hess. In particular, the company has substantial exposure to the Delaware Basin in Texas, as well as midstream, Gulf of Mexico and East African interests. We believe that Anadarko can deliver handsome capital efficient production growth over the next 3-4 years, which may drive the stock to outperform.
In July, JA Solar was sold from the portfolio, acquired by its Chairman under a long-running takeover plan that was first announced in 2017. We had owned JA Solar, a Chinese manufacturer of solar modules, since 2011. We regarded the acquisition price as satisfactory, given the competitive environment for solar module manufacturing.
The portfolio saw the disposal of Sino Gas & Energy in September. Sino Gas, a 'research' position that we had held in the portfolio for around four years, was acquired by US energy firm Lone Star, at a price which gave the fund a good profit over the invested period. The company had successfully expanded its unconventional drilling operations in the Ordos Basin, China's largest natural gas producing region, such that it came to the attention of a number of potential acquirers.
3. Portfolio Position
The table below shows the fund valuation in terms of historical and forward (analyst consensus estimates) price/earnings ratios versus the S&P500 Index.
| | | 2011 | | 2012 | | 2013 | | 2014 | | 2015 | | 2016 | | 2017 | | 2018 | |
Guinness Atkinson Global Energy Fund P/E | | | 7.3 | | | | 6.9 | | | | 7.6 | | | | 8.4 | | | | 18.4 | | | | 29.6 | | | | 20.3 | | | | 10.5 | | |
S&P 500 P/E | | | 28.1 | | | | 28.5 | | | | 25.7 | | | | 23.4 | | | | 27.5 | | | | 26.0 | | | | 22.2 | | | | 17.5 | | |
Premium(+)/Discount(-) | | | 68 | % | | | -69 | % | | | -61 | % | | | -54 | % | | | -22 | % | | | 36 | % | | | 4 | % | | | -27 | % | |
Average oil price (WTI $) | | | 95.0 | | | | 94.0 | | | | 98.0 | | | | 93.0 | | | | 49.0 | | | | 43.0 | | | | 51.0 | | | | 66.0 | | |
Source: Standard and Poor's; Guinness Atkinson Asset Management Ltd
50
The sector and geographic weightings of the portfolio at December 31, 2018 were as follows:
Sector Breakdown | |
| | | Dec. 31, 2017 | | Dec. 31, 2018 | |
Integrated | | | 41.9 | | | | 45.3 | | |
Exploration and production | | | 37.8 | | | | 35.7 | | |
Drilling | | | 1.8 | | | | 1.5 | | |
Equipment and services | | | 9.2 | | | | 8.3 | | |
Refining and marketing | | | 3.5 | | | | 3.9 | | |
Storage & Transportation | | | 3.5 | | | | 3.7 | | |
Solar | | | 2.1 | | | | 0.6 | | |
Cash | | | 0.2 | | | | 1.0 | | |
Total | | | 100 | | | | 100 | | |
Geographic Breakdown | |
| | | Dec. 31, 2017 | | Dec. 31, 2018 | |
US | | | 51.4 | | | | 47.6 | | |
Canada | | | 10.4 | | | | 11.1 | | |
UK | | | 9.2 | | | | 9.5 | | |
Europe | | | 17.5 | | | | 18.8 | | |
Hong Kong | | | 7.3 | | | | 7.9 | | |
Russia | | | 3.3 | | | | 3.7 | | |
Other | | | 0.7 | | | | 0.6 | | |
Cash | | | 0.2 | | | | 0.8 | | |
Total | | | 100 | | | | 100 | | |
4. Market Background
Turning to the commodities, 2018 was a year of two halves for the oil market. OPEC compliance on their 2017 quota cuts reached a level of 135% in February 2018, causing global oil inventories to draw and spot prices to rise. Persistent production declines from Venezuela combined with the threat of stringent US-led sanctions against Iran then led to concerns that there would be physical oil supply shortages in the second half of the year, bringing the spot Brent oil price as high as $86/bl. After pressure from the US, and a realisation that prices were unsustainably high, OPEC (and Saudi in particular) delivered a surge of production in the second half of the year that coincided with the announcement of waivers for Iranian oil exports and a peak in US onshore shale oil supply. The ensuing oversupply pushed oil and product inventories higher, causing a sharp correction in spot oil prices. OPEC responded by re-introducing quotas for 2019, to maintain reasonable prices for their members.
Spot oil prices traded in a wide range during the year. Brent oil started 2018 at $67/bl before peaking at $86/bl in early October and then falling sharply to end the year at $54/bl, close to its lows for the year, and down by 19% over the year. The sharp drop in spot prices at the end of the year was accelerated by financial activity in oil. Over the fourth quarter, the net long non-commercial crude oil futures open position (WTI) fell from 560,000 contracts to 309,000 contracts. The average Brent spot oil price in 2018 was $71.7/bl, $17/bl higher than the 2017 average of $54.8/bl. WTI spot averaged $64.9/bl, a discount of $7/bl to Brent, as resurgent US production brought numerous infrastructure issues and widened the discount to Brent. Also of note was the fact that Canadian oil prices, as measured by the Western Canadian Select crude blend, averaged only $38.6/bl during the year, dropping as low as $13.5/bl in mid-November, leading the Alberta government to instigate production quotas for 2019.
51
There was also a marked change in the shape of the oil futures curve over the year. Both Brent and WTI moving from shallow backwardation to extreme backwardation by the middle of the year, then swinging into contango in the fourth quarter. Importantly, longer dated crude prices were more resilient, with the Brent five year forward price finishing the year up 4% at $60/bl.
The major components to oil supply/demand for 2018 were as follows:
• OPEC oil supply, measured for OPEC-14, is likely to have decreased by around 0.1m b/day, averaging 32.1m b/day, versus 32.2m b/day in 2017. The losers included Venezuela, which suffered a dramatic production decline (falling from 1.6m b/day at the start of the year to 1.2m b/day in December 2018) together with Angola (a decline of 0.1m b/day) and Iran (a decline of 0.8m b/day predominantly at the end of the year caused by US-sanctions). The winners were Saudi Arabia, Kuwait, UAE and Iraq which together increased production by 1.7m b/day to offset declines elsewhere. After several years of problems, Libya and Nigeria also posted gains over the year. OPEC met in December 2018 and resolved to reduce their supply by around 0.7m b/day in 2019, effectively reversing the surge of production brought on in the middle of 2018 to balance the impact of Iranian sanctions. During the year, Saudi delayed its planned IPO of Saudi Aramco and Qatar announced its intention to leave OPEC.
• Non-OPEC oil supply is likely to have grown by 2.4m b/day over the year (60.4m b/day, versus 58.0m b/day in 2017) and was driven almost entirely by growth from the US onshore, Canada and Russia. US onshore oil supply is expected to have averaged 8.7m b/day in 2018, delivering a record 1.6m b/day growth for the year, as WTI oil prices of $60/bl and above incentivised an increase of 100 oil directed drilling rigs in the first half of 2018 (around 870 rigs as of December 2018). Increases in production were also reported in Canada (+0.3m b/day) and the remainder of the United States (+0.5m b/day), offset by declines in Norway (-0.1m b/day) and Mexico (-0.1m b/day) while other large non-OPEC producers like Brazil and China managed to keep production flat.
• Global oil demand is estimated to have grown by around 1.3 m b/day in 2018, according to the IEA. This comprises non-OECD oil demand growth of 0.9m b/day (with China up 0.5m b/day and India up 0.2m b/day) and OECD oil demand growth of 0.4m b/day. If confirmed, these final figures will be in line with the forecasts for 2018 that were made at the beginning of the year. Non-OECD demand growth was tempered somewhat due to higher oil prices and the strong US dollar in the middle of the year. OECD demand growth of 0.4m b/day in 2018 was at the lower end of the recent historic range, reflecting a greater level of price elasticity.
• OECD oil inventories at the end of November 2018 were estimated to be at 2,873 million barrels, down from 2,903 million barrels a year before, but still 7% above the 2005-2014 average level. We expect inventories to end 2018 broadly flat with the end of 2017, having been undersupplied by around 0.3m b/day in 2017.
• For natural gas, 2018 was a year of further divergence between the US, Europe and Asia. In the US, the gas price was anchored sub $3/mcf until prices spiked briefly to $4.8/mcf in early November as a result of the onset of colder weather and lower levels of natural gas in storage. The stronger end to the year brought the average gas price to $3.07/mcf (up from $3.02/mcf in 2017) but longer term gas prices (such as the five year forward gas price) saw less price increase as a $3/mcf price was deemed sufficient to justify new drilling to offset lower inventory levels.
5. Outlook
As we look ahead into 2019, we expect OPEC to remain disciplined in its pursuit of normalised oil inventories, and will seek to manage the Brent oil price at around $60/bl. OPEC are striving to find a 'happy medium' for the oil market where their own economics are better satisfied, the world economy is kept stable and US oil production grows in a controlled manner.
On the supply side, the US onshore shale system will grow strongly again this year, up by just over 1m b/day if Brent averages $60/bl. E&Ps will continue to react to oil prices (despite higher levels of capital discipline) and growth will be higher if prices are higher. Permian pipeline constraints will be solved by year end and oil service activity is likely to pick up as the year progresses. Non-OPEC (ex US onshore) supply will hold up in 2019 but will come under increasing pressure as upstream capex cuts from 2015-18 take effect. A dearth of new project sanctions and increasing decline rates on existing fields means that non-OPEC (ex US onshore) supply will stagnate to the end of the decade, even if oil prices rise from here.
Global oil demand will depend on GDP growth, currently expected at around 1.4m b/day if the IMF's GDP global forecast of 3.5% holds up. The non-OECD will deliver most of the growth in 2019, with China and India leading the way. We will see more electric vehicles sold this year but they will pose a negligible threat to oil demand growth.
Putting all this together, OECD oil inventories are likely to be similar to end-2018 but the path will be bumpy. Looking further ahead, we believe that continued oil demand growth, and a decline in non-OPEC supply outside the US, will raise the call on the US shale system and OPEC. We expect OPEC will manage the market to a higher price in this environment.
52
Meanwhile, global gas demand will grow handsomely again in 2019 led by strong Asian GDP growth and a shift in the region from coal to gas consumption by power utilities.
Energy equity valuations remain at depressed levels. On a relative price-to-book (P/B) basis (versus the S&P500), the valuation of energy equities sit at a 50 year low, at 0.5x, just below level that it was at in February 2016 when Brent oil was $29/bl. We believe that improving ROCE (we forecast 7% for our portfolio in 2019 assuming $60 Brent prices, up from 1% in 2016) should drive a higher P/B ratio.
Free cash flow will remain a priority in 2019. Shareholder pressure for energy companies to live within cash flow, cover dividends and buyback shares should keep free cash flow in sharp focus. We expect improvements here even in a static oil price environment and, looking ahead to 2020 with a $60 oil price, we expect oil & gas companies to be able to grow shareholder distributions meaningfully for the first time in a decade. Super majors could raise distributions by 50%, whilst mid & large cap producers could raise them by 100%.
Energy equities offer attractive upside if our oil price and profitability scenario plays out. If you believe, as we do, in long term $60 Brent with ROCE and FCF Returns being sustained at long run average levels, then there should be 40-50% upside across the energy complex.
 | | 
| |
Will Riley | | Jonathan Waghorn | |

| | | |
Tim Guinness January 2019
Fund investment team | | | | | |
The Fund invests in foreign securities, which involve political, economic, currency risks, greater volatility, and differences in accounting methods. These risks are greater for emerging markets. The Fund is non-diversified, meaning that its assets may be invested in fewer individual holdings than diversified funds. Therefore, the Fund is more exposed to individual stock volatility than diversified funds. The Fund invests in smaller companies, which involve additional risks such as limited liquidity and greater volatility. The Fund's focus on the energy sector to the exclusion of other sectors exposes the Fund to greater market risk and potential monetary losses than if the Fund's assets were diversified among various sectors.
The MSCI World Energy Index (Net Return) is an unmanaged index composed of more than 1,400 stocks listed on exchanges in the U.S., Europe, Canada, Australia, New Zealand and the Far East. Net Return reflects deduction for withholding tax but reflects no deduction for fees and expenses. Net Return is net of local withholding taxes that any investor would pay. This index is unmanaged and is not available for investment, and do not incur expenses.
MCF is an abbreviation denoting a thousand cubic feet of natural gas.
Price to Book Ratio (P/B Ratio) a ratio used to compare a stock's market value to its book value. It is calculated by dividing the current closing price of the stock by the latest quarter's book value per share.
P/E – Price to Earnings ratio is calculated by dividing current price of the stock by the company's trailing months' earnings per share.
Please refer to the Schedule of Investments for details on Fund holdings. Current and future portfolio holdings are subject to risk.
The information provided herein represents the opinion of Guinness Atkinson Asset Management, Inc. for the period stated and it is not intended to be a forecast of future events, a guarantee of future results, or investment advice. Opinions, Fund holdings and sector allocations are subject to change at any time, and are not recommendations to buy or sell any security.
53
Growth of $10,000
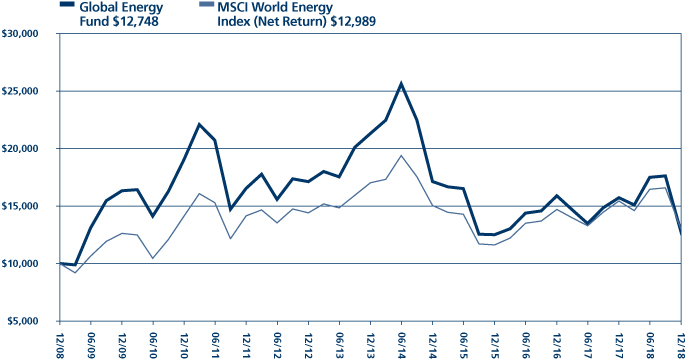
Average Annual Total Return
Periods Ended December 31, 2018
| One Year | | Five Years | | Ten Years | |
| | -18.92 | % | | | -9.77 | % | | | 2.46 | % | |
Performance data quoted represents past performance and does not guarantee future results. The investment return and principal value of an investment will fluctuate so that an investor's shares, when redeemed, may be worth more or less than their original cost. Current performance of the Fund may be lower or higher than the performance quoted. Performance data current to the most recent month end may be obtained by visiting www.gafunds.com.
Total returns for certain periods reflect a fee waiver in effect and in the absence of this waiver, the total returns would be lower. Returns reflect the reinvestment of distributions made by the Fund, if any. The graph and the performance table above do not reflect the deduction of taxes that a shareholder would pay on Fund distribution or the redemption of Fund shares.
The MSCI World Energy Index (Net Return) is an unmanaged index composed of more than 1,400 stocks listed on exchanges in the U.S., Europe, Canada, Australia, New Zealand and the Far East. Net Return reflects deduction for withholding tax but reflects no deduction for fees and expenses. Net Return is net of local withholding taxes that any investor would pay.
54
FUND HIGHLIGHTS at December 31, 2018
GUINNESS ATKINSON GLOBAL ENERGY FUND
# of Holdings in Portfolio: | | 37 | |
Portfolio Turnover: | | 14.4% | |
% of Stocks in Top 10: | | 39.2% | |
Fund Managers: | | | |
Timothy W. N. Guinness | |
Will Riley | |
Jonathan Waghorn | |
Top 10 Holdings (% of net assets) | | | | | | | |
ConocoPhillips | | | 4.2 | % | | Royal Dutch Shell PLC - Class A | | | 3.9 | % | |
| BP PLC | | | 4.1 | % | | Canadian Natural Resources Ltd. | | | 3.8 | % | |
CNOOC Ltd. | | | 4.0 | % | | Equinor ASA | | | 3.8 | % | |
Valero Energy, Corp. | | | 3.9 | % | | PetroChina Co., Ltd. - H Shares | | | 3.8 | % | |
Occidental Petroleum Corp. | | | 3.9 | % | | ENI SpA | | | 3.8 | % | |
Industry Breakdown (% of net assets) | | | | | | | |
Oil & Gas - Integrated | | | 41.6 | % | | Energy - Alternate Sources | | | 0.6 | % | |
Oil & Gas - Exploration & Production | | | 40.1 | % | | Oil & Gas - Drilling | | | 0.6 | % | |
Oil & Gas - Field Services | | | 8.2 | % | | Financials - Investment Companies | | | 0.5 | % | |
Oil Refining & Marketing | | | 3.9 | % | | Machinery - General Industries | | | 0.2 | % | |
Oil & Gas - Pipelines and Transportation | | | 3.8 | % | | | | | | | | | |
55
SCHEDULE OF INVESTMENTS
at December 31, 2018
GUINNESS ATKINSON GLOBAL ENERGY FUND
Shares | | COMMON STOCKS: 99.5% | | Value | |
Energy – Alternate Sources: 0.6% | | | |
| | 25,300 | | | SunPower Corp.* | | $ | 125,741 | | |
Financials – Investment Companies: 0.5% | | | |
| | 10,000,000 | | | Reabold Resources PLC*† | | | 93,683 | | |
Machinery – General Industries: 0.2% | | | |
| | 182,956 | | | Shandong Molong Petroleum Machinery Co., Ltd. - H Shares* | | | 30,401 | | |
Oil & Gas – Drilling: 0.6% | | | |
| | 4,183,812 | | | Cluff Natural Resources PLC*† | | | 123,298 | | |
Oil & Gas – Exploration & Production: 40.1% | | | |
| | 15,750 | | | Anadarko Petroleum Corp. | | | 690,480 | | |
| | 22,409 | | | Apache Corp. | | | 588,236 | | |
| | 31,000 | | | Canadian Natural Resources Ltd. | | | 747,978 | | |
| | 509,000 | | | CNOOC Ltd. | | | 783,044 | | |
| | 13,000 | | | ConocoPhillips | | | 810,550 | | |
| | 26,300 | | | Devon Energy Corp. | | | 592,802 | | |
| | 698,157 | | | EnQuest PLC* | | | 196,013 | | |
| | 238,274 | | | JKX Oil & Gas PLC*† | | | 119,455 | | |
| | 37,786 | | | Newfield Exploration Co.* | | | 553,943 | | |
| | 32,670 | | | Noble Energy Inc. | | | 612,889 | | |
| | 41,000 | | | Oasis Petroleum Inc.* | | | 226,730 | | |
| | 12,400 | | | Occidental Petroleum Corp. | | | 761,112 | | |
| | 46,199 | | | Ophir Energy PLC* | | | 21,834 | | |
| | 43,900 | | | QEP Resources Inc.* | | | 247,157 | | |
| | 249,550 | | | SOCO International PLC | | | 216,863 | | |
| | 165,540 | | | Tullow Oil PlC* | | | 380,778 | | |
| | 20,797 | | | Unit Corp.* | | | 296,981 | | |
| | | | | | | | 7,846,845 | | |
Oil & Gas – Field Services: 8.2% | | | |
| | 23,800 | | | Halliburton Co. | | | 632,604 | | |
| | 50,980 | | | Helix Energy Solutions Group, Inc.* | | | 275,802 | | |
| | 19,300 | | | Schlumberger Ltd. | | | 696,344 | | |
| | | | | | | | 1,604,750 | | |
The accompanying notes are an integral part of these financial statements.
56
Shares | | COMMON STOCKS: 99.5% (Continued) | | Value | |
Oil & Gas – Integrated: 41.6% | | | |
| | 127,600 | | | BP PLC | | $ | 807,929 | | |
| | 6,700 | | | Chevron Corp. | | | 728,893 | | |
| | 46,860 | | | ENI SpA | | | 740,156 | | |
| | 35,220 | | | Equinor ASA | | | 747,738 | | |
| | 165,650 | | | Gazprom OAO - ADR | | | 735,066 | | |
| | 28,201 | | | Imperial Oil Ltd. | | | 714,527 | | |
| | 16,118 | | | OMV AG | | | 706,778 | | |
| | 1,193,000 | | | PetroChina Co., Ltd. - H Shares | | | 740,364 | | |
| | 25,620 | | | Royal Dutch Shell PLC - Class A | | | 753,832 | | |
| | 25,876 | | | Suncor Energy, Inc. | | | 722,716 | | |
| | 13,940 | | | Total SA | | | 737,676 | | |
| | | | | | | | 8,135,675 | | |
Oil & Gas – Pipelines and Transportation: 3.8% | | | |
| | 23,600 | | | Enbridge Inc. | | | 733,488 | | |
Oil Refining & Marketing: 3.9% | | | |
| | 10,269 | | | Valero Energy, Corp. | | | 769,867 | | |
| | | | | Total Common Stocks
(cost $27,134,678) | | | 19,463,748 | | |
| | | | | Total Investments in Securities
(cost $27,134,678): 99.5% | | | 19,463,748 | | |
| | | | | Other Assets less Liabilities: 0.5% | | | 89,194 | | |
| | | | | Net Assets: 100.0% | | $ | 19,552,942 | | |
* Non-income producing security.
ADR - American Depository Receipt
PLC - Public Limited Company
† The Advisor has determined these securities to be Illiquid. As of December 31, 2018, the total market value of these illiquid securities represent 1.7% of net assets. The total market value of these illiquid securities is $336,437.
The accompanying notes are an integral part of these financial statements.
57
GUINNESS ATKINSON GLOBAL INNOVATORS FUND for the period ended December 31, 2018
1. Performance
AVERAGE ANNUAL TOTAL RETURNS
| | | 1 Year | | 3 Years | | 5 Years | | 10 Years | |
Fund | |
Investor Class | | | -16.80 | % | | | 7.08 | % | | | 6.03 | % | | | 14.00 | % | |
Institutional Class* | | | -16.59 | % | | | 7.35 | % | | | 6.19 | % | | | 14.09 | % | |
MSCI World Index (Net Return) | | | -8.71 | % | | | 6.30 | % | | | 4.56 | % | | | 9.66 | % | |
Nasdaq Composite Index | | | -2.81 | % | | | 11.16 | % | | | 11.06 | % | | | 16.85 | % | |
*Institutional Class shares commenced on December 31, 2015. The performance figures for the Institutional Class shares include the performance of Investor Class shares for the period prior to the inception date of the Institutional Class shares.
For the Fund's current one-year expense ratios, please refer to the Financial Highlights section of this report.
Performance data quoted represents past performance and does not guarantee future results. The investment return and principal value of an investment in the Fund will fluctuate so that an investor's shares, when redeemed, may be worth more or less than their original cost. Current performance of the Fund may be lower or higher than the performance quoted. Performance data current to the most recent month-end may be obtained by visiting www.gafunds.com, or calling (800) 915-6565.
In 2018 the Guinness Atkinson Global Innovators Fund Investor Class shares produced a total return of -16.80% vs the MSCI World Index net total return of -8.71%. The fund therefore underperformed the benchmark by 8.09% over the year.
As we have highlighted in previous reviews, historically, the Global Innovators Fund has tended to outperform in months where the index performance has been positive and underperform in months where the index performance has been negative. In a year where markets rallied strongly through the first 3 quarters but suffered substantial loses in the last quarter, the picture generally held true. The general sector rotation and 'risk-off' attitude in the latter part of the year resulted in much of the fund's underperformance during 2018.
The fund outperformed the MSCI World in each of the first three months of the year, most notably outperforming by ~2% in February as volatility spiked, sending the majority of stocks down. Our overweighting to IT stocks, which was the top performing sector, was the largest contributor to the outperformance as strong corporate earnings resulted in large idiosyncratic stock movements.
Come the second quarter, the fund produced mixed results as our overweighting to IT became unfavourable. Stock selection was the main drag on the portfolio during this period as semiconductor companies and Apple supply chain names sold off – for example AAC Technologies and Catcher Technology, which are not constituents of the benchmark. However, our underweighting to financials provided some positives with our only financial stock, Intercontinental Exchange, returning 1.75% whilst the sector was down 4.1%.
Entering the third quarter, the fund underperformed the benchmark as a continuation of the sell-off in semiconductor stocks resulted in a substantial drag on the portfolio. Additionally, our underweighting to healthcare stocks proved to be a negative contributor with the sector producing the largest returns amongst the GICS sectors. The fund's position in Checkpoint Software – the US listed cyber security business – returned 20.4% over the quarter and thus was a key positive contributor to the fund's performance.
In October and December, notable sell-offs in sectors which had been outperforming throughout the year contributed negatively to asset allocation – in particular, IT in which the fund is overweight. The trade dispute between the US and China seemed to begin having a notable negative impact on economic indicators in China. Reports of slowing iPhone demand and growing fears that consumers are upgrading phones more irregularly started a sharp sell-off in the Apple supply chain names. Additionally, weakness in the automotive industry, primarily driven by falling sales in China – the world's largest automotive market – resulted in the German tire manufacturer and auto components company Continental, which we own in the fund, selling off. However, with the fund continuing to have no energy exposure and significantly underweight financials, the portfolio benefitted from the avoidance of the two worst performing sectors over the quarter.
Overall, our overweighting to Asia Pacific stocks, and in particular Chinese stocks, resulted in over 5% of the fund's underperformance over 2018. This can be attributed to the large sell-offs in AAC Technologies, New Oriental Education and Baidu,
58
as well as the zero exposure the benchmark has to Chinese stocks. On a sector level, our overweighting to IT produced the majority of our underperformance with semiconductor and Apple supply chain names underperforming.
2. Activity
We sold five positions and initiated five new positions over the course of 2018.
We made three changes to the portfolio in the first quarter. We sold Intel, Verifone and WisdomTree and bought KLA Tencor, Lam Research and Baidu.
Intel had been held in the fund since February 2011, performing well over the holding period, with particularly strong performance materialising in 2017. Earnings released in October 2017 exceeded market expectations, but we did not foresee strong growth continuing throughout 2018 and beyond. Cash flow return on investment has also been declining in recent years, adding to the potential risks.
Verifone provide the technology and infrastructure that allow merchants to offer a variety of payments options including chip and pin, contactless card payments and the likes of Apple Pay and Google Wallet. The company was bought on the original thesis of benefitting from the rollout of chip and pin technology in the US which was being driven by a shift in card fraud liability to merchants that do not offer this technology. The adoption of this has remained slow and demand for Verifone's payment terminals has slowed alongside softer card-network rules regarding fraud liability for non-chip terminals, decreasing the urgency to upgrade in certain merchant segments. This combined with a declining cashflow return on investment profile and increasing debt on their balance sheet contributed to our decision to sell Verifone.
WisdomTree, an ETF provider, sold off due to weaker Q4 2017 earnings, which were reported in early February amid weaker markets. Their business suffered outflows in Europe and inflows slowed in its Canadian operations. WisdomTree has been struggling to capture market share from larger passive rivals in the U.S. market. This has contributed to decreasing returns on capital and lower growth expectations.
KLA Tencor, a US based supplier of semiconductor process control and yield management solutions, is at the forefront of improving yields and reducing failure rates in the semiconductor industry. The company's products include defect inspection and calibration products. We see potential for the overall industry to expand, with the key market drivers being data centres, high performance computing, autonomous driving and artificial intelligence. At the time, KLA Tencor offered an attractive valuation of 14.4x PER with a strong cashflow return on investment profile and well covered debt. We think the company is in a strong position to meet our return requirements at a valuation which provides some downside protection.
Lam Research, the US manufacturer of semiconductor processing equipment has been at the forefront of innovative wafer fabrication. Wafer manufacturing has been integral to a range of secular trends within the Information Technology sector. On a company level, Lam Research has seen improving cashflow return on investment while maintaining a strong balance sheet. The company has continually invested in research and development (R&D) to help preserve its competitive edge. Recently, earnings and margins have been trending upwards. When looking at the company on a valuation basis, it is attractively priced versus its own history, trading below its long-term average forward P/E and cheaper than the majority of its peers.
Baidu, a Chinese based search engine internet company has been strengthening its core online marketing business using AI and big-data technology to enhance its search, news feed and video products. Their margins are expected to improve with the sale of non-core business and focus on investment in core products. The spin-off of iQiyi, their streaming platform, in the US being a good example. In the period of market uncertainty at the end of January the share price dropped almost 20% and far more than the market, which provided us a favourable entry point to a company with a strong balance sheet, a high level of return on capital, at a reasonable valuation, with potential to grow its revenue and earnings.
We did not make any changes to the portfolio in the second quarter.
We made two changes to the portfolio in the third quarter. We sold positions in Shire and Boeing and initiated new positions in ABB and Tencent Holdings.
Shire, the biotech company who research and develop medicines for rare diseases, was bought in the fund in September 2016. We had previously owned the stock in 2013, selling after the (ultimately failed) bid for the company by Abbvie. Shire operates in a highly lucrative industry and displays strong margins as a reflection. However, having sold-off around 25% to lows in March 2018, Shire was subject to M&A speculation from larger rivals including Japanese firm Takeda, whose US$62 billion bid was still subject
59
to EU regulatory approval in November. The stock gained 44% after the bid was first proposed and with additional regulatory hurdles to still to overcome, we took the opportunity to sell.
Boeing had been a very strong holding for the portfolio, returning ~245% USD since purchase in 2014. One of the less obvious holdings in the Innovators Fund, Boeing was bought as we believed it was driving efficiencies by drastically reducing construction time on airlines and using 3D printing for some non-critical components to drive down costs. However, the valuation of the company had increased significantly which was what ultimately drove our sell decision
ABB is one of the leading manufacturers of industrial robots as well as providing electrification products and power generation solutions. We believe ABB is set to benefit from the increasing demand for industrial robots as companies strive to improve efficiencies through factory automation and should benefit from the announced splitting off of its power grid business. After selling off around 14% from record highs in January, this presented an opportunity to buy a company offering strong growth prospects and rising returns on capital at a reasonable valuation.
Tencent, the Chinese conglomerate and largest gaming company in the world has subsidiaries including: WeChat, the social media platform which boasts over 1 billion active monthly users and offers a platform for activities ranging from payment making to ordering a taxi; JD.com, China's answer to Amazon; and Tencent Music Entertainment (TME) which has four times as many users as Spotify. However, Tencent has underperformed in 2018, selling off around 35% from highs in January. This was a result of trade tariff concerns, Chinese intervention in the gaming industry and headlines surrounding their e-commerce holding JD.com. Tencent may still not appear cheap relative to the market, however, with returns on capital around 20% and growth prospects above 20% p/a, we believe the higher valuation is warranted and Tencent is set to benefit from continuous R&D in its new and existing channels.
We made no changes to the portfolio in the fourth quarter.
3. Positioning
Under the new GICS sector reclassification, effective 1st October 2018, the Telecommunication Services sector was renamed as Communication Services. As part of the changes, Comcast has been reclassified from 'Consumer Discretionary' to 'Communication Services' and Tencent, Baidu, Alphabet and Facebook have all been reclassified from 'Information Technology' to 'Communication Services'. Changes in sector exposure as a result of new positions (excluding reclassification changes) led to an increase in IT, whilst reducing our exposure to financials and healthcare.
In terms of the portfolio's geographic breakdown, the portfolio continues to have a bias to the U.S., but we reduced this over 2018, decreasing the fund's allocation by just over 6%. We increased our exposure to Asia and Europe as we increasingly find companies trading as substantial discounts to their historic valuations with attractive future growth rates.
Sector Allocation at 12/31/18 | |
Consumer Discretionary | | | 14 | % | |
Consumer Staples | | | 0 | % | |
Energy | | | 0 | % | |
Financials | | | 3 | % | |
Health Care | | | 3 | % | |
Industrials | | | 20 | % | |
Infromation Technology | | | 43 | % | |
Materials | | | 0 | % | |
Communication Services | | | 16 | % | |
Utilites | | | 0 | % | |
Real Estate | | | 0 | % | |
Cash | | | 1 | % | |
Total | | | 100 | % | |
60
4. Outlook
2018 brought uncertainty and volatility back into the markets despite companies' continuing their strong earnings growth post the financial crisis. A tightening Fed rate cycle, US-China tensions, weakness in emerging markets currencies, slowing economic growth indicators in Europe and Asia and a fall from grace of market leaders of the 2017 tech rally, were in stark contrast to the 'unified global growth' consensus of 2017 which fuelled a significant equity rally, a good proportion of which was from multiple expansion and not just earnings growth. However, after the recent market falls, global equity valuations on a sector and regional level now mostly trade at a discount to their 5 and 10-year valuations based on rolling 1-year forward P/E ratios, creating better prospects for higher future returns.
The Guinness Atkinson Global Innovators Fund seeks to invest in quality innovative companies trading at reasonable valuations. By doing so, we look to invest in companies that are experiencing faster profit growth, larger margins and are less susceptible to cyclical pressures. By taking a long-term view on markets, the recent pull back in equity markets could well provide an attractive entry point for new investments.
In summary, the four key tenets to our approach are innovation, quality, growth, and conviction. The fund has significant characteristics compared to the broad market: higher spend on intellectual property; less capital intensiveness; higher cash flow returns on investment; net cash; with higher growth prospects and is now trading at a 5% discount to the benchmark in terms of valuation. Historically, the fund has traded at 10-20% premium to the benchmark and as such we see the fund as providing good value today.
| | | Fund | | MSCI World
Index | |
Innovation | |
R&D / Sales | | | 8 | % | | | 6 | % | |
CAPEX / Sales | | | 6 | % | | | 10 | % | |
Quality | |
| CFROI (median 2018) | | | 16 | % | | | 8 | % | |
Weighted average net debt / equity | | | -10 | % | | | 67 | % | |
Growth (& valuation) | |
Trailing 3-year sales growth (annualised) | | | 14 | % | | | 6 | % | |
Estimated earnings growth (2020 vs 2019) | | | 13 | % | | | 8 | % | |
FCF (free cash flow) yield | | | 6 | % | | | 5 | % | |
PE (2019e) | | | 13.6 | | | | 14.3 | | |
Conviction | |
Number of stocks | | | 30 | | | | 1652 | | |
Active share | | | 95 | % | | | — | | |
As of December 31, 2018, the Subsidized 30-day SEC Yield was 0.87% and the Unsubsidized 30-day SEC Yield was 0.67%.
May we wish you a happy and prosperous New Year, and we look forward to updating you on the progress of the fund over the course of 2019.

| | 
| | | |
Ian Mortimer | | Matthew Page | | January 2019 | |
61
The Fund invests in foreign securities, which involve political, economic and currency risks, greater volatility, and differences in accounting methods. These risks are greater for emerging markets. The Fund is non-diversified, meaning that its assets may be invested in fewer individual holdings than diversified funds. Therefore, the Fund is more exposed to individual stock volatility than diversified funds. The Fund invests in smaller companies, which involve additional risks such as limited liquidity and greater volatility.
The approach of the Fund is not to provide access to the most innovative companies in the world but rather to look at companies using the 'prism' of innovation to highlight those we think might be winners in the future – and then only buy them if they are offering reasonable value compared to those future expectations. We are firm believers that innovative companies can outperform in the future and that a value discipline to stock selection will add meaningfully to that performance.
The MSCI World Index (Net Return) is a free float-adjusted market capitalization weighted index that is designed to measure the equity market performance of developed markets. Net Return reflects deduction for withholding tax but reflects no deduction for fees and expenses. Net Return is net of local withholding taxes that any investor would pay. The NASDAQ Composite Index is a market capitalization-weighted index that is designed to represent the performance of the National Market System, which includes over 5,000 stocks traded only over-the-counter and not on an exchange. These indices are unmanaged and are not available for investment, and do not incur expenses.
PER or P/E – Price to Earnings ratio is calculated by dividing current price of the stock by the company's trailing months' earnings per share.
Active share measures the extent of active management in a portfolio compared to the corresponding benchmark listed.
A cash flow return on investment (CFROI) is a valuation metric that acts as a proxy for a company's economic return.
Capital Expenditure (CAPEX) is an amount spent to acquire or upgrade productive assets (such as buildings, machinery and equipment, vehicles) in order to increase the capacity or efficiency of a company for more than one accounting period.
Cash flow measures the cash generating capability of a company by adding non-cash charges (e.g. depreciation) and interest expense to pretax income.
Earnings growth is not representative of the Fund's future performance.
Subsidized 30-Day SEC Yield is based on a 30-day period ending on the last day of the previous month and is computed by dividing the net investment income per share earned during the period by the maximum offering price per share on the last day of the period. The subsidized yield is based on the net expenses of the Fund. The yield would be lower without the waivers in effect. Unsubsidized 30 Day SEC Yield is based on total expenses of the Fund. One cannot invest directly in an index.
Please refer to the Schedule of Investments for details on Fund holdings. Current and future portfolio holdings are subject to risk.
The information provided herein represents the opinion of Guinness Atkinson Asset Management, Inc. for the period stated and is not intended to be a forecast of future events, a guarantee of future results, or investment advice. Opinions, Fund holdings and sector allocations are subject to change at any time, and are not recommendations to buy or sell any security.
62
Growth of $10,000
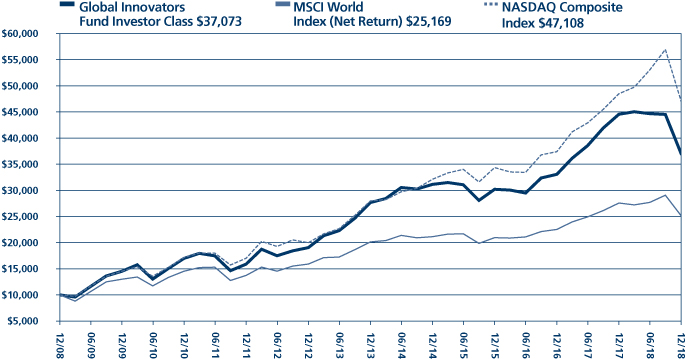
| | Average Annual Total Return
Periods Ended December 31, 2018 | |
| | One Year | | Five Years | | Ten Years | |
| Investor Class | | | -16.80 | % | | | 6.03 | % | | | 14.00 | % | |
| Institutional Class1 | | | -16.59 | % | | | 6.19 | % | | | 14.09 | % | |
Performance data quoted represents past performance and does not guarantee future results. The investment return and principal value of an investment will fluctuate so that an investor's shares, when redeemed, may be worth more or less than their original cost. Current performance of the Fund may be lower or higher than the performance quoted. Performance data current to the most recent month end may be obtained by visiting www.gafunds.com.
The performance graph above is shown for the Fund's Investor Class shares; Institutional Class shares performance may vary.
Total returns for certain periods reflect a fee waiver in effect and in the absence of this waiver, the total returns would be lower. Returns reflect the reinvestment of distributions made by the Fund, if any. The graph and the performance table above do not reflect the deduction of taxes that a shareholder would pay on Fund distribution or the redemption of Fund shares.
The MSCI World Index (Net Return) is a free float-adjusted market capitalization weighted index that is designed to measure the equity market performance of developed markets. Net Return reflects deduction for withholding tax but reflects no deduction for fees and expenses. Net Return is net of local withholding taxes that any investor would pay. The NASDAQ Composite Index is a market capitalization weighted index that is designed to represent the performance of the National Market System which includes over 5,000 stocks traded only over-the-counter and not on an exchange. The indices referenced in this chart are not available for investment and do not incur expenses.
1 Performance information for the Institutional Class, prior to commencement of operations on December 31, 2015, is based on the performance of Investor Class, and adjusted for the lower expenses applicable to Institutional Class
63
FUND HIGHLIGHTS at December 31, 2018
GUINNESS ATKINSON GLOBAL INNOVATORS FUND
# of Holdings in Portfolio: | | 31 | |
Portfolio Turnover: | | 28.9% | |
% of Stocks in Top 10: | | 34.9% | |
Fund Managers: | | | |
Matthew Page | | | |
Dr. Ian Mortimer | | | |
Top 10 Holdings (% of net assets) | | | | | | | |
NIKE Inc. | | | 3.7 | % | | Eaton Corp. PLC | | | 3.5 | % | |
Danaher Corp. | | | 3.6 | % | | Schneider Electric SE | | | 3.4 | % | |
SAP SE | | | 3.5 | % | | ANTA Sports Products Ltd. | | | 3.4 | % | |
Alphabet Inc. - A Shares | | | 3.5 | % | | Check Point Software Technologies Ltd. | | | 3.4 | % | |
Tecent Holdings Ltd. | | | 3.5 | % | | Intercontinental Exchange Inc. | | | 3.4 | % | |
Industry Breakdown (% of net assets) | | | | | | | |
Diversified Manufacturing Operations | | | 10.3 | % | | Finance - Other Services | | | 3.4 | % | |
Electronic Components - Semiconductor | | | 9.6 | % | | Commercial Services | | | 3.3 | % | |
Semiconductor | | | 9.6 | % | | Rubber - Tires | | | 3.3 | % | |
Machinery | | | 6.6 | % | | Computers | | | 3.3 | % | |
Web Portals | | | 6.6 | % | | Networking Products | | | 3.3 | % | |
Athletic Footwear | | | 3.7 | % | | Cable/Satellite TV | | | 3.3 | % | |
Enterprise Software/Services | | | 3.5 | % | | Schools | | | 3.3 | % | |
Internet Application Software | | | 3.5 | % | | Industrial Automation/Robot | | | 3.2 | % | |
Power Conversion/Supply Equipment | | | 3.4 | % | | Internet Content | | | 3.1 | % | |
Retail - Apparel | | | 3.4 | % | | Electronic Component - Miscellaneous | | | 3.1 | % | |
Applications Software | | | 3.4 | % | | Metal Processors & Fabricators | | | 3.0 | % | |
64
SCHEDULE OF INVESTMENTS
at December 31, 2018
GUINNESS ATKINSON GLOBAL INNOVATORS FUND
Shares | | COMMON STOCKS: 99.2% | | Value | |
Application Software: 3.4% | | | |
| | 54,670 | | | Check Point Software Technologies Ltd.* | | $ | 5,611,875 | | |
Athletic Footwear: 3.7% | | | |
| | 81,390 | | | NIKE Inc. | | | 6,034,255 | | |
Cable/Satellite TV: 3.3% | | | |
| | 159,170 | | | Comcast Corp. - Class A | | | 5,419,738 | | |
Commercial Services: 3.3% | | | |
| | 65,200 | | | PayPal Holdings, Inc.* | | | 5,482,668 | | |
Computers: 3.3% | | | |
| | 85,880 | | | Cognizant Technology Solutions Corp. - A Shares | | | 5,451,662 | | |
Diversified Manufacturing Operations: 10.3% | | | |
| | 56,810 | | | Danaher Corp. | | | 5,858,247 | | |
| | 82,850 | | | Eaton Corp. PLC | | | 5,688,481 | | |
| | 48,360 | | | Siemens AG | | | 5,412,070 | | |
| | | | | | | | 16,958,798 | | |
Electronic Components — Miscellaneous: 3.1% | | | |
| | 866,000 | | | AAC Technologies Holdings Inc. | | | 5,018,378 | | |
Electronic Components — Semiconductor: 9.6% | | | |
| | 262,000 | | | Infineon Technologies AG | | | 5,245,898 | | |
| | 37,965 | | | NVIDIA Corp. | | | 5,068,327 | | |
| | 6,320 | | | Samsung Electronics Co., Ltd. - GDR | | | 5,506,602 | | |
| | | | | | | | 15,820,827 | | |
Enterprise Software/Services: 3.5% | | | |
| | 58,180 | | | SAP SE | | | 5,824,888 | | |
Finance — Other Services: 3.4% | | | |
| | 74,420 | | | Intercontinental Exchange, Inc. | | | 5,606,059 | | |
Industrial Automation/Robot: 3.2% | | | |
| | 35,300 | | | FANUC Corp. | | | 5,342,263 | | |
Internet Application Software: 3.5% | | | |
| | 143,400 | | | Tencent Holdings Ltd. | | | 5,739,750 | | |
| | 37 | | | Tencent Music Entertainment Group | | | 486 | | |
| | | | | | | | 5,740,236 | | |
Internet Content: 3.1% | | | |
| | 38,890 | | | Facebook Inc.* | | | 5,098,090 | | |
Machinery: 6.6% | | | |
| | 282,800 | | | ABB Ltd. | | | 5,404,922 | | |
| | 20,650 | | | Roper Industries, Inc. | | | 5,503,638 | | |
| | | | | | | | 10,908,560 | | |
The accompanying notes are an integral part of these financial statements.
65
Shares | | COMMON STOCKS: 99.2% (Continued) | | Value | |
Metal Processors & Fabricators: 3.0% | | | |
| | 684,000 | | | Catcher Technology Co., Ltd. | | $ | 5,000,457 | | |
Networking Products: 3.3% | | | |
| | 125,295 | | | Cisco Systems Inc. | | | 5,429,032 | | |
Power Conversion/Supply Equipment: 3.4% | | | |
| | 82,610 | | | Schneider Electric SE | | | 5,675,948 | | |
Retail — Apparel: 3.4% | | | |
| | 1,176,000 | | | ANTA Sports Products Ltd. | | | 5,654,757 | | |
Rubber — Tires: 3.3% | | | |
| | 39,250 | | | Continental AG | | | 5,467,013 | | |
Schools: 3.3% | | | |
| | 98,440 | | | New Oriental Education & Technology Group Inc. - ADR | | | 5,395,496 | | |
Semiconductor: 9.6% | | | |
| | 163,550 | | | Applied Materials Inc. | | | 5,354,627 | | |
| | 61,550 | | | KLA-Tencor Corp. | | | 5,508,110 | | |
| | 35,800 | | | Lam Research Corp. | | | 4,874,886 | | |
| | | | | | | | 15,737,623 | | |
Web Portals: 6.6% | | | |
| | 5,570 | | | Alphabet Inc. - A Shares* | | | 5,820,427 | | |
| | 32,000 | | | Baidu Inc.* | | | 5,075,200 | | |
| | | | | | | | 10,895,627 | | |
| | | | | Total Common Stocks
(cost $148,118,849) | | | 163,574,250 | | |
| | | | | Total Investments in Securities
(cost $148,118,849): 99.2% | | | 163,574,250 | | |
| | | | | Other Assets less Liabilities: 0.8% | | | 1,264,223 | | |
| | | | | Net Assets: 100.0% | | $ | 164,838,473 | | |
* Non-income producing security.
ADR - American Depository Receipt
GDR - Global Depository Receipt
PLC - Public Limited Company
The accompanying notes are an integral part of these financial statements.
66
GUINNESS ATKINSON RENMINBI YUAN & BOND FUND
1. Performance
AVERAGE ANNUAL TOTAL RETURN
| | | 1 Year | | 3 Years | | 5 Years | | Since
Inception
(06/30/11) | |
Fund | | | -2.12 | % | | | 1.21 | % | | | -0.29 | % | | | 1.02 | % | |
Benchmark Indices: | |
Hang Seng Markit iBoxx Offshore RMB Overall Index | | | -0.52 | % | | | 2.64 | % | | | 1.37 | % | | | 2.38 | % | |
RMB Cash Offshore (CNH)* | | | -5.19 | % | | | -1.48 | % | | | -2.49 | % | | | -0.81 | % | |
RMB Cash Onshore (CNY)* | | | -5.40 | % | | | -1.90 | % | | | -2.52 | % | | | -0.83 | % | |
*Net change in exchange rate versus U.S. dollar.
For the Fund's current one-year expense ratios, please refer to the Financial Highlights section of this report.
Performance data quoted represents past performance and does not guarantee future results. The investment return and principal value of an investment will fluctuate so that an investor's shares, when redeemed, may be worth more or less than their original cost. Current performance of the Fund may be lower or higher than the performance quoted. Performance data current to the most recent month-end may be obtained by visiting www.gafunds.com, or calling (800) 915-6565.
The Fund fell 2.12% in 2018. The Offshore Renminbi weakened 5.40% against the dollar while offshore renminbi (RMB) bonds, as measured by the Hang Seng Markit iBoxx Offshore RMB Overall Index, fell 0.52%
As is usual in the offshore bond market, the bulk of returns during the year were attributable to coupons and capital growth was modest. In USD terms the capital value of bonds, based on the Hang Seng Markit iBoxx Offshore RMB Price Return Index, was -4.43% for the year. The return from coupon payments was 3.91% for the year. Against an increasingly uncertain economic backdrop, it was the higher quality investment grade bonds which did better.
There were 226 new bonds issued during the year totaling RMB 113 bn which compared to 108 bonds issued in 2017 with a value of RMB42 bn. Bank issuers continued to dominate with foreign banks, from Australia, Korea and the Middle East especially, taking the lion's share. Outside of that sector it was notable that BMW and Daimler both issued twice during the year. An interesting development was the issuance of RMB 20bn by the People's Bank of China (PBoC) in November. They issued two notes, of 3-month and 1-year maturities to assist with managing the supply of renminbi in the offshore market. In recent months the USDCNH (US Dollar/Chinese Yuan) exchange rate has set the tone for the onshore USDCNY and to some extent, the movements in the former have been magnified by the more limited supply of CNH making the PBoC's job more difficult.
The RMB sovereign bond market yield curve has changed significantly since this fund was launched. Offshore sovereign bonds now trade in a yield range of 3.4%-4.07% from maturities of 1 year to 30 years and are cheaper than their onshore equivalents with a yield premium of 0.4%-0.8%. The yield to maturity (YTM) of the whole market at the end of 2018 was 4.21%, down from 4.46% at the end of September. Investment grade (those with a credit rating by Standard and Poor's of at least BBB- or equivalent) YTM was 3.97% and high yield YTM was 5.19%.
In 2018 the offshore renminbi (CNH) exchange rate ranged from RMB 6.9752 – 6.2540: US$1. We believe that China's central bank (PBoC), regards RMB7.000:US1 as level beyond which it cannot go for the present without triggering a turn in sentiment that would trigger renewed capital outflows. The bottom of the range was hit in October but the rate moved into 'safer' territory by the end of the year to close at RMB6.8706. We did not see signs of direct intervention, for example in the form of central bank buying. However, we noted that the concept of a countercyclical adjustment factor was re-introduced to reference rate setting mechanism and as discussed above, the PBoC increased its presence in the offshore market. Despite the opacity of central bank operations and currency management we believe the exchange rate has been allowed to find its level with intervention at lower levels designed to head off domestic outflows and international (US) criticism.
2. Portfolio Position
At the end of the year the Fund was 108.5% invested in bonds having ended the year with an overdraft of 8.5%. This was covered in the New Year. The bond portfolio was 88% invested bonds that carry a credit rating from either Standard & Poor's or Moody's
67
RENMINBI YUAN & BOND FUND
that is considered to be 'Investment grade' (compared to 80% of the broader market) and the average credit rating of the portfolio is calculated to be between BBB and A (based on the Standard & Poor's rating system). Over 60% of the portfolio is invested in bonds from financial sector issuers which compares with a market weight of 58%. The portfolio had a YTM of 4.97% at the end of December with investment grade YTM (88% of the portfolio) at 4.83% and high yield at 5.98%. As of December 31, 2018, the Subsidized 30-day SEC Yield was 3.98% and the Unsubsidized 30-day SEC Yield was 3.60%.
3. Outlook and Strategy
We expect the coming year to be similar to the one just gone because the issues China faces have not changed. The only difference are the conditions which make them easier/harder to manage. In 2015, there were heightened concerns about Chinese debt and debt servicing capacity; in 2016-18 these were mitigated by improved profitability and cash flows in the state (SOE) sector which improved their debt servicing capacity. Now the economy is slowing, as is SOE profitability, and so we expected concerns to rise again. These in turn will be, and are being, met by policy support.
At the same time the deleveraging program is likely to continue, but at a slower pace. The process exerts a growth drag and at a time when a cyclical recovery is now moderating, we expect policy adjustments. The dispute with the US remains a wild card. Clearly, the effects are now biting in China and, to a lesser extent, the US. We think that there is growing pressure on both Xi and Trump to compromise: China's economy is slowing faster than Xi would like and Trump appears worried that the US economy will slow just at the time he seeks re-election. The outcome is by no means certain, but we have at least seen more progress since December 2018 than was evident in the previous six months.

Edmund Harriss
The Fund invests in foreign securities, which involve political, economic and currency risks, greater volatility, and differences in accounting methods. These risks are greater for emerging markets. The Fund is non-diversified, meaning that its assets may be concentrated in fewer individual holdings than diversified funds. Therefore, the Fund is more exposed to individual stock volatility than diversified funds. The Fund invests in smaller companies, which involve additional risks such as limited liquidity and greater volatility. Investments in debt securities typically decrease in value when interest rates rise, which can be greater for longer-term debt securities. The Fund may invest in derivatives, which involves risks different from, and in certain cases, greater than the risks presented by traditional investments. Investments focused in a single geographic region may be exposed to greater risk than investments diversified among various geographic regions.
The Hang Seng Markit iBoxx Offshore RMB Bond Index family ("HSM iBoxx") is designed to track the performance of the offshore RMB bond market. This index is unmanaged and not available for investment, and does not incur expenses.
The RMB Cash Offshore (CNH) is the currency code for renminbi traded outside China in the offshore market.
The RMB Cash Onshore (CNY) is the international currency code for the renminbi.
The credit ratings reflect Standard and Poor's opinion as to the quality of the underlying securities in the Fund's portfolio and not that of the Fund itself. Quality ratings are subject to change. Standard and Poor's assigns a rating of AAA as the highest to D as the lowest credit quality rating. Investment Grade Bonds are typically those that are rated between AAA and BBB- by S&P.
Subsidized 30-Day SEC Yield is based on a 30-day period ending on the last day of the previous month and is computed by dividing the net investment income per share earned during the period by the maximum offering price per share on the last day of the period. The subsidized yield is based on the net expenses of the Fund. The yield would be lower without the waivers in effect. Unsubsidized 30 Day SEC Yield is based on total expenses of the Fund. One cannot invest directly in an index.
Please refer to the Schedule of Investments for details on Fund holdings. Current and future portfolio holdings are subject to risk.
The information provided herein represents the opinion of Guinness Atkinson Asset Management, Inc. for the period stated and is not intended to be a forecast of future events, a guarantee of future results, or investment advice. Opinions, Fund holdings and sector allocations are subject to change at any time, and are not recommendations to buy or sell any security.
68
RENMINBI YUAN & BOND FUND
Growth of $10,000
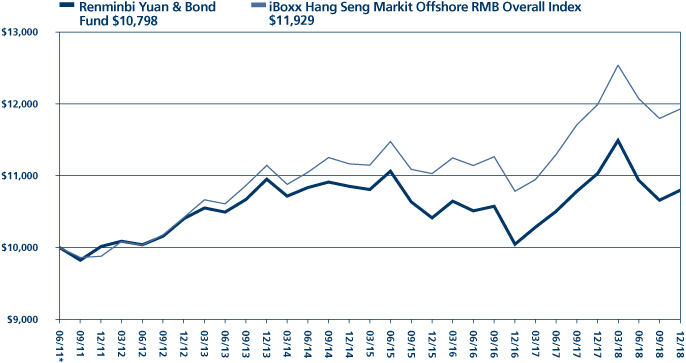
Average Annual Total Return
Periods Ended December 31, 2018
| One Year | | Five Years | | Since Inception
(06/30/11) | |
| | -2.12 | % | | | -0.29 | % | | | 1.02 | % | |
*Inception date 6/30/11.
Performance data quoted represents past performance and does not guarantee future results. The investment return and principal value of an investment will fluctuate so that an investor's shares, when redeemed, may be worth more or less than their original cost. Current performance of the Fund may be lower or higher than the performance quoted. Performance data current to the most recent month end may be obtained by visiting www.gafunds.com.
Total returns for certain periods reflect a fee waiver in effect and in the absence of this waiver, the total returns would be lower. Returns reflect the reinvestment of distributions made by the Fund, if any. The graph and the performance table above do not reflect the deduction of taxes that a shareholder would pay on Fund distribution or the redemption of Fund shares. The Fund imposes a 2% redemption fee on shares held less than 30 days.
The iBoxx Hang Seng Markit Offshore RMB Overall Index ("HSM iBoxx") captures the performance of debt denominated in Chinese yuan but issued and settled offshore. The index family offers a broad coverage of the offshore RMB bond universe.
69
FUND HIGHLIGHTS at December 31, 2018
GUINNESS ATKINSON RENMINBI YUAN & BOND FUND
# of Holdings in Portfolio: | | 17 | |
Portfolio Turnover: | | 34.9% | |
% of Investments in Top 10: | | 67.2% | |
Fund Manager: | | | |
Edmund Harriss | |
Top 10 Holdings (% of net assets) | | | | | | | |
Long Profit Group Ltd. Via Ocean Wealth II Ltd.,
6.500%, 02/27/20 | | | 6.8 | % | | BMW Finance NV, 4.250%, 10/18/20 | | | 6.7 | % | |
Daimler International Finance BV, 4.800%, 04/09/21 | | | 6.8 | % | | Australia & New Zealand Banking Group Ltd.,
Callable Bond, 4.750%, 01/30/25 | | | 6.7 | % | |
Commonwealth Bank of Australia, Callable Bond,
5.150%, 03/11/25 | | | 6.7 | % | | The Korea Development Bank, 4.500%, 11/10/20 | | | 6.7 | % | |
Commonwealth Bank of Australia, 4.200%, 10/26/20 | | | 6.7 | % | | Franshion Brilliant Ltd., 5.200%, 03/08/21 | | | 6.7 | % | |
Arab Petroleum Investments Corp, 4.700%, 03/13/21 | | | 6.7 | % | | BP Capital Markets PLC, 3.650%, 02/28/19 | | | 6.7 | % | |
Industry Breakdown (% of net assets) | | | | | | | |
Supranational Banks | | | 21.4 | % | | Oil Company - Integrated | | | 6.7 | % | |
Commercial Banks Non-US | | | 20.2 | % | | Finance - Leasing Company | | | 6.6 | % | |
Real Estate Operator/Developer | | | 20.2 | % | | Computers | | | 6.6 | % | |
Auto-Cars/Light Trucks | | | 13.5 | % | | Export/Import Bank | | | 6.6 | % | |
Special Purpose Banks | | | 6.7 | % | | | | | |
70
SCHEDULE OF INVESTMENTS
at December 31, 2018
GUINNESS ATKINSON RENMINBI YUAN & BOND FUND
Principal Amount (CNH) | | CORPORATE BONDS: 108.5% | | Value | |
Auto-Cars/Light Trucks: 13.5% | | | |
| | 1,000,000 | | | BMW Finance NV, 4.250%, 10/18/20 | | $ | 146,112 | | |
| | 1,000,000 | | | Daimler International Finance BV, 4.800%, 04/09/21 | | | 147,109 | | |
| | | | | | | | 293,221 | | |
Commercial Banks Non-US: 20.2% | | | |
| | 1,000,000 | | | Australia & New Zealand Banking Group Ltd., Callable Bond, 4.750%, 01/30/25 | | | 146,022 | | |
| | 1,000,000 | | | Commonwealth Bank of Australia, 4.200%, 10/26/20 | | | 146,370 | | |
| | 1,000,000 | | | Commonwealth Bank of Australia, Callable Bond, 5.150%, 03/11/25 | | | 146,464 | | |
| | | | | | | | 438,856 | | |
Computers: 6.6% | | | |
| | 1,000,000 | | | Lenovo Group Ltd., 4.950%, 06/10/20 | | | 145,149 | | |
Export/Import Bank: 6.6% | | | |
| | 1,000,000 | | | Export-Import Bank of Korea, 4.500%, 01/27/24 | | | 144,686 | | |
Finance – Leasing Company: 6.6% | | | |
| | 1,000,000 | | | Far East Horizon Ltd., 4.900%, 02/27/21 | | | 145,307 | | |
Oil Company – Integrated: 6.7% | | | |
| | 1,000,000 | | | BP Capital Markets PLC, 3.650%, 02/28/19 | | | 145,466 | | |
Real Estate Operator/Developer: 20.2% | | | |
| | 1,000,000 | | | Franshion Brilliant Ltd., 5.200%, 03/08/21 | | | 145,656 | | |
| | 1,000,000 | | | Long Profit Group Ltd. Via Ocean Wealth II Ltd., 6.500%, 02/27/20 | | | 148,533 | | |
| | 1,000,000 | | | Shui On Development Holding Ltd., 6.880%, 03/02/21 | | | 144,555 | | |
| | | | | | | | 438,744 | | |
Special Purpose Banks: 6.7% | | | |
| | 1,000,000 | | | The Korea Development Bank, 4.500%, 11/10/20 | | | 145,767 | | |
Supranational Banks: 21.4% | | | |
| | 1,000,000 | | | Arab Petroleum Investments Corp, 4.700%, 03/13/21 | | | 146,205 | | |
| | 500,000 | | | Asian Development Bank, 2.850%, 10/21/20 | | | 71,707 | | |
| | 1,000,000 | | | Central American Bank for Economic Integration, 4.200%, 09/21/21 | | | 144,945 | | |
| | 710,000 | | | International Finance Corp., 3.100%, 09/24/19 | | | 102,791 | | |
| | | | | | | | 465,648 | | |
| | | | | Total Corporate Bonds
(cost $2,547,921) | | | 2,362,844 | | |
| | | | | Total Investments in Securities
(cost $2,547,921): 108.5% | | | 2,362,844 | | |
| | | | | Liabilities in Excess of Other Assets: (8.5%) | | | (185,522 | ) | |
| | | | | Net Assets: 100.0% | | $ | 2,177,322 | | |
The accompanying notes are an integral part of these financial statements.
71
STATEMENTS OF ASSETS AND LIABILITIES
at December 31, 2018
| | | Alternative
Energy
Fund | | Asia
Focus
Fund | | Asia Pacific
Dividend
Builder
Fund | | China &
Hong Kong
Fund | |
Assets | |
Investments in securities, at cost | | $ | 11,310,533 | | | $ | 12,293,583 | | | $ | 4,399,992 | | | $ | 48,131,590 | | |
Investments in securities, at value | | $ | 7,773,855 | | | $ | 14,784,094 | | | $ | 4,066,424 | | | $ | 55,663,292 | | |
Cash | | | — | | | | 418,712 | | | | 156,241 | | | | 1,297,204 | | |
Cash denominated in foreign currency (cost of $8,145, $0, $3,771 and
$25,691, respectively) | | | 8,155 | | | | — | | | | 3,785 | | | | 25,702 | | |
Receivables: | |
Securities sold | | | 232,471 | | | | — | | | | — | | | | — | | |
Fund shares sold | | | 2,171 | | | | — | | | | 220 | | | | 100 | | |
Dividends and interest | | | 2,211 | | | | — | | | | — | | | | — | | |
Tax reclaim | | | 6,265 | | | | — | | | | — | | | | — | | |
Due from Advisor, net | | | — | | | | — | | | | 4,158 | | | | — | | |
Prepaid expenses | | | 3,495 | | | | 4,927 | | | | 2,896 | | | | 12,459 | | |
Total assets | | | 8,028,623 | | | | 15,207,733 | | | | 4,233,724 | | | | 56,998,757 | | |
Liabilities | |
Overdraft due to custodian bank | | | 2,721 | | | | — | | | | — | | | | — | | |
Payable for Fund shares redeemed | | | 39,980 | | | | — | | | | — | | | | 113,191 | | |
Due to Advisor, net | | | 5,677 | | | | 20,341 | | | | — | | | | 50,419 | | |
Accrued administration fees | | | 1,334 | | | | 1,571 | | | | 839 | | | | 3,139 | | |
Accrued shareholder servicing plan fees | | | 1,913 | | | | 2,779 | | | | 1,598 | | | | 7,109 | | |
Deferred trustees' compensation | | | 48,716 | | | | 73,679 | | | | 37,401 | | | | 146,294 | | |
Other accrued expenses | | | 40,706 | | | | 50,871 | | | | 33,319 | | | | 64,124 | | |
Total liabilities | | | 141,047 | | | | 149,241 | | | | 73,157 | | | | 384,276 | | |
Net Assets | | $ | 7,887,576 | | | $ | 15,058,492 | | | $ | 4,160,567 | | | $ | 56,614,481 | | |
Composition of Net Assets | |
Paid-in capital | | $ | 48,203,317 | | | $ | 11,882,549 | | | $ | 4,755,709 | | | $ | 48,857,864 | | |
Total distributed earnings (loss) | | | (40,315,741 | ) | | | 3,175,943 | | | | (595,142 | ) | | | 7,756,617 | | |
Net Assets | | $ | 7,887,576 | | | $ | 15,058,492 | | | $ | 4,160,567 | | | $ | 56,614,481 | | |
Number of shares issued and outstanding (unlimited shares authorized,
no par value) | | | 3,091,426 | | | | 908,219 | | | | 292,496 | | | | 2,992,474 | | |
Net asset value per share | | $ | 2.55 | | | $ | 16.58 | | | $ | 14.22 | | | $ | 18.92 | | |
The accompanying notes are an integral part of these financial statements.
72
STATEMENTS OF ASSETS AND LIABILITIES
at December 31, 2018
| | | Dividend
Builder
Fund | | Global
Energy
Fund | | Global
Innovators
Fund | | Renminbi
Yuan & Bond
Fund | |
Assets | |
Investments in securities, at cost | | $ | 7,699,733 | | | $ | 27,134,678 | | | $ | 148,118,849 | | | $ | 2,547,921 | | |
Investments in securities, at value | | $ | 8,446,527 | | | $ | 19,463,748 | | | $ | 163,574,250 | | | $ | 2,362,844 | | |
Cash | | | 2,034 | | | | 174,214 | | | | 2,101,243 | | | | — | | |
Cash denominated in foreign currency (cost of $5,707, $0, $0 and
$0, respectively) | | | 5,707 | | | | — | | | | — | | | | — | | |
Receivables: | |
Fund shares sold | | | 83,603 | | | | 35,751 | | | | 53,381 | | | | — | | |
Dividends and interest | | | 18,690 | | | | 37,235 | | | | 57,238 | | | | 38,253 | | |
Tax reclaim | | | 6,969 | | | | 59,608 | | | | — | | | | — | | |
Due from Advisor, net | | | 9,829 | | | | — | | | | — | | | | 61 | | |
Prepaid expenses | | | 2,971 | | | | 7,512 | | | | 37,359 | | | | 5,313 | | |
Total assets | | | 8,576,330 | | | | 19,778,068 | | | | 165,823,471 | | | | 2,406,471 | | |
Liabilities | |
Overdraft due to custodian bank | | | — | | | | — | | | | — | | | | 168,205 | | |
Payable for Fund shares redeemed | | | 64,965 | | | | 72,623 | | | | 617,233 | | | | — | | |
Due to Advisor, net | | | — | | | | 11,965 | | | | 78,823 | | | | — | | |
Accrued administration fees | | | 741 | | | | 1,666 | | | | 9,093 | | | | 712 | | |
Accrued shareholder servicing plan fees | | | 2,389 | | | | 5,786 | | | | 34,936 | | | | 799 | | |
Deferred trustees' compensation | | | 24,170 | | | | 75,073 | | | | 148,884 | | | | 37,833 | | |
Other accrued expenses | | | 26,861 | | | | 58,013 | | | | 96,029 | | | | 21,600 | | |
Total liabilities | | | 119,126 | | | | 225,126 | | | | 984,998 | | | | 229,149 | | |
Net Assets | | $ | 8,457,204 | | | $ | 19,552,942 | | | $ | 164,838,473 | | | $ | 2,177,322 | | |
Composition of Net Assets | |
Paid-in capital | | $ | 7,738,226 | | | $ | 49,261,746 | | | $ | 147,883,799 | | | $ | 6,671,309 | | |
Total distributed earnings (loss) | | | 718,978 | | | | (29,708,804 | ) | | | 16,954,674 | | | | (4,493,987 | ) | |
Net Assets | | $ | 8,457,204 | | | $ | 19,552,942 | | | $ | 164,838,473 | | | $ | 2,177,322 | | |
Number of shares issued and outstanding (unlimited shares authorized,
no par value) | | | 500,102 | | | | 1,078,338 | | | | — | | | | 193,596 | | |
Net asset value per share | | $ | 16.91 | | | $ | 18.13 | | | | — | | | $ | 11.25 | | |
Net asset value per share per Class: | |
Investor Class shares: | |
Net assets applicable to shares outstanding | | | | | | $ | 131,227,872 | | | | | | |
Shares of beneficial interest issued and outstanding | | | | | | | 3,761,383 | | | | |
Net asset value per share | | | — | | | | — | | | $ | 34.89 | | | | — | | |
Institutional Class shares: | |
Net assets applicable to shares outstanding | | | | | | $ | 33,610,601 | | | | | | |
Shares of beneficial interest issued and outstanding | | | | | | | 960,693 | | | | |
Net asset value per share | | | — | | | | — | | | $ | 34.99 | | | | — | | |
The accompanying notes are an integral part of these financial statements.
73
STATEMENTS OF OPERATIONS
For the year ended December 31, 2018
| | | Alternative
Energy
Fund | | Asia
Focus
Fund | | Asia Pacific
Dividend
Builder
Fund | | China &
Hong Kong
Fund | |
Investment Income | |
Dividends* | | $ | 172,861 | | | $ | 575,183 | | | $ | 236,863 | | | $ | 1,955,132 | | |
Other Income | | | 46,405 | | | | 17,811 | | | | 8,908 | | | | 47,087 | | |
Total income | | | 219,266 | | | | 592,994 | | | | 245,771 | | | | 2,002,219 | | |
Expenses | |
Advisory fees | | | 102,153 | | | | 188,835 | | | | 59,209 | | | | 712,739 | | |
Shareholder servicing plan fees | | | 20,462 | | | | 26,437 | | | | 12,026 | | | | 87,029 | | |
Transfer agent fees and expenses | | | 28,760 | | | | 27,511 | | | | 16,583 | | | | 56,808 | | |
Fund accounting fee and expenses | | | 30,682 | | | | 36,678 | | | | 30,547 | | | | 59,230 | | |
Administration fees | | | 4,894 | | | | 9,032 | | | | 2,849 | | | | 32,655 | | |
Custody fees and expenses | | | 8,447 | | | | 17,851 | | | | 16,903 | | | | 21,196 | | |
Audit fees | | | 18,002 | | | | 24,499 | | | | 11,998 | | | | 24,499 | | |
Legal fees | | | 7,593 | | | | 14,211 | | | | 4,101 | | | | 57,483 | | |
Registration fees | | | 18,009 | | | | 17,291 | | | | 18,627 | | | | 22,373 | | |
Printing | | | 8,758 | | | | 6,959 | | | | 3,393 | | | | 10,293 | | |
Trustees' fees and expenses | | | 3,559 | | | | (5,027 | ) | | | 5,922 | | | | (16,845 | ) | |
Insurance | | | 887 | | | | 1,661 | | | | 644 | | | | 6,364 | | |
CCO fees and expenses | | | 7,448 | | | | 8,604 | | | | 6,927 | | | | 16,672 | | |
Miscellaneous | | | 2,582 | | | | 3,370 | | | | 2,654 | | | | 5,051 | | |
Interest expense | | | 515 | | | | 1,033 | | | | 1,092 | | | | 3,203 | | |
Total expenses | | | 262,751 | | | | 378,945 | | | | 193,475 | | | | 1,098,750 | | |
Less: fees waived and expenses absorbed | | | (60,122 | ) | | | (4,300 | ) | | | (127,356 | ) | | | — | | |
Net expenses | | | 202,629 | | | | 374,645 | | | | 66,119 | | | | 1,098,750 | | |
Net investment income | | | 16,637 | | | | 218,349 | | | | 179,652 | | | | 903,469 | | |
Realized and unrealized gain (loss) on investments and foreign currency | |
Net realized gain (loss) on: | |
Investments | | | (166,040 | ) | | | 1,692,996 | | | | 734,404 | | | | 5,351,589 | | |
Foreign currency | | | (2,397 | ) | | | (8,330 | ) | | | (2,267 | ) | | | (490 | ) | |
| | | | (168,437 | ) | | | 1,684,666 | | | | 732,137 | | | | 5,351,099 | | |
Net change in unrealized appreciation (depreciation) on: | |
Investments | | | (1,443,250 | ) | | | (5,948,574 | ) | | | (1,878,875 | ) | | | (20,996,479 | ) | |
Foreign currency | | | (698 | ) | | | (141 | ) | | | 18 | | | | 67 | | |
| | | | (1,443,948 | ) | | | (5,948,715 | ) | | | (1,878,857 | ) | | | (20,996,412 | ) | |
Net realized and unrealized loss on investments and foreign currency | | | (1,612,385 | ) | | | (4,264,049 | ) | | | (1,146,720 | ) | | | (15,645,313 | ) | |
Net decrease in Net Assets from Operations | | $ | (1,595,748 | ) | | $ | (4,045,700 | ) | | $ | (967,068 | ) | | $ | (14,741,844 | ) | |
* Net of foreign tax withheld of $9,804, $62,328, $19,580, and $79,621, respectively.
The accompanying notes are an integral part of these financial statements.
74
STATEMENTS OF OPERATIONS
For the year ended December 31, 2018
| | | Dividend
Builder
Fund | | Global
Energy
Fund | | Global
Innovators
Fund | | Renminbi
Yuan & Bond
Fund | |
Investment Income | |
Dividends* | | $ | 294,356 | | | $ | 747,455 | | | $ | 3,390,074 | | | $ | — | | |
Other Income | | | — | | | | 11,225 | | | | 1,751 | | | | — | | |
Interest | | | — | | | | — | | | | — | | | | 111,214 | | |
Total income | | | 294,356 | | | | 758,680 | | | | 3,391,825 | | | | 111,214 | | |
Expenses | |
Advisory fees | | | 42,486 | | | | 215,773 | | | | 1,662,165 | | | | 15,832 | | |
Shareholder servicing plan fees | | | 21,715 | | | | 58,274 | | | | — | | | | 1,891 | | |
Investor Class | | | — | | | | — | | | | 374,848 | | | | — | | |
Transfer agent fees and expenses | | | 16,351 | | | | 30,483 | | | | — | | | | 14,870 | | |
Investor Class | | | — | | | | — | | | | 93,902 | | | | — | | |
Institutional Class | | | — | | | | — | | | | 21,794 | | | | — | | |
Fund accounting fee and expenses | | | 30,039 | | | | 38,973 | | | | 124,972 | | | | 21,452 | | |
Administration fees | | | 4,486 | | | | 12,916 | | | | 100,681 | | | | 872 | | |
Institutional Class | | | — | | | | — | | | | 5,000 | | | | — | | |
Custody fees and expenses | | | 9,157 | | | | 7,281 | | | | 25,919 | | | | 1,699 | | |
Audit fees | | | 12,500 | | | | 24,499 | | | | 24,503 | | | | 12,500 | | |
Legal fees | | | 7,616 | | | | 19,413 | | | | 166,278 | | | | 1,551 | | |
Registration fees | | | 17,717 | | | | 18,515 | | | | — | | | | 16,252 | | |
Investor Class | | | — | | | | — | | | | 30,582 | | | | — | | |
Institutional Class | | | — | | | | — | | | | 16,016 | | | | — | | |
Printing | | | 5,935 | | | | 9,449 | | | | 36,801 | | | | 3,279 | | |
Trustees' fees and expenses | | | 10,337 | | | | 7,950 | | | | 39,559 | | | | 2,332 | | |
Insurance | | | 769 | | | | 2,829 | | | | 19,386 | | | | 218 | | |
CCO fees and expenses | | | 7,257 | | | | 9,887 | | | | 34,925 | | | | 6,416 | | |
Miscellaneous | | | 2,218 | | | | 3,088 | | | | 11,123 | | | | 1,202 | | |
Interest expense | | | 169 | | | | 982 | | | | 23,631 | | | | 873 | | |
Total expenses | | | 188,752 | | | | 460,312 | | | | 2,812,085 | | | | 101,239 | | |
Less: fees waived and expenses absorbed | | | (124,396 | ) | | | (42,666 | ) | | | (143,158 | ) | | | (74,469 | ) | |
Net expenses | | | 64,356 | | | | 417,646 | | | | 2,668,927 | | | | 26,770 | | |
Net investment income | | | 230,000 | | | | 341,034 | | | | 722,898 | | | | 84,444 | | |
Realized and unrealized gain (loss) on investments and foreign currency | |
Net realized gain (loss) on: | |
Investments | | | 804,656 | | | | (2,153,882 | ) | | | 14,069,631 | | | | 490 | | |
Foreign currency | | | (212 | ) | | | (3,268 | ) | | | 100,408 | | | | 1,971 | | |
| | | | 804,444 | | | | (2,157,150 | ) | | | 14,170,039 | | | | 2,461 | | |
Net change in unrealized depreciation on: | |
Investments | | | (1,409,304 | ) | | | (2,852,368 | ) | | | (50,317,700 | ) | | | (169,939 | ) | |
Foreign currency | | | (215 | ) | | | (1,233 | ) | | | (3,186 | ) | | | (18,183 | ) | |
| | | | (1,409,519 | ) | | | (2,853,601 | ) | | | (50,320,886 | ) | | | (188,122 | ) | |
Net realized and unrealized loss on investments and foreign currency | | | (605,075 | ) | | | (5,010,751 | ) | | | (36,150,847 | ) | | | (185,661 | ) | |
Net decrease in Net Assets from Operations | | $ | (375,075 | ) | | $ | (4,669,717 | ) | | $ | (35,427,949 | ) | | $ | (101,217 | ) | |
* Net of foreign tax withheld of $15,576, $77,856, $203,802, and $446, respectively.
The accompanying notes are an integral part of these financial statements.
75
STATEMENTS OF CHANGES IN NET ASSETS
| | | Alternative Energy Fund | | Asia Focus Fund | |
| | | Year Ended
December 31, 2018 | | Year Ended
December 31, 2017 | | Year Ended
December 31, 2018 | | Year Ended
December 31, 2017 | |
Increase/(decrease) in net assets from: | |
Operations | |
Net investment income (loss) | | $ | 16,637 | | | $ | (12,156 | ) | | $ | 218,349 | | | $ | 149,420 | | |
Net realized gain (loss) on: | |
Investments | | | (166,040 | ) | | | (1,004,303 | ) | | | 1,692,996 | | | | 496,560 | | |
Foreign currency | | | (2,397 | ) | | | (6,533 | ) | | | (8,330 | ) | | | 1,379 | | |
Net change in unrealized appreciation (depreciation) on: | |
Investments | | | (1,443,250 | ) | | | 2,961,520 | | | | (5,948,574 | ) | | | 6,103,537 | | |
Foreign currency | | | (698 | ) | | | 2,991 | | | | (141 | ) | | | 141 | | |
Net increase (decrease) in net assets resulting from operations | | | (1,595,748 | ) | | | 1,941,519 | | | | (4,045,700 | ) | | | 6,751,037 | | |
Distributions to shareholders | |
Net dividends and distributions | | | (7,535 | ) | | | (30,281 | ) | | | (1,236,501 | ) | | | (180,033 | ) | |
Total distributions to shareholders | | | (7,535 | ) | | | (30,281 | ) | | | (1,236,501 | ) | | | (180,033 | ) | |
Capital transactions | |
Proceeds from shares sold | | | 1,971,025 | | | | 1,640,619 | | | | 1,775,761 | | | | 1,211,935 | | |
Reinvestment of distributions | | | 7,262 | | | | 29,241 | | | | 1,154,137 | | | | 169,156 | | |
Cost of shares repurchased | | | (3,116,071 | ) | | | (3,151,250 | ) | | | (2,793,901 | ) | | | (3,217,540 | ) | |
Redemption fee proceeds | | | — | | | | — | | | | 7,691 | | | | 8,704 | | |
Net change in net assets from capital transactions | | | (1,137,784 | ) | | | (1,481,390 | ) | | | 143,688 | | | | (1,827,745 | ) | |
Total increase (decrease) in net assets | | | (2,741,067 | ) | | | 429,848 | | | | (5,138,513 | ) | | | 4,743,259 | | |
Net assets | |
Beginning of period | | | 10,628,643 | | | | 10,198,795 | | | | 20,197,005 | | | | 15,453,746 | | |
End of period | | $ | 7,887,576 | | | $ | 10,628,643 | * | | $ | 15,058,492 | | | $ | 20,197,005 | * | |
Capital share activity | |
Shares sold | | | 635,171 | | | | 586,174 | | | | 80,612 | | | | 60,741 | | |
Shares issued on reinvestment | | | 2,720 | | | | 10,224 | | | | 67,062 | | | | 7,770 | | |
Shares redeemed | | | (1,064,661 | ) | | | (1,137,303 | ) | | | (133,734 | ) | | | (171,083 | ) | |
Net increase (decrease) in shares outstanding | | | (426,770 | ) | | | (540,905 | ) | | | 13,940 | | | | (102,572 | ) | |
* Includes accumulated net investment loss of ($63,194) for the Alternative Energy Fund and ($99,273) for the Asia Focus Fund.
The accompanying notes are an integral part of these financial statements.
76
STATEMENTS OF CHANGES IN NET ASSETS
| | | Asia Pacific Dividend Builder Fund | | China & Hong Kong Fund | |
| | | Year Ended
December 31, 2018 | | Year Ended
December 31, 2017 | | Year Ended
December 31, 2018 | | Year Ended
December 31, 2017 | |
Increase/(decrease) in net assets from: | |
Operations | |
Net investment income | | $ | 179,652 | | | $ | 163,038 | | | $ | 903,469 | | | $ | 812,118 | | |
Net realized gain (loss) on: | |
Investments | | | 734,404 | | | | 265,113 | | | | 5,351,589 | | | | 4,209,914 | | |
Foreign currency | | | (2,267 | ) | | | (3,923 | ) | | | (490 | ) | | | (10,027 | ) | |
Net change in unrealized appreciation (depreciation) on: | |
Investments | | | (1,878,875 | ) | | | 1,602,465 | | | | (20,996,479 | ) | | | 21,938,469 | | |
Foreign currency | | | 18 | | | | (6 | ) | | | 67 | | | | (99 | ) | |
Net increase (decrease) in net assets resulting from operations | | | (967,068 | ) | | | 2,026,687 | | | | (14,741,844 | ) | | | 26,950,375 | | |
Distributions to shareholders | |
Net dividends and distributions | | | (248,299 | ) | | | (178,143 | ) | | | (6,456,112 | ) | | | (4,994,718 | )* | |
Total distributions to shareholders | | | (248,299 | ) | | | (178,143 | ) | | | (6,456,112 | ) | | | (4,994,718 | ) | |
Capital transactions | |
Proceeds from shares sold | | | 1,258,118 | | | | 3,770,529 | | | | 2,187,646 | | | | 3,454,532 | | |
Reinvestment of distributions | | | 225,595 | | | | 167,222 | | | | 6,195,506 | | | | 4,797,165 | | |
Cost of shares repurchased | | | (3,687,777 | ) | | | (6,718,803 | ) | | | (8,781,959 | ) | | | (10,264,154 | ) | |
Redemption fee proceeds | | | 2,705 | | | | 5,331 | | | | 5,268 | | | | 19,268 | | |
Net change in net assets from capital transactions | | | (2,201,359 | ) | | | (2,775,721 | ) | | | (393,539 | ) | | | (1,993,189 | ) | |
Total increase (decrease) in net assets | | | (3,416,726 | ) | | | (927,177 | ) | | | (21,591,495 | ) | | | 19,962,468 | | |
Net assets | |
Beginning of period | | | 7,577,293 | | | | 8,504,470 | | | | 78,205,976 | | | | 58,243,508 | | |
End of period | | $ | 4,160,567 | | | $ | 7,577,293 | ** | | $ | 56,614,481 | | | $ | 78,205,976 | ** | |
Capital share activity | |
Shares sold | | | 71,613 | | | | 240,260 | | | | 88,912 | | | | 137,182 | | |
Shares issued on reinvestment | | | 14,158 | | | | 10,222 | | | | 312,589 | | | | 187,756 | | |
Shares redeemed | | | (217,765 | ) | | | (459,145 | ) | | | (355,124 | ) | | | (429,183 | ) | |
Net increase (decrease) in shares outstanding | | | (131,994 | ) | | | (208,663 | ) | | | 46,377 | | | | (104,245 | ) | |
* Includes net realized gains distributions of $4,544,673 and net investment income distributions of $450,045.
** Includes accumulated net investment loss of ($41,839) for the Asia Pacific Dividend Fund and net investiment income of $473,979 for the China & Hong Kong Fund.
The accompanying notes are an integral part of these financial statements.
77
STATEMENTS OF CHANGES IN NET ASSETS
| | | Dividend Builder Fund | | Global Energy Fund | |
| | | Year Ended
December 31, 2018 | | Year Ended
December 31, 2017 | | Year Ended
December 31, 2018 | | Year Ended
December 31, 2017 | |
Increase/(decrease) in net assets from: | |
Operations | |
Net investment income | | $ | 230,000 | | | $ | 207,250 | | | $ | 341,034 | | | $ | 442,569 | | |
Net realized gain (loss) on: | |
Investments | | | 804,656 | | | | (146,759 | ) | | | (2,153,882 | ) | | | (1,550,390 | ) | |
Foreign currency | | | (212 | ) | | | 206 | | | | (3,268 | ) | | | (17,455 | ) | |
Net change in unrealized appreciation (depreciation) on: | |
Investments | | | (1,409,304 | ) | | | 1,569,877 | | | | (2,852,368 | ) | | | (700,540 | ) | |
Foreign currency | | | (215 | ) | | | 13 | | | | (1,233 | ) | | | 21,364 | | |
Net increase (decrease) in net assets resulting from operations | | | (375,075 | ) | | | 1,630,587 | | | | (4,669,717 | ) | | | (1,804,452 | ) | |
Distributions to shareholders | |
Net dividends and distributions | | | (235,246 | ) | | | (211,862 | ) | | | (339,150 | ) | | | (450,140 | ) | |
Return of capital | | | — | | | | — | | | | (5,853 | ) | | | — | | |
Total distributions to shareholders | | | (235,246 | ) | | | (211,862 | ) | | | (345,003 | ) | | | (450,140 | ) | |
Capital transactions | |
Proceeds from shares sold | | | 1,562,974 | | | | 1,656,460 | | | | 8,114,523 | | | | 6,467,799 | | |
Reinvestment of distributions | | | 234,335 | | | | 210,782 | | | | 334,182 | | | | 438,787 | | |
Cost of shares repurchased | | | (1,757,201 | ) | | | (2,037,808 | ) | | | (15,640,025 | ) | | | (21,874,821 | ) | |
Redemption fee proceeds | | | — | | | | — | | | | — | | | | — | | |
Net change in net assets from capital transactions | | | 40,108 | | | | (170,566 | ) | | | (7,191,320 | ) | | | (14,968,235 | ) | |
Total increase (decrease) in net assets | | | (570,213 | ) | | | 1,248,159 | | | | (12,206,040 | ) | | | (17,222,827 | ) | |
Net assets | |
Beginning of period | | | 9,027,417 | | | | 7,779,258 | | | | 31,758,982 | | | | 48,981,809 | | |
End of period | | $ | 8,457,204 | | | $ | 9,027,417 | * | | $ | 19,552,942 | | | $ | 31,758,982 | * | |
Capital share activity | |
Shares sold | | | 85,116 | | | | 99,637 | | | | 336,323 | | | | 304,663 | | |
Shares issued on reinvestment | | | 13,108 | | | | 12,412 | | | | 16,734 | | | | 20,314 | | |
Shares redeemed | | | (97,123 | ) | | | (122,224 | ) | | | (673,197 | ) | | | (1,029,846 | ) | |
Net increase (decrease) in shares outstanding | | | 1,101 | | | | (10,175 | ) | | | (320,140 | ) | | | (704,869 | ) | |
* Includes accumulated net investment loss of ($18,315) for the Dividend Builder Fund and ($73,689) for the Global Energy Fund.
The accompanying notes are an integral part of these financial statements.
78
STATEMENTS OF CHANGES IN NET ASSETS
| | | Global Innovators Fund | |
| | | Year Ended
December 31, 2018 | | Year Ended
December 31, 2017 | |
Increase/(decrease) in net assets from: | |
Operations | |
Net investment income | | $ | 722,898 | | | $ | 517,271 | | |
Net realized gain (loss) on: | |
Investments | | | 14,069,631 | | | | 3,033,721 | | |
Foreign currency | | | 100,408 | | | | (3,424 | ) | |
Net change in unrealized appreciation (depreciation) on: | |
Investments | | | (50,317,700 | ) | | | 53,223,726 | | |
Foreign currency | | | (3,186 | ) | | | 4,598 | | |
Net increase (decrease) in net assets resulting from operations | | | (35,427,949 | ) | | | 56,775,892 | | |
Distributions to Shareholders | |
Net dividends and distribuitons: | |
Investor Class | | | (9,754,366 | ) | | | (4,118,360 | )* | |
Institutional Class | | | (2,497,962 | ) | | | (1,043,275 | )* | |
Total distributions to shareholders | | | (12,252,328 | ) | | | (5,161,635 | ) | |
Capital transactions | |
Proceeds from shares sold: | |
Investor Class | | | 31,077,028 | | | | 44,470,842 | | |
Institutional Class | | | 11,945,787 | | | | 13,388,654 | | |
Reinvestment of distributions: | |
Investor Class | | | 9,540,475 | | | | 4,033,128 | | |
Institutional Class | | | 1,468,662 | | | | 584,355 | | |
Cost of shares repurchased: | |
Investor Class | | | (56,741,056 | ) | | | (38,915,538 | ) | |
Institutional Class | | | (14,827,646 | ) | | | (4,451,622 | ) | |
Redemption fee proceeds | | | — | | | | — | | |
Net change in net assets from capital transactions | | | (17,536,750 | ) | | | 19,109,819 | | |
Total increase (decrease) in net assets | | | (65,217,027 | ) | | | 70,724,076 | | |
Net assets | |
Beginning of period | | | 230,055,500 | | | | 159,331,424 | | |
End of period | | $ | 164,838,473 | | | $ | 230,055,500 | ** | |
Capital share activity | |
Shares sold: | |
Investor Class | | | 681,845 | | | | 1,096,920 | | |
Institutional Class | | | 270,177 | | | | 327,464 | | |
Shares issued on reinvestment: | |
Investor Class | | | 260,242 | | | | 91,123 | | |
Institutional Class | | | 39,964 | | | | 13,173 | | |
Shares redeemed: | |
Investor Class | | | (1,314,992 | ) | | | (968,093 | ) | |
Institutional Class | | | (327,944 | ) | | | (112,182 | ) | |
Net increase (decrease) in shares outstanding | | | (390,708 | ) | | | 448,405 | | |
* Includes net realized gains distributions of $3,944,151 and $927,419 and net investment income distributions of $174,209 and $115,856 for the Investor Class and Institutional Class, respectively.
** Includes accumulated net investment loss of ($147,579).
The accompanying notes are an integral part of these financial statements.
79
STATEMENTS OF CHANGES IN NET ASSETS
| | | Renminbi Yuan & Bond Fund | |
| | | Year Ended
December 31, 2018 | | Year Ended
December 31, 2017 | |
Increase/(decrease) in net assets from: | |
Operations | |
Net investment income | | $ | 84,444 | | | $ | 47,386 | | |
Net realized gain (loss) on: | |
Investments | | | 490 | | | | (63,923 | ) | |
Foreign currency | | | 1,971 | | | | 22,863 | | |
Net change in unrealized appreciation (depreciation) on: | |
Investments | | | (169,939 | ) | | | 192,610 | | |
Foreign currency | | | (18,183 | ) | | | 29,997 | | |
Net increase (decrease) in net assets resulting from operations | | | (101,217 | ) | | | 228,933 | | |
Distributions to shareholders | |
Net dividends and distributions | | | (115,227 | ) | | | (17,602 | ) | |
Return of capital | | | (3,326 | ) | | | (4,493 | ) | |
Total distributions to shareholders | | | (118,553 | ) | | | (22,095 | ) | |
Capital transactions | |
Proceeds from shares sold | | | 1,628,695 | | | | 498,207 | | |
Reinvestment of distributions | | | 116,649 | | | | 21,675 | | |
Cost of shares repurchased | | | (1,982,929 | ) | | | (422,316 | ) | |
Redemption fee proceeds | | | 25 | | | | — | | |
Net change in net assets from capital transactions | | | (237,560 | ) | | | 97,566 | | |
Total increase (decrease) in net assets | | | (457,330 | ) | | | 304,404 | | |
Net assets | |
Beginning of period | | | 2,634,652 | | | | 2,330,248 | | |
End of period | | $ | 2,177,322 | | | $ | 2,634,652 | * | |
Capital share activity | |
Shares sold | | | 133,685 | | | | 43,128 | | |
Shares issued on reinvestment | | | 10,215 | | | | 1,890 | | |
Shares redeemed | | | (169,888 | ) | | | (36,698 | ) | |
Net increase (decrease) in shares outstanding | | | (25,988 | ) | | | 8,320 | | |
* Includes accumulated net investment loss of ($42,906).
The accompanying notes are an integral part of these financial statements.
80
FINANCIAL HIGHLIGHTS
For a capital share outstanding throughout each period.
| | | Year Ended December 31, | |
Alternative Energy Fund | | 2018 | | 2017 | | 2016 | | 2015 | | 2014 | |
Net asset value, beginning of period | | $ | 3.02 | | | $ | 2.51 | | | $ | 3.03 | | | $ | 3.42 | | | $ | 3.99 | | |
Income from investment operations: | |
Net investment income (loss) | | | — | | | | — | | | | 0.01 | | | | (0.03 | ) | | | (0.04 | ) | |
Net realized and unrealized gain (loss)
on investments and foreign currency | | | (0.47 | ) | | | 0.52 | | | | (0.53 | )(3) | | | (0.36 | ) | | | (0.53 | ) | |
Total from investment operations | | | (0.47 | ) | | | 0.52 | | | | (0.52 | ) | | | (0.39 | ) | | | (0.57 | ) | |
Less distributions: | |
From net investment income | | | — | (1) | | | (0.01 | ) | | | — | | | | — | | | | — | | |
Total distributions | | | — | | | | (0.01 | ) | | | — | | | | — | | | | — | | |
Redemption fee proceeds | | | — | | | | — | | | | — | | | | — | (1) | | | — | (1) | |
Net asset value, end of period | | $ | 2.55 | | | $ | 3.02 | | | $ | 2.51 | | | $ | 3.03 | | | $ | 3.42 | | |
Total return | | | (15.49 | )% | | | 20.68 | % | | | (17.16 | )% | | | (11.40 | )% | | | (14.29 | )% | |
Ratios/supplemental data: | |
Net assets, end of period (millions) | | $ | 7.9 | | | $ | 10.6 | | | $ | 10.2 | | | $ | 13.6 | | | $ | 15.2 | | |
Ratio of expenses to average net assets: | |
Before fee waived/recaptured | | | 2.57 | % | | | 2.74 | % | | | 2.60 | % | | | 2.31 | % | | | 2.06 | % | |
| After fees waived/recaptured(2) | | | 1.98 | % | | | 1.98 | % | | | 1.99 | %(4) | | | 1.98 | % | | | 2.02 | %(4) | |
Ratio of net investment income (loss) to average net assets: | |
Before fees waived/recaptured | | | (0.43 | )% | | | (0.88 | )% | | | (0.38 | )% | | | (1.32 | )% | | | (0.74 | )% | |
After fees waived/recaptured | | | 0.16 | % | | | (0.12 | )% | | | 0.23 | % | | | (0.99 | )% | | | (0.70 | )% | |
Portfolio turnover rate | | | 36.54 | % | | | 32.45 | % | | | 63.95 | % | | | 28.67 | % | | | 42.27 | % | |
(1) Amount represents less than $0.01 per share.
(2) The Advisor has contractually agreed to limit the operating expenses of the Fund to 1.98%, excluding interest expense, expenses related to dividends on short positions, brokerage commissions, taxes and other extraordinary expenses. See Note 3.
(3) The Advisor reimbursed the Fund $16,892 for a trade error. As of December 31, 2016, the reimbursement amount represents $0.004 per share.
(4) If interest expense had been excluded, expenses would have been lowered by 0.01% and 0.04% for the year ended December 31, 2016 and 2014, respectively.
The accompanying notes are an integral part of these financial statements.
81
FINANCIAL HIGHLIGHTS
For a capital share outstanding throughout each period.
| | | Year Ended December 31, | |
Asia Focus Fund | | 2018 | | 2017 | | 2016 | | 2015 | | 2014 | |
Net asset value, beginning of period | | $ | 22.58 | | | $ | 15.50 | | | $ | 14.40 | | | $ | 16.47 | | | $ | 16.33 | | |
Income from investment operations: | |
Net investment income (loss) | | | 0.26 | | | | 0.16 | | | | 0.15 | | | | 0.21 | | | | 0.16 | | |
Net realized and unrealized gain (loss)
on investments and foreign currency | | | (4.83 | ) | | | 7.11 | | | | 1.17 | | | | (2.11 | ) | | | 0.15 | | |
Total from investment operations | | | (4.57 | ) | | | 7.27 | | | | 1.32 | | | | (1.90 | ) | | | 0.31 | | |
Less distributions: | |
From net investment income | | | (0.26 | ) | | | (0.20 | ) | | | (0.22 | ) | | | (0.17 | ) | | | (0.17 | ) | |
From net realized gain | | | (1.18 | ) | | | — | | | | — | | | | — | | | | — | | |
Total distributions | | | (1.44 | ) | | | (0.20 | ) | | | (0.22 | ) | | | (0.17 | ) | | | (0.17 | ) | |
Redemption fee proceeds | | | 0.01 | | | | 0.01 | | | | — | | | | — | (1) | | | — | (1) | |
Net asset value, end of period | | $ | 16.58 | | | $ | 22.58 | | | $ | 15.50 | | | $ | 14.40 | | | $ | 16.47 | | |
Total return | | | (20.45 | )% | | | 47.10 | % | | | 9.20 | % | | | (11.56 | )% | | | 1.91 | % | |
Ratios/supplemental data: | |
Net assets, end of period (millions) | | $ | 15.1 | | | $ | 20.2 | | | $ | 15.5 | | | $ | 15.3 | | | $ | 19.7 | | |
Ratio of expenses to average net assets: | |
Before fees waived | | | 2.01 | % | | | 2.22 | % | | | 2.24 | % | | | 1.98 | % | | | 1.91 | % | |
| After fees waived(2) | | | 1.99 | %(3) | | | 1.98 | % | | | 1.98 | % | | | 1.98 | %(3) | | | 1.91 | %(3) | |
Ratio of net investment income to average net assets: | |
Before fees waived | | | 1.14 | % | | | 0.60 | % | | | 0.75 | % | | | 1.24 | % | | | 0.90 | % | |
After fees waived | | | 1.16 | % | | | 0.84 | % | | | 1.01 | % | | | 1.24 | % | | | 0.90 | % | |
Portfolio turnover rate | | | 31.97 | % | | | 13.24 | % | | | 38.07 | % | | | 8.64 | % | | | 23.16 | % | |
(1) Amount represents less than $0.01 per share.
(2) The Advisor has contractually agreed to limit the operating expenses of the Fund to 1.98%, excluding interest expense, expenses related to dividends on short positions, brokerage commissions, taxes and other extraordinary expenses. See Note 3.
(3) If interest expense had been excluded, expenses would have been lowered by 0.01%, 0.01% and 0.01% for the year ended December 31, 2018, 2015 and 2014, respectively.
The accompanying notes are an integral part of these financial statements.
82
FINANCIAL HIGHLIGHTS
For a capital share outstanding throughout each period.
| | | Year Ended December 31, | |
Asia Pacific Dividend Builder Fund | | 2018 | | 2017 | | 2016 | | 2015 | | 2014 | |
Net asset value, beginning of period | | $ | 17.85 | | | $ | 13.43 | | | $ | 12.79 | | | $ | 13.83 | | | $ | 12.95 | | |
Income from investment operations: | |
Net investment income | | | 0.49 | | | | 0.40 | | | | 0.42 | | | | 0.39 | | | | 0.31 | | |
Net realized and unrealized gain (loss)
on investments and foreign currency | | | (3.36 | ) | | | 4.47 | | | | 0.71 | | | | (1.01 | ) | | | 0.85 | | |
Total from investment operations | | | (2.87 | ) | | | 4.87 | | | | 1.13 | | | | (0.62 | ) | | | 1.16 | | |
Less distributions: | |
From net investment income | | | (0.77 | ) | | | (0.46 | ) | | | (0.49 | ) | | | (0.42 | ) | | | (0.28 | ) | |
Total distributions | | | (0.77 | ) | | | (0.46 | ) | | | (0.49 | ) | | | (0.42 | ) | | | (0.28 | ) | |
Redemption fee proceeds | | | 0.01 | | | | 0.01 | | | | — | (1) | | | — | (1) | | | — | (1) | |
Net asset value, end of period | | $ | 14.22 | | | $ | 17.85 | | | $ | 13.43 | | | $ | 12.79 | | | $ | 13.83 | | |
Total return | | | (16.42 | )% | | | 36.70 | % | | | 8.81 | % | | | (4.61 | )% | | | 9.04 | % | |
Ratios/supplemental data: | |
Net assets, end of period (millions) | | $ | 4.2 | | | $ | 7.6 | | | $ | 8.5 | | | $ | 7.3 | | | $ | 4.1 | | |
Ratio of expenses to average net assets: | |
Before fees waived | | | 3.27 | % | | | 3.48 | % | | | 3.14 | % | | | 3.87 | % | | | 3.91 | % | |
| After fees waived(2) | | | 1.12 | %(3) | | | 1.12 | %(3) | | | 1.11 | %(3) | | | 1.98 | % | | | 1.99 | %(3) | |
Ratio of net investment income to average net assets: | |
Before fees waived | | | 0.89 | % | | | 0.20 | % | | | 1.11 | % | | | 0.36 | % | | | 0.37 | % | |
After fees waived | | | 3.04 | % | | | 2.56 | % | | | 3.14 | % | | | 2.25 | % | | | 2.29 | % | |
Portfolio turnover rate | | | 23.38 | % | | | 47.32 | % | | | 30.91 | % | | | 28.59 | % | | | 15.76 | % | |
(1) Amount represents less than $0.01 per share.
(2) The Advisor has contractually agreed to limit the operating expenses of the Fund to 1.10%, prior to December 31, 2015, the limit on operating expenses was 1.98%, excluding interest expense, expenses related to dividends on short positions, brokerage commissions, taxes and other extraordinary expenses. See Note 3.
(3) If interest expense had been excluded, expenses would have been lowered by 0.02%, 0.02%, 0.01% and 0.01% for the year ended December 31, 2018, 2017, 2016 and 2014, respectively.
The accompanying notes are an integral part of these financial statements.
83
FINANCIAL HIGHLIGHTS
For a capital share outstanding throughout each period.
| | | Year Ended December 31, | |
China & Hong Kong Fund | | 2018 | | 2017 | | 2016 | | 2015 | | 2014 | |
Net asset value, beginning of period | | $ | 26.55 | | | $ | 19.09 | | | $ | 19.50 | | | $ | 23.65 | | | $ | 30.86 | | |
Income from investment operations: | |
Net investment income | | | 0.33 | | | | 0.29 | | | | 0.34 | | | | 0.34 | | | | 0.48 | | |
Net realized and unrealized gain (loss)
on investments and foreign currency | | | (5.59 | ) | | | 8.95 | | | | 0.26 | | | | (2.11 | ) | | | (1.12 | ) | |
Total from investment operations | | | (5.26 | ) | | | 9.24 | | | | 0.60 | | | | (1.77 | ) | | | (0.64 | ) | |
Less distributions: | |
From net investment income | | | (0.31 | ) | | | (0.16 | ) | | | (0.27 | ) | | | (0.45 | ) | | | (0.45 | ) | |
From net realized gain | | | (2.06 | ) | | | (1.63 | ) | | | (0.74 | ) | | | (1.94 | ) | | | (6.13 | ) | |
Total distributions | | | (2.37 | ) | | | (1.79 | ) | | | (1.01 | ) | | | (2.39 | ) | | | (6.58 | ) | |
Redemption fee proceeds | | | — | (1) | | | 0.01 | | | | — | (1) | | | 0.01 | | | | 0.01 | | |
Net asset value, end of period | | $ | 18.92 | | | $ | 26.55 | | | $ | 19.09 | | | $ | 19.50 | | | $ | 23.65 | | |
Total return | | | (20.21 | )% | | | 48.85 | % | | | 2.95 | % | | | (7.58 | )% | | | (1.97 | )% | |
Ratios/supplemental data: | |
Net assets, end of period (millions) | | $ | 56.6 | | | $ | 78.2 | | | $ | 58.2 | | | $ | 65.9 | | | $ | 85.6 | | |
| Ratio of expenses to average net assets:(2) | | | 1.54 | % | | | 1.64 | % | | | 1.66 | % | | | 1.54 | %(3) | | | 1.52 | %(3) | |
Ratio of net investment income to average net assets: | | | 1.27 | % | | | 1.17 | % | | | 1.70 | % | | | 1.23 | % | | | 1.51 | % | |
Portfolio turnover rate | | | 22.27 | % | | | 20.78 | % | | | 28.02 | % | | | 26.50 | % | | | 15.11 | % | |
(1) Amount represents less than $0.01 per share.
(2) The Advisor has contractually agreed to limit the operating expenses of the Fund to 1.98%, excluding interest expense, expenses related to dividends on short positions, brokerage commissions, taxes and other extraordinary expenses. See Note 3.
(3) If interest expense had been excluded, expenses would have been lowered by 0.01% and 0.01% for the year ended December 31, 2015 and 2014, respectively.
The accompanying notes are an integral part of these financial statements.
84
FINANCIAL HIGHLIGHTS
For a capital share outstanding throughout each period.
| | | Year Ended December 31, | |
Dividend Builder Fund | | 2018 | | 2017 | | 2016 | | 2015 | | 2014 | |
Net asset value, beginning of period | | $ | 18.09 | | | $ | 15.28 | | | $ | 14.75 | | | $ | 15.83 | | | $ | 15.64 | | |
Income from investment operations: | |
Net investment income | | | 0.44 | | | | 0.41 | | | | 0.46 | | | | 0.42 | | | | 0.52 | | |
Net realized and unrealized gain (loss)
on investments and foreign currency | | | (1.17 | ) | | | 2.82 | | | | 0.54 | (3) | | | (0.99 | ) | | | 0.26 | | |
Total from investment operations | | | (0.73 | ) | | | 3.23 | | | | 1.00 | | | | (0.57 | ) | | | 0.78 | | |
Less distributions: | |
From net investment income | | | (0.45 | ) | | | (0.42 | ) | | | (0.47 | ) | | | (0.46 | ) | | | (0.47 | ) | |
From net realized gain | | | — | | | | — | | | | — | | | | (0.05 | ) | | | (0.12 | ) | |
Total distributions | | | (0.45 | ) | | | (0.42 | ) | | | (0.47 | ) | | | (0.51 | ) | | | (0.59 | ) | |
Redemption fee proceeds | | | — | | | | — | | | | — | | | | — | (1) | | | — | (1) | |
Net asset value, end of period | | $ | 16.91 | | | $ | 18.09 | | | $ | 15.28 | | | $ | 14.75 | | | $ | 15.83 | | |
Total return | | | (4.14 | )% | | | 21.34 | % | | | 6.83 | % | | | (3.61 | )% | | | 4.99 | % | |
Ratios/supplemental data: | |
Net assets, end of period (millions) | | $ | 8.5 | | | $ | 9.0 | | | $ | 7.8 | | | $ | 11.0 | | | $ | 5.2 | | |
Ratio of expenses to average net assets: | |
Before fees waived | | | 2.00 | % | | | 2.06 | % | | | 2.11 | % | | | 1.77 | % | | | 2.96 | % | |
| After fees waived(2) | | | 0.68 | % | | | 0.68 | % | | | 0.70 | %(4) | | | 0.68 | % | | | 0.68 | % | |
Ratio of net investment income to average net assets: | |
Before fees waived | | | 1.12 | % | | | 1.07 | % | | | 1.41 | % | | | 1.76 | % | | | 1.18 | % | |
After fees waived | | | 2.44 | % | | | 2.45 | % | | | 2.82 | % | | | 2.86 | % | | | 3.46 | % | |
Portfolio turnover rate | | | 23.71 | % | | | 18.61 | % | | | 21.57 | % | | | 24.94 | % | | | 7.60 | % | |
(1) Amount represents less than $0.01 per share.
(2) The Advisor has contractually agreed to limit the operating expenses of the Fund to 0.68%, excluding interest expense, expenses related to dividends on short positions, brokerage commissions, taxes and other extraordinary expenses. See Note 3.
(3) An affiliate of the Fund reimbursed the Fund $203.00 for a trade error. As of December 31, 2016, the reimbursement amount represents $0.000 per share.
(4) If interest expense had been excluded, expenses would have been lowered by 0.02% for the year ended December 31, 2016.
The accompanying notes are an integral part of these financial statements.
85
FINANCIAL HIGHLIGHTS
For a capital share outstanding throughout each period.
| | | Year Ended December 31, | |
Global Energy Fund | | 2018 | | 2017 | | 2016 | | 2015 | | 2014 | |
Net asset value, beginning of period | | $ | 22.71 | | | $ | 23.29 | | | $ | 18.54 | | | $ | 25.73 | | | $ | 32.45 | | |
Income from investment operations: | |
Net investment income | | | 0.29 | | | | 0.30 | | | | 0.26 | | | | 0.26 | | | | 0.28 | | |
Net realized and unrealized gain (loss)
on investments and foreign currency | | | (4.56 | ) | | | (0.56 | ) | | | 4.75 | | | | (7.20 | ) | | | (6.66 | ) | |
Total from investment operations | | | (4.27 | ) | | | (0.26 | ) | | | 5.01 | | | | (6.94 | ) | | | (6.38 | ) | |
Less distributions: | |
From net investment income | | | (0.30 | ) | | | (0.32 | ) | | | (0.26 | ) | | | (0.25 | ) | | | (0.22 | ) | |
From net realized gain | | | (0.01 | ) | | | — | | | | — | | | | — | (1) | | | (0.13 | ) | |
Total distributions | | | (0.31 | ) | | | (0.32 | ) | | | (0.26 | ) | | | (0.25 | ) | | | (0.35 | ) | |
Redemption fee proceeds | | | — | | | | — | | | | — | (1) | | | — | (1) | | | 0.01 | | |
Net asset value, end of period | | $ | 18.13 | | | $ | 22.71 | | | $ | 23.29 | | | $ | 18.54 | | | $ | 25.73 | | |
Total return | | | (18.92 | )% | | | (1.06 | )% | | | 27.04 | % | | | (26.97 | )% | | | (19.63 | )% | |
Ratios/supplemental data: | |
Net assets, end of period (millions) | | $ | 19.6 | | | $ | 31.8 | | | $ | 49.0 | | | $ | 44.0 | | | $ | 62.9 | | |
Ratio of expenses to average net assets | |
Before fees waived/recaptured | | | 1.60 | % | | | 1.62 | % | | | 1.53 | % | | | 1.41 | % | | | 1.30 | % | |
| After fees waived/recaptured(2) | | | 1.45 | % | | | 1.45 | % | | | 1.45 | % | | | 1.41 | % | | | 1.30 | % | |
Ratio of net investment income to average net assets | |
Before fees waived/recaptured | | | 1.04 | % | | | 1.01 | % | | | 1.10 | % | | | 1.07 | % | | | 0.76 | % | |
After fees waived/recaptured | | | 1.19 | % | | | 1.18 | % | | | 1.18 | % | | | 1.07 | % | | | 0.76 | % | |
Portfolio turnover rate | | | 14.39 | % | | | 6.25 | % | | | 14.96 | % | | | 15.70 | % | | | 39.33 | % | |
(1) Amount represents less than $0.01 per share.
(2) The Advisor has contractually agreed to limit the operating expenses of the Fund to 1.45%, excluding interest expense, expenses related to dividends on short positions, brokerage commissions, taxes and other extraordinary expenses. See Note 3.
The accompanying notes are an integral part of these financial statements.
86
FINANCIAL HIGHLIGHTS
For a capital share outstanding throughout each period.
| | | Year Ended December 31, | |
Global Innovators Fund – Investor Class | | 2018 | | 2017 | | 2016 | | 2015 | | 2014 | |
Net asset value, beginning of period | | $ | 44.98 | | | $ | 34.15 | | | $ | 31.47 | | | $ | 34.00 | | | $ | 30.65 | | |
Income from investment operations: | |
Net investment income | | | 0.13 | | | | 0.09 | | | | 0.30 | | | | 0.26 | | | | 0.28 | | |
Net realized and unrealized gain (loss) on investments | | | (7.56 | ) | | | 11.76 | | | | 2.69 | | | | (1.28 | )(3) | | | 3.57 | | |
Total from investment operations | | | (7.43 | ) | | | 11.85 | | | | 2.99 | | | | (1.02 | ) | | | 3.85 | | |
Less distributions: | |
From net investment income | | | (0.15 | ) | | | (0.04 | ) | | | (0.31 | ) | | | (0.24 | ) | | | (0.26 | ) | |
From net realized gain | | | (2.51 | ) | | | (0.98 | ) | | | — | | | | (1.27 | ) | | | (0.24 | ) | |
Total distributions | | | (2.66 | ) | | | (1.02 | ) | | | (0.31 | ) | | | (1.51 | ) | | | (0.50 | ) | |
Redemption fee proceeds | | | — | | | | — | | | | — | | | | — | (1) | | | — | (1) | |
Net asset value, end of period | | $ | 34.89 | | | $ | 44.98 | | | $ | 34.15 | | | $ | 31.47 | | | $ | 34.00 | | |
Total return | | | (16.80 | )% | | | 34.75 | % | | | 9.51 | % | | | (3.04 | )% | | | 12.55 | % | |
Ratios/supplemental data: | |
Net assets, end of period (millions) | | $ | 131.2 | | | $ | 185.9 | | | $ | 133.7 | | | $ | 164.9 | | | $ | 157.5 | | |
Ratio of expenses to average net assets: | |
Before fees waived/recaptured | | | 1.30 | % | | | 1.33 | % | | | 1.35 | % | | | 1.27 | % | | | 1.26 | % | |
| After fees waived/recaptured(2) | | | 1.25 | %(4) | | | 1.24 | % | | | 1.24 | % | | | 1.27 | % | | | 1.26 | % | |
Ratio of net investment income to average net assets: | |
Before fees waived/recaptured | | | 0.23 | % | | | 0.13 | % | | | 0.71 | % | | | 0.69 | % | | | 1.25 | % | |
After fees waived/recaptured | | | 0.28 | % | | | 0.22 | % | | | 0.82 | % | | | 0.69 | % | | | 1.25 | % | |
Portfolio turnover rate | | | 28.93 | % | | | 19.86 | % | | | 31.25 | % | | | 37.59 | % | | | 14.40 | % | |
(1) Amount represents less than $0.01 per share.
(2) The Advisor has contractually agreed to limit the operating expenses to 1.24%, prior to December 31, 2015 the limit on operating expenses was 1.55%, excluding interest expense, related to dividends on short positions, brokerage commissions, taxes and other extraordinary expenses. See Note 3.
(3) The Advisor reimbursed the Fund $10,554 for trade errors. As of December 31, 2015, the reimbursement amount represents $0.002 per share.
(4) If interest expense had been excluded, expenses would have been lowered by 0.01% for the year ended December 31, 2018.
The accompanying notes are an integral part of these financial statements.
87
FINANCIAL HIGHLIGHTS
For a capital share outstanding throughout each period.
| | | Year Ended December 31, | | For the
Period Ended | |
Global Innovators Fund – Institutional Class | | 2018 | | 2017 | | 2016 | | December 31, 2015(1) | |
Net asset value, beginning of period | | $ | 45.08 | | | $ | 34.20 | | | $ | 31.47 | | | $ | 31.47 | | |
Income from investment operations: | |
Net investment income | | | 0.24 | | | | 0.16 | | | | 0.20 | | | | — | | |
Net realized and unrealized gain on investments | | | (7.58 | ) | | | 11.82 | | | | 2.88 | | | | — | | |
Total from investment operations | | | (7.34 | ) | | | 11.98 | | | | 3.08 | | | | — | | |
Less distributions: | |
From net investment income | | | (0.24 | ) | | | (0.12 | ) | | | (0.35 | ) | | | — | | |
From net realized gain | | | (2.51 | ) | | | (0.98 | ) | | | — | | | | — | | |
Total distributions | | | (2.75 | ) | | | (1.10 | ) | | | (0.35 | ) | | | — | | |
Redemption fee proceeds | | | — | | | | — | | | | — | | | | — | | |
Net asset value, end of period | | $ | 34.99 | | | $ | 45.08 | | | $ | 34.20 | | | $ | 31.47 | | |
Total return | | | (16.59 | )% | | | 35.07 | % | | | 9.81 | % | | | — | | |
Ratios/supplemental data: | |
Net assets, end of period (millions) | | $ | 33.6 | | | $ | 44.1 | | | $ | 25.7 | | | $ | 0.0 | | |
Ratio of expenses to average net assets: | |
Before fees waived | | | 1.13 | % | | | 1.17 | % | | | 1.38 | % | | | — | | |
| After fees waived(2) | | | 1.00 | %(3) | | | 0.99 | % | | | 0.99 | % | | | — | | |
Ratio of net investment income to average net assets: | |
Before fees waived | | | 0.40 | % | | | 0.30 | % | | | 0.68 | % | | | — | | |
After fees waived | | | 0.53 | % | | | 0.48 | % | | | 1.07 | % | | | — | | |
Portfolio turnover rate | | | 28.93 | % | | | 19.86 | % | | | 31.25 | % | | | — | | |
(1) Commencement of Operations.
(2) The Advisor has contractually agreed to limit the operating expenses of the Fund's Institutional Class to 0.99%, excluding interest expense, expenses related to dividends on short positions, brokerage commissions, taxes and other extraordinary expenses. See Note 3.
(3) If interest expense had been excluded, expenses would have been lowered by 0.01% for the year ended December 31, 2018.
The accompanying notes are an integral part of these financial statements.
88
FINANCIAL HIGHLIGHTS
For a capital share outstanding throughout each period.
| | | Year Ended December 31, | |
Renminbi Yuan & Bond Fund | | 2018 | | 2017 | | 2016 | | 2015 | | 2014 | |
Net asset value, beginning of period | | $ | 12.00 | | | $ | 11.03 | | | $ | 11.63 | | | $ | 12.42 | | | $ | 12.95 | | |
Income from investment operations: | |
Net investment income | | | 0.29 | | | | 0.23 | | | | 0.19 | | | | 0.63 | | | | 0.32 | | |
Net realized and unrealized gain (loss)
on investments and foreign currency | | | (0.54 | ) | | | 0.85 | | | | (0.59 | ) | | | (1.12 | ) | | | (0.44 | ) | |
Total from investment operations | | | (0.25 | ) | | | 1.08 | | | | (0.40 | ) | | | (0.49 | ) | | | (0.12 | ) | |
Less distributions: | |
From net investment income | | | (0.49 | ) | | | (0.09 | ) | | | — | | | | (0.27 | ) | | | (0.41 | ) | |
Return of capital | | | (0.01 | ) | | | (0.02 | ) | | | (0.20 | ) | | | (0.03 | ) | | | — | | |
Total distributions | | | (0.50 | ) | | | (0.11 | ) | | | (0.20 | ) | | | (0.30 | ) | | | (0.41 | ) | |
Redemption fee proceeds | | | — | (1) | | | — | | | | — | (1) | | | — | (1) | | | — | (1) | |
Net asset value, end of period | | $ | 11.25 | | | $ | 12.00 | | | $ | 11.03 | | | $ | 11.63 | | | $ | 12.42 | | |
Total return | | | (2.12 | )% | | | 9.79 | % | | | (3.52 | )% | | | (4.05 | )% | | | (0.92 | )% | |
Ratios/supplemental data: | |
Net assets, end of period (millions) | | $ | 2.2 | | | $ | 2.6 | | | $ | 2.3 | | | $ | 7.1 | | | $ | 100.6 | | |
Ratio of expenses to average net assets: | |
Before fees waived | | | 3.52 | % | | | 4.17 | % | | | 4.35 | % | | | 1.05 | % | | | 0.95 | % | |
| After fees waived(2) | | | 0.93 | %(3) | | | 0.90 | % | | | 1.00 | %(3) | | | 0.93 | %(3) | | | 0.90 | % | |
Ratio of net investment income (loss) to average net assets: | |
Before fees waived/recaptured | | | 0.34 | % | | | (1.33 | )% | | | (0.71 | )% | | | 2.68 | % | | | 2.49 | % | |
After fees waived/recaptured | | | 2.93 | % | | | 1.94 | % | | | 2.64 | % | | | 2.80 | % | | | 2.54 | % | |
Portfolio turnover rate | | | 34.93 | % | | | 66.21 | % | | | 13.00 | % | | | 15.85 | % | | | 28.29 | % | |
(1) Amount represents less than $0.01 per share.
(2) The Advisor has contractually agreed to limit the operating expenses of the Fund to 0.90%, excluding interest expense, expenses related to dividends on short positions, brokerage commissions, taxes and other extraordinary expenses. See Note 3.
(3) If interest expense had been excluded, expenses would have been lowered by 0.03%, 0.10% and 0.03% for the year ended December 31, 2018, 2016 and 2015, respectively.
The accompanying notes are an integral part of these financial statements.
89
NOTES TO FINANCIAL STATEMENTS
Note 1
Organization
Guinness AtkinsonTM Funds (the "Trust"), was organized on April 28, 1997 as a Delaware business trust and registered under the Investment Company Act of 1940, as amended (the "1940 Act"), as an open-end management investment company. Currently, the Trust offers eight separate series: Guinness Atkinson Alternative Energy Fund (the "Alternative Energy Fund"), Guinness Atkinson Asia Focus Fund (the "Asia Focus Fund"), Guinness Atkinson Asia Pacific Dividend Builder Fund (the "Asia Pacific Dividend Builder Fund"), Guinness Atkinson China & Hong Kong Fund (the "China & Hong Kong Fund"), Guinness Atkinson Global Energy Fund (the "Global Energy Fund"), Guinness Atkinson Global Innovators Fund (the "Global Innovators Fund"), Guinness Atkinson Dividend Builder Fund (the "Dividend Builder Fund") and Guinness Atkinson Renminbi Yuan & Bond Fund (the "Renminbi Yuan & Bond Fund"), all of which (each a "Fund" and collectively, the "Funds") are covered by this report. Except for the Dividend Builder Fund, each Fund is a non-diversified Fund. The China & Hong Kong Fund began operations on June 30, 1994, the Asia Focus Fund began operations on April 29, 1996, the Global Innovators Fund began operations on December 15, 1998, the Global Energy Fund began operations on June 30, 2004, the Alternative Energy Fund and the Asia Pacific Dividend Builder Fund began operations on March 31, 2006, the Renminbi Yuan & Bond Fund began operations on June 30, 2011, and the Dividend Builder Fund began operations on March 30, 2012. Each of the Funds is authorized to issue a single class of shares except for the Global Innovators Fund. The Global Innovators Fund is authorized to issue two classes of shares: Investor Class shares and Institutional Class shares. Institutional Class shares of the Global Innovators Fund commenced operations on December 31, 2015.
The shares of each class represent an interest in the same portfolio of investments of the Global Innovators Fund and have equal rights as to voting, redemptions, dividends and liquidation, subject to the approval of the Trustees. Income and expenses (other than expenses attributable to a specific class) and realized and unrealized gains and losses on investments are allocated to each class of shares in proportion to their relative shares outstanding. Shareholders of a class that bears distribution and service expenses under the terms of a distribution plan have exclusive voting rights to that distribution plan.
The Alternative Energy Fund, Asia Focus Fund, Global Energy Fund, and Global Innovator Fund's investment objective is long-term capital appreciation. The Asia Pacific Dividend Builder Fund's investment objective is to provide investors with dividend income and long-term capital growth. The China & Hong Kong Fund's investment objective is long-term capital appreciation primarily through investments in securities of China and Hong Kong. The Renminbi Yuan & Bond Fund's investment objective is to seek total return. Total return means the combination of capital appreciation and investment income, which includes changes in the value of the renminbi, the currency of China of which the yuan is the unit. The Dividend Builder Fund's investment objective is to seek a moderate level of current income and consistent dividend growth at a rate that exceeds inflation.
Note 2
Significant accounting policies
Each Fund is an investment company and accordingly follows the investment company accounting and reporting guidance of the Financial Accounting Standards Board (FASB) Accounting Standard Codification Topic 946 "Financial Services – Investment Companies".
The following is a summary of significant accounting policies consistently followed by the Funds. These policies are in conformity with accounting principles generally accepted in the United States of America. ("GAAP").
A. Security Valuation. Securities of the Funds that are traded on a principal exchange (U.S. or foreign) or NASDAQ are valued at the official closing price on each day that the exchanges are open for trading. Securities traded on an exchange for which there have been no sales, and other over-the-counter securities are valued at the mean between the bid and asked prices. Debt securities are valued based on available market quotations received from an independent pricing service approved by the Trust's Board of Trustees which may utilize both transaction data and market information such as yield, prices of securities of comparable quality, coupon rate, maturity, type of issue, trading characteristics and other market data. Securities for which quotations are not readily available are valued at their respective fair values as determined in good faith by the Funds' Valuation Committee in accordance with procedures established by the Board of Trustees. In determining fair value, the Funds' Valuation Committee take into account all relevant factors and available information. Consequently, the price of the security used to calculate its Net Asset Value may differ from quoted or published prices for the same security. Fair value pricing involves subjective judgments and there is no single standard for determining a security's fair value. As a result, different mutual funds could reasonably arrive at different fair value for the same security. It is possible that the fair value determined for a security
90
is materially different from the value that could be realized upon the sale of that security or from the values that other mutual funds may determine. Short-term investments are stated at cost, combined with accrued interest, which approximates market value. Realized gains and losses from securities transactions are calculated using the identified cost method.
Foreign securities are recorded in the financial statements after translation to U.S. dollars based on the applicable exchange rate at the end of the period. The Funds do not isolate that portion of the results of operations resulting from changes in the currency exchange rate from the fluctuations resulting from changes in the market prices of investments.
Foreign exchange gain or loss resulting from holding of a foreign currency, expiration of a currency exchange contract, difference in exchange rates between the trade date and settlement date of an investment purchased or sold, and the difference between dividends actually received compared to the amount shown in a Fund's accounting records on the date of receipt are shown as net realized gains or losses on foreign currency transactions in the respective Fund's statement of operations.
B. Forward Foreign Currency Exchange Contracts. The Funds may utilize forward foreign currency exchange contracts ("forward contracts") to hedge against foreign exchange fluctuations on foreign-denominated investments under which they are obligated to exchange currencies at specific future dates and at specified rates. All commitments are "marked-to-market" daily and any resulting unrealized gains or losses are included as unrealized appreciation (depreciation) on foreign currency denominated assets and liabilities. The Funds record realized gains or losses at the time the forward contract is settled. Risks may arise upon entering these contracts from the potential inability of a counter party to meet the terms of their contracts and from unanticipated movements in the value of a foreign currency relative to the U.S. dollar or other currencies. Counterparties to these contracts are major U.S. financial institutions. Please refer to Note 7 for further information on forward foreign currency contracts held in each Fund.
C. Restricted and Illiquid Securities. A restricted security cannot be resold to the general public without prior registration under the Securities Act of 1933. If the security is subsequently registered and resold, the issuers would typically bear the expense of all registrations at no cost to the Fund. Restricted securities are valued according to the guidelines and procedures adopted by the Funds' Board of Trustees. A security may be considered illiquid if it lacks a readily available market. Securities are generally considered liquid if they can be sold or disposed of in the ordinary course of business within seven days at approximately the price at which the security is valued by a fund. Illiquid securities may be valued under methods approved by the Board of Trustees as reflecting fair value.
D. Security Transactions, Dividend Income and Distributions. Security transactions are accounted for on the trade date. Dividend income and distributions to shareholders are recorded on the ex-dividend date. Realized gains and losses from securities transactions are calculated using the identified cost method.
E. Allocation of Expenses. Each Fund is charged for those expenses directly attributable to it. Expenses that are not directly attributable to a Fund are allocated among the Funds in proportion to their respective assets or another appropriate method. Expenses such as distribution and service fees, transfer agent fees and expenses with respect to the Global Innovators Fund, that are specific to individual share classes are accrued directly to the respective share class.
F. Cash Overdraft. Throughout the year, the Funds may have cash overdraft balances. A fee is incurred on these overdrafts, calculated by multiplying the overdraft by a rate plus London Interbank Offered Rate ("LIBOR"). Payables, if any, are reflected as Overdraft Due to Custodian Bank in the Statements of Assets and Liabilities. Expenses from cash overdrafts are included in Interest Expense in the Statements of Operations.
G. Concentration of Risk. The Alternative Energy Fund invests substantially in the alternative energy or energy technology sectors. The Asia Focus Fund invests substantially all of its assets in the Asian continent. The Asia Pacific Dividend Builder Fund invests primarily in dividend-producing equity securities of Asia Pacific companies. The China & Hong Kong Fund invests substantially all of its assets in securities that are traded in China or Hong Kong or that are issued by companies that do a substantial part of their business in China. The Global Energy Fund invests substantially in energy companies; the changes in the prices and supplies of oil and other energy fuels may affect the Fund's investments. The Renminbi Yuan & Bond Fund invests in securities issued by companies economically tied to China, which exposes the Fund to greater market risk and potential monetary losses than if the Fund's assets were diversified among other regions. The consequences of political, social, or economic changes in the countries or business sectors in which the securities are offered or the issuers conduct their operations may affect the market prices of the Funds' investments and any income generated, as well as the Funds' ability to repatriate such amounts.
91
H. Use of Estimates. The preparation of financial statements in conformity with accounting principles generally accepted in the United States requires management to make estimates and assumptions that affect the reported amounts of assets and liabilities and the disclosure of contingent assets and liabilities at the date of the financial statements. Actual results could differ from those estimates.
I. Reclassifications. Accounting principles generally accepted in the United States require that certain components of net assets be reclassified between financial and tax reporting. These reclassifications have no effect on net assets or net asset value per share and were primarily attributed to differences in the treatment of foreign currency and net investment losses. For the year ended December 31, 2018, permanent differences in book and tax accounting have been reclassified as follows:
| | | Increase (Decrease) | |
| | | Paid in Capital | | Total distributable
Earning/(Losses) | |
Alternative Energy Fund | | $ | (9,319,691 | ) | | $ | 9,319,691 | | |
Asia Focus Fund | | | — | | | | — | | |
Asia Pacific Dividend Fund | | | (805,348 | ) | | | 805,348 | | |
China & Hong Kong Fund | | | — | | | | — | | |
Dividend Builder Fund | | | — | | | | — | | |
Global Energy Fund | | | — | | | | — | | |
Global Innovators Fund | | | — | | | | — | | |
Renminbi Yuan & Bond Fund | | | — | | | | — | | |
J. Indemnifications. Under the Trust's organizational documents, its current and former officers and trustees are indemnified against certain liabilities arising out of the performance of their duties to the Funds. In addition, in the normal course of business, the Funds enter into contracts that contain a variety of representations and warranties that provide general indemnifications. The Funds' maximum exposure under these arrangements is unknown as this would involve future claims that may be made against the Funds that have not yet occurred or that would be covered by other parties.
K. Federal Income Taxes. The Funds intend to comply with the requirements of Subchapter M of the Internal Revenue Code applicable to regulated investment companies and to distribute substantially all of their net investment income and any net realized gains to their shareholders. Therefore, no provision is made for federal income or excise taxes. Due to the timing of dividend distributions and the differences in accounting for income and realized gains and losses for financial statement and federal income tax purposes, the fiscal year in which amounts are distributed may differ from the year in which the income and realized gains and losses are recorded by the Funds.
Accounting for Uncertainty in Income Taxes (the "Income Tax Statement") requires an evaluation of tax positions taken (or expected to be taken) in the course of preparing a Funds' tax returns to determine whether these positions meet a "more-likely-than-not" standard that, based on the technical merits, have a more than fifty percent likelihood of being sustained by a taxing authority upon examination. A tax position that meets the "more-likely-than-not" recognition threshold is measured to determine the amount of benefit to recognize in the financial statements. The Funds recognize interest and penalties, if any, related to unrecognized tax benefits as income tax expense in the Statements of Operations.
The Income Tax Statement requires management of the Funds to analyze tax positions taken in the prior three open tax years, if any, and tax positions expected to be taken in the Fund's current tax year, as defined by the IRS statute of limitations for all major jurisdictions, including federal tax authorities and certain state tax authorities. As of and during the year ended December 31, 2018, the Funds did not have a liability for any unrecognized tax benefits. The Funds have no examination in progress and are not aware of any tax positions for which it is reasonably possible that the total amounts of unrecognized tax benefits will significantly change in the next twelve months.
92
Note 3
Investment Advisory and Other Agreements
The Trust, on behalf of each Fund, entered into an Investment Advisory Agreement with Guinness Atkinson Asset Management, Inc. (the "Advisor"), under which the Advisor provides the Funds with investment management services. The Advisor furnishes all investment advice, office space, facilities, and most of the personnel needed by the Funds. As compensation for its services, the Advisor is entitled to a monthly fee at the following annual rates based upon the average daily net assets of the Funds:
Alternative Energy Fund | | 1.00% | |
Asia Focus Fund | | 1.00% | |
Asia Pacific Dividend Builder Fund | | 1.00% | |
China & Hong Kong Fund | | 1.00% | |
Dividend Builder Fund | | 0.45% | |
Global Energy Fund | | 0.75% | |
Global Innovators Fund | | 0.75% on the 1st $500 million, 0.60% thereafter | |
Renminbi Yuan & Bond Fund | | 0.55% | |
The Funds are responsible for their own operating expenses. The Advisor has contractually agreed to limit each Fund's total operating expenses (excluding interest, dividends on short positions, taxes and extraordinary expenses) by reducing all or a portion of its fees and reimbursing the Fund for expenses so that its ratio of expenses to average daily net assets will not exceed the following levels:
| | | Annual Expense Limit | | Expiration Date | |
Alternative Energy Fund | | | 1.98 | % | | June 30, 2019 | |
Asia Focus Fund | | | 1.98 | % | | June 30, 2019 | |
Asia Pacific Dividend Builder Fund | | | 1.10 | % | | June 30, 2019 | |
China & Hong Kong Fund | | | 1.98 | % | | June 30, 2019 | |
Dividend Builder Fund | | | 0.68 | % | | June 30, 2019 | |
Global Energy Fund | | | 1.45 | % | | June 30, 2019 | |
Global Innovators Fund - Investor Class | | | 1.24 | % | | June 30, 2019 | |
Global Innovators Fund - Institutional Class | | | 0.99 | % | | June 30, 2019 | |
Renminbi Yuan & Bond Fund | | | 0.90 | % | | June 30, 2019 | |
The expense ratios shown in the financial highlights may exceed these levels due to expenses incurred, but not covered by the expense limitation agreement.
93
To the extent that the Advisor waives fees and/or absorbs expenses it may seek repayment of a portion or all of such amounts at any time within three fiscal years after the fiscal year in which such amounts were waived or absorbed, subject to the applicable cap. For the year ended December 31, 2018, the Advisor waived fees and absorbed expenses as follows:
Alternative Energy Fund | | $ | 60,122 | | |
Asia Focus Fund | | $ | 4,300 | | |
Asia Pacific Dividend Builder Fund | | $ | 127,356 | | |
Dividend Builder Fund | | $ | 124,396 | | |
Global Energy Fund | | $ | 42,666 | | |
Global Innovators Fund | | $ | 143,158 | | |
Renminbi Yuan & Bond Fund | | $ | 74,469 | | |
Total | | $ | 576,467 | | |
At December 31, 2018, the Advisor may recapture a portion of the following amounts that had been paid and/or waived on behalf of the Funds no later than the dates as stated below:
Fund | | December 31, 2019 | | December 31, 2020 | | December 31, 2021 | | Total | |
Alternative Energy Fund | | $ | 74,816 | | | $ | 79,688 | | | $ | 60,122 | | | $ | 214,626 | | |
Asia Focus Fund | | | 39,307 | | | | 42,738 | | | | 4,300 | | | | 86,345 | | |
Asia Pacific Dividend Builder Fund | | | 147,701 | | | | 150,454 | | | | 127,356 | | | | 425,511 | | |
Dividend Builder Fund | | | 140,817 | | | | 116,547 | | | | 124,396 | | | | 381,760 | | |
Global Energy Fund | | | 38,343 | | | | 65,017 | | | | 42,666 | | | | 146,026 | | |
Global Innovators Fund | | | 203,998 | | | | 210,068 | | | | 143,158 | | | | 557,224 | | |
Renminbi Yuan & Bond Fund | | | 90,419 | | | | 79,810 | | | | 74,469 | | | | 244,698 | | |
Mutual Fund Administration, LLC (the "Administrator") acts as the Funds' administrator under an administration agreement. The fees paid to the Administrator for the year ended December 31, 2018 are reported on the Statements of Operations.
Foreside Fund Services, LLC acts as the Funds' principal underwriter in a continuous public offering of the Funds' shares.
Foreside Fund Officer Services, LLC provides Chief Compliance Officer ("CCO") services to the Funds. The fees paid for CCO services for the year ended December 31, 2018 are reported on the Statements of Operations.
On August 14, 1998, the Trust approved a Deferred Compensation Plan for Trustees (the "Plan"). Trustees can elect to receive payment in cash or defer payments provided for in the Plan. If a trustee elects to defer payment, the Plan provides for the creation of a deferred payment account (Phantom Share Account). This account accumulates the deferred fees earned, and the value of the account is adjusted at the end of each quarter to reflect the value that would have been earned if the account had been invested in designated investments. The Funds recognize as trustee expense amounts accrued as meetings are attended plus the change in value of the Phantom Share Account.
The fees paid to non-interested Trustees for the year ended December 31, 2018 are reported on the Statements of Operations.
Certain officers of the Trust are also officers and/or Directors of the Advisor and the Administrator. None of these officers are compensated directly by the Funds.
94
Note 4
Shareholder Servicing Plan
Each Fund has adopted a Shareholder Servicing Plan to pay a fee at an annual rate of up to 0.25% of its daily average net assets of shares serviced by shareholder servicing agents who provide administrative and support services to their customers. The Global Innovators Fund – Institutional Class shares do not participate in the Shareholder Servicing Plan.
The fees paid under the Shareholder Servicing Plan for the year ended December 31, 2018 are reported on the Statements of Operations.
Note 5
Investment Transactions
The following table presents purchases and sales of securities during the year ended December 31, 2018 excluding short-term investments, to indicate the volume of transactions in each Fund.
| | | Purchases | | Sales | |
Alternative Energy Fund | | $ | 3,606,440 | | | $ | 4,584,335 | | |
Asia Focus Fund | | $ | 5,995,876 | | | $ | 6,702,583 | | |
Asia Pacific Dividend Builder Fund | | $ | 1,392,252 | | | $ | 3,656,325 | | |
China & Hong Kong Fund | | $ | 15,763,513 | | | $ | 22,661,394 | | |
Dividend Builder Fund | | $ | 2,197,591 | | | $ | 2,186,587 | | |
Global Energy Fund | | $ | 4,073,110 | | | $ | 11,572,220 | | |
Global Innovators Fund | | $ | 62,879,489 | | | $ | 91,613,163 | | |
Renminbi Yuan & Bond Fund | | $ | 1,758,573 | | | $ | 851,024 | | |
The Funds did not purchase U.S. Government securities as a part of their long-term investment strategy during the year ended December 31, 2018.
Note 6
Fair Value Measurements and Disclosures
Fair Value Measurements and Disclosures defines fair value, establishes a framework for measuring fair value in accordance with GAAP, and expands disclosure about fair value measurements. It also provides guidance on determining when there has been a significant decrease in the volume and level of activity for an asset or a liability, when a transaction is not orderly, and how that information must be incorporated into a fair value measurement.
Under Fair Value Measurements and Disclosures, various inputs are used in determining the value of each Fund's investments. These inputs are summarized into three broad Levels as described below:
Level 1 — Unadjusted quoted prices in active markets for identical assets or liabilities that a Fund has the ability to access.
Level 2 — Observable inputs other than quoted prices included in level 1 that are observable for the asset or liability, either directly or indirectly. These inputs may include quoted prices for the identical instrument on an inactive market, prices for similar instruments, interest rates, prepayment speeds, credit risk, yield curves, default rates and similar data.
Level 3 — Unobservable inputs for the asset or liability, to the extent relevant observable inputs are not available, representing the Fund's own assumptions about the assumptions a market participant would use in valuing the asset or liability, and would be based on the best information available.
The availability of observable inputs can vary from security to security and is affected by a wide variety of factors, including for example, the type of security, whether the security is new and not yet established in the marketplace, the liquidity of markets, and other characteristics particular to the security. To the extent that valuation is based on models or inputs that are less observable or unobservable in the market, the determination of fair value requires more judgment. Accordingly, the degree of judgment exercised in determining fair value is greatest for instruments categorized in Level 3.
95
The inputs used to measure fair value may fall into different levels of the fair value hierarchy. In such cases, for disclosure purposes, the level in the fair value hierarchy within which the fair value measurement falls in its entirety, is determined based on the lowest level input that is significant to the fair value measurement in its entirety.
The inputs or methodology used for valuing securities are not an indication of the risk associated with investing in those securities. The following is a summary of the inputs used, as of December 31, 2018, in valuing the Funds' assets carried at fair value:
Alternative Energy Fund
Assets Table | | Level 1 | | Level 2 | | Level 3 | | Total | |
Investments, at value | |
Common Stocks: | |
Basic Materials | | $ | 245,700 | | | $ | 270,382 | | | $ | — | | | $ | 516,082 | | |
Energy | | | 1,803,105 | | | | 1,269,671 | | | | — | | | | 3,072,776 | | |
Industrial | | | 1,009,949 | | | | 1,427,218 | | | | — | | | | 2,437,167 | | |
Utilities | | | 290,736 | | | | 1,457,094 | | | | — | | | | 1,747,830 | | |
Total Investments, at value | | | 3,349,490 | | | | 4,424,365 | | | | — | | | | 7,773,855 | | |
Total Assets | | $ | 3,349,490 | | | $ | 4,424,365 | | | $ | — | | | $ | 7,773,855 | | |
Asia Focus Fund
Assets Table | | Level 1 | | Level 2 | | Level 3 | | Total | |
Investments, at value | |
Common Stocks:1 | |
Communications | | $ | 834,802 | | | $ | 420,275 | | | $ | — | | | $ | 1,255,077 | | |
Consumer, Cyclical | | | — | | | | 1,783,658 | | | | — | | | | 1,783,658 | | |
Consumer, Non-cyclical | | | 328,860 | | | | 2,275,578 | | | | — | | | | 2,604,438 | | |
Energy | | | — | | | | 474,929 | | | | — | | | | 474,929 | | |
Financial | | | 485,184 | | | | 2,336,297 | | | | — | | | | 2,821,481 | | |
Industrial | | | — | | | | 2,321,416 | | | | — | | | | 2,321,416 | | |
Technology | | | 1,024,349 | | | | 1,491,728 | | | | — | | | | 2,516,077 | | |
Utilities | | | — | | | | 1,007,018 | | | | — | | | | 1,007,018 | | |
Total Investments, at value | | | 2,673,195 | | | | 12,110,899 | | | | — | | | | 14,784,094 | | |
Total Assets | | $ | 2,673,195 | | | $ | 12,110,899 | | | $ | — | | | $ | 14,784,094 | | |
96
Asia Pacific Dividend Builder Fund
Assets Table | | Level 1 | | Level 2 | | Level 3 | | Total | |
Investments, at value | |
Common Stocks:1 | |
Communications | | $ | — | | | $ | 120,253 | | | $ | — | | | $ | 120,253 | | |
Consumer, Cyclical | | | — | | | | 780,796 | | | | — | | | | 780,796 | | |
Consumer, Non-cyclical | | | — | | | | 347,720 | | | | — | | | | 347,720 | | |
Energy | | | — | | | | 108,131 | | | | — | | | | 108,131 | | |
Financial | | | 113,900 | | | | 1,500,549 | | | | — | | | | 1,614,449 | | |
Industrial | | | — | | | | 621,944 | | | | — | | | | 621,944 | | |
Technology | | | 113,820 | | | | 359,311 | | | | — | | | | 473,131 | | |
Total Investments, at value | | | 227,720 | | | | 3,838,704 | | | | — | | | | 4,066,424 | | |
Total Assets | | $ | 227,720 | | | $ | 3,838,704 | | | $ | — | | | $ | 4,066,424 | | |
China & Hong Kong Fund
Assets Table | | Level 1 | | Level 2 | | Level 3 | | Total | |
Investments, at value | |
Common Stocks:1 | |
Communications | | $ | 3,220,579 | | | $ | 1,785,166 | | | $ | — | | | $ | 5,005,745 | | |
Consumer, Cyclical | | | — | | | | 11,222,446 | | | | — | | | | 11,222,446 | | |
Consumer, Non-cyclical | | | 1,529,199 | | | | 6,045,932 | | | | — | | | | 7,575,131 | | |
Energy | | | — | | | | 2,492,204 | | | | — | | | | 2,492,204 | | |
Financial | | | 1,728,468 | | | | 14,542,137 | | | | — | | | | 16,270,605 | | |
Industrial | | | 1,982,132 | | | | 7,360,825 | | | | — | | | | 9,342,957 | | |
Technology | | | 3,754,204 | | | | — | | | | — | | | | 3,754,204 | | |
Total Investments, at value | | | 12,214,582 | | | | 43,448,710 | | | | — | | | | 55,663,292 | | |
Total Assets | | $ | 12,214,582 | | | $ | 43,448,710 | | | $ | — | | | $ | 55,663,292 | | |
97
Dividend Builder Fund
Assets Table | | Level 1 | | Level 2 | | Level 3 | | Total | |
Investments, at value | |
Common Stocks:1 | |
Communications | | $ | 239,181 | | | $ | 522,998 | | | $ | — | | | $ | 762,179 | | |
Consumer, Cyclical | | | 221,154 | | | | 274,083 | | | | — | | | | 495,237 | | |
Consumer, Non-cyclical | | | 977,091 | | | | 2,879,177 | | | | — | | | | 3,856,268 | | |
Energy | | | — | | | | 234,212 | | | | — | | | | 234,212 | | |
Financial | | | 746,689 | | | | 238,519 | | | | — | | | | 985,208 | | |
Industrial | | | 677,954 | | | | 461,391 | | | | — | | | | 1,139,345 | | |
Technology | | | 717,689 | | | | 256,389 | | | | — | | | | 974,078 | | |
Total Investments, at value | | | 3,579,758 | | | | 4,866,769 | | | | — | | | | 8,446,527 | | |
Total Assets | | $ | 3,579,758 | | | $ | 4,866,769 | | | $ | — | | | $ | 8,446,527 | | |
Global Energy Fund
Assets Table | | Level 1 | | Level 2 | | Level 3 | | Total | |
Investments, at value | |
Common Stocks:1 | |
Energy | | $ | 11,403,100 | | | $ | 7,810,824 | | | $ | — | | | $ | 19,213,924 | | |
Financial | | | 93,683 | | | | — | | | | — | | | | 93,683 | | |
Industrial | | | 125,741 | | | | 30,400 | | | | — | | | | 156,141 | | |
Total Investments, at value | | | 11,622,524 | | | | 7,841,224 | | | | — | | | | 19,463,748 | | |
Total Assets | | $ | 11,622,524 | | | $ | 7,841,224 | | | $ | — | | | $ | 19,463,748 | | |
Global Innovators Fund
Assets Table | | Level 1 | | Level 2 | | Level 3 | | Total | |
Investments, at value | |
Common Stocks:1 | |
Communications | | $ | 26,842,488 | | | $ | 5,739,750 | | | $ | — | | | $ | 32,582,238 | | |
Consumer, Cyclical | | | 6,034,255 | | | | 11,121,769 | | | | — | | | | 17,156,024 | | |
Consumer, Non-cyclical | | | 16,736,412 | | | | — | | | | — | | | | 16,736,412 | | |
Financial | | | 5,606,058 | | | | — | | | | — | | | | 5,606,058 | | |
Industrial | | | 11,192,119 | | | | 31,854,037 | | | | — | | | | 43,046,156 | | |
Technology | | | 31,869,974 | | | | 16,577,388 | | | | — | | | | 48,447,362 | | |
Total Investments, at value | | | 98,281,306 | | | | 65,292,944 | | | | — | | | | 163,574,250 | | |
Total Assets | | $ | 98,281,306 | | | $ | 65,292,944 | | | $ | — | | | $ | 163,574,250 | | |
98
Renminbi Yuan & Bond Fund
Assets Table | | Level 1 | | Level 2 | | Level 3 | | Total | |
Investments, at value | |
Corporate Bonds: | |
Consumer Cyclical | | $ | — | | | $ | 293,221 | | | $ | — | | | $ | 293,221 | | |
Energy | | | — | | | | 145,466 | | | | — | | | | 145,466 | | |
Financial | | | — | | | | 1,168,675 | | | | — | | | | 1,168,675 | | |
Government | | | — | | | | 610,333 | | | | — | | | | 610,333 | | |
Technology | | | — | | | | 145,149 | | | | — | | | | 145,149 | | |
Total Investments, at value | | | — | | | | 2,362,844 | | | | — | | | | 2,362,844 | | |
Total Assets | | $ | — | | | $ | 2,362,844 | | | $ | — | | | $ | 2,362,844 | | |
Note 7
Forward Foreign Currency Contracts
In order to hedge their portfolio and to protect them against possible fluctuations in foreign exchange rates pending the settlement of securities transactions, the Funds may enter into forward foreign currency contracts that obligate them to exchange currencies at specified future dates. At the maturity of a forward contract, a Fund may either make delivery of the foreign currency from currency held, if any, or from the proceeds of the portfolio securities sold. It may also terminate its obligation to deliver the foreign currency at any time by purchasing an offsetting contract. The forward values of amounts due are netted against the forward value of the currency to be delivered, and the net amount is shown as a receivable or payable in the financial statements. The Funds did not enter into forward foreign currency contracts during the year ended December 31, 2018 and did not have any outstanding forward contracts as of December 31, 2018.
99
Note 8
Tax Matters
As of December 31, 2018, the tax basis of investments were as follows:
| | | Alternative
Energy Fund | | Asia Focus
Fund | | Asia Pacific
Dividend
Builder
Fund | | China &
Hong Kong
Fund | | Dividend
Builder
Fund | | Global
Energy
Fund | | Global
Innovators
Fund | | Renminbi
Yuan & Bond
Fund | |
Cost of investments for
tax purposes | | $ | 11,354,861 | | | $ | 12,293,583 | | | $ | 4,613,859 | | | $ | 48,131,590 | | | $ | 7,706,883 | | | $ | 27,653,920 | | | $ | 148,188,310 | | | $ | 2,547,921 | | |
Gross tax unrealized
appreciation | | | 282,180 | | | | 4,126,349 | | | | 252,554 | | | | 12,994,277 | | | | 1,498,298 | | | | 1,759,026 | | | | 33,377,732 | | | | 859 | | |
Gross tax unrealized
(depreciation) | | | (3,863,186 | ) | | | (1,635,838 | ) | | | (799,989 | ) | | | (5,462,575 | ) | | | (758,654 | ) | | | (9,949,198 | ) | | | (17,991,792 | ) | | | (185,936 | ) | |
Net tax unrealized
appreciation
(depreciation) on
investments | | | (3,581,006 | ) | | | 2,490,511 | | | | (547,435 | ) | | | 7,531,702 | | | | 739,644 | | | | (8,190,172 | ) | | | 15,385,940 | | | | (185,077 | ) | |
Net tax appreciation
(depreciation) on
foreign-currency
denominated assets
and liabilities | | | 136 | | | | — | | | | 14 | | | | 12 | | | | (118 | ) | | | 24 | | | | — | | | | (129 | ) | |
Net tax unrealized
appreciation
(depreciation)* | | | (3,580,870 | ) | | | 2,490,511 | | | | (574,421 | ) | | | 7,531,714 | | | | 739,526 | | | | (8,190,148 | ) | | | 15,385,940 | | | | (185,206 | ) | |
Undistributed net
ordinary income** | | | — | | | | — | | | | — | | | | 673,194 | | | | 585 | | | | — | | | | 49,568 | | | | — | | |
Undistributed Long-term
Capital Gains | | | — | | | | 759,584 | | | | — | | | | — | | | | 3,225 | | | | — | | | | 1,668,050 | | | | — | | |
Post October loss*** | | | (19,359 | ) | | | (473 | ) | | | (215 | ) | | | (301,997 | ) | | | (188 | ) | | | (305,041 | ) | | | — | | | | (33,885 | ) | |
Capital loss
carryforward | | | (36,665,576 | ) | | | — | | | | — | | | | — | | | | — | | | | (21,138,542 | ) | | | — | | | | (4,237,063 | ) | |
Other accumulated
gain/(loss) | | | (49,936 | ) | | | (73,679 | ) | | | (47,506 | ) | | | (146,294 | ) | | | (24,170 | ) | | | (75,073 | ) | | | (148,884 | ) | | | (37,833 | ) | |
Total accumulated
gain/(loss) | | $ | (40,315,741 | ) | | $ | 3,175,943 | | | $ | (595,142 | ) | | $ | 7,756,617 | | | $ | 718,978 | | | $ | (29,708,804 | ) | | $ | 16,954,674 | | | $ | (4,493,987 | ) | |
* The differences between book-basis and tax-basis unrealized appreciation/(depreciation) is attributable primary to the tax deferral of losses on wash sales and passive foreign investment company (PFIC) mark to market adjustments.
** The differences between book-basis and tax-basis undistributed net ordinary income is attributed to deferred compensation, which is included in Other Accumulated Loss.
*** Under the current tax law, capital and currency losses realized after October 31 and prior to a Fund's fiscal year end may be deferred as occurring on the first day of the following year.
100
As of December 31, 2018, the Funds have the following capital loss carryforwards available to offset future realized capital gains:
Capital losses expiring in: | | Alternative
Energy Fund | | Asia Focus
Fund | | Asia Pacific
Dividend
Builder
Fund | | China &
Hong Kong
Fund | | Dividend
Builder
Fund | | Global
Energy
Fund | | Global
Innovators
Fund | | Renminbi
Yuan & Bond
Fund | |
No Expiration Long-term | | $ | 36,665,576 | | | $ | — | | | $ | — | | | $ | — | | | $ | — | | | $ | 17,981,385 | | | $ | — | | | $ | 3,271,487 | | |
No Expiration Short-term | | | — | | | | — | | | | — | | | | — | | | | — | | | | 3,157,157 | | | | — | | | | 965,576 | | |
Total | | $ | 36,665,576 | | | $ | — | | | $ | — | | | $ | — | | | $ | — | | | $ | 21,138,542 | | | $ | — | | | $ | 4,237,063 | | |
For the year ended December 31, 2018, the Asia Pacific Dividend Builder Fund and Dividend Builder Fund, utilized capital losses carryforwards of $681,328, and $801,228 respectively.
The tax character of distributions (other than return of capital distributions, see statement of changes in net assets) paid during 2018 and 2017 fiscal years are as follows:
| | | 2018 | | 2017 | |
| | | Ordinary
Income | | Long-term
Capital Gain | | Ordinary
Income | | Long-term
Capital Gain | |
Alternative Energy Fund | | $ | 7,535 | | | $ | — | | | $ | 30,281 | | | $ | — | | |
Asia Focus Fund | | | 200,103 | | | | 1,036,398 | | | | 180,033 | | | | — | | |
Asia Pacific Dividend Builder Fund | | | 248,299 | | | | | | 178,143 | | | | — | | |
China & Hong Kong Fund | | | 1,329,608 | | | | 5,126,504 | | | | 1,109,662 | | | | 3,885,056 | | |
Dividend Builder Fund | | | 235,246 | | | | — | | | | 211,862 | | | | — | | |
Global Energy Fund | | | 339,150 | | | | — | | | | 450,140 | | | | — | | |
Global Innovators Fund | | | 775,043 | | | | 11,477,285 | | | | 4,093,190 | | | | 1,068,445 | | |
Renminbi Yuan & Bond Fund | | | 115,227 | | | | — | | | | 17,602 | | | | — | | |
Note 9
Recently Issued Accounting Pronouncements
In March 2017, the Financial Accounting Standards Board (FASB) issued Accounting Standards Update (ASU) No. 2017-08, Receivables – Nonrefundable Fees and Other Costs (Subtopic 310-20): Premium Amortization on Purchased Callable Debt Securities. The amendments in the ASU shorten the amortization period for certain callable debt securities, held at a premium, to be amortized to the earliest call date. The ASU does not require an accounting change for securities held at a discount; which continues to be amortized to maturity. The ASU is effective for fiscal years and interim periods within those fiscal years beginning after December 15, 2018. Management has evaluated the potential impacts of ASU 2017-08 and believes that adoption of ASU 2017-08 will not have a material effect on the fund's overall financial position or its overall results of operations.
In August 2018, the Securities and Exchange Commission (the "SEC") adopted regulations that eliminated or amended disclosure requirements that were redundant or outdated in light of changes in SEC requirements, accounting principles generally accepted in the United States of America ("GAAP"), International Financial Reporting Standards, or changes in technology or the business environment. These regulations were effective November 5, 2018, and the Fund is complying with them effective with these financial statements.
In August 2018, FASB issued Accounting Standards Update No. 2018-13 ("ASU 2018-13"), "Disclosure Framework – Changes to the Disclosure Requirements for Fair Value Measurement," which amends the fair value measurement disclosure requirements of ASC Topic 820 ("ASC 820"), "Fair Value Measurement." ASU 2018-13 includes new, eliminated, and modified disclosure requirements for ASC 820. In addition, ASU 2018-13 clarifies that materiality is an appropriate consideration of entities when evaluating disclosure requirements. ASU 2018-13 is effective for all entities for fiscal years beginning after December 15, 2019, including interim periods therein. Early adoption is permitted and the Fund has adopted ASU 2018-13 with these financial statements.
101
Note 10
Events Subsequent to the Fiscal Period End
The Funds have adopted financial reporting rules regarding a subsequent event which requires an entity to recognize in the financial statements the effects of all subsequent events that provide additional evidence about conditions that existed at the date of the balance sheet. Management has evaluated the Funds' related events and transactions and has determined that there were no events or transactions that occurred that would materially impact the amounts or disclosures in the Funds' financial statements.
102
REPORT OF INDEPENDENT REGISTERED
PUBLIC ACCOUNTING FIRM
To the Shareholders and Board of Trustees
of Guinness Atkinson Funds
Opinion on the Financial Statements
We have audited the accompanying statements of assets and liabilities of Alternative Energy Fund, Asia Focus Fund, Asia Pacific Dividend Builder Fund, China & Hong Kong Fund, Global Energy Fund, Global Innovators Fund, Renminbi Yuan & Bond Fund and Dividend Builder Fund (the "Funds"), each a series of Guinness Atkinson Funds (the "Trust"), including the schedules of investments, as of December 31, 2018, the related statements of operations for the year then ended, the statements of changes in net assets for each of the two years in the period then ended, and financial highlights for each of the five years in the period then ended, and the related notes (collectively referred to as the "financial statements"). In our opinion, the financial statements present fairly, in all material respects, the financial position of the Funds as of December 31, 2018, the results of their operations for the year then ended, the changes in their net assets for each of the two years in the period then ended, and their financial highlights for each of the five years in the period then ended, in conformity with accounting principles generally accepted in the United States of America.
Basis for Opinion
These financial statements are the responsibility of the Funds' management. Our responsibility is to express an opinion on the Funds' financial statements based on our audits. We are a public accounting firm registered with the Public Company Accounting Oversight Board (United States) ("PCAOB") and are required to be independent with respect to the Funds in accordance with the U.S. federal securities laws and the applicable rules and regulations of the Securities and Exchange Commission and the PCAOB. We have served as the auditor of one or more of the funds in the Trust since 2003.
We conducted our audits in accordance with the standards of the PCAOB. Those standards require that we plan and perform the audits to obtain reasonable assurance about whether the financial statements are free of material misstatement, whether due to error or fraud. The Funds are not required to have, nor were we engaged to perform, an audit of the Funds' internal control over financial reporting. As part of our audits we are required to obtain an understanding of internal control over financial reporting, but not for the purpose of expressing an opinion on the effectiveness of the Funds' internal control over financial reporting. Accordingly, we express no such opinion.
Our audits included performing procedures to assess the risks of material misstatement of the financial statements, whether due to error or fraud, and performing procedures that respond to those risks. Such procedures included examining, on a test basis, evidence regarding the amounts and disclosures in the financial statements. Our audits also included evaluating the accounting principles used and significant estimates made by management, as well as evaluating the overall presentation of the financial statements. Our procedures included confirmation of securities owned as of December 31, 2018 by correspondence with the custodian and brokers; when replies were not received from brokers, we performed other auditing procedures. We believe that our audits provide a reasonable basis for our opinion.
TAIT, WELLER & BAKER LLP
Philadelphia, Pennsylvania
February 26, 2019
103
Additional Information (Unaudited)
Proxy Voting Procedures
The Advisor votes proxies relating to portfolio securities in accordance with procedures that have been approved by the Board. You may obtain a description of these procedures, free of charge, by calling "toll-free" (800) 915-6565. This information is also available through the Securities and Exchange Commission's website at www.sec.gov.
Proxy Voting Records
Information regarding how the Advisor voted proxies relating to portfolio securities during the latest 12-month period ended June 30 is available, without charge, by calling toll-free, (800) 915-6565. This information is also available through the Securities and Exchange Commission's website at www.sec.gov.
Form N-Q Disclosure
The Funds file their complete schedule of portfolio holdings with the Securities and Exchange Commission for the first and third quarters of each fiscal year on Form N-Q. The Funds' Form N-Q is available on the Securities and Exchange Commission's website at www.sec.gov. The Funds' Form N-Q may be reviewed and copied at the Commission's Public Reference Room in Washington, DC, and information on the operation of the Public Reference Room may be obtained by calling (800) SEC-0330. This information is also available, without charge, by calling toll-free, (800) 915-6565.
Householding Mailings
To reduce expenses, the Trust may mail only one copy of Funds' prospectus and each annual and semi-annual report to those addresses shared by two or more accounts. If you wish to receive individual copies of these documents, please call us at (800) 915-6565 (or contact your financial institution). The Trust will be sending you individual copies thirty days after receiving your request.
Supplemental Tax Information
For the year ended December 31, 2018, certain dividends paid by the Funds may be subject to a maximum tax rate of 15%, as provided for by the Jobs and Growth Tax Relief Reconciliation Act of 2003. The percentage of dividends declared from ordinary income designated as qualified dividend income was as follows:
Alternative Energy Fund | | | 100 | % | |
Asia Focus Fund | | | 100 | % | |
Asia Pacific Dividend Builder Fund | | | 92 | % | |
China & Hong Kong Fund | | | 100 | % | |
Dividend Builder Fund | | | 100 | % | |
Global Energy Fund | | | 100 | % | |
Global Innovators Fund | | | 100 | % | |
Renminbi Yuan & Bond Fund | | | N/A | | |
For the year ended December 31, 2018, pursuant to Section 853(b)(3) of the Internal Revenue Code, the Asia Focus Fund, China & Hong Kong Fund and the Global Innovators Fund designates $1,016,471, $5,605,914 and $11,477,285 respectively, as long-term capital gains.
104
Pursuant to Section 853 of the Internal Revenue Code of 1986, as amended, the Funds designate the following income earned from foreign sources and foreign taxes paid for the year ended December 31, 2018:
| | | Foreign Sourced Income | | Foreign Taxes Paid | |
| | | Total
Amount | | Per Share
Amount | | Total
Amount | | Per Share
Amount | |
Alternative Energy Fund | | $ | 168,254 | | | $ | 0.05 | | | $ | 9,804 | | | $ | 0.03 | | |
| Asia Focus Fund | | | 613,903 | | | | 0.68 | | | | 62,328 | | | | 0.07 | | |
| Asia Pacific Dividend Builder Fund | | | 248,500 | | | | 0.85 | | | | 19,580 | | | | 0.07 | | |
| China & Hong Kong Fund | | | 1,950,999 | | | | 0.65 | | | | 79,621 | | | | 0.03 | | |
| Dividend Builder Fund | | | 202,339 | | | | 0.40 | | | | 15,576 | | | | 0.03 | | |
| Global Energy Fund | | | 581,729 | | | | 0.54 | | | | 77,856 | | | | 0.07 | | |
Global Innovators Fund | | | N/A | | | | N/A | | | | N/A | | | | N/A | | |
Renminbi Yuan & Bond Fund | | | N/A | | | | N/A | | | | N/A | | | | N/A | | |
105
TRUSTEE AND OFFICER INFORMATION (Unaudited)
Unless otherwise noted, each Trustee and officer's address is 225 South Lake Avenue, Suite 216, Pasadena, California 91101. Trustees and officers of the Trust serve until their resignation, removal or retirement. Additional information about the Trustees is included in the Funds' Statement of Additional Information which is available, without charge, upon request by calling toll-free, 1-800-915-6565 or by visiting the Funds' website at www.gafunds.com.
| Name and Age | | Position(s)
Held with
Trust† | | Year Elected | | Principal Occupation(s) During the
Past 5 Years | | Number of
Portfolios In
Fund Complex
Overseen by
Trustee | | Other Directorships
Held by Trustee
During the Past 5 Years | |
Non-Interested Trustees | |
Dr. Gunter Dufey
(78) | | Trustee | | | 1994 | | | Executive Director of Education Exchange Ltd., a consulting firm since 2010. Professorial Fellow, Nanyang Technological University (Singapore) since 2005. Professor (Emeritus) of Ross School at The University of Michigan, where he served from 1968 to 2002. | | | 8 | | | None | |
James I. Fordwood
(71) | | Trustee | | | 1994 | | | CFO and Managing Member of Prima Marketing LLC (network of convenience stores) since 1998; President, Balmacara Production Inc. since 1986 (holding company); Treasurer, Inverness21 LLC (owns and operates office buildings) since 2007; Treasurer, JL Energy Inc. (holding company) since 1985; Treasurer, Thistle, Inc. (seismic data management) since 1984. | | | 8 | | | None | |
Dr. Bret A. Herscher
(60) | | Trustee | | | 1994 | | | Vice President of Minnow Medical, a company that develops medical devices for treating peripheral artery disease since 2009. President of Pacific Consultants, a technical and technology management consulting company serving the electronic industry and venture capital community that he co-founded, from 1996 to 2007. | | | 8 | | | None | |
106
| Name and Age | | Position(s)
Held with
Trust† | | Year Elected | | Principal Occupation(s) During the
Past 5 Years | | Number of
Portfolios In
Fund Complex
Overseen by
Trustee | | Other Directorships
Held by Trustee
During the Past 5 Years | |
J. Brooks Reece, Jr.
(71) | | Trustee and Chairman | | | 1994 | | | Retired; CEO, Adcole Corp., a manufacturer of precision measuring machines and sun angle sensors for space satellites, from 1984 to 2017. | | | 8 | | | | None | | |
Susan Penry-Williams
(73) | | Trustee | | | 2016 | | | Retired; Partner Kramer Levin Naftalis & Frankel LLP, from 1994 to 2014. | | | 8 | | | | None | | |
Interested Trustee | | | | | | | | | | | | | | | | | | | | | |
Timothy W.N. Guinness*
14 Queen Anne's Gate
London,
England SW1H 9AA
U.K.
(70) | | Trustee | | | 1998 | | | Chairman/CIO of Guinness AtkinsonTM Asset Management since November 2002. Chairman of Guinness Asset Management Ltd., investment advisor in London, since 2003. Director of Guinness Capital Management Ltd. since 2010. Director of SR Europe Investment Trust Plc since 2001. Director of Atlantis Japan Growth Fund Ltd., since 2002. Non-Executive Director of Quayle Munro since 2007. Non-Executive Director of Brompton Bicycle Ltd., since 2000. | | | 8 | | | | None | | |
Officers | | | | | | | | | | | | | | | | | | | | | |
James Atkinson
(61) | | President | | | 2003 | | | Chief Executive Officer and Director of Guinness AtkinsonTM Asset Management since November 2002. Director of Guinness Asset Management Ltd. since 2003. Principal of Orbis Marketing, a mutual fund marketing and advertising firm, since November 2001. | | | N/A | | | | N/A | | |
* "Interested person" (as defined in the 1940 Act) of the Funds because of his affiliation with the Funds' Advisor, Guinness Atkinson Asset Management, Inc.
107
| Name and Age | | Position(s)
Held with
Trust† | | Year Elected | | Principal Occupation(s) During the
Past 5 Years | | Number of
Portfolios In
Fund Complex
Overseen by
Trustee | | Other Directorships
Held by Trustee
During the Past 5 Years | |
Patrick Keniston
(54) | | Chief Compliance Officer | | | 2014 | | | Managing Director, Foreside Fund Officer Services, LLC since October 2008. | | N/A | | N/A | |
Rita Dam
(52) | | Treasurer | | | 2009 | | | Co-Chief Executive Officer (2016-present), and Vice President, Mutual Fund Administration, LLC (2006-2015). Co-President (2018-present), Foothill Capital Management, LLC, a registered investment advisor. | | N/A | | N/A | |
Joy Ausili
(52) | | Secretary and Assistant Treasurer | | | 2009 | | | Co-Chief Executive Officer (2016-present), and Vice President, Mutual Fund Administration, LLC (2006-2015). Co-President (2018-present), Foothill Capital Management, LLC, a registered investment advisor. | | N/A | | N/A | |
Sardjono Kadiman
(43) | | Assistant Treasurer | | | 2009 | | | Managing Director (2018-present), and Vice President, Mutual Fund Administration, LLC (2008-2017). | | N/A | | N/A | |
Lyna Phan
(43) | | Assistant Treasurer | | | 2011 | | | Managing Director (2018-present), and Vice President, Mutual Fund Administration, LLC (2010-2017). | | N/A | | N/A | |
108
Privacy Notice
Guinness AtkinsonTM Funds and Guinness Atkinson Asset Management, Inc. may collect non-public information about you from the following sources:
• Information we receive about you on applications or other forms;
• Information you give us orally; and
• Information about your transactions with us.
We do not disclose any non-public personal information about our shareholders or former shareholders without the shareholder's authorization, except as required by law or in response to inquiries from governmental authorities. We restrict access to your personal and account information to those employees who need to know that information to provide products and services to you. We also may disclose that information to unaffiliated third parties (such as to brokers or custodians) only as permitted by law and only as needed for us to provide agreed services to you. We maintain physical, electronic and procedural safeguards to guard your non-public personal information.
109
Guinness AtkinsonTM Funds Information
Board of Trustees
J. Brooks Reece, Jr., Chairman | |
Dr. Gunter Dufey | |
James I. Fordwood | |
Timothy W.N. Guinness | |
Dr. Bret A. Herscher | |
Susan Penry-Williams | |
Contact Guinness AtkinsonTM Funds
P.O. Box 701 | |
Milwaukee, WI 53201-0701 | |
Shareholder Services: 800-915-6566 | |
Literature Request: 800-915-6565 | |
Website: www.gafunds.com | |
Email: mail@gafunds.com | |
Guinness AtkinsonTM Funds
Fund | | Cusip | | Ticker | | Fund# | |
Alternative Energy Fund | | | 402031 50 4 | | | GAAEX | | | 1298 | | |
Asia Focus Fund | | | 402031 10 8 | | | IASMX | | | 1096 | | |
Asia Pacific Dividend Builder Fund | | | 402031 60 3 | | | GAADX | | | 1299 | | |
China & Hong Kong Fund | | | 402031 20 7 | | | ICHKX | | | 1094 | | |
Dividend Builder Fund | | | 402031 80 1 | | | GAINX | | | 1092 | | |
Global Energy Fund | | | 402031 40 5 | | | GAGEX | | | 1098 | | |
Global Innovators Fund Investor Class | | | 402031 30 6 | | | IWIRX | | | 1095 | | |
Global Innovators Fund Institutional Class | | | 402031 88 4 | | | GINNX | | | 5323 | | |
Renminbi Yuan & Bond Fund | | | 402031 70 2 | | | GARBX | | | 1099 | | |
Distributed by Foreside Fund Services, LLC, Three Canal Plaza, Suite 100, Portland, ME 04101
This report is intended for shareholders of the Guinness AtkinsonTM Funds and may not be used as literature unless preceded or accompanied by a current prospectus.
110
This page is Intentionally Left Blank
111
Guinness Atkinson Funds
c/o U.S. Bancorp Fund Services, LLC
P.O. Box 701
Milwaukee, WI 53201-0701
Item 2. Code of Ethics.
The registrant has adopted a code of ethics that applies to the registrant’s principal executive officer and principal financial officer. The registrant has not made any amendments to its code of ethics during the period covered by this report. The registrant has not granted any waivers from any provisions of the code of ethics during the period covered by this report.
The registrant undertakes to provide to any person without charge, upon request, a copy of its code of ethics by mail when they call the registrant at 1-800-915-6565.
Item 3. Audit Committee Financial Expert.
The registrant’s board of trustees has determined that there is at least one audit committee financial expert serving on its audit committee. James I. Fordwood is the “audit committee financial expert” and is considered to be “independent” as each term is defined in Item 3 of Form N-CSR.
Item 4. Principal Accountant Fees and Services.
The registrant has engaged its principal accountant to perform audit services, audit-related services, tax services and other services during the past two fiscal years. “Audit services” refer to performing an audit of the registrant’s annual financial statements or services that are normally provided by the accountant in connection with statutory and regulatory filings or engagements for those fiscal years. “Audit-related services” refer to the assurance and related services by the principal accountant that are reasonably related to the performance of the audit. “Tax services” refer to professional services rendered by the principal accountant for tax compliance, tax advice, and tax planning. There were no “other services” provided by the principal accountant. The following table details the aggregate fees billed or expected to be billed for each of the last two fiscal years for audit fees, audit-related fees, tax fees and other fees by the principal accountant.
| | FYE 12/31/2018 | | FYE 12/31/2017 | |
Audit Fees | | $ | 129,500 | | $ | 140,900 | |
Audit-Related Fees | | N/A | | N/A | |
Tax Fees | | $ | 24,000 | | $ | 25,600 | |
All Other Fees | | N/A | | N/A | |
The audit committee has adopted pre-approval policies and procedures that require the audit committee to pre-approve all audit and non-audit services of the registrant, including services provided to any entity affiliated with the registrant.
The percentage of fees billed by Tait, Weller, & Baker LLP applicable to non-audit services pursuant to waiver of pre-approval requirement were as follows:
| | FYE 12/31/2018 | | FYE 12/31/2017 | |
Audit-Related Fees | | 0 | % | 0 | % |
Tax Fees | | 0 | % | 0 | % |
All Other Fees | | 0 | % | 0 | % |
All of the principal accountant’s hours spent on auditing the registrant’s financial statements were attributed to work performed by full-time permanent employees of the principal accountant.
The following table indicates the non-audit fees billed or expected to be billed by the registrant’s accountant for services to the registrant and to the registrant’s investment adviser (and any other controlling entity, etc.—not sub-adviser) for the last two years. The audit committee of the Board of Trustees has considered whether the provision of non-audit services that were rendered to the registrant’s investment adviser is compatible with maintaining the principal accountant’s independence and has concluded that the provision of such non-audit services by the accountant has not compromised the accountant’s independence.
Non-Audit Related Fees | | FYE 12/31/2018 | | FYE 12/31/2017 | |
Registrant | | N/A | | N/A | |
Registrant’s Investment Advisor | | N/A | | N/A | |
Item 5. Audit Committee of Listed Registrants.
Not applicable to registrants who are not listed issuers (as defined in Rule 10A-3 under the Securities Exchange Act of 1934).
Item 6. Schedule of Investments.
(a) Schedule of Investments is included as part of the report to shareholders filed under Item 1 of this Form.
(b) Not Applicable.
Item 7. Disclosure of Proxy Voting Policies and Procedures for Closed-End Management Investment Companies.
Not Applicable.
Item 8. Portfolio Managers of Closed-End Management Investment Companies.
Not Applicable.
Item 9. Purchases of Equity Securities by Closed-End Management Investment Company and Affiliated Purchasers.
Not Applicable.
Item 10. Submission of Matters to a Vote of Security Holders.
The registrant has not made any material changes to the procedures by which shareholders may recommend nominees to the registrant’s Board of Trustees.
Item 11. Controls and Procedures.
(a) The registrant’s principal executive officer and principal financial officer have evaluated the registrant’s disclosure controls and procedures within 90 days of this filing and have concluded based on such evaluation that the registrant’s disclosure controls and procedures were effective, as of that
date, in ensuring that information required to be disclosed by the registrant in this Form N-CSR was recorded, processed, summarized, and reported within the time periods specified in the Securities and Exchange Commission’s rules and forms.
(b) There were no changes in the registrant’s internal control over financial reporting (as defined in Rule 30a-3(d) under the Investment Company Act of 1940) that occurred during the registrant’s last fiscal quarter that have materially affected, or are reasonably likely to materially affect, the registrant’s internal control over financial reporting.
Item 12. Disclosure of Securities Lending Activities for Closed-End Management Investment Companies.
Not applicable to open-end investment companies.
Item 13. Exhibits.
(a) (1) Any code of ethics or amendment thereto, that is subject of the disclosure required by Item 2, to the extent that the registrant intends to satisfy Item 2 requirements through filing an exhibit. Incorporated by reference to the Registrant’s Form N-CSR filed March 10, 2011.
(b)
(2) Certifications pursuant to Section 302 of the Sarbanes-Oxley Act of 2002. Filed herewith.
(3) Any written solicitation to purchase securities under Rule 23c-1 under the Act sent or given during the period covered by the report by or on behalf of the registrant to 10 or more persons. Not applicable to open-end investment companies.
(c) Certification pursuant to Section 906 of the Sarbanes-Oxley Act of 2002. Filed herewith.
SIGNATURES
Pursuant to the requirements of the Securities Exchange Act of 1934 and the Investment Company Act of 1940, the registrant has duly caused this report to be signed on its behalf by the undersigned, thereunto duly authorized.
(Registrant) Guinness Atkinson Funds | |
| | |
By | /s/ James J. Atkinson | |
Name: | James J. Atkinson | |
Title: | President | |
Date: | 3/11/19 | |
Pursuant to the requirements of the Securities Exchange Act of 1934 and the Investment Company Act of 1940, this report has been signed by the following persons on behalf of the registrant and in the capacities and on the dates indicated.
By | /s/ James J. Atkinson | |
Name: | James J. Atkinson | |
Title: | President | |
Date: | 3/11/19 | |
| |
By | /s/ Rita Dam | |
Name: | Rita Dam | |
Title: | Treasurer | |
Date: | 3/11/19 | |