UNITED STATES
SECURITIES AND EXCHANGE COMMISSION
Washington, D.C. 20549
FORM N-CSR
CERTIFIED SHAREHOLDER REPORT OF REGISTERED MANAGEMENT
INVESTMENT COMPANIES
Investment Company Act file number 811-08360
GUINNESS ATKINSON FUNDS
(Exact name of registrant as specified in charter)
251 South Lake Avenue, Suite 800
Pasadena, CA 91101
(Address of principal executive offices) (Zip code)
(Name and address of agent for service)
James J. Atkinson, Jr.
251 South Lake Avenue, Suite 800
Pasadena, CA 91101
Registrant’s telephone number, including area code: (800-915-6566)
Date of fiscal year end: December 31
Date of reporting period: December 31, 2021
Item 1. Reports to Stockholders.
The registrant’s annual report transmitted to shareholders pursuant to Rule 30e-1 under the Investment Company Act of 1940, as amended (the “Investment Company Act”), is as follows:

Guinness Atkinson™ Funds
Annual Report
December 31, 2021
TABLE OF CONTENTS
| 3 | | Letter to Shareholders |
| 6 | | Expense Examples |
| 8 | | Alternative Energy Fund |
| 20 | | Asia Focus Fund |
| 22 | | China & Hong Kong Fund |
| 40 | | Global Energy Fund |
| 51 | | Global Innovators Fund |
| 60 | | Renminbi Yuan & Bond Fund |
| 66 | | Statements of Assets and Liabilities |
| 68 | | Statements of Operations |
| 70 | | Statements of Changes in Net Assets |
| 75 | | Financial Highlights |
| 82 | | Notes to Financial Statements |
| 93 | | Report of Independent Registered Public Accounting Firm |
| 96 | | Liquidity Risk Management Program |
| 97 | | Trustee and Officer Information |
| 99 | | Privacy Notice |
| 100 | | Guinness Atkinson Funds Information |
Dear Guinness Atkinson Funds Shareholders,
Like everyone else, we’re waiting for things to return to normal. Whatever that is. It’s difficult to argue that the world has changed dramatically in the last few years, but in fact, it’s been experiencing dramatic change for the last several decades. Although we won’t argue the point that it has really seen dramatic change in the last 24 plus months. Despite the upheaval, the markets delivered solid returns.
The year was another good one for most of the Guinness Atkinson Funds. Of the six GA Funds, four produced positive returns for the year with the Global Energy Fund leading the way with a 45.98% total return for the 12 months ending December 31, 2021.
The Global Innovators Fund enjoyed another good year with the Investor Class return of 21.52% and the Institutional Class returning 21.86% for the year.
The Alternative Energy Fund returned 8.40% for the year while the Renminbi Yuan & Bond Fund provided a total return of 3.00%.
The two GA Funds that experienced negative returns for the year are the Asia Focus Fund, down 6.32% and the China & Hong Kong Fund which was down 6.70%.
Two of the Guinness Atkinson Funds converted to exchange traded funds (ETFs) during the year. The Dividend Builder Fund is now the SmartETFs Dividend Builder ETF (DIVS) and the Asia Pacific Dividend Builder Fund is now the SmartETFs Asia Pacific Dividend Builder ETF (ADIV). These two Funds are still part of the Guinness Atkinson Funds Trust and are still managed by Guinness Atkinson.
We encourage you to check out SmartETFs. In addition to DIVS and ADIV, SmartETFs includes the SmartETFs Smart Transportation & Technology ETF (MOTO), SmartETFs Sustainable Energy II ETF (SOLR, a twin of the Alternative Energy Fund) and SmartETFs Advertising & Marketing Technology ETF (MRAD). For more information, please visit www.smartetfs.com.
Consider the investment objectives, risks, charges and expenses of the Fund carefully before investing. For a prospectus or summary prospectus with this and other information, please call (866) 307-5990 or visit our website at www.SmartETFs.com. Read the prospectus or summary prospectus carefully before investing.
Investing involves risk including the loss of principal.
Shares of ETFs are bought and sold at market price (not NAV) and are not individually redeemed from the Fund. Brokerage commissions will reduce returns.
Shares of the SmartETFs Funds are distributed by Foreside Fund Services, LLC.
Throughout this report are detailed commentaries on each of the Guinness Atkinson Funds prepared by our portfolio managers.
As usual, we appreciate the confidence you have placed in us and our management team and look ahead to what we hope is a great 2022.
We encourage you to visit gafunds.com for the latest news and announcements on the Guinness Atkinson Funds.
Sincerely,
| Timothy Guinness | James Atkinson |
The table below provides total return data for each of the Funds over the one, three, five, ten-year and since inception periods through December 31, 2021. Also included in the table is the expense ratio data from the most recent prospectus dated May 1, 2021.
| Fund (inception date) | 1-year | 3-year | 5-year | 10-year | Since Inception | Expense Ratio |
Alternative Energy Fund (March 31, 2006) | 8.40% | 38.06% | 21.83% | 8.75% | -3.03% | 2.46% gross; 1.98% net |
Asia Focus Fund (April 29, 1996) | -6.32% | 15.08% | 12.27% | 6.19% | 4.03% | 2.21% gross; 1.98% net |
China & Hong Kong Fund (June 30, 1994) | -6.70% | 11.58% | 10.53% | 6.48% | 7.06% | 1.60% |
Global Energy Fund (June 30, 2004) | 45.98% | 1.97% | -3.19% | -2.00% | 4.32% | 2.56% gross; 1.46% net |
Global Innovators Fund Investor Class (December 15, 1998) | 21.52% | 31.36% | 20.51% | 18.13% | 9.74% | 1.24% gross; 1.24% net |
Global Innovators Fund Institutional Class (December 31, 2015) | 21.86% | 31.69% | 20.81% | 18.31% | 9.81% | 1.07% gross; 0.99% net |
Renminbi Yuan & Bond Fund (June 30, 2011) | 3.00% | 5.16% | 4.56% | 2.28% | 2.19% | 5.26% gross; 0.91% net |
Periods of greater than one year are average annualized returns; one year and shorter period returns are actual returns. All returns are for the periods ending December 31, 2021.
Performance data shown for the Global Innovators, Institutional Class (GINNX), prior to its launch date on December 31, 2015, uses performance data from the Global Innovators, Investor Class (IWIRX).
Performance data quoted represents past performance and does not guarantee future results. The investment return and principal value of an investment will fluctuate so that an investor’s shares, when redeemed, may be worth more or less than the original cost. Current performance of the Funds may be lower or higher than the performance quoted. Performance data current to the most recent month end may be obtained by visiting www.gafunds.com.
Each of the Asia Focus Fund, t, the China & Hong Kong Fund, and the Renminbi Yuan & Bond Fund imposes a 2% redemption fee on shares held less than 30 days. Performance data quoted does not reflect this fee. If it had, total return would be lower.
Expense ratios are from the most recent prospectus (dated May 1, 2021) and are from the most recent audited financials (period ending December 31, 2020) at the time that prospectus was completed.
The Adviser has contractually agreed to reduce its fees and/or pay Fund expenses in order to limit the Fund’s Total Annual Operating Expenses to through June 30,2025. Total returns reflect a fee waiver in effect & in the absence of this waiver, the total returns would be lower.
Morningstar Ratings Through December 31, 2021
| Fund | Category | Overall | 3-Year | 5-Year | 10-Year |
| Alternative Energy | Foreign Small/Mid Value | 3 ««« (139 funds) | 5 «««««
(139 funds) | 4 «««« (105 funds) | 1 « (70 funds) |
| Asia Focus | Pacific/Asia ex-Japan | 2 «« (52 funds) | 3 ««« (52 funds) | 3 ««« (45 funds) | 1 « (32 funds) |
| China & Hong Kong | China Region | 3 ««« (95 funds) | 3 ««« (95 funds) | 3 ««« (72 funds) | 3 ««« (53 funds) |
| Global Energy | Energy Equity | 4 «««« (69 funds) | 4 «««« (66 funds) | 4 «««« (68 funds) | 3 ««« (51 funds) |
| Global Innovators Investor Class | Large Growth | 3 ««« (1,116 funds) | 3 ««« (1,116 funds) | 2 «« (1,012 funds) | 3 ««« (768 funds) |
| Global Innovators Institutional Class | Large Growth | 3 ««« (1,116 funds) | 3 ««« (1,116 funds) | 2 «« (1,012 funds) | 3 ««« (768 funds) |
| Renminbi Yuan & Bond | Emerging Markets Local Currency Bond | 5 ««««« (73 funds) | 5 ««««« (73 funds) | 5 ««««« (69 funds) | 5 ««««« (52 funds) |
Morningstar Ratings Disclosure
Global Innovators Fund ratings shown were given for the Investor Share Class.
For each fund with at least a three-year history, Morningstar calculates a Morningstar Rating™ based on a Morningstar Risk-Adjusted Return measure that accounts for variation in a fund’s monthly performance (including the effects of sales charges, loads, and redemption fees), placing more emphasis on downward variations and rewarding consistent performance. The top 10% of funds in each category receive 5 stars, the next 22.5% receive 4 stars, the next 35% receive 3 stars, the next 22.5% receive 2 stars and the bottom 10% receive 1 star. (Each share class is counted as a fraction of one fund within this scale and rated separately, which may cause slight variations in distribution percentages.)
© 2022 Morningstar, Inc. All Rights Reserved. The information contained herein (1) is proprietary to Morningstar (2) may not be copied or distributed and (3) is not warranted to be accurate, complete or timely. Neither Morningstar nor its content providers are responsible for any damages or losses arising from any use of this information.
GUINNESS ATKINSON FUNDS
Expense Examples (Unaudited)
As a shareholder of the Funds, you incur two types of costs: (1) redemption fees (applicable to the Asia Focus Fund, the Asia Pacific Dividend Builder Fund, the China & Hong Kong Fund, and the Renminbi Yuan & Bond Fund); and (2) ongoing costs, including advisory fees and other Fund expenses. The examples below are intended to help you understand your ongoing costs (in dollars) of investing in the Funds and to compare these costs with the ongoing costs of investing in other mutual funds.
The examples are based on an investment of $1,000 invested at the beginning of the period shown and held for the entire period from July 1, 2021 to December 31, 2021.
Actual Expenses
For each Fund, the first line of the table below provides information about actual account values and actual expenses. You may use the information in this line, together with the amount you invested, to estimate the expenses that you paid over the period. Simply divide your account value by $1,000 (for example, an $8,600 account value divided by $1,000 = 8.6), then multiply the result by the number in the first line under the heading entitled “Expenses Paid during Period” to estimate the expenses you paid on your account during this period.
Hypothetical Example for Comparison Purposes
For each Fund, the second line of the table below provides information about hypothetical account values and hypothetical expenses based on the Fund’s actual expense ratios and an assumed rate of return of 5% per year before expenses, which is not the Fund’s actual return. The hypothetical account values and expenses may not be used to estimate the actual ending account balance or expenses you paid for the period. You may use this information to compare the ongoing costs of investing in the Fund and other funds. To do so, compare this 5% hypothetical example with the 5% hypothetical examples that appear in the shareholder reports of the other funds.
Please note that the expenses shown in the table are meant to highlight your ongoing costs only and do not reflect any redemption fees. Therefore, the second line for each Fund of the table is useful in comparing ongoing costs only and will not help you determine the relative total costs of owning different funds. In addition, if these redemption fees were included, your costs would have been higher.
| | | Beginning Account Value (07/01/21) | | | Ending Account Value (12/31/21) | | | Expenses Paid During Period* (07/01/21 to 12/31/21) | | | Expense Ratios During Period* (07/01/21 to 12/31/21) | |
| Guinness Atkinson Alternative Energy Fund Actual | | $ | 1,000.00 | | | $ | 1,024.40 | | | $ | 10.10 | | | | 1.98 | %† |
| Guinness Atkinson Alternative Energy Fund Hypothetical (5% return before expenses) | | $ | 1,000.00 | | | $ | 1,015.22 | | | $ | 10.06 | | | | 1.98 | %† |
| Guinness Atkinson Asia Focus Fund Actual | | $ | 1,000.00 | | | $ | 909.90 | | | $ | 9.53 | | | | 1.98 | %† |
| Guinness Atkinson Asia Focus Fund Hypothetical (5% return before expenses) | | $ | 1,000.00 | | | $ | 1,015.22 | | | $ | 10.06 | | | | 1.98 | %† |
| Guinness Atkinson China & Hong Kong Fund Actual | | $ | 1,000.00 | | | $ | 893.70 | | | $ | 7.16 | | | | 1.49 | % |
| Guinness Atkinson China & Hong Kong Fund Hypothetical (5% return before expenses) | | $ | 1,000.00 | | | $ | 1,017.64 | | | $ | 7.63 | | | | 1.49 | % |
| Guinness Atkinson Global Energy Fund Actual | | $ | 1,000.00 | | | $ | 1,077.80 | | | $ | 7.65 | | | | 1.46 | %† |
| Guinness Atkinson Global Energy Fund Hypothetical (5% return before expenses) | | $ | 1,000.00 | | | $ | 1,017.85 | | | $ | 7.43 | | | | 1.45 | %† |
| Guinness Atkinson Global Innovators Fund – Investor Class Actual | | $ | 1,000.00 | | | $ | 1,062.20 | | | $ | 6.45 | | | | 1.24 | %† |
| Guinness Atkinson Global Innovators Fund – Investor Class Hypothetical (5% return before expenses) | | $ | 1,000.00 | | | $ | 1,018.95 | | | $ | 6.31 | | | | 1.24 | %† |
| Guinness Atkinson Global Innovators Fund – Institutional Class Actual | | $ | 1,000.00 | | | $ | 1,063.80 | | | $ | 5.15 | | | | 0.99 | %† |
| Guinness Atkinson Global Innovators Fund – Institutional Class Hypothetical (5% return before expenses) | | $ | 1,000.00 | | | $ | 1,020.21 | | | $ | 5.04 | | | | 0.99 | %† |
| Guinness Atkinson Renminbi Yuan & Bond Fund Actual | | $ | 1,000.00 | | | $ | 1,012.10 | | | $ | 4.56 | | | | 0.90 | %† |
| Guinness Atkinson Renminbi Yuan & Bond Fund Hypothetical (5% return before expenses) | | $ | 1,000.00 | | | $ | 1,020.67 | | | $ | 4.58 | | | | 0.90 | %† |
GUINNESS ATKINSON FUNDS
Expense Examples (Unaudited)
| * | Expenses are equal to the Funds’ annualized expense ratio as indicated, multiplied by the average account value over the period, multiplied by the number of days in most recent fiscal half-year period (184), then divided by the number of days in the fiscal year (365) (to reflect the one-half year period). |
| † | Net of fee waivers and expenses absorbed/recaptured. If those fee waivers and expenses absorbed/recaptured had not been in effect, the Fund’s actual expenses would have been higher/lower. |
GUINNESS ATKINSON ALTERNATIVE ENERGY FUND
ANNUAL REPORT FOR THE PERIOD ENDED
DECEMBER 31, 2021
| Average annualized Total returns | 1 Year | 3 Years | 5 Years | 10 Years |
| Fund | 8.40% | 38.06% | 21.83% | 8.75% |
| Benchmark Index: | | | | |
| MSCI World Index (Net Return) | 21.82% | 21.68% | 15.01% | 12.68% |
Gross 2.46% & Net 1.98%. The Adviser has contractually agreed to reduce its fees and/or pay Fund expenses in order to limit the Fund’s Total Annual Operating Expenses to 1.98% through June 30, 2025.
For the Fund’s current one-year expense ratios, please refer to the Financial Highlights section of this report.
Performance data quoted represents past performance and does not guarantee future results. The investment return and principal value of an investment in the Fund will fluctuate so that an investor's shares, when redeemed, may be worth more or less than their original cost. Current performance of the Fund may be lower or higher than the performance quoted. Performance data current to the most recent month-end may be obtained by visiting www.gafunds.com, or calling (800) 915-6565.
The Guinness Atkinson Alternative Energy Fund is positioned to benefit from the many opportunities associated with the sustainable energy transition that we have discussed. As part of our investment process, we have identified a universe of around 250 companies (market capitalisation of over USD$500m) that are most directly exposed to the theme, and classify them into the following four sub-sectors:
| · | Displacement includes companies involved in the displacement or more efficient usage of existing hydrocarbon-based energy |
| · | Electrification includes companies involved specifically in the switching of hydrocarbon-based fuel demand towards electricity, especially for electric vehicles |
| · | Generation includes companies involved in the generation of sustainable energy, either pureplay companies or those transitioning from hydrocarbon-based fuels |
| · | Installation (Equipment) includes companies involved in the manufacturing of equipment for the generation and consumption of sustainable energy |
Sustainable Energy equities delivered a positive return in 2021 with the Guinness Atkinson Alternative Energy fund delivering 8.40% return in USD terms while the MSCI World Net Return index delivered 21.82%.
The largest positive contributors to the fund in 2021 were our two Chinese generation companies (independent power producers) China Longyuan and China Suntien. At the start of the year, China Longyuan announced a corporate transaction with its parent company CNH Energy and its sister company Pingzhuang Energy that provided China Longyuan with a China A share listing while China Suntien’s share price increase reflected strong profit growth resulting from the start-up of new wind projects. Their strong performance was sustained through the third quarter of 2021 as the Chinese economy rebounded strongly and warm weather increased air conditioning demand, driving higher electricity prices and better margins for both.
Within electrification, Onsemi enjoyed numerous earnings upgrades through the year, as demand and pricing for its semiconductor products both rose. The company announced plans to prune both its revenue base and manufacturing footprint to invest in high-value, high-growth applications served by its power and sensing-biased semiconductor portfolio. Growth will be sacrificed in the 2022/2023 period while it focuses on higher margin businesses. Also within electrification, Gentherm delivered strong results and good new contract awards, including a first production vehicle award for its new “ClimateSense” product which combines several individual product lines (such as thermal products, electronics and software) into a system solution.
With displacement, Nibe Industrier was the greatest contributor, with the shares reacting to strong demand for heat pumps, solid underlying business performance and a share split that increased accessibility of its shares. Of particular note was the company’s North American Climate Solutions business returning to growth and signs that Nibe’s decentralised business model was providing good insulation against raw material cost inflation. Ameresco and Hubbell also delivered strong contribution over the year.
The equipment (installation) sector was the weakest contributor with only three companies delivering a positive contribution over the year. Of note was Schneider Electric, whose shares reacted positively to consistent improvements in business performance, and polysilicon manufacturer Daqo New Energy which delivered a significant contribution to the fund during the first quarter of the year (prior to its sale from the portfolio) as a result of strong polysilicon demand and rising polysilicon prices.
While the strongest performers came from all four sub sectors, the weaker performers came predominantly from the equipment (installation) sector. Siemens Gamesa, TPI Composites and Vestas Wind Systems suffered from slowing momentum within the near-term wind macro environment (compounded by supply chain pressures and raw material inflationary concerns) that trumped longer-term positive wind industry developments.
Other weak contributors included LG Chem whose shares were weak following a $1.9 billion product recall with GM regarding battery faults on the Chevrolet Bolt, and two generation companies, Albioma and Iberdrola, which de-rated as a result of general market concerns around rising interest rates and the risk of greater regulation to compensate for higher fossil fuel prices.
2021 individual stock contribution, in USD

source: Bloomberg, Guinness Atkinson Asset Management estimates
In terms of attribution relative to the Guinness sustainable energy universe, the fund delivered positive sector allocation and stock selection within efficiency (due to a small sector overweight and advantaged stock selection as described above); electric vehicles (due to a bias towards power semiconductors and electronics and avoidance of recently listed US Special Purpose Acquisition Companies (SPACs)); within independent power producers (IPPs) (due to exposure to Chinese wind-dominated IPPs and the avoidance of US residential solar and pure-play high-growth solar IPPs that were weaker as a result of rising interest rate concerns); and within other equipment (due to avoidance of weak hydrogen fuel cell and electrolyser companies as well as newly listed energy storage stocks).
The fund delivered negative sector allocation and stock selection within batteries (due to lack of exposure to battery raw material companies as well as pure-play cathode and anode manufacturers); and within solar and wind equipment (where we held overweight positions to sectors and manufacturing companies that suffered from raw material cost inflation and supply chain issues).
Early in the year, we sold Daqo New Energy and replaced the holding with a position in Infineon Technologies. We also added Eaton towards the end of the year.
| · | Daqo is a fast growing, low cost, China based manufacturer of polysilicon, whose shares increased by more than eight times since the start of 2019. While underlying profitability has increased at Daqo, we are concerned that the share price now fully reflects a very optimistic outlook for long term polysilicon pricing and company growth. |
| · | Infineon Technologies designs, manufactures, and markets semiconductors with a focus on the automotive, industrial power control, power management and digital security markets. Having recently acquired Cypress Semi, we believe that Infineon is very well placed to benefit from the industry’s need for greater semiconductor (especially power semiconductor) content in electric vehicles. |
| · | Eaton is a US listed, $65 billionn market capitalisation specialized producer of highly engineered products and services. These offerings are designed to solve customer pain points in vital portions of the world’s infrastructure. We believe Eaton has mostly positioned its portfolio in profitable niches that should benefit from secular trends like energy transition and electrification, to propel long-term growth. |
The sector and geographic weightings of the portfolio at December 31, 2021 were as follows:
| Sector breakdown | Dec. 31, 2021 |
| Displacement | |
| Efficiency | 11.9% |
| Electrification | |
| Battery | 8.7% |
| Electric vehicles | 24.6% |
| Generation | |
| IPP | 16.0% |
| Utility | 8.4% |
| Installation | |
| Equipment | 27.5% |
| Cash | 2.9% |
| Total | 100% |
| Geographic breakdown | Dec 31, 2021 |
| USA | 39.0% |
| China | 9.9% |
| Germany | 7.9% |
| France | 6.6% |
| Spain | 6.6% |
| South Korea | 6.0% |
| Canada | 6.0% |
| Sweden | 4.1% |
| Ireland | 4.1% |
| Denmark | 2.7% |
| UK | 2.4% |
| Israel | 1.8% |
| Cash | 2.9% |
The year of 2021 saw continued positive momentum for the energy transition. Policy commitments and investments were made to accelerate the decarbonisation of the global energy sector. Offsetting this, we saw raw material cost inflation, supply chain issues and some political tensions which have slowed the pace of growth and profitability in certain subsectors. Against this backdrop, our portfolio has seen improved cash return expectations versus twelve months ago. It continues to offer broad exposure to companies that are well placed to benefit from an energy transition that will gather pace through the remainder of this decade.
After very strong policy support in 2020, we witnessed further policy commitment in 2021. The most significant policy milestones last year included:
| · | President Biden returning the US to the Paris Agreement, and announcing significantly increased 2030 GHG reduction targets; |
| · | the influential 2021 Intergovernmental Panel on Climate Change (IPCC) climate report, which highlighted the importance and urgency of pursuing a 1.5° warming or net zero 2050 scenario; |
| · | the Conference of the Parties(COP)15 Biological Diversity Conference, at which President Xi gave more clarity on how China would meet its climate targets over the coming years, including a major expansion in solar; and |
| · | and the Conference of the Parties(COP)26 climate conference, which introduced new net zero targets, additional country pledges and some “alliances of the willing” to reduce coal usage and methane emissions. |
In addition to enhanced policy commitment, 2021 saw major steps forward for various aspects of the transition. We saw around 290 gigawatts (GW) of new renewable generation capacity installed, 10 GW higher than the record installations seen in 2020 and nearly 100 GW higher than the 194 GW installed in 2019. Solar represented nearly two-thirds of the new capacity additions, followed by wind then hydro. Renewable electricity generation increased by around 6% to over 7,900 TWh, outpacing global electricity demand growth (4.5% in 2021). Electric vehicle sales surged, reaching around 7% of global light auto sales, up from just over 3% in 2020. Sales were particularly strong in China and Europe. And investment into energy efficiency also accelerated, with building infrastructure remaining a key focus for spending.
2021 was also a year in which the complexities of a shift to a lower carbon economy become more evident.
In Europe, record natural gas prices became a major political headache, forcing governments to seek protection for consumers from the extreme price spike. On the one hand, observers could point to extraordinarily high post-pandemic power demand, plus the tactics of President Putin to withhold gas exports into Europe, as reasons for the extreme prices. But on the other hand, the spike has been driven by an attempt to shift away from carbon intensive coal usage in China, and the impact of a rapidly rising carbon price in Europe, which is affecting the behaviour of utilities.
In the US, Democratic Senator Joe Manchin has blocked the path of the “Build Back Better” (BBB) bill, a cornerstone spending plan of the current administration which includes various clean energy related provisions designed to accelerate the transition. Manchin represents West Virginia, a major coal producing state, and claims the bill will “risk the reliability of our electric grid and increase our dependence on foreign supply chains”.
After many years of consistent cost reductions, 2021 also saw the emergence of inflationary conditions and supply chain pressures across the breadth of the sustainable energy sector. Energy transition technologies and equipment are typically raw material intensive (leaving them exposed to raw material inflation) and are dominated by Chinese manufacturing (50% of all wind turbines and 70% of all solar panels are manufactured in China), leaving importers exposed to supply chain inefficiencies and higher freight costs.
Natural gas prices will moderate; there will be a resolution to Manchin’s opposition to BBB, and most areas of raw material inflation will settle down and be trumped by scale and technological improvements. But the world is waking up to the fact that although the energy transition will result in economic and environmental gains, policy decisions have the potential in the short-term to cause economic and political friction.
Against this backdrop, the Guinness Atkinson Alternative Energy Fund has seen improved cash return expectations and delivered a total return (USD) of +8.4% vs the MSCI World Index (net return) of +21.8%. Within the portfolio, outperforming sectors included Chinese wind generation, EV component suppliers, poly-silicon (for solar) and efficiency. Underperforming sectors included European green utilities, solar component manufacturers and wind developers.
Looking ahead to 2022 and beyond, we expect further acceleration of the transition:
| · | On the supply side of the energy transition, the International Energy Agency (IEA) is forecasting that renewable power additions over the coming five years will be just over 1,800 GW; a near 50% increase on its previous five-year forecast published twelve months earlier. The increase is driven by a further reduction in the levelized cost of electricity for renewables. |
| · | The IEA has described solar power as “the cheapest electricity in history” and, despite near term headwinds and cyclical cost inflationary factors, large-scale solar remains at the bottom end of the cost curve. Globally, we expect solar installations to grow in 2022 by over 20%, led by China, India, Middle East and other parts of Asia. It is likely that poly-silicon prices have peaked, bringing cost relief for cell and module manufacturers. The outlook for solar in the US this year is less certain due to various issues (stimulus spending, net metering and Chinese import issues). |
| · | Global wind installations are expected to be around flat in 2022, as changes in tax incentives, COVID-related logistics issues and raw material cost inflation are worked through. Onshore installations should pick up meaningfully in the middle of the decade, and there is clear momentum in offshore wind, albeit with a 3-4 year lead time. President Biden has recently called for the US to have 30 GW of offshore wind by 2030 (current installed base = <1 GW), which would represent a step change for the industry. |
| · | Energy efficiency will continue to receive a good proportion of post-COVID stimulus spending, with a continued focus on buildings. We expect an acceleration in the penetration of LED lighting, insulation and heat pumps, as well as a focus on grid and transmission upgrades. The IEA estimates that to meet current government policies, energy efficiency spending needs to increase from a recent average level of around $250bn per annum to around $375bn this decade and nearly $550bn in the 2030s. |
| · | EV sales should exceed 9 million in 2022, representing around 10% of total passenger vehicle sales, taking the global EV stock from 16 million vehicles to 25 million vehicles. Lower EV prices, greater brand choice and growing consumer appetite continue to be the key drivers of improved EV sales. |
| · | Battery demand for use in EVs and energy storage will accelerate in 2022. We expect new battery capacity of nearly 300 GWh to be sold this year, up by around 25% versus 2021. Raw material cost inflation will continue to have an impact in 2022, but rapidly increasingly manufacturing capacity, coupled with technological improvements, will continue to push average battery pack costs towards $100/kWh, the level at which mass market EVs become affordable. |
The outlook we summarise here is broadly consistent with current government activity and observable investment plans. To be clear, however, the growth described falls well short of the energy transition activity needed to achieve a net zero / 1.5 degree scenario in 2050, as targeted by the IPCC and at COP26. In a net zero scenario, the deployment of renewable generation capacity, penetration of EVs and battery storage, use of alternative fuels and implementation of energy efficiency measures will need to accelerate markedly.
At December 31, 2021, the Guinness Atkinson Alternative Energy Fund traded on a 2022 Price Earnings (P/E) ratio of 24.5x and 2022 Enterprise Value to Earning Before Interest, Taxes, Depreciation, and Amortization (EV/EBITDA) multiple of 13.2x. The fund trades at about a 20% premium to the MSCI World Index, which we see as justified given the attractive growth rates available to invest in across the sector. As a sense check, consensus EPS growth (2021-2023E) of the portfolio (at 21.3%pa) is well ahead of the MSCI World (at 13.5%pa). Looking over the next five years, we believe that the portfolio is likely to deliver average earnings growth.
Portfolio managers
Jonathan Waghorn and Will Riley
January 2022
The Fund invests in foreign securities, which involves political, economic and currency risks, greater volatility, and differences in accounting methods. These risks are greater for emerging markets. The Fund’s focus on the energy sector to the exclusion of other sectors exposes the Fund to greater market risk and potential monetary losses than if the Fund’s assets were diversified among various sectors. The Fund invests in smaller companies, which involves additional risks such as limited liquidity and greater volatility.
The MSCI World Index is a free float-adjusted market capitalization weighted index that is designed to measure the equity market performance of developed markets. Net Return reflects deduction for withholding tax but reflects no deduction for fees and expenses. Net Return is net of local withholding taxes that any investor would pay. This index is unmanaged, not available for investment and does not incur expenses.
P/E – Price to Earnings ratio is calculated by dividing current price of the stock by the company's trailing twelve months' earnings per share.
EV/EBITDA - The enterprise value (EV) to earnings before interest, taxes, depreciation, and amortization (EBITDA) ratio is calculated by dividing EV by EBITDA or earnings before interest, taxes, depreciation, and amortization.
Please refer to the Schedule of Investments for details on Fund holdings. Current and future portfolio holdings are subject to risk.
The information provided herein represents the opinion of Guinness Atkinson Asset Management, Inc. for the period stated and is not intended to be a forecast of future events, a guarantee of future results, or investment advice. Opinions, Fund holdings and sector allocations are subject to change at any time, and are not recommendations to buy or sell any security.
Alternative Energy Fund
Growth of $10,000 (Unaudited)

Average Annual Total Return
Periods Ended December 31, 2021
| One Year | | Five Years | | Ten Years |
| 8.40% | | 21.83% | | 8.75% |
Performance data quoted represents past performance and does not guarantee future results. The investment return and principal value of an investment will fluctuate so that an investor's shares, when redeemed, may be worth more or less than their original cost. Current performance of the Fund may be lower or higher than the performance quoted. Performance data current to the most recent month end may be obtained by visiting www.gafunds.com.
Total returns for certain periods reflect a fee waiver in effect and in the absence of this waiver, the total returns would be lower. Returns reflect the reinvestment of distributions made by the Fund, if any. The graph and the performance table above do not reflect the deduction of taxes that a shareholder would pay on Fund distribution or the redemption of Fund shares.
The Wilderhill Clean Energy Index (ECO) is a modified equal dollar weighted index comprised of publicly traded companies whose businesses stand to benefit substantially from societal transition toward the use of cleaner energy and conservation. The MSCI World Index is a free float-adjusted market capitalization weighted index that is designed to measure the equity market performance of developed markets. Net Return reflects deduction for withholding tax but reflects no deduction for fees and expenses. Net Return is net of local withholding taxes that any investor would pay.
FUND HIGHLIGHTS at December 31, 2021
GUINNESS ATKINSON ALTERNATIVE ENERGY FUND
| # of Holdings in Portfolio: | | | 31 | |
| Portfolio Turnover: | | | 29.0 | % |
| % of Stocks in Top 10: | | | 42.4 | % |
| Fund Managers: |
| Will Riley |
| Jonathan Waghorn |
| Top 10 Holdings (% of net assets) | | | |
| Nextera Energy Inc. | | | 4.5 | % |
| Schneider Electric SE | | | 4.4 | % |
| Nibe Industrier AB - B Shares | | | 4.4 | % |
| Infineon Technologies AG | | | 4.3 | % |
| ON Semiconductor Corp | | | 4.3 | % |
| Sensata Technologies Holding | | | 4.1 | % |
| China Longyuan Power Group Corp, - H Shares | | | 4.1 | % |
| Gentherm Inc. | | | 4.1 | % |
| Iberdrola SA | | | 4.1 | % |
| APTIV PLC | | | 4.1 | % |
| Geographic Breakdown (% of net assets) |
| United States | | | 38.7 | % |
| China | | | 10.4 | % |
| Spain | | | 9.8 | % |
| Germany | | | 8.4 | % |
| France | | | 7.0 | % |
| Canada | | | 6.1 | % |
| Sweden | | | 4.4 | % |
| Ireland | | | 4.1 | % |
| South Korea | | | 3.5 | % |
| Denmark | | | 2.9 | % |
| United Kingdom | | | 2.6 | % |
| Israel | | | 1.7 | % |
GUINNESS ATKINSON ALTERNATIVE ENERGY FUND
Schedule of Investments
at December 31, 2021
| Shares | | | Common Stocks: 99.6% | | Value | |
| | | | | | | |
| | | | | Electrification: 41.1% | | | | |
| | 7,930 | | | APTIV PLC | | $ | 1,308,054 | |
| | 15,150 | | | Gentherm Inc.* | | | 1,316,535 | |
| | 19,210 | | | Hella GmbH & Co. KGaA | | | 1,302,628 | |
| | 30,220 | | | Infineon Technologies AG | | | 1,401,443 | |
| | 11,950 | | | Itron Inc.* | | | 818,814 | |
| | 29,720 | | | Johnson Matthey PLC | | | 822,599 | |
| | 1,760 | | | LG Chem Ltd. | | | 910,460 | |
| | 20,370 | | | ON Semiconductor Corp.* | | | 1,383,530 | |
| | 2,070 | | | Samsung SDI Co., Ltd. | | | 1,140,472 | |
| | 7,180 | | | Schneider Electric SE | | | 1,408,834 | |
| | 21,360 | | | Sensata Technologies Holding* | | | 1,317,698 | |
| | 80,000 | | | Tianneng Power International | | | 84,653 | |
| | | | | | | | 13,215,720 | |
| | | | | | | | | |
| | | | | Energy Efficiency: 12.1% | | | | |
| | 15,460 | | | Ameresco PLC* | | | 1,259,062 | |
| | 5,900 | | | Hubbell Inc. | | | 1,228,793 | |
| | 93,140 | | | Nibe Industrier AB - B Shares | | | 1,408,146 | |
| | | | | | | | 3,896,001 | |
| | | | | | | | | |
| | | | | Renewable Energy Generation: 28.0% | | | | |
| | 21,790 | | | Albioma SA | | | 849,855 | |
| | 564,000 | | | China Longyuan Power Group Corp. - H Shares | | | 1,316,591 | |
| | 1,362,000 | | | China Suntien Green Energy Corp. Ltd. - H Shares | | | 1,062,138 | |
| | 110,450 | | | Iberdrola SA | | | 1,308,167 | |
| | 15,480 | | | Nextera Energy Inc. | | | 1,445,213 | |
| | 11,369 | | | Ormat Technologies Inc. | | | 901,562 | |
| | 38,640 | | | Siemens Gamesa Renewable Energy SA | | | 926,293 | |
| | 78,900 | | | TransAlta Renewables Inc. | | | 1,169,883 | |
| | | | | | | | 8,979,702 | |
| | | | | Renewal Equipment Manufacturing: 18.4% | | | | |
| | 25,150 | | | Canadian Solar Inc.* | | | 786,944 | |
| | 4,700 | | | Eaton Corp PLC | | | 812,254 | |
| | 3,350 | | | Enphase Energy Inc.* | | | 612,849 | |
| | 12,910 | | | First Solar Inc.* | | | 1,125,236 | |
| | 2,000 | | | Solaredge Technologies Inc.* | | | 561,140 | |
| | 14,510 | | | TPI Composites Inc.* | | | 217,070 | |
| | 30,165 | | | Vestas Wind Systems A/S | | | 922,886 | |
| | 530,200 | | | Xinyi Solar Holdings Ltd. | | | 899,024 | |
| | | | | | | | 5,937,403 | |
The accompanying notes are an integral part of these financial statements.
GUINNESS ATKINSON ALTERNATIVE ENERGY FUND
Schedule of Investments
at December 31, 2021
| Shares | | | Common Stocks: 99.6% | | Value | |
| | | | | Total Common Stocks | | $ | 32,028,826 | |
| | | | | (cost $26,882,246) | | | | |
| | | | | | | | | |
| | | | | Total Investments in Securities | | | 32,028,826 | |
| | | | | (cost $26,882,246): 99.6% | | | | |
| | | | | | | | | |
| | | | | Other Assets less Liabilities: 0.4% | | | 145,116 | |
| | | | | | | | | |
| | | | | Net Assets: 100.0% | | $ | 32,173,942 | |
| * | Non-income producing security. |
PLC - Public Limited Company
The accompanying notes are an integral part of these financial statements.
GUINNESS ATKINSON ASIA FOCUS FUND
ANNUAL REPORT FOR THE PERIOD ENDED
DECEMBER 31, 2021
| Average annualized Total returns | 1 Year | 3 Years | 5 Years | 10 Years |
| Fund | -6.32% | 15.08% | 12.27% | 6.19% |
| Benchmark Index: | | | | |
| MSCI AC Far East Free ex japan index (net return) | -8.42% | 11.29% | 10.71% | 7.63% |
(All performance data given in USD terms)
Gross 2.21% & Net 1.98%; The Adviser has contractually agreed to reduce its fees and/or pay Fund expenses in order to limit the Fund’s Total Annual Operating Expenses to 1.98% through June 30, 2025.
For the Fund’s current one-year expense ratio, please refer to the Financial Highlights section of this report.
Performance data quoted represents past performance and does not guarantee future results. The investment return and principal value of an investment in the Fund will fluctuate so that an investor's shares, when redeemed, may be worth more or less than their original cost. Current performance of the Fund may be lower or higher than the performance quoted. Performance data current to the most recent month-end may be obtained by visiting www.gafunds.com, or calling (800) 915-6565.
The Fund fell -6.32% in 2021 compared to the benchmark which fell -8.42%.
Macro challenges for all markets, Asian and Developed, have intensified in 2021. Consumer price inflation in the US has continued to climb and the market now expects that the Federal Reserve will need to raise interest rates by more than anticipated. The effect of this has been most keenly felt by growth stocks for whom rising interest rates reduce the value of future earnings in today’s money bringing stock valuations down along with it. The second set of challenges emerged during the third quarter in China with the imposition of tighter polices on the operations of the e-commerce giants and restrictions on debt accumulation by the privately-owned real estate developers. This has had a destabilising effect on investor sentiment and has sent a chill through the housing market as companies seek to raise cash to meet near-term debt obligations; however, in our view it probably contributes on balance, to the long-term stability of China’s economic growth.
The Fund, held up better than the market despite its heavy exposure to China and the consumer discretionary sector which, at the index level, were significant underperformers during the period. However, with its bias toward higher growth stocks the Fund has been affected by a rotation toward value stocks. Relative performance was undoubtedly helped by its more modest exposure (than index and peers) to Chinse e-commerce and technology names like Alibaba and Tencent. Our equal-weighting approach, in more volatile times works more in our favour. But more positively we saw positive outperformance from Chinese names like NetEase and Ping An Insurance and there strong contributions from Mainland-listed companies including Nari Technology (electricity transmission equipment), Inner Mongolia Yili (dairy), Wuxi Lead Intelligent (capital equipment for EV battery makers) and Venustech (cyber security software).
At the forefront of performance were technology manufacturers and chip designers listed in either Taiwan or the US. Broadcom designs chips and provides software services whilst Applied Materials makes and services capital equipment used by the semiconductor manufacturers. Novatek Microelectronics reported a tripling of earnings as its chip designs for screen controllers have application in handheld devices, cars, appliances and televisions. Elite Material is another success story with is specialised laminates being used not only in smartphones but now also in infrastructure equipment such as Intel’s new servers and for switches being used in data centres.
At the other end, Autohome was the weakest performer over the year. Slower car sales have reduced both advertising and commission revenues, but we have also seen competition emerge from other search engine companies like Baidu. There have been management changes to try and address the challenges and we shall look for evidence of their effectiveness in the course of 2022. Sany Heavy is a mainland China listed maker of construction equipment whose share price fell along with slowdown in construction activity in the second half of the year. We believe earnings are forecast by the consensus to grow over the next two years with the scope for upgrades to forecasts if, as we believe, activity stabilises and then picks up again.
We sold four stocks: New Oriental Education, Beijing Oriental Yuhong Waterproof Co., KT&G and Catcher Technology. We sold New Oriental Education after changes in the regulatory environment meant its prospects for growth fell significantly. We sold Yuhong, which is a manufacturer of waterproofing materials used in the construction industry. We believe its share price did not fully reflect the company’s exposure to Evergrande, and therefore took profit on the stock. We still like the company and it remains on our watchlist as Yuhong’s balance sheet is strong enough to weather a weaker year. KT&G and Catcher were sold as these companies are now considered as low growth companies.
We bought Applied Materials, Broadcom, LG Household & Health, and China Medical System. Applied Materials and Broadcom derive more than 50% of their revenue from Asia and so are eligible for the Fund. LG Household Healthcare is a Korean company with exposure to cosmetics, drinks and personal products. China Medical System sells generic drugs on behalf of other companies and is moving into drug development itself.
At a country level the Fund is overweight China and underweight Hong Kong resulting in a modest overweight to the two combined. The Fund also has off-benchmark exposures to Australia and to the US, where the Fund has holdings in Applied Materials and Broadcom, both of which derive over half their revenues from the region. The biggest country under-weights are to Korea and Taiwan. At a sector level, the Fund has the highest relative exposure to Information Technology, Healthcare and Industrials while its lowest relative exposures are to Financials. The Fund has no exposure to Materials, Real estate or to Utilities.
We see valuations in Asia as attractive, being one of the few regions trading at a discount to its historic average. China is clearly a big influence on outcomes. We expect to see the Federal Reserve switch back to its main job this year in trying to deliver price stability and the provision of liquidity when the system needs it. We think it is trying to shake off its role, begun in 1994, as a stock market prop. We expect therefore, that low unemployment and high inflation means higher interest rates and we think it is unlikely that the Federal reserve will be inclined to act on stock market weakness unless there is serious disruption. In short, monetary policy looks set to tighten.
The opposite, we think, is true in China. Interest rates have eased a little and as economic growth decelerates following the moves to force deleveraging in the real estate sector, we shall see more moves to provide support. China never spent anything like as much as the US did during COVID (China spent 4.7% of Gross Domestic Product (GDP), the US spent upward of 25% of GDP) leaving them room to loosen. We therefore expect to China to be easing at a time when the developed world is tightening, and with Chinese stock price valuations so low, we think there are opportunities.
Edmund Harriss
January 2022
The Fund invests in foreign securities, which involves political, economic and currency risks, greater volatility, and differences in accounting methods. These risks are greater for emerging markets. Investments focused in a single geographic region may be exposed to greater risk and more volatility than investments diversified among various geographies. The Fund invests in smaller companies, which involves additional risks such as limited liquidity and greater volatility.
The MSCI AC (All Country) Far East ex Japan Index is a free float-adjusted market capitalization-weighted index that is designed to measure equity market performance of the Far East, excluding Japan. Net Return reflects deduction for withholding tax but reflects no deduction for fees and expenses. Net Return is net of local withholding taxes that any investor would pay. This index is unmanaged and is not available for investment, and does not incur expenses.
PER or P/E – Price to Earnings ratio is calculated by dividing current price of the stock by the company's trailing twelve months' earnings per share.
GDP – Gross domestic product (GDP) is the total monetary or market value of all the finished goods and services produced within a country's borders in a specific time period.
Please refer to the Schedule of Investments for details on Fund holdings. Current and future portfolio holdings are subject to risk.
The information provided herein represents the opinion of Guinness Atkinson Asset Management, Inc. for the period stated and is not intended to be a forecast of future events, a guarantee of future results, or investment advice. Opinions, Fund holdings and sector allocations are subject to change at any time, and are not recommendations to buy or sell any security.
Asia Focus Fund
Growth of $10,000 (Unaudited)

Average Annual Total Return
Periods Ended December 31, 2021
| One Year | | Five Years | | Ten Years |
| -6.32% | | 12.27% | | 6.19% |
Performance data quoted represents past performance and does not guarantee future results. The investment return and principal value of an investment will fluctuate so that an investor's shares, when redeemed, may be worth more or less than their original cost. Current performance of the Fund may be lower or higher than the performance quoted. Performance data current to the most recent month end may be obtained by visiting www.gafunds.com.
Total returns for certain periods reflect a fee waiver in effect and in the absence of this waiver, the total returns would be lower. Returns reflect the reinvestment of distributions made by the Fund, if any. The graph and the performance table above do not reflect the deduction of taxes that a shareholder would pay on Fund distribution or the redemption of Fund shares.
The MSCI All Country Far East Free ex-Japan Index (MSCI AC Far East Free ex-Japan Index) is a free float-adjusted, capitalization-weighted index that is designed to measure equity market performance of the Far East region excluding Japan. The index referenced in this chart is not available for investment and does not incur expenses. Net Return reflects deduction for withholding tax but reflects no deduction for fees and expenses. Net Return is net of local withholding taxes that any investor would pay.
FUND HIGHLIGHTS at December 31, 2021
GUINNESS ATKINSON ASIA FOCUS FUND
| # of Holdings in Portfolio: | | | 32 | |
| Portfolio Turnover: | | | 29.1 | % |
| % of Stocks in Top 10: | | | 44.1 | % |
| Fund Manager: |
| Edmund Harriss |
| Sharukh Malik |
| Mark Hammonds |
| Top 10 Holdings (% of net assets) | | | |
| NARI Technology Co., Ltd. | | | 5.5 | % |
| DBS Group Holdings | | | 4.8 | % |
| Broadcom Inc. | | | 4.5 | % |
| Taiwan Semiconductor Manufacturing Co., Ltd. | | | 4.5 | % |
| Elite Material Co., Ltd. | | | 4.5 | % |
| Wuxi Lead Intelligent Equipment Co., Ltd. | | | 4.3 | % |
| Samsung Electronics Co., Ltd. | | | 4.0 | % |
| Inner Mongolia Yili - A Shares | | | 4.0 | % |
| Corporate Travel Management Ltd. | | | 4.0 | % |
| Sonic Healthcare Ltd. | | | 4.0 | % |
| Industry Breakdown (% of net assets) |
| Electronic Components - Semiconductor | | | 12.0 | % |
| Semiconductor Components - Integrated Circuits | | | 8.3 | % |
| Commercial Banks | | | 7.9 | % |
| E-Commerce/Services | | | 5.7 | % |
| Machinery - General Industries | | | 5.5 | % |
| Electronic Component Miscellaneous | | | 4.5 | % |
| Batteries/Battery Systems | | | 4.3 | % |
| Food - Dairy Products | | | 4.0 | % |
| Travel Services | | | 4.0 | % |
| MRI/Medical Diagnostic Imaging | | | 4.0 | % |
| Entertainment Software | | | 3.5 | % |
| Auto - Cars/Light Trucks | | | 3.4 | % |
| Textile - Apparel | | | 3.3 | % |
| Medical Products | | | 3.0 | % |
| Computer Data Security | | | 3.0 | % |
| Internet Application Software | | | 2.9 | % |
| Pharmaceuticals | | | 2.8 | % |
| Building & Construction Products - Miscellaneous | | | 2.8 | % |
| Auto/Truck Parts & Equipment | | | 2.7 | % |
| Photo Equipment & Supplies | | | 2.6 | % |
| Machinery - Construction & Mining | | | 2.5 | % |
| Cosmetics & Toiletries | | | 2.4 | % |
| Insurance | | | 2.2 | % |
| E-Commerce/Products | | | 2.0 | % |
| Building Products - Cement/Aggregates | | | 1.0 | % |
| Metal Processors & Fabricators | | | 0.0 | % |
GUINNESS ATKINSON ASIA FOCUS FUND
Schedule of Investments
at December 31, 2021
| Shares | | | Common Stocks: 100.3% | | Value | |
| | | | | | | |
| | | | | Australia: 8.0% | | | | |
| | 40,819 | | | Corporate Travel Management Ltd. | | $ | 653,066 | |
| | 19,149 | | | Sonic Healthcare Ltd. | | | 649,062 | |
| | | | | | | | 1,302,128 | |
| | | | | | | | | |
| | | | | China: 55.1% | | | | |
| | 8,900 | | | Alibaba Group Holding Ltd. | | | 135,729 | |
| | 1,700 | | | Alibaba Group Holding Ltd. - ADR | | | 201,943 | |
| | 5,800 | | | Autohome Inc. - ADR | | | 170,984 | |
| | 2,900 | | | Baidu Inc.* -ADR | | | 431,491 | |
| | 321,000 | | | China Lesso Group Holdings Ltd. | | | 461,130 | |
| | 293,000 | | | China Medical System Holdings Ltd. | | | 489,304 | |
| | 66,500 | | | China Merchants Bank Co., Ltd. - H Shares | | | 516,459 | |
| | 205,000 | | | Geely Automobile Holdings Ltd. | | | 560,059 | |
| | 100,700 | | | Inner Mongolia Yili Industrial Group Co., Ltd. - A Shares | | | 655,929 | |
| | 7,200 | | | JD.com Inc. - ADR | | | 504,504 | |
| | 143,340 | | | NARI Technology Co., Ltd. - A Shares | | | 901,470 | |
| | 5,700 | | | NetEase Inc. - ADR | | | 580,146 | |
| | 49,000 | | | Ping An Insurance Group Company of China Ltd. - H Shares | | | 352,896 | |
| | 114,600 | | | Sany Heavy Industry Co., Ltd. - A Shares | | | 410,504 | |
| | 27,800 | | | Shenzhou International | | | 534,499 | |
| | 659,000 | | | Sino Biopharmaceutical Ltd. | | | 461,507 | |
| | 8,000 | | | Tencent Holdings Ltd. | | | 468,723 | |
| | 108,400 | | | Venustech Group Inc. - A Shares | | | 485,880 | |
| | 60,160 | | | Wuxi Lead Intelligent Equipment Co., Ltd. - A Shares | | | 702,917 | |
| | | | | | | | 9,026,074 | |
| | | | | | | | | |
| | | | | Singapore: 4.8% | | | | |
| | 32,362 | | | DBS Group Holdings Ltd. | | | 783,966 | |
| | | | | | | | | |
| | | | | South Korea: 9.1% | | | | |
| | 38,530 | | | Hanon Systems | | | 435,907 | |
| | 430 | | | LG Household & Health Care Ltd. | | | 396,778 | |
| | 10,050 | | | Samsung Electronics Co., Ltd. | | | 661,913 | |
| | | | | | | | 1,494,598 | |
The accompanying notes are an integral part of these financial statements.
GUINNESS ATKINSON ASIA FOCUS FUND
Schedule of Investments
at December 31, 2021
| Shares | | | Common Stocks: 100.3% | | Value | |
| | | | Taiwan: 15.4% | | | |
| | 73,000 | | | Elite Material Co., Ltd. | | $ | 732,239 | |
| | 4,800 | | | Largan Precision Co., Ltd. | | | 426,917 | |
| | 32,000 | | | Novatek Microelectronics Corp. | | | 622,335 | |
| | 2 | | | Shin Zu Shing Co., Ltd. | | | 7 | |
| | 33,000 | | | Taiwan Semiconductor Manufacturing Co., Ltd. | | | 732,275 | |
| | | | | | | | 2,513,773 | |
| | | | | United States: 7.9% | | | | |
| | 3,508 | | | Applied Materials Inc. | | | 552,019 | |
| | 1,120 | | | Broadcom Inc. | | | 745,259 | |
| | | | | | | | 1,297,278 | |
| | | | | Total Common Stocks | | $ | 16,417,817 | |
| | | | | (cost $9,837,897) | | | | |
| | | | | Total Investments in Securities | | | 16,417,817 | |
| | | | | (cost $9,837,897): 100.3% | | | | |
| | | | | Liabilities in Excess of Other Assets: (0.3%) | | | (50,441 | ) |
| | | | | | | | | |
| | | | | Net Assets: 100.0% | | $ | 16,367,376 | |
| * | Non-income producing security. |
ADR - American Depository Receipt
The accompanying notes are an integral part of these financial statements.
GUINNESS ATKINSON CHINA & HONG KONG FUND
ANNUAL REPORT FOR THE PERIOD ENDED
DECEMBER 31, 2021
| Average annualized Total returns | 1 Year | 3 Years | 5 Years | 10 Years |
| Fund | -6.70% | 11.58% | 10.53% | 6.48% |
| Benchmark Index: | | | | |
| Hang Seng Composite Index | -13.89% | 4.80% | 6.99% | 6.96% |
Expense Ratio 1.60%.
For the Fund’s current one-year expense ratio, please refer to the Financial Highlights sect of this report.
Performance data quoted represents past performance and does not guarantee future results. The investment return and principal value of an investment in the Fund will fluctuate so that an investor's shares, when redeemed, may be worth more or less than their original cost. Current performance of the Fund may be lower or higher than the performance quoted. Performance data current to the most recent month-end may be obtained by visiting www.gafunds.com, or calling (800) 915-6565.
In 2021, the Fund fell 6.70% and the Hang Seng Composite Index fell 13.89% and the MSCI China Net Total Return Index fell 21.72%. Therefore the Fund outperformed the Hang Seng Index by 7.19% and the MSCI China Index by 15.02%.
Fund Philosophy
The Fund invests in quality, profitable companies which give exposure to the structural growth themes in China. These seven themes are:
| · | Rise of the Middle Class1 |
| · | Cloud Computing & Artificial Intelligence |
Once we have identified companies which give exposure to these themes, we also apply a set of quantitative filters to identify quality, profitable companies with strong balance sheets. Quality is defined as a return on capital above the cost of capital while a strong balance sheet is defined as debt/equity less than 150%. These filters reduce the universe from an initial ~1,600 companies to ~800 companies, of which we generally pick 30-40 to form an equally weighted portfolio.
| 1 | The Rise of the Middle Class refers to the opportunity set as China’s middle class continues to grow in size and wealth. A company falls within this theme if it gives exposure to Food, Home Improvements, Beverages, Urbanization, Leisure or Education. |
| 2 | Sustainability refers to China’s efforts to reduce it carbon output and to reduce its impact to the environment. A company falls within this theme if it gives exposure to the ongoing energy transition, electric vehicles or waste reduction. |
| 3 | Next Gen Consumer refers to new ways of consumption. A company falls within this theme if it gives exposure to E-Commerce or Online Entertainment. |
Overall, we are looking for companies with the following characteristics:
| · | High return on capital companies. |
| · | Companies with growing operating cashflow, which we expect to continue to grow. |
| · | The ability to deploy this cash at a high rate of return. |
| · | Sensibly structured balance sheets with no excessive debt. |
| · | Management we trust to grow the business. |
| · | Companies that are judged to not harm society’s wider interests. |
| · | Market is undervaluing the growth opportunities. |
The Fund has a valuation discipline to ensure that we do not overpay for future growth. When assessing the valuation of companies on a discounted cash flow basis, we adjust the discount rate where necessary to reflect the potential for higher global interest rates.
The Fund is run on an equally weighted basis, meaning it has high conviction in 30-40 stocks.
Fund and Market Review
The Rally
The year started off strongly for China, with the large cap tech stocks driving a rally which lasted until mid-February. A bullish mood partly explained this rally, with newly launched funds braking fundraising records. At the time we did note that certain parts of the market were looking expensive and there was a risk of a derating if expectations were not met. In particular, discount rates in Hong Kong reached their lowest level in 10 years and so we made a point of using higher discount rates when valuing companies, to reflect the risk of rising global interest rates.
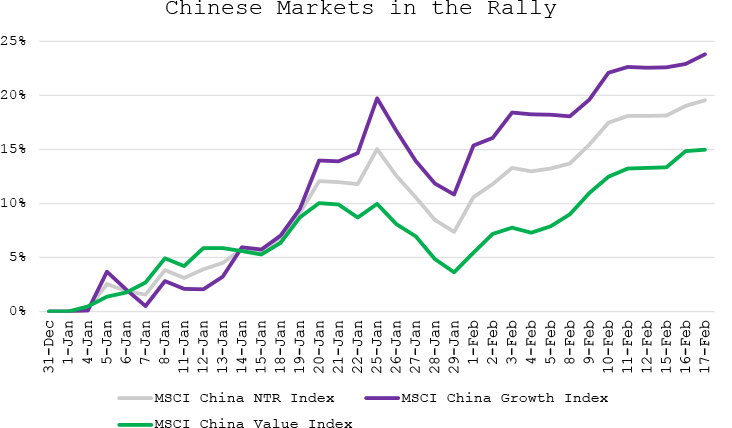
(Data from 12/31/20 to 02/17/21, returns in USD)
Chinese markets peaked in February, and in this rally, the MSCI China NTR Index rose 19.6%. We think it is also meaningful to split China’s performance into Growth and Value. The MSCI China Growth Index rose 23.8% while the MSCI China Value Index rose by 15.0%.
The Sell-Off
But following the peak, Chinese markets were weak for the rest of the year due to multiple reasons. In February concerns over the potential for higher global interest rates, in response to higher inflation, led to a global sell-off. High growth stocks, whose valuations were boosted by 12 months of very low discount rates, were particularly weak. Additionally in China the central bank indicated monetary policy was unlikely to be loosened further, compounding the initial effect. In March, the MSCI China NTR Index fell 6.3%.
Over the spring and summer, we saw increased government regulation affecting various industries. We think the government introduced new rules for several reasons, with the aims of:
| · | Improving poor corporate behaviour in industries where there had previously been relatively less regulation. |
| · | Reducing social inequality, which links in with the government’s focus on common prosperity. |
| · | Protecting data security, which is linked to the structure that Chinese companies use to list overseas. |

(Data from 02/17/21 to 12/31/21, returns in USD)
Chinese markets were most affected by regulations in July, with the MSCI China Net Total Return Index falling 13.8%. Towards the end of the summer, new headwinds appeared, including:
| · | Evergrande was unable to borrow more to pay off its liabilities, meaning it could not repay a bond due in September. This led to concerns over potential contagion in the property market, as well as in the wider economy. |
| · | Unexpected power cuts led to weaker economic activity in September. We think these cuts were due to inefficiencies in Chinese power markets, meaning power plants were reluctant to produce in light of higher cost prices. |
| · | Economic growth was slowing down, as the government wound down monetary stimulus. |
Chinese markets were broadly flat between August and October, but fell in November, driven by further weakness in the large cap tech stocks. Tencent was asked by regulators to temporarily pause releasing new apps and to stop updating existing apps. This was because the company was found to violate data protection rules on four occasions in the past. Alibaba reported weaker results than expected, which reflected the headwinds the business was facing. Though revenues grew 29% year-on-year in the third quarter, the core business, the customer management segment, only grew sales by 3%. The company is investing to generate growth in other parts of the business, but margins are likely to suffer.
Stock Performance

Leaders
Nari Technology benefited from a rerating during the year. The company makes software and hardware for the electricity grid, focusing on dispatching and distribution solutions. Nari is an indirect beneficiary of China’s buildout of renewable energy, which requires investment in the state grid network to link the sources of renewable energy to where electricity is demanded. Part of this effort also involves the construction of Ultra High Voltage (UHV) lines to transport electricity at long distances with minimal energy loss, where Nari also has exposure to.
China Medical System was by far the strongest stock in the portfolio in the first half of the year, rising 139%. The stock then gave back much of its gains, but still ended the year as one of the strongest performing stocks in the portfolio. The company was historically a contract sales organisation that sold drugs on behalf of foreign companies in China. Its focus was on generics, an area in which the government has initiated significant price cuts to lower overall healthcare costs. As a business dealing exclusively in generics, CMS’s share price sold off sharply in 2019 and was weak in 2020. We felt the share price during this period was implying the worst-case scenario so continued to add to the position as part of the Fund’s rebalancing process. Over time, CMS has delivered. Price cuts for its generic products have been well below average due to the relatively lower level of competition. The business has signed deals to build its innovative pipeline, where pricing power is much higher compared to generics. In the first half of 2021, revenue grew 24% and net income grew 27%.
Lead Intelligent makes equipment used to manufacture batteries for electric vehicles. It is well known for its winding equipment, which packs cells together, but also has a good offering in the early stage of the battery manufacturing process where electrodes are made. CATL, one of the largest battery manufacturers in the world, is now Lead’s second largest shareholder. CATL has guaranteed the company at least 50% share in its main battery cell equipment orders between 2021 and 2023, so Lead Intelligent should derive good earnings growth from this deal. The business also has exposure to other customers, such as Northvolt in Europe. We think the demand for electric vehicles is very likely to continue to grow, which requires battery plants to be built, leading to rapid growth in Lead Intelligent’s business.
China Merchants Bank is, in our opinion, the best run bank in China. One of the company’s advantages is its good customer service, which allows the company to obtain cheaper sources of funding from its retail base, rather than rely on wholesale markets. The business earns its income through income on loans, as well as on fee income from its credit card, wealth management and custodian businesses. The wealth management business sells funds, insurance products and wealth management products, which allows the bank to take advantage of China’s growing middle class. In 2021, China Merchants Bank grew operating income by 14% and grew net profit by 23%.
Haier Smart Home gives exposure to rising demand for household appliances such as air conditioners, washing machines and fridges. Management are confident the business can grow profits by 15% a year in the medium to long-term, given the wide range of products the business offers. The company’s premium Casarte continues to grow quickly at higher margins than the rest of the business. The Leader brand, on the other hand, is a mass market brand targeted at younger consumers, offering more value-for-money products. The combined contribution from the two brands is now 20% of total revenue.
Laggards
New Oriental Education was sold in June after it became much likelier that the government would ban weekend and holiday tuition. This fear became a reality as after we sold the stock, the government banned for-profit firms from operating in the after-school tuition industry. Though we did sell well below the stock’s peak, we still made a ~50% return on the stock over the total holding period. Furthermore, we avoided making a loss on the investment, as after the government announced its restrictions in the month after we sold the stock, New Oriental’s share price fell a further 70% in two days.
We sold Autohome due to its lack of earnings growth. The company operates China’s largest online platform for buying and selling cars. However, the ongoing chip shortage has affected car sales which is out of the company’s control. Increasing competition from well-funded businesses is another headwind that Autohome is facing. The market is not expecting earnings to reach 2020’s level until 2024 and we do not have a strong view as to why the market is wrong.
Alibaba had a tough year, with increased government restrictions and a slowing core business. In November 2020, Alibaba’s founder, Jack Ma, gave a speech criticising various aspects of China’s financial system. While criticism is allowed in China, one has to be very careful about the way in which it is done. Jack Ma’s method was public and direct, which was not well received by the government. Soon after, Ant Group, which is owned by Alibaba, saw its public listing suspended. This marked the beginning of the government’s antitrust efforts targeting the tech sector. Additionally, the core e-commerce business is slowing down and Alibaba is investing to try to generate new growth drivers, which will depress margins in the short-term. The business was trading at high valuations at the beginning of the year, implying growth rates which the business has not been able to achieve, explaining the sharp derating in 2021. As previously discussed, the Fund’s equally weighted nature means Alibaba has a neutral weight of ~3.3% in the Fund. In Feb-21, Alibaba was the second largest stock in the MSCI China Index with a 14.1% weight. Therefore given the sell-off in the stock, the Fund has benefited significantly from its underweight in the stock. We continue to hold the stock because Alibaba gives good, return on capital exposure to e-commerce which we expect to continue to grow over time. We limit the stock specific risk to the company through the equally weighted nature of the portfolio, which helped in 2021.
Chinese insurers have had a tough year, and Ping An is no exception. Consumer demand has been sluggish in a weaker macro environment and so demand for more expensive insurance protection products has been weak. Customers have instead shifted towards savings products but these are lower margin for Ping An. In response to the weak market, insurers have been letting go of part-time agents and are replacing them with fewer, but more qualified and productive full-time agents. Additionally, the market has been worried about Ping An’s exposure to property. Ping An invested in the property developer China Fortune Land Development, which defaulted on its debt in March, and so Ping An took an impairment of RMB 36bn. We think the share price probably reflects the issues we have outlined and that the business is trying to increase productivity in the current environment.
Galaxy Entertainment operates casinos and hotels in Macau. Given China’s zero-COVID policy, only domestic Chinese customers can enter Macau. But with COVID outbreaks over the year, it has been difficult for some domestic Chinese to move around the country. Therefore it has been another weak year for the business.
Sells
Conch Cement was sold as it was difficult to argue, with confidence, that earnings will meaningfully increase in the medium term. The long-term growth driver for the cement industry is ultimately driven by real estate and infrastructure and at least in the case of infrastructure, there are better names available. Conch Cement is a consolidator but is ultimately a price taker in the cement industry, and so has limited pricing power.
We sold Shenzhen Expressway as it was also difficult to identify the long-term structural growth drivers for the business. The company runs toll roads with revenue concentrated in Shenzhen and the broader Guangdong province. Though margins are relatively high, the business is very capital intensive and so asset turnover is low, resulting in a low overall return on capital.
We sold Yuhong, a manufacturer of waterproofing materials used in the construction industry. We believe the share price did not fully reflect the company’s exposure to Evergrande, and therefore took profit on the stock. We still like the company and it remains on our watchlist as Yuhong’s balance sheet is strong enough to weather a weaker year. At the time of the sale, there were more attractive ideas on the watchlist.
New Oriental Education and Autohome were also sold – please see the previous section for details.
Buys
We bought Xinyi Solar, which is the world’s largest manufacturer of solar glass and so through its economies of scale, has benefited as the low-cost producer in the industry. However its competitive advantage is not solely a function of its scale. The quality of Xinyi’s glass is high relative to its peers so the company is well trusted by its clients. This is very important given the rising popularity of bifacial panels which need thinner and so more durable glass. Tighter emissions standards also raise the cost of production, as well as the barriers to entry, protecting incumbents such as Xinyi. Policymakers in all major regions around the world are aiming to significantly increase investment into renewable energy sources which should bode well for Xinyi.
Fuling Zhacai is a condiment company focused on the production of zhacai and paocai. Zhacai is made using mustard roots and is commonly eaten with rice and buns. Fuling Zhacai has a long history of manufacturing zhacai and has a market share of 36%. 28% of sales are from the South where the company is based but there is a fairly even split between the other major regions of China. Fuling Zhacai has been able to pass on cost increases to its customers which is a strong indicator of its pricing power, allowing the company to earn a high return on capital over time.
AIA gives the Fund exposure to the rising demand for premium life and health insurance. It is headquartered in Hong Kong and derives more than 50% of its revenue from the China region. AIA also has exposure to Southeast Asia, namely Thailand, Malaysia and Singapore. However, much of the future earnings growth is likely to come from mainland China. AIA is targeting the rising middle class in the country and we believe there is a lot of room for the company to grow from a relatively low base. AIA targets the premium end of the market, using its highly trained workforce which is viewed as giving some of the best service in the industry. This is backed up by AIA’s very low turnover rate amongst its staff, relative to its competitors.
Shengyi Technology makes copper clad laminates (CCLs), which are the main base material for printed circuit boards (PCBs). It has benefited from multiple trends which point to greater demand for CCLs and PCBs: growing popularity of 5G compatible devices, growing demand for servers and cloud services as well as localisation towards Chinese suppliers in the Chinese market. Shengyi is quickly moving up the value chain, supporting a gradual rise in margins over time.
We bought H&T Intelligent which makes controllers used in applications such as household appliances and power tools. H&T’s controllers are used in well-known brands such as Whirlpool, Siemens and Bosch. The company is well placed to take advantage of growing demand for the Internet of Things (IoT), which naturally complements the existing business. H&T is also aiming to expand into the automobile market where electronic control units, which are not too dissimilar from controllers, are becoming increasingly used.
3. OUTLOOK

Valuations for China have fallen significantly from their peak and are now at more reasonable levels. But to justify an investment in China, we argue lower valuations are not enough. Earnings growth is required to justify long-term returns and this is the component of shareholder return that we can attempt to control in the Fund.
The Fund is invested in quality, profitable companies which give exposure to the structural growth opportunities present in China. Our companies have in aggregate grown net income by 13% a year over the past 10 years i.e. they have shown they can translate the structural growth opportunities into consistent earnings growth. Our companies have done this while maintaining a high return on equity of 22%. To be clear, we are not interested in loss making, low return businesses which happen to be in boom areas.
Though our companies have, over the past 10 years, grown earning by 13% a year, the market is expecting higher growth over the next two years. Based on consensus earning estimates, the market is expecting earnings for the Fund’s holdings, in aggregate, to grow by 17% a year between 2020 and 2022, as China and the global economy recover from COVID.
What could lead to a rerating? In response to what is, by China’s standards, a weak macroenvironment, we think the government is likely to loosen fiscal and monetary policy in 2022. We expect this to lead to an improvement in growth and sentiment towards China, potentially leading to a rerating. Stability was the core theme at the Central Economic Work Conference (CEWC), a key event which sets the economic agenda for 2022. For the first time, the CEWC mentioned weaker expectations as a challenge facing the economy, and also mentioned a fall in demand for the first time since 2015. The CEWC called for government bodies to introduce pro-growth fiscal and monetary support. We expect this support to include front-loaded infrastructure investments, green energy investments, tax cuts and targeted monetary loosening. We expect some support for the property market which remains weak, but at the same time we do not see broad based easing. The CEWC maintained the line that housing is for living, not for speculation, so we do not see the government aggressively easing monetary policy either.
For this reason, if we are right in assuming that more supportive government policies could improve the Chinese economy, we can see investors paying more attention to China at some point in 2022. The Fund is invested in good quality businesses which give exposure to the growth opportunities in China. Currently these companies are out of favour but this could change for the aforementioned reasons. We believe that at today’s prices, it is a good entry point to invest in the Fund. The Fund is supported by strong historic earnings growth which we expect to continue, potentially boosted by a valuation rerating if China becomes a more popular investment destination.
Edmund Harriss
Sharukh Malik
January 2022
The Fund invests in foreign securities, which involve political, economic and currency risks, greater volatility, and differences in accounting methods. These risks are greater for emerging markets. The China and/or Hong Kong stock markets in which the Fund invests may experience periods of volatility and instability. These fluctuations may cause a security to be worth less than it was at the time of purchase. Market risk applies to individual securities, a particular sector or the entire economy. China and/or Hong Kong stocks may fall out of favor with investors, the value of Chinese currencies may decline relative to the U.S. dollar and/or China or Hong Kong stock markets may decline generally. The Fund invests in invest in small-cap or mid-cap, which involve additional risks such as limited liquidity and greater volatility, than investments in larger companies.
The Hang Seng Composite Index is a market capitalization weighted index that covers about 95% of the total market capitalization of companies listed on the main board of the Hong Kong Stock Exchange. This index is unmanaged, not available for investment and does not incur expenses.
PE ratio – Price to Earnings ratio is calculated by dividing current price of the stock by the company's trailing twelve months' earnings per share.
Please refer to the Schedule of Investments for details on Fund holdings. Current and future portfolio holdings are subject to risk.
The information provided herein represents the opinion of Guinness Atkinson Asset Management, Inc. for the period stated and it is not intended to be a forecast of future events, a guarantee of future results, or investment advice. Opinions, Fund holdings and sector allocations are subject to change at any time, and are not recommendations to buy or sell any security.
China & Hong Kong Fund
Growth of $10,000 (Unaudited)

Average Annual Total Return
Periods Ended December 31, 2021
| One Year | | Five Years | | Ten Years |
| -6.70% | | 10.53% | | 6.48% |
Performance data quoted represents past performance and does not guarantee future results. The investment return and principal value of an investment will fluctuate so that an investor's shares, when redeemed, may be worth more or less than their original cost. Current performance of the Fund may be lower or higher than the performance quoted. Performance data current to the most recent month end may be obtained by visiting www.gafunds.com.
Total returns for certain periods reflect a fee waiver in effect and in the absence of this waiver, the total returns would be lower. Returns reflect the reinvestment of distributions made by the Fund, if any. The graph and the performance table above do not reflect the deduction of taxes that a shareholder would pay on Fund distribution or the redemption of Fund shares.
The Hang Seng Composite Index is a market-capitalization weighted index that comprises the top 200 companies listed on the Hong Kong Stock Exchange, based on the average market capitalization for the past twelve months. The index referenced in this chart is not available for investment and does not incur expenses. Net Return reflects deduction for withholding tax but reflects no deduction for fees and expenses. Net Return is net of local withholding taxes that any investor would pay.
FUND HIGHLIGHTS at December 31, 2021
GUINNESS ATKINSON CHINA & HONG KONG FUND
| # of Holdings in Portfolio: | | | 31 | |
| Portfolio Turnover: | | | 29.8 | % |
| % of Stocks in Top 10: | | | 42.2 | % |
| Fund Manager: |
| Edmund Harriss |
| Sharukh Malik |
| Top 10 Holdings (% of net assets) | | | |
| NARI Technology Co. Ltd. - A Shares | | | 6.1 | % |
| China Resources Gas Group Ltd. | | | 4.5 | % |
| Inner Mongolia Yili Industrial Group Co., Ltd. - A Shares | | | 4.3 | % |
| NetEase Inc. - ADR | | | 4.3 | % |
| Haier Electronics Group Co., Ltd. | | | 4.2 | % |
| Shenzhen H&T Intelligent Control Co., Ltd. | | | 4.1 | % |
| Chongqing Fuling Zhacai Group Co., Ltd. | | | 3.7 | % |
| China Merchants Bank Co., Ltd. - H Shares | | | 3.7 | % |
| JD.com Inc. - ADR | | | 3.7 | % |
| Venustech Group Inc. - A Shares | | | 3.6 | % |
| Geographic Breakdown (% of net assets) | | | |
| China | | | 87.4 | % |
| Hong Kong | | | 13.0 | % |
GUINNESS ATKINSON CHINA & HONG KONG FUND
Schedule of Investments
at December 31, 2021
| Shares | | | Common Stocks: 100.4% | | Value | |
| | | | Appliances: 7.3% | | | |
| | 560,200 | | | Haier Electronics Group Co., Ltd.* | | $ | 2,367,548 | |
| | 181,009 | | | Zhejiang Supor Cookware - A Shares | | | 1,769,978 | |
| | | | | | | | 4,137,526 | |
| | | | | Auto/Cars - Light Trucks: 2.8% | | | | |
| | 579,000 | | | Geely Automobile Holdings Ltd. | | | 1,581,825 | |
| | | | | | | | | |
| | | | | Auto/Truck Parts & Equipment: 2.8% | | | | |
| | 797,480 | | | Weichai Power Co., Ltd. - H Shares | | | 1,560,898 | |
| | | | | | | | | |
| | | | | Batteries/Battery System: 3.6% | | | | |
| | 173,440 | | | Wuxi Lead Intelligent Equipment Co., Ltd. - A Shares | | | 2,026,494 | |
| | | | | | | | | |
| | | | | Building Products: 2.7% | | | | |
| | 1,062,000 | | | China Lesso Group Holdings Ltd. | | | 1,525,608 | |
| | | | | | | | | |
| | | | | Casino Hotels: 2.3% | | | | |
| | 257,000 | | | Galaxy Entertainment Group Ltd. | | | 1,331,726 | |
| | | | | | | | | |
| | | | | Commercial Banks: 3.7% | | | | |
| | 269,500 | | | China Merchants Bank Co., Ltd. - H Shares | | | 2,093,019 | |
| | | | | | | | | |
| | | | | Computer Data Security: 3.6% | | | | |
| | 461,650 | | | Venustech Group Inc. - A Shares | | | 2,069,249 | |
| | | | | | | | | |
| | | | | E-Commerce/Services: 13.0% | | | | |
| | 24,500 | | | Alibaba Group Holding Ltd. | | | 373,636 | |
| | 6,800 | | | Alibaba Group Holding Ltd. - ADR | | | 807,772 | |
| | 29,700 | | | JD.com Inc. - ADR | | | 2,081,079 | |
| | 539,989 | | | Shenzhen H&T Intelligent Control Co., Ltd. | | | 2,327,067 | |
| | 479,200 | | | Shengyi Technology Co., Ltd. | | | 1,772,988 | |
| | | | | | | | 7,362,542 | |
| | | | | Energy-Alternate: 3.3% | | | | |
| | 1,111,987 | | | Xinyi Solar Holdings Ltd. | | | 1,885,521 | |
| | | | | | | | | |
| | | | | Food-Dairy Products: 8.0% | | | | |
| | 355,800 | | | Chongqing Fuling Zhacai Group Co., Ltd. | | | 2,112,983 | |
| | 374,800 | | | Inner Mongolia Yili Industrial Group Co., Ltd. - A Shares | | | 2,441,333 | |
| | | | | | | | 4,554,316 | |
| | | | | Gas-Distribution: 4.5% | | | | |
| | 456,000 | | | China Resources Gas Group Ltd. | | | 2,576,387 | |
| | | | | | | | | |
| | | | | Home Furniture: 3.0% | | | | |
| | 485,700 | | | Suofeiya Home Collection - A Shares | | | 1,694,023 | |
The accompanying notes are an integral part of these financial statements.
GUINNESS ATKINSON CHINA & HONG KONG FUND
Schedule of Investments
at December 31, 2021
| Shares | | | Common Stocks: 100.4% | | Value | |
| | | | | Insurance: 5.3% | | | | |
| | 170,200 | | | AIA Group Ltd. | | $ | 1,715,862 | |
| | 175,500 | | | Ping An Insurance Group Company of China Ltd. - H Shares | | | 1,263,942 | |
| | | | | | | | 2,979,804 | |
| | | | | Internet Application Software: 2.9% | | | | |
| | 28,400 | | | Tencent Holdings Ltd. | | | 1,663,967 | |
| | | | | | | | | |
| | | | | Internet Content - Entertainment: 4.3% | | | | |
| | 23,875 | | | NetEase Inc. - ADR | | | 2,429,998 | |
| | | | | | | | | |
| | | | | Machinery-General Industry: 9.3% | | | | |
| | 551,600 | | | NARI Technology Co., Ltd. - A Shares | | | 3,469,030 | |
| | 501,697 | | | Sany Heavy Industry Co., Ltd. - A Shares | | | 1,797,110 | |
| | | | | | | | 5,266,140 | |
| | | | | Pharmaceuticals: 9.2% | | | | |
| | 1,096,000 | | | China Medical System Holdings | | | 1,830,298 | |
| | 1,726,400 | | | CSPC Pharmaceutical Group Ltd. | | | 1,875,535 | |
| | 2,183,500 | | | Sino Biopharmaceutical Ltd. | | | 1,529,136 | |
| | | | | | | | 5,234,969 | |
| | | | | Real Estate Operations/Development: 3.1% | | | | |
| | 742,500 | | | China Overseas Land & Investments Ltd. | | | 1,758,039 | |
| | | | | | | | | |
| | | | | Retail - Apparel/Shoe: 2.9% | | | | |
| | 2,914,000 | | | China Lilang Ltd. | | | 1,629,583 | |
| | | | | | | | | |
| | | | | Web Portals: 2.8% | | | | |
| | 10,500 | | | Baidu Inc.* | | | 1,562,295 | |
| | | | | | | | | |
| | | | | Total Common Stocks | | $ | 56,923,929 | |
| | | | | (cost $44,285,193) | | | | |
| | | | | Total Investments in Securities | | | 56,923,929 | |
| | | | | (cost $44,285,193): 100.4% | | | | |
| | | | | Liabilities in Excess of Other Assets: (0.4%) | | | (199,024 | ) |
| | | | | Net Assets: 100.0% | | $ | 56,724,905 | |
| * | Non-income producing security. |
ADR - American Depository Receipt
The accompanying notes are an integral part of these financial statements.
GUINNESS ATKINSON GLOBAL ENERGY FUND
ANNUAL REPORT FOR THE PERIOD ENDED
DECEMBER 31, 2021
Average annualized Total
returns | 1 Year | 3 Years | 5 Years | 10 Years |
| Fund | 45.98% | 1.97% | -3.19% | -2.00% |
| Benchmark Index: | | | | |
| MSCI World Energy Index (Net Return) | 40.09% | 2.28% | -1.12% | -0.18% |
Gross 2.56% & Net 1.46%. The Adviser has contractually agreed to reduce its fees and/or pay Fund expenses in order to limit the Fund’s Total Annual Operating Expenses to 1.45% through June 30, 2025.
For the Fund’s current one-year expense ratio, please refer to the Financial Highlights section of this report.
Performance data quoted represents past performance and does not guarantee future results. The investment return and principal value of an investment in the Fund will fluctuate so that an investor's shares, when redeemed, may be worth more or less than their original cost. Current performance of the Fund may be lower or higher than the performance quoted. Performance data current to the most recent month-end may be obtained by visiting www.gafunds.com, or calling (800) 915-6565.
Strength in oil and gas prices (spot and long-dated) led to good returns for energy equities in 2021. As ever, the performance of the MSCI World Energy Index was only part of the story, with 2021 seeing divergence between the energy equity subsectors:
| · | Integrated oil and gas companies were slightly below average in the sector. US super majors (Exxon and Chevron) were amongst the best performers, benefitting from the strength in the US economy and buoyancy of the US stock market in general. European integrateds outperformed the broad market but lagged US peers despite reporting free cashflow yields far in excess of the 10-year average. The weakest integrateds were those more exposed to aviation fuel refining, where demand continued to struggle. |
| · | Exploration and production (E&P) was the strongest performing sector. E&Ps in most regions benefitted from the tightening of oil and gas markets, in particular those with North American operations. Higher commodity prices resulted in especially good returns for companies with lower growth but greater operational and financial leverage. The stock market was also kind to E&P companies that showed commitment to capital discipline over production growth, with new mechanisms such as variable dividends being well received. |
| · | Oil refiners were underperformers, performing well versus the broad market but underperforming E&P and integrateds. Whilst refining margins in the US and Europe have improved since 2020, the COVID demand overhang remains. A bright spot was biodiesel exposure, with demand helped by governments mandating higher biodiesel consumption. In emerging markets, the strength of oil prices (especially in local currency terms) put pressure on refining margins, particularly in countries with regulated retail fuel pricing. |
| · | Midstream was a slight underperformer over the year. With revenues generally linked to pipeline capacity and throughout rather than commodity prices, most midstream companies were relative laggards versus producing companies. Pipeline companies exposed to gas generally performed better than those exposed to oil. |
| · | Energy services underperformed, despite the rising oil and gas price environment. The sector remained weighed down by excess capacity issues. Sustained capital discipline from oil and gas producers was also a factor, with lower E&P spending translating into lower service revenues. Large cap diversified service providers were a little more resilient. We also saw a number of service companies, particularly in offshore design and installation, turn to the energy transition (e.g. offshore wind), though replacing oil & gas revenues is proving challenging. |
On a stock-by stock-basis in the fund, our three US shale oil biased E&P companies (Devon Energy Corp +196%; EOG Resources +89%; Pioneer Natural Resources +66%) were strong performers, enjoying a high degree of operational leverage to rising oil prices. US integrateds (Exxon +57%; Chevron +27%) and our US refining holding (Valero +42%) outperformed, benefitting from growing optimism around the US refining environment, plus general buoyancy in the US stock market. Canadian integrateds (Imperial Oil +96%; Canadian Natural Resources +85%; Suncor +55%) were also strong, with high-cost oil sands operations enjoying oil price leverage and growing free cashflow profiles.
Natural gas producers performed well, thanks to strength in the underlying commodity. Gazprom, which controls a significant proportion of gas imports in Europe and China, returned 73%. Petrochina, which owns the majority of China’s domestic natural gas reserves, was up by 55%.
Weaker subsectors in the fund included European mid and larger cap integrateds (Galp -3%; Repsol +21%; TotalEnergies +26%), the common theme here being weaker prospects for downstream earnings, especially for refining operations exposed to the aviation sector, as Galp and Repsol’s are. In the oil services sector, our main large cap pick, Schlumberger (+40%) underperformed the fund but was a relatively good performer versus peers, whereas smaller cap offshore services company Helix (-26%) struggled.
2. PORTFOLIO POSITION
The sector and geographic weightings of the portfolio at December 31, 2021 were as follows:
| Sector breakdown | Dec. 31, 2020 | Dec. 31, 2021 |
| Integrated | 56.3 | 56.3 |
| Exploration and production | 22.3 | 24.2 |
| Drilling | 0.0 | 0.0 |
| Equipment and services | 4.6 | 5.2 |
| Refining and marketing | 7.3 | 7.2 |
| Storage & Transportation | 4.4 | 4.3 |
| Solar | 1.8 | 2.2 |
| Cash | 3.3 | 0.7 |
| Total | 100 | 100 |
| Geographic breakdown | Dec. 31, 2020 | Dec. 31, 2021 |
| US | 33.1 | 35.0 |
| Canada | 15.6 | 17.3 |
| UK | 8.5 | 6.5 |
| Europe | 28.9 | 26.7 |
| Hong Kong | 9.2 | 9.0 |
| Russia | 4.0 | 3.8 |
| Other | 0.0 | 0.0 |
| Cash | 0.7 | 1.8 |
| Total | 100 | 100 |
3. MARKET BACKGROUND
The year of 2021 saw a sustained tightening in the balance of the oil market. Organization of the Petroleum Exporting Countries (OPEC) kept their discipline, maintaining their production quotas at levels which allowed global oil inventories to decline. The recovery in global oil demand has been strong but uneven. OECD demand has lagged, held back by the aviation sector, but non-OECD demand is now at new highs. Oil prices responded positively, with the Brent spot price up by around 50% over the year. European and Asian natural gas prices reached record levels, driven by surging global power consumption, lower Russian supply and a shortage of coal. Rising oil and gas prices created a positive backdrop for oil & gas equities. Energy was the strongest equity sector in the MSCI in 2021, having been the weakest in 2020.
Global oil demand in 2021 is estimated to have risen by around 5.5m b/day, the post-COVID economic recovery having gained momentum. After lockdowns in the first quarter, accelerated vaccination programs contributed to mobility improving across the world, especially US and Europe. Freight and industrial activity surged. The area of oil demand that continued to lag was aviation. Globally, commercial flights in 2021 remained around 25% lower than in 2019. Even in this sector, however, there were signs of improvement, with commercial flights ending the year down by less than 20% versus 2019.
OPEC, led by Saudi, were focused on micromanaging the oil market as demand improved. Their approach has been a cautious one, returning oil to the market but in volumes that have kept the overall balance tight. Outside OPEC+, there was no significant supply response, leaving the direction of the oil price in OPEC’s hands.
OPEC+ started the year with quotas 7.8m b/day below ‘base line’. Saudi reacted to the softness in European demand in the first quarter with the unilateral decision to remove a further 1m b/day from the market, which was later reversed. From March to June, OPEC+ increased their supply by 2m b/day. Then in July, the group set out a clear trajectory for their output, announcing a monthly supply increase of 0.4m b/day from August 2021 to September 2022, adding to 5.8m b/day. At the same time, the quota agreement was extended from April 2022 to December 2022. “OPEC+ is here to stay”, declared the Saudi Energy Minister after the July meeting, adding that the OPEC+ spirit of cooperation would enable supply coordination beyond 2022 if required. The group has been disciplined, maintaining at least 100% compliance with quotas every month in 2021.
Low investment in oil supply outside OPEC in 2021 further compounded an already weakened outlook for oil project investment, increasing the risk that new large-scale oil projects will not be sufficient to satisfy demand. 2021 ended as the lowest year for large project additions since the early 2000s.
For US shale oil, production has recovered from the lows of May/June 2020, but still sits around 1.2m b/day below the November 2019 peak of 10.4m b/day. Shale oil producers added back drilling rigs, but at a significantly slower pace than in the 2016 cycle. Instead, equity markets rewarded companies that prioritized free cashflow and dividends over the recycling of cashflow into additional drilling.
Overall, non-OPEC supply is expected to have recovered by 0.7m b/day in 2021, having fallen by 2.6m b/day in 2020. Given that demand has rebounded by over 5m b/day, it has fallen to OPEC to control market balance.
Thanks to the events described above, spot oil prices rose strongly in 2021. Brent started the year at $51/bl, moved up to nearly $70/bl in early March, before falling to the low $60s/bl. The price then resumed its upwards trajectory, rising to over $80/bl in October. Uncertainty around the Omicron COVID variant created volatility in the final few weeks of the year, the spot price dropping back into the $60s/bl, before rallying to close 2021 at $77/bl. Brent spot averaged $70/bl in 2021, versus $42/bl in 2020. The five-year forward Brent price opened the year at $49/bl and rose by the end of December to $64/bl.
WTI oil prices in the US followed a similar path, with WTI reaching $77/bl by the end of December. Five-year forward WTI was up from $45/bl to $58/bl.
Brent spot vs five year forward oil prices (2017-21)

Source: Bloomberg
For natural gas, several factors came together across to globe to drive prices materially higher. Surging power demand as many economies recovered from COVID; cold weather in Europe; drought in Brazil and China curbing hydro output; higher European carbon prices; lower supply from Russia; and a shortage of coal in China came together to create extraordinarily tight markets. The European gas price (using UK NBP) rose from $7.7/mcf to $21.0/mcf; Japanese LNG prices rose from $7.3/mcf to $31.0/mcf; and the US spot price (Henry Hub) rose from $2.5/mcf to $3.7/mcf. In the US, exports of LNG reached new highs of around 11 Bcf/day, as the arbitrage between US and European/Asian prices was wide enough to incentivize export operations to run at full capacity.
International natural gas prices 2005-21
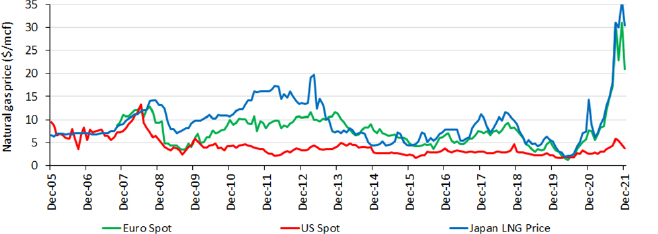
Source: Bloomberg; Guinness Asset Management
4. OUTLOOK
Following a successful year of oil inventory management in 2021, the OPEC+ group will be looking this year to bring additional supply back into the market as the oil demand trajectory allows. Their aim will be to keep global inventories under control, whilst achieving an oil price which satisfies the fiscal needs of its members.
The path for oil demand will vary region by region, as developed markets plus China continue their strong vaccination roll out, whilst other emerging countries remain more exposed to COVID. Overall, the IEA forecast demand in 2022 of 99.5m b/day, up by 3.3m b/day versus 2021. This would put global oil demand on par with its previous peak in 2019, and on course to reach a new high in 2023. The IEA’s forecasts imply that oil demand in the OECD region will still, on average, be around 3% lower in 2022 than in 2019. By contrast, demand in the non-OECD region in 2022 is expected to be around 3% ahead of 2019.
OPEC+ will maintain high compliance with quotas, remaining alert to any demand or supply issues that might require deviation from the 0.4m b/day monthly increases in production currently planned until September. Iran remains the wildcard, with a possible 1m b/day supply increase if negotiations with the US conclude successfully. If this occurs, OPEC+ will take it in its stride. We believe the oil price desired by OPEC is at around $65-70/bl, though they will welcome a higher outcome if it does not destabilize the global economy.
We expect moderate growth from US shale production, with average production rising 0.5m-0.75m b/day versus 2021. Non-OPEC (ex US shale) will take its share of the OPEC+ quota increases, but beyond that, there will be no major roll-out of large new projects, the cycle having peaked in 2020.
For natural gas, relief from very high prices should be forthcoming. Additional supply will come from Russia and Norway; China is increasing its coal supply, and with normalized weather, hydro and wind generation will pick up again. Prices should settle back around $7-9/mcf, well down on current levels, but a significant step up on 2019/20.
Despite the 2021 rally, energy equity valuations remain subdued. The MSCI World Energy Index now trades on a price to book ratio of 1.6x, versus the S&P500 at 4.9x. The relative P/B of energy vs the S&P500 remains close to a 55-year low.
Oil and gas companies are demonstrating a meaningful shift towards capital discipline, manifested in lower levels of reinvestment, lower levels of debt and a return of free cash to shareholders. We forecast a free cashflow yield for our portfolio in 2022, assuming $65/bl Brent, of around 9%.
Energy equities offer attractive upside if our oil price, profitability and free cashflow scenarios play out. We believe energy equities currently discount an oil price of around $55/bl. Adopting $65/bl Brent as a long-term oil price (consistent with the bottom end of OPEC’s desired range), we see around 40% upside across the energy complex.
| Will Riley & Jonathan Waghorn | January 2022 |
The Fund invests in foreign securities, which involve political, economic, currency risks, greater volatility, and differences in accounting methods. These risks are greater for emerging markets. The Fund is non-diversified, meaning that its assets may be invested in fewer individual holdings than diversified funds. Therefore, the Fund is more exposed to individual stock volatility than diversified funds. The Fund invests in smaller companies, which involve additional risks such as limited liquidity and greater volatility. The Fund’s focus on the energy sector to the exclusion of other sectors exposes the Fund to greater market risk and potential monetary losses than if the Fund’s assets were diversified among various sectors.
The MSCI World Energy Index is an unmanaged index composed of more than 1,400 stocks listed on exchanges in the U.S., Europe, Canada, Australia, New Zealand and the Far East. Net Return reflects deduction for withholding tax but reflects no deduction for fees and expenses. Net Return is net of local withholding taxes that any investor would pay. This index is unmanaged and is not available for investment, and do not incur expenses.
MCF is an abbreviation denoting a thousand cubic feet of natural gas.
Price to Book Ratio (P/B Ratio) a ratio used to compare a stock’s market value to its book value. It is calculated by dividing the current closing price of the stock by the latest quarter’s book value per share.
P/E – Price to Earnings ratio is calculated by dividing current price of the stock by the company’s trailing months’ earnings per share.
Free cashflow – Represents the cash that a company is able to generate after laying out the money required to maintain or expand its asset base.
Please refer to the Schedule of Investments for details on Fund holdings. Current and future portfolio holdings are subject to risk.
The information provided herein represents the opinion of Guinness Atkinson Asset Management, Inc. for the period stated and it is not intended to be a forecast of future events, a guarantee of future results, or investment advice. Opinions, Fund holdings and sector allocations are subject to change at any time, and are not recommendations to buy or sell any security.
Global Energy Fund
Growth of $10,000 (Unaudited)

| Average Annual Total Return |
| Periods Ended December 31, 2021 |
| One Year | | Five Years | | Ten Years |
| 45.98% | | -3.19% | | -2.00% |
Performance data quoted represents past performance and does not guarantee future results. The investment return and principal value of an investment will fluctuate so that an investor's shares, when redeemed, may be worth more or less than their original cost. Current performance of the Fund may be lower or higher than the performance quoted. Performance data current to the most recent month end may be obtained by visiting www.gafunds.com.
Total returns for certain periods reflect a fee waiver in effect and in the absence of this waiver, the total returns would be lower. Returns reflect the reinvestment of distributions made by the Fund, if any. The graph and the performance table above do not reflect the deduction of taxes that a shareholder would pay on Fund distribution or the redemption of Fund shares.
The Hang Seng Composite Index is a market-capitalization weighted index that comprises the top 200 companies listed on the Hong Kong Stock Exchange, based on the average market capitalization for the past twelve months. The index referenced in this chart is not available for investment and does not incur expenses. Net Return reflects deduction for withholding tax but reflects no deduction for fees and expenses. Net Return is net of local withholding taxes that any investor would pay.
FUND HIGHLIGHTS at December 31, 2021
GUINNESS ATKINSON GLOBAL ENERGY FUND
| # of Holdings in Portfolio: | | | 33 | |
| Portfolio Turnover: | | | 49.6 | % |
| % of Stocks in Top 10: | | | 44.2 | % |
| Fund Managers: |
| Timothy Guinness |
| Will Riley |
| Jonathan Waghorn |
| Top 10 Holdings (% of net assets) | | | |
| Chevron Corp. | | | 4.8 | % |
| Imperial Oil Ltd. | | | 4.6 | % |
| Canadian Natural Resources Ltd. | | | 4.5 | % |
| ConocoPhillips | | | 4.5 | % |
| Exxon Mobil Corp. | | | 4.4 | % |
| EOG Resources Inc. | | | 4.4 | % |
| Devon Energy Corp. | | | 4.3 | % |
| TOTAL SA | | | 4.3 | % |
| Equinor ASA | | | 4.2 | % |
| Suncor Energy, Inc. | | | 4.2 | % |
| Geographic Breakdown (% of net assets) |
| United States | | | 35.4 | % |
| Canada | | | 17.3 | % |
| China | | | 9.0 | % |
| United Kingdom | | | 6.0 | % |
| France | | | 4.3 | % |
| Norway | | | 4.2 | % |
| Netherlands | | | 4.0 | % |
| Italy | | | 3.9 | % |
| Russia | | | 3.8 | % |
| Austria | | | 3.6 | % |
| Spain | | | 3.5 | % |
| Portugal | | | 3.1 | % |
| Singapore | | | 0.1 | % |
GUINNESS ATKINSON GLOBAL ENERGY FUND
Schedule of Investments
at December 31, 2021
| Shares | | | Common Stocks: 98.2% | | Value | |
| | | | Energy - Alternate Sources: 0.8% | | | |
| | 662 | | | Maxeon Solar Technologies Ltd. | | $ | 9,202 | |
| | 4,300 | | | SunPower Corp.* | | | 89,741 | |
| | | | | | | | 98,943 | |
| | | | | | | | | |
| | | | | Oil & Gas - Exploration & Production: 26.3% | | | | |
| | 13,100 | | | Canadian Natural Resources Ltd. | | | 553,711 | |
| | 262,000 | | | CNOOC Ltd. | | | 269,847 | |
| | 7,600 | | | ConocoPhillips | | | 548,568 | |
| | 2,311,662 | | | Deltic Energy PLC | | | 69,581 | |
| | 12,000 | | | Devon Energy Corp. | | | 528,600 | |
| | 41,770 | | | Diversified Gas & Oil PLC | | | 58,993 | |
| | 206,297 | | | EnQuest PLC* | | | 52,244 | |
| | 6,050 | | | EOG Resources Inc. | | | 537,421 | |
| | 93,214 | | | JKX Oil & Gas PLC* | | | 50,314 | |
| | 137,690 | | | Pharos Energy PLC | | | 48,429 | |
| | 2,650 | | | Pioneer Natural Resources Company | | | 481,982 | |
| | 5,221,570 | | | Reabold Resources PLC* | | | 12,715 | |
| | | | | | | | 3,212,405 | |
| | | | | Oil & Gas - Field Services: 4.2% | | | | |
| | 20,180 | | | Helix Energy Solutions Group, Inc.* | | | 62,962 | |
| | 15,100 | | | Schlumberger Ltd. | | | 452,245 | |
| | | | | | | | 515,207 | |
| | | | | Oil & Gas - Integrated: 59.3% | | | | |
| | 111,530 | | | BP PLC | | | 498,651 | |
| | 5,020 | | | Chevron Corp. | | | 589,097 | |
| | 848,000 | | | China Petroleum & Chemical | | | 394,823 | |
| | 34,670 | | | Eni SpA | | | 482,028 | |
| | 19,340 | | | Equinor ASA | | | 517,882 | |
| | 8,850 | | | Exxon Mobil Corp. | | | 541,531 | |
| | 39,180 | | | Galp Energia Sgps Sa | | | 379,796 | |
| | 50,610 | | | Gazprom OAO - ADR | | | 467,636 | |
| | 15,551 | | | Imperial Oil Ltd. | | | 561,019 | |
| | 7,768 | | | OMV AG | | | 441,460 | |
| | 972,000 | | | PetroChina Co., Ltd. - H Shares | | | 432,610 | |
| | 36,291 | | | Repsol SA | | | 430,903 | |
| | 22,490 | | | Royal Dutch Shell PLC - Class A | | | 494,104 | |
| | 20,476 | | | Suncor Energy, Inc. | | | 512,487 | |
| | 10,330 | | | TOTAL SA | | | 524,534 | |
| | | | | | | | 7,268,561 | |
The accompanying notes are an integral part of these financial statements.
GUINNESS ATKINSON GLOBAL ENERGY FUND
Schedule of Investments
at December 31, 2021
Shares | | | Common Stocks: 98.2% | | Value | |
| | | | Oil & Gas - Pipelines and Transportation: 4.0% | | | |
| | 12,600 | | | Enbridge Inc. | | $ | 492,408 | |
| | | | | Oil Refining & Marketing: 3.6% | | | | |
| | 5,869 | | | Valero Energy, Corp. | | | 440,821 | |
| | | | | Total Common Stocks | | $ | 12,028,345 | |
| | | | | (cost $14,652,573) | | | | |
| | | | | Total Investments in Securities | | | 12,028,345 | |
| | | | | (cost $14,652,573): 98.2% | | | | |
| | | | | Other Assets less Liabilities: 1.8% | | | 225,360 | |
| | | | | Net Assets: 100.0% | | $ | 12,253,705 | |
| * | Non-income producing security. |
ADR - American Depository Receipt
PLC - Public Limited Company
The accompanying notes are an integral part of these financial statements.
GUINNESS ATKINSON GLOBAL INNOVATORS FUND
ANNUAL REPORT FOR THE PERIOD ENDED
DECEMBER 31, 2021
| AVERAGE ANNUAL TOTAL RETURNS | 1 YEAR | 3 YEARS | 5 YEARS | 10 YEARS |
| FUND |
| Investor Class | 21.52% | 31.36% | 20.51% | 18.13% |
| Institutional Class* | 21.86% | 31.69% | 20.81% | 18.31% |
| BENCHMARK INDICES: |
| MSCI WORLD INDEX (Net Return) | 21.82% | 21.68% | 15.01% | 12.68% |
| NASDAQ COMPOSITE INDEX | 22.18% | 34.23% | 24.94% | 20.93% |
Fund performance (Total Return in USD). Bloomberg and Guinness Atkinson Asset Management
*Institutional Class shares commenced on December 31, 2015. The performance figures for the Institutional Class shares include the performance of Investor Class shares for the period prior to the inception date of the Institutional Class shares.
Investor Class Gross 1.24% & Net 1.24%; Institutional Class Gross 1.07% & Net 0.99%. The Adviser has contractually agreed to reduce its fees and/or pay Fund expenses in order to limit the Fund’s Total Annual Operating Expenses for Investor Class and for Institutional Class shares to 1.24% and 0.99% through June 30, 2025.
For the Fund’s current one-year expense ratios, please refer to the Financial Highlights section of this report.
Performance data quoted represents past performance and does not guarantee future results. The investment return and principal value of an investment in the Fund will fluctuate so that an investor's shares, when redeemed, may be worth more or less than their original cost. Current performance of the Fund may be lower or higher than the performance quoted. Performance data current to the most recent month-end may be obtained by visiting www.gafunds.com, or calling (800) 915-6565.
Summary
Over 2021, the Guinness Atkinson Global Innovators Fund produced a total return of 21.52% (in USD) vs the MSCI World Index net total return of 21.82% (in USD). The fund therefore underperformed the benchmark by 0.30%.
Performance
For the 1st quarter of 2021, the Guinness Atkinson Global Innovators Fund provided a total return of 4.18% (USD) against the MSCI World Index net total return of 4.92% (USD). Hence, the fund underperformed the benchmark by 0.74% (USD). Whilst equity markets rose across all regions, it was not smooth sailing. US Treasuries yields were sent higher on greater inflation expectations, negatively affecting the more interest rate-sensitive high growth sectors, and leading to value outperforming. Overall, the markets were buoyed by increasingly optimistic economic growth expectations, governments continuing their unprecedented fiscal policies (including newly elected President Biden’s proposed $2tn package), a strong covid-19 vaccine rollout and supportive central bank policy. During the quarter, although the IT sector was a laggard, the semiconductor industry outperformed. Industry supply constraints and continued growth in capital expenditure from leading foundries meant the fund’s semiconductor exposure was the fund’s largest contributor to performance, primarily from the semiconductor equipment manufacturers, Applied Materials (+55.1% TR in USD), KLA Corp (+28.0%), and LAM Research (+26.3%).
For the 2nd quarter, the Guinness Atkinson Global Innovators Fund provided a total return of 9.82% (USD) against the MSCI World Index net total return of 7.74% (USD). Hence, the fund outperformed the benchmark by 2.08% (USD). The 2nd quarter began as the 1st quarter finished: Covid-19 vaccination programs progressed for many regions, leading covid-19 deaths to flatline and an easing of mobility restrictions. With that, activity across many regions began to pick up, with economic indicators broadly pointing to economic expansion. However, as the quarter progressed the Delta variant came to prominence and we started to see a slowdown in the economy and a coincident fall in rates with the US 10yr Treasury Yield dropping from its recent highs of 1.7%. From mid-May to quarter end, growth stocks staged a strong rally and the value stocks that had performed well in the year to that point fell back, leading to growth outperforming over the quarter as a whole. The fund’s overweight exposure to IT was a positive contributor to relative performance, and while the Industrial sector was the second worst performing over the quarter, strong stock selection within this sector for the fund drove positive attribution, particularly from companies such as Roper Technologies (+16.7% TR in USD) and ABB (+11.9%) .
For the 3rd quarter of 2021, the Guinness Atkinson Global Innovators Fund provided a total return of -2.22% (USD) against the MSCI World Index net total return of -0.01% (USD). The outperformance of growth stocks, and in particular ‘quality’ growth stocks where future earnings are seen as more reliable, continued for much of the 3rd quarter. However, in mid-September the market turned once more as the market began to price in a more hawkish Fed taper and future rate rises, alongside increased worries around China and global growth in general, and continued uncertainty around the prospects for inflation and disrupted supply chains. The strong gains seen in the first two months of the quarter were wiped out, and value relatively outperformed in September. During the quarter, strong stock selection within Healthcare names was a tailwind for the fund, with Danaher (+13.52 TR in USD) and Thermo-Fisher (+13.3) being the fund’s top two performing holdings over the period, driven by strong earnings releases. Underperformance was driven in part by our remaining Chinese position, Anta Sports, which fell 19.6% over the quarter following a broader sell off in China equities as a whole .
For the 4th quarter of 2021, the Guinness Atkinson Global Innovators Fund provided a total return of -8.63% (USD) against the MSCI World Index net total return of 7.77%. Hence, the Fund outperformed the benchmark by 0.84%. Global equities had a mixed 4th quarter, with significant outperformance from developed markets. Sentiment remained subdued in the early stages of the quarter, yet markets soon regained momentum following the onset of a strong earnings season reflecting continued good results from companies despite the economic headwinds. Momentum carried stocks through until late November when the emergence of the Covid-19 Omicron variant spooked the market into one of the largest sell-offs of the year. Equities were dealt a further blow as Central Banks became markedly more hawkish in tone as inflation continued to prove more persistent than transitory. Omicron fears eventually waned after indications of a lower hospitalisation risk, yet investor trepidation meant a preference for more defensive stocks as coronavirus infections continued to surge. Whilst growth outperformed during the 4th quarter overall, December saw a strong rotation into value. An overweight position to Semiconductor companies was of particular benefit to the fund during the 4th quarter, with all Fund holdings in this industry including Nvidia (+42.0% TR in USD), KLA (+28.9%), and Lam Research (+26.6%) outperforming the MSCI World Index.
More broadly, over the entire 2021, fund performance can be attributed to:
| · | IT, the fund’s largest sector exposure, was the largest positive contributor to the fund’s relative performance particularly through the exposure to semiconductors – 4 of the top 5 performers were semiconductor stocks (Nvidia +125.5%, Applied Materials +83.6%, KLA Corp +68.0%, Lam Research +53.7%, all TR in USD). |
| · | Fund exposure to Industrials was the second largest contributor through positive stock selection to clean energy & sustainability related stocks including ABB (+40.2% TR in USD) and Schneider Electric (+38.5%). |
| · | Consumer Discretionary was the largest drag primarily through the fund’s holding of Chinese stocks New Oriental Education (-59.2% TR in USD, until sold in Q2) and Anta Sports (-4.7%). |
| · | Additionally, not owning any Energy stocks – the best performing sector over 2021 - was also a drag on performance. |
Activity
We sold three positions and initiated three new positions over the course of 2021.
| · | We made no changes over Q1. |
| · | During Q2, we sold two positions, Check Point Software and New Oriental Education, and initiated two positions in Taiwan Semiconductor and Apple. |
| · | During Q3, we sold our position in Tencent, and entered into one new position, Amphenol. |
| · | We made no changes over Q4. |
Outlook
The Guinness Atkinson Global Innovators Fund seeks to invest in quality innovative growth companies trading at reasonable valuations. By doing so, we seek to invest in companies that are experiencing faster profit growth, larger margins and are less susceptible to cyclical pressures. We are pleased with how well the fund has performed despite the varying market conditions over the last 2 years. In particular, our focus on quality growth-at-a-reasonable-price has shown it strength in avoiding the highly valued non-profitable tech businesses that have swung between large rises and falls.
The table below illustrates how the portfolio at year-end reflects the four key tenets of our approach. The four key tenets of our approach are innovation, quality, growth, and conviction. The fund has attractive characteristics to the broad market; higher spend on intellectual property through research and development (R&D), had less capital intensiveness, had higher cash flow returns on investment, with higher historic growth. The fund currently trades at a 18.2% premium to the benchmark on a PE basis which we believe is a reasonable price to pay for this attractive set of characteristics.
| | | Fund | MSCI World Index |
| Innovation | R&D / Sales | 9.0% | 7.6% |
| CAPEX / Sales | 6.3% | 8.4% |
| Quality | Return-on-Capital | 18.8% | 6.4% |
| Weighted average net debt / equity | 10.1% | 53.7% |
| Growth (& valuation) | Trailing 5-year sales growth (annualised) | 12.8% | 3.2% |
| Estimated earnings growth (2023 vs 2022) | 12.1% | 6.7% |
| PE (2022e) | 24.0 | 20.4 |
| Conviction | Number of stocks | 30 | 1555 |
| Active share | 80.7% | - |
Source: Guinness Atkinson Asset Management, Bloomberg, as of 12.31.2021
In the current market environment where inflation concerns and slower growth remain top of mind, we are optimistic that the Fund’s focus on high quality growth stocks, underpinned by secular growth trends stands us in good stead going forward. As we look into 2022, the prospects for further multiple expansion at the index level do not look particularly likely given that central banks are talking about tightening monetary policy. On the other hand, demand in the economy remains strong, US capital expenditure is potentially at an all-time high, and most companies are raising prices which suggests the prospects for earnings growth in 2022 look more positive than multiple expansion. This further bodes well for what we believe are our high-quality, growth businesses.
Ian Mortimer & Matthew Page
January 202
The Fund invests in foreign securities, which involve political, economic and currency risks, greater volatility, and differences in accounting methods. These risks are greater for emerging markets. The Fund invests in smaller and mid-cap companies, which involve additional risks such as limited liquidity and greater volatility than investments in larger companies. The Fund’s focus on the technology, internet and communications sectors are extremely competitive and subject to rapid rates of change.
The approach of the Fund is not to provide access to the most innovative companies in the world but rather to look at companies using the ‘prism’ of innovation to highlight those we think might be winners in the future - and then only buy them if they are offering reasonable value compared to those future expectations. We are firm believers that innovative companies may outperform in the future and that a value discipline to stock selection has the potential to add to that performance.
The MSCI World Index is a free float-adjusted market capitalization weighted index that is designed to measure the equity market performance of developed markets. Net Return reflects deduction for withholding tax but reflects no deduction for fees and expenses. Net Return is net of local withholding taxes that any investor would pay. The NASDAQ Composite Index is a market capitalization-weighted index that is designed to represent the performance of the National Market System, which includes over 5,000 stocks traded only over-the-counter and not on an exchange. These indices are unmanaged and are not available for investment, and do not incur expenses.
Capital expenditures (CapEx) are funds used by a company to acquire, upgrade, and maintain physical assets such as property, technology, or equipment. CapEx is often used to undertake new projects or investments by a company.
Gross domestic product (GDP) is the total monetary or market value of all the finished goods and services produced within a country’s borders in a specific time period.
Earnings per share (EPS) is calculated as a company's profit divided by the outstanding shares of its common stock.
Return on Capital is a ratio used as a measure of the profitability and value-creating potential of companies relative to the amount of capital invested by shareholders and other debtholders.
Net Debt / Equity is a measure of a company’s financial leverage. It is calculated by dividing its net liabilities by stockholders’ equity. This is measure using the most recent balance sheet available.
Earnings Growth is the annual compound annual growth rate of earnings from investments.
Active Share measures how much an equity portfolio’s holdings differ from the benchmark index constituents.
PE – Price to Earnings ratio is calculated by dividing current price of the stock by the company's trailing twelve months earnings per share.
Cash flow measures the cash generating capability of a company by adding non-cash charges (e.g. depreciation) and interest expense to pretax income.
A cash flow return on investment (CFROI) is a valuation metric that acts as a proxy for a company's economic return. This return is compared to the cost of capital, or discount rate, to determine value-added potential.
Earnings growth is not representative of the Fund’s future performance.
Please refer to the Schedule of Investments for details on Fund holdings. Current and future portfolio holdings are subject to risk.
The information provided herein represents the opinion of Guinness Atkinson Asset Management, Inc. for the period stated and is not intended to be a forecast of future events, a guarantee of future results, or investment advice. Opinions, Fund holdings and sector allocations are subject to change at any time, and are not recommendations to buy or sell any security
Global Innovators Fund
Growth of $10,000 (Unaudited)

Average Annual Total Return
Periods Ended December 31, 2021
| | | One Year | | Five Years | | Ten Years |
| Investor Class | | 21.52% | | 20.51% | | 18.13% |
| Institutional Class 1 | | 21.86% | | 20.81% | | 18.31% |
Performance data quoted represents past performance and does not guarantee future results. The investment return and principal value of an investment will fluctuate so that an investor's shares, when redeemed, may be worth more or less than their original cost. Current performance of the Fund may be lower or higher than the performance quoted. Performance data current to the most recent month end may be obtained by visiting www.gafunds.com.
The performance graph above is shown for the Fund's Investor Class shares; Institutional Class shares performance may vary.
Total returns for certain periods reflect a fee waiver in effect and in the absence of this waiver, the total returns would be lower. Returns reflect the reinvestment of distributions made by the Fund, if any. The graph and the performance table above do not reflect the deduction of taxes that a shareholder would pay on Fund distribution or the redemption of Fund shares.
The MSCI World Index (Net Return) is a free float-adjusted market capitalization weighted index that is designed to measure the equity market performance of developed markets. Net Return reflects deduction for withholding tax but reflects no deduction for fees and expenses. Net Return is net of local withholding taxes that any investor would pay. The NASDAQ Composite Index is a market capitalization weighted index that is designed to represent the performance of the National Market System which includes over 5,000 stocks traded only over-the-counter and not on an exchange. The indices referenced in this chart are not available for investment and do not incur expenses.
| 1 | Performance information for the Institutional Class, prior to commencement of operations on December 31, 2015, is based on the performance of Investor Class, and adjusted for the lower expenses applicable to Institutional Class. |
FUND HIGHLIGHTS at December 31, 2021
GUINNESS ATKINSON GLOBAL INNOVATORS FUND
| # of Holdings in Portfolio: | | | 30 | |
| Portfolio Turnover: | | | 19.0 | % |
| % of Stocks in Top 10: | | | 37.3 | % |
| Fund Managers: |
| Dr. Ian Mortimer |
| Matthew Page |
| Top 10 Holdings (% of net assets) | | | |
| NVIDIA Corp. | | | 4.4 | % |
| Apple Inc. | | | 3.8 | % |
| KLA-Tencor Corp. | | | 3.8 | % |
| Lam Research Corp. | | | 3.8 | % |
| Microsoft Corp. | | | 3.6 | % |
| Applied Materials Inc. | | | 3.6 | % |
| Intercontinental Exchange, Inc. | | | 3.6 | % |
| Schneider Electric SE | | | 3.6 | % |
| Thermo Fisher Scientific Inc. | | | 3.6 | % |
| Amphenol Corporation | | | 3.5 | % |
| Geographic Breakdown (% of net assets) |
| United States | | | 74.2 | % |
| Germany | | | 6.6 | % |
| France | | | 3.6 | % |
| Switzerland | | | 3.5 | % |
| Taiwan | | | 3.3 | % |
| South Korea | | | 3.2 | % |
| Ireland | | | 2.5 | % |
| China | | | 2.5 | % |
GUINNESS ATKINSON GLOBAL INNOVATORS FUND
Schedule of Investments
at December 31, 2021
| Shares | | | Common Stocks: 99.4% | | Value | |
| | | | Application Software: 3.6% | | | |
| | 24,474 | | | Microsoft Corp. | | $ | 8,231,096 | |
| | | | | Athletic Footwear: 3.5% | | | | |
| | 47,756 | | | NIKE Inc. | | | 7,959,492 | |
| | | | | Cable/Satellite TV: 2.8% | | | | |
| | 126,738 | | | Comcast Corp. - Class A | | | 6,378,724 | |
| | | | | Commercial Services: 2.2% | | | | |
| | 26,465 | | | PayPal Holdings, Inc.* | | | 4,990,770 | |
| | | | | Computers: 3.9% | | | | |
| | 48,896 | | | Apple Inc. | | | 8,682,463 | |
| | | | | Diversified Manufacturing Operations: 6.9% | | | | |
| | 22,829 | | | Danaher Corp. | | | 7,510,969 | |
| | 12,038 | | | Thermo Fisher Scientific Inc. | | | 8,032,235 | |
| | | | | | | | 15,543,204 | |
| | | | | E-Commerce: 3.1% | | | | |
| | 2,093 | | | Amazon.com Inc.* | | | 6,978,774 | |
| | | | | Electronic Components - Semiconductor: 14.6% | | | | |
| | 91,736 | | | Amphenol Corporation | | | 8,023,231 | |
| | 166,834 | | | Infineon Technologies AG | | | 7,736,875 | |
| | 33,523 | | | NVIDIA Corp. | | | 9,859,449 | |
| | 4,381 | | | Samsung Electronics Co., Ltd. - GDR | | | 7,224,269 | |
| | | | | | | | 32,843,824 | |
| | | | | Enterprise Software/Services: 6.2% | | | | |
| | 11,989 | | | Adobe Inc.* | | | 6,798,482 | |
| | 50,290 | | | SAP SE | | | 7,146,459 | |
| | | | | | | | 13,944,941 | |
| | | | | Finance - Other Services: 9.7% | | | | |
| | 59,536 | | | Intercontinental Exchange, Inc. | | | 8,142,739 | |
| | 19,759 | | | Mastercard Inc . | | | 7,099,804 | |
| | 30,763 | | | Visa Inc. | | | 6,666,650 | |
| | | | | | | | 21,909,193 | |
| | | | | Internet Content: 3.0% | | | | |
| | 20,370 | | | Meta Platforms Inc. - Class A* | | | 6,851,449 | |
The accompanying notes are an integral part of these financial statements.
GUINNESS ATKINSON GLOBAL INNOVATORS FUND
Schedule of Investments
at December 31, 2021
| Shares | | | Common Stocks: 99.4% | | Value | |
| | | | Machinery - Electric Utility: 3.5% | | | |
| | 206,267 | | | ABB Ltd. | | $ | 7,892,033 | |
| | | | | Machinery: 3.3% | | | | |
| | 15,320 | | | Roper Industries, Inc. | | | 7,535,295 | |
| | | | | Metal Instrument: 2.5% | | | | |
| | 55,070 | | | Medtronic PLC | | | 5,696,992 | |
| | | | | Networking Products: 3.5% | | | | |
| | 124,980 | | | Cisco Systems Inc. | | | 7,919,983 | |
| | | | | Pharmaceutical: 3.2% | | | | |
| | 115,957 | | | Bristol-Myers Squibb Co. | | | 7,229,919 | |
| | | | | Power Conversion/Supply Equipment: 3.6% | | | | |
| | 41,245 | | | Schneider Electric SE | | | 8,092,944 | |
| | | | | Retail - Apparel: 2.5% | | | | |
| | 378,000 | | | ANTA Sports Products Ltd. | | | 5,667,697 | |
| | | | | Semiconductor: 14.5% | | | | |
| | 52,216 | | | Applied Materials Inc. | | | 8,216,710 | |
| | 19,995 | | | KLA-Tencor Corp. | | | 8,600,049 | |
| | 11,842 | | | Lam Research Corp. | | | 8,516,174 | |
| | 62,010 | | | Taiwan Semiconductor - ADR | | | 7,460,423 | |
| | | | | | | | 32,793,356 | |
| | | | | Web Portals: 3.3% | | | | |
| | 2,554 | | | Alphabet Inc. - A Shares* | | | 7,399,040 | |
| | | | | Total Common Stocks | | $ | 224,541,189 | |
| | | | | (cost $104,844,834) | | | | |
| | | | | Total Investments in Securities | | | 224,541,189 | |
| | | | | (cost $104,844,834): 99.4% | | | | |
| | | | | Other Assets less Liabilities: 0.6% | | | 1,404,366 | |
| | | | | Net Assets: 100.0% | | $ | 225,945,555 | |
| * | Non-income producing security. |
ADR - American Depository Receipt
GDR - Global Depository Receipt
PLC - Public Limited Company
The accompanying notes are an integral part of these financial statements.
GUINNESS ATKINSON RENMINBI YUAN & BOND FUND
ANNUAL REPORT FOR THE PERIOD ENDED
DECEMBER 31, 2021
| AVERAGE ANNUALIZED TOTAL RETURN | 1 YEAR | 3 YEARS | 5 YEARS | 10 YEARS |
| Fund | 3.00% | 5.16% | 4.56% | 2.28% |
| Benchmark Indices: | | | | |
| Hang Seng Markit iBoxx Offshore RMB Overall Index | 5.04% | 6.59% | 6.13% | 3.96% |
| RMB Cash Offshore (CNH)* | 2.29% | 2.62% | 1.88% | -0.02% |
| RMB Cash Onshore (CNY)* | 2.69% | 2.67% | 1.79% | -0.10% |
| * | Net change in exchange rate versus U.S. dollar. |
Gross 5.26% & Net 0.91%. The Adviser has contractually agreed to reduce its fees and/or pay Fund expenses in order to limit the Fund’s Total Annual Operating Expenses to 0.90% through June 30, 2025.
For the Fund’s current one-year expense ratios, please refer to the Financial Highlights section of this report.
Performance data quoted represents past performance and does not guarantee future results. The investment return and principal value of an investment will fluctuate so that an investor’s shares, when redeemed, may be worth more or less than their original cost. Current performance of the Fund may be lower or higher than the performance quoted. Performance data current to the most recent month-end may be obtained by visiting www.gafunds.com, or calling (800) 915-6565.
The Fund rose 3.00% in the year compared to the offshore renminbi (CNH) which rose 2.29% against the dollar and the benchmark which rose 5.04%.
The renminbi had a bumpier year in 2021 but still ended the year 2.29% higher against the dollar following a 7.06% increase in 2020. The causes of the bumpiness were periodic COVID outbreaks with related disruptions to production and transportation, and growing concerns about financial stability in the real estate sector. The decision to by the authorities to enforce the ‘three red lines’ for real estate companies to meet to allow them to take on further debt raised concerns. When they were applied to Evergrande, both heavily indebted and perceived to be ‘close’ to government, then concerns were elevated into crisis for the sector. Earlier panic amongst some lenders and bondholders has subsided somewhat and the currency resumed its climb against the dollar to end the year at RMB6.357 to US$1.
The crisis in the real estate market was focused especially on the Chinese US dollar bond market where there was a sharp sell-off. The impact on the offshore Renminbi market, in which this Fund holds assets, has been much more muted. The Fund holds one real estate bond, Zhenro Properties, which is due to mature in June 2022. The bond is trading over 20% below par but the company has been buying back bonds, it paid its coupon on this and its other bonds on time and we expect it could mature at par on the maturity date.
Renminbi strength over the past two years has coincided with strong trade growth from China. The value of imports and exports combined exceed US$6 trillion for the first time and the trade surplus hit a new record at $676bn, which we estimate to be 3.9% of 2021 Gross Domestic Product (GDP). Trade related flows have been, we think, an important driver of currency appreciation and we think that portfolio flows associated with foreigners increasing their exposure to renminbi assets is another.
The duration of the offshore RMB market was 1.9 years as at the end of the period. China offshore renminbi sovereign bonds at 2 years’ maturity offered a yield 1.57% above equivalent Treasuries as US bond yields rose in response to domestic inflationary pressure. In the Corporate market, renminbi-denominated credits with a credit rating equivalent to single A by S&P, offered a yield premium of 2.10% above 2-year maturity US Corporate equivalents.
New issuance in the market reached RMB285 billion ($44 bn) by value. Excluding issuance by the People’s Bank of China (PBOC)which issues every quarter to help manage and maintain liquidity in the currency market, this falls to RMB175 billion ($27 bn) but this is still well up on last year. The bulk of new issuers have been financial institutions and supranational organizations.
During year four holdings matured: Far East Horizon 4.9% 2/27/21, Shui On Development 6.875% 3/2/21, Arab Petroleum Investment Corp 4.7% 3/13/21 and Daimler International Finance 4.8% 4/9/21.
We bought ten new positions which were funded by the matured positions and by new flows into the Fund. We bought KFW 2.7% 3/25/24, a German development bank and European Investment Bank 2.7% 4/22/24 both with triple A credit ratings. Amongst our new bank positions are HSBC 3.4% 6/29/27, China Construction Bank 2.85% 4/22/23 and Bank of China 3.08% 4/28/26. We also add a position in Hong Kong Mortgage Co 2.7% 2/9/24. We bought our first municipal bond, issued by Shenzhen and we also bought new positions in Volkswagen, Wharf and Qatar-based CBQ Finance.
Bonds issued by Government/Supranational organizations accounted for 18% of the portfolio with a further 14% issued by Chinese non-financial companies, 17% in Chinese banks and 18% in non-Chinese banks. Foreign (non-Chinese) corporate issuers accounted for 12%. The valuation of the portfolio as measured by the yield to maturity was 4.22% and the duration of the portfolio was 1.90 years, which compares to the market yield to maturity of 3.34% and duration of 1.93 years.
There is likely to be a narrowing of the interest rate differential between the USD and RMB; as the Federal Reserve moves to increase interest rates, China is moving in the opposite direction. We expect to see US monetary tightening in response to rising headline inflation but China, which never spent as much on COVID support has room for manoeuvre as economic growth decelerated at the end of last year. We expect therefore, that Chinese growth will hold above and this in turn could drive additional portfolio inflows, now enable by the Bond and Stock Connect channels.
The longer-term story for Chinese growth potential and Renminbi appreciate remains intact and we look forward to it with increased confidence. Chinese political, administrative and monetary systems are working well together on industrial and economic policy producing an environment that gets things done. The focus on industry pillars of sustainable energy, electric vehicles, industrial automation are making good progress; semiconductor manufacturing and artificial intelligence are areas that are still lagging. But we believe China’s economy, both industrial and consumer, is emerging from this pandemic period with increased relative strength versus politically divided competitors currently carries a greater financial and fiscal weight than ever before.
Edmund Harriss
January 2022
The Fund invests in foreign securities, which involve political, economic and currency risks, greater volatility, and differences in accounting methods. These risks are greater for emerging markets. The Fund is non-diversified, meaning that its assets may be concentrated in fewer individual holdings than diversified funds. Therefore, the Fund is more exposed to individual stock volatility than diversified funds. The Fund invests in smaller companies, which involve additional risks such as limited liquidity and greater volatility. Investments in debt securities typically decrease in value when interest rates rise, which can be greater for longer-term debt securities. The Fund may invest in derivatives, which involves risks different from, and in certain cases, greater than the risks presented by traditional investments.
Investments focused in a single geographic region may be exposed to greater risk than investments diversified among various geographic regions.
The Hang Seng Markit iBoxx Offshore RMB Bond Index family (“HSM iBoxx”) is designed to track the performance of the offshore RMB bond market. This index is unmanaged and not available for investment, and does not incur expenses.
The RMB Cash Offshore (CNH) is the currency code for renminbi traded outside China in the offshore market.
The RMB Cash Onshore (CNY) is the international currency code for the renminbi.
Yield to maturity is the total return anticipated on a bond if the bond is held until it matures.
SEC 30-day Yield: 3.40% (subsidized); 5.68% (unsubsidized). The unsubsidized SEC yield is calculated with a standardized formula mandated by the SEC. The formula is based on maximum offering price per share and does not reflect waivers in effect.
Duration is expressed in the form of number of years and measures a bond's sensitivity to change in interest rates. To be specific, it measures the change in market value of security due to 1% change in interest rates.
Please refer to the Schedule of Investments for details on Fund holdings. Current and future portfolio holdings are subject to risk.
The information provided herein represents the opinion of Guinness Atkinson Asset Management, Inc. for the period stated and is not intended to be a forecast of future events, a guarantee of future results, or investment advice. Opinions, Fund holdings and sector allocations are subject to change at any time, and are not recommendations to buy or sell any security.
Renminbi Yuan & Bond Fund
Growth of $10,000 (Unaudited)
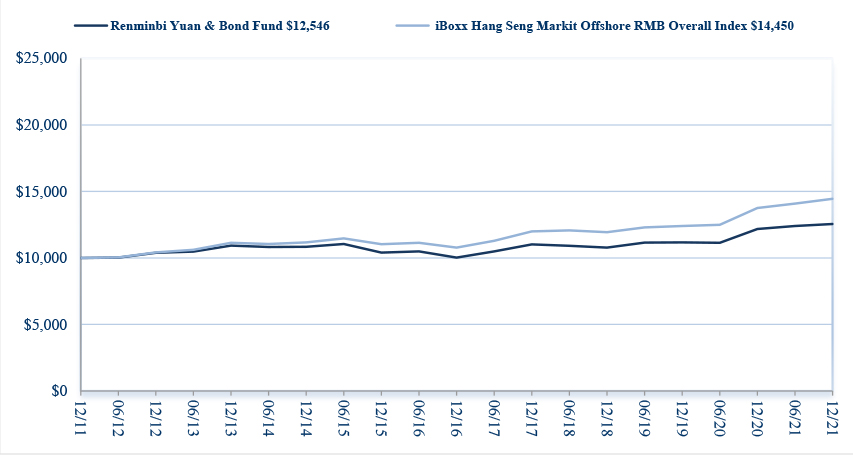
Average Annual Total Return
Periods Ended December 31, 2021
| One Year | | Five Years | | Ten Years |
| 3.00% | | 4.56% | | 2.28% |
Performance data quoted represents past performance and does not guarantee future results. The investment return and principal value of an investment will fluctuate so that an investor's shares, when redeemed, may be worth more or less than their original cost. Current performance of the Fund may be lower or higher than the performance quoted. Performance data current to the most recent month end may be obtained by visiting www.gafunds.com.
Total returns for certain periods reflect a fee waiver in effect and in the absence of this waiver, the total returns would be lower. Returns reflect the reinvestment of distributions made by the Fund, if any. The graph and the performance table above do not reflect the deduction of taxes that a shareholder would pay on Fund distribution or the redemption of Fund shares.
The iBoxx Hang Seng Markit Offshore RMB Overall Index (“HSM iBoxx”) captures the performance of debt denominated in Chinese yuan but issued and settled offshore. The index family offers a broad coverage of the offshore RMB bond universe.
FUND HIGHLIGHTS at December 31, 2021
GUINNESS ATKINSON RENMINBI YUAN & BOND FUND
| # of Holdings in Portfolio: | | | 21 | |
| Portfolio Turnover: | | | 31.8 | % |
| % of Investments in Top 10: | | | 46.7 | % |
| Fund Managers: |
| Edmund Harriss |
| Top 10 Holdings (% of net assets) | | | |
| First Abu Dhabi Bank, 3.400%, 8/18/25 | | | 11.6 | % |
| BMW Finance, 2.800%, 8/11/23 | | | 8.7 | % |
| CBQ Finance Ltd., 4.000%, 08/05/23 | | | 5.9 | % |
| Export-Import Bank of Korea, 4.500%, 01/27/24 | | | 3.0 | % |
| China Development Bank, 3.230%, 11/27/25 | | | 3.0 | % |
| QNB Finance Ltd., 5.250%, 6/21/21 | | | 2.9 | % |
| China Development Bank, 3.030%, 11/27/23 | | | 2.9 | % |
| HSBC Holdings Ltd., 3.400%, 06/29/27 | | | 2.9 | % |
| Bank of China, 3.300%, 4/17/22 | | | 2.9 | % |
| European International Bank, 2.700%, 04/22/24 | | | 2.9 | % |
| Geographic Breakdown (% of net assets) |
| China | | | 17.4 | % |
| United Arab Emirates | | | 11.6 | % |
| Netherlands | | | 11.6 | % |
| British Virgin Islands | | | 8.7 | % |
| Hong Kong | | | 8.6 | % |
| Bermuda | | | 5.9 | % |
| Cayman Islands | | | 5.0 | % |
| South Korea | | | 3.0 | % |
| Supranational | | | 2.9 | % |
| Germany | | | 2.9 | % |
GUINNESS ATKINSON RENMINBI YUAN & BOND FUND
Schedule of Investments
at December 31, 2021
| Principal Amount (CNH) | | | Corporate Bonds: 77.6% | | Value | |
| | | | Auto-Cars/Light Trucks: 11.6% | | | |
| | 3,000,000 | | | BMW Finance, 2.800%, 8/11/23 | | $ | 469,768 | |
| | 1,000,000 | | | Volkswagen International Finance NV, 2.900%, 01/21/24 | | | 156,242 | |
| | | | | | | | 626,010 | |
| | | | | Commercial Banks: 29.2% | | | | |
| | 1,000,000 | | | Bank of China, 3.300%, 04/17/22 | | | 157,304 | |
| | 1,000,000 | | | Bank of China, 3.008%, 04/28/26 | | | 156,784 | |
| | 2,000,000 | | | CBQ Finance Ltd., 4.000%, 08/05/23 | | | 319,460 | |
| | 1,000,000 | | | China Construction Bank, 2.850%, 04/22/23 | | | 156,825 | |
| | 4,000,000 | | | First Abu Dhabi Bank, 3.400%, 08/18/25 | | | 629,023 | |
| | 1,000,000 | | | QNB Finance Ltd., 3.800%, 06/17/25 | | | 158,425 | |
| | | | | | | | 1,577,821 | |
| | | | | Diversified Banks: 2.9% | | | | |
| | 1,000,000 | | | HSBC Holding Ltd., 3.400%, 06/29/27 | | | 157,542 | |
| | | | | Diversified Operations: 2.9% | | | | |
| | 1,000,000 | | | Wharf Finance Ltd., 3.250%, 01/14/24 | | | 155,903 | |
| | | | | Export/Import Bank: 14.6% | | | | |
| | 1,000,000 | | | China Development Bank, 3.030%, 11/27/23 | | | 157,812 | |
| | 1,000,000 | | | China Development Bank, 3.230%, 11/27/25 | | | 158,945 | |
| | 1,000,000 | | | European International Bank, 2.700%, 04/22/24 | | | 157,121 | |
| | 1,000,000 | | | Export-Import Bank of Korea, 4.500%, 01/27/24 | | | 161,499 | |
| | 1,000,000 | | | Kreditanstalt Fuer Wiederaufbau, 2.700%, 03/25/24 | | | 156,597 | |
| | | | | | | | 791,974 | |
| | | | | Finance-Mtg Loan/Banker: 2.9% | | | | |
| | 1,000,000 | | | Hong Kong Mortgage Corp. Ltd., 2.700%, 02/09/24 | | | 156,126 | |
| | | | | Municipal City: 2.9% | | | | |
| | 1,000,000 | | | Municipality of Shenzhen China, 2.900%, 10/19/26 | | | 155,560 | |
| | | | | Transportation Services: 2.8% | | | | |
| | 1,000,000 | | | GLP China Holding Ltd., 4.000%, 02/7/24 | | | 154,629 | |
| | | | | | | | | |
| | | | | Real Estate Operator/Developer: 7.8% | | | | |
| | 1,000,000 | | | Sun Hung Kai Properties 3.200%, 08/14/27 | | | 154,530 | |
| | 1,000,000 | | | Wharf Real Estate Investment Company Ltd., 3.200%, 09/15/23 | | | 156,633 | |
| | 1,000,000 | | | Zhenro Properties Group Ltd., 7.120%, 06/30/22 | | | 111,547 | |
| | | | | | | | 422,710 | |
| | | | | Total Corporate Bonds | | $ | 4,198,275 | |
| | | | | (cost $4,077,381) | | | | |
| | | | | Total Investments in Securities | | | 4,198,275 | |
| | | | | (cost $4,077,381): 77.6% | | | | |
| | | | | China Yuan (Offshore): 15.7% | | | 847,941 | |
| | | | | Other Assets less Liabilities: 6.7% | | | 360,595 | |
| | | | | Net Assets: 100.0% | | $ | 5,406,811 | |
CNH - The official currency of the People’s Republic of China.
The accompanying notes are an integral part of these financial statements.
GUINNESS ATKINSON™ FUNDS
STATEMENTS OF ASSETS AND LIABILITIES
at December 31, 2021
| | | Alternative Energy Fund | | | Asia Focus Fund | | | China & Hong Kong Fund | |
| Assets | | | | | | | | | |
| Investments in securities, at cost | | $ | 26,882,246 | | | $ | 9,837,897 | | | $ | 44,285,193 | |
| Investments in securities, at value | | $ | 32,028,826 | | | $ | 16,417,817 | | | $ | 56,923,929 | |
| Cash | | | - | | | | 17,079 | | | | - | |
| Cash denominated in foreign currency | | | | | | | | | | | | |
| (cost of $4,428, $3,808 and $14,941, respectively) | | | 4,428 | | | | 3,843 | | | | 15,114 | |
| Receivables: | | | | | | | | | | | | |
| Securities sold | | | 1,012,117 | | | | - | | | | - | |
| Fund shares sold | | | 28,424 | | | | - | | | | 10 | |
| Dividends and interest | | | 31,507 | | | | 11,003 | | | | - | |
| Tax reclaim | | | 15,384 | | | | - | | | | - | |
| Prepaid expenses | | | 2,979 | | | | 6,742 | | | | 6,932 | |
| Total Assets | | | 33,123,665 | | | | 16,456,484 | | | | 56,945,985 | |
| | | | | | | | | | | | | |
| Liabilities | | | | | | | | | | | | |
| Overdraft due to custodian bank | | | 854,911 | | | | - | | | | 66,825 | |
| Payable for Fund shares redeemed | | | 9,415 | | | | - | | | | 35,684 | |
| Due to Advisor, net | | | 35,270 | | | | 36,402 | | | | 51,160 | |
| Accrued administration fees | | | 1,528 | | | | 2,145 | | | | 2,947 | |
| Accrued shareholder servicing plan fees | | | 7,411 | | | | 2,462 | | | | 6,450 | |
| Audit fees | | | 18,533 | | | | 25,000 | | | | 25,237 | |
| CCO fees | | | 760 | | | | 1,210 | | | | 1,579 | |
| Custody fees | | | 4,759 | | | | 9,055 | | | | 9,667 | |
| Fund Accounting fees | | | 2,488 | | | | 1,635 | | | | 3,100 | |
| Legal fees | | | 1,292 | | | | 1,454 | | | | 2,440 | |
| Miscellaneous fees | | | 1,232 | | | | 1,188 | | | | 1,375 | |
| Printing fees | | | 4,586 | | | | 3,203 | | | | 4,726 | |
| Transfer Agent fees | | | 7,075 | | | | 4,885 | | | | 9,331 | |
| Trustee fees | | | 463 | | | | 469 | | | | 559 | |
| Total Liabilities | | | 949,723 | | | | 89,108 | | | | 221,080 | |
| | | | | | | | | | | | | |
| Net Assets | | $ | 32,173,942 | | | $ | 16,367,376 | | | $ | 56,724,905 | |
| | | | | | | | | | | | | |
| Composition of Net Assets | | | | | | | | | | | | |
| Paid-in capital | | $ | 59,221,807 | | | $ | 9,885,308 | | | $ | 43,945,756 | |
| Total distributable earnings (loss) | | | (27,047,865 | ) | | | 6,482,068 | | | | 12,779,149 | |
| Net Assets | | $ | 32,173,942 | | | $ | 16,367,376 | | | $ | 56,724,905 | |
| | | | | | | | | | | | | |
| Number of shares issued and outstanding (unlimited shares authorized, no par value) | | | 4,795,540 | | | | 804,064 | | | | 2,829,193 | |
| | | | | | | | | | | | | |
| Net asset value per share | | $ | 6.71 | | | $ | 20.36 | | | $ | 20.05 | |
The accompanying notes are an integral part of these financial statements.
GUINNESS ATKINSON™ FUNDS
STATEMENTS OF ASSETS AND LIABILITIES
at December 31, 2021
| | | Global Energy Fund | | | Global Innovators Fund | | | Renminbi Yuan & Bond Fund | |
| Assets | | | | | | | | | |
| Investments in securities, at cost | | $ | 14,652,573 | | | $ | 104,844,834 | | | $ | 4,077,381 | |
| Investments in securities, at value | | $ | 12,028,345 | | | $ | 224,541,189 | | | $ | 4,198,275 | |
| Cash | | | 201,665 | | | | 1,081,654 | | | | 322,487 | |
| Cash denominated in foreign currency | | | | | | | | | | | | |
| (cost of $0, $277,136, and $833,119, respectively) | | | - | | | | 278,790 | | | | 847,941 | |
| Receivables: | | | | | | | | | | | | |
| Fund shares sold | | | 3,108 | | | | 38,463 | | | | 9,980 | |
| Dividends and interest | | | 12,820 | | | | 109,001 | | | | 60,858 | |
| Tax reclaim | | | 82,672 | | | | 161,130 | | | | - | |
| Prepaid expenses | | | 4,395 | | | | 15,504 | | | | 4,910 | |
| Total Assets | | | 12,333,005 | | | | 226,225,731 | | | | 5,444,451 | |
| | | | | | | | | | | | | |
| Liabilities | | | | | | | | | | | | |
| Payable for Fund shares redeemed | | | 20,353 | | | | 18,566 | | | | - | |
| Due to Advisor, net | | | 10,342 | | | | 157,744 | | | | 12,059 | |
| Accrued administration fees | | | 760 | | | | 11,098 | | | | 578 | |
| Accrued shareholder servicing plan fees | | | 2,259 | | | | 21,706 | | | | 1,294 | |
| Audit fees | | | 25,421 | | | | 25,239 | | | | 12,719 | |
| CCO fees | | | 836 | | | | 3,209 | | | | 1,158 | |
| Custody fees | | | 4,957 | | | | 8,520 | | | | 1,017 | |
| Fund Accounting fees | | | 2,306 | | | | 7,216 | | | | 2,220 | |
| Legal fees | | | 1,221 | | | | 4,591 | | | | 601 | |
| Miscellaneous fees | | | 2,127 | | | | 1,775 | | | | 280 | |
| Printing fees | | | 3,537 | | | | 6,178 | | | | 2,601 | |
| Transfer Agent fees | | | 4,355 | | | | 13,883 | | | | 2,623 | |
| Trustee fees | | | 826 | | | | 451 | | | | 490 | |
| Total Liabilities | | | 79,300 | | | | 280,176 | | | | 37,640 | |
| | | | | | | | | | | | | |
| Net Assets | | $ | 12,253,705 | | | $ | 225,945,555 | | | $ | 5,406,811 | |
| | | | | | | | | | | | | |
| Composition of Net Assets | | | | | | | | | | | | |
| Paid-in capital | | $ | 43,134,888 | | | $ | 104,603,412 | | | $ | 9,507,972 | |
| Total distributable earnings (loss) | | | (30,881,183 | ) | | | 121,342,143 | | | | (4,101,161 | ) |
| Net Assets | | $ | 12,253,705 | | | $ | 225,945,555 | | | $ | 5,406,811 | |
| | | | | | | | | | | | | |
| Number of shares issued and outstanding (unlimited shares authorized, no par value) | | | 691,274 | | | | - | | | | 428,413 | |
| | | | | | | | | | | | | |
| Net asset value per share | | $ | 17.73 | | | | - | | | $ | 12.62 | |
| | | | | | | | | | | | | |
| Net asset value per share per Class: | | | | | | | | | | | | |
| Investor Class shares: | | | | | | | | | | | | |
| Net assets applicable to shares outstanding | | | | | | $ | 161,395,373 | | | | | |
| Shares of beneficial interest issued and outstanding | | | | | | | 2,601,270 | | | | | |
| Net asset value per share | | | | | | $ | 62.04 | | | | | |
| | | | | | | | | | | | | |
| Institutional Class shares: | | | | | | | | | | | | |
| Net assets applicable to shares outstanding | | | | | | $ | 64,550,182 | | | | | |
| Shares of beneficial interest issued and outstanding | | | | | | | 1,029,911 | | | | | |
| Net asset value per share | | | | | | $ | 62.68 | | | | | |
The accompanying notes are an integral part of these financial statements.
GUINNESS ATKINSON™ FUNDS
STATEMENTS OF OPERATIONS
For the year ended December 31, 2021
| | | Alternative Energy Fund | | | Asia Focus Fund | | | China & Hong Kong Fund | |
| Investment Income | | | | | | | | | |
| Dividends * | | $ | 397,591 | | | $ | 304,737 | | | $ | 1,116,800 | |
| Other Income | | | 1,690 | | | | 649 | | | | 1,715 | |
| Total income | | | 399,281 | | | | 305,386 | | | | 1,118,515 | |
| | | | | | | | | | | | | |
| Expenses | | | | | | | | | | | | |
| Advisory fees | | | 356,624 | | | | 186,865 | | | | 656,853 | |
| Shareholder servicing plan fees | | | 77,712 | | | | 22,418 | | | | 70,671 | |
| Transfer agent fees and expenses | | | 40,375 | | | | 27,342 | | | | 56,363 | |
| Fund accounting fee and expenses | | | 8,807 | | | | 8,682 | | | | 12,660 | |
| Administration fees | | | 15,775 | | | | 8,738 | | | | 28,730 | |
| Custody fees and expenses | | | 20,733 | | | | 23,858 | | | | 36,548 | |
| Audit fees | | | 18,500 | | | | 25,000 | | | | 25,057 | |
| Legal fees | | | 17,655 | | | | 9,482 | | | | 31,826 | |
| Registration fees | | | 20,370 | | | | 15,394 | | | | 19,665 | |
| Printing | | | 16,913 | | | | 6,922 | | | | 11,482 | |
| Trustees' fees and expenses | | | 6,408 | | | | 5,971 | | | | 10,000 | |
| Insurance | | | 1,697 | | | | 1,114 | | | | 4,019 | |
| CCO fees and expenses | | | 9,306 | | | | 7,017 | | | | 14,146 | |
| Miscellaneous | | | 5,042 | | | | 4,113 | | | | 4,607 | |
| Interest expense | | | 623 | | | | 323 | | | | 1,639 | |
| Total expenses | | | 616,540 | | | | 353,239 | | | | 984,266 | |
| Plus: fees and expenses recaptured | | | 90,199 | | | | 17,077 | | | | - | |
| Net expenses | | | 706,739 | | | | 370,316 | | | | 984,266 | |
| Net investment income (loss) | | | (307,458 | ) | | | (64,930 | ) | | | 134,249 | |
| | | | | | | | | | | | | |
| Realized and Unrealized Gain (Loss) on Investments and Foreign Currency | | | | | | | | | | | | |
| Net realized gain (loss) on: | | | | | | | | | | | | |
| Investments | | | 5,775,551 | | | | 1,028,664 | | | | 6,332,490 | |
| Foreign currency | | | 924 | | | | (5,400 | ) | | | (3,916 | ) |
| | | | 5,776,475 | | | | 1,023,264 | | | | 6,328,574 | |
| Net change in unrealized depreciation on: | | | | | | | | | | | | |
| Investments | | | (3,674,826 | ) | | | (2,124,251 | ) | | | (10,585,010 | ) |
| Foreign currency | | | (1,813 | ) | | | (278 | ) | | | 146 | |
| | | | (3,676,639 | ) | | | (2,124,529 | ) | | | (10,584,864 | ) |
| | | | | | | | | | | | | |
| Net realized and unrealized gain (loss) on investments and foreign currency | | | 2,099,836 | | | | (1,101,265 | ) | | | (4,256,290 | ) |
| Net increase (decrease) in Net Assets from Operations | | $ | 1,792,378 | | | $ | (1,166,195 | ) | | $ | (4,122,041 | ) |
| * | Net of foreign tax withheld of $38,513, $40,788, and $45,319, respectively. |
The accompanying notes are an integral part of these financial statements.
GUINNESS ATKINSON™ FUNDS
STATEMENTS OF OPERATIONS
For the year ended December 31, 2021
| | | Global Energy Fund | | | Global Innovators Fund | | | Renminbi Yuan & Bond Fund | |
| Investment Income | | | | | | | | | |
| Dividends * | | $ | 511,291 | | | $ | 1,999,003 | | | $ | - | |
| Interest | | | - | | | | - | | | | 128,000 | |
| Total income | | | 511,291 | | | | 1,999,003 | | | | 128,000 | |
| | | | | | | | | | | | | |
| Expenses | | | | | | | | | | | | |
| Advisory fees | | | 87,475 | | | | 1,638,696 | | | | 25,912 | |
| Shareholder servicing plan fees | | | 21,542 | | | | - | | | | 2,521 | |
| Investor Class | | | - | | | | 307,152 | | | | - | |
| Transfer agent fees and expenses | | | 23,636 | | | | - | | | | 15,621 | |
| Investor Class | | | - | | | | 68,904 | | | | - | |
| Institutional Class | | | - | | | | 22,008 | | | | - | |
| Fund accounting fee and expenses | | | 6,697 | | | | 23,765 | | | | 6,902 | |
| Administration fees | | | 4,575 | | | | 71,343 | | | | 1,954 | |
| Institutional Class | | | - | | | | 31,507 | | | | - | |
| Custody fees and expenses | | | 15,780 | | | | 22,647 | | | | 3,171 | |
| Audit fees | | | 25,035 | | | | 25,057 | | | | 12,500 | |
| Legal fees | | | 5,802 | | | | 102,403 | | | | 2,719 | |
| Registration fees | | | 17,412 | | | | - | | | | 17,391 | |
| Investor Class | | | - | | | | 21,855 | | | | - | |
| Institutional Class | | | - | | | | 17,705 | | | | - | |
| Printing | | | 7,627 | | | | 14,226 | | | | 5,288 | |
| Trustees' fees and expenses | | | 3,813 | | | | 25,878 | | | | 4,430 | |
| Insurance | | | 517 | | | | 13,725 | | | | 203 | |
| CCO fees and expenses | | | 6,476 | | | | 32,927 | | | | 5,834 | |
| Miscellaneous | | | 5,279 | | | | 7,019 | | | | 3,596 | |
| Interest expense | | | 690 | | | | 312 | | | | - | |
| Total expenses | | | 232,356 | | | | 2,447,129 | | | | 108,042 | |
| Plus: fees and expenses recaptured | | | - | | | | 113,435 | | | | - | |
| Less: fees waived and expenses absorbed | | | (62,548 | ) | | | - | | | | (65,641 | ) |
| Net expenses | | | 169,808 | | | | 2,560,564 | | | | 42,401 | |
| Net investment income (loss) | | | 341,483 | | | | (561,561 | ) | | | 85,599 | |
| | | | | | | | | | | | | |
| Realized and Unrealized Gain (Loss) on Investments and Foreign Currency | | | | | | | | | | | | |
| Net realized gain (loss) on: | | | | | | | | | | | | |
| Investments | | | (354,795 | ) | | | 30,073,427 | | | | 105 | |
| Foreign currency | | | 841 | | | | (20,551 | ) | | | 3,333 | |
| | | | (353,954 | ) | | | 30,052,876 | | | | 3,438 | |
| Net change in unrealized appreciation (depreciation) on: | | | | | | | | | | | | |
| Investments | | | 3,612,046 | | | | 12,738,188 | | | | 34,580 | |
| Foreign currency | | | (2,469 | ) | | | (2,335 | ) | | | 10,704 | |
| | | | 3,609,577 | | | | 12,735,853 | | | | 45,284 | |
| | | | | | | | | | | | | |
| Net realized and unrealized gain on investments and foreign currency | | | 3,255,623 | | | | 42,788,729 | | | | 48,722 | |
| Net increase in Net Assets from Operations | | $ | 3,597,106 | | | $ | 42,227,168 | | | $ | 134,321 | |
| * | Net of foreign tax withheld of $53,326, $145,704, and $0, respectively. |
The accompanying notes are an integral part of these financial statements.
GUINNESS ATKINSON™ FUNDS
STATEMENTS OF CHANGES IN NET ASSETS
| | | Alternative Energy Fund | | | Asia Focus Fund | |
| | | Year EndedDecember 31, 2021 | | | Year Ended December 31, 2020 | | | Year Ended December 31, 2021 | | | Year Ended December 31, 2020 | |
| INCREASE/(DECREASE) IN NET ASSETS FROM: | | | | | | | | | | | | |
| Operations | | | | | | | | | | | | |
| Net investment loss | | $ | (307,458 | ) | | $ | (107,535 | ) | | $ | (64,930 | ) | | $ | (1,750 | ) |
| Net realized gain (loss) on: | | | | | | | | | | | | | | | | |
| Investments | | | 5,775,551 | | | | 1,140,352 | | | | 1,028,664 | | | | 553,837 | |
| Foreign currency | | | 924 | | | | (1,754 | ) | | | (5,400 | ) | | | (6,082 | ) |
| Net change in unrealized appreciation (depreciation) on: | | | | | | | | | | | | | | | | |
| Investments | | | (3,674,826 | ) | | | 7,977,044 | | | | (2,124,251 | ) | | | 3,321,077 | |
| Foreign currency | | | (1,813 | ) | | | 911 | | | | (278 | ) | | | 172 | |
| Net increase (decrease) in net assets resulting from operations | | | 1,792,378 | | | | 9,009,018 | | | | (1,166,195 | ) | | | 3,867,254 | |
| | | | | | | | | | | | | | | | | |
| Distributions to Shareholders | | | | | | | | | | | | | | | | |
| Net dividends and distributions | | | - | | | | - | | | | (1,421,534 | ) | | | (1,055,465 | ) |
| Total distributions to shareholders | | | - | | | | - | | | | (1,421,534 | ) | | | (1,055,465 | ) |
| | | | | | | | | | | | | | | | | |
| Capital Transactions | | | | | | | | | | | | | | | | |
| Proceeds from shares sold | | | 28,957,121 | | | | 12,444,243 | | | | 240,038 | | | | 378,945 | |
| Reinvestment of distributions | | | - | | | | - | | | | 1,326,856 | | | | 985,566 | |
| Cost of shares redeemed | | | (25,492,415 | ) | | | (3,766,410 | ) | | | (1,689,080 | ) | | | (2,512,240 | ) |
| Redemption fee proceeds | | | - | | | | - | | | | - | | | | 60 | |
| Net change in net assets from capital transactions | | | 3,464,706 | | | | 8,677,833 | | | | (122,186 | ) | | | (1,147,669 | ) |
| | | | | | | | | | | | | | | | | |
| Total increase (decrease) in net assets | | | 5,257,084 | | | | 17,686,851 | | | | (2,709,915 | ) | | | 1,664,120 | |
| | | | | | | | | | | | | | | | | |
| Net Assets | | | | | | | | | | | | | | | | |
| Beginning of period | | | 26,916,858 | | | | 9,230,007 | | | | 19,077,291 | | | | 17,413,171 | |
| End of period | | $ | 32,173,942 | | | $ | 26,916,858 | | | $ | 16,367,376 | | | $ | 19,077,291 | |
| | | | | | | | | | | | | | | | | |
| Capital Share Activity | | | | | | | | | | | | | | | | |
| Shares sold | | | 4,346,328 | | | | 2,447,767 | | | | 9,627 | | | | 19,228 | |
| Shares issued on reinvestment | | | - | | | | - | | | | 66,442 | | | | 44,236 | |
| Shares redeemed | | | (3,897,489 | ) | | | (877,381 | ) | | | (74,821 | ) | | | (129,961 | ) |
| Net increase (decrease) in shares outstanding | | | 448,839 | | | | 1,570,386 | | | | 1,248 | | | | (66,497 | ) |
The accompanying notes are an integral part of these financial statements.
GUINNESS ATKINSON™ FUNDS
STATEMENTS OF CHANGES IN NET ASSETS
| | | China & Hong Kong Fund | |
| | | Year Ended December 31, 2021 | | | Year Ended December 31, 2020 | |
| INCREASE/(DECREASE) IN NET ASSETS FROM: | | | | | | |
| Operations | | | | | | |
| Net investment income | | $ | 134,249 | | | $ | 353,886 | |
| Net realized gain (loss) on: | | | | | | | | |
| Investments | | | 6,332,490 | | | | 5,445,244 | |
| Foreign currency | | | (3,916 | ) | | | 62,429 | |
| Net change in unrealized appreciation (depreciation) on: | | | | | | | | |
| Investments and deferred foreign taxes | | | (10,585,010 | ) | | | 2,104,240 | |
| Foreign currency | | | 146 | | | | 45 | |
| Net increase (decrease) in net assets resulting from operations | | | (4,122,041 | ) | | | 7,965,844 | |
| | | | | | | | | |
| Distributions to Shareholders | | | | | | | | |
| Net dividends and distributions | | | (9,872,790 | ) | | | (2,316,950 | ) |
| Total distributions to shareholders | | | (9,872,790 | ) | | | (2,316,950 | ) |
| | | | | | | | | |
| Capital Transactions | | | | | | | | |
| Proceeds from shares sold | | | 622,987 | | | | 519,510 | |
| Reinvestment of distributions | | | 9,441,077 | | | | 2,222,457 | |
| Cost of shares redeemed | | | (5,891,141 | ) | | | (9,469,071 | ) |
| Redemption fee proceeds | | | 44 | | | | 1,280 | |
| Net change in net assets from capital transactions | | | 4,172,967 | | | | (6,725,824 | ) |
| | | | | | | | | |
| Total decrease in net assets | | | (9,821,864 | ) | | | (1,076,930 | ) |
| | | | | | | | | |
| Net Assets | | | | | | | | |
| Beginning of period | | | 66,546,769 | | | | 67,623,699 | |
| End of period | | $ | 56,724,905 | | | $ | 66,546,769 | |
| | | | | | | | | |
| Capital Share Activity | | | | | | | | |
| Shares sold | | | 24,542 | | | | 22,691 | |
| Shares issued on reinvestment | | | 474,903 | | | | 91,384 | |
| Shares redeemed | | | (237,628 | ) | | | (425,146 | ) |
| Net increase (decrease) in shares outstanding | | | 261,817 | | | | (311,071 | ) |
The accompanying notes are an integral part of these financial statements.
GUINNESS ATKINSON™ FUNDS
STATEMENTS OF CHANGES IN NET ASSETS
| | | Global Energy Fund | |
| | | Year Ended December 31, 2021 | | | Year Ended December 31, 2020 | |
| INCREASE/(DECREASE) IN NET ASSETS FROM: | | | | | | |
| Operations | | | | | | |
| Net investment income | | $ | 341,483 | | | $ | 344,212 | |
| Net realized gain (loss) on: | | | | | | | | |
| Investments | | | (354,795 | ) | | | (4,445,902 | ) |
| Foreign currency | | | 841 | | | | (1,054 | ) |
| Net change in unrealized appreciation (depreciation) on: | | | | | | | | |
| Investments | | | 3,612,046 | | | | (1,643,358 | ) |
| Foreign currency | | | (2,469 | ) | | | 2,004 | |
| Net increase (decrease) in net assets resulting from operations | | | 3,597,106 | | | | (5,744,098 | ) |
| | | | | | | | | |
| Distributions to Shareholders | | | | | | | | |
| Net dividends and distributions | | | (320,289 | ) | | | (339,997 | ) |
| Total distributions to shareholders | | | (320,289 | ) | | | (339,997 | ) |
| | | | | | | | | |
| Capital Transactions | | | | | | | | |
| Proceeds from shares sold | | | 9,011,904 | | | | 2,338,606 | |
| Reinvestment of distributions | | | 304,561 | | | | 327,414 | |
| Cost of shares redeemed | | | (9,025,520 | ) | | | (4,651,589 | ) |
| Net change in net assets from capital transactions | | | 290,945 | | | | (1,985,569 | ) |
| | | | | | | | | |
| Total increase (decrease) in net assets | | | 3,567,762 | | | | (8,069,664 | ) |
| | | | | | | | | |
| Net Assets | | | | | | | | |
| Beginning of period | | | 8,685,943 | | | | 16,755,607 | |
| End of period | | $ | 12,253,705 | | | $ | 8,685,943 | |
| | | | | | | | | |
| Capital Share Activity | | | | | | | | |
| Shares sold | | | 538,603 | | | | 195,700 | |
| Shares issued on reinvestment | | | 17,748 | | | | 25,579 | |
| Shares redeemed | | | (561,717 | ) | | | (378,770 | ) |
| Net decrease in shares outstanding | | | (5,366 | ) | | | (157,491 | ) |
The accompanying notes are an integral part of these financial statements.
GUINNESS ATKINSON™ FUNDS
STATEMENTS OF CHANGES IN NET ASSETS
| | | Global Innovators Fund | |
| | | Year Ended | | | Year Ended | |
| | | December 31, 2021 | | | December 31, 2020 | |
| INCREASE/(DECREASE) IN NET ASSETS FROM: | | | | | | |
| Operations | | | | | | | | |
| Net investment loss | | $ | (561,561 | ) | | $ | (70,802 | ) |
| Net realized gain (loss) on: | | | | | | | | |
| Investments | | | 30,073,427 | | | | 10,498,152 | |
| Foreign currency | | | (20,551 | ) | | | (25,283 | ) |
| Net change in unrealized appreciation (depreciation) on: | | | | | | | | |
| Investments | | | 12,738,188 | | | | 44,741,825 | |
| Foreign currency | | | (2,335 | ) | | | 7,659 | |
| Net increase in net assets resulting from operations | | | 42,227,168 | | | | 55,151,551 | |
| | | | | | | | | |
| Distributions to Shareholders | | | | | | | | |
| Net dividends and distributions: | | | | | | | | |
| Investor Class | | | (25,414,561 | ) | | | (3,838,812 | ) |
| Institutional Class | | | (9,400,513 | ) | | | (1,438,567 | ) |
| Total distributions to shareholders | | | (34,815,074 | ) | | | (5,277,379 | ) |
| | | | | | | | | |
| Capital Transactions | | | | | | | | |
| Proceeds from shares sold: | | | | | | | | |
| Investor Class | | | 11,115,435 | | | | 7,186,724 | |
| Institutional Class | | | 11,415,755 | | | | 6,182,277 | |
| Reinvestment of distributions: | | | | | | | | |
| Investor Class | | | 24,718,056 | | | | 3,740,179 | |
| Institutional Class | | | 6,130,723 | | | | 816,731 | |
| Cost of shares redeemed: | | | | | | | | |
| Investor Class | | | (27,350,132 | ) | | | (34,700,968 | ) |
| Institutional Class | | | (10,485,347 | ) | | | (10,767,945 | ) |
| Net change in net assets from capital transactions | | | 15,544,490 | | | | (27,543,002 | ) |
| | | | | | | | | |
| Total increase in net assets | | | 22,956,584 | | | | 22,331,170 | |
| | | | | | | | | |
| Net Assets | | | | | | | | |
| Beginning of period | | | 202,988,971 | | | | 180,657,801 | |
| End of period | | $ | 225,945,555 | | | $ | 202,988,971 | |
| | | | | | | | | |
| Capital Share Activity | | | | | | | | |
| Shares sold: | | | | | | | | |
| Investor Class | | | 166,747 | | | | 150,001 | |
| Institutional Class | | | 178,278 | | | | 124,918 | |
| Shares issued on reinvestment: | | | | | | | | |
| Investor Class | | | 415,011 | | | | 63,371 | |
| Institutional Class | | | 101,907 | | | | 13,757 | |
| Shares redeemed: | | | | | | | | |
| Investor Class | | | (421,610 | ) | | | (723,291 | ) |
| Institutional Class | | | (157,370 | ) | | | (233,014 | ) |
| Net increase (decrease) in shares outstanding | | | 282,963 | | | | (604,258 | ) |
The accompanying notes are an integral part of these financial statements.
GUINNESS ATKINSON™ FUNDS
STATEMENTS OF CHANGES IN NET ASSETS
| | | Renminbi Yuan & Bond Fund | |
| | | Year Ended December 31, 2021 | | | Year Ended December 31, 2020 | |
| INCREASE/(DECREASE) IN NET ASSETS FROM: | | | | | | |
| Operations | | | | | | |
| Net investment income | | $ | 85,599 | | | $ | 55,300 | |
| Net realized gain (loss) on: | | | | | | | | |
| Investments | | | 105 | | | | (65,112 | ) |
| Foreign currency | | | 3,333 | | | | 36,841 | |
| Net change in unrealized appreciation on: | | | | | | | | |
| Investments | | | 34,580 | | | | 227,473 | |
| Foreign currency | | | 10,704 | | | | 4,221 | |
| Net increase in net assets resulting from operations | | | 134,321 | | | | 258,723 | |
| | | | | | | | | |
| Distributions to Shareholders | | | | | | | | |
| Net dividends and distributions | | | (101,565 | ) | | | (6,438 | ) |
| Total distributions to shareholders | | | (101,565 | ) | | | (6,438 | ) |
| | | | | | | | | |
| Capital Transactions | | | | | | | | |
| Proceeds from shares sold | | | 1,710,991 | | | | 2,270,348 | |
| Reinvestment of distributions | | | 89,554 | | | | 6,151 | |
| Cost of shares redeemed | | | (336,024 | ) | | | (104,683 | ) |
| Net change in net assets from capital transactions | | | 1,464,521 | | | | 2,171,816 | |
| | | | | | | | | |
| Total increase in net assets | | | 1,497,277 | | | | 2,424,101 | |
| | | | | | | | | |
| Net Assets | | | | | | | | |
| Beginning of period | | | 3,909,534 | | | | 1,485,433 | |
| End of period | | $ | 5,406,811 | | | $ | 3,909,534 | |
| | | | | | | | | |
| Capital Share Activity | | | | | | | | |
| Shares sold | | | 135,160 | | | | 192,372 | |
| Shares issued on reinvestment | | | 7,103 | | | | 543 | |
| Shares redeemed | | | (26,598 | ) | | | (8,962 | ) |
| Net increase in shares outstanding | | | 115,665 | | | | 183,953 | |
The accompanying notes are an integral part of these financial statements.
FINANCIAL HIGHLIGHTS
For a capital share outstanding throughout each period.
| | | | | | Year Ended December 31, | |
| Alternative Energy Fund | | 2021 | | | 2020 | | | 2019 | | | 2018 | | | 2017 | |
| Net asset value, beginning of period | | $ | 6.19 | | | $ | 3.32 | | | $ | 2.55 | | | $ | 3.02 | | | $ | 2.51 | |
| | | | | | | | | | | | | | | | | | | | | |
| Income from investment operations: | | | | | | | | | | | | | | | | | | | | |
| Net investment income (loss) | | | (0.06 | ) | | | (0.03 | ) | | | (0.01 | ) | | | - | | | | - | |
Net realized and unrealized gain (loss)
on investments and foreign currency | | | 0.58 | | | | 2.90 | | | | 0.78 | | | | (0.47 | ) | | | 0.52 | |
| Total from investment operations | | | 0.52 | | | | 2.87 | | | | 0.77 | | | | (0.47 | ) | | | 0.52 | |
| | | | | | | | | | | | | | | | | | | | | |
| Less distributions: | | | | | | | | | | | | | | | | | | | | |
| From net investment income | | | - | | | | - | | | | - | | | | - | (1) | | | (0.01 | ) |
| Total distributions | | | - | | | | - | | | | - | | | | - | | | | (0.01 | ) |
| | | | | | | | | | | | | | | | | | | | | |
| Net asset value, end of period | | $ | 6.71 | | | $ | 6.19 | | | $ | 3.32 | | | $ | 2.55 | | | $ | 3.02 | |
| | | | | | | | | | | | | | | | | | | | | |
| Total return | | | 8.40 | % | | | 86.45 | % | | | 30.20 | % | | | (15.49 | %) | | | 20.68 | % |
| | | | | | | | | | | | | | | | | | | | | |
| Ratios/supplemental data: | | | | | | | | | | | | | | | | | | | | |
| Net assets, end of period (millions) | | $ | 32.2 | | | $ | 26.9 | | | $ | 9.2 | | | $ | 7.9 | | | $ | 10.6 | |
| | | | | | | | | | | | | | | | | | | | | |
| Ratio of expenses to average net assets: | | | | | | | | | | | | | | | | | | | | |
| Before fee waived/recaptured | | | 1.73 | % | | | 2.46 | % | | | 3.00 | % | | | 2.57 | % | | | 2.74 | % |
| After fees waived/recaptured (2) | | | 1.98 | % | | | 1.98 | % | | | 1.98 | % | | | 1.98 | % | | | 1.98 | % |
| | | | | | | | | | | | | | | | | | | | | |
| Ratio of net investment income (loss) to average net assets: | | | | | | | | | | | | | | | | | | | | |
| Before fees waived/recaptured | | | (0.61 | %) | | | (1.40 | %) | | | (1.15 | %) | | | (0.43 | %) | | | (0.88 | %) |
| After fees waived/recaptured | | | (0.86 | %) | | | (0.92 | %) | | | (0.13 | %) | | | 0.16 | % | | | (0.12 | %) |
| | | | | | | | | | | | | | | | | | | | | |
| Portfolio turnover rate | | | 29.03 | % | | | 35.00 | % | | | 43.19 | % | | | 36.54 | % | | | 32.45 | % |
| (1) | Amount represents less than $0.01 per share. |
| (2) | The Advisor has contractually agreed to limit the operating expenses of the Fund to 1.98%, excluding interest expense, expenses related to dividends on short positions, brokerage commissions, taxes and other extraordinary expenses. See Note 3. |
The accompanying notes are an integral part of these financial statements.
FINANCIAL HIGHLIGHTS
For a capital share outstanding throughout each period.
| | | Year Ended December 31, | |
| Asia Focus Fund | | 2021 | | | 2020 | | | 2019 | | | 2018 | | | 2017 | |
| | | | | | | | | | | | | | | | |
| Net asset value, beginning of period | | $ | 23.76 | | | $ | 20.03 | | | $ | 16.58 | | | $ | 22.58 | | | $ | 15.50 | |
| | | | | | | | | | | | | | | | | | | | | |
| Income from investment operations: | | | | | | | | | | | | | | | | | | | | |
| Net investment income (loss) | | | (0.08 | ) | | | 0.01 | | | | 0.21 | | | | 0.26 | | | | 0.16 | |
| Net realized and unrealized gain (loss) on investments and foreign currency | | | (1.46 | ) | | | 5.09 | | | | 4.56 | | | | (4.83 | ) | | | 7.11 | |
| Total from investment operations | | | (1.54 | ) | | | 5.10 | | | | 4.77 | | | | (4.57 | ) | | | 7.27 | |
| | | | | | | | | | | | | | | | | | | | | |
| Less distributions: | | | | | | | | | | | | | | | | | | | | |
| From net investment income | | | - | | | | (0.10 | ) | | | (0.12 | ) | | | (0.26 | ) | | | (0.20 | ) |
| From net realized gain | | | (1.86 | ) | | | (1.27 | ) | | | (1.20 | ) | | | (1.18 | ) | | | - | |
| Total distributions | | | (1.86 | ) | �� | | (1.37 | ) | | | (1.32 | ) | | | (1.44 | ) | | | (0.20 | ) |
| | | | | | | | | | | | | | | | | | | | | |
| Redemption fee proceeds | | | - | | | | - | (1) | | | - | (1) | | | 0.01 | | | | 0.01 | |
| | | | | | | | | | | | | | | | | | | | | |
| Net asset value, end of period | | $ | 20.36 | | | $ | 23.76 | | | $ | 20.03 | | | $ | 16.58 | | | $ | 22.58 | |
| | | | | | | | | | | | | | | | | | | | | |
| Total return | | | (6.32 | %) | | | 25.93 | % | | | 29.20 | % | | | (20.45 | %) | | | 47.10 | % |
| | | | | | | | | | | | | | | | | | | | | |
| Ratios/supplemental data: | | | | | | | | | | | | | | | | | | | | |
| Net assets, end of period (millions) | | $ | 16.4 | | | $ | 19.1 | | | $ | 17.4 | | | $ | 15.1 | | | $ | 20.2 | |
| | | | | | | | | | | | | | | | | | | | | |
| Ratio of expenses to average net assets: | | | | | | | | | | | | | | | | | | | | |
| Before fees waived | | | 1.89 | % | | | 2.21 | % | | | 2.27 | % | | | 2.01 | % | | | 2.22 | % |
| After fees waived (2) | | | 1.98 | % | | | 1.98 | % | | | 1.98 | % | | | 1.99 | %(3) | | | 1.98 | % |
| | | | | | | | | | | | | | | | | | | | | |
| Ratio of net investment income (loss) to average net assets: | | | | | | | | | | | | | | | | | | | | |
| Before fees waived | | | (0.26 | %) | | | (0.24 | %) | | | 0.85 | % | | | 1.14 | % | | | 0.60 | % |
| After fees waived | | | (0.35 | %) | | | (0.01 | %) | | | 1.14 | % | | | 1.16 | % | | | 0.84 | % |
| | | | | | | | | | | | | | | | | | | | | |
| Portfolio turnover rate | | | 29.05 | % | | | 30.24 | % | | | 19.56 | % | | | 31.97 | % | | | 13.24 | % |
| (1) | Amount represents less than $0.01 per share. |
| (2) | The Advisor has contractually agreed to limit the operating expenses of the Fund to 1.98%, excluding interest expense, expenses related to dividends on short positions, brokerage commissions, taxes and other extraordinary expenses. See Note 3. |
| (3) | If interest expense had been excluded, expenses would have been lowered by 0.01% for the year ended December 31, 2018. |
The accompanying notes are an integral part of these financial statements.
FINANCIAL HIGHLIGHTS
For a capital share outstanding throughout each period.
| | | Year Ended December 31, | |
| China & Hong Kong Fund | | 2021 | | | 2020 | | | 2019 | | | 2018 | | | 2017 | |
| | | | | | | | | | | | | | | | |
| Net asset value, beginning of period | | $ | 25.92 | | | $ | 23.49 | | | $ | 18.92 | | | $ | 26.55 | | | $ | 19.09 | |
| | | | | | | | | | | | | | | | | | | | | |
| Income from investment operations: | | | | | | | | | | | | | | | | | | | | |
| Net investment income | | | 0.05 | | | | 0.16 | | | | 0.37 | | | | 0.33 | | | | 0.29 | |
| Net realized and unrealized gain (loss) on investments and foreign currency | | | (1.83 | ) | | | 3.20 | | | | 5.23 | | | | (5.59 | ) | | | 8.95 | |
| Total from investment operations | | | (1.78 | ) | | | 3.36 | | | | 5.60 | | | | (5.26 | ) | | | 9.24 | |
| | | | | | | | | | | | | | | | | | | | | |
| Less distributions: | | | | | | | | | | | | | | | | | | | | |
| From net investment income | | | (0.07 | ) | | | (0.20 | ) | | | (0.43 | ) | | | (0.31 | ) | | | (0.16 | ) |
| From net realized gain | | | (4.02 | ) | | | (0.73 | ) | | | (0.60 | ) | | | (2.06 | ) | | | (1.63 | ) |
| Total distributions | | | (4.09 | ) | | | (0.93 | ) | | | (1.03 | ) | | | (2.37 | ) | | | (1.79 | ) |
| | | | | | | | | | | | | | | | | | | | | |
| Redemption fee proceeds | | | - | (1) | | | - | (1) | | | - | (1) | | | - | (1) | | | 0.01 | |
| | | | | | | | | | | | | | | | | | | | | |
| Net asset value, end of period | | $ | 20.05 | | | $ | 25.92 | | | $ | 23.49 | | | $ | 18.92 | | | $ | 26.55 | |
| | | | | | | | | | | | | | | | | | | | | |
| Total return | | | (6.70 | )% | | | 14.54 | % | | | 30.00 | % | | | (20.21 | )% | | | 48.85 | % |
| | | | | | | | | | | | | | | | | | | | | |
| Ratios/supplemental data: | | | | | | | | | | | | | | | | | | | | |
| Net assets, end of period (millions) | | $ | 56.7 | | | $ | 66.5 | | | $ | 67.6 | | | $ | 56.6 | | | $ | 78.2 | |
| | | | | | | | | | | | | | | | | | | | | |
| Ratio of expenses to average net assets:(2) | | | 1.50 | % | | | 1.60 | %(3) | | | 1.69 | % | | | 1.54 | % | | | 1.64 | % |
| | | | | | | | | | | | | | | | | | | | | |
| Ratio of net investment income to average net assets: | | | 0.20 | % | | | 0.59 | % | | | 1.61 | % | | | 1.27 | % | | | 1.17 | % |
| | | | | | | | | | | | | | | | | | | | | |
| Portfolio turnover rate | | | 29.82 | % | | | 45.40 | % | | | 24.18 | % | | | 22.27 | % | | | 20.78 | % |
| (1) | Amount represents less than $0.01 per share. |
| (2) | The Advisor has contractually agreed to limit the operating expenses of the Fund to 1.98%, excluding interest expense, expenses related to dividends on short positions, brokerage commissions, taxes and other extraordinary expenses. See Note 3. |
| (3) | If interest expense had been excluded, expenses would have been lowered by 0.02% for the year ended December 31, 2020. |
The accompanying notes are an integral part of these financial statements.
FINANCIAL HIGHLIGHTS
For a capital share outstanding throughout each period.
| | | Year Ended December 31, | |
| Global Energy Fund | | 2021 | | | 2020 | | | 2019 | | | 2018 | | | 2017 | |
| | | | | | | | | | | | | | | | |
| Net asset value, beginning of period | | $ | 12.47 | | | $ | 19.62 | | | $ | 18.13 | | | $ | 22.71 | | | $ | 23.29 | |
| | | | | | | | | | | | | | | | | | | | | |
| Income from investment operations: | | | | | | | | | | | | | | | | | | | | |
| Net investment income | | | 0.49 | | | | 0.45 | | | | 0.45 | | | | 0.29 | | | | 0.30 | |
| Net realized and unrealized gain (loss) on investments and foreign currency | | | 5.23 | | | | (7.15 | ) | | | 1.42 | | | | (4.56 | ) | | | (0.56 | ) |
| Total from investment operations | | | 5.72 | | | | (6.70 | ) | | | 1.87 | | | | (4.27 | ) | | | (0.26 | ) |
| | | | | | | | | | | | | | | | | | | | | |
| Less distributions: | | | | | | | | | | | | | | | | | | | | |
| From net investment income | | | (0.46 | ) | | | (0.45 | ) | | | (0.38 | ) | | | (0.30 | ) | | | (0.32 | ) |
| From net realized gain | | | - | | | | - | | | | - | | | | (0.01 | ) | | | - | |
| Total distributions | | | (0.46 | ) | | | (0.45 | ) | | | (0.38 | ) | | | (0.31 | ) | | | (0.32 | ) |
| | | | | | | | | | | | | | | | | | | | | |
| Redemption fee proceeds | | | - | | | | - | | | | - | | | | - | | | | - | |
| | | | | | | | | | | | | | | | | | | | | |
| Net asset value, end of period | | $ | 17.73 | | | $ | 12.47 | | | $ | 19.62 | | | $ | 18.13 | | | $ | 22.71 | |
| | | | | | | | | | | | | | | | | | | | | |
| Total return | | | 45.98 | % | | | (34.22 | )% | | | 10.40 | % | | | (18.92 | )% | | | (1.06 | )% |
| | | | | | | | | | | | | | | | | | | | | |
| Ratios/supplemental data: | | | | | | | | | | | | | | | | | | | | |
| Net assets, end of period (millions) | | $ | 12.3 | | | $ | 8.7 | | | $ | 16.8 | | | $ | 19.6 | | | $ | 31.8 | |
| | | | | | | | | | | | | | | | | | | | | |
| Ratio of expenses to average net assets | | | | | | | | | | | | | | | | | | | | |
| Before fees waived/recaptured | | | 1.99 | % | | | 2.56 | % | | | 1.91 | % | | | 1.60 | % | | | 1.62 | % |
| After fees waived/recaptured (2) | | | 1.46 | %(3) | | | 1.46 | %(3) | | | 1.45 | % | | | 1.45 | % | | | 1.45 | % |
| | | | | | | | | | | | | | | | | | | | | |
| Ratio of net investment income to average net assets | | | | | | | | | | | | | | | | | | | | |
| Before fees waived/recaptured | | | 2.40 | % | | | 2.39 | % | | | 1.65 | % | | | 1.04 | % | | | 1.01 | % |
| After fees waived/recaptured | | | 2.93 | % | | | 3.49 | % | | | 2.11 | % | | | 1.19 | % | | | 1.18 | % |
| | | | | | | | | | | | | | | | | | | | | |
| Portfolio turnover rate | | | 49.58 | % | | | 15.49 | % | | | 9.81 | % | | | 14.39 | % | | | 6.25 | % |
| (1) | Amount represents less than $0.01 per share. |
| (2) | The Advisor has contractually agreed to limit the operating expenses of the Fund to 1.45%, excluding interest expense, expenses related to dividends on short positions, brokerage commissions, taxes and other extraordinary expenses. See Note 3. |
| (3) | If interest expense had been excluded, expenses would have been lowered by 0.01% for the year ended December 31, 2020. |
The accompanying notes are an integral part of these financial statements.
FINANCIAL HIGHLIGHTS
For a capital share outstanding throughout each period.
| | | Year Ended December 31, | |
| Global Innovators Fund - Investor Class | | 2021 | | | 2020 | | | 2019 | | | 2018 | | | 2017 | |
| | | | | | | | | | | | | | | | |
| Net asset value, beginning of period | | $ | 60.53 | | | $ | 45.66 | | | $ | 34.89 | | | $ | 44.98 | | | $ | 34.15 | |
| | | | | | | | | | | | | | | | | | | | | |
| Income from investment operations: | | | | | | | | | | | | | | | | | | | | |
| Net investment income (loss) | | | (0.20 | ) | | | (0.06 | ) | | | 0.12 | | | | 0.13 | | | | 0.09 | |
| Net realized and unrealized gain (loss) on investments and foreign currency | | | 12.77 | | | | 16.53 | | | | 12.73 | | | | (7.56 | ) | | | 11.76 | |
| Total from investment operations | | | 12.57 | | | | 16.47 | | | | 12.85 | | | | (7.43 | ) | | | 11.85 | |
| | | | | | | | | | | | | | | | | | | | | |
| Less distributions: | | | | | | | | | | | | | | | | | | | | |
| From net investment income | | | - | | | | - | | | | (0.11 | ) | | | (0.15 | ) | | | (0.04 | ) |
| From net realized gain | | | (11.06 | ) | | | (1.60 | ) | | | (1.97 | ) | | | (2.51 | ) | | | (0.98 | ) |
| Total distributions | | | (11.06 | ) | | | (1.60 | ) | | | (2.08 | ) | | | (2.66 | ) | | | (1.02 | ) |
| | | | | | | | | | | | | | | | | | | | | |
| Net asset value, end of period | | $ | 62.04 | | | $ | 60.53 | | | $ | 45.66 | | | $ | 34.89 | | | $ | 44.98 | |
| | | | | | | | | | | | | | | | | | | | | |
| Total return | | | 21.52 | % | | | 36.17 | % | | | 37.00 | % | | | (16.80 | )% | | | 34.75 | % |
| | | | | | | | | | | | | | | | | | | | | |
| Ratios/supplemental data: | | | | | | | | | | | | | | | | | | | | |
| Net assets, end of period (millions) | | $ | 161.4 | | | $ | 147.8 | | | $ | 134.8 | | | $ | 131.2 | | | $ | 185.9 | |
| | | | | | | | | | | | | | | | | | | | | |
| Ratio of expenses to average net assets: | | | | | | | | | | | | | | | | | | | | |
| Before fees waived/recaptured | | | 1.17 | % | | | 1.24 | % | | | 1.35 | % | | | 1.30 | % | | | 1.33 | % |
| After fees waived/recaptured (1) | | | 1.24 | % | | | 1.24 | % | | | 1.24 | % | | | 1.25 | %(2) | | | 1.24 | % |
| | | | | | | | | | | | | | | | | | | | | |
| Ratio of net investment income (loss) to average net assets: | | | | | | | | | | | | | | | | | | | | |
| Before fees waived/recaptured | | | (0.25 | %) | | | (0.10 | %) | | | 0.17 | % | | | 0.23 | % | | | 0.13 | % |
| After fees waived/recaptured | | | (0.32 | %) | | | (0.10 | %) | | | 0.28 | % | | | 0.28 | % | | | 0.22 | % |
| | | | | | | | | | | | | | | | | | | | | |
| Portfolio turnover rate | | | 19.01 | % | | | 14.44 | % | | | 15.56 | % | | | 28.93 | % | | | 19.86 | % |
| (1) | The Advisor has contractually agreed to limit the operating expenses to 1.24% excluding interest expense, expenses related to dividends on short positions, brokerage commissions, taxes and other extraordinary expenses. See Note 3. |
| (2) | If interest expense had been excluded, expenses would have been lowered by 0.01% for the year ended December 31, 2018. |
The accompanying notes are an integral part of these financial statements.
FINANCIAL HIGHLIGHTS
For a capital share outstanding throughout each period.
| | | Year Ended December 31, | |
| Global Innovators Fund - Institutional Class | | 2021 | | | 2020 | | | 2019 | | | 2018 | | | 2017 | |
| | | | | | | | | | | | | | | | |
| Net asset value, beginning of period | | $ | 60.89 | | | $ | 45.84 | | | $ | 34.99 | | | $ | 45.08 | | | $ | 34.20 | |
| | | | | | | | | | | | | | | | | | | | | |
| Income from investment operations: | | | | | | | | | | | | | | | | | | | | |
| Net investment income (loss) | | | (0.04 | ) | | | 0.07 | | | | 0.22 | | | | 0.24 | | | | 0.16 | |
| Net realized and unrealized gain (loss) on investments and foreign currency | | | 12.89 | | | | 16.60 | | | | 12.79 | | | | (7.58 | ) | | | 11.82 | |
| Total from investment operations | | | 12.85 | | | | 16.67 | | | | 13.01 | | | | (7.34 | ) | | | 11.98 | |
| | | | | | | | | | | | | | | | | | | | | |
| Less distributions: | | | | | | | | | | | | | | | | | | | | |
| From net investment income | | | - | | | | (0.02 | ) | | | (0.19 | ) | | | (0.24 | ) | | | (0.12 | ) |
| From net realized gain | | | (11.06 | ) | | | (1.60 | ) | | | (1.97 | ) | | | (2.51 | ) | | | (0.98 | ) |
| Total distributions | | | (11.06 | ) | | | (1.62 | ) | | | (2.16 | ) | | | (2.75 | ) | | | (1.10 | ) |
| | | | | | | | | | | | | | | | | | | | | |
| Net asset value, end of period | | $ | 62.68 | | | $ | 60.89 | | | $ | 45.84 | | | $ | 34.99 | | | $ | 45.08 | |
| | | | | | | | | | | | | | | | | | | | | |
| Total return | | | 21.86 | %(1) | | | 36.46 | % | | | 37.35 | % | | | (16.59 | )% | | | 35.07 | % |
| | | | | | | | | | | | | | | | | | | | | |
| Ratios/supplemental data: | | | | | | | | | | | | | | | | | | | | |
| Net assets, end of period (millions) | | $ | 64.6 | | | $ | 55.2 | | | $ | 45.9 | | | $ | 33.6 | | | $ | 44.1 | |
| | | | | | | | | | | | | | | | | | | | | |
| Ratio of expenses to average net assets: | | | | | | | | | | | | | | | | | | | | |
| Before fees waived | | | 0.99 | % | | | 1.07 | % | | | 1.21 | % | | | 1.13 | % | | | 1.17 | % |
| After fees waived (1) | | | 0.99 | % | | | 0.99 | % | | | 0.99 | % | | | 1.00 | %(2) | | | 0.99 | % |
| | | | | | | | | | | | | | | | | | | | | |
| Ratio of net investment income to average net assets: | | | | | | | | | | | | | | | | | | | | |
| Before fees waived | | | (0.08 | %) | | | 0.06 | % | | | 0.31 | % | | | 0.40 | % | | | 0.30 | % |
| After fees waived | | | (0.08 | %) | | | 0.14 | % | | | 0.53 | % | | | 0.53 | % | | | 0.48 | % |
| | | | | | | | | | | | | | | | | | | | | |
| Portfolio turnover rate | | | 19.01 | % | | | 14.44 | % | | | 15.56 | % | | | 28.93 | % | | | 19.86 | % |
| (1) | The Advisor has contractually agreed to limit the operating expenses of the Fund's Institutional Class to 0.99%, excluding interest expense, expenses related to dividends on short positions, brokerage commissions, taxes and other extraordinary expenses. See Note 3. |
| (2) | If interest expense had been excluded, expenses would have been lowered by 0.01% for the year ended December 31, 2018. |
The accompanying notes are an integral part of these financial statements.
FINANCIAL HIGHLIGHTS
For a capital share outstanding throughout each period.
| | | Year Ended December 31, | |
| Renminbi Yuan & Bond Fund | | 2021 | | | 2020 | | | 2019 | | | 2018 | | | 2017 | |
| | | | | | | | | | | | | | | | |
| Net asset value, beginning of period | | $ | 12.50 | | | $ | 11.53 | | | $ | 11.25 | | | $ | 12.00 | | | $ | 11.03 | |
| | | | | | | | | | | | | | | | | | | | | |
| Income from investment operations: | | | | | | | | | | | | | | | | | | | | |
| Net investment income | | | 0.21 | | | | 0.24 | | | | 0.34 | | | | 0.29 | | | | 0.23 | |
| Net realized and unrealized gain (loss) on investments and foreign currency | | | 0.16 | | | | 0.78 | | | | 0.05 | | | | (0.54 | ) | | | 0.85 | |
| Total from investment operations | | | 0.37 | | | | 1.02 | | | | 0.39 | | | | (0.25 | ) | | | 1.08 | |
| | | | | | | | | | | | | | | | | | | | | |
| Less distributions: | | | | | | | | | | | | | | | | | | | | |
| From net investment income | | | (0.25 | ) | | | (0.05 | ) | | | - | | | | (0.49 | ) | | | (0.09 | ) |
| Return of capital | | | - | | | | - | | | | (0.13 | ) | | | (0.01 | ) | | | (0.02 | ) |
| Total distributions | | | (0.25 | ) | | | (0.05 | ) | | | (0.13 | ) | | | (0.50 | ) | | | (0.11 | ) |
| | | | | | | | | | | | | | | | | | | | | |
| Redemption fee proceeds | | | - | | | | - | (1) | | | 0.02 | | | | - | (1) | | | - | |
| | | | | | | | | | | | | | | | | | | | | |
| Net asset value, end of period | | $ | 12.62 | | | $ | 12.50 | | | $ | 11.53 | | | $ | 11.25 | | | $ | 12.00 | |
| | | | | | | | | | | | | | | | | | | | | |
| Total return | | | 3.00 | %(2) | | | 8.89 | % | | | 3.68 | % | | | (2.12 | )% | | | 9.79 | % |
| | | | | | | | | | | | | | | | | | | | | |
| Ratios/supplemental data: | | | | | | | | | | | | | | | | | | | | |
| Net assets, end of period (millions) | | $ | 5.4 | | | $ | 3.9 | | | $ | 1.5 | | | $ | 2.2 | | | $ | 2.6 | |
| | | | | | | | | | | | | | | | | | | | | |
| Ratio of expenses to average net assets: | | | | | | | | | | | | | | | | | | | | |
| Before fees waived | | | 2.29 | % | | | 5.26 | % | | | 6.79 | % | | | 3.52 | % | | | 4.17 | % |
| After fees waived (2) | | | 0.90 | % | | | 0.91 | %(3) | | | 0.90 | % | | | 0.93 | %(3) | | | 0.90 | % |
| | | | | | | | | | | | | | | | | | | | | |
| Ratio of net investment income (loss) to average net assets: | | | | | | | | | | | | | | | | | | | | |
| Before fees waived/recaptured | | | 0.43 | % | | | (1.90 | %) | | | (1.95 | %) | | | 0.34 | % | | | (1.33 | %) |
| After fees waived/recaptured | | | 1.82 | % | | | 2.45 | % | | | 3.94 | % | | | 2.93 | % | | | 1.94 | % |
| | | | | | | | | | | | | | | | | | | | | |
| Portfolio turnover rate | | | 31.79 | % | | | 36.26 | % | | | 0.00 | % | | | 34.93 | % | | | 66.21 | % |
| (1) | Amount represents less than $0.01 per share. |
| (2) | The Advisor has contractually agreed to limit the operating expenses of the Fund to 0.90%, excluding interest expense, expenses related to dividends on short positions, brokerage commissions, taxes and other extraordinary expenses. See Note 3. |
| (3) | If interest expense had been excluded, expenses would have been lowered by 0.01%, 0.03% and 0.10% for the years ended December 31, 2020, 2018 and 2016, respectively. |
The accompanying notes are an integral part of these financial statements.
NOTES TO FINANCIAL STATEMENTS
December 31, 2021
Note 1 - Organization
Guinness Atkinson™ Funds (the “Trust”), was organized on April 28, 1997 as a Delaware business trust and registered under the Investment Company Act of 1940, as amended (the “1940 Act”), as an open-end management investment company. Currently, the Trust offers eleven separate, series portfolios, each of which has a unique investment objective and strategies. This report covers the six open-end mutual funds: Guinness Atkinson Alternative Energy Fund (the “Alternative Energy Fund”), Guinness Atkinson Asia Focus Fund (the “Asia Focus Fund”), Guinness Atkinson China & Hong Kong Fund (the “China & Hong Kong Fund”), Guinness Atkinson Global Energy Fund (the “Global Energy Fund”), Guinness Atkinson Global Innovators Fund (the “Global Innovators Fund”) and Guinness Atkinson Renminbi Yuan & Bond Fund (the “Renminbi Yuan & Bond Fund”), all of which (each a “Fund” and collectively, the “Funds”) are covered by this report. Except for the Renminbi Yuan & Bond Fund, each Fund is a diversified Fund. The China & Hong Kong Fund began operations on June 30, 1994, the Asia Focus Fund began operations on April 29, 1996, the Global Innovators Fund began operations on December 15, 1998, the Global Energy Fund began operations on June 30, 2004, the Alternative Energy Fund began operations on March 31, 2006, and the Renminbi Yuan & Bond Fund began operations on June 30, 2011. Each of the Funds is authorized to issue a single class of shares except for the Global Innovators Fund. The Global Innovators Fund is authorized to issue two classes of shares: Investor Class shares and Institutional Class shares. Institutional Class shares of the Global Innovators Fund commenced operations on December 31, 2015.
The shares of each class represent an interest in the same portfolio of investments of the Global Innovators Fund and have equal rights as to voting, redemptions, dividends and liquidation, subject to the approval of the Trustees. Income and expenses (other than expenses attributable to a specific class) and realized and unrealized gains and losses on investments are allocated to each class of shares in proportion to their relative shares outstanding. Shareholders of a class that bears distribution and service expenses under the terms of a distribution plan have exclusive voting rights to that distribution plan.
The Alternative Energy Fund, Asia Focus Fund, Global Energy Fund, and Global Innovator Fund’s investment objective is long-term capital appreciation. The China & Hong Kong Fund’s investment objective is long-term capital appreciation primarily through investments in securities of China and Hong Kong. The Renminbi Yuan & Bond Fund’s investment objective is to seek total return. Total return means the combination of capital appreciation and investment income, which includes changes in the value of the renminbi, the currency of China of which the yuan is the unit.
Note 2 - Significant accounting policies
Each Fund is an investment company and accordingly follows the investment company accounting and reporting guidance of the Financial Accounting Standards Board (FASB) Accounting Standard Codification Topic 946 “Financial Services—Investment Companies”.
The following is a summary of significant accounting policies consistently followed by the Funds. These policies are in conformity with accounting principles generally accepted in the United States of America. (“GAAP”).
| A. | Security Valuation. Securities of the Funds that are traded on a principal exchange (U.S. or foreign) or NASDAQ are valued at the official closing price on each day that the exchanges are open for trading. Securities traded on an exchange for which there have been no sales, and other over-the-counter securities are valued at the mean between the bid and asked prices. Debt securities are valued based on available market quotations received from an independent pricing service approved by the Trust’s Board of Trustees which may utilize both transaction data and market information such as yield, prices of securities of comparable quality, coupon rate, maturity, type of issue, trading characteristics and other market data. Securities for which quotations are not readily available are valued at their respective fair values as determined in good faith by the Funds’ Valuation Committee in accordance with procedures established by the Board of Trustees. In determining fair value, the Funds’ Valuation Committee take into account all relevant factors and available information. Consequently, the price of the security used to calculate its Net Asset Value may differ from quoted or published prices for the same security. Fair value pricing involves subjective judgments and there is no single standard for determining a security’s fair value. As a result, different mutual funds could reasonably arrive at different fair value for the same security. It is possible that the fair value determined for a security is materially different from the value that could be realized upon the sale of that security or from the values that other mutual funds may determine. Short-term investments are stated at cost, combined with accrued interest, which approximates market value. Realized gains and losses from securities transactions are calculated using the identified cost method. |
NOTES TO FINANCIAL STATEMENTS
December 31, 2021
Foreign securities are recorded in the financial statements after translation to U.S. dollars based on the applicable exchange rate at the end of the period. The Funds do not isolate that portion of the results of operations resulting from changes in the currency exchange rate from the fluctuations resulting from changes in the market prices of investments.
Foreign exchange gain or loss resulting from holding of a foreign currency, expiration of a currency exchange contract, difference in exchange rates between the trade date and settlement date of an investment purchased or sold, and the difference between dividends actually received compared to the amount shown in a Fund’s accounting records on the date of receipt are shown as net realized gains or losses on foreign currency transactions in the respective Fund’s statement of operations.
| B. | Forward Foreign Currency Exchange Contracts. The Funds may utilize forward foreign currency exchange contracts ("forward contracts") to hedge against foreign exchange fluctuations on foreign-denominated investments under which they are obligated to exchange currencies at specific future dates and at specified rates. All commitments are "marked-to-market" daily and any resulting unrealized gains or losses are included as unrealized appreciation (depreciation) on foreign currency denominated assets and liabilities. The Funds record realized gains or losses at the time the forward contract is settled. Risks may arise upon entering these contracts from the potential inability of a counter party to meet the terms of their contracts and from unanticipated movements in the value of a foreign currency relative to the U.S. dollar or other currencies. Counterparties to these contracts are major U.S. financial institutions. Please refer to Note 8 for further information on forward foreign currency contracts held in each Fund. |
| C. | Restricted Securities. A restricted security cannot be resold to the general public without prior registration under the Securities Act of 1933. If the security is subsequently registered and resold, the issuers would typically bear the expense of all registrations at no cost to the Fund. Restricted securities are valued according to the guidelines and procedures adopted by the Funds’ Board of Trustees. |
| D. | Illiquid Securities. Pursuant to Rule 22e-4 under the 1940 Act, the Funds have adopted a Liquidity Risk Management Program (“LRMP”) that requires, among other things, that each Fund limits its illiquid investments that are assets to no more than 15% of net assets. An illiquid investment is any security which may not reasonably be expected to be sold or disposed of in current market conditions in seven calendar days or less without the sale or disposition significantly changing the market value of the investment. If the Advisor, at any time determines that the value of illiquid securities held by a Fund exceeds 15% of its net asset value, the Advisor will take steps as it considers appropriate to reduce them as soon as reasonably practicable in accordance with the Funds’ written LRMP. |
| E. | Security Transactions, Dividend Income and Distributions. Security transactions are accounted for on the trade date. Realized gains and losses from securities transactions are calculated using the identified cost method. Dividend income is recorded net of applicable withholding taxes on the ex-dividend date and interest income is recorded on an accrual basis. Withholding taxes on foreign dividends, if applicable, are paid (a portion of which may be reclaimable) or provided for in accordance with the applicable country’s tax rules and rates and are disclosed in the Statement of Operations. Withholding tax reclaims are filed in certain countries to recover a portion of the amounts previously withheld. The Funds record a reclaim receivable based on a number of factors, including a jurisdiction’s legal obligation to pay reclaims as well as payment history and market convention. The Funds may be subject to foreign taxation related to capital gains on the sale of securities in the foreign jurisdictions in which they invest. When a capital gain tax is determined to apply, the Funds record an estimated deferred tax liability in an amount that may be payable if securities were disposed of on the valuation date. |
NOTES TO FINANCIAL STATEMENTS
December 31, 2021
| F. | Allocation of Expenses. Each Fund is charged for those expenses directly attributable to it. Expenses that are not directly attributable to a Fund are allocated among the Funds in proportion to their respective assets or another appropriate method. Expenses such as distribution and service fees, transfer agent fees and expenses with respect to the Global Innovators Fund, that are specific to individual share classes are accrued directly to the respective share class. |
| G. | Cash overdraft. Throughout the year, the Funds may have cash overdraft balances. A fee is incurred on these overdrafts, calculated by multiplying the overdraft by a rate plus London Interbank Offered Rate (“LIBOR”). Payables, if any, are reflected as Overdraft Due to Custodian Bank in the Statements of Assets and Liabilities. Expenses from cash overdrafts are included in Interest Expense in the Statements of Operations. |
| H. | Concentration of Risk. The Alternative Energy Fund invests substantially in the alternative energy or energy technology sectors. The Asia Focus Fund invests substantially all of its assets in the Asian continent. The China & Hong Kong Fund invests substantially all of its assets in securities that are traded in China or Hong Kong or that are issued by companies that do a substantial part of their business in China. The Global Energy Fund invests substantially in energy companies; the changes in the prices and supplies of oil and other energy fuels may affect the Fund’s investments. The Renminbi Yuan & Bond Fund invests in securities issued by companies economically tied to China, which exposes the Fund to greater market risk and potential monetary losses than if the Fund’s assets were diversified among other regions. The consequences of political, social, or economic changes in the countries or business sectors in which the securities are offered or the issuers conduct their operations may affect the market prices of the Funds' investments and any income generated, as well as the Funds' ability to repatriate such amounts. |
| I. | Use of Estimates. The preparation of financial statements in conformity with accounting principles generally accepted in the United States requires management to make estimates and assumptions that affect the reported amounts of assets and liabilities and the disclosure of contingent assets and liabilities at the date of the financial statements. Actual results could differ from those estimates. |
| J. | Reclassifications. Accounting principles generally accepted in the United States require that certain components of net assets be reclassified between financial and tax reporting. These reclassifications have no effect on net assets or new asset value per share and were primarily attributed to differences in the treatment of foreign currency and net investment losses. For the year ended December 31, 2021, permanent differences in book and tax accounting have been reclassified as follows: |
| | | Distributable Earnings /(Losses) | | | Paid in Capital | |
| Alternative Energy Fund | | $ | 309,403 | | | $ | (309,403 | ) |
| Asia Focus Fund | | | - | | | | - | |
| China & Hong Kong Fund | | | - | | | | - | |
| Global Energy Fund | | | - | | | | - | |
| Global Innovators Fund | | | - | | | | - | |
| Renminbi Yuan & Bond Fund | | | 485 | | | | (485 | ) |
NOTES TO FINANCIAL STATEMENTS
December 31, 2021
| K. | Indemnifications. Under the Trust's organizational documents, its current and former officers and trustees are indemnified against certain liabilities arising out of the performance of their duties to the Funds. In addition, in the normal course of business, the Funds enter into contracts that contain a variety of representations and warranties that provide general indemnifications. The Funds' maximum exposure under these arrangements is unknown as this would involve future claims that may be made against the Funds that have not yet occurred or that would be covered by other parties. |
| L. | Federal Income Taxes. The Funds intend to comply with the requirements of Subchapter M of the Internal Revenue Code applicable to regulated investment companies and to distribute substantially all of their net investment income and any net realized gains to their shareholders. Therefore, no provision is made for federal income or excise taxes. Due to the timing of dividend distributions and the differences in accounting for income and realized gains and losses for financial statement and federal income tax purposes, the fiscal year in which amounts are distributed may differ from the year in which the income and realized gains and losses are recorded by the Funds. |
Accounting for Uncertainty in Income Taxes (the “Income Tax Statement”) requires an evaluation of tax positions taken (or expected to be taken) in the course of preparing a Funds’ tax returns to determine whether these positions meet a “more-likely-than-not” standard that, based on the technical merits, have a more than fifty percent likelihood of being sustained by a taxing authority upon examination. A tax position that meets the “more-likely-than-not” recognition threshold is measured to determine the amount of benefit to recognize in the financial statements. The Funds recognize interest and penalties, if any, related to unrecognized tax benefits as income tax expense in the Statements of Operations. The Income Tax Statement requires management of the Funds to analyze tax positions taken in the prior three open tax years, if any, and tax positions expected to be taken in the Fund’s current tax year, as defined by the IRS statute of limitations for all major jurisdictions, including federal tax authorities and certain state tax authorities. As of and during the open year ended December 31, 2021 the Funds did not have a liability for any unrecognized tax benefits. The Funds have no examination in progress and are not aware of any tax positions for which it is reasonably possible that the total amounts of unrecognized tax benefits will significantly change in the next twelve months.
Note 3 - Investment Advisory and Other Agreements
The Trust, on behalf of each Fund, entered into an Investment Advisory Agreement with Guinness Atkinson Asset Management, Inc. (the “Advisor”), under which the Advisor provides the Funds with investment management services. The Advisor furnishes all investment advice, office space, facilities, and most of the personnel needed by the Funds. As compensation for its services, the Advisor is entitled to a monthly fee at the following annual rates based upon the average daily net assets of the Funds:
| | |
| Alternative Energy Fund | 1.00% |
| Asia Focus Fund | 1.00% |
| China & Hong Kong Fund | 1.00% |
| Global Energy Fund | 0.75% |
| Global Innovators Fund | 0.75% on the 1st $500 million, 0.60% thereafter |
| Renminbi Yuan & Bond Fund | 0.55% |
The Funds are responsible for their own operating expenses. The Advisor has contractually agreed to limit each Fund’s total operating expenses (excluding interest, dividends on short positions, taxes and extraordinary expenses) by reducing all or a portion of its fees and reimbursing the Fund for expenses so that its ratio of expenses to average daily net assets will not exceed the following levels:
NOTES TO FINANCIAL STATEMENTS
December 31, 2021
| | Annual Expense Limit | Expiration Date |
| Alternative Energy Fund | 1.98% | June 30, 2025 |
| Asia Focus Fund | 1.98% | June 30, 2025 |
| China & Hong Kong Fund | 1.98% | June 30, 2025 |
| Global Energy Fund | 1.45% | June 30, 2025 |
| Global Innovators Fund - Investor Class | 1.24% | June 30, 2025 |
| Global Innovators Fund - Institutional Class | 0.99% | June 30, 2025 |
| Renminbi Yuan & Bond Fund | 0.90% | June 30, 2025 |
The expense ratios shown in the financial highlights may exceed these levels due to expenses incurred, but not covered by the expense limitation agreement.
To the extent that the Advisor waives fees and/or absorbs expenses it may seek repayment of a portion or all of such amounts at any time within three fiscal years after the fiscal year in which such amounts were waived or absorbed and recaptured previously waived subject to the applicable cap. For the year ended December 31, 2021, the Advisor waived fees and absorbed expenses/recaptured previously waived fees as follows:
| | | Fees waived and Expenses Absorbed | | | Fees and Expenses Recaptured | |
| Alternative Energy Fund | | $ | - | | | $ | 90,199 | |
| Asia Focus Fund | | | - | | | | 17,077 | |
| Global Energy Fund | | | 62,548 | | | | - | |
| Global Innovators Fund | | | - | | | | 113,435 | |
| Renminbi Yuan & Bond Fund | | | 65,641 | | | | - | |
| Total | | $ | 128,189 | | | $ | 240,711 | |
At December 31, 2021, the Advisor may recapture a portion of the following amounts that had been paid and/or waived on behalf of the Funds no later than the dates as stated below:
| | | December 31, | |
| Fund | | 2022 | | | 2023 | | | 2024 | | | Total | |
| Alternative Energy Fund | | $ | 59,162 | | | $ | 56,176 | | | $ | - | | | $ | 115,338 | |
| Asia Focus Fund | | | 34,478 | | | | 37,318 | | | | - | | | | 71,796 | |
| Global Energy Fund | | | 87,056 | | | | 108,558 | | | | 62,548 | | | | 258,162 | |
| Global Innovators Fund | | | 240,701 | | | | 36,040 | | | | 1,211 | | | | 277,952 | |
| Renminbi Yuan & Bond Fund | | | 102,254 | | | | 98,235 | | | | 65,641 | | | | 266,130 | |
Foreside Fund Services, LLC acts as the Funds' principal underwriter in a continuous public offering of the Funds' shares.
Mutual Fund Administration, LLC (the “Administrator”) acts as the Funds’ administrator under an administration agreement. The fees paid to the Administrator for the year ended December 31, 2021, are reported on the Statements of Operations.
Foreside Fund Officer Services, LLC provides Chief Compliance Officer (“CCO”) services to the Funds. The fees paid for CCO services for the year ended December 31, 2021, are reported on the Statements of Operations.
NOTES TO FINANCIAL STATEMENTS
December 31, 2021
The fees paid to non-interested Trustees for the year ended December 31, 2021, are reported on the Statements of Operations.
Certain officers of the Trust are also officers and/or Directors of the Advisor and the Administrator. None of these officers are compensated directly by the Funds.
Note 4 - Distribution Plan
The Trust has adopted a Distribution Plan under Rule 12b-1 of the 1940 Act. The Board of Trustees has not authorized the Funds to make payment under the Distribution Plan. Currently, no payment is being made by the Funds.
Note 5 - Shareholder Servicing Plan
Each Fund has adopted a Shareholder Servicing Plan to pay a fee at an annual rate of up to 0.25% of its daily average net assets of shares serviced by shareholder servicing agents who provide administrative and support services to their customers. The Global Innovators Fund – Institutional Class shares do not participate in the Shareholder Servicing Plan.
The fees paid under the Shareholder Servicing Plan for the year ended December 31, 2021, are reported on the Statements of Operations.
Note 6 - Investment Transactions
The following table presents purchases and sales of securities during the year ended December 31, 2021, excluding short-term investments, to indicate the volume of transactions in each Fund.
| | | | | | | |
| | | Purchases | | | Sales | |
| Alternative Energy Fund | | | 14,619,478 | | | | 9,937,670 | |
| Asia Focus Fund | | | 5,368,611 | | | | 6,833,524 | |
| China & Hong Kong Fund | | | 19,262,285 | | | | 24,464,471 | |
| Global Energy Fund | | | 5,705,855 | | | | 5,572,449 | |
| Global Innovators Fund | | | 40,828,053 | | | | 60,987,178 | |
| Renminbi Yuan & Bond Fund | | | 2,164,719 | | | | 1,231,868 | |
The Funds did not purchase U.S. Government securities as a part of their long-term investment strategy during the year ended December 31, 2021.
Note 7 - Fair Value Measurements and Disclosures
Fair Value Measurements and Disclosures defines fair value, establishes a framework for measuring fair value in accordance with GAAP, and expands disclosure about fair value measurements. It also provides guidance on determining when there has been a significant decrease in the volume and level of activity for an asset or a liability, when a transaction is not orderly, and how that information must be incorporated into a fair value measurement.
Under Fair Value Measurements and Disclosures, various inputs are used in determining the value of each Fund’s investments. These inputs are summarized into three broad Levels as described below:
| · | Level 1 – Unadjusted quoted prices in active markets for identical assets or liabilities that a Fund has the ability to access. |
NOTES TO FINANCIAL STATEMENTS
December 31, 2021
| · | Level 2 – Observable inputs other than quoted prices included in level 1 that are observable for the asset or liability, either directly or indirectly. These inputs may include quoted prices for the identical instrument on an inactive market, prices for similar instruments, interest rates, prepayment speeds, credit risk, yield curves, default rates and similar data. |
| · | Level 3 – Unobservable inputs for the asset or liability, to the extent relevant observable inputs are not available, representing the Fund’s own assumptions about the assumptions a market participant would use in valuing the asset or liability, and would be based on the best information available. |
The availability of observable inputs can vary from security to security and is affected by a wide variety of factors, including for example, the type of security, whether the security is new and not yet established in the marketplace, the liquidity of markets, and other characteristics particular to the security. To the extent that valuation is based on models or inputs that are less observable or unobservable in the market, the determination of fair value requires more judgment. Accordingly, the degree of judgment exercised in determining fair value is greatest for instruments categorized in Level 3.
The inputs used to measure fair value may fall into different levels of the fair value hierarchy. In such cases, for disclosure purposes, the level in the fair value hierarchy within which the fair value measurement falls in its entirety, is determined based on the lowest level input that is significant to the fair value measurement in its entirety.
The inputs or methodology used for valuing securities are not an indication of the risk associated with investing in those securities. The following is a summary of the inputs used, as of December 31, 2021, in valuing the Funds' assets carried at fair value:
| Alternative Energy Fund | | | | | | | | | | | | |
| Assets Table | | Level 1 | | | Level 2 | | | Level 3 | | | Total | |
| Investments, at value | | | | | | | | | | | | |
| Common Stocks: | | | | | | | | | | | | |
| Basic Materials | | $ | 1,733,058 | | | $ | - | | | $ | - | | | $ | 1,733,058 | |
| Communication | | | 1,140,472 | | | | - | | | | - | | | | 1,140,472 | |
| Consumer, Cyclical | | | 4,011,870 | | | | - | | | | - | | | | 4,011,870 | |
| Energy | | | 6,051,442 | | | | - | | | | - | | | | 6,051,442 | |
| Industrial | | | 6,994,539 | | | | - | | | | - | | | | 6,994,539 | |
| Technology | | | 2,784,974 | | | | - | | | | - | | | | 2,784,974 | |
| Utilities | | | 9,312,471 | | | | - | | | | - | | | | 9,312,471 | |
| Total Investments, at value | | | 32,028,826 | | | | - | | | | - | | | | 32,028,826 | |
| Total Assets | | $ | 32,028,826 | | | $ | - | | | $ | - | | | $ | 32,028,826 | |
| Asia Focus Fund | | | | | | | | | | | | |
| Assets Table | | Level 1 | | | Level 2 | | | Level 3 | | | Total | |
| Investments, at value | | | | | | | | | | | | |
| Common Stocks: | | | | | | | | | | | | |
| Communications | | $ | 1,913,374 | | | $ | - | | | $ | - | | | $ | 1,913,374 | |
| Consumer, Cyclical | | | 2,183,531 | | | | - | | | | - | | | | 2,183,531 | |
| Consumer, Non-cyclical | | | 2,652,581 | | | | - | | | | - | | | | 2,652,581 | |
| Financial | | | 1,653,321 | | | | - | | | | - | | | | 1,653,321 | |
| Industrial | | | 3,635,183 | | | | - | | | | - | | | | 3,635,183 | |
| Technology | | | 4,379,827 | | | | - | | | | - | | | | 4,379,827 | |
| Total Investments, at value | | | 16,417,817 | | | | - | | | | - | | | | 16,417,817 | |
| Total Assets | | $ | 16,417,817 | | | $ | - | | | $ | - | | | $ | 16,417,817 | |
NOTES TO FINANCIAL STATEMENTS
December 31, 2021
| China & Hong Kong Fund | | | | | | | | | | | | |
| Assets Table | | Level 1 | | | Level 2 | | | Level 3 | | | Total | |
| Investments, at value | | | | | | | | | | | | |
| Common Stocks: | | | | | | | | | | | | |
| Communications | | $ | 6,488,749 | | | $ | - | | | $ | - | | | $ | 6,488,749 | |
| Consumer, Cyclical | | | 13,811,115 | | | | - | | | | - | | | | 13,811,115 | |
| Consumer, Non-cyclical | | | 9,629,612 | | | | - | | | | - | | | | 9,629,612 | |
| Energy | | | 1,885,523 | | | | - | | | | - | | | | 1,885,523 | |
| Financial | | | 5,115,000 | | | | - | | | | - | | | | 5,115,000 | |
| Industrial | | | 12,918,296 | | | | - | | | | - | | | | 12,918,296 | |
| Technology | | | 4,499,247 | | | | - | | | | - | | | | 4,499,247 | |
| Utilities | | | 2,576,387 | | | | - | | | | - | | | | 2,576,387 | |
| Total Investments, at value | | | 56,923,929 | | | | - | | | | - | | | | 56,923,929 | |
| Total Assets | | $ | 56,923,929 | | | $ | - | | | $ | - | | | $ | 56,923,929 | |
| Global Energy Fund | | | | | | | | | | | | |
| Assets Table | | Level 1 | | | Level 2 | | | Level 3 | | | Total | |
| Investments, at value | | | | | | | | | | | | |
| Common Stocks: | | | | | | | | | | | | |
| Energy | | $ | 12,028,345 | | | $ | - | | | $ | - | | | $ | 12,028,345 | |
| Total Investments, at value | | | 12,028,345 | | | | - | | | | - | | | | 12,028,345 | |
| Total Assets | | $ | 12,028,345 | | | $ | - | | | $ | - | | | $ | 12,028,345 | |
| Global Innovators Fund | | | | | | | | | | | | |
| Assets Table | | Level 1 | | | Level 2 | | | Level 3 | | | Total | |
| Investments, at value | | | | | | | | | | | | |
| Common Stocks: | | | | | | | | | | | | |
| Communications | | $ | 35,527,969 | | | $ | - | | | $ | - | | | $ | 35,527,969 | |
| Consumer, Cyclical | | | 13,627,190 | | | | - | | | | - | | | | 13,627,190 | |
| Consumer, Non-cyclical | | | 33,460,885 | | | | - | | | | - | | | | 33,460,885 | |
| Financial | | | 21,909,192 | | | | - | | | | - | | | | 21,909,192 | |
| Industrial | | | 24,008,208 | | | | - | | | | - | | | | 24,008,208 | |
| Technology | | | 96,007,745 | | | | - | | | | - | | | | 96,007,745 | |
| Total Investments, at value | | | 224,541,189 | | | | - | | | | - | | | | 224,541,189 | |
| Total Assets | | $ | 224,541,189 | | | $ | - | | | $ | - | | | $ | 224,541,189 | |
| Renminbi Yuan & Bond Fund | | | | | | | | | | | | |
| Assets Table | | Level 1 | | | Level 2 | | | Level 3 | | | Total | |
| Investments, at value | | | | | | | | | | | | |
| Corporate Bonds: | | | | | | | | | | | | |
| Consumer Cyclical | | $ | - | | | $ | 780,640 | | | $ | - | | | $ | 780,640 | |
| Diversified | | | - | | | | 155,903 | | | | - | | | | 155,903 | |
| Financial | | | - | | | | 2,787,552 | | | | - | | | | 2,787,552 | |
| Government | | | - | | | | 474,180 | | | | - | | | | 474,180 | |
| Total Investments, at value | | | - | | | | 4,198,275 | | | | - | | | | 4,198,275 | |
| Total Assets | | $ | - | | | | 4,198,275 | | | $ | - | | | | 4,198,275 | |
NOTES TO FINANCIAL STATEMENTS
December 31, 2021
Note 8 - Forward Foreign Currency Contracts
In order to hedge their portfolio and to protect them against possible fluctuations in foreign exchange rates pending the settlement of securities transactions, the Funds may enter into forward foreign currency contracts that obligate them to exchange currencies at specified future dates. At the maturity of a forward contract, a Fund may either make delivery of the foreign currency from currency held, if any, or from the proceeds of the portfolio securities sold. It may also terminate its obligation to deliver the foreign currency at any time by purchasing an offsetting contract. The forward values of amounts due are netted against the forward value of the currency to be delivered, and the net amount is shown as a receivable or payable in the financial statements. The Funds did not enter into forward foreign currency contracts during the year ended December 31, 2021 and did not have any outstanding forward contracts as of December 31, 2021.
Note 9 - Tax Matters
As of December 31, 2021, the tax bases of investments were as follows:
| | | Alternative Energy Fund | | | Asia Focus Fund | | | China & Hong Kong Fund | |
| Cost of investments for tax purposes | | $ | 26,882,246 | | | $ | 10,096,715 | | | $ | 44,285,193 | |
| Gross tax unrealized appreciation | | | 6,757,299 | | | | 7,342,621 | | | | 16,378,368 | |
| Gross tax unrealized depreciation | | | (1,610,719 | ) | | | (1,021,519 | ) | | | (3,739,632 | ) |
| Net tax unrealized appreciation on investments | | | 5,146,580 | | | | 6,321,102 | | | | 12,638,736 | |
| Net tax unrealized appreciation on foreign-currency denominated assets and liabilities | | | (1,660 | ) | | | 35 | | | | 173 | |
| Net tax unrealized appreciation * | | | 5,144,920 | | | | 6,321,137 | | | | 12,638,909 | |
| Undistributed net ordinary income | | | - | | | | 25,623 | | | | 210,716 | |
| Undistributed Long-Term Capital Gains | | | - | | | | 341,178 | | | | 137,043 | |
| Post October loss ** | | | - | | | | (205,870 | ) | | | (207,519 | ) |
| Capital loss carryforward | | | (31,883,382 | ) | | | - | | | | - | |
| Other accumulated gain/(loss) | | | - | | | | - | | | | - | |
| Total accumulated gain/(loss) | | ($ | 26,738,462 | ) | | $ | 6,482,068 | | | $ | 12,779,149 | |
NOTES TO FINANCIAL STATEMENTS
December 31, 2021
| | | Global Energy Fund | | | Global Innovators Fund | | | Renminbi Yuan & Bond Fund | |
| Cost of investments for tax purposes | | $ | 14,659,032 | | | $ | 104,869,694 | | | $ | 4,077,381 | |
| Gross tax unrealized appreciation | | | 1,324,657 | | | | 119,762,963 | | | | 164,494 | |
| Gross tax unrealized depreciation | | | (3,955,344 | ) | | | (91,468 | ) | | | (43,600 | ) |
| Net tax unrealized appreciation (depreciation) on investments | | | (2,630,687 | ) | | | 119,671,495 | | | | 120,894 | |
| Net tax unrealized appreciation on foreign-currency denominated assets and liabilities | | | (445 | ) | | | 7,630 | | | | 15,405 | |
| Net tax unrealized appreciation (depreciation) * | | | (2,631,132 | ) | | | 119,679,125 | | | | 136,299 | |
| Undistributed net ordinary income | | | 25,196 | | | | 125,446 | | | | - | |
| Undistributed Long-Term Capital Gains | | | - | | | | 1,542,514 | | | | - | |
| Post October loss ** | | | - | | | | (4,942 | ) | | | - | |
| Capital loss carryforward | | | (28,275,247 | ) | | | - | | | | (4,236,975 | ) |
| Other accumulated gain/(loss) | | | - | | | | - | | | | - | |
| Total accumulated gain/(loss) | | $ | (30,881,183 | ) | | $ | 121,342,143 | | | $ | 4,100,676 | |
| * | The differences between book-basis and tax-basis unrealized appreciation/(depreciation) is attributable primary to the tax deferral of losses on wash sales and passive foreign investment company (PFIC) mark to market adjustments. |
| ** | Under the current tax law, capital and currency losses realized after October 31 and prior to a Fund's fiscal year end may be deferred as occurring on the first day of the following year. |
As of December 31, 2021, the Funds have the following capital loss carryforwards available to offset future realized capital gains:
| Capital losses expiring in: | | Alternative Energy Fund | | | Asia Focus Fund | | | China & Hong Kong Fund | | | Global Energy Fund | | | Global Innovators Fund | | | Renminbi Yuan & Bond Fund | |
| No Expiration Long-term | | $ | 31,883,382 | | | $ | - | | | $ | - | | | $ | 24,967,228 | | | $ | - | | | $ | 3,271,504 | |
| No Expiration Short-term | | | - | | | | - | | | | - | | | | 3,308,019 | | | | - | | | | 965,471 | |
| Total | | $ | 31,883,382 | | | $ | - | | | $ | - | | | $ | 28,275,247 | | | $ | - | | | $ | 4,236,975 | |
NOTES TO FINANCIAL STATEMENTS
December 31, 2021
The tax character of distributions paid during 2021 and 2020 fiscal years are as follows:
| | | 2021 | | | 2020 | |
| | | Ordinary Income | | | Long-term Capital Gain | | | Ordinary Income | | | Long-term Capital Gain | |
| Alternative Energy Fund | | $ | - | | | $ | - | | | $ | - | | | $ | - | |
| Asia Focus Fund | | | 193,255 | | | | 1,228,279 | | | | 255,001 | | | | 800,464 | |
| China & Hong Kong Fund | | | 3,366,912 | | | | 6,505,878 | | | | 875,966 | | | | 1,440,984 | |
| Global Energy Fund | | | 320,289 | | | | - | | | | 339,997 | | | | - | |
| Global Innovators Fund | | | - | | | | 34,815,074 | | | | 177,487 | | | | 5,099,892 | |
| Renminbi Yuan & Bond Fund | | | 101,565 | | | | - | | | | 6,438 | | | | - | |
Note 10 - Recently Issued Accounting Pronouncements
In August 2018, FASB issued Accounting Standards Update No. 2018-13 (“ASU 2018-13”), “Disclosure Framework – Changes to the Disclosure Requirements for Fair Value Measurement,” which amends the fair value measurement disclosure requirements of ASC Topic 820 (“ASC 820”), “Fair Value Measurement.” ASU 2018-13 includes new, eliminated, and modified disclosure requirements for ASC 820. In addition, ASU 2018-13 clarifies that materiality is an appropriate consideration of entities when evaluating disclosure requirements. ASU 2018-13 is effective for all entities for fiscal years beginning after December 15, 2019, including interim periods therein. Early adoption is permitted, and the Fund has adopted ASU 2018-13 with these financial statements.
Note 11 – Recent Market Risks
In early 2020, an outbreak of a novel strain of coronavirus (COVID-19) emerged globally. This coronavirus has resulted in closing international borders, enhanced health screenings, healthcare service preparation and delivery, quarantines, cancellations, disruptions to supply chains and customer activity, as well as general public concern and uncertainty. The impact of this outbreak has negatively affected the worldwide economy, as well as the economies of individual countries, the financial health of individual companies and the market in general in significant and unforeseen ways. The future impact of COVID-19 is currently unknown, and it may exacerbate other risks that apply to the Fund, including political, social and economic risks. Any such impact could adversely affect the Fund’s performance, the performance of the securities in which the Fund invests and may lead to losses on your investment in the Fund. The ultimate impact of COVID-19 on the financial performance of the Fund’s investments is not reasonably estimable at this time.
Note 12 - Events Subsequent to the Fiscal Period End
The Funds have adopted financial reporting rules regarding a subsequent event which requires an entity to recognize in the financial statements the effects of all subsequent events that provide additional evidence about conditions that existed at the date of the balance sheet. Management has evaluated the Funds’ related events and transactions and has determined that there were no events or transactions that occurred through the date of issuance of the Funds’ financial statements.
REPORT OF INDEPENDENT REGISTERED PUBLIC ACCOUNTING FIRM
To the Shareholders and Board of Trustees of Guinness Atkinson Funds
Opinion on the Financial Statements
We have audited the accompanying statements of assets and liabilities of Alternative Energy Fund, Asia Focus Fund, China & Hong Kong Fund, Global Energy Fund, Global Innovators Fund and Renminbi Yuan & Bond Fund (the “Funds”), each a series of Guinness Atkinson Funds (the “Trust”), including the schedules of investments, as of December 31, 2021, the related statements of operations for the year then ended, the statements of changes in net assets for each of the two years in the period then ended, and financial highlights for each of the five years in the period then ended, and the related notes (collectively referred to as the “financial statements”). In our opinion, the financial statements present fairly, in all material respects, the financial position of the Funds as of December 31, 2021, the results of their operations for the year then ended, the changes in their net assets for each of the two years in the period then ended, and their financial highlights for each of the five years in the period then ended, in conformity with accounting principles generally accepted in the United States of America.
Basis for Opinion
These financial statements are the responsibility of the Funds’ management. Our responsibility is to express an opinion on the Funds’ financial statements based on our audits. We are a public accounting firm registered with the Public Company Accounting Oversight Board (United States) (“PCAOB”) and are required to be independent with respect to the Funds in accordance with the U.S. federal securities laws and the applicable rules and regulations of the Securities and Exchange Commission and the PCAOB. We have served as the auditor of one or more of the funds in the Trust since 2003.
We conducted our audits in accordance with the standards of the PCAOB. Those standards require that we plan and perform the audits to obtain reasonable assurance about whether the financial statements are free of material misstatement, whether due to error or fraud. The Funds are not required to have, nor were we engaged to perform, an audit of the Funds’ internal control over financial reporting. As part of our audits we are required to obtain an understanding of internal control over financial reporting, but not for the purpose of expressing an opinion on the effectiveness of the Funds’ internal control over financial reporting. Accordingly, we express no such opinion.
Our audits included performing procedures to assess the risks of material misstatement of the financial statements, whether due to error or fraud, and performing procedures that respond to those risks. Such procedures included examining, on a test basis, evidence regarding the amounts and disclosures in the financial statements. Our audits also included evaluating the accounting principles used and significant estimates made by management, as well as evaluating the overall presentation of the financial statements. Our procedures included confirmation of securities owned as of December 31, 2021 by correspondence with the custodian. We believe that our audits provide a reasonable basis for our opinion.
| | TAIT, WELLER & BAKER LLP |
| Philadelphia, Pennsylvania | |
| March 1, 2022 | |
NOTES TO FINANCIAL STATEMENTS
December 31, 2021
Additional Information (Unaudited)
Proxy Voting Procedures
The Advisor votes proxies relating to portfolio securities in accordance with procedures that have been approved by the Board. You may obtain a description of these procedures, free of charge, by calling “toll-free” (800) 915-6565. This information is also available through the Securities and Exchange Commission’s website at www.sec.gov.
Proxy Voting Records
Information regarding how the Advisor voted proxies relating to portfolio securities during the latest 12-month period ended June 30 is available, without charge, by calling toll-free, (800) 915-6565. This information is also available through the Securities and Exchange Commission’s website at www.sec.gov.
Fund Portfolio Holdings
The Funds file their complete schedule of portfolio holdings with the SEC for the first and third quarters of each fiscal year on Form N-PORT within 60 days of the end of such fiscal quarter. Shareholders may obtain the Funds’ Form N-PORT on the SEC’s website at www.sec.gov. Prior to the use of Form N-PORT, the Funds filed their complete schedule of portfolio holdings with the SEC on Form N-Q, which is available on the SEC’s website.
Householding Mailings
To reduce expenses, the Trust may mail only one copy of Funds’ prospectus and each annual and semi-annual report to those addresses shared by two or more accounts. If you wish to receive individual copies of these documents, please call us at (800) 915-6565 (or contact your financial institution). The Trust will be sending you individual copies thirty days after receiving your request.
Supplemental Tax Information
For the year ended December 31, 2021, certain dividends paid by the Funds may be subject to a maximum tax rate of 15%, as provided for by the Jobs and Growth Tax Relief Reconciliation Act of 2003. The percentage of dividends declared from ordinary income designated as qualified dividend income was as follows:
| Alternative Energy Fund | N/A |
| Asia Focus Fund | 60% |
| China & Hong Kong Fund | 19% |
| Global Energy Fund | 100% |
| Global Innovators Fund | N/A |
| Renminbi Yuan & Bond Fund | N/A |
For the year ended December 31, 2021, pursuant to Section 853(b)(3) of the Internal Revenue Code, the Asia Focus Fund, China & Hong Kong Fund, and the Global Innovators Fund designates $1,228,279, $6,505,878, and $34,815,074 respectively, as long-term capital gains.
NOTES TO FINANCIAL STATEMENTS
December 31, 2021
Pursuant to Section 853 of the Internal Revenue Code of 1986, as amended, the Funds designate the following income earned from foreign sources and foreign taxes paid for the year ended December 31, 2021:
| | Foreign Sourced Income | Foreign Taxes Paid |
| | Total Amount | Per Share Amount | Total Amount | Per Share Amount |
| Alternative Energy Fund | N/A | N/A | N/A | N/A |
| Asia Focus Fund | $335,373 | $0.42 | $45,319 | $0.02 |
| China & Hong Kong Fund | 1,164,576 | 0.41 | 41,293 | 0.05 |
| Global Energy Fund | 389,807 | 0.56 | 49,406 | 0.07 |
| Global Innovators Fund | N/A | N/A | N/A | N/A |
| Renminbi Yuan & Bond Fund | N/A | N/A | N/A | N/A |
Guinness Atkinson Funds
Statement Regarding Liquidity Risk Management Program
The Securities and Exchange Commission adopted Rule 22e-4 under the Investment Company Act of 1940, as amended (the “Liquidity Rule”), to promote effective liquidity risk management throughout the open-end investment company industry, thereby reducing the risk that funds will be unable to meet their redemption obligations and mitigating dilution of the interests of fund shareholders.
The Board of Trustees (the “Board”) of Guinness Atkinson Funds (the “Trust”) met on December 10, 2021 (the “Meeting”), to review the liquidity risk management program (the “Program”) applicable to the following series of the Trust (each, a “Fund” and together, the “Funds”) pursuant to the Liquidity Rule:
Guinness Atkinson Alternative Energy Fund
Guinness Atkinson Asia Focus Fund
Guinness Atkinson China & Hong Kong Fund
Guinness Atkinson Global Energy Fund
Guinness Atkinson Global Innovators Fund
Guinness Atkinson Renminbi Yuan & Bond Fund
The Board has appointed Guinness Atkinson Asset Management, Inc., the investment adviser to the Funds, as the liquidity program administrator (“LPA”) for the Program. At the Meeting, the LPA, provided the Board with a written report (the “Report”) that addressed the operation, adequacy, and effectiveness of implementation of the Program, and any material changes to it for the period from October 1, 2020 through September 30, 2021 (the “Program Reporting Period”).
In assessing the adequacy and effectiveness of implementation of the Program, the Report discussed the following, among other things:
1. Investment strategy and the liquidity of its portfolio investments,
2. Redemption history of each Fund,
3. Effect of pricing spreads on Fund liquidity, and
4. Other funding sources.
The Report stated that the LPA assessed the Funds and determined that the Funds continue to be excluded from the requirement for HLIM determination by virtue of the liquidity of their holdings. Highly liquid investments are defined as cash and any investment reasonably expected to be convertible to cash in current market conditions in three business days or less without the conversion to cash significantly changing the market value of the investment. The Report also stated that there were no material changes made to the Program during the Program Reporting Period.
In the Report, the LPA concluded that the Program is adequately designed and has been effective in managing each Fund’s Liquidity Risk and in implementing the requirements of the Liquidity Rule
There can be no assurance that the Program will achieve its objectives in the future. Please refer to the Funds’ prospectus for more information regarding each Fund’s exposure to liquidity risk and other principal risks to which an investment in the Funds may be subject.
TRUSTEE AND OFFICER INFORMATION (Unaudited)
Unless otherwise noted, each Trustee and officer’s address is 251 South Lake Avenue, Suite 800, Pasadena, California 91101. Trustees and officers of the Trust serve until their resignation, removal or retirement. Additional information about the Trustees is included in the Funds’ Statement of Additional Information which is available, without charge, upon request by calling toll-free, 1-800-915-6565 or by visiting the Funds’ website at www.gafunds.com.
| Name and Age | Position(s) Held with the Trust† | Length of Time Served | Principal Occupation(s) During the Past 5 Years | Number of Portfolios In Fund Complex Overseen by Trustee | Other Directorships Held by Trustee During the Past 5 Years |
| Non-Interested Trustees |
J. Brooks Reece, Jr. (74) | Trustee and Chairman | Indefinite; Since April 1994 | Operating Partner, Stonebridge Partners Small cap Team, since 2018. Previously, CEO, Adcole Corp, from 1989 to 2017. | 11 | None |
James I. Fordwood (74) | Trustee, Audit Committee Chairman | Indefinite; Since April 1994 | CFO and Managing Member of Prima Marketing LLC (network of convenience stores) since 1998; President, Balmacara Production Inc. since 1986 (holding company); Treasurer, Inverness21 LLC (owns and operates office buildings) since 2007; Treasurer, JL Energy Inc. (holding company) since 1985; Treasurer, Thistle, Inc. (seismic data management) since 1984. | 11 | None |
Dr. Bret A. Herscher (63) | Trustee | Indefinite; Since April 1994 | Self-employed Consultant, since 2018, to companies in the medical device sector. Chief Technology Officer, EARGO, Inc., a hearing aid company, from 2012 to 2018. | 11 | None |
Susan Penry-Williams (75) | Trustee | Indefinite; Since February 2016 | Retired; Partner, Kramer Levin Naftalis & Frankel LLP, from 1994 to 2014. | 11 | None |
| Interested Trustee |
Timothy W.N. Guinness* 18 Smith Square London, England SW1P 3HZ (73) | Trustee | Indefinite; Since April 1994 | Chairman/CIO of Guinness Atkinson™ Asset Management since November 2002. Chairman of Guinness Asset Management Ltd., investment adviser in London, since 2003. Director of Guinness Capital Management Ltd. since 2010; Partner, Ekins Guinness LLP (investment research) since 2017; Non-Executive Director of Brompton Bicycle Ltd., since 2000. | 11 | None |
| Name and Age | Position(s) Held with the Trust† | Length of Time Served | Principal Occupation(s) During the Past 5 Years | Number of Portfolios In Fund Complex Overseen by Trustee | Other Directorships Held by Trustee During the Past 5 Years |
| Officers | | | | | |
James Atkinson (63) | President | Since April 2003 | Chief Executive Officer and Director of Guinness Atkinson™ Asset Management since 2002. Director of Guinness Asset Management Ltd. since 2003. Principal of Orbis Marketing, a mutual fund marketing and advertising firm, since 2001. | N/A | N/A |
Patrick Keniston (57) | Chief Compliance Officer | Since May 2013 | Managing Director, Foreside Fund Officer Services, LLC, since 2008. | N/A | N/A |
Rita Dam (54) | Treasurer | Since September 2009 | Co-Chief Executive Officer (2016 - present), and Vice President, Mutual Fund Administration, LLC (2006 -2015). Co-President (2018 – present), Foothill Capital Management, LLC, a registered investment adviser. | N/A | N/A |
Joy Ausili (54) | Secretary and Assistant Treasurer | Since September 2009 | Co-Chief Executive Officer, Mutual Fund Administration, LLC (2016 - present), and Vice President, Mutual Fund Administration, LLC (2006 -2015). Co-President (2018 – present), Foothill Capital Management, LLC, a registered investment advisor. | N/A | N/A |
Lyna Phan (46) | Assistant Treasurer | Since September 2011 | Managing Director (2018 – present), and Vice President, Mutual Fund Administration, LLC. (2008-2017). | N/A | N/A |
Evan Robledo (33) | Assistant Treasurer | Since December 2021 | Vice President (2020 – present), and Assistant Vice President, Mutual Fund Administration, LLC. (2018-2020). | N/A | N/A |
| *“ | Interested person” (as defined in the 1940 Act) of the Funds because of his affiliation with Guinness Atkinson™. |
Privacy Notice
Guinness AtkinsonTM Funds and Guinness Atkinson Asset Management, Inc. may collect non-public information about you from the following sources:
| • | Information we receive about you on applications or other forms; |
| • | Information you give us orally; and |
| • | Information about your transactions with us. |
We do not disclose any non-public personal information about our shareholders or former shareholders without the shareholder’s authorization, except as required by law or in response to inquiries from governmental authorities. We restrict access to your personal and account information to those employees who need to know that information to provide products and services to you. We also may disclose that information to unaffiliated third parties (such as to brokers or custodians) only as permitted by law and only as needed for us to provide agreed services to you. We maintain physical, electronic and procedural safeguards to guard your non-public personal information.
Guinness AtkinsonTM Funds Information
| Board of Trustees | Contact Guinness AtkinsonTM Funds |
| | |
| J. Brooks Reece, Jr. Chairman | P.O. Box 701 |
| James I. Fordwood | Milwaukee, WI 53201-0701 |
| Timothy W.N. Guinness | Shareholder Services: 800-915-6566 |
| Dr. Bret A. Herscher | Literature Request: 800-915-6565 |
| Susan Penry-Williams | Website: www.gafunds.com |
| | Email: mail@gafunds.com |
| Guinness Atkinson TM Funds | | | |
| Funds | Cusip | Ticker | Fund # |
| Alternative Energy Fund | 402031 50 4 | GAAEX | 1298 |
| Asia Focus Fund | 402031 10 8 | IASMX | 1096 |
| China & Hong Kong Fund | 402031 20 7 | ICHKX | 1094 |
| Global Energy Fund | 402031 40 5 | GAGEX | 1098 |
| Global Innovators Fund Investor Class | 402031 30 6 | IWIRX | 1095 |
| Global Innovators Fund Institutional Class | 402031 88 4 | GINNX | 5323 |
| Renminbi Yuan & Bond Fund | 402031 70 2 | GARBX | 1099 |
Distributed by Foreside Fund Services, LLC, Three Canal Plaza, Suite 100, Portland, ME 04101
This report is intended for shareholders of the Guinness AtkinsonTM Funds and may not be used as literature unless preceded or accompanied by a current prospectus.

Item 2. Code of Ethics.
The registrant has adopted a code of ethics that applies to the registrant's principal executive officer and principal financial officer. The registrant has not made any amendments to its code of ethics during the period covered by this report. The registrant has not granted any waivers from any provisions of the code of ethics during the period covered by this report.
The registrant undertakes to provide to any person without charge, upon request, a copy of its code of ethics by mail when they call the registrant at 1-800-915-6565.
Item 3. Audit Committee Financial Expert.
The registrant’s board of trustees has determined that there is at least one audit committee financial expert serving on its audit committee. James I. Fordwood is the “audit committee financial expert” and is considered to be “independent” as each term is defined in Item 3 of Form N-CSR.
Item 4. Principal Accountant Fees and Services.
The registrant has engaged its principal accountant to perform audit services, audit-related services, tax services and other services during the past two fiscal years. "Audit services" refer to performing an audit of the registrant's annual financial statements or services that are normally provided by the accountant in connection with statutory and regulatory filings or engagements for those fiscal years. "Audit-related services" refer to the assurance and related services by the principal accountant that are reasonably related to the performance of the audit. "Tax services" refer to professional services rendered by the principal accountant for tax compliance, tax advice, and tax planning. There were no "other services" provided by the principal accountant. The following table details the aggregate fees billed or expected to be billed for each of the last two fiscal years for audit fees, audit-related fees, tax fees and other fees by the principal accountant.
| | FYE 12/31/2021 | FYE 12/31/2020 |
| Audit Fees | $116,300 | $131,800 |
| Audit-Related Fees | N/A | N/A |
| Tax Fees | $15,000 | $24,000 |
| All Other Fees | N/A | N/A |
The audit committee has adopted pre-approval policies and procedures that require the audit committee to pre-approve all audit and non-audit services of the registrant, including services provided to any entity affiliated with the registrant.
The percentage of fees billed by Tait, Weller, & Baker LLP applicable to non-audit services pursuant to waiver of pre-approval requirement were as follows:
| | FYE 12/31/2021 | FYE 12/31/2020 |
| Audit-Related Fees | 0% | 0% |
| Tax Fees | 0% | 0% |
| All Other Fees | 0% | 0% |
All of the principal accountant's hours spent on auditing the registrant's financial statements were attributed to work performed by full-time permanent employees of the principal accountant.
The following table indicates the non-audit fees billed or expected to be billed by the registrant's accountant for services to the registrant and to the registrant's investment adviser (and any other controlling entity, etc.—not sub-adviser) for the last two years. The audit committee of the Board of Trustees has considered whether the provision of non-audit services that were rendered to the registrant's investment adviser is compatible with maintaining the principal accountant's independence and has concluded that the provision of such non-audit services by the accountant has not compromised the accountant's independence.
| Non-Audit Related Fees | FYE 12/31/2021 | FYE 12/31/2020 |
| Registrant | N/A | N/A |
| Registrant’s Investment Advisor | N/A | N/A |
Item 5. Audit Committee of Listed Registrants.
Not applicable to registrants who are not listed issuers (as defined in Rule 10A-3 under the Securities Exchange Act of 1934).
Item 6. Schedule of Investments.
(a) Schedule of Investments is included as part of the report to shareholders filed under Item 1 of this Form.
(b) Not Applicable.
Item 7. Disclosure of Proxy Voting Policies and Procedures for Closed-End Management Investment Companies.
Not Applicable.
Item 8. Portfolio Managers of Closed-End Management Investment Companies.
Not Applicable.
Item 9. Purchases of Equity Securities by Closed-End Management Investment Company and Affiliated Purchasers.
Not Applicable.
Item 10. Submission of Matters to a Vote of Security Holders.
The registrant has not made any material changes to the procedures by which shareholders may recommend nominees to the registrant’s Board of Trustees.
Item 11. Controls and Procedures.
| (a) | The registrant’s principal executive officer and principal financial officer have evaluated the registrant’s disclosure controls and procedures within 90 days of this filing and have concluded based on such evaluation that the registrant’s disclosure controls and procedures were effective, as of that date, in ensuring that information required to be disclosed by the registrant in this Form N-CSR was recorded, processed, summarized, and reported within the time periods specified in the Securities and Exchange Commission’s rules and forms. |
| (b) | There were no changes in the registrant’s internal control over financial reporting (as defined in Rule 30a-3(d) under the Investment Company Act of 1940) that occurred during the registrant’s last fiscal quarter that have materially affected, or are reasonably likely to materially affect, the registrant’s internal control over financial reporting. |
Item 12. Disclosure of Securities Lending Activities for Closed-End Management Investment Companies.
Not applicable to open-end investment companies.
Item 13. Exhibits.
(b)
(2) Certifications pursuant to Section 302 of the Sarbanes-Oxley Act of 2002. Filed herewith.
(3) Any written solicitation to purchase securities under Rule 23c-1 under the Act sent or given during the period covered by the report by or on behalf of the registrant to 10 or more persons. Not applicable to open-end investment companies.
SIGNATURES
Pursuant to the requirements of the Securities Exchange Act of 1934 and the Investment Company Act of 1940, the registrant has duly caused this report to be signed on its behalf by the undersigned, thereunto duly authorized.
(Registrant) Guinness Atkinson Funds
| By | /s/ James J. Atkinson | |
| Name: | James J. Atkinson | |
| Title: | President | |
| Date: | 3/11/2022 | |
Pursuant to the requirements of the Securities Exchange Act of 1934 and the Investment Company Act of 1940, this report has been signed by the following persons on behalf of the registrant and in the capacities and on the dates indicated.
| By | /s/ James J. Atkinson | |
| Name: | James J. Atkinson | |
| Title: | President | |
| Date: | 3/11/2022 | |
| By | /s/ Rita Dam | |
| Name: | Rita Dam | |
| Title: | Treasurer | |
| Date: | 3/11/2022 | |