UNITED STATES
SECURITIES AND EXCHANGE COMMISSION
Washington, D.C. 20549
FORM N-CSR
CERTIFIED SHAREHOLDER REPORT OF REGISTERED MANAGEMENT
INVESTMENT COMPANIES
Investment Company Act file number 811-08360
Guinness Atkinson Funds
(Exact name of registrant as specified in charter)
251 South Lake Avenue, Suite 800,
Pasadena, California 91101
(Address of principal executive offices) (Zip code)
(Name and address of agent for service)
James J. Atkinson, Jr.
251 South Lake Avenue, Suite 800,
Pasadena, CA 91101
Registrant’s telephone number, including area code: (866-307-5990)
Date of fiscal year end: December 31
Date of reporting period: December 31, 2021
Item 1. Reports to Stockholders.
The registrant’s annual report transmitted to shareholders pursuant to Rule 30e-1 under the Investment Company Act of 1940, as amended (the “Investment Company Act”), is as follows:

SmartETFs
Annual Report
December 31, 2021
TABLE OF CONTENTS
| Letter to Shareholders (Unaudited) | 3 |
| Management’s Discussion of Fund Performance (Unaudited) and Schedules of Investments | |
| Smart Transportation & Technology ETF (MOTO) | 7 |
| Advertising & Marketing Technology ETF (MRAD) | 17 |
| Sustainable Energy II ETF (SOLR) | 26 |
| Asia Pacific Dividend Builder ETF (ADIV) | 38 |
| Dividend Builder ETF (DVIS) | 46 |
| Statements of Assets and Liabilities | 57 |
| Statements of Operations | 59 |
| Statements of Changes in Net Assets | 61 |
| Financial Highlights | 64 |
| Notes to Financial Statements | 69 |
| Report of Independent Registered Public Accounting Firm | 79 |
| Other Information (Unaudited) | 81 |
Dear SmartETF Shareholders,
Welcome to the many new members of the SmartETFs family and thank you for joining us. The last year saw the number of SmartETFs grow from three to five. And we’re just getting started. As we mentioned last year, we’re working to enlarge the SmartETFs offerings and have plans for 2022. Stay tuned.
We’re delighted to report that all of the SmartETFs produced positive returns for 2021. In fact, you may notice that all of the SmartETFs have positive returns for all of the standard time periods ending December 31, 2021. That’s not to say that there were not any bumps along the way; the last few weeks of 2021 brought a bit of turbulence.
The top performing SmartETF was DIVS, the SmartETFs Dividend Builder ETF, which produced a total return of 23.60% for the year. Not bad for a boring dividend fund. Along with the Asia Pacific Dividend Builder ETF, the Dividend Builder was one of two Funds converted from traditional, open-end mutual funds in March of 2021.
The SmartETFs Asia Pacific Dividend Builder ETF (ADIV) provided a total return of 11.27% for the year.
MOTO, the SmartETFs Smart Transportation & Technology ETF, delivered a total return of 17.12% over the calendar year.
SOLR, the SmartETFs Sustainable Energy II ETF, also had a good year, producing a total return of 12.07%.
MRAD, the SmartETFs Advertising and Marketing Technology ETF, had a decent year, turning in a total return of 6.69%. This despite the fact that the MarTech stocks were buffeted as the year closed.
You’ll see in the performance table that two of the SmartETFs have Morningstar ratings. (The other three SmartETFs are too new to be rated.) The Dividend Builder sports a Five-Star overall rating while the Asia Pacific Dividend Builder has earned a Four-Star overall rating.
The concept that underpins the SmartETFs family is a series of mega themes. Our world view is one of change and opportunity. We believe that Asia, innovation, demographics, and increasing social responsibility are four mega themes that will lead to profound changes over the balance of this century.
Our objective with SmartETFs is not just to provide investors with excellent investment opportunities but to also inform and engage. If you haven’t already done so we encourage you to sign up to follow us on Twitter (“SmartETFs”) and/or sign up for our email service. You can do both of these from the SmartETFs website at www.SmartETFs.com. Or, if you prefer, simply visit the website occasionally to see the latest news and views from our portfolio managers.
We appreciate the confidence you’ve placed in us and look forward to serving you.
Regards,
President
SmartETFs
The total expense ratio for MOTO ETF is 0.68% net and 1.51% gross. For SOLR ETF, the expense ratio is 0.79% net and 1.91% gross. For MRAD ETF, the expense ratio is 0.68% net and 0.71% gross. All returns are for the periods ending December 31, 2021. For ADIV ETF, the expense ratio is 0.78% net and 4.97% gross. All returns are for the periods ending December 31, 2021. For DIVS ETF, the expense ratio is 0.65% net and 1.42% gross. All returns are for the periods ending December 31, 2021. The Adviser has contractually agreed to reduce its fees and/or pay ETF expenses in order to limit the Fund's total annual operating expenses through June 30, 2022 for MOTO and through June 30, 2025 for SOLR, MRAD, ADIV, and DIVS. Performance would have been lower without fee waivers in effect.
[SmartETFs Annual Report Letter Dec 2021]
Fund
Symbol
Inception date | 1-year | 3-year | 5-year | 10-year | From
Inception | Expense
Ratio |
Advertising & Marketing Technology ETF
MRAD
December 31, 2020 | 6.69% | | | | | 0.68% net;
0.71% gross |
Asia Pacific Dividend Builder
ADIV
March 31, 2006 | 11.27% | 15.10% | 11.74% | 9.08% | | 0.78% net;
4.97% gross |
Dividend Builder ETF DIVS
March 30, 2012 | 23.60% | 20.70% | 15.38% | | 11.96% | 0.65% net;
1.42% gross |
Smart Transportation & Technology ETF
MOTO
November 14, 2019 | 17.12% | | | | 37.32% | 0.68% net;
1.51% gross |
Sustainable Energy II ETF
SOLR
November 11, 2020 | 12.11% | | | | 28.22% | 0.79% net;
1.91% gross |
Periods of greater than one year are average annualized returns; one year and shorter period returns are actual returns. All returns are for the periods ending December 31, 2021.
The Asia Pacific Dividend Builder ETF and the Dividend Builder ETF converted from traditional open-end mutual funds to exchange traded funds on March 29, 2021. Performance data shown for these two ETFs includes their performance history as traditional open-end mutual funds.
Performance data quoted represents past performance and does not guarantee future results. The investment return and principal value of an investment will fluctuate so that an investor’s shares, when redeemed, may be worth more or less than the original cost. Current performance of the Fund may be lower or higher than the performance quoted. Performance data current to the most recent month end may be obtained by visiting www.SmartETFs.com.
Shares of ETFs are bought and sold at market price (not NAV) and are not individually redeemed from the Fund. Brokerage commissions will reduce returns.
Investing involves risk including the loss of principal.
Shares of the SmartETFs Funds are distributed by Foreside Fund Services, LLC.
Morningstar Ratings Through December 31, 2021
| Fund | Category | Overall | 3-Year | 5-Year | 10-Year |
Asia Pacific Dividend Builder
ADIV | Pacific/Asia ex-Japan Stock | 4 «««« (139 funds) | 4 ««««
(139 funds) | 4 «««« (105 funds) | 4 «««« (70 funds) |
Dividend Builder
DIVS | World Large-Stock Blend | 5 «««««
(283 funds) | 4 «««« (283 funds) | 5 «««««
(236 funds) | |
Morningstar Ratings Disclosure
For each fund with at least a three-year history, Morningstar calculates a Morningstar Rating™ based on a Morningstar Risk-Adjusted Return measure that accounts for variation in a fund’s monthly performance (including the effects of sales charges, loads, and redemption fees), placing more emphasis on downward variations and rewarding consistent performance. The top 10% of funds in each category receive 5 stars, the next 22.5% receive 4 stars, the next 35% receive 3 stars, the next 22.5% receive 2 stars and the bottom 10% receive 1 star. (Each share class is counted as a fraction of one fund within this scale and rated separately, which may cause slight variations in distribution percentages.)
© 2022 Morningstar, Inc. All Rights Reserved. The information contained herein (1) is proprietary to Morningstar (2) may not be copied or distributed and (3) is not warranted to be accurate, complete or timely. Neither Morningstar nor its content providers are responsible for any damages or losses arising from any use of this information.
SmartETFs Smart Transportation & Technology ETF
ANNUAL REPORT FOR THE PERIOD ENDED
DECEMBER 31, 2021
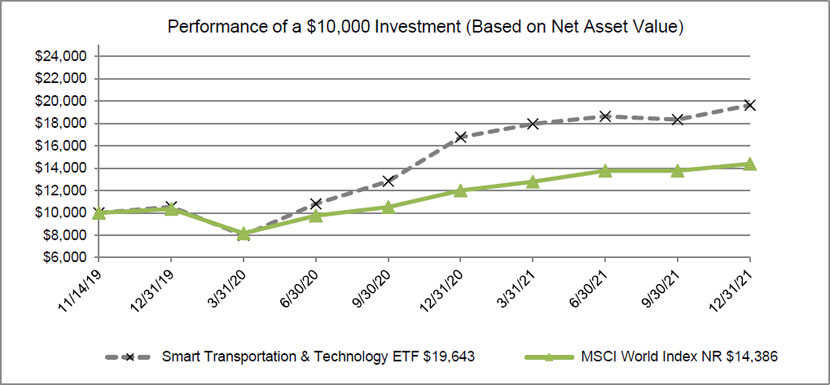
1. Performance
Average annualized Total returns | 1 Year | Since Inception 11/14/2019 |
| Smart Transportation & Technology ETF (Net Asset Value) | 17.12% | 37.32% |
| Smart Transportation & Technology ETF (Market Price) | 17.24% | 37.07% |
| | | |
| Benchmark Indices: | | |
| MSCI World Index (Net Return) | 21.82% | 46.10% |
The Fund’s total expense ratio is 1.51% and the net expense ratio is 0.68%. The Adviser has contractually agreed to reduce its fees and/or pay ETF expenses in order to limit the Fund's total annual operating expenses to 0.68% through June 30, 2022. For the Fund’s current one-year expense ratios, please refer to the Financial Highlights section of this report.
Performance data quoted represents past performance and does not guarantee future results. The investment return and principal value of an investment in the Fund will fluctuate so that an investor's shares, when redeemed, may be worth more or less than their original cost. Current performance of the Fund may be lower or higher than the performance quoted. Performance data current to the most recent month-end may be obtained by visiting www.smartetfs.com, or calling (866) 307-5990.
Total returns for certain periods reflect a fee waiver in effect and in the absence of this waiver, the total returns would be lower. Returns reflect the reinvestment of distributions made by the Fund, if any. The graph and the performance table above do not reflect the deduction of taxes that a shareholder would pay on Fund distribution or the redemption of Fund shares.
Shares of ETFs are bought and sold at market price (not NAV) and are not individually redeemed from the ETF. Brokerage commissions will reduce returns. SmartETFs NAVs are calculated using prices as of 4:00 PM Eastern Time. The closing price is the Mid-Point between the Bid and Ask price as of the close of exchange. Closing price returns do not represent the returns you would receive if you traded shares at other times.
2021 was positive for global equities, although Smart Transportation equities underperformed. The Smart Transportation ETF (MOTO ETF) rose by 17.12%, underperforming the MSCI World Net Total Return Index (+21.82%) by 4.70%.
In terms of individual stock performance, the three best performers were:
| ● | NVIDIA shares rallied consistently through the year as a result of strong AV (autonomous vehicle) and EV (electric vehicle) related product demand complimented by near-term continued tightness in the semiconductor market. |
| ● | ON Semiconductor shares reacted positively to a hopeful capital markets day that was held early in the third quarter that coincided with an improving trend of quarterly results. The company rebranded itself to ‘onsemi’ and plans to prune both its revenue base and manufacturing footprint to invest in high-value, high-growth applications served by its power and sensing-biased semiconductor portfolio. |
| ● | Alphabet shares were a consistently strong performer over the year. Its autonomous driving subsidiary, Waymo, continues to grow and expand and commenced a fully autonomous ride-hailing service in Phoenix Arizona called Waymo One. |
The three weakest individual performers were:
| ● | Tianneng Power is a Hong Kong listed manufacturer of predominantly lead acid batteries for the Chinese market. The shares receded early in 2021 due to profit taking after standout performance in 2020 and then they suffered later in the year as raw material cost inflation impacted manufacturing margins. |
| ● | LG Chem shares were weaker following a $1.9bn product recall with GM regarding battery faults on the Chevrolet Bolt. |
| ● | Hanon Systems is a Korean-listed supplier of innovative thermal and energy management solutions for car OEMs. The shares were weaker as a result of semiconductor supply shortages and cost inflation during the year despite the majority owner, Hahn & Co, running a sale process for the company. |
Individual Stock Performance over the period
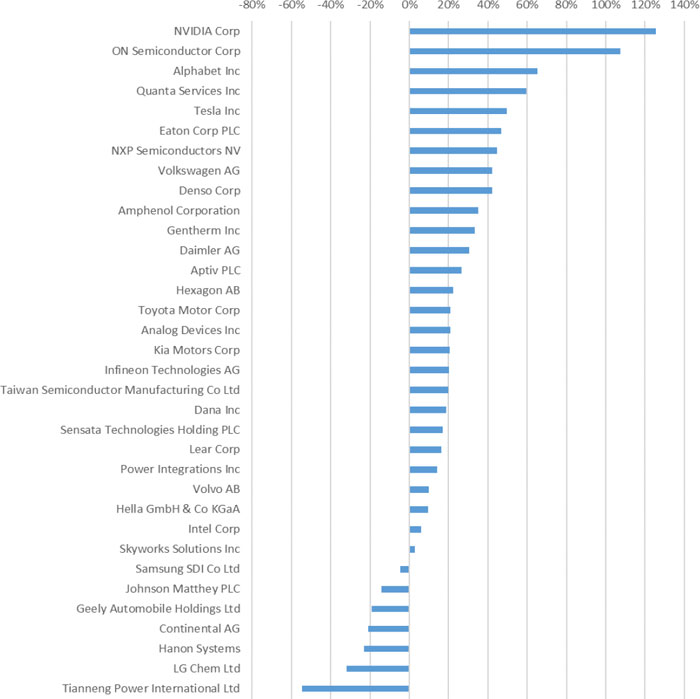
Source: Bloomberg, Guinness Atkinson
2. Activity
In the second half of the year, Continental spun-off of its powertrain division into a separate company, Vitesco, while Daimler AG spun off its trucks business into a separate listed company, Daimler Trucks. Both stocks are still held in the MOTO ETF.
Offsetting this in the second half of the year, we sold our position in Autohome, the largest online automotive platform for auto advertising, sales, financing and content in China. The company faces increasing competition and margin compression, compounded by unexpected management changes.
3. Portfolio Position
The sector and geographic weightings of the MOTO ETF at December 31st, 2021 were as follows:
| Sector breakdown | Dec. 31, 2021 |
| EV Manufacturers | |
| EV Transition | 15.8% |
| EV Dominated | 5.3% |
| Components | |
| Autonomous | 16.3% |
| Car Components | 21.9% |
| Batteries | 8.1% |
| Semiconductors | |
| Power | 7.1% |
| General | 8.6% |
| Connectivity | 8.5% |
| Services | |
| TAAS | 3.4% |
| Other | 3.2% |
| Cash | 1.7% |
| Geographic breakdown | Dec. 31, 2021 |
| United States | 49.0% |
| Germany | 12.9% |
| South Korea | 10.1% |
| Japan | 6.1% |
| Sweden | 5.6% |
| China | 3.2% |
| Netherlands | 3.2% |
| Taiwan | 3.0% |
| Ireland | 2.9% |
| UK | 2.1% |
| Cash | 1.7% |
4. Outlook
2021 was another year of growth and improving outlook for companies associated with the entire value chain of electrification of transportation. We consider here the recent activity and subsequently the outlook for both the lithium battery markets and the electric vehicle markets.
The catalyst for greater lithium-ion battery use has been sharp falls in the cost of manufacturing. According to BloombergNEF (BNEF), battery pack costs are down 89% over the period 2010 to 2021 (an implied ‘learning rate’ of around 18%) with the average cost being $132/kWh in 2021 (split $101/kWh for the cell itself and an additional $31/kWh for the pack).
The $132/kWh survey outcome for 2021 is an average calculated across a wide range of uses and regions. China was typically the lowest cost manufacturer with some individual passenger EV battery packs at below $100/kWh (and e-bus and commercial vehicle packs at $101/kWh on average) while BNEF calculated that Tesla’s estimated average pack price in 2021 was around $112/kWh. The survey also includes stationary storage solutions which saw a fall in cost of around 16% in 2021, to $152/kWh, as manufacturers turned to simple and cheaper battery chemistries, such as lithium-ion phosphate, to offset raw material inflation.
Raw materials make up around 50% of the cost of a lithium-ion battery pack, with cathode materials alone representing around 20% of the total cost. The key catalyst material is lithium carbonate, whose price in China rose by 270% in 2021. While battery manufacturers have long-term contracts and approaches in place to mitigate such inflation, they ultimately have little choice but to pass on the costs to consumers. In Q4 2021, BYD increased its battery prices by 20%.
Raw material cost inflation will continue to have an impact in 2022 and we see the likelihood that the cost of manufacturing may exceed levels seen in 2020. Rapidly increasing manufacturing capacity, (bringing further efficiencies of scale) together with reduced supply chain disruptions should help to alleviate the cost pressures in subsequent years and allow the average cost of producing a lithium-ion battery for an EV is likely to fall towards $100/kWh in the mid-2020s, maybe a year or so later than we previously expected.
While the $100/kWh cost level is a key target, we note that in 2021 the battery and EV industry started focusing on manufacturing costs well below $100/kWh. EV manufacturers started to vertically integrate with battery manufacturers and form battery manufacturing JVs such as BlueOvalSK (Ford/SK) and Ultium Cells (GM/LG Energy Solutions) in efforts to improve manufacturing efficiencies with $60/kWh targets discussed for the end of the decade. The US Department of Energy also set $60/kWh as its ‘stretch’ goal, a level would be achieved by 2030 if the current 18% learning rate is maintained.
Strong momentum in electric vehicle sales growth continued through 2021. On our estimates, nearly 6.1m new EVs were sold in the twelve months to November 2021, a growth of around 116% versus sales in the same period twelve months earlier (affected by COVID) and 178% higher than the same period in 2019. This growth compares very favourably to overall global light vehicle sales growth of 6.8%% and -9.4% for the same periods in 2021 and 2020 respectively. Accordingly, the market share for EVs has increased to around 7.6% for 2021 versus 3.4% and 2.4% in 2020 and 2019 respectively.
Regionally, China has regained its position as the largest EV market with total sales of new EVs of 2.9m in the twelve months to November 2021, up 150% on 2020. Europe, which overtook China to be the largest EV market at the end of 2020, saw total new EV sales of 2.27m units, up 94%. The US still lags Europe and China with new EV sales of 0.6m, up 95% on the same period twelve months earlier.
Lower EV prices, greater brand choice and growing consumer appetite continue to be the key drivers of improved EV sales. The strength in Europe has been helped by new generous EV incentives offered by Germany and France (amongst other countries) for passenger vehicles and increasing compliance with stricter emissions standards that came into effect at the start of the 2020. While passenger EVs are benefitting, EU data indicates that trucks are still witness the electrification trend; only 6 electric trucks were registered in Europe in the 12 months to the end of July 2020, versus 167,000 new diesel/petrol powered trucks. In China, after stagnating in 2019 as a result of the removal of EV subsidies, EV sales activity rebounded as a result of a broader range of EV models, including a number at lower price points.
Government support for EVs will reduce in 2022. Europe will continue rolling back its EV “super-credits”, and China plans to reduce EV subsidies further. Despite this, we expect global EV sales to exceed 9 million in 2022, representing around 10% of total passenger vehicle sales, taking the global EV stock from 16m vehicles to 25m vehicles.
US EV sales are expected to lag again. As part of the currently stalled Build Back Better plan, the Biden administration is attempting to increase the tax credit for EVs to US$12,500, but this will be applicable only to a small number of vehicles as the limits for individual manufacturers have not been lifted. In December, the Environmental protection Agency (EPA) announced tougher emissions standards for US passenger cars and light trucks, requiring the 2026 model year vehicles to deliver average fuel economy of around 55 miles per gallon, around 23% greater than existing legislation.
On a global basis, we expect EVs will represent around 20% of new vehicle sales in 2025 (concurrent with the cost of EV lithium-ion batteries falling to around $100/kWh), 50% of new vehicle sales in 2030 and nearly all new vehicle sales by 2040. At that point, it implies an overall EV population of around 1bn vehicles, over sixty-five times greater than current global population of around 15m EVs. With EVs using roughly one third of the energy of a typical internal combustion engine vehicle, this transition alone will have substantial impact on global energy efficiency and global decarbonisation.
Despite these rapid EV growth assumptions, we calculate that oil demand from passenger vehicles will not peak until around 2024/25 and that, even by 2030, passenger vehicle oil demand will be similar to 2021 levels. With transportation generating just over 7bn tonnes of carbon emissions in 2020, accelerating the transition and reducing associated oil demand is critical to achieving a net zero 2050 scenario.
The MOTO ETF is positioned to benefit from these long-term trends, providing exposure to a basket of smart transportation companies with cash returns and growth that are on average greater than the MSCI World Index but that trade at a 2022 P/E multiple discount of around 14%.
Will Riley & Jonathan Waghorn
January 2022
P/E Ratio is the price-to-earnings ratio and is a ratio for valuing a company that measures its current share price relative to its earnings per share.
International investments may involve risk of capital loss from unfavorable fluctuation in currency values, from differences in generally accepted accounting principles or from social, economic or political instability in other nations. Emerging markets involve heightened risks related to the same factors as well as increased volatility and lower trading volume.
The companies in which the Fund invests may be subject to rapid changes in technology, intense competition, rapid obsolescence of products and services, loss of intellectual property protections, evolving industry standards and frequent new product productions and changes in business cycles and government regulations.
These risks could adversely affect the value of companies in which the Fund invests. Limitations on applications for autonomous or electric vehicles could adversely affect the value of companies in which the Fund invests.
MSCI World Index A free float-adjusted market capitalization weighted index that is designed to measure the equity market performance of developed markets. One cannot invest directly in an index.
Please refer to the Schedule of Investments for details on Fund holdings. Current and future portfolio holdings are subject to risk.
The information provided herein represents the opinion of Guinness Atkinson Asset Management, Inc. for the period stated and is not intended to be a forecast of future events, a guarantee of future results, or investment advice. Opinions, Fund holdings and sector allocations are subject to change at any time, and are not recommendations to buy or sell any security.
Smart Transportation & Technology ETF
FUND PERFORMANCE AND SUMMARY
As of December 31, 2021 (Unaudited)
Average Annual Returns
December 31, 2021 | One Year | Since Inception
(11/14/2019) |
| Smart Transportation & Technology ETF - NAV | | 17.12% | 37.32% |
| Smart Transportation & Technology ETF - Market | | 17.24% | 37.07% |
| MSCI World Index NR | | 21.82% | 46.10% |
The performance data quoted represents past performance and past performance is not a guarantee of future results. The investment return and principal value of an investment will fluctuate so that an investor's shares, when redeemed, may be worth more or less than their original cost. Current performance of theFund may be lower or higher than the performance quoted. Performance data current to the most recent month end may be obtained by visiting www.smartetfs.com.
Total returns reflect the reinvestment of distributions made by the Fund, if any. The deduction of taxes that a shareholder would pay on Fund distribution or the redemption of Fund shares is not reflected in the total returns.
The Fund's shares are listed on an exchange. The price of the Fund's shares is based on market price, and because the exchange-traded fund shares trade at market prices rather and net asset value, shares may trade at a price greater than net asset value (premium) or less than net asset value (discount).
The MSCI World Index (Net Return) is a free float-adjusted market capitalization weighted index that is designed to measure the equity market performance of developed markets. Net Return reflects deduction for withholding tax but reflects no duduction for fees and expenses. Net Return is net of local withholding taxes that any investor would pay.
SmartETFs Smart Transportation & Technology ETF
Schedule of Investments
at December 31, 2021
| Shares | | | Common Stocks: 96.0% | | Value ($) | |
| | | | | Auto/Trucks Parts & Equipment: 5.9% | | | | |
| | 6,776 | | | Gentherm Inc.* | | $ | 588,834 | |
| | 5,772 | | | Hella GmbH & Co KGaA | | | 391,399 | |
| | | | | | | | 980,233 | |
| | | | | Commerical Services: 3.2% | | | | |
| | 4,662 | | | Quanta Services Inc. | | | 534,545 | |
| | | | | | | | | |
| | | | | Rubber-Tires: 1.6% | | | | |
| | 2,506 | | | Continental AG | | | 265,475 | |
| | | | | | | | | |
| | | | | Smart Transportation: 30.9% | | | | |
| | 2,954 | | | Aptiv PLC | | | 487,262 | |
| | 5,250 | | | Daimler AG | | | 403,728 | |
| | 2,373 | | | Daimler Truck AG | | | 87,179 | |
| | 7,000 | | | Denso Corp. | | | 579,547 | |
| | 154,000 | | | Geely Automobile Holdings Ltd. | | | 420,727 | |
| | 12,642 | | | Johnson Matthey PLC | | | 349,909 | |
| | 6,286 | | | KiaCorp | | | 434,629 | |
| | 7,560 | | | Sensata Technologies Holding* | | | 466,376 | |
| | 840 | | | Tesla Inc.* | | | 887,695 | |
| | 112,000 | | | Tianneng Power International | | | 118,515 | |
| | 23,800 | | | Toyota Motor Corp. | | | 435,387 | |
| | 500 | | | Vitesco Technologies Group AG* | | | 24,575 | |
| | 18,592 | | | Volvo AB Class B | | | 430,929 | |
| | | | | | | | 5,126,458 | |
| | | | | | | | | |
| | | | | Technology: 3.0% | | | | |
| | 4,214 | | | Taiwan Semiconductor Manufacturing Co Ltd. - ADR | | | 506,986 | |
| | | | | | | | | |
| | | | | Technology & Transportation: 51.4% | | | | |
| | 196 | | | Alphabet Inc. Class C* | | | 567,144 | |
| | 5,852 | | | Amphenol Corp. Class A | | | 511,816 | |
| | 2,730 | | | Analog Devices Inc. | | | 479,852 | |
| | 18,578 | | | Dana Inc. | | | 423,950 | |
| | 3,220 | | | Eaton Corp. PLC | | | 556,480 | |
| | 32,942 | | | Hanon Systems | | | 372,688 | |
| | 31,850 | | | Hexagon AB Class B | | | 505,824 | |
| | 12,250 | | | Infineon Technologies AG - ADR | | | 568,090 | |
| | 8,092 | | | Intel Corp. | | | 416,738 | |
| | 2,450 | | | Lear Corp. | | | 448,228 | |
| | 742 | | | LG Chem Ltd. | | | 383,842 | |
| | 2,268 | | | NVIDIA Corp. | | | 667,041 | |
| | 2,310 | | | NXP Semiconductors NV | | | 526,172 | |
| | 10,080 | | | ON Semiconductor Corp.* | | | 684,634 | |
| | 5,320 | | | Power Integrations Inc. | | | 494,175 | |
| | 896 | | | Samsung SDI Co., Ltd. | | | 493,654 | |
| | 2,772 | | | Skyworks Solutions Inc. | | | 430,048 | |
| | | | | | | | 8,530,376 | |
| | | | | | | | | |
| | | | | Total Common Stocks (Cost $12,757,457) | | | 15,944,073 | |
The accompanying notes are an integral part of these financial statements.
SmartETFs Smart Transportation & Technology ETF
Schedule of Investments
at December 31, 2021
| Shares | | | | | Value ($) | |
| | | | | Preferred Stocks | | | | |
| | | | | Smart Transportation: 2.5% | | | | |
| | 2,030 | | | Volkswagen AG | | $ | 409,914 | |
| | | | | Total Preferred Stocks (Cost $392,904) | | | 409,914 | |
| | | | | | | | | |
| | | | | Total Investments (Cost $13,150,361): 98.5% | | | 16,353,987 | |
| | | | | Other Assets in Excess of Liabilities - 1.5% | | | 254,420 | |
| | | | | Total Net Assets - 100.0% | | $ | 16,608,407 | |
| * | Non-income producing security. |
ADR - American Depository Receipt
PLC - Public Limited Company
The accompanying notes are an integral part of these financial statements.
SmartETFs Smart Transportation & Technology ETF
Schedule of Investments
at December 31, 2021
Country Breakdown | Percent of Total
Net Assets |
| Common Stocks | |
| United States | 49.1% |
| Germany | 10.5% |
| South Korea | 10.0% |
| Japan | 6.1% |
| Sweden | 5.6% |
| Netherlands | 3.2% |
| Taiwan | 3.0% |
| Ireland | 2.9% |
| Hong Kong | 2.5% |
| United Kingdom | 2.1% |
| China | 1.0% |
| Total Common Stocks | 96.0% |
| Preferred Stocks | |
| Germany | 2.5% |
| Total Preferred Stocks | 2.5% |
| Total Investments | 98.5% |
| Other Assets in Excess of Liabilities | 1.5% |
| Total Net Assets | 100.0% |
The accompanying notes are an integral part of these financial statements.
SMARTETFS ADVERTISING & MARKETING TECHNOLOGY ETF
ANNUAL REPORT FOR THE PERIOD ENDED
DECEMBER 31, 2021
Performance
| Average annualized Total returns | 1 year | SINCE
INCEPTION
12/31/2020 |
| Advertising & Marketing Tech ETF (Net Asset Value) | 6.69% | 6.69% |
| Advertising & Marketing Tech ETF (Market Price) | 6.38% | 6.38% |
| Benchmark Index: |
| MSCI World Index (Net Return) | 21.82% | 21.82% |
The Fund’s total expense ratio is 0.71% and the net expense ratio is 0.68%. The Adviser has contractually agreed to reduce its fees and/or pay ETF expenses in order to limit the Fund’s total annual operating expense to 0.68% through June 30, 2025. For the Fund’s current one-year expense ratios, please refer to the Financial Highlights section of this report.
Performance data quoted represents past performance and does not guarantee future results. The investment return and principal value of an investment in the Fund will fluctuate so that an investor's shares, when redeemed, may be worth more or less than their original cost. Current performance of the Fund may be lower or higher than the performance quoted. Performance data current to the most recent month-end may be obtained by visiting www.SmartETFs.com, or calling (866) 307-5990.
Total returns for certain periods reflect a fee waiver in effect and in the absence of this waiver, the total returns would be lower. Returns reflect the reinvestment of distributions made by the Fund, if any. The graph and the performance table above do not reflect the deduction of taxes that a shareholder would pay on Fund distribution or the redemption of Fund shares.
Shares of ETFs are bought and sold at market price (not NAV) and are not individually redeemed from the ETF. Brokerage commissions will reduce returns. SmartETFs NAVs are calculated using prices as of 4:00 PM Eastern Time. The closing price is the Mid-Point between the Bid and Ask price as of the close of exchange. Closing price returns do not represent the returns you would receive if you traded shares at other times
Review
In 2021, the SmartETFs Advertising & Marketing Technology ETF produced a total return of 6.69% (NAV, in USD), versus the MSCI World Index (net return) of 21.82% (in USD). The Fund therefore underperformed by 15.1%.
At quarter end, the Fund’s assets under management was $2.69mn.
In the first quarter of 2021, the Fund returned 3.60% (in USD) vs the MSCI World Index return of 4.92% (underperformance of 1.32%).
Global equities advanced in the first quarter in 2021, supported by (1) the roll-out of Covid-19 vaccines, (2) news of further US fiscal stimulus, and (3) a pledge by the Federal Reserve System’s (the Fed) Chairman, Jerome Powell, to keep interest rates lower-for-longer to help support the economic recovery. One year on from when equity markets bottomed, the MSCI World Index has rallied 79% (in USD) and is 18% above its pre-Covid highs.
Over Q1, the MSCI World Index rose 5% (in USD) and all regions registered gains, though markets were choppy and repeatedly tested as optimism drove bond yields higher. Despite the Fed’s reassurances that interest rates will remain low, the sharp rise in yields sparked sell-offs in global equity markets due to fears that rates may not remain supportively lower-for-longer if there is a material spike in inflation. This particularly dragged on the outlook for growth stocks which are expected to see earnings growth further out into the future and so are more vulnerable to higher discount rates. In contrast, value stocks performed relatively better as the “stay-at-home” trade gave way to the “re-opening” trade.
Equity markets’ advance was fueled by value stocks and cyclical sectors, i.e. those which are most sensitive to the economic cycle. Energy, Financials, and Industrials performed best over the quarter, and this dragged on the Fund’s performance.
In the second quarter of 2021, the Fund returned 10.28% (in USD) vs the MSCI World Index return of 7.74% (outperformance of 2.54%).
Global equity markets rallied strongly in the second quarter, building on first quarter gains, and closing out one of the best first half starts in history. Over Q2, the MSCI World Index rose 7.74% (in USD) and all regions registered gains. The US market delivered the best return, thanks to the rebound of growth stocks, strong first-quarter earnings growth (47% year-on-year), and the prospect of more fiscal stimulus as Joe Biden reached a bipartisan deal to boost infrastructure spending by $600 billion. Q2 marked the S&P 500 Index’s fifth consecutive quarter of gains, and best first-half performance since 1998. Overall, the economic picture remained rosy too. The US economy accelerated in Q2 2021, recording an annualized GDP increase of 6.4%.
Growth equities led in the quarter, supported by strong earnings releases from mega-cap technology companies, reversing some of the year-to-date underperformance versus value. Large cap companies generally outperformed their small-cap counterparts during the quarter, also breaking from recent trends. IT and Communication Services were the best performing sectors in Q2 and this benefitted the Fund’s performance.
Nonetheless the largest positive contributor to the Fund was news released by Google announcing that it is extending its deadline to remove third-party cookies from Chrome, from its original date of January 2022 until late 2023. Google also said it will conclude its initial trial of Federated Learning of Cohorts or FLoC, its most well-known and criticized Privacy Sandbox ad method, on July 13th. Share prices of a number of demand-side and sell-side advertising platform companies increased for 2 reasons: (1) significantly more time to plan for the removal of cookies and, (2) increased likelihood that cookies could not be removed at all.
In the third quarter of 2021, the Fund returned -3.28% (in USD) vs the MSCI World Index return of -0.01% (underperformance of 3.27%).
After a strong start to the quarter in July and August (+4.32% in USD), the MSCI World Index fell 4.15% in September as several risks surfaced, and volatility spiked towards the end of the quarter. This was due to numerous factors including increasing Delta-variant Covid cases, ongoing debt ceiling negotiations, fiscal and monetary policy uncertainty, global supply chain bottlenecks, slowing economic and earnings growth projections, ongoing inflation fears, and regulatory uncertainty in China.
The MSCI World Index ended flat for the quarter, whilst the Asia-Pac ex Japan and Emerging Market markets were markedly the worst performing after negative news from China weighed heavily on performance. Greater regulation on the education and tech sectors, and the potential default of Evergrande – a large indebted Chinese property developer – all contributed to spooking investors.
In the US, equities notched up a small positive return in Q3: strong earnings had lifted US stocks in the run up to August, when the Fed seemed to strike a dovish tone, confirming its hesitance to tighten policy too fast. However, growth and inflation concerns late in the quarter meant US equities retraced their steps in September. This was exacerbated late in the month after the Fed stated that tapering of quantitative easing (i.e. a slowdown in the pace of asset purchases) will be announced in November, as expected, and will finish by mid-2022.
The above resulted in a sharp style rotation at the end of the quarter, away from growth stocks and towards value. Value’s outperformance coincided with rate-sensitive stocks leading the gains, as the Financials and Energy sectors fared best over the quarter. This proved a drag on the Fund’s performance.
In the fourth quarter of 2021, the Fund returned -3.25% (in USD) vs the MSCI World Index return of 7.77% (underperformance of 11.01%).
Stocks remained subdued in early October, with increasingly disrupted supply chains, hawkish Fed rhetoric, and higher persistent inflation. However, markets soon regained momentum following the onset of a strong Q3 earnings season, with over 80% of S&P 500 companies beating earnings expectations in the month.
Further evidence of an economic rebound and sustained strong earnings releases continued to drive equities higher during November. However, the World Health Organization labelled the new Omicron strain as a “variant of concern” in the final week of the month, spooking the market to one of the largest sell-offs of the year. Equities were dealt another blow as Fed chair Jerome Powell also offered a more hawkish tone.
Volatility continued into December though fears over Omicron eventually waned as investors were encouraged by data indicating a lower risk of hospitalisation. Investors showed a preference for more defensive stocks as coronavirus infections surged past previous peaks across the US and Europe.
Over the quarter, Central Banks become more hawkish. In late November, Jay Powell told congress that the Fed was retiring the word “transitory”. Powell’s change of tact represented a significant turning point in Central Bank thinking – that inflation now takes top priority and the need to stimulate the economy had “clearly diminished”. The market is now expecting three rate hikes of 0.25% over 2022 and an earlier timeline to the tapering of assets. The European Central Bank (ECB) also scaled back their asset purchasing programming, and the UK went a step further – raising rates to 0.25% from 0.10%.
Whilst growth outperformed by 0.8% during Q4, December saw a strong rotation into value. This followed what was perceived as a hawkish ‘pivot’ by the Fed, reversing much of the strength seen by growth in the prior two months. The sharp style rotation at the end of the quarter proved a drag on the Fund’s performance given it holds high growth adtech and martech names. Higher rates used to discount future growth, reduces the valuation of such fast-growing companies. Further, the Fund is predominantly exposed to the Communications sector, which was the only sector with negative returns in the quarter.
Activity
We made five changes to the portfolio in 2021.
BOUGHT: AcuityAds, Digital Turbine, Perion Network, PubMatic, Tremor International
SOLD: Accenture, Hakuhodo, Medallia, New York Times, SAP
Portfolio Positioning (as of December 31, 2021)


Source: Bloomberg
Outlook
The table below shows the Fund’s 1-year forward earnings and sales growth (analyst consensus estimates) versus the MSCI World Index.1
| As of 12/31/2021 | 1-yr forward earnings growth | 1-yr forward sales growth |
| Fund | 15.0% | 16.0% |
| MSCI World Net TR | 6.7% | 6.1% |
Source: Bloomberg; SmartETFs
The Fund at year end has higher expected sales and earnings growth vs the broad market and this is characteristic of the secular growth that the advertising tech/marketing tech industries are expected to experience.
Whilst there may be volatility in equity markets and for advertising tech companies, there is good reason to be optimistic as we continue into 2022. A build-up of cash for both the average consumer and corporation, and government continuing to push through large stimulus packages should translate into robust near-term gross domestic product (GDP) growth. In particular, we continue to see an acceleration in technological transformations post-COVID that will have a lasting effect on how consumers and businesses operate. As such, we believe the Fund and its holdings are well positioned to benefit from such transformations, which include the move from traditional to digital advertising.
Sagar Thanki
January 2022
International investments may involve risk of capital loss from unfavorable fluctuation in currency values, from differences in generally accepted accounting principles or from social, economic or political instability in other nations. Emerging markets involve heightened risks related to the same factors as well as increased volatility and lower trading volume.
Growth stocks typically are more volatile than value stocks; however, value stocks have a lower expected growth rate in earnings and sales.
The companies in which the Fund invests may be subject to rapid changes in technology, intense competition, rapid obsolescence of products and services, loss of intellectual property protections, evolving industry standards and frequent new product productions and changes in business cycles and government regulations.
These risks could adversely affect the value of companies in which the Fund invests. Limitations on applications for autonomous or electric vehicles could adversely affect the value of companies in which the Fund invests.
The MSCI World Index is a free float-adjusted market capitalization weighted index that is designed to measure the equity market performance of developed markets.
The S&P 500 Index is a stock market index tracking the performance of 500 large companies listed on stock exchanges in the United States.
One cannot invest directly in an index.
| 1 | Earnings growth is not a measure of the Fund’s future performance. |
Please refer to the Schedule of Investments for details on Fund holdings. Current and future portfolio holdings are subject to risk.
The information provided herein represents the opinion of Guinness Atkinson Asset Management, Inc. for the period stated and is not intended to be a forecast of future events, a guarantee of future results, or investment advice. Opinions, Fund holdings, and sector allocations are subject to change at any time and are not recommendations to buy or sell any security.
| SmartETFs Advertising & Marketing Technology ETF |
| FUND PERFORMANCE AND SUMMARY |
| As of December 31, 2021 (Unaudited) |

Average Annual Returns
December 31, 2021 | One Year | Since Inception
(12/31/2020) |
| SmartETFs Advertising & Marketing Technology ETF - NAV | 6.69% | 6.67% |
| SmartETFs Advertising & Marketing Technology ETF - Market | 6.38% | 6.36% |
| MSCI World Index NR | 21.82% | 21.82% |
The performance data quoted represents past performance and past performance is not a guarantee of future results. The investment return and principal value of an investment will fluctuate so that an investor’s shares, when redeemed, may be worth more or less than their original cost. Current performance of the Fund may be lower or higher than the performance quoted. Performance data current to the most recent month end may be obtained by visiting www.smartetfs.com.
Total returns reflect the reinvestment of distributions made by the Fund, if any. The deduction of taxes that a shareholder would pay on Fund distribution or the redemption of Fund shares is not reflected in the total returns.
The Fund's shares are listed on an exchange. The price of the Fund's shares is based on market price, and because the exchange-traded fund shares trade at market prices rather and net asset value, shares may trade at a price greater than net asset value (premium) or less than net asset value (discount).
The MSCI World Index (Net Return) is a free float-adjusted market capitalization weighted index that is designed to measure the equity market performance of developed markets. Net Return reflects deduction for withholding tax but reflects no duduction for fees and expenses. Net Return is net of local withholding taxes that any investor would pay.
SmartETFs Advertising & Marketing Technology ETF
Schedule of Investments
at December 31, 2021
| Shares | | | Common Stocks: 99.5% | | Value ($) | |
| | | | | Advertising: 55.1% | | | | |
| | 2,325 | | | AcuityAds Holdings Inc.* | | $ | 8,742 | |
| | 50 | | | Alphabet Inc.* | | | 144,852 | |
| | 380 | | | Baidu Inc.* | | | 56,540 | |
| | 4,000 | | | CyberAgent Inc.* | | | 66,519 | |
| | 1,400 | | | Digital Turbine Inc.* | | | 85,386 | |
| | 3,500 | | | Future PLC | | | 181,343 | |
| | 2,230 | | | Magnite Inc.* | | | 39,025 | |
| | 310 | | | Meta Platforms Inc. - Class A* | | | 104,269 | |
| | 5,300 | | | Perion Network Ltd. | | | 127,465 | |
| | 2,550 | | | PubMatic Inc.* | | | 86,828 | |
| | 260 | | | Roku Inc.* | | | 59,332 | |
| | 1,440 | | | TechTarget Inc.* | | | 137,750 | |
| | 1,000 | | | Trade Desk Inc/The* | | | 91,640 | |
| | 3,832 | | | Tremor International Ltd.* | | | 58,055 | |
| | 2,000 | | | ValueCommerce Co., Ltd. | | | 77,675 | |
| | 1,280 | | | Yandex NV* | | | 77,440 | |
| | 14,000 | | | Z Holdings Corp. | | | 81,182 | |
| | | | | | | | 1,484,042 | |
| | | | | Enterprise Software/Services: 5.2% | | | | |
| | 370 | | | Atlassian Corp PLC* | | | 141,077 | |
| | | | | | | | | |
| | | | | Internet Content: 2.2% | | | | |
| | 1,000 | | | Tencent Holdings Ltd. | | | 58,590 | |
| | | | | | | | | |
| | | | | Marketing Technology: 37.0% | | | | |
| | 170 | | | Adobe Inc.* | | | 96,400 | |
| | 4,020 | | | Criteo SA* | | | 156,257 | |
| | 220 | | | HubSpot Inc.* | | | 145,013 | |
| | 8,040 | | | iClick Interactive Asia Group Ltd.* | | | 37,064 | |
| | 1,180 | | | LiveRamp Holdings Inc.* | | | 56,581 | |
| | 660 | | | Pegasystems Inc. | | | 73,801 | |
| | 3,870 | | | QuinStreet Inc.* | | | 70,395 | |
| | 12,280 | | | S4 Capital PLC* | | | 105,323 | |
| | 380 | | | salesforce.com Inc.* | | | 96,569 | |
| | 40,000 | | | Weimob Inc.* | | | 40,480 | |
| | 1,850 | | | ZoomInfo Technologies Inc.* | | | 118,770 | |
| | | | | | | | 996,654 | |
| | | | | | | | | |
| | | | | Total Common Stocks (Cost $2,558,350) | | | 2,680,364 | |
| | | | | | | | | |
| | | | | Total Investments (Cost $2,558,350) - 99.5% | | | 2,680,364 | |
| | | | | Other Assets in Excess of Liabilities - 0.5% | | | 13,266 | |
| | | | | Total Net Assets - 100.0% | | $ | 2,693,630 | |
| * | Non-income producing security. |
ADR - American Depository Receipt
PLC - Public Limited Company
The accompanying notes are an integral part of these financial statements.
SmartETFs Advertising & Marketing Technology ETF
Schedule of Investments
at December 31, 2021
| Country Breakdown | Percent of Total
Net Assets |
| Common Stocks | |
| Unites States | 52.2% |
| United Kingdom | 10.6% |
| Japan | 8.4% |
| Israel | 6.9% |
| France | 5.8% |
| China | 5.8% |
| Australia | 5.2% |
| Russia | 2.9% |
| Hong Kong | 1.4% |
| Canada | 0.3% |
| Total Investments | 99.5% |
| Other Assets in Excess of Liabilities | 0.5% |
| Total Net Assets | 100.0% |
The accompanying notes are an integral part of these financial statements.
GUINNESS ATKINSON SMARTETFS SUSTAINABLE ENERGY II ETF
ANNUAL REPORT FOR THE PERIOD ENDED
DECEMBER 31, 2021
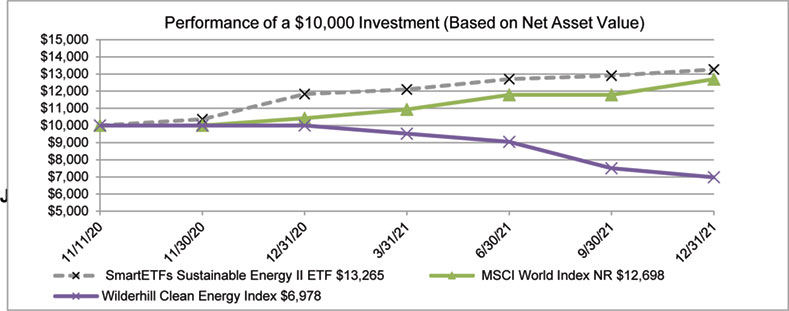
| Average annualized Total returns | 1
Year | Since Inception
11/11/2020 |
| Sustainable Energy II ETF (Net Asset Value) | 12.11% | 28.22% |
| Sustainable Energy II ETF (Market Price) | 11.54% | 30.17% |
| | | |
| Benchmark Indices: | | |
| MSCI World Index (Net Return) | 21.82% | 30.80% |
The Fund’s total expense ratio is 1.91% and the net expense ratio is 0.79%. The Adviser has contractually agreed to reduce its fees and/or pay ETF expenses in order to limit the Fund's total annual operating expenses to 0.68% through June 30, 2025. For the Fund’s current one-year expense ratios, please refer to the Financial Highlights section of this report.
Performance data quoted represents past performance and does not guarantee future results. The investment return and principal value of an investment in the Fund will fluctuate so that an investor's shares, when redeemed, may be worth more or less than their original cost. Current performance of the Fund may be lower or higher than the performance quoted. Performance data current to the most recent month-end may be obtained by visiting www.smartetfs.com, or calling (866) 307-5990.
Total returns for certain periods reflect a fee waiver in effect and in the absence of this waiver, the total returns would be lower. Returns reflect the reinvestment of distributions made by the Fund, if any. The graph and the performance table above do not reflect the deduction of taxes that a shareholder would pay on Fund distribution or the redemption of Fund shares.
Shares of ETFs are bought and sold at market price (not NAV) and are not individually redeemed from the ETF. Brokerage commissions will reduce returns. SmartETFs NAVs are calculated using prices as of 4:00 PM Eastern Time. The closing price is the Mid-Point between the Bid and Ask price as of the close of exchange. Closing price returns do not represent the returns you would receive if you traded shares at other times.
The SmartETFs Sustainable Energy II ETF is positioned to benefit from the many opportunities associated with the sustainable energy transition that we have discussed. As part of our investment process, we have identified a universe of around 250 companies (market capitalisation of over USD$500m) that are most directly exposed to the theme, and classify them into the following four sub-sectors:
| ● | Displacement includes companies involved in the displacement or more efficient usage of existing hydrocarbon-based energy |
| ● | Electrification includes companies involved specifically in the switching of hydrocarbon-based fuel demand towards electricity, especially for electric vehicles |
| ● | Generation includes companies involved in the generation of sustainable energy, either pureplay companies or those transitioning from hydrocarbon-based fuels |
| ● | Installation (Equipment) includes companies involved in the manufacturing of equipment for the generation and consumption of sustainable energy |
Sustainable Energy equities delivered a positive return in 2021 with the SmartETFs Sustainable Energy II ETF delivering 12.11% return (net asset value) in USD terms while the MSCI World Index Net Return index delivered 21.82%.
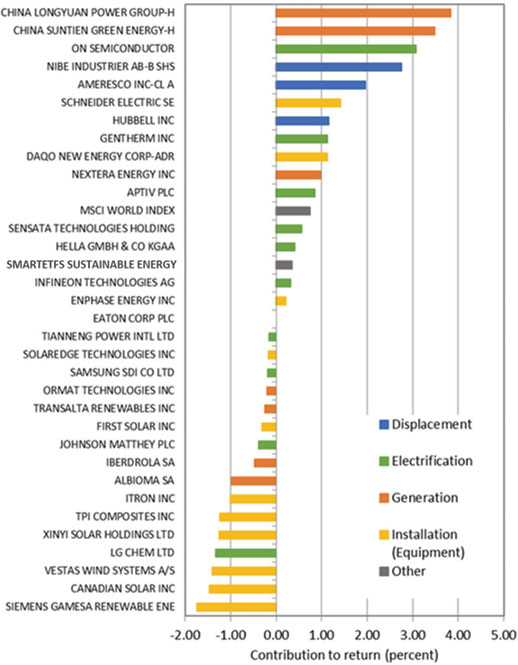
The largest positive contributors to the Fund in 2021 were our two Chinese generation companies (independent power producers) China Longyuan and China Suntien. At the start of the year, China Longyuan announced a corporate transaction with its parent company CNH Energy and its sister company Pingzhuang Energy that provided China Longyuan with a China A share listing while China Suntien’s share price increase reflected strong profit growth resulting from the start-up of new wind projects. Their strong performance was sustained through the third quarter of 2021 as the Chinese economy rebounded strongly and warm weather increased air conditioning demand, driving higher electricity prices and better margins for both.
Within electrification, Onsemi enjoyed numerous earnings upgrades through the year, as demand and pricing for its semiconductor products both rose. The company announced plans to prune both its revenue base and manufacturing footprint to invest in high-value, high-growth applications served by its power and sensing-biased semiconductor portfolio. Growth will be sacrificed in the 2022/2023 period while it focuses on higher margin businesses. Also, within electrification, Gentherm delivered strong results and good new contract awards, including a first production vehicle award for its new “ClimateSense” product which combines several individual product lines (such as thermal products, electronics and software) into a system solution.
With displacement, Nibe Industrier was the greatest contributor, with the shares reacting to strong demand for heat pumps, solid underlying business performance and a share split that increased accessibility of its shares. Of particular note was the company’s North American Climate Solutions business returning to growth and signs that Nibe’s decentralised business model was providing good insulation against raw material cost inflation. Ameresco and Hubbell also delivered strong contribution over the year.
The equipment (installation) sector was the weakest contributor with only three companies delivering a positive contribution over the year. Of note was Schneider Electric, whose shares reacted positively to consistent improvements in business performance, and polysilicon manufacturer Daqo New Energy which delivered a significant contribution to the Fund during the first quarter of the year (prior to its sale from the portfolio) as a result of strong polysilicon demand and rising polysilicon prices.
While the strongest performers came from all four sub sectors, the weaker performers came predominantly from the equipment (installation) sector. Siemens Gamesa, TPI Composites and Vestas Wind Systems suffered from slowing momentum within the near-term wind macro environment (compounded by supply chain pressures and raw material inflationary concerns) that trumped longer-term positive wind industry developments.
Other weak contributors included LG Chem whose shares were weak following a $1.9bn product recall with GM regarding battery faults on the Chevrolet Bolt, and two generation companies, Albioma and Iberdrola, which de-rated as a result of general market concerns around rising interest rates and the risk of greater regulation to compensate for higher fossil fuel prices.
2021 individual stock contribution, in USD
source: Bloomberg, Guinness Atkinson Asset Management estimates
In terms of attribution relative to the Guinness sustainable energy universe, the Fund delivered positive sector allocation and stock selection within efficiency (due to a small sector overweight and advantaged stock selection as described above); electric vehicles (due to a bias towards power semiconductors and electronics and avoidance of recently listed US special purpose acquisition companies (SPACs)); within independent power producers (IPPs) (due to exposure to Chinese wind-dominated IPPs and the avoidance of US residential solar and pure-play high-growth solar IPPs that were weaker as a result of rising interest rate concerns); and within other equipment (due to avoidance of weak hydrogen fuel cell and electrolyser companies as well as newly listed energy storage stocks).
The Fund delivered negative sector allocation and stock selection within batteries (due to lack of exposure to battery raw material companies as well as pure-play cathode and anode manufacturers); and within solar and wind equipment (where we held overweight positions to sectors and manufacturing companies that suffered from raw material cost inflation and supply chain issues).
Early in the year, we sold Daqo New Energy and replaced the holding with a position in Infineon Technologies. We also added Eaton towards the end of the year.
| ● | Daqo is a fast growing, low cost, China based manufacturer of polysilicon, whose shares increased by more than eight times since the start of 2019. While underlying profitability has increased at Daqo, we are concerned that the share price now fully reflects a very optimistic outlook for long term polysilicon pricing and company growth. |
| ● | Infineon Technologies designs, manufactures, and markets semiconductors with a focus on the automotive, industrial power control, power management and digital security markets. Having recently acquired Cypress Semi, we believe that Infineon is very well placed to benefit from the industry’s need for greater semiconductor (especially power semiconductor) content in electric vehicles. |
| ● | Eaton is a US listed, US$65bn market capitalisation specialized producer of highly engineered products and services. These offerings are designed to solve customer pain points in vital portions of the world’s infrastructure. We believe Eaton has mostly positioned its portfolio in profitable niches that should benefit from secular trends like energy transition and electrification, to propel long-term growth. |
The sector and geographic weightings of the portfolio at December 31, 2021 were as follows:
| Sector breakdown | Dec. 31, 2021 |
| Displacement | |
| Efficiency | 11.8% |
| Electrification | |
| Battery | 8.1% |
| Electric vehicles | 23.7% |
| Generation | |
| IPP | 15.0% |
| Utility | 8.1% |
| Installation | |
| Equipment | 28.5% |
| Cash | 4.8% |
| Total | 100% |
| Geographic breakdown | Dec 31, 2021 |
| USA | 38.7% |
| China | 9.8% |
| Germany | 7.3% |
| France | 6.5% |
| Spain | 6.4% |
| Canada | 6.1% |
| South Korea | 5.6% |
| Sweden | 4.1% |
| Ireland | 3.9% |
| Denmark | 2.5% |
| UK | 2.5% |
| Israel | 1.8% |
| Cash | 4.8% |
The year of 2021 saw continued positive momentum for the energy transition. Policy commitments and investments were made to accelerate the decarbonisation of the global energy sector. Offsetting this, we saw raw material cost inflation, supply chain issues and some political tensions which have slowed the pace of growth and profitability in certain subsectors. Against this backdrop, our portfolio has seen improved cash return expectations versus twelve months ago. It continues to offer broad exposure to companies that are well placed to benefit from an energy transition that will gather pace through the remainder of this decade.
After very strong policy support in 2020, we witnessed further policy commitment in 2021. The most significant policy milestones last year included:
| ● | President Biden returning the US to the Paris Agreement, and announcing significantly increased 2030 Greenhouse Gas (GHG) reduction targets; |
| ● | the influential 2021 Intergovernmental Panel on Climate Change (IPCC) climate report, which highlighted the importance and urgency of pursuing a 1.5° warming or net zero 2050 scenario; |
| ● | the Conference of the Parties (COP)-15 Biological Diversity Conference, at which President Xi gave more clarity on how China would meet its climate targets over the coming years, including a major expansion in solar; and |
| ● | and the COP26 climate conference, which introduced new net zero targets, additional country pledges and some “alliances of the willing” to reduce coal usage and methane emissions. |
In addition to enhanced policy commitment, 2021 saw major steps forward for various aspects of the transition. We saw around 290 GW of new renewable generation capacity installed, 10 GW (gigawatt) higher than the record installations seen in 2020 and nearly 100 GW higher than the 194 GW installed in 2019. Solar represented nearly two-thirds of the new capacity additions, followed by wind then hydro. Renewable electricity generation increased by around 6% to over 7,900 TWh (terawatt-hour), outpacing global electricity demand growth (4.5% in 2021). Electric vehicle sales surged, reaching around 7% of global light auto sales, up from just over 3% in 2020. Sales were particularly strong in China and Europe. And investment into energy efficiency also accelerated, with building infrastructure remaining a key focus for spending.
2021 was also a year in which the complexities of a shift to a lower carbon economy become more evident.
In Europe, record natural gas prices became a major political headache, forcing governments to seek protection for consumers from the extreme price spike. On the one hand, observers could point to extraordinarily high post-pandemic power demand, plus the tactics of President Putin to withhold gas exports into Europe, as reasons for the extreme prices. But on the other hand, the spike has been driven by an attempt to shift away from carbon intensive coal usage in China, and the impact of a rapidly rising carbon price in Europe, which is affecting the behaviour of utilities.
In the US, Democratic Senator Joe Manchin has blocked the path of the “Build Back Better” (BBB) bill, a cornerstone spending plan of the current administration which includes various clean energy related provisions designed to accelerate the transition. Manchin represents West Virginia, a major coal producing state, and claims the bill will “risk the reliability of our electric grid and increase our dependence on foreign supply chains”.
After many years of consistent cost reductions, 2021 also saw the emergence of inflationary conditions and supply chain pressures across the breadth of the sustainable energy sector. Energy transition technologies and equipment are typically raw material intensive (leaving them exposed to raw material inflation) and are dominated by Chinese manufacturing (50% of all wind turbines and 70% of all solar panels are manufactured in China), leaving importers exposed to supply chain inefficiencies and higher freight costs.
Natural gas prices will moderate; there will be a resolution to Manchin’s opposition to BBB, and most areas of raw material inflation will settle down and be trumped by scale and technological improvements. But the world is waking up to the fact that although the energy transition will result in economic and environmental gains, policy decisions have the potential in the short-term to cause economic and political friction.
Against this backdrop, the SmartETFs Sustainable Energy II ETF has seen improved cash return expectations and delivered a total return (USD) (net asset value) of +12.07% vs the MSCI World Index (net return) of +21.82%. Within the portfolio, outperforming sectors included Chinese wind generation, electric vehicle (EV) component suppliers, polysilicon (for solar) and efficiency. Underperforming sectors included European green utilities, solar component manufacturers and wind developers.
Looking ahead to 2022 and beyond, we expect further acceleration of the transition:
| ● | On the supply side of the energy transition, the International Energy Agency (IEA) is forecasting that renewable power additions over the coming five years will be just over 1,800 GW; a near 50% increase on its previous five-year forecast published twelve months earlier. The increase is driven by a further reduction in the levelized cost of electricity for renewables. |
| ● | The IEA has described solar power as “the cheapest electricity in history” and, despite near term headwinds and cyclical cost inflationary factors, large-scale solar remains at the bottom end of the cost curve. Globally, we expect solar installations to grow in 2022 by over 20%, led by China, India, Middle East and other parts of Asia. It is likely that poly-silicon prices have peaked, bringing cost relief for cell and module manufacturers. The outlook for solar in the US this year is less certain due to various issues (stimulus spending, net metering and Chinese import issues). |
| ● | Global wind installations are expected to be around flat in 2022, as changes in tax incentives, COVID-related logistics issues and raw material cost inflation are worked through. Onshore installations should pick up meaningfully in the middle of the decade, and there is clear momentum in offshore wind, albeit with a 3-4 year lead time. President Biden has recently called for the US to have 30 GW of offshore wind by 2030 (current installed base = <1 GW), which would represent a step change for the industry. |
| ● | Energy efficiency will continue to receive a good proportion of post-COVID stimulus spending, with a continued focus on buildings. We expect an acceleration in the penetration of LED lighting, insulation and heat pumps, as well as a focus on grid and transmission upgrades. The IEA estimates that to meet current government policies, energy efficiency spending needs to increase from a recent average level of around $250bn per annum (pa) to around $375bn this decade and nearly $550bn in the 2030s. |
| ● | EV sales should exceed 9 million in 2022, representing around 10% of total passenger vehicle sales, taking the global EV stock from 16 million vehicles to 25 million vehicles. Lower EV prices, greater brand choice and growing consumer appetite continue to be the key drivers of improved EV sales. |
| ● | Battery demand for use in EVs and energy storage will accelerate in 2022. We expect new battery capacity of nearly 300 GWh to be sold this year, up by around 25% versus 2021. Raw material cost inflation will continue to have an impact in 2022, but rapidly increasingly manufacturing capacity, coupled with technological improvements, will continue to push average battery pack costs towards $100/kWh, the level at which mass market EVs become affordable. |
The outlook we summarise here is broadly consistent with current government activity and observable investment plans. To be clear, however, the growth described falls well short of the energy transition activity needed to achieve a net zero / 1.5 degree scenario in 2050, as targeted by the IPCC and at COP26. In a net zero scenario, the deployment of renewable generation capacity, penetration of EVs and battery storage, use of alternative fuels and implementation of energy efficiency measures will need to accelerate markedly.
At December 31, 2021, the SmartETFs Sustainable Energy II ETF traded on a 2022 P/E ratio of 24.5x and 2022 EV/EBITDA multiple of 13.2x. The Fund trades at about a 20% premium to the MSCI World Index, which we see as justified given the attractive growth rates available to invest in across the sector. As a sense check, consensus EPS growth (2021-2023E) of the portfolio (at 21.3% pa) is well ahead of the MSCI World (at 13.5% pa). Looking over the next five years, we believe that the portfolio is in a position to deliver average earnings growth.
Jonathan Waghorn and Will Riley
January 2022
Definitions
P/E Ratio is the price-to-earnings ratio and is a ratio for valuing a company that measures its current share price relative to its earnings per share.
EV/EBITDA is the enterprise value (EV) to earnings before interest, taxes, depreciation, and amortization (EBITDA). This ratio is used by investment managers to measure a company’s return on investment.
International investments involve risk of capital loss from unfavorable fluctuation in currency values, from differences in generally accepted accounting principles or from social, economic or political instability in other nations. Emerging markets involve heightened risks related to the same factors as well as increased volatility and lower trading volume.
The companies in which the Fund invests may be subject to rapid changes in technology, intense competition, rapid obsolescence of products and services, loss of intellectual property protections, evolving industry standards and frequent new product productions and changes in business cycles and government regulations.
These risks could adversely affect the value of companies in which the Fund invests. Limitations on applications for autonomous or electric vehicles could adversely affect the value of companies in which the Fund invests.
MSCI World Index A free float-adjusted market capitalization weighted index that is designed to measure the equity market performance of developed markets. One cannot invest directly in an index.
Please refer to the Schedule of Investments for details on Fund holdings. Current and future portfolio holdings are subject to risk.
The information provided herein represents the opinion of Guinness Atkinson Asset Management, Inc. for the period stated and is not intended to be a forecast of future events, a guarantee of future results, or investment advice. Opinions, Fund holdings and sector allocations are subject to change at any time, and are not recommendations to buy or sell any security.
Sustainable Energy II ETF
FUND PERFORMANCE AND SUMMARY
As of December 31, 2021 (Unaudited)
Average Annual Returns
December 31, 2021 | One Year | Since Inception
(11/11/2020) |
| Sustainable Energy II ETF - NAV | 12.11% | 28.22% |
| Sustainable Energy II ETF - Market | 11.54% | 30.17% |
| MSCI World Index NR | 21.82% | 30.80% |
The performance data quoted represents past performance and past performance is not a guarantee of future results. The investment return and principal value of an investment will fluctuate so that an investor's shares, when redeemed, may be worth more or less than their original cost. Current performance of theFund may be lower or higher than the performance quoted. Performance data current to the most recent month end may be obtained by visiting www.smartetfs.com.
Total returns reflect the reinvestment of distributions made by the Fund, if any. The deduction of taxes that a shareholder would pay on Fund distribution or the redemption of Fund shares is not reflected in the total returns.
The Fund's shares are listed on an exchange. The price of the Fund's shares is based on market price, and because the exchange-traded fund shares trade at market prices rather and net asset value, shares may trade at a price greater than net asset value (premium) or less than net asset value (discount).
The MSCI World Index (Net Return) is a free float-adjusted market capitalization weighted index that is designed to measure the equity market performance of developed markets. Net Return reflects deduction for withholding tax but reflects no duduction for fees and expenses. Net Return is net of local withholding taxes that any investor would pay.
SmartETFs Sustainable Energy II ETF
Schedule of Investments
at December 31, 2021
| Shares | | | Common Stocks: 96.2% | | Value ($) | |
| | | | | Electrification: 39.0% | | | | |
| | 1,422 | | | Aptiv PLC* | | $ | 234,559 | |
| | 2,898 | | | Gentherm Inc.* | | | 251,836 | |
| | 2,896 | | | Hella GmbH & Co. KGaA | | | 196,378 | |
| | 5,202 | | | Infineon Technologies AG | | | 241,241 | |
| | 2,214 | | | Itron Inc.* | | | 151,703 | |
| | 5,346 | | | Johnson Matthey PLC | | | 147,968 | |
| | 288 | | | LG Chem Ltd. | | | 148,984 | |
| | 3,744 | | | ON Semiconductor Corporation* | | | 254,293 | |
| | 342 | | | Samsung SDI Co., Ltd. | | | 188,426 | |
| | 1,296 | | | Schneider Electric SE | | | 254,296 | |
| | 3,906 | | | Sensata Technologies Holding* | | | 240,961 | |
| | | | | | | | 2,310,645 | |
| | | | | Energy Efficiency: 11.9% | | | | |
| | 2,898 | | | Ameresco Inc.* | | | 236,013 | |
| | 1,080 | | | Hubbell Inc. | | | 224,932 | |
| | 16,272 | | | Nibe Industrier AB - B Shares | | | 246,010 | |
| | | | | | | | 706,955 | |
| | | | | | | | | |
| | | | | Renewable Energy Generation: 28.0% | | | | |
| | 3,438 | | | Albioma SA | | | 134,089 | |
| | 95,994 | | | China Longyuan Power Group Corp Ltd. | | | 224,087 | |
| | 228,000 | | | China Suntien Green Energy Corp Ltd. | | | 177,803 | |
| | 612 | | | Enphase Energy Inc.* | | | 111,959 | |
| | 18,324 | | | Iberdrola SA | | | 217,029 | |
| | 2,862 | | | Nextera Energy Inc. | | | 267,196 | |
| | 1,764 | | | Ormat Technologies Inc. | | | 139,885 | |
| | 6,984 | | | Siemens Gamesa Renewable Energy SA | | | 167,423 | |
| | 14,850 | | | TransAlta Renewables Inc. | | | 220,187 | |
| | | | | | | | 1,659,658 | |
| | | | | | | | | |
| | | | | Renewable Equipment Manufacturing: 17.3% | | | | |
| | 4,662 | | | Canadian Solar Inc.* | | | 145,874 | |
| | 1,170 | | | Eaton Corp. PLC | | | 202,199 | |
| | 2,340 | | | First Solar Inc.* | | | 203,954 | |
| | 378 | | | Solaredge Technologies Inc.* | | | 106,056 | |
| | 2,088 | | | TPI Composites Inc.* | | | 31,237 | |
| | 4,914 | | | Vestas Wind Systems A/S | | | 150,342 | |
| | 108,000 | | | Xinyi Solar Holdings Ltd. | | | 183,128 | |
| | | | | | | | 1,022,790 | |
| | | | | | | | | |
| | | | | Total Common Stocks (Cost $5,538,510) | | | 5,700,048 | |
| | | | | | | | | |
| | | | | Total Investments (Cost $5,538,510) - 96.2% | | | 5,700,048 | |
| | | | | Other Assets in Excess of Liabilities - 3.8% | | | 226,469 | |
| | | | | Total Net Assets - 100.0% | | $ | 5,926,517 | |
| * | Non-income producing security. |
ADR - American Depository Receipt
PLC - Public Limited Company
The accompanying notes are an integral part of these financial statements.
| SmartETFs Sustainable Energy II ETF |
| Schedule of Investments |
| at December 31, 2021 |
| Country Breakdown | Percent of Total
Net Assets |
| Common Stocks | |
| United States | 38.6% |
| China | 9.8% |
| Germany | 7.4% |
| Spain | 7.0% |
| France | 6.6% |
| Canada | 6.2% |
| South Korea | 5.7% |
| Sweden | 4.1% |
| Ireland | 4.0% |
| Denmark | 2.5% |
| United Kingdom | 2.5% |
| Israel | 1.8% |
| Total Investments | 96.2% |
| Other Assets in Excess of Liabilities | 3.8% |
| Total Net Assets | 100.0% |
The accompanying notes are an integral part of these financial statements.
SmartETFs Asia Pacific Dividend Builder ETF
ANNUAL REPORT FOR THE PERIOD ENDED
DECEMBER 31, 2021
1. Performance
| Average annualized Total returns | 1
Year | 3
Years | 5
Years | 10
Years |
| Asia Pacific Dividend Builder ETF (Net Asset Value) | 11.27% | 15.10% | 11.74% | 9.08% |
| Asia Pacific Dividend Builder ETF (Market Price) | 11.72% | 15.26% | 11.83% | 9.12% |
| Benchmark Index: | | | | |
| MSCI AC Pacific Ex Japan Index (net return) | -5.85% | 11.69% | 10.28% | 7.38% |
The Fund’s total expense ratio is 4.97% and the net expense ratio is 0.78%. The Adviser has contractually agreed to reduce its fees and/or pay ETF expenses in order to limit the Fund's total annual operating expenses to 0.68% through June 30, 2025. For the Fund’s current one-year expense ratios, please refer to the Financial Highlights section of this report.
The SmartETFs Asia Pacific Dividend Builder ETF acquired the assets and liabilities of the predecessor mutual fund, the Guinness Atkinson Asia Pacific Dividend Builder Fund, on March 26, 2021. As a result of the transaction, the Fund adopted the accounting and performance history of its predecessor mutual fund Performance results shown prior to March 26, 2021, reflect the performance of the predecessor mutual fund. The Market Price returns shown prior to March 26, 2021 reflects the predecessor mutual fund's NAV.
Performance data quoted represents past performance and does not guarantee future results. The investment return and principal value of an investment in the Fund will fluctuate so that an investor's shares, when redeemed, may be worth more or less than their original cost. Current performance of the Fund may be lower or higher than the performance quoted. Performance data current to the most recent month-end may be obtained by visiting www.smartetfs.com, or calling (866) 307-5990.
Total returns for certain periods reflect a fee waiver in effect and in the absence of this waiver, the total returns would be lower. Returns reflect the reinvestment of distributions made by the Fund, if any. The graph and the performance table above do not reflect the deduction of taxes that a shareholder would pay on Fund distribution or the redemption of Fund shares.
Shares of ETFs are bought and sold at market price (not NAV) and are not individually redeemed from the ETF. Brokerage commissions will reduce returns. SmartETFs NAVs are calculated using prices as of 4:00 PM Eastern Time. The closing price is the Mid-Point between the Bid and Ask price as of the close of exchange. Closing price returns do not represent the returns you would receive if you traded shares at other times.
The Fund rose 11.27% in 2021 compared to the MSCI AC Pacific ex Japan Net Return Index which fell -5.85%.
Most of the absolute gains made by the Fund came in the first half of the year while the relative performance, from holding onto them, came in the second half of the year. Stock selection made an important contribution this year notably with our China exposure outperforming the MSCI China Index. The main contributors to performance in 2021 were our holdings in financials, Health care, and Technology but we also saw contributions coming from holdings in the communication services, consumer discretionary and real estate sectors.
Over the whole COVID period, taking the under-performance in 2020 and its outperformance in 2021, the Fund was up 26.77% and outperformed the index which rose 15.85% by 10.92%
Dividends in Asia fell sharply in 2020, where many companies’ dividend policies are tied to profits, and were down 16.9% in USD for the benchmark. In 2021 we saw a good recovery. In the portfolio, 26 companies grew their dividend, 1 kept the dividend flat, 8 dividends fell, and 1 dividend was omitted. The sources of dividend income received by the portfolio during the year were well spread: 28% came from Chinese companies, 17% from Korea, 15% from Taiwan and 11% from Australia with contributions also coming from Singapore (8%) and Thailand (5%). From a sector perspective 24% came from technology, primarily manufacturing; a further 21% came from consumer discretionary companies, 16% from banking and 8% from each of the consumer staples, insurance and real estate sectors.
Consumer price inflation has taken off in developed markets. Asia has seen consumer prices move higher as well but to nothing like the same extent. Korea is the only one that has felt a need to raise interest rates in response to domestic price increases. One of the key factors that lies behind the consumer price inflation spike, which does have an effect in Asia, is the rise of factory input prices, Producer Price Inflation (PPI). The cost of materials and components, from wood to semiconductors, has risen sharply. All our manufacturing businesses from household goods, consumer durables, textile makers and semiconductor producers have reported this issue. They have responded in various, and sometimes multiple, ways to enable a combination of cost saving, cost pass through and higher average selling prices.
Trade growth remained a bright spot across Asia especially out of China, Taiwan and Korea and the Chinese Yuan strengthened to its highest level against the US dollar in over 3 years. It has been a sustaining force for consumer confidence in Asia. China exports were 35% higher than pre-pandemic levels and total merchandise trade (exports and imports of goods) exceeded $6 trillion for the first time. Korean exports were higher, but supply disruptions had a greater impact. It has a much more diverse export mix than most countries that includes capital equipment, petrochemical plant and ships. Car exports are substantial through Hyundai and Kia in particular, which have been affected. It is also a major producer of household appliances, another area that has been disrupted.
China’s domestic policies in 2021 have been the most contentious issue for investors but although swift and with high immediate impact in implementation, the underlying rationale is consistent with both China’s stated aims and indeed in what we are seeing in the US, Europe and UK. The regulatory changes imposed upon the technology and e-commerce sector in China come against a backdrop of market concentration and increasingly anti-competitive behaviour. These companies now face a mix of intensifying competition and regulatory change. 2021 was not their year, but we have no doubt that they still have a big part to play in the China and Asia story. The second policy area to rattle investors has been China’s crackdown on debt accumulation by real estate developers which has sent a chill through the housing market. This has long been a thorn in the side of policy efforts to reduce aggregate borrowing and we think is designed to ensure long term economic health rather than spike investors or destabilise the property market.
In 2021, there was one change to the portfolio in the first half of the year. We sold China Mobile and replaced it with China Overseas Land & Investment (COLI). Both stocks offer a similar yield but COLI’s returns on capital, earnings growth and dividend growth profile are superior to those of China Mobile, in our opinion. COLI also trades at a significantly lower valuation to China Mobile. Over the past five years, COLI has grown its dividend at an average annual rate of 14.1%, paying out 25% of its earnings (25% pay-out ratio) compared China Mobile, whose dividend has grown 4% over the same period with a 43% pay-out ratio.
The Chinese real estate developer sector is not a popular area hence the low and, in our opinion, attractive valuation. COLI’s circumstances are significantly different from those of the privately owned companies with much higher cash and much lower debt levels. The company is rated as an investment grade debt issuer at BBB+ by Standard & Poor’s, Baa1 by Moody’s and A- by Fitch. We see this company as having a solid financial platform and with many of its peers now focused on managing liquidity, COLI is in a good position to acquire land for future development at lower cost in the absence of competitive bidding. We believe COLI is set for average earnings growth over the next couple of years, as well as a yield and dividend growth in line with earnings.
The Fund is overweight to consumer discretionary, consumer staples, financials, health care and technology companies and is underweight communication services and industrials as well as energy, and materials which, typically for cyclical reasons, are unable to sustain our minimum return on capital requirements. The fund has an overweight to real estate through its holdings in real estate investment trusts and the newly purchased position discussed above. On a country basis, the fund is most notably underweight in Australia, China, Hong Kong and Korea and overweight in Singapore, Taiwan and Thailand. Our US position consists of Qualcomm (smartphone chips) and Aflac (life and health insurer).
At the end of the year the portfolio was trading on a forward Price Earnings (P/E) multiple of 10.9 times consensus estimated earnings for 2022 and at a 21% discount to the market index valuation of 13.8x. We think the combination of robust earnings quality, a positive earnings outlook, low valuation and an historic dividend yield well above the market yield, is the right one for these times.
Edmund Harriss
January 2022
The Fund invests in foreign securities, which involves political, economic and currency risks, greater volatility, and differences in accounting methods. These risks are greater for emerging markets. The Fund invests in small- or mid-cap companies, which involve additional risks such as limited liquidity and greater volatility than larger companies. When inflation rate is greater than expected, that markets may respond differently to changes in the inflation rate than the Advisor expects, or inflation may manifest in such a way that the Fund is unable to provide reasonable protection against inflation.
The MSCI AC Pacific Ex-Japan Index is a market capitalization weighted index that monitors the performance of stocks from the Pacific region, excluding Japan. Net Return reflects deduction for withholding tax but reflects no deduction for fees and expenses. Net Return is net of local withholding taxes that any investor would pay. The index is unmanaged and not available for investment, and do not incur expenses.
The MSCI China Index captures large and mid cap representation across China A shares, H shares, B shares, Red chips, P chips and foreign listings (e.g. ADRs). With 740 constituents, the index covers about 85% of this China equity universe. Currently, the index includes Large Cap A and Mid Cap A shares represented at 20% of their free float adjusted market capitalization. The index is unmanaged and not available for investment, and do not incur expenses.
PER or P/E – Price to Earnings ratio is calculated by dividing current price of the stock by the company's trailing twelve months' earnings per share.
Ratings listed herein are assigned by Standard & Poor’s (S&P),Moody’s Investor Service (Moody’s), and Fitch Ratings (Fitch) . Credit quality ratings are measured on a scale with S&P’s credit quality ratings ranging from AAA (highest) to D (lowest), Moody’s credit quality ratings ranging from Aaa (highest) to C (lowest), and Fitch’s credit quality ratings ranging from AAA (highest) to D (lowest).
Please refer to the Schedule of Investments for details on Fund holdings. Current and future portfolio holdings are subject to risk.
The information provided herein represents the opinion of Guinness Atkinson Asset Management, Inc. for the period stated and is not intended to be a forecast of future events, a guarantee of future results, or investment advice. Opinions, Fund holdings and sector allocations are subject to change at any time, and are not recommendations to buy or sell any security.
SmartETFs Asia Pacific Dividend Builder ETF
FUND PERFORMANCE AND SUMMARY
As of December 31, 2021 (Unaudited)
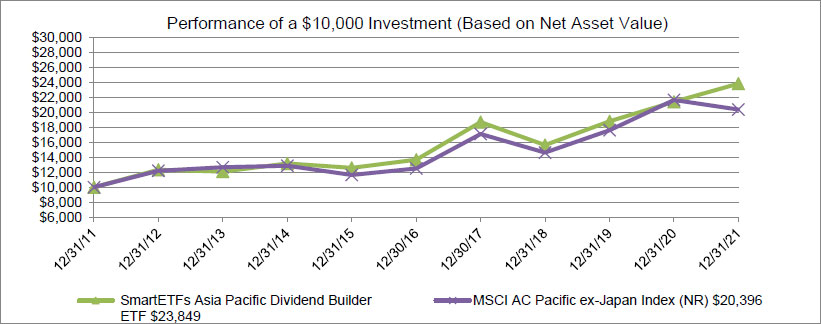
Average Annual Returns
December 31, 2021 | One Year | Five Years | Ten Years |
| SmartETFs Asia Pacific Dividend Builder ETF - NAV | 11.27% | 11.74% | 9.08% |
| SmartETFs Asia Pacific Dividend Builder ETF - Market | 11.72% | 11.83% | 9.12% |
| MSCI AC Pacific ex-Japan Index NR | -5.85% | 10.27% | 7.38% |
The SmartETFs Asia Pacific Dividend Builder ETF acquired the assets and liabilities of the predecessor mutual fund, the Guinness Atkinson Asia Pacific Dividend Builder Fund, on March 26, 2021. As a result of the transaction, the Fund adopted the accounting and performance history of its predecessor mutual fund Performance results shown prior to March 26, 2021, reflect the performance of the predecessor mutual fund. The Market Price returns shown prior to March 26, 2021 reflects the predecessor mutual fund's NAV.
The performance data quoted represents past performance and past performance is not a guarantee of future results. The investment return and principal value of an investment will fluctuate so that an investor's shares, when redeemed, may be worth more or less than their original cost. Current performance of theFund may be lower or higher than the performance quoted. Performance data current to the most recent month end may be obtained by visiting www.smartetfs.com.
Total returns reflect the reinvestment of distributions made by the Fund, if any. The deduction of taxes that a shareholder would pay on Fund distribution or the redemption of Fund shares is not reflected in the total returns.
The Fund's shares are listed on an exchange. The price of the Fund's shares is based on market price, and because the exchange-traded fund shares trade at market prices rather and net asset value, shares may trade at a price greater than net asset value (premium) or less than net asset value (discount).
The MSCI All Country Pacific Free ex-Japan Index (MSCI AC Pacific ex-Japan Index) is a free float-adjusted, capitalization-weighted index that is designed to measure equity market performance in the Pacific region including Japan. Net Return reflects deduction for withholding tax but reflects no deduction for fees and expenses. Net Return is net of local withholding taxes that any investor would pay.
SmartETFs Asia Pacific Dividend Builder ETF
Schedule of Investments
at December 31, 2021
| Shares | | | Common Stocks: 99.6% | | Value ($) | |
| | | | | Australia: 11.1% | | | | |
| | 6,881 | | | Corporate Travel Management Ltd. | | $ | 110,090 | |
| | 3,007 | | | JB Hi-Fi Ltd. | | | 105,617 | |
| | 36,910 | | | Metcash Ltd. | | | 120,735 | |
| | 3,853 | | | Sonic Healthcare Ltd. | | | 130,599 | |
| | | | | | | | 467,041 | |
| | | | | China: 31.9% | | | | |
| | 156,000 | | | China Construction Bank Corp. - H Shares | | | 108,049 | |
| | 180,000 | | | China Lilang Ltd. | | | 100,661 | |
| | 67,000 | | | China Medical System Holdings | | | 111,889 | |
| | 14,000 | | | China Merchants Bank Co., Ltd. - H Shares | | | 108,728 | |
| | 48,500 | | | China Overseas Land & Investment Ltd. | | | 114,835 | |
| | 20,000 | | | China Resources Gas Group Ltd. | | | 112,999 | |
| | 17,700 | | | Inner Mongolia Yili Industrial Group Co., Ltd. - A Shares | | | 115,292 | |
| | 1,016 | | | NetEase Inc. - ADR | | | 103,409 | |
| | 15,500 | | | Ping An Insurance Group Company of China Ltd. - H Shares | | | 111,630 | |
| | 5,100 | | | Shenzhou International | | | 98,056 | |
| | 40,900 | | | Suofeiya Home Collection - A Shares | | | 142,651 | |
| | 11,994 | | | Zhejiang Supor Cookware - A Shares | | | 117,282 | |
| | | | | | | | 1,345,481 | |
| | | | | Hong Kong: 5.2% | | | | |
| | 34,500 | | | BOC Hong Kong Holdings Ltd. | | | 113,060 | |
| | 12,224 | | | Link REIT/The | | | 107,635 | |
| | | | | | | | 220,695 | |
| | | | | | | | | |
| | | | | India: 3.4% | | | | |
| | 5,969 | | | Tech Machindra LTD | | | 143,487 | |
| | | | | | | | | |
| | | | | Malaysia: 2.7% | | | | |
| | 114,700 | | | Public Bank Bhd | | | 114,535 | |
| | | | | | | | | |
| | | | | Singapore: 8.2% | | | | |
| | 52,354 | | | Ascendas Real Estate Investment Trust - REIT | | | 114,556 | |
| | 74,200 | | | CapitaLand Mall Trust - REIT | | | 112,274 | |
| | 4,986 | | | DBS Group Holdings Ltd. | | | 120,785 | |
| | | | | | | | 347,615 | |
| | | | | South Korea: 7.5% | | | | |
| | 8,991 | | | Hanon Systems | | | 101,719 | |
| | 13,332 | | | Korean Reinsurance Co | | | 103,731 | |
| | 1,622 | | | KT&G Corp. | | | 107,783 | |
| | | | | | | | 313,233 | |
| | | | | | | | | |
| | | | | Taiwan: 20.0% | | | | |
| | 18,000 | | | Catcher Technology Co., Ltd. | | | 101,642 | |
The accompanying notes are an integral part of these financial statements.
SmartETFs Asia Pacific Dividend Builder ETF
Schedule of Investments
at December 31, 2021
| Shares | | | | | Value ($) | |
| | | | | Common Stocks (Continued) | | | | |
| | | | | Taiwan (Continued) | | | | |
| | 14,000 | | | Elite Material Co., Ltd. | | $ | 140,429 | |
| | 29,517 | | | Hon Hai Precision Industry Co., Ltd. | | | 110,762 | |
| | 1,400 | | | Largan Precision Co., Ltd. | | | 124,517 | |
| | 8,000 | | | Nien Made Enterprise Co., Ltd. | | | 119,069 | |
| | 6,500 | | | Novatek Microelectronics Corp. | | | 126,412 | |
| | 991 | | | Taiwan Semiconductor Manufacturing Co., Ltd. | | | 119,227 | |
| | | | | | | | 842,058 | |
| | | | | | | | | |
| | | | | Thailand: 2.8% | | | | |
| | 41,300 | | | Tisco Financial Group PCL/Foreign | | | 119,386 | |
| | | | | | | | | |
| | | | | United States: 6.8% | | | | |
| | 2,253 | | | Aflac Inc. | | | 131,553 | |
| | 846 | | | QUALCOMM Inc. | | | 154,708 | |
| | | | | | | | 286,261 | |
| | | | | | | | | |
| | | | | Total Common Stocks (Cost $2,984,212) | | | 4,199,792 | |
| | | | | | | | | |
| | | | | Total Investments (Cost $2,984,212): 99.6% | | | 4,199,792 | |
| | | | | Other Assets in Excess of Liabilities - 0.4% | | | 18,673 | |
| | | | | Net Assets: 100.0% | | $ | 4,218,465 | |
ADR - American Depository Receipt
PCL - Public Company Limited
REIT - Real Estate Investment Trust
The accompanying notes are an integral part of these financial statements.
SmartETFs Asia Pacific Dividend Builder ETF
Schedule of Investments
at December 31, 2021
Industry Breakdown | Percent of Total
Net Assets |
| Common Stocks | |
| Financial | 35.1% |
| Consumer, Cyclical | 21.2% |
| Technology | 15.4% |
| Consumer, Non-cyclical | 13.9% |
| Industrial | 11.3% |
| Utilities | 2.7% |
| Total Investments | 99.6% |
| Liabilities in Net Excess of Other Assets | 0.4% |
| Total Net Assets | 100.0% |
The accompanying notes are an integral part of these financial statements.
SmartETFs Dividend Builder ETF
ANNUAL REPORT FOR THE PERIOD ENDED
DECEMBER 31, 2021
| Average annualized Total returns | 1
Year | 3
Years | 5
Years | Since Inception
(March 30, 2012) |
| dividend Builder ETF (Net Asset Value) | 23.60% | 20.70% | 15.38% | 11.96% |
| dividend Builder ETF (Market Price) | 23.47% | 20.65% | 15.36% | 11.95% |
| Benchmark Index: | | | | |
| MSCI World Index (Net Return) | 21.82% | 21.68% | 15.02% | 11.77% |
The Fund’s total expense ratio is 1.42% and the net expense ratio is 0.65%. The Adviser has contractually agreed to reduce its fees and/or pay ETF expenses in order to limit the Fund's total annual operating expenses to 0.65% through June 30, 2025. For the Fund’s current one-year expense ratios, please refer to the Financial Highlights section of this report.
The SmartETFs Dividend Builder ETF acquired the assets and liabilities of the predecessor mutual fund, the Guinness Atkinson Dividend Builder Fund, on March 26, 2021. As a result of the transaction, the Fund adopted the accounting and performance history of its predecessor mutual fund Performance results shown prior to March 26, 2021, reflect the performance of the predecessor mutual fund. The Market Price returns shown prior to March 26, 2021 reflects the predecessor mutual fund's NAV.
Performance data quoted represents past performance and does not guarantee future results. The investment return and principal value of an investment in the Fund will fluctuate so that an investor's shares, when redeemed, may be worth more or less than their original cost. Current performance of the Fund may be lower or higher than the performance quoted. Performance data current to the most recent month-end may be obtained by visiting www.smartetfs.com, or calling (866) 307-5990.
Total returns for certain periods reflect a fee waiver in effect and in the absence of this waiver, the total returns would be lower. Returns reflect the reinvestment of distributions made by the Fund, if any. The graph and the performance table above do not reflect the deduction of taxes that a shareholder would pay on Fund distribution or the redemption of Fund shares.
Shares of ETFs are bought and sold at market price (not NAV) and are not individually redeemed from the ETF. Brokerage commissions will reduce returns. SmartETFs NAVs are calculated using prices as of 4:00 PM Eastern Time. The closing price is the Mid-Point between the Bid and Ask price as of the close of exchange. Closing price returns do not represent the returns you would receive if you traded shares at other times.
1. Review
In 2021, the SmartETFs Dividend Builder ETF produced a total return of 23.60% (TR in USD), compared to the MSCI World Index Net Return of 21.82%. The Fund therefore outperformed the Index by 1.78%.
In 2021, Covid-19 statistics, tiered lockdowns, unprecedented inflation, supply-chain shortages, and interest rate expectations dominated financial headlines for most of the year, yet equity markets instead focused on central bank stimulus, vaccine optimism, and corporate earnings growth as they ended 2021 with stronger-than-average returns.
Further, looking in more detail at the market and Fund performance in 2021, we identify 3 broad trends in terms of style/rotation:

Source: Bloomberg, data as of December 31st 2021
| (1) | the start of year to mid-May (12.31.2020 to 05.14.2021) when value outperformed growth on the back of the ‘reflation/reopening trade’ that started in November 2020 when the news of a successful vaccine was released and both economic growth-sensitive value stocks (such as Energy and Industrials) and rate-sensitive value stocks (like Banks) did well. Overall, the Fund outperformed the benchmark by 0.8% (TR in USD) over this period with our holdings in Industrials (ABB, Eaton, Raytheon) and Financials (Aflac, CME, Arthur Gallagher, Blackrock) performing well. |
| (2) | mid-May (05.14.2021) to late-September (09.21.2021) when this ‘reflation’ trend reversed and growth outperformed value as the Delta variant came to prominence, and we started to see a slowdown in the economy and a coincident fall in rates with US 10yr treasury yields dropping from 1.7% back to 1.2%. The Fund underperformed the benchmark by 2.9% (TR in USD) in this period (as we might expect in a growth-led rally), but ‘quality’ companies also performed well as the market focused on a slower growth outlook and increased market uncertainty – which aided Fund performance. IT companies held such as Microsoft, Broadcom, and Paychex performed strongly, as did Healthcare stocks such as Novo Nordisk, Sonic Healthcare, and Roche. Over the period the MSCI World Growth Index was up 15.19% (TR in USD) vs the MSCI World Value Index up 1.34% – a 13.85% differential. |
| (3) | late-September (09.21.2021) to year end (12.31.2021) when value and growth switched in-and-out of favour as markets dealt with another Covid-19 variant, supply-chain shortages, higher inflation, a more hawkish Fed ‘pivot’, and increased worries around China and global growth in general. The risk-off mood in markets aided the Fund’s relative performance given its high quality, defensive attributes. By seeking companies with persistently high profitability, strong balance sheets, robust competitive advantages, and attractive valuations, the Fund’s holdings held up better in the sell-off bouts, which dragged on those companies that bore relatively greater Covid, inflation, and interest rate risk, e.g. travel companies (airlines/hotels), companies with little pricing power, growth stocks with extreme valuations, and companies with high debt levels. In this period the Fund’s companies weathered the various uncertainties and the Fund outperformed the MSCI World Index by 2.6% (TR in USD). |
It is pleasing that the Fund navigated these different market environments well – generally outperforming the MSCI World High Dividend Yield Index and peers.
Overall, over the course of 2021, whilst value and growth stocks rotated in and out of favour, quality stocks outperformed both styles, and with less volatility. This benefitted the Fund’s relative performance.

Source: Bloomberg, data as of December 31st 2021
Large-cap stocks, and developed markets, also broadly outperformed their counterparts as investors seemingly sought greater safety in large companies with less growth uncertainty.

Source: Bloomberg, data as of December 31st 2021
With stock valuations broadly higher versus their historic averages, equity market performance across all sectors was generally driven by higher earnings growth as companies recovered from the lockdown-induced slowdowns experienced in 2020.

Source: Bloomberg, data as of December 31st 2021
Since 2001, when Bloomberg began compiling sector data, last year marked the first time that all 11 sectors posted double-digit returns. Amongst the best performers were the Energy, Real Estate and Financial sectors, which were the only three to see negative returns in 2020.
Over the course of the year, for the Fund, strong stock selection in Industrials, IT and Healthcare more than offset weaker allocation effects from owning no Banks, no REITs, and no Energy stocks – all sectors which performed strongly in the year – and from being overweight Consumer Staples, which generally lagged the market through 2021. Our underweighting to Utilities, Consumer Discretionary, and to Communication Services all also aided the Fund’s relative performance.
Our largest overweight in the Fund is to the Consumer Staples sector, with approximately 27% of holdings (c.20% overweight vs benchmark). Whilst this proved a drag on performance in the year, we believe that most developed global markets have now likely passed through the ‘recovery phase’ of the economic cycle, where companies that see the fastest recovery in their earnings outperform. We believe we are now in the phase of the cycle where fundamentals will drive returns, i.e. companies that offer steady compounding earnings and reasonable valuation will be rewarded. We continue to see many high-quality Consumer Staples companies trading at valuations around their 5- or 10-year average, which we do not necessarily see in other sectors.
Energy was the best performing sector in 2021 with both WTI and Brent Crude Oil prices hitting new highs in the year, and Real Estate and Financials also did well as Banks benefitted from higher inflation and interest rate expectations. As these sectors participated in what is known as the reflationary trade, this helped markets like the UK perform strongly given higher exposure to these sectors. In the Fund, we have no exposure to the Energy or Real Estate sector and nor have we ever owned any Banks. Companies within these sectors tend not to show up in our investible universe due to our focus on companies which have persistently high returns on capital and strong balance sheets. The stringent quality criteria excludes most companies within the commodity-based and regulated sectors where a business’ profitability can be particularly sensitive to exogenous factors.
Despite no exposure to these sectors, we still believe that the Fund is somewhat naturally hedged against inflation given its focus on dividend-paying – and specifically dividend-growing – companies.
Dividend Update
Based on quarter-end prices the Fund had a 12-month trailing dividend yield of 1.79% (net of withholding taxes), 5.3% higher than the benchmark index dividend yield of 1.7% (gross of withholding taxes).
In the Fund, the average dividend growth for 2021 was 6.3%. Out of our 35 holdings
| ● | 31 companies grew their dividend |
| ● | 3 companies kept their dividend flat |
| ● | 1 company reduced its dividend |
| ● | 0 companies cancelled their dividend |
This follows on from 2020, which saw 28 companies grow their dividend, 6 keep their dividend flat, only 1 company reduced, and none completely cancelled their distribution.
Activity
In 2021 we sold 1 position (Anta Sports) and replaced it with 1 new position (Texas Instruments), leaving the portfolio with 35 positions at the end of the year.
This change reduced our Consumer Discretionary and Asian exposure, whilst adding to our IT and US exposure.
Portfolio Positioning
We continue to maintain a fairly even balance between quality defensive and quality cyclical/growth companies. We have approximately 45% in quality defensive companies (e.g. Consumer Staples and Healthcare companies) and around 55% in quality cyclical or growth-oriented companies (e.g. Industrials, Financials, Consumer Discretionary, Information Technology, etc). Within Financials, however, we do not own any Banks, which helps to dampen the cyclicality of our Financials.
The Fund also has zero weighting to Energy, Utilities, Materials, and Real Estate.
Geographically, the Fund is diversified around the world with 54% in the US, 39% in Europe and 6% in Asia-Pacific. Within the Asia-Pacific region we have one company listed in Taiwan (Taiwan Semiconductor) and one company listed in Australia (Sonic Healthcare).
Outlook
The four key tenets to our approach are: quality, value, dividend, and conviction. We follow these metrics at the portfolio level to make sure we are providing what we say we will. At year end, we are pleased to report that the portfolio continues to deliver on all four of these measures relative to the MSCI World Index benchmark.
Based on the measures, holistically, the high-conviction Fund has companies which are on average better quality at better value versus the index and with a higher dividend yield. The Fund at the end of the year was trading on 18.0x 2022 expected price-to-earnings; a discount of 11.5% to the broad market, with a dividend yield premium of 5.3%.
In 2021, the economic recovery endured even as the battle against Covid-19 and its variants continued. With the onset of the Omicron variant in late November, it remains to be seen whether lockdowns – and a halt to global economies – will resurface. So far, Omicron is showing far greater transmission levels but milder symptoms, as evidenced by daily cases, hospitalizations, and death rates, and stocks moving to a record high in the final weeks of 2021 suggests that investors do not expect significant shutdowns. This will continue to be a critical factor in determining the economy’s trajectory for 2022.
Further, strong earnings were an important driver of 2021’s strong stock market performance and companies’ ability to successfully absorb higher input costs and pass them onto their consumers will play an important role in future earnings results too amid persistent supply chain challenges. Inflation is also proving stickier than many anticipated and the Federal Reserve System’s hawkish view affirms this. However, inflation should stabilize once the economy completes its reopening, when supply chains are fully operational, and labor shortages ease.
As we look ahead to 2022, we are confident that the companies in the portfolio are well placed from a pricing power perspective, and we note the defensive nature of the portfolio – which has outperformed in all market corrections since launch in 2010 – gives us confidence heading into what, currently, appears more volatile markets. We believe the holdings we have selected in the Fund remain very robust and are well placed to weather whatever the new year brings; our perpetual approach of focusing on quality compounders and dividend-growers should continue to stand us in good stead in our search for rising income streams and long-term capital growth.
As ever, we would like to thank you for your continued support, and we wish you all a safe and prosperous 2022.
Matthew Page & Ian Mortimer
January 2022
The Fund’s strategy of investing in dividend-paying stocks involves the risk that such stocks may fall out of favor with investors and could reduce or eliminate the payment of dividends in the future or the anticipated acceleration of dividends could not occur. The Fund invests in foreign securities, which involve political, economic and currency risks, greater volatility, and differences in accounting methods. These risks are greater for emerging markets. The Fund invests in small- or mid-cap companies, which involve additional risks such as limited liquidity and greater volatility than larger companies. When inflation rate is greater than expected, that markets may respond differently to changes in the inflation rate than the Advisor expects, or inflation may manifest in such a way that the Fund is unable to provide reasonable protection against inflation.
The MSCI World Index is a free float-adjusted market capitalization weighted index that is designed to measure the equity market performance of developed markets. This index is unmanaged and is not available for investment and does not incur expenses.
The MSCI World Growth Index captures large and mid cap securities exhibiting overall growth style characteristics across 23 Developed Markets (DM) countries.
The MSCI World Value Index captures large and mid cap securities exhibiting overall value style characteristics across 23 Developed Markets (DM) countries.
The MSCI World High Dividend Yield Index is based on the MSCI World Index, its parent index, and includes large and mid cap stocks across 23 Developed Markets (DM) countries.
The MSCI World Quality Index is based on MSCI World, its parent index, which includes large and mid cap stocks across 23 Developed Market (DM) countries.
The MSCI World Mid Cap Index captures mid cap representation across 23 Developed Markets (DM) countries.
The MSCI World Small Cap Index captures small cap representation across 23 Developed Markets (DM) countries.
PER or P/E – Price to Earnings ratio is calculated by dividing current price of the stock by the company's trailing twelve months' earnings per share.
Earnings growth is not a measure of the Fund’s future performance.
Dividend yield is calculated by annualizing the last quarterly dividend paid and dividing it by the current share price.
Diversification does not assure a profit nor protect against loss in a declining market.
Please refer to the Schedule of Investments for details on Fund holdings. Current and future portfolio holdings are subject to risk.
The information provided herein represents the opinion of Guinness Atkinson Asset Management, Inc. for the period stated and is not intended to be a forecast of future events, a guarantee of future results, or investment advice. Opinions, Fund holdings and sector allocations are subject to change at any time, and are not recommendations to buy or sell any security.
SmartETFs Dividend Builder ETF
FUND PERFORMANCE AND SUMMARY
As of December 31, 2021 (Unaudited)

Average Annual Returns
December 31, 2021 | One Year | Five Years | Since Inception
3/30/2012 |
| SmartETFs Dividend Builder ETF - NAV | 23.60% | 15.38% | 11.96% |
| SmartETFs Dividend Builder ETF - Market | 23.47% | 15.36% | 11.95% |
| MSCI World Index NR | 21.82% | 15.02% | 11.77% |
The SmartETFs Dividend Builder ETF acquired the assets and liabilities of the predecessor mutual fund, the Guinness Atkinson Dividend Builder Fund, on March 26, 2021. As a result of the transaction, the Fund adopted the accounting and performance history of its predecessor mutual fund Performance results shown prior to March 26, 2021, reflect the performance of the predecessor mutual fund. The Market Price returns shown prior to March 26, 2021 reflects the predecessor mutual fund's NAV.
The performance data quoted represents past performance and past performance is not a guarantee of future results. The investment return and principal value of an investment will fluctuate so that an investor's shares, when redeemed, may be worth more or less than their original cost. Current performance of theFund may be lower or higher than the performance quoted. Performance data current to the most recent month end may be obtained by visiting www.smartetfs.com.
Total returns reflect the reinvestment of distributions made by the Fund, if any. The deduction of taxes that a shareholder would pay on Fund distribution or the redemption of Fund shares is not reflected in the total returns.
The Fund's shares are listed on an exchange. The price of the Fund's shares is based on market price, and because the exchange-traded fund shares trade at market prices rather and net asset value, shares may trade at a price greater than net asset value (premium) or less than net asset value (discount).
The MSCI World Index is a free float-adjusted market capitalization weighted index that is designed to measure the equity market performance of developed markets. Net Return reflects deduction for withholding tax but reflects no deduction for fees and expenses. Net Return is net of local withholding taxes that any investor would pay.
SmartETFs Dividend Builder ETF
Schedule of Investments
at December 31, 2021
| Shares | | | Common Stocks: 99.8% | | Value ($) | |
| | | | | Australia: 3.1% | | | | |
| | 22,314 | | | Sonic Healthcare Ltd. | | $ | 756,341 | |
| | | | | | | | | |
| | | | | Denmark: 4.0% | | | | |
| | 8,627 | | | Novo Nordisk A/S | | | 969,978 | |
| | | | | | | | | |
| | | | | France: 5.4% | | | | |
| | 8,600 | | | Danone SA | | | 534,144 | |
| | 4,019 | | | Schneider Electric SE | | | 788,594 | |
| | | | | | | | 1,322,738 | |
| | | | | Germany: 4.3% | | | | |
| | 3,693 | | | Deutsche Boerse AG | | | 618,072 | |
| | 5,364 | | | Henkel AG & Company KGaA | | | 434,160 | |
| | | | | | | | 1,052,232 | |
| | | | | Ireland: 2.1% | | | | |
| | 5,112 | | | Medtronic PLC | | | 528,836 | |
| | | | | | | | | |
| | | | | Switzerland: 9.2% | | | | |
| | 19,404 | | | ABB Ltd. | | | 742,421 | |
| | 5,355 | | | Nestle SA | | | 748,168 | |
| | 1,838 | | | Roche Holding AG | | | 763,894 | |
| | | | | | | | 2,254,483 | |
| | | | | Taiwan: 2.6% | | | | |
| | 5,241 | | | Taiwan Semiconductor Manufacturing Co., Ltd. | | | 630,545 | |
| | | | | | | | | |
| | | | | United Kingdom: 15.5% | | | | |
| | 87,149 | | | BAE Systems PLC | | | 648,188 | |
| | 15,251 | | | British American Tobacco PLC | | | 563,963 | |
| | 14,265 | | | Diageo PLC | | | 778,855 | |
| | 29,126 | | | Imperial Tobacco Group PLC | | | 636,928 | |
| | 6,733 | | | Reckitt Benckiser Group PLC | | | 577,655 | |
| | 10,836 | | | Unilever PLC | | | 578,368 | |
| | | | | | | | 3,783,957 | |
| | | | | United States: 53.6% | | | | |
| | 5,793 | | | AbbVie Inc. | | | 784,372 | |
| | 11,520 | | | Aflac Inc. | | | 672,653 | |
| | 4,779 | | | Arthur J Gallagher & Co. | | | 810,853 | |
| | 820 | | | BlackRock Inc. | | | 750,759 | |
| | 1,281 | | | Broadcom Inc. | | | 852,390 | |
| | 11,910 | | | Cisco Systems Inc. | | | 754,737 | |
| | 2,925 | | | CME Group Inc. | | | 668,245 | |
| | 4,346 | | | Eaton Corp. PLC | | | 751,076 | |
| | 2,709 | | | Illinois Tool Works Inc. | | | 668,581 | |
| | 3,679 | | | Johnson & Johnson | | | 629,367 | |
| | 2,431 | | | Microsoft Corp. | | | 817,594 | |
| | 8,873 | | | Otis Worldwide Corp. | | | 772,572 | |
The accompanying notes are an integral part of these financial statements.
SmartETFs Dividend Builder ETF
Schedule of Investments
at December 31, 2021
| Shares | | | | | Value ($) | |
| | | | | Common Stocks (Continued) | | | | |
| | | | | United States (Continued) | | | | |
| | 6,081 | | | Paychex Inc. | | $ | 830,056 | |
| | 4,265 | | | PepsiCo Inc. | | | 740,873 | |
| | 4,484 | | | Procter & Gamble Co/The | | | 733,493 | |
| | 7,603 | | | Raytheon Techologies Corp. | | | 654,314 | |
| | 3,549 | | | Texas Instruments Inc. | | | 668,880 | |
| | 7,520 | | | VF Corp. | | | 550,614 | |
| | | | | | | | 13,111,429 | |
| | | | | | | | | |
| | | | | Total Common Stocks (Cost $17,001,345) | | | 24,410,539 | |
| | | | | | | | | |
| | | | | Total Investments in Securities (Cost $17,001,345): 99.8% | | | 24,410,539 | |
| | | | | Other Assets less Liabilities: 0.2% | | | 60,639 | |
| | | | | Net Assets: 100.0% | | $ | 24,471,178 | |
ADR - American Depository Receipt
PLC - Public Limited Company
The accompanying notes are an integral part of these financial statements.
SmartETFs Dividend Builder ETF
Schedule of Investments
at December 31, 2021
| Industry Breakdown | Percent of Total
Net Assets |
| Common Stocks | |
| Consumer, Non-cyclical | 47.0% |
| Technology | 18.6% |
| Industrial | 17.5% |
| Financial | 14.4% |
| Consumer, Cyclical | 2.3% |
| Total Investments | 99.8% |
| Other Assets in Excess of Liabilities | 0.2% |
| Total Net Assets | 100.0% |
The accompanying notes are an integral part of these financial statements.
SmartETFs
STATEMENTS OF ASSETS AND LIABILITIES
at December 31, 2021
| | | Smart Transportation & Technology ETF | | | Advertising & Marketing Technology ETF | | | Sustainable Energy II ETF | |
| Assets: | | | | | | | | | | | | |
| Investments in securities, at cost | | $ | 13,150,361 | | | $ | 2,558,350 | | | $ | 5,538,510 | |
| Investments in securities, at value | | $ | 16,353,987 | | | $ | 2,680,364 | | | $ | 5,700,048 | |
| Cash | | | 250,916 | | | | 68,023 | | | | 297,053 | |
| Foreign currency, at value | | | | | | | | | | | | |
| (Cost $34,351, $0, and $0, respectively) | | | 34,563 | | | | - | | | | - | |
| Receivables: | | | | | | | | | | | | |
| Dividends receivable | | | 19,774 | | | | 426 | | | | 3,802 | |
| Tax reclaim | | | 3,727 | | | | 52 | | | | 1,910 | |
| Due from Advisor, net | | | - | | | | 14,359 | | | | 5,853 | |
| Total Assets | | $ | 16,662,967 | | | $ | 2,763,224 | | | $ | 6,008,666 | |
| | | | | | | | | | | | | |
| Liabilities: | | | | | | | | | | | | |
| Overdraft due to custodian bank | | | - | | | | - | | | | 8,430 | |
| Payable for securities purchased | | | 34,562 | | | | - | | | | - | |
| Due to Advisor, net | | | 5,320 | | | | - | | | | - | |
| Custody fees and expenses | | | - | | | | 20,541 | | | | 26,099 | |
| Transfer agent fees and expenses | | | - | | | | 14,841 | | | | 12,618 | |
| Fund Accounting expense | | | - | | | | 13,231 | | | | 19,608 | |
| Audit fees payable | | | 13,000 | | | | 13,000 | | | | 13,000 | |
| Printing | | | - | | | | 3,700 | | | | 987 | |
| Legal fees payable | | | 501 | | | | 1,720 | | | | 434 | |
| CCO fees payable | | | 746 | | | | 675 | | | | 215 | |
| Trustee’s fees payable | | | 431 | | | | 201 | | | | 176 | |
| Fund Administration fees | | | - | | | | 106 | | | | 260 | |
| Other accrued payable | | | - | | | | 1,579 | | | | 322 | |
| Total Liabilities | | | 54,560 | | | | 69,594 | | | | 82,149 | |
| | | | | | | | | | | | | |
| Net Assets | | $ | 16,608,407 | | | $ | 2,693,630 | | | $ | 5,926,517 | |
| | | | | | | | | | | | | |
| Composition of Net Assets: | | | | | | | | | | | | |
| Paid-in capital | | $ | 13,324,162 | | | $ | 2,574,416 | | | $ | 5,787,554 | |
| Total distributable earnings | | | 3,284,245 | | | | 119,214 | | | | 138,963 | |
| Net Assets | | $ | 16,608,407 | | | $ | 2,693,630 | | | $ | 5,926,517 | |
| | | | | | | | | | | | | |
| Number of shares issued and outstanding | | | | | | | | | | | | |
| (unlimited number of shares authorized, no par value) | | | 350,002 | | | | 100,001 | | | | 180,000 | |
| Net Asset Value, Offering and Redemption Price Per Share | | $ | 47.45 | | | $ | 26.94 | | | $ | 32.93 | |
The accompanying notes are an integral part of these financial statements.
SmartETFs
STATEMENTS OF ASSETS AND LIABILITIES
at December 31, 2021
| | | Asia Pacific Dividend
Builder ETF | | | Dividend Builder ETF | |
| Assets: | | | | | | | | |
| Investments in securities, at cost | | $ | 2,984,212 | | | $ | 17,001,345 | |
| Investments in securities, at value | | $ | 4,199,792 | | | $ | 24,410,539 | |
| Cash | | | 62,417 | | | | 26,323 | |
| Foreign currency, at value (Cost $8,144 and $0) | | | 8,199 | | | | - | |
| Receivables: | | | | | | | | |
| Dividends receivable | | | 15,337 | | | | 53,785 | |
| Tax reclaim | | | - | | | | 40,531 | |
| Due from Advisor, net | | | 7,122 | | | | - | |
| Total Assets | | $ | 4,292,867 | | | $ | 24,531,178 | |
| | | | | | | | | |
| Liabilities: | | | | | | | | |
| Deferred foreign tax liability | | | 14,423 | | | | - | |
| Due to Advisor, net | | | - | | | | 747 | |
| Custody fees and expenses | | | 21,940 | | | | 20,028 | |
| Audit fees payable | | | 13,000 | | | | 13,000 | |
| Transfer agent fees and expenses | | | 12,476 | | | | 12,180 | |
| Fund Accounting expense | | | 8,953 | | | | 9,706 | |
| Legal fees payable | | | 515 | | | | 617 | |
| CCO fees payable | | | 471 | | | | 985 | |
| Printing | | | 453 | | | | 1,046 | |
| Fund Administration fees | | | 395 | | | | 1,083 | |
| Trustee’s fees payable | | | 289 | | | | 344 | |
| Other accrued payable | | | 1,487 | | | | 264 | |
| Total Liabilities | | | 74,402 | | | | 60,000 | |
| | | | | | | | | |
| Net Assets | | $ | 4,218,465 | | | $ | 24,471,178 | |
| | | | | | | | | |
| Composition of Net Assets: | | | | | | | | |
| Paid-in capital | | $ | 3,043,520 | | | $ | 17,059,896 | |
| Total distributable earnings | | | 1,174,945 | | | | 7,411,282 | |
| Net Assets | | $ | 4,218,465 | | | $ | 24,471,178 | |
| | | | | | | | | |
| Number of shares issued and outstanding | | | | | | | | |
| (unlimited number of shares authorized, no par value) | | | 257,305 | | | | 909,899 | |
| Net Asset Value, Offering and Redemption Price Per Share | | $ | 16.39 | | | $ | 26.89 | |
The accompanying notes are an integral part of these financial statements.
SmartETFs
STATEMENTS OF OPERATIONS
For the year ended December 31, 2021
| | | Smart Transportation & Technology ETF | | | Advertising & Marketing Technology ETF | | | Sustainable Energy II ETF | |
| Investment Income: | | | | | | | | | | | | |
| Dividends* | | $ | 250,433 | | | $ | 2,027 | | | $ | 52,009 | |
| Total income | | | 250,433 | | | | 2,027 | | | | 52,009 | |
| | | | | | | | | | | | | |
| Expenses: | | | | | | | | | | | | |
| Advisory fees | | | 97,432 | | | | 18,349 | | | | 38,021 | |
| Custody fees and expenses | | | - | | | | 20,425 | | | | 24,467 | |
| Transfer agent fees and expenses | | | - | | | | 14,725 | | | | 10,986 | |
| Printing | | | - | | | | 14,274 | | | | 8,495 | |
| Legal fees | | | 3,240 | | | | 13,079 | | | | 3,027 | |
| Audit fees | | | 13,000 | | | | 13,000 | | | | 13,000 | |
| Fund Accounting expense | | | - | | | | 13,116 | | | | 17,976 | |
| Listing fees | | | - | | | | 10,000 | | | | 5,000 | |
| CCO fees and expenses | | | 7,142 | | | | 5,576 | | | | 5,834 | |
| Trustees’ fees and expenses | | | 5,172 | | | | 4,105 | | | | 4,377 | |
| Miscellaneous | | | - | | | | 4,466 | | | | 3,294 | |
| Fund Administration expense | | | - | | | | 1,204 | | | | 2,203 | |
| Insurance | | | - | | | | 84 | | | | 70 | |
| Total expenses | | | 125,986 | | | | 132,403 | | | | 136,750 | |
| Less: fees waived and expenses absorbed | | | (28,558 | ) | | | (114,055 | ) | | | (98,719 | ) |
| Net expenses | | | 97,428 | | | | 18,348 | | | | 38,031 | |
| Net Investment Income (Loss) | | | 153,005 | | | | (16,321 | ) | | | 13,978 | |
| | | | | | | | | | | | | |
| Realized and Unrealized Gain (Loss) on Investments and Foreign Currency | | | | | | | | | | | | |
| Net realized gain (loss) on: | | | | | | | | | | | | |
| Investments | | | 18,109 | | | | (2,792 | ) | | | 121,257 | |
| Foreign Currency | | | (1,664 | ) | | | (198 | ) | | | 2,186 | |
| | | | 16,445 | | | | (2,990 | ) | | | 123,443 | |
| Net change in unrealized appreciation (depreciation) on: | | | | | | | | | | | | |
| Investments | | | 1,505,444 | | | | 122,077 | | | | 67,051 | |
| Foreign Currency | | | (121 | ) | | | (3 | ) | | | (104 | ) |
| | | | 1,505,323 | | | | 122,074 | | | | 66,947 | |
| Net realized and unrealized gain on investments and foreign currency | | | 1,521,768 | | | | 119,084 | | | | 190,390 | |
| | | | | | | | | | | | | |
| Net Increase in Net Assets Resulting from Operations | | $ | 1,674,773 | | | $ | 102,763 | | | $ | 204,368 | |
| * | Net of foreign taxes withheld of $19,633, $207 and $6,193, respectively. |
The accompanying notes are an integral part of these financial statements.
SmartETFs
STATEMENTS OF OPERATIONS
For the year ended December 31, 2021
| | | Asia Pacific
Dividend Builder
ETF^ | | | Dividend Builder
ETF^ | |
| Investment Income: | | | | | | | | |
| Dividends* | | $ | 159,033 | | | $ | 666,398 | |
| Total income | | | 159,033 | | | | 666,398 | |
| | | | | | | | | |
| Expenses: | | | | | | | | |
| Advisory fees | | | 36,674 | | | | 115,354 | |
| Custody fees and expenses | | | 33,208 | | | | 20,822 | |
| Transfer agent fees and expenses | | | 16,563 | | | | 18,908 | |
| Audit fees | | | 13,000 | | | | 13,000 | |
| Fund Accounting expense | | | 12,768 | | | | 14,573 | |
| Listing fees | | | 10,000 | | | | 10,000 | |
| Registration expense | | | 9,385 | | | | 8,878 | |
| Printing | | | 9,252 | | | | 10,762 | |
| CCO fees and expenses | | | 5,389 | | | | 8,663 | |
| Shareholder Servicing fees | | | 4,044 | | | | 12,183 | |
| Legal fees | | | 3,429 | | | | 12,173 | |
| Trustees' fees and expenses | | | 3,319 | | | | 5,940 | |
| Fund Administration expense | | | 1,799 | | | | 11,154 | |
| Miscellaneous | | | 1,425 | | | | 1,163 | |
| Insurance | | | 331 | | | | 1,683 | |
| Interest expense | | | 168 | | | | 525 | |
| Total expenses | | | 160,754 | | | | 265,781 | |
| Less: fees waived and expenses absorbed | | | (121,828 | ) | | | (96,939 | ) |
| Net expenses | | | 38,926 | | | | 168,842 | |
| Net Investment Income | | | 120,107 | | | | 497,556 | |
| | | | | | | | | |
| Realized and Unrealized Gain (Loss) on Investments and Foreign Currency | | | | | | | | |
| Net realized gain (loss) on: | | | | | | | | |
| Investments | | | 393,918 | | | | 2,839,400 | |
| Deferred foreign taxes | | | (10,524 | ) | | | - | |
| Foreign Currency | | | (3,680 | ) | | | (9,242 | ) |
| | | | 379,714 | | | | 2,830,158 | |
| Net change in unrealized appreciation (depreciation) on: | | | | | | | | |
| Investments | | | (48,020 | ) | | | 1,955,769 | |
| Deferred foreign taxes | | | (8,390 | ) | | | - | |
| Foreign Currency | | | (38 | ) | | | (650 | ) |
| | | | (56,448 | ) | | | 1,955,119 | |
| Net realized and unrealized gain on investments and foreign currency | | | 323,266 | | | | 4,785,277 | |
| | | | | | | | | |
| Net Increase in Net Assets Resulting from Operations | | $ | 443,373 | | | $ | 5,282,833 | |
| * | Net of foreign taxes withheld of $15,448 and $23,955, respectively. |
| ^ | The Funds adopted the accounting history of its predecessor mutual fund. The above financial information include those of the predecessor mutual fund. |
The accompanying notes are an integral part of these financial statements.
SmartETFs
STATEMENTS OF CHANGES IN NET ASSETS
| | | Smart Transportation & Technology ETF | |
| | | Year Ended | | | Year Ended | |
| | | December 31, 2021 | | | December 31, 2020 | |
| INCREASE IN NET ASSETS FROM: | | | | | | | | |
| Operations: | | | | | | | | |
| Net Investment income | | $ | 153,005 | | | $ | 11,379 | |
| Net realized gain on investments and foreign currency | | | 16,445 | | | | 119,374 | |
| Net change in unrealized appreciation on investments and foreign currency | | | 1,505,323 | | | | 1,555,579 | |
| Net Increase in Net Assets Resulting from Operations | | | 1,674,773 | | | | 1,686,332 | |
| | | | | | | | | |
| Distributions to Shareholders: | | | (91,000 | ) | | | (165,407 | ) |
| | | | | | | | | |
| Capital Transactions: | | | | | | | | |
| Proceeds from shares sold | | | 7,889,267 | | | | 3,573,560 | |
| Transaction fees (Note 4) | | | 5,547 | | | | 1,687 | |
| Cost of shares redeemed | | | - | | | | (602,143 | ) |
| Net Increase in Net Assets from Capital Transactions | | | 7,894,814 | | | | 2,973,104 | |
| | | | | | | | | |
| Total Increase in Net Assets | | | 9,478,587 | | | | 4,494,029 | |
| | | | | | | | | |
| Net Assets: | | | | | | | | |
| Beginning of period | | | 7,129,820 | | | | 2,635,791 | |
| End of period | | $ | 16,608,407 | | | $ | 7,129,820 | |
| | | | | | | | | |
| Capital Share Activity: | | | | | | | | |
| Shares sold | | | 175,000 | | | | 100,000 | |
| Shares redeemed | | | - | | | | (25,000 | ) |
| Net Increase in Share Transactions | | | 175,000 | | | | 75,000 | |
The accompanying notes are an integral part of these financial statements.
SmartETFs
STATEMENTS OF CHANGES IN NET ASSETS
| | | Advertising & Marketing | | | Sustainable | |
| | | Technology ETF | | | Energy II ETF | |
| | | | | | | | | | | | | | | | | |
| | | Year Ended
December 31, 2021 | | | For the period
December 31, 2020*
to December 31, 2020 | | | Year Ended
December 31, 2021 | | | For the period
November 11, 2020*
to December 31, 2020 | |
| INCREASE/(DECREASE) IN NET ASSETS FROM: | | | | | | | | | | | | | | | | |
| Operations: | | | | | | | | | | | | | | | | |
| Net Investment income (loss) | | $ | (16,321 | ) | | $ | (5 | ) | | $ | 13,978 | | | $ | (108 | ) |
| Net realized gain (loss) on investments and foreign currency | | | (2,990 | ) | | | - | | | | 123,443 | | | | (3,170 | ) |
| Net change in unrealized appreciation (depreciation) on investments and foreign currency | | | 122,074 | | | | (63 | ) | | | 66,947 | | | | 94,473 | |
| Net Increase (Decrease) in Net Assets Resulting from Operations | | | 102,763 | | | | (68 | ) | | | 204,368 | | | | 91,195 | |
| | | | | | | | | | | | | | | | | |
| Distributions to Shareholders: | | | - | | | | - | | | | (156,600 | ) | | | - | |
| | | | | | | | | | | | | | | | | |
| Capital Transactions: | | | | | | | | | | | | | | | | |
| Proceeds from shares sold | | | 2,338,370 | | | | 252,565 | | | | 4,974,083 | | | | 813,652 | |
| Transaction fees (Note 4) | | | - | | | | - | | | | (242 | ) | | | 61 | |
| Net Increase in Net Assets from Capital Transactions | | | 2,338,370 | | | | 252,565 | | | | 4,973,841 | | | | 813,713 | |
| | | | | | | | | | | | | | | | | |
| Total Increase in Net Assets | | | 2,441,133 | | | | 252,497 | | | | 5,021,609 | | | | 904,908 | |
| | | | | | | | | | | | | | | | | |
| Net Assets: | | | | | | | | | | | | | | | | |
| Beginning of period | | | 252,497 | | | | - | | | | 904,908 | | | | - | |
| End of period | | $ | 2,693,630 | | | $ | 252,497 | | | $ | 5,926,517 | | | $ | 904,908 | |
| | | | | | | | | | | | | | | | | |
| Capital Share Activity: | | | | | | | | | | | | | | | | |
| Shares sold | | | 90,000 | | | | 10,001 | | | | 150,000 | | | | 30,000 | |
| Net Increase in Share Transactions | | | 90,000 | | | | 10,001 | | | | 150,000 | | | | 30,000 | |
| * | Commencement of operations. |
The accompanying notes are an integral part of these financial statements.
SmartETFs
STATEMENTS OF CHANGES IN NET ASSETS
| | | Asia Pacific Dividend Builder ETF | | | Dividend Builder ETF | |
| | | Year Ended | | | Year Ended | |
| | | December 31, 2021^ | | | December 31, 2020 | | | December 31, 2021^ | | | December 31, 2020 | |
| INCREASE/(DECREASE) IN NET ASSETS FROM: | | | | | | | | | | | | | | | | |
| Operations: | | | | | | | | | | | | | | | | |
| Net Investment income | | $ | 120,107 | | | $ | 218,924 | | | $ | 497,556 | | | $ | 367,974 | |
| Net realized gain (loss) on investments and foreign currency | | | 379,714 | | | | 2,728,630 | | | | 2,830,158 | | | | (437,854 | ) |
| Net change in unrealized appreciation (depreciation) on investments, deferred foreign taxes, and foreign currency | | | (56,448 | ) | | | 830,540 | | | | 1,955,119 | | | | 2,455,926 | |
| Net Increase in Net Assets Resulting from Operations | | | 443,373 | | | | 3,778,094 | | | | 5,282,833 | | | | 2,386,046 | |
| | | | | | | | | | | | | | | | | |
| Distributions to Shareholders: | | | (598,780 | ) | | | (488,673 | ) | | | (1,151,828 | ) | | | (348,995 | ) |
| | | | | | | | | | | | | | | | | |
| Capital Transactions: | | | | | | | | | | | | | | | | |
| Proceeds from shares sold | | | 453,040 | | | | 13,768,044 | | | | 5,627,119 | | | | 11,029,359 | |
| Reinvestment of distributions | | | 11,729 | | | | 478,955 | | | | 139,178 | | | | 347,728 | |
| Transaction fees (Note 4) | | | 779 | | | | - | | | | - | | | | - | |
| Cost of shares redeemed | | | (265,942 | ) | | | (18,075,853 | ) | | | (7,481,140 | ) | | | (4,303,026 | ) |
| Net Increase (Decrease) in Net Assets from Capital Transactions | | | 199,606 | | | | (3,828,854 | ) | | | (1,714,843 | ) | | | 7,074,061 | |
| | | | | | | | | | | | | | | | | |
| Total Increase (Decrease) in Net Assets | | | 44,199 | | | | (539,433 | ) | | | 2,416,162 | | | | 9,111,112 | |
| | | | | | | | | | | | | | | | | |
| Net Assets: | | | | | | | | | | | | | | | | |
| Beginning of period | | | 4,174,266 | | | | 4,713,699 | | | | 22,055,016 | | | | 12,943,904 | |
| End of period | | $ | 4,218,465 | | | $ | 4,174,266 | | | $ | 24,471,178 | | | $ | 22,055,016 | |
| | | | | | | | | | | | | | | | | |
| Capital Share Activity: | | | | | | | | | | | | | | | | |
| Shares sold | | | 24,540 | | | | 1,122,616 | | | | 241,629 | | | | 549,958 | |
| Shares issued on reinvestment | | | 634 | | | | 30,188 | | | | 5,961 | | | | 18,098 | |
| Shares redeemed | | | (14,581 | ) | | | (1,190,438 | ) | | | (306,086 | ) | | | (223,646 | ) |
| Net Increase (Decrease) in Share Transactions | | | 10,593 | | | | (37,634 | ) | | | (58,496 | ) | | | 344,410 | |
| ^ | Prior to March 27, 2021, the Funds were operating as a traditional open-end mutual fund. |
The accompanying notes are an integral part of these financial statements.
SmartETFs Smart Transportation & Technology ETF
FINANCIAL HIGHLIGHTS
For a capital share outstanding throughout each period.
| | | | | | | | | For the Period | |
| | | Year Ended | | | November 14, 2019* | |
| | | December 31, 2021 | | | December 31, 2020 | | | to December 31, 2019 | |
| Net asset value, beginning of period | | $ | 40.74 | | | $ | 26.36 | | | $ | 25.00 | |
| | | | | | | | | | | | | |
| Investment operations: | | | | | | | | | | | | |
| Net investment income | | | 0.44 | | | | 0.06 | | | | 0.02 | |
| Net realized and unrealized gain on investments | | | 6.53 | | | | 15.42 | | | | 1.34 | |
| Total from investment operations | | | 6.97 | | | | 15.48 | | | | 1.36 | |
| | | | | | | | | | | | | |
| Distributions to Shareholders from: | | | | | | | | | | | | |
| Net investment income | | | (0.22 | ) | | | (0.08 | ) | | | - | |
| Realized gain | | | (0.04 | ) | | | (1.02 | ) | | | - | |
| Total distributions | | | (0.26 | ) | | | (1.10 | ) | | | - | |
| | | | | | | | | | | | | |
| Net asset value, end of period | | $ | 47.45 | | | $ | 40.74 | | | $ | 26.36 | |
| | | | | | | | | | | | | |
| Total return | | | 17.12 | % | | | 59.08 | % | | | 5.43 | %(1) |
| | | | | | | | | | | | | |
| Ratios/Supplemental Data: | | | | | | | | | | | | |
| Net assets, end of period (millions) | | $ | 16.6 | | | $ | 7.1 | | | $ | 2.6 | |
| | | | | | | | | | | | | |
| Ratio of expenses to average net assets: | | | | | | | | | | | | |
| Before fee waived | | | 0.88 | % | | | 1.51 | % | | | 3.87 | %(2) |
| After fees waived | | | 0.68 | % | | | 0.68 | % | | | 0.68 | %(2) |
| | | | | | | | | | | | | |
| Ratio of net investment income (loss) to average net assets: | | | | | | | | | | | | |
| Before fees waived | | | 0.87 | % | | | (0.45 | %) | | | (2.44 | %)(2) |
| After fees waived | | | 1.07 | % | | | 0.38 | % | | | 0.75 | %(2) |
| | | | | | | | | | | | | |
| Portfolio turnover rate (3) | | | 12.20 | % | | | 16.10 | % | | | 0.00 | %(1) |
| * | Commencement of operations. |
| (3) | Portfolio turnover rate excludes securities received or delivered from in-kind processing of creations or redemptions. |
The accompanying notes are an integral part of these financial statements.
SmartETFs Advertising & Marketing Technology ETF
FINANCIAL HIGHLIGHTS
For a capital share outstanding throughout the period.
| | | Year Ended
December 31, 2021 | | | For the Period
December 31, 2020*
to December 31, 2020 | |
| Net asset value, beginning of period | | $ | 25.25 | | | $ | 25.25 | |
| | | | | | | | | |
| Investment operations: | | | | | | | | |
| Net investment income (loss) | | | (0.16 | ) | | | - | |
| Net realized and unrealized gain on investments | | | 1.85 | | | | - | |
| Total from investment operations | | | 1.69 | | | | - | |
| | | | | | | | | |
| Net asset value, end of period | | $ | 26.94 | | | $ | 25.25 | |
| | | | | | | | | |
| Total return | | | 6.69 | % | | | 0.00 | %(1) |
| | | | | | | | | |
| Ratios/Supplemental Data: | | | | | | | | |
| Net assets, end of period (in thousands) | | $ | 2,694 | | | $ | 252 | |
| | | | | | | | | |
| Ratio of expenses to average net assets: | | | | | | | | |
| Before fee waived | | | 4.90 | % | | | 810.45 | %(2) |
| After fees waived | | | 0.68 | % | | | 0.68 | %(2) |
| | | | | | | | | |
| Ratio of net investment income (loss) to average net assets: | | | | | | | | |
| Before fees waived | | | (4.82 | %) | | | (810.45 | %)(2) |
| After fees waived | | | (0.60 | %) | | | 0.68 | %(2) |
| | | | | | | | | |
| Portfolio turnover rate (3) | | | 21.14 | % | | | 0.00 | %(1) |
| * | Commencement of operations. |
| (3) | Portfolio turnover rate excludes securities received or delivered from in-kind processing of creations or redemptions. |
The accompanying notes are an integral part of these financial statements.
SmartETFs Sustainable Energy II ETF
FINANCIAL HIGHLIGHTS
For a capital share outstanding throughout the period.
| | | Year Ended
December 31, 2021 | | | For the Period
November 11, 2020*
to December 31, 2020 | |
| Net asset value, beginning of period | | $ | 30.16 | | | $ | 25.48 | |
| | | | | | | | | |
| Investment operations: | | | | | | | | |
| Net investment income (loss) | | | 0.08 | | | | (0.01 | ) |
| Net realized and unrealized gain on investments | | | 3.56 | | | | 4.69 | |
| Total from investment operations | | | 3.64 | | | | 4.68 | |
| | | | | | | | | |
| Distributions to Shareholders from: | | | | | | | | |
| Net investment income | | | (0.09 | ) | | | - | |
| Realized gain | | | (0.78 | ) | | | - | |
| Total distributions | | | (0.87 | ) | | | - | |
| | | | | | | | | |
| Net asset value, end of period | | $ | 32.93 | | | $ | 30.16 | |
| | | | | | | | | |
| Total return | | | 12.11 | % | | | 18.37 | %(1) |
| | | | | | | | | |
| Ratios/Supplemental Data: | | | | | | | | |
| Net assets, end of period (in thousands) | | $ | 5,927 | | | $ | 905 | |
| | | | | | | | | |
| Ratio of expenses to average net assets: | | | | | | | | |
| Before fee waived | | | 2.84 | % | | | 30.82 | %(2) |
| After fees waived | | | 0.79 | % | | | 0.78 | %(2) |
| | | | | | | | | |
| Ratio of net investment income (loss) to average net assets: | | | | | | | | |
| Before fees waived | | | (1.76 | %) | | | (30.22 | %)(2) |
| After fees waived | | | 0.29 | % | | | (0.18 | %)(2) |
| | | | | | | | | |
| Portfolio turnover rate (3) | | | 24.21 | % | | | 4.55 | %(1) |
| * | Commencement of operations. |
| (3) | Portfolio turnover rate excludes securities received or delivered from in-kind processing of creations or redemptions. |
The accompanying notes are an integral part of these financial statements.
SmartETFs Asia Pacific Dividend Builder ETF
FINANCIAL HIGHLIGHTS
For a capital share outstanding throughout each period.
| | | Year Ended December 31, | |
| | | 2021 | | | 2020 | | | 2019 | | | 2018 | | | 2017 | |
| Net asset value, beginning of period | | $ | 16.92 | | | $ | 16.58 | | | $ | 14.22 | | | $ | 17.85 | | | $ | 13.43 | |
| | | | | | | | | | | | | | | | | | | | | |
| Investment operations: | | | | | | | | | | | | | | | | | | | | |
| Net investment income | | | 0.96 | | | | 0.37 | | | | 0.51 | | | | 0.49 | | | | 0.40 | |
| Net realized and unrealized gain (loss) on investments and foreign currency | | | 0.84 | | | | 1.84 | | | | 2.35 | | | | (3.36 | ) | | | 4.47 | |
| Total from investment operations | | | 1.80 | | | | 2.21 | | | | 2.86 | | | | (2.87 | ) | | | 4.87 | |
| | | | | | | | | | | | | | | | | | | | | |
| Distributions to Shareholders from: | | | | | | | | | | | | | | | | | | | | |
| Net investment income | | | (0.89 | ) | | | (0.38 | ) | | | (0.50 | ) | | | (0.77 | ) | | | (0.46 | ) |
| Realized gain | | | (1.44 | ) | | | (1.49 | ) | | | - | | | | - | | | | - | |
| Total distributions | | | (2.33 | ) | | | (1.87 | ) | | | (0.50 | ) | | | (0.77 | ) | | | (0.46 | ) |
| | | | | | | | | | | | | | | | | | | | | |
| Redemption fee proceeds | | | - | | | | - | | | | - | (1) | | | 0.01 | | | | 0.01 | |
| | | | | | | | | | | | | | | | | | | | | |
| Net asset value, end of period | | $ | 16.39 | | | $ | 16.92 | | | $ | 16.58 | | | $ | 14.22 | | | $ | 17.85 | |
| | | | | | | | | | | | | | | | | | | | | |
| Total return | | | 11.27 | % | | | 13.90 | % | | | 20.33 | % | | | (16.42 | %) | | | 36.70 | % |
| | | | | | | | | | | | | | | | | | | | | |
| Ratios/Supplemental Data: | | | | | | | | | | | | | | | | | | | | |
| Net assets, end of period (millions) | | $ | 4.2 | | | $ | 4.2 | | | $ | 4.7 | | | $ | 4.2 | | | $ | 7.6 | |
| | | | | | | | | | | | | | | | | | | | | |
| Ratio of expenses to average net assets: | | | | | | | | | | | | | | | | | | | | |
| Before fee waived | | | 3.55 | % | | | 3.00 | % | | | 4.02 | % | | | 3.27 | % | | | 3.48 | % |
| After fees waived(2) | | | 0.86 | % | | | 1.11 | %(3) | | | 1.10 | % | | | 1.12 | %(3) | | | 1.12 | %(3) |
| | | | | | | | | | | | | | | | | | | | | |
| Ratio of net investment income (loss) to average net assets: | | | | | | | | | | | | | | | | | | | | |
| Before fees waived | | | (0.04 | %) | | | 0.98 | % | | | 0.34 | % | | | 0.89 | % | | | 0.20 | % |
| After fees waived | | | 2.65 | % | | | 2.87 | % | | | 3.26 | % | | | 3.04 | % | | | 2.56 | % |
| | | | | | | | | | | | | | | | | | | | | |
| Portfolio turnover rate (4) | | | 27.21 | % | | | 217.65 | % | | | 32.99 | % | | | 23.38 | % | | | 47.32 | % |
| (1) | Amount represents less than $0.01 per share. |
| (2) | The Advisor has contractually agreed to limit the operating expenses of the Fund to 0.78%, excluding interests expenses, expenses related to dividends on short positions, brokerage commissions, taxes and other extraordinary expenses. Includes financial information of the predecessor mutual fund for the period prior to March 27, 2021. The predecessor mutual fund's expense cap was 1.10%. See Note 7. |
| (3) | If interest expense had been excluded, expenses would have been lowered by 0.01%, 0.02%, 0.02% for the year ended December 31, 2020, 2018, and 2017, respectively. |
| (4) | Portfolio turnover rate excludes securities received or delivered from in-kind processing of creations or redemptions. |
The accompanying notes are an integral part of these financial statements.
SmartETFs Dividend Builder ETF
FINANCIAL HIGHLIGHTS
For a capital share outstanding throughout each period.
| | | Year Ended December 31, | |
| | | 2021 | | | 2020 | | | 2019 | | | 2018 | | | 2017 | |
| Net asset value, beginning of period | | $ | 22.77 | | | $ | 20.74 | | | $ | 16.91 | | | $ | 18.09 | | | $ | 15.28 | |
| | | | | | | | | | | | | | | | | | | | | |
| Investment operations: | | | | | | | | | | | | | | | | | | | | |
| Net investment income | | | 0.50 | | | | 0.45 | | | | 0.49 | | | | 0.44 | | | | 0.41 | |
| Net realized and unrealized gain (loss) on investments and foreign currency | | | 4.78 | | | | 2.00 | | | | 3.97 | | | | (1.77 | ) | | | 2.82 | |
| Total from investment operations | | | 5.28 | | | | 2.45 | | | | 4.46 | | | | (0.73 | ) | | | 3.23 | |
| | | | | | | | | | | | | | | | | | | | | |
| Distributions to Shareholders from: | | | | | | | | | | | | | | | | | | | | |
| Net investment income | | | (0.48 | ) | | | (0.42 | ) | | | (0.50 | ) | | | (0.45 | ) | | | (0.42 | ) |
| Realized gain | | | (0.68 | ) | | | - | (1) | | | (0.13 | ) | | | - | | | | - | |
| Total distributions | | | (1.16 | ) | | | (0.42 | ) | | | (0.63 | ) | | | (0.45 | ) | | | (0.42 | ) |
| | | | | | | | | | | | | | | | | | | | | |
| Net asset value, end of period | | $ | 26.89 | | | $ | 22.77 | | | $ | 20.74 | | | $ | 16.91 | | | $ | 18.09 | |
| | | | | | | | | | | | | | | | | | | | | |
| Total return | | | 23.60 | % | | | 12.26 | % | | | 26.71 | % | | | (4.14 | %) | | | 21.34 | % |
| | | | | | | | | | | | | | | | | | | | | |
| Ratios/Supplemental Data: | | | | | | | | | | | | | | | | | | | | |
| Net assets, end of period (millions) | | $ | 24.5 | | | $ | 22.1 | | | $ | 12.9 | | | $ | 8.5 | | | $ | 9.0 | |
| | | | | | | | | | | | | | | | | | | | | |
| Ratio of expenses to average net assets: | | | | | | | | | | | | | | | | | | | | |
| Before fee waived | | | 1.04 | % | | | 1.56 | % | | | 1.98 | % | | | 2.00 | % | | | 2.06 | % |
| After fees waived(2) | | | 0.66 | % | | | 0.68 | % | | | 0.68 | % | | | 0.68 | % | | | 0.68 | % |
| | | | | | | | | | | | | | | | | | | | | |
| Ratio of net investment income (loss) to average net assets: | | | | | | | | | | | | | | | | | | | | |
| Before fees waived | | | 1.56 | % | | | 1.43 | % | | | 1.30 | % | | | 1.12 | % | | | 1.07 | % |
| After fees waived | | | 1.94 | % | | | 2.31 | % | | | 2.60 | % | | | 2.44 | % | | | 2.45 | % |
| | | | | | | | | | | | | | | | | | | | | |
| Portfolio turnover rate (3) | | | 18.47 | % | | | 11.48 | % | | | 18.51 | % | | | 23.71 | % | | | 18.61 | % |
| (1) | Amount represents less than $0.01 per share. |
| (2) | The Advisor has contractually agreed to limit the operating expenses of the Fund to 0.65%, excluding interests expenses, expenses related to dividends on short positions, brokerage commissions, taxes and other extraordinary expenses. Includes financial information of the predecessor mutual fund for the period prior to March 27, 2021. The predecessor mutual fund’s expense cap was 0.68%. See Note 7. |
| (4) | Portfolio turnover rate excludes securities received or delivered from in-kind processing of creations or redemptions. |
The accompanying notes are an integral part of these financial statements.
NOTES TO FINANCIAL STATEMENTS
Note 1 - Organization
Guinness Atkinson™ Funds (the “Trust”), was organized on April 28, 1997 as a Delaware statutory trust and registered under the Investment Company Act of 1940, as amended (the “1940 Act”), as an open-end management investment company. The Trust comprises of twelve separate series portfolios, each of which has unique investment objectives and strategies. This report covers five series, which are operated as exchange-traded funds (“ETFs”): SmartETFs Smart Transportation & Technology ETF (“Smart Transportation & Technology ETF”), SmartETFs Advertising & Marketing Technology ETF (“Advertising & Marketing Technology ETF”), SmartETFs Sustainable Energy II ETF (“Sustainable Energy II ETF”), SmartETFs Asia Pacific Dividend Builder ETF (“Asia Pacific Dividend Builder ETF”) and SmartETFs Dividend Builder ETF (“Dividend Builder ETF”) (individually each a “Fund” or collectively the “Funds”). Each Fund is a diversified fund. The investment objective of the Smart Transportation & Technology ETF is long term capital appreciation from investments involved in the manufacture, development, distribution, and servicing of autonomous or electric vehicles. The investment objective of the Advertising & Marketing Technology ETF is long term capital appreciation by investing in publicly-traded equity securities of domestic and foreign companies across multiple sectors that are involved in the development, production or deployment of more targeted and/or more efficient advertising or marketing services. The investment objective of the Sustainable Energy ETF is long term capital appreciation by investing in equity securities of companies that provide or support alternative or renewable sources of energy. The investment objective of the Asia Pacific Dividend Builder ETF is to provide investors with dividend income and long-term capital growth. The investment objective of the Dividend Builder ETF is to seek a moderate level of current income and consistent dividend growth at rate that exceeds inflation. Smart Transportation & Technology ETF commenced operations on November 14, 2019. Advertising & Marketing Technology ETF commenced operations on December 31, 2020. Sustainable Energy II ETF commenced operations on November 11, 2020. The Asia Pacific Dividend Builder ETF and the Dividend Builder ETF commenced operations on March 27, 2021.
The reorganization was accomplished by the following tax-free exchange in which each shareholder of the Predecessor Mutual Funds received the same aggregate share net asset value in the corresponding share of the Successor Funds as noted below: The Asia Pacific Dividend Builder ETF and the Dividend Builder ETF (the “Successor Funds”) are the successor in interest to the Guinness Atkinson Asia Pacific Dividend Builder Fund and the Guinness Atkinson Dividend Builder Fund (the “Predecessor Mutual Funds”), respectively. Effective as of the close of business on March 26, 2021, the assets and liabilities of the Predecessor Mutual Funds were transferred to the Successor Funds in exchange for shares of the Successor Funds. For financial reporting purposes, assets received and shares issued by the Successor Funds were recorded at fair value; however the cost basis of the investments received from the Predecessor Mutual Funds are carried forward to align ongoing reporting of the Successor Funds’ realized and unrealized gains and losses with amounts distributable to shareholders for tax purposes. Costs incurred by the Successor Funds in connection with the reorganization were paid by the Guinness Atkinson Asset Management, Inc. (the “Adviser”).
| | | Shares Issued | | | Net Assets | |
| Asia Pacific Dividend Builder ETF | | | 237,305 | | | $ | 4,393,412 | |
| Dividend Builder ETF | | | 989,899 | | | $ | 23,436,263 | |
The net unrealized appreciation of investments transferred for the Asia Pacific Dividend Builder ETF was $1,360,232 and net unrealized appreciation of investments transferred for the Dividend Builder ETF was $5,962,821.
Note 2 - Significant Accounting Policies
The Funds are an investment company and accordingly follows the investment company accounting and reporting guidance of the Financial Accounting Standards Board (FASB) Accounting Standard Codification Topic 946 “Financial Services—Investment Companies”.
NOTES TO FINANCIAL STATEMENTS (Continued)
Securities Valuations. Securities of the Funds that are traded on a principal exchange (U.S. or foreign) or NASDAQ are valued at the official closing price on each day that the exchanges are open for trading. Securities traded on an exchange for which there have been no sales, and other over-the-counter securities are valued at the mean between the bid and asked prices. Securities for which quotations are not readily available are valued at their respective fair values as determined in good faith by the Funds’ Valuation Committee in accordance with procedures established by the Board of Trustees. Short term investments are stated at cost, combined with accrued interest, which approximates market value. Realized gains and losses from securities transactions are calculated using the identified cost method.
Foreign Currency Transactions. The accounting records of the Funds are maintained in U.S. dollars. Financial instruments and other assets and liabilities of the Funds denominated in a foreign currency, if any, are translated into U.S. dollars at current exchange rates. Purchases and sales of financial instruments, income receipts and expense payments are translated into U.S. dollars at the exchange rate on the date of the transaction. The Funds does not isolate that portion of the results of operations resulting from changes in foreign exchange rates from those resulting from changes in values to financial instruments. Such fluctuations are included with the net realized and unrealized gains or losses from investments. Realized foreign exchange gains or losses arise from transactions in financial instruments and foreign currencies, currency exchange fluctuations between the trade and settlement date of such transactions, and the difference between the amount of assets and liabilities recorded and the U.S. dollar equivalent of the amounts actually received or paid. Net unrealized foreign exchange gains and losses arise from changes in the value of assets and liabilities, including financial instruments, resulting from changes in currency exchange rates. The Funds may be subject to foreign taxes related to foreign income received, capital gains on the sale of securities and certain foreign currency transactions (a portion of which may be reclaimable). All foreign taxes are recorded in accordance with the applicable regulations and rates that exist in the foreign jurisdictions in which the Funds invests.
Illiquid Securities. Pursuant to Rule 22e-4 under the 1940 Act, the Funds have adopted a Liquidity Risk Management Program (“LRMP”) that requires, among other things, that each Fund limits its illiquid investments that are investments to no more than 15% of net assets. An illiquid investment is any security which may not reasonably be expected to be sold or disposed of in current market conditions in seven calendar days or less without the sale or disposition significantly changing the market value of the investment. If the Adviser, at any time determines that the value of illiquid securities held by a Fund exceeds 15% of its net asset value, the Adviser will take such steps as it considers appropriate to reduce them as soon as reasonably practicable in accordance with the Funds’ written LRMP.
Security Transactions, Dividend Income and Distributions. Security transactions are accounted for on the trade date. Realized gains and losses from securities transactions are calculated using the identified cost method.
Dividend income is recorded net of applicable withholding taxes on the ex-dividend date and interest income is recorded on an accrual basis. Withholding taxes on foreign dividends, if applicable, are paid (a portion of which may be reclaimable) or provided for in accordance with the applicable country’s tax rules and rates and are disclosed in the Statement of Operations. Withholding tax reclaims are filed in certain countries to recover a portion of the amounts previously withheld. The Funds record a reclaim receivable based on a number of factors, including a jurisdiction’s legal obligation to pay reclaims as well as payment history and market convention. The Funds may be subject to foreign taxation related to capital gains on the sale of securities in the foreign jurisdictions in which they invest. When a capital gain tax is determined to apply, the Funds record an estimated deferred tax liability in an amount that may be payable if securities were disposed of on the valuation date.
Allocation of Expenses. Each Fund is charged for those expenses directly attributable to it. Expenses that are not directly attributable to a Fund are allocated among the Funds in the Trust in proportion to their respective assets or another appropriate method.
NOTES TO FINANCIAL STATEMENTS (Continued)
Use of Estimates. The preparation of financial statements in conformity with U.S. accepted accounting principles (“GAAP”) requires management to make estimates and assumptions that affect the reported amounts of assets and liabilities and the disclosure of contingent assets and liabilities at the date of the financial statements. Actual results could differ from those estimates.
Reclassification of Capital Accounts. U.S. GAAP requires that certain components of net assets relating to permanent differences be reclassified between financial tax reporting. These reclassifications have no effect on net assets or NAV per share.
The permanent differences primarily relate to redemptions in-kind. For the period ended December 31, 2021, the following table shows the reclassifications made:
| | | Distributable Earnings | | | Paid-In Capital | |
| Smart Transportation & Technology ETF | | $ | 156 | | | $ | (156 | ) |
| Advertising & Marketing Technology ETF | | | 16,514 | | | | (16,514 | ) |
| Sustainable Energy II ETF | | | - | | | | - | |
| Asia Pacific Dividend Builder ETF | | | 26,716 | | | | (26,716 | ) |
| Dividend Builder ETF | | | (1,546,994 | ) | | | 1,546,994 | |
Federal Income Taxes. The Funds intend to comply with the requirements of Subchapter M of the Internal Revenue Code applicable to regulated investment companies and to distribute substantially all of its net investment income and any net realized gains to its shareholders. Therefore, no federal income tax or excise provision is required. Due to the timing of dividend distributions and the differences in accounting for income and realized gains and losses for financial statement and federal income tax purposes, the fiscal year in which amounts are distributed may differ from the year in which the income and realized gains and losses are recorded by the Funds.
Management of the Funds have evaluated tax positions taken or expected to be taken in the course of preparing the Funds’ tax returns to determine whether these positions meet a “more-likely-than-not” standard that, based on the technical merits, have a more than fifty percent likelihood of being sustained by a taxing authority upon examination. A tax position that meets the “more-likely-than-not” recognition threshold is measured to determine the amount of benefit to recognize in the financial statements. The Funds recognizes interest and penalties, if any, related to unrecognized tax benefits as income tax expense in the Statements of Operations. The Income Tax Statement requires management of the Funds to analyze tax positions taken in the prior three open tax years, if any, and tax positions expected to be taken in the Fund’s current tax year, as defined by the IRS statute of limitations for all major jurisdictions, including federal tax authorities and certain state tax authorities. As of and during the open tax period/year ended December 31, 2019-2021 for the Smart Transportation & Technology ETF, for the period/year ended December 31, 2020-2021 for the Advertising & Marketing Technology ETF and the Sustainable Energy II ETF, and for the year ended December 2018-2021 for the Asia Pacific Dividend Builder ETF and the Dividend Builder ETF, the Funds did not have a liability for any unrecognized tax benefits. The Funds have no examination in progress and is not aware of any tax positions for which it is reasonably possible that the total amounts of unrecognized tax benefits will significantly change in the next twelve months.
Indemnifications. Under the Trust's organizational documents, its current and former officers and trustees are indemnified against certain liabilities arising out of the performance of their duties to the Funds. In addition, in the normal course of business, the Funds enter into contracts that contain a variety of representations and warranties that provide general indemnifications. The Funds’ maximum exposure under these arrangements is unknown as this would involve future claims that may be made against the Funds that have not yet occurred or that would be covered by other parties.
NOTES TO FINANCIAL STATEMENTS (Continued)
Note 3 – Valuation of Investments
The Funds utilizes various methods to measure the fair value of most of its investments on a recurring basis. GAAP establishes a hierarchy that prioritizes inputs to valuation techniques used to measure fair value. The three levels of inputs are as follows:
| ● | Level 1 – Unadjusted quoted prices in active markets for identical assets or liabilities that a Fund has the ability to access. |
| ● | Level 2 – Observable inputs other than quoted prices included in level 1 that are observable for the asset or liability, either directly or indirectly. These inputs may include quoted prices for the identical instrument on an inactive market, prices for similar instruments, interest rates, prepayment speeds, credit risk, yield curves, default rates and similar data. |
| ● | Level 3 – Unobservable inputs for the asset or liability, to the extent relevant observable inputs are not available, representing the Fund’s own assumptions about the assumptions a market participant would use in valuing the asset or liability, and would be based on the best information available. |
The availability of observable inputs can vary from security to security and is affected by a wide variety of factors, including for example, the type of security, whether the security is new and not yet established in the marketplace, the liquidity of markets, and other characteristics particular to the security. To the extent that valuation is based on models or inputs that are less observable or unobservable in the market, the determination of fair value requires more judgment. Accordingly, the degree of judgment exercised in determining fair value is greatest for instruments categorized in Level 3.
The inputs used to measure fair value may fall into different levels of the fair value hierarchy. In such cases, for disclosure purposes, the level in the fair value hierarchy within which the fair value measurement falls in its entirety, is determined based on the lowest level input that is significant to the fair value measurement in its entirety.
The following table summarizes the market value of the Funds’ investments as of December 31, 2021, based on the inputs used to value them:
| Smart Transportation & Technology ETF | | | | | | | | | | | | |
| Investments | | Level 1 | | | Level 2 | | | Level 3 | |
| Common Stocks | | $ | 15,944,073 | | | $ | - | | | $ | - | |
| Preferred Stocks | | | 409,914 | | | | - | | | | - | |
| Total | | $ | 16,353,987 | | | $ | - | | | $ | - | |
| Advertising & Marketing Technology ETF | | | | | | | | | | | | |
| Investments | | Level 1 | | | Level 2 | | | Level 3 | |
| Common Stocks | | $ | 2,680,364 | | | $ | - | | | $ | - | |
| Total | | $ | 2,680,364 | | | $ | - | | | $ | - | |
| Sustainable Energy II ETF | | | | | | | | | | | | |
| Investments | | Level 1 | | | Level 2 | | | Level 3 | |
| Common Stocks | | $ | 5,700,048 | | | $ | - | | | $ | - | |
| Total | | $ | 5,700,048 | | | $ | - | | | $ | - | |
NOTES TO FINANCIAL STATEMENTS (Continued)
| Asia Pacific Dividend Builder ETF | | | | | | | | | | | | |
| Investments | | Level 1 | | | Level 2 | | | Level 3 | |
| Common Stocks | | $ | 4,199,792 | | | $ | - | | | $ | - | |
| Total | | $ | 4,199,792 | | | $ | - | | | $ | - | |
| Dividend Builder ETF | | | | | | | | | | | | |
| Investments | | Level 1 | | | Level 2 | | | Level 3 | |
| Common Stocks | | $ | 24,410,539 | | | $ | - | | | $ | - | |
| Total | | $ | 24,410,539 | | | $ | - | | | $ | - | |
Note 4 – Capital Share Transactions
Shares are created and redeemed by the ETFs only in Creation Unit size aggregations of 25,000 Shares for the Smart Transportation & Technology ET and the Asia Pacific Dividend Builder ETF, 20,000 Shares for Dividend Builder ETF and 10,000 Shares for the Advertising & Marketing Technology ETF and the Sustainable Energy II ETF. Only broker-dealers or large institutional investors with creation and redemption agreements called Authorized Participants (“AP”) are permitted to purchase or redeem Creation Units from the ETFs. Such transactions are generally permitted on an in-kind basis, with a balancing cash component to equate the transactions to the NAV per unit of the ETFs on the transaction date. Both purchases and redemptions of Creation Units are subject to a Transaction Fee.
Note 5 - Investment Transactions
Purchases and sales of investments, excluding in-kind transactions and short-term investments, for the period ended December 31, 2021 were as follows:
| | | Purchases | | | Sales | |
| Smart Transportation & Technology ETF | | $ | 2,547,329 | | | $ | 1,700,632 | |
| Advertising & Marketing Technology ETF | | | 543,053 | | | | 563,475 | |
| Sustainable Energy II ETF | | | 1,245,563 | | | | 1,096,752 | |
| Asia Pacific Dividend Builder ETF | | | 1,218,345 | | | | 1,708,462 | |
| Dividend Builder ETF | | | 5,464,424 | | | | 4,568,995 | |
Purchases, sales, and realized gain/(loss) of in-kind transactions for the period ended December 31, 2021 were as follows:
| | | In-Kind Purchases | | | In-kind Sales | | | Gain/(Loss) | |
| Smart Transportation & Technology ETF | | $ | 6,943,833 | | | $ | - | | | $ | - | |
| Advertising & Marketing Technology ETF | | | 2,329,994 | | | | - | | | | - | |
| Sustainable Energy II ETF | | | 4,474,821 | | | | - | | | | - | |
| Asia Pacific Dividend Builder ETF | | | 217,421 | | | | - | | | | - | |
| Dividend Builder ETF | | | 1,430,745 | | | | 3,564,006 | | | | 1,547,236 | |
Note 6 – Principal Risks
The ETFs are subject to the risks common to all ETFs that invest in equity securities and foreign securities. Investing in the ETFs may be more risky than investing in an ETF that invests only in U.S. securities due to the increased volatility of foreign markets.
Autonomous/Electric Vehicle Risk. Autonomous and/or electric vehicles are a relatively new development in transportation markets. They could fail to “catch on” with consumers in a meaningful way and could suffer technical problems, supply or demand shortfalls, or be supplanted by other technologies.
Technology Risk. The technologies used by autonomous and electric vehicles and their support systems, such as software, grids, networks, fuel and batteries, may be unproven, susceptible to obsolescence or subject to future regulation in countries or locations of deployment.
NOTES TO FINANCIAL STATEMENTS (Continued)
Cybersecurity Risk. Technologies created or deployed for Smart Transportation, including for vehicles or drive systems as well as for networks and intelligent roadways, may be subject to greater cybersecurity risk than other companies.
Product Risk. Companies creating products and technologies for autonomous or electric transportation, for passenger, commercial or freight usage, face considerable competition.
Product Regulation Risk. Autonomous vehicles and their networks may be subject to multiple levels of regulation including local regulations and operating restrictions.
Foreign Securities Risk. Foreign securities experience more volatility than their domestic counterparts, in part because of higher political and economic risks, lack of reliable information, fluctuations in currency exchange rates and the risks that a foreign government may take over assets, restrict the ability to exchange currency or restrict the delivery of securities.
Advertising & Marketing Technology Risk. While there are some well-established Advertising and Marketing Technology companies, technology is advancing rapidly, and Advertising and Marketing Technology companies are subject to intense competition. The barriers to entry into some of these businesses are relatively low and there are a number of smaller competitors in the field that have the ability to disrupt these businesses. Some of the technology is unproven and subject to cybersecurity threats. Changes in data protection standards and regulation could also affect these companies. Both Advertising and Marketing Technology applications may converge in the future with transaction activity, such as banking or payments, which may be heavily regulated. These factors may mean more rapid software or technological obsolescence as compared to traditional technology companies, and that the business models for some Advertising or Marketing Technology companies may change or these companies may become defunct rapidly.
Industry Risk. Prices of energy, whether traditional or sustainable, may fluctuate or decline due to many factors, including international political or economic developments, real or perceived, demand for energy and sustainable energy, production and distribution policies of OPEC (Organization of Petroleum Exporting Countries) and other oil-producing countries, energy conservation projects, changes in governmental regulations affecting companies in the energy business or related lines of business, including Sustainable Energy companies, changes in technology affecting Sustainable Energy, and changes in tax regulations relating to energy. A decline in energy prices would likely have a negative effect on securities held by the Fund. The Fund’s focus on sustainable energy businesses exposes the Fund to greater market risk and potential monetary losses than if the Fund’s assets were diversified among various industries or sectors.
Pandemic Risk. In 2020, markets globally were impacted by the Covid-19 pandemic, which is ongoing. The pandemic adversely affected industries, including supply chains, as well as general financial conditions, and has resulted in shutdowns and economic stimulus packages. Total economic effects of Covid-19 cannot be predicted. Covid-19 may continue in the foreseeable future and could adversely affect companies in the Funds’ portfolio, including by affecting their willingness or ability to pay dividends, which could negatively impact stock prices as well as yield.
Note 7 - Investment Advisory and Other Agreements
The Trust, on behalf of the Funds, entered into an Investment Advisory Agreement with Guinness Atkinson Asset Management, Inc. (the “Adviser”), under which the Adviser provides the Funds with investment management services. The Adviser furnishes all necessary office facilities, equipment and personnel for servicing the investments of the Funds.
Pursuant to the investment advisory agreement between Smart Transportation & Technology ETF and the Adviser, the Fund pays the Adviser an annual advisory fee rate of 0.68% of its average daily net assets and the Adviser has agreed to pay all expenses of the Fund, except for: (i) brokerage expenses and other expenses (such as stamp taxes) connected with the execution of portfolio transactions or in connection with creation and redemption transactions; (ii) legal fees or expenses in connection with any arbitration, litigation or pending or threatened arbitration or litigation, including any settlements in connection therewith; (iii) compensation and expenses of the Independent Trustee; (iv) compensation and expenses of counsel to the Independent Trustees; (v) compensation and expenses of the Trust’s CCO; (vi) extraordinary expenses; (vii) distribution fees and expenses paid by the Trust under any distribution plan adopted pursuant to Rule 12b-1 under the 1940 Act; and (viii) the advisory fee payable to the Advisor. The Smart Transportation & Technology ETF is responsible for other expenses not assumed by the Adviser, including brokerage expenses in connection with portfolio transactions or creation/redemption transactions, legal fees, compensation and expenses of the Board of Trustees, compensation and expenses of the Trust’s CCO, extraordinary expenses, distribution fees and expenses, interest, taxes, in addition to the advisory fee.
NOTES TO FINANCIAL STATEMENTS (Continued)
The Advertising & Marketing Technology ETF pays the Adviser 0.68%, the Sustainable Energy II ETF pays the Adviser 0.79%, the Asia Pacific Dividend Builder ETF pays the Adviser 0.75% and the Dividend Builder ETF pays the Adviser 0.45% an annual advisory fee rate based on each Fund’s average daily net assets.
The Adviser has contractually agreed to limit each Fund’s total operating expenses by reducing all or a portion of its fees and reimburse the Funds for expenses (excluding interest, taxes, acquired fund fees and expenses (as defined in Form N-1A), dividends on short positions, brokerage expenses, and extraordinary expenses) so that its ratio of expenses to average daily net assets will not exceed the following levels:
| | Annual Expense
Limitation | Expiration Date |
| Smart Transportation & Technology ETF | 0.68% | June 30, 2022 |
| Advertising & Marketing Technology ETF | 0.68% | June 30, 2025 |
| Sustainable Energy II ETF | 0.79% | June 30, 2025 |
| Asia Pacific Dividend Builder ETF | 0.78% | June 30, 2025 |
| Dividend Builder ETF | 0.65% | June 30, 2025 |
Penserra Capital Management, LLC (“Penserra”) serves as the Funds’ sub-adviser. Penserra is compensated by the Adviser and does not receive payments from the Funds.
Foreside Fund Services, LLC, a Delaware limited liability company, (the “Distributor”) serves as the Funds’ principal underwriter and distributor of Creation Units pursuant to a distribution agreement. The Distributor does not maintain any secondary market in ETF Shares.
Mutual Fund Administration, LLC (the “Administrator”) serves as the Funds’ administrator under an administration agreement.
Brown Brothers Harriman & Co. (the “Custodian”, “Transfer Agent” and “Fund Accounting agent”) serves as the Funds’ custodian, transfer agent and fund accounting agent. Prior to March 27, 2021, U.S. Bancorp Fund Services served as the Funds’ transfer agent for the Asia Pacific Dividend Builder ETF and the Dividend Builder ETF.
Foreside Fund Officer Services, LLC provides Chief Compliance Officer (“CCO”) services to the Funds’. The fees paid for CCO services for the period ended December 31, 2021, are reported on the Statements of Operations.
The fees paid to non-interested Trustees for the period ended December 31, 2021 are reported on the Statements of Operations.
Certain officers of the Trust are also officers and/or Directors of the Adviser and the Administrator. None of these officers are compensated directly by the Funds.
NOTES TO FINANCIAL STATEMENTS (Continued)
Note 8 – Distribution Plan
The Trust has adopted a Distribution Plan pursuant to Rule 12b-1 of the 1940 Act which permits the Funds to pay Rule 12b-1 fees not to exceed 0.10% per year of each Fund’s average daily net assets. The Board of Trustees has not authorized the Funds to make payments under the Distribution Plan. Currently, no payment is being made by the Funds.
Note 9 – Tax Matters
At December 31, 2021, gross unrealized appreciation and depreciation of investments, based on cost for federal income tax purposes were as follows:
| | | Smart
Transportation
& Technology
ETF | | | Advertising &
Marketing
Technology
ETF | | | Sustainable
Energy II ETF | | | Asia Pacific
Dividend
Builder ETF | | | Dividend
Builder ETF | |
| Tax cost of investments | | $ | 13,151,122 | | | $ | 2,558,350 | | | $ | 5,596,901 | | | $ | 3,010,055 | | | $ | 17,007,770 | |
| Gross tax unrealized appreciation | | $ | 3,812,325 | | | $ | 538,761 | | | $ | 805,471 | | | $ | 1,251,872 | | | $ | 7,683,732 | |
| Gross tax unrealized depreciation | | | (609,460 | ) | | | (416,747 | ) | | | (702,324 | ) | | | (62,135 | ) | | | (280,963 | ) |
| Net tax unrealized appreciation (depreciation) | | | 3,202,865 | | | | 122,014 | | | | 103,147 | | | | 1,189,737 | | | | 7,402,769 | |
| Net tax unrealized appreciation (depreciation) on foreign currency | | | (46 | ) | | | (3 | ) | | | (118 | ) | | | 148 | | | | 1,047 | |
| Net Tax unrealized depreciation on deferred foreign taxes | | | - | | | | - | | | | - | | | | (14,333 | ) | | | - | |
| Undistributed ordinary income | | | 82,177 | | | | - | | | | 35,934 | | | | - | | | | 7,794 | |
| Undistributed long-term capital gains | | | - | | | | - | | | | - | | | | - | | | | - | |
| Post October Loss* | | | (751 | ) | | | (5 | ) | | | - | | | | (607 | ) | | | (328 | ) |
| Capital loss carryforward | | | - | | | | (2,792 | ) | | | - | | | | - | | | | - | |
| Distributable earnings (accumulated deficit) | | $ | 3,284,245 | | | $ | 119,214 | | | $ | 138,963 | | | $ | 1,174,945 | | | $ | 7,411,282 | |
The difference between cost amounts for financial statements and federal income tax purposes is due primarily timing differences in recognizing certain gains and losses in security transactions.
| * | A regulated investment company may elect for any taxable year to treat any portion of any qualified late year loss as arising on the first day of the next table year. Qualified late year losses are certain capital and ordinary losses which occur during the portion of the Funds’ taxable year subsequent to October 31 and December 31, respectively. |
As of December 31, 2021, the Advertising & Marketing Technology ETF had short-term capital loss carryforwards with no expiration of $2,792.
For the year ended December 31, 2021, the Dividend Builder ETF utilized capital loss carryforward of $632,653.
NOTES TO FINANCIAL STATEMENTS (Continued)
The tax character of distributions paid by the Funds during the fiscal year/period ended December 31, 2021 and December 31, 2020 were as follows:
| | | 2021 | | | 2020 | |
| | | Ordinary Income | | | Capital Gains | | | Ordinary Income | | | Capital Gains | |
| Smart Transportation & Technology ETF | | $ | 91,000 | | | $ | - | | | $ | 165,407 | | | $ | - | |
| Advertising & Marketing Technology ETF | | | - | | | | - | | | | - | | | | - | |
| Sustainable Energy II ETF | | | 156,600 | | | | - | | | | - | | | | - | |
| Asia Pacific Dividend Builder ETF | | | 418,667 | | | | 180,113 | | | | 488,673 | | | | - | |
| Dividend Builder ETF | | | 515,361 | | | | 636,467 | | | | 345,035 | | | | 3,960 | |
Note 10 - Recent Market Risks
In early 2020, an outbreak of a novel strain of coronavirus (COVID-19) emerged globally. This coronavirus has resulted in closing international borders, enhanced health screenings, healthcare service preparation and delivery, quarantines, cancellations, disruptions to supply chains and customer activity, as well as general public concern and uncertainty. The impact of this outbreak has negatively affected the worldwide economy, as well as the economies of individual countries, the financial health of individual companies and the market in general in significant and unforeseen ways. The future impact of COVID-19 is currently unknown, and it may exacerbate other risks that apply to the Funds, including political, social and economic risks. Any such impact could adversely affect the Funds’ performance, the performance of the securities in which the Funds invests and may lead to losses on your investment in the Funds. The ultimate impact of COVID-19 on the financial performance of the Funds’ investments is not reasonably estimable at this time
Note 11 - New Accounting Pronouncements
In March 2020, the FASB issued ASU No. 2020-04 (“ASU 2020-04”), Reference Rate Reform (Topic 848) - Facilitation of the Effects of Reference Rate Reform on Financial Reporting. The amendments in ASU 2020-04 provide optional temporary financial reporting relief from the effect of certain types of contract modifications due to the planned discontinuation of LIBOR and other interbank-offered based reference rates as of the end of 2021. ASU 2020-04 is effective for certain reference rate-related contract modifications that occur during the period March 12, 2020 through December 31, 2022. Management is currently evaluating the impact of the guidance.
In December 2020, the SEC adopted a new rule providing a framework for fund valuation practices (“Rule 2a-5”). Rule 2a-5 establishes requirements for determining fair value in good faith for purposes of the 1940 Act. Rule 2a-5 will permit fund boards to designate certain parties to perform fair value determinations, subject to board oversight and certain other conditions. Rule 2a-5 also defines when market quotations are “readily available” for purposes of the 1940 Act and the threshold for determining whether a fund must fair value a security. In connection with Rule 2a-5, the SEC also adopted related recordkeeping requirements and is rescinding previously issued guidance, including with respect to the role of a board in determining fair value and the accounting and auditing of fund investments. The Funds will be required to comply with the rules by September 8, 2022. Management is currently assessing the potential impact of the new rules on the Funds’ financial statements
The SEC adopted new Rule 12d1-4, which will allow registered investment companies (including business development companies (“BDCs”), unit investment trusts (“UITs”), closed-end funds, exchange-traded funds (“ETFs”), and exchange-traded managed funds (“ETMFs”) (an “acquiring” fund), to invest in other investment companies (an “acquired fund”), including private funds under a specific exception, beyond the limits of Section 12(d)(1), subject to the conditions of the rule. Rule 12d1-4 became effective January 19, 2021. Funds electing to rely on Rule 12d1-4 will have to comply with the rules by January 19, 2022
NOTES TO FINANCIAL STATEMENTS (Continued)
Note 12 - Events Subsequent to the Fiscal Period End
The Funds have adopted financial reporting rules regarding a subsequent event which requires an entity to recognize in the financial statements the effects of all subsequent events that provide additional evidence about conditions that existed at the date of the balance sheet. Management has evaluated the Funds’ related events and transactions and has determined that there were no events or transactions that occurred that would materially impact the amounts or disclosures in the Funds’ financial statements.
REPORT OF INDEPENDENT REGISTERED PUBLIC ACCOUNTING FIRM
To the Board of Trustees
and Shareholders of
Guinness Atkinson Funds
Opinion on the Financial Statements
We have audited the accompanying statements of assets and liabilities of SmartETFs Asia Pacific Dividend Builder ETF, SmartETFs Dividend Builder ETF, SmartETFs Smart Transportation & Technology ETF, SmartETFs Sustainable Energy II ETF and SmartETFs Advertising and Marketing Technology ETF (the “Funds”), a series of Guinness Atkinson Funds (the “Trust”), including the schedules of investments, as of December 31, 2021, the related statements of operations, the statements of changes in net assets, and financial highlights for each of the periods indicated in the table below, and the related notes (collectively referred to as the “financial statements”). In our opinion, the financial statements and financial highlights referred to above present fairly, in all material respects, the financial position of the Funds as of December 31, 2021, the results of their operations, the changes in their net assets, and their financial highlights for the periods indicated in the table below, in conformity with accounting principles generally accepted in the United States of America.
| Individual Funds Constituting the Guinness Atkinson Trust | | Statement Of Operations | | Statements Of Changes In Net Assets | | Financial Highlights |
| SmartETF Asia Pacific Dividend Builder ETF | | For the year ended December 31, 2021 | | For the years in the period ended December 31, 2021 and 2020 | | For the five years in the period then ended |
| | | | | | | |
SmartETF Dividend Builder ETF | | For the year ended December 31, 2021 | | For the years in the period ended December 31, 2021 and 2020 | | For the five years in the period then ended |
| | | | | | | |
| SmartETF Smart Transportation & Technology ETF | | For the year ended December 31, 2021 | | For the years in the period ended December 31, 2021 and 2020 | | For the two years in the period ended December 31, 2021 and 2020 and for the period November 14, 2019 (commencement of operations) through December 31, 2019 |
| | | | | | | |
| SmartETF Sustainable Energy II ETF | | For the year ended December 31, 2021 | | For the year in the period ended December 31, 2021 and for the period November 11, 2020 (commencement of operations) through December 31, 2020 | | For the year in the period ended December 31, 2021 and for the period November 11, 2020 (commencement of operations) through December 31, 2020 |
| | | | | | | |
| SmartETF Advertising and Marketing Technology ETF | | For the year ended December 31, 2021 | | For the year in the period ended December 31, 2021 and for the period December 31, 2020 (commencement of operations) through December 31, 2020 | | For the year in the period ended December 31, 2021 and for the period December 31, 2020 (commencement of operations) through December 31, 2020 |
To the Board of Trustees
and Shareholders of
Guinness Atkinson Funds
Basis for Opinion
These financial statements are the responsibility of the Funds’ management. Our responsibility is to express an opinion on the Fund’s financial statements based on our audits. We are a public accounting firm registered with the Public Company Accounting Oversight Board (United States) (“PCAOB”) and are required to be independent with respect to the Fund in accordance with the U.S. federal securities laws and the applicable rules and regulations of the Securities and Exchange Commission and the PCAOB. We have served as the auditor of one or more of the funds in the Trust since 2003.
We conducted our audits in accordance with the standards of the PCAOB. Those standards require that we plan and perform the audit to obtain reasonable assurance about whether the financial statements are free of material misstatement, whether due to error or fraud. The Fund is not required to have, nor were we engaged to perform, an audit of its internal control over financial reporting. As part of our audits we are required to obtain an understanding of internal control over financial reporting, but not for the purpose of expressing an opinion on the effectiveness of the Funds’ internal control over financial reporting. Accordingly, we express no such opinion.
Our audits included performing procedures to assess the risks of material misstatement of the financial statements, whether due to error or fraud, and performing procedures that respond to those risks. Such procedures included examining, on a test basis, evidence regarding the amounts and disclosures in the financial statements. Our audits also included evaluating the accounting principles used and significant estimates made by management, as well as evaluating the overall presentation of the financial statements. Our procedures included confirmation of securities owned as of December 31, 2021 by correspondence with the custodian and brokers; when replies were not received from brokers, we performed other auditing procedures. We believe that our audits provide a reasonable basis for our opinion.
| |  | |
| | TAIT, WELLER & BAKER LLP | |
Philadelphia, Pennsylvania
March 1, 2022
Other Information (Unaudited)
Expense Example
As a shareholder of the Funds you incur two types of costs: (1) transaction costs, including brokerage commissions on purchases and sales of ETF shares, and (2) ongoing costs, including management fees and other Fund expenses. This example is intended to help you understand your ongoing costs (in dollars) of investing in the Fund and to compare these costs with the ongoing costs of investing in other funds. The examples are based on an investment of $1,000 invested at the beginning of the period and held for the entire period as indicated in the Expense Example Tables.
Actual Expenses
This section helps you estimate the actual expenses after fee waivers that the Fund may have incurred over the period. The “Expenses Paid During Period” column shows the actual dollar expense cost incurred by a $1,000 investment in the Fund, and the “Ending Account Value” number is derived from deducting that expense cost from the Fund’s gross investment return for the period.
You may use the information, together with the amount you invested in the Fund, to estimate the expenses you paid over the period. Simply divide your account value by $1,000 (for example, an $8,600 account value divided by $1,000 = 8.6), then multiply that ratio by the number shown for the Fund under “Expenses Paid During Period”.
Hypothetical Example for Comparison Purposes
This section helps you compare the Fund’s costs with those of other funds. It assumes that the Fund had an annualized return of 5% before expenses, which is not the Fund’s actual return and the expense ratio for the period is unchanged. The hypothetical account value and expense may not be used to estimate the actual ending account balance or the expenses you paid for the period. This example is useful in making comparisons because the SEC requires all funds to make this 5% calculation. You can assess the Fund’s comparative cost by comparing the hypothetical results for the Fund in the “Expenses Paid During Period” column with those that appear in the same charts in the shareholder reports of other Funds.
Smart Transportation & Technology ETF
| | Beginning Account Value 07/01/21 | Ending Account Value 12/31/21 | Expenses Paid During the Period(a) | Annualized Expense Ratio |
| Actual | $1,000.00 | $1,050.57 | $3.51 | 0.68% |
| Hypothetical (5% annual return before expenses) | $1,000.00 | $1,021.78 | $3.47 | 0.68% |
Advertising & Marketing Technology ETF
| | Beginning Account Value 07/01/21 | Ending Account Value 12/31/21 | Expenses Paid During the Period(a) | Annualized Expense Ratio |
| Actual | $1,000.00 | $932.67 | $3.31 | 0.68% |
| Hypothetical (5% annual return before expenses) | $1,000.00 | $1,021.78 | $3.47 | 0.68% |
Sustainable Energy II ETF
| | Beginning Account Value 07/01/21 | Ending Account Value 12/31/21 | Expenses Paid During the Period(a) | Annualized Expense Ratio |
| Actual | $1,000.00 | $1,040.22 | $4.06 | 0.79% |
| Hypothetical (5% annual return before expenses) | $1,000.00 | $1,021.22 | $4.02 | 0.79% |
Other Information (Unaudited) - Continued
Asia Pacific Dividend Builder ETF
| | Beginning Account Value 07/01/21 | Ending Account Value 12/31/21 | Expenses Paid During the Period(a) | Annualized Expense Ratio |
| Actual | $1,000.00 | $992.67 | $3.92 | 0.78% |
| Hypothetical (5% annual return before expenses) | $1,000.00 | $1,021.27 | $3.97 | 0.78% |
Dividend Builder ETF
| | Beginning Account Value 07/01/21 | Ending Account Value 12/31/21 | Expenses Paid During the Period(a) | Annualized Expense Ratio |
| Actual | $1,000.00 | $1,091.32 | $3.43 | 0.65% |
| Hypothetical (5% annual return before expenses) | $1,000.00 | $1,021.93 | $3.31 | 0.65% |
| | | | | |
| (a) | The dollar amounts shown as expenses paid during the period are equal to the annualized expense ratio multiplied by the average account value during the period, multiplied by 184/365 (to reflect the one-half year period). The expense ratio reflects an expense waiver. |
Other Information (Unaudited) - Continued
Statement Regarding Liquidity Risk Management Program
The Securities and Exchange Commission adopted Rule 22e-4 under the Investment Company Act of 1940, as amended (the “Liquidity Rule”), to promote effective liquidity risk management throughout the open-end investment company industry, thereby reducing the risk that funds will be unable to meet their redemption obligations and mitigating dilution of the interests of fund shareholders.
The Board of Trustees (the “Board”) of Guinness Atkinson Funds (the “Trust”) met on December 10, 2021 (the “Meeting”), to review the liquidity risk management program (the “Program”) applicable to the following series of the Trust (each, a “Fund” and together, the “Funds”) pursuant to the Liquidity Rule:
The SmartETFs Advertising & Marketing Technology ETF
The SmartETFs Asia Pacific Dividend Builder ETF
The SmartETFs Dividend Builder ETF
The SmartETFs Smart Transportation & Technology ETF
The SmartETFs Sustainable Energy II ETF
The Board has appointed Guinness Atkinson Asset Management, Inc., the investment adviser to the Funds, as the liquidity program administrator (“LPA”) for the Program. At the Meeting, the LPA provided the Board with a written report (the “Report”) that addressed the operation, adequacy, and effectiveness of implementation of the Program, and any material changes to it for the period from `October 1, 2020 through September 30, 2021 (the “Program Reporting Period”).
In assessing the adequacy and effectiveness of implementation of the Program, the Report discussed the following, among other things:
| 1. | Each Fund is deemed an “In-Kind ETF” and therefore is not subject to the liquidity classification requirements, |
| 2. | An overview of each Fund’s investment strategy and the liquidity of its portfolio investments during the Program Reporting Period, and |
| 3. | Effect of pricing spreads on Fund liquidity. |
The Report also stated that there were no material changes made to the Program during the Program Reporting Period.
In the Report, the LPA concluded that the Program is adequately designed and has been effective in managing each Fund’s Liquidity Risk and in implementing the requirements of the Liquidity Rule.
There can be no assurance that the Program will achieve its objectives in the future. Please refer to the Funds’ prospectus for more information regarding each Fund’s exposure to liquidity risk and other principal risks to which an investment in the Funds may be subject.
Other Information (Unaudited) - Continued
Supplemental Tax Information
For the year ended December 31, 2021, a portion of the dividends distributed by the Funds are considered qualified dividend income and are eligible for reduced tax rates. The tax rates range from 5% to 20% depending on the individual’s tax bracket, as provided for by the Jobs and Growth Tax Relief Reconciliation Act of 2003. The percentage of dividends declared from ordinary income designated as qualified dividend income was as follows:
| Smart Transportation & Technology ETF | 71% |
| Advertising & Marketing Technology ETF | N/A |
| Sustainable Energy II ETF | 21% |
| Asia Pacific Dividend Builder ETF | 18% |
| Dividend Builder ETF | 100% |
For the year ended December 31, 2021, pursuant to Section 853(b)(3) of the Internal Revenue Code, the Asia Pacific Dividend Builder ETF and Dividend Builder ETF designates $180,113 and $640,133 respectively, as long-term capital gains.
Pursuant to Section 853 of the Internal Revenue Code of 1986, as amended, the Funds designate the following income earned from foreign sources and foreign taxes paid for the year ended December 31, 2021:
| | Foreign Sourced Income | Foreign Taxes Paid |
| | Total Amount | Per Share Amount | Total Amount | Per Share Amount |
| Smart Transportation & Technology ETF | $153,566 | $0.44 | $19,633 | $0.06 |
| Advertising & Marketing Technology ETF | N/A | N/A | N/A | N/A |
| Sustainable Energy II ETF | 44,173 | 0.25 | 4,721 | 0.03 |
| Asia Pacific Dividend Builder ETF | 187,256 | 0.73 | 19,155 | 0.07 |
| Dividend Builder ETF | 464,691 | 0.51 | 25,201 | 0.02 |
Premium/Discount Information
Information about the differences between the daily market price on the secondary markets for shares of the Funds and the Funds NAV can be found on the Funds’ website at www.smartetfs.com.
Other Information (Unaudited) - Continued
Trustee and Officer Information
Unless otherwise noted, each Trustee and officer’s address is 251 South Lake Avenue, Suite 800, Pasadena, California 91101. Trustees and officers of the Trust serve until their resignation, removal or retirement. Additional information about the Trustees is included in the Funds’ Statement of Additional Information which is available, without charge, upon request by calling 866-307-5990 (toll free in the United States) or by visiting the Funds’ website at www.smartetfs.com.
| Disinterested Trustees |
| Name and Age | Position Held with the Trust | Length of Time Served | Principal Occupation(s) During the Past 5 Years | Number of Portfolios In Fund Complex Overseen by Trustee | Other Directorships Held by Trustee |
J. Brooks Reece, Jr. (74) | Trustee and Chairman | Indefinite; Since April 1994 | Operating Partner, Stonebridge Partners Small cap Team, since 2018. Previously, CEO, Adcole Corp, from 1989 to 2017. | 11 | None |
James I. Fordwood (74) | Trustee, Audit Committee Chairman | Indefinite; Since April 1994 | CFO and Managing Member of Prima Marketing LLC (network of convenience stores) since 1998; President, Balmacara Production Inc. since 1986 (holding company); Treasurer, Inverness21 LLC (owns and operates office buildings) since 2007; Treasurer, JL Energy Inc. (holding company) since 1985; Treasurer, Thistle, Inc. (seismic data management) since 1984. | 11 | None |
Dr. Bret A. Herscher (63) | Trustee | Indefinite; Since April 1994 | Self-employed Consultant, since 2018, to companies in the medical device sector. Chief Technology Officer, EARGO, Inc., a hearing aid company, from 2012 to 2018. | 11 | None |
Susan Penry-Williams (75) | Trustee | Indefinite; Since February 2016 | Retired, Partner, Kramer Levin Naftalis & Frankel LLP, from 1994 to 2014. | 11 | None |
| Interested Trustees |
| Name, Address, and Age | Position Held with the Trust | Length of Time Served | Principal Occupations During the Past 5 Years | Number of Portfolios In Fund Complex Overseen by Trustee | Other Directorships Held by Trustee |
Timothy W.N. Guinness* 18 Smith Square London, SW1P 3HZ UK (73) | Trustee | Indefinite; Since April 1994 | Chairman/CIO of Guinness Atkinson™ Asset Management since November 2002. Chairman of Guinness Asset Management Ltd., investment adviser in London, since 2003. Director of Guinness Capital Management Ltd. since 2010. Partner, Ekins Guinness LLP (investment research) since 2017; Non-Executive Director of Brompton Bicycle Ltd., Since 2000. | 11 | None |
| * | “Interested person” (as defined in the 1940 Act) of the Funds because of his affiliation with Guinness Atkinson™. |
Other Information (Unaudited) - Continued
| Officers |
Name and Age | Position(s) Held with the Trust | Length of Time Served | Principal Occupation(s) During the Past 5 Years |
| James J. Atkinson (63) | President | Since April 2003 | Chief Executive Officer and Director of Guinness Atkinson™ Asset Management since 2002. Director of Guinness Asset Management Ltd. since 2003. Principal of Orbis Marketing, a mutual fund marketing and advertising firm, since 2001. |
| Patrick Keniston (57) | Chief Compliance Officer | Since May 2013 | Managing Director, Foreside Fund Officer Services, LLC, since 2008. |
| Rita Dam (54) | Treasurer | Since September 2009 | Co-Chief Executive Officer (2016 - present), and Vice President, Mutual Fund Administration, LLC (2006 - 2015). Co-President (2018 – present), Foothill Capital Management, LLC, a registered investment adviser. |
| Joy Ausili (54) | Secretary & Assistant Treasurer | Since September 2009 | Co-Chief Executive Officer, Mutual Fund Administration, LLC (2016 - present), and Vice President, Mutual Fund Administration, LLC (2006 -2015). Co-President (2018 – present), Foothill Capital Management, LLC, a registered investment advisor. |
| Lyna Phan (46) | Assistant Treasurer | Since September 2011 | Managing Director (2018 – present), and Vice President (2010 - 2017), Mutual Fund Administration, LLC. |
| Evan Robledo (33) | Assistant Treasurer | Since December 2021 | Vice President (2020 – present), Assistant Vice President (2018 – 2020), and Senior Associate (2013 - 2018), Mutual Fund Administration, LLC. |
Privacy Notice
The SmartETFs and Guinness Atkinson Asset Management, Inc. may collect non-public information about you from the following sources:
• Information we receive about you on applications or other forms;
• Information you give us orally; and
• Information about your transactions with us.
We do not disclose any non-public personal information about our shareholders or former shareholders without the shareholder’s authorization, except as required by law or in response to inquiries from governmental authorities. We restrict access to your personal and account information to those employees who need to know that information to provide products and services to you. We also may disclose that information to unaffiliated third parties (such as to brokers or custodians) only as permitted by law and only as needed for us to provide agreed services to you. We maintain physical, electronic and procedural safeguards to guard your non-public personal information.

This report is intended for the ETF’s shareholders. It may not be distributed to prospective investors unless it is preceded or accompanied by the ETF’s prospectus and summary prospectus, which includes more complete information. Investing involves substantial risk and high volatility, including possible loss of principal. An investor should consider the investment objective, risks, charges and expenses of the ETF carefully before investing. To obtain a prospectus and summary prospectus, which contains this and other information, e-mail request to mail@SmartETFs.com, by calling 866-307-5990 (toll free in the United States), visiting the ETF’s website, www.SmartETFs.com, or by calling or writing a broker-dealer or other financial intermediary. Please read the prospectus and summary prospectus carefully before investing.
Additional information about the Trust’s Board of Trustees/Officers and a description of the policies and procedures the Trust uses to determine how to vote proxies relating to portfolio securities are provided in the Statement of Additional Information. The Statement of Additional Information and information regarding how the Trust voted proxies relating to portfolio securities during the most recent twelve month period ending June 30 is available, without charge, by calling 866-307-5990, or by visiting www.SmartETFs.com, or on the Securities and Exchange Commission’s website at http://www.sec.gov.
The ETF files its complete schedule of portfolio holdings with the Securities and Exchange Commission for the first and third quarters of each fiscal year on Form N-PORT. The ETF’s Form N-PORT are available on the Commission’s website at www.sec.gov. In addition, the ETF’s full portfolio holdings are updated daily and available on the ETF’s website at www.SmartETFs.com.
Foreside Fund Services, LLC, distributor.
Item 2. Code of Ethics.
The registrant has adopted a code of ethics that applies to the registrant's principal executive officer and principal financial officer. The registrant has not made any amendments to its code of ethics during the period covered by this report. The registrant has not granted any waivers from any provisions of the code of ethics during the period covered by this report.
The registrant undertakes to provide to any person without charge, upon request, a copy of its code of ethics by mail when they call the registrant at 1-866-307-5990.
Item 3. Audit Committee Financial Expert.
The registrant’s board of trustees has determined that there is at least one audit committee financial expert serving on its audit committee. James I. Fordwood is the “audit committee financial expert” and is considered to be “independent” as each term is defined in Item 3 of Form N-CSR.
Item 4. Principal Accountant Fees and Services.
The registrant has engaged its principal accountant to perform audit services, audit-related services, tax services and other services during the past two fiscal years. "Audit services" refer to performing an audit of the registrant's annual financial statements or services that are normally provided by the accountant in connection with statutory and regulatory filings or engagements for those fiscal years. "Audit-related services" refer to the assurance and related services by the principal accountant that are reasonably related to the performance of the audit. "Tax services" refer to professional services rendered by the principal accountant for tax compliance, tax advice, and tax planning. There were no "other services" provided by the principal accountant. The following table details the aggregate fees billed or expected to be billed for each of the last two fiscal years for audit fees, audit-related fees, tax fees and other fees by the principal accountant.
| | FYE 12/31/2021 | FYE 12/31/2020 |
| Audit Fees | $52,500 | $17,500 |
| Audit-Related Fees | N/A | N/A |
| Tax Fees | $12,500 | $7,500 |
| All Other Fees | N/A | N/A |
The audit committee has adopted pre-approval policies and procedures that require the audit committee to pre-approve all audit and non-audit services of the registrant, including services provided to any entity affiliated with the registrant.
The percentage of fees billed by Tait, Weller, & Baker LLP applicable to non-audit services pursuant to waiver of pre-approval requirement were as follows:
| | FYE 12/31/2021 | FYE 12/31/2020 |
| Audit-Related Fees | 0% | 0% |
| Tax Fees | 0% | 0% |
| All Other Fees | 0% | 0% |
All of the principal accountant's hours spent on auditing the registrant's financial statements were attributed to work performed by full-time permanent employees of the principal accountant.
The following table indicates the non-audit fees billed or expected to be billed by the registrant's accountant for services to the registrant and to the registrant's investment adviser (and any other controlling entity, etc.—not sub-adviser) for the last two years. The audit committee of the Board of Trustees has considered whether the provision of non-audit services that were rendered to the registrant's investment adviser is compatible with maintaining the principal accountant's independence and has concluded that the provision of such non-audit services by the accountant has not compromised the accountant's independence.
| Non-Audit Related Fees | FYE 12/31/2021 | FYE 12/31/2020 |
| Registrant | N/A | N/A |
| Registrant’s Investment Advisor | N/A | N/A |
Item 5. Audit Committee of Listed Registrants.
Not applicable to registrants who are not listed issuers (as defined in Rule 10A-3 under the Securities Exchange Act of 1934).
Item 6. Schedule of Investments.
| (a) | Schedule of Investments is included as part of the report to shareholders filed under Item 1 of this Form. |
Item 7. Disclosure of Proxy Voting Policies and Procedures for Closed-End Management Investment Companies.
Not Applicable.
Item 8. Portfolio Managers of Closed-End Management Investment Companies.
Not Applicable.
Item 9. Purchases of Equity Securities by Closed-End Management Investment Company and Affiliated Purchasers.
Not Applicable.
Item 10. Submission of Matters to a Vote of Security Holders.
The registrant has not made any material changes to the procedures by which shareholders may recommend nominees to the registrant’s Board of Trustees.
Item 11. Controls and Procedures.
| (a) | The registrant’s principal executive officer and principal financial officer have evaluated the registrant’s disclosure controls and procedures within 90 days of this filing and have concluded based on such evaluation that the registrant’s disclosure controls and procedures were effective, as of that date, in ensuring that information required to be disclosed by the registrant in this Form N-CSR was recorded, processed, summarized, and reported within the time periods specified in the Securities and Exchange Commission’s rules and forms. |
| (b) | There were no changes in the registrant’s internal control over financial reporting (as defined in Rule 30a-3(d) under the Investment Company Act of 1940) that occurred during the registrant’s last fiscal quarter that have materially affected, or are reasonably likely to materially affect, the registrant’s internal control over financial reporting. |
Item 12. Disclosure of Securities Lending Activities for Closed-End Management Investment Companies.
Not applicable to open-end investment companies.
Item 13. Exhibits.
(1) Any code of ethics or amendment thereto, that is subject of the disclosure required by Item 2, to the extent that the registrant intends to satisfy Item 2 requirements through filing an exhibit. Incorporated by reference to the Registrant’s Form N-CSR filed March 10, 2011.
(2) Certifications pursuant to Section 302 of the Sarbanes-Oxley Act of 2002. Filed herewith.
(3) Any written solicitation to purchase securities under Rule 23c-1 under the Act sent or given during the period covered by the report by or on behalf of the registrant to 10 or more persons. Not applicable to open-end investment companies.
SIGNATURES
Pursuant to the requirements of the Securities Exchange Act of 1934 and the Investment Company Act of 1940, the registrant has duly caused this report to be signed on its behalf by the undersigned, thereunto duly authorized.
| (Registrant) Guinness Atkinson Funds | |
| | | |
| By | /s/ James J. Atkinson | |
| Name: | James J. Atkinson | |
| Title: | President | |
| Date: | 3/11/2022 | |
Pursuant to the requirements of the Securities Exchange Act of 1934 and the Investment Company Act of 1940, this report has been signed by the following persons on behalf of the registrant and in the capacities and on the dates indicated.
| By | /s/ James J. Atkinson | |
| Name: | James J. Atkinson | |
| Title: | President | |
| Date: | 3/11/2022 | |
| By | /s/ Rita Dam | |
| Name: | Rita Dam | |
| Title: | Treasurer | |
| Date: | 3/11/2022 | |