Exhibit 99.1
Exhibit 99.1
(in United States dollars, tabular amounts in millions, except where noted)
MANAGEMENT’S DISCUSSION AND ANALYSIS FOR THE YEAR ENDED DECEMBER 31, 2016
This Management’s Discussion and Analysis (“MD&A”) should be read in conjunction with the consolidated financial statements of Goldcorp Inc. (“Goldcorp” or “the Company”) for the year ended December 31, 2016 and related notes thereto which have been prepared in accordance with International Financial Reporting Standards (“GAAP” or “IFRS”) as issued by the International Accounting Standards Board (“IASB”). All figures are in United States (“US”) dollars unless otherwise noted. References to C$ are to Canadian dollars. This MD&A has been prepared as of February 15, 2017.
TABLE OF CONTENTS
|
| | |
| | | Page Number |
| Cautionary Statements | |
| 2016 Highlights | |
| Business Overview and Strategy | |
| 2016 Achievements | |
| Market Overview | |
| Annual Results | |
| Fourth Quarter Results | |
| Liquidity and Capital Resources | |
| Guidance | |
| Operational and Projects Review | |
| 2016 Reserves and Resources | |
| Non-GAAP Performance Measures | |
| Risks and Uncertainties | |
| Accounting Matters | |
| Controls and Procedures | |
| Reserves and Resources | |
CAUTIONARY STATEMENT REGARDING FORWARD-LOOKING STATEMENTS
This MD&A contains “forward-looking statements” within the meaning of Section 27A of the United States Securities Act of 1933, as amended, Section 21E of the United States Exchange Act of 1934, as amended, the United States Private Securities Litigation Reform Act of 1995, or in releases made by the United States Securities and Exchange Commission, all as may be amended from time to time, and "forward-looking information" under the provisions of applicable Canadian securities legislation, concerning the business, operations and financial performance and condition of Goldcorp. Forward-looking statements include, but are not limited to, statements with respect to the future price of gold, silver, copper, lead and zinc, the estimation of Mineral Reserves (as defined below) and Mineral Resources (as defined below), the realization of Mineral Reserve estimates, the timing and amount of estimated future production, costs of production, targeted cost reductions, capital expenditures, free cash flow, costs and timing of the development of new deposits, success of exploration activities, permitting time lines, hedging practices, currency exchange rate fluctuations, requirements for additional capital, government regulation of mining operations, environmental risks, unanticipated reclamation expenses, timing and possible outcome of pending litigation, title disputes or claims and limitations on insurance coverage. Generally, these forward-looking statements can be identified by the use of forward-looking terminology such as “plans”, “expects” , “is expected”, “budget”, “scheduled”, “estimates”, “forecasts”, “intends”, “anticipates”, “believes”, or variations or comparable language of such words and phrases or statements that certain actions, events or results “may”, “could”, “would”, "should", “might” or “will be taken”, “occur” or “be achieved” or the negative connotation thereof.
Forward-looking statements are necessarily based upon a number of factors and assumptions that, if untrue, could cause the actual results, performances or achievements of Goldcorp to be materially different from future results, performances or achievements expressed or implied by such statements. Such statements and information are based on numerous assumptions regarding present and future business strategies and the environment in which Goldcorp will operate in the future, including the price of gold, anticipated costs and ability to achieve goals. Certain important factors that could cause actual results, performances or achievements to differ materially from those in the forward-looking statements include, among others, gold price volatility, discrepancies between actual and estimated production, Mineral Reserves and Mineral Resources and metallurgical recoveries, mining operational and development risks, litigation risks, regulatory restrictions (including environmental regulatory restrictions and liability), changes in national and local government legislation, taxation, controls or regulations and/or change in the administration of laws, policies and practices, expropriation or nationalization of property and political or economic developments in Canada, the United States and other jurisdictions in which the Company does or may carry on business in the future, delays, suspension and technical challenges associated with capital projects, higher prices for fuel, steel, power, labour and other consumables, currency fluctuations, the speculative nature of gold exploration, the global economic climate, dilution, share price volatility, competition, loss of key employees, additional funding requirements and defective title to mineral claims or property. Although Goldcorp believes its expectations are based upon reasonable assumptions and has attempted to identify important factors that could cause actual actions, events or results to differ materially from those described in forward-looking statements, there may be other factors that cause actions, events or results not to be as anticipated, estimated or intended.
Forward-looking statements are subject to known and unknown risks, uncertainties and other important factors that may cause the actual results, level of activity, performance or achievements of Goldcorp to be materially different from those expressed or implied by such forward-looking statements, including but not limited to: risks related to international operations, including economic and political instability in foreign jurisdictions in which Goldcorp operates; risks related to current global financial conditions; risks related to joint venture operations; actual results of current exploration activities; actual results of current reclamation activities; environmental risks; conclusions of economic evaluations; changes in project parameters as plans continue to be refined; future prices of gold, silver, copper, lead and zinc; possible variations in ore reserves, grade or recovery rates; failure of plant, equipment or processes to operate as anticipated; mine development and operating risks; accidents, labour disputes and other risks of the mining industry; risks associated with restructuring and cost-efficiency initiatives; delays in obtaining governmental approvals or financing or in the completion of development or construction activities; risks related to the integration of acquisitions; risks related to indebtedness and the service of such indebtedness, as well as those factors discussed in the section entitled "Description of the Business – Risk Factors” in Goldcorp’s most recent annual information form available on SEDAR at www.sedar.com and on EDGAR at www.sec.gov. Although Goldcorp has attempted to identify important factors that could cause actual results to differ materially from those contained in forward-looking statements, there may be other factors that cause results not to be as anticipated, estimated or intended. There can be no assurance that such statements will prove to be accurate, as actual results and future events could differ materially from those anticipated in such statements. Accordingly, readers should not place undue reliance on forward-looking statements. Forward-looking statements are made as of the date hereof and, accordingly, are subject to change after such date. Except as otherwise indicated by Goldcorp, these statements do not reflect the potential impact of any non-recurring or other special items or of any disposition, monetization, merger, acquisition, other business combination or other transaction that may be announced or that may occur after the date hereof. Forward-looking statements are provided for the purpose of providing information about management’s current expectations and plans and allowing investors and others to get a better understanding of Goldcorp's operating environment. Goldcorp does not intend or undertake to publicly update any forward-looking statements that are included in this document, whether as a result of new information, future events or otherwise, except in accordance with applicable securities laws.
CAUTIONARY STATEMENT REGARDING CERTAIN MEASURES OF PERFORMANCE
This MD&A presents certain measures, including "total cash costs: by-product", "total cash costs: co-product", ‘‘all-in sustaining costs" and ‘‘adjusted operating cash flow’’, that are not recognized measures under IFRS. This data may not be comparable to data presented by other gold producers. For a reconciliation of these measures to the most directly comparable financial information presented in the consolidated financial statements prepared in accordance with IFRS, see Non-GAAP Financial Performance Measures in this MD&A. The Company believes that these generally accepted industry measures are realistic indicators of operating performance and are useful in performing year over year comparisons. However, these non-GAAP measures should be considered together with other data prepared in accordance with IFRS, and these measures, taken by themselves, are not
Third Quarter Report – 2016
(in United States dollars, tabular amounts in millions, except where noted)
necessarily indicative of operating costs or cash flow measures prepared in accordance with IFRS. This MD&A also contains information as to estimated future all-in sustaining costs. The estimates of future all-in sustaining costs are not based on total production cash costs calculated in accordance with IFRS, which forms the basis of the Company’s cash costs: by-product. The estimates of future all-in sustaining costs are anticipated to be adjusted to include sustaining capital expenditures, corporate administrative expense, exploration and evaluation costs and reclamation cost accretion and amortization, and exclude the effects of expansionary capital, tax payments, dividends and financing costs. Projected IFRS total production cash costs for the full year would require inclusion of the projected impact of future included and excluded items, including items that are not currently determinable, but may be significant, such as sustaining capital expenditures, reclamation cost accretion and amortization and tax payments. Due to the uncertainty of the likelihood, amount and timing of any such items, the Company does not have information available to provide a quantitative reconciliation of projected all-in sustaining costs to a total production cash costs projection.
CAUTIONARY NOTE REGARDING RESERVES AND RESOURCES
Scientific and technical information contained in this MD&A relating to Mineral Reserves and Mineral Resources was reviewed and approved by Gil Lawson, P.Eng., Vice President, Geology and Mine Planning for Goldcorp, and a “qualified person” as defined by Canadian Securities Administrators' National Instrument 43-101 – Standards of Disclosure for Mineral Projects (“NI 43-101”). Scientific and technical information in this MD&A relating to exploration results was reviewed and approved by Sally Goodman, PhD, PGeo, Director, Generative Geology for Goldcorp, and a "qualified person" as defined by NI 43-101. All Mineral Reserves and Mineral Resources have been calculated in accordance with the standards of the Canadian Institute of Mining, Metallurgy and Petroleum ("CIM") and NI 43-101, or the Australasian Code for Reporting of Exploration Results, Mineral Resources and Ore Reserves equivalent. All Mineral Resources are reported exclusive of Mineral Reserves. Mineral Resources that are not Mineral Reserves do not have demonstrated economic viability. Information on data verification performed on the mineral properties mentioned in this MD&A that are considered to be material mineral properties to the Company are contained in Goldcorp’s most recent annual information form and the current technical report for each of those properties, all available on SEDAR at www.sedar.com.
Cautionary Note to United States investors concerning estimates of measured, indicated and inferred resources: The Mineral Resource and Mineral Reserve estimates contained in this MD&A have been prepared in accordance with the requirements of the securities laws in effect in Canada, which differ from the requirements of United States securities laws and uses terms that are not recognized by the United States Securities and Exchange Commission (“SEC”). Canadian reporting requirements for disclosure of mineral properties are governed by NI 43-101. The definitions used in NI 43-101 are incorporated by reference from the CIM Definition Standards adopted by CIM Council on May 10, 2014 (the “CIM Definition Standards”) . U.S. reporting requirements are governed by the SEC Industry Guide 7 (“Industry Guide 7”) under the United States Securities Act of 1933, as amended. These reporting standards have similar goals in terms of conveying an appropriate level of confidence in the disclosures being reported, but embody difference approaches and definitions. For example, the terms “Mineral Reserve”, “Proven Mineral Reserve” and “Probable Mineral Reserve” are Canadian mining terms as defined in in NI 43-101, and these definitions differ from the definitions in Industry Guide 7. Under Industry Guide 7 standards, a “final” or “bankable” feasibility study is required to report reserves and the primary environmental analysis or report must be filed with the appropriate governmental authority. Further, under Industry Guide 7, mineralization may not be classified as "reserve" unless the determination has been made that the mineralization could be economically and legally produced or extracted at the time the reserve determination is made.
While the terms “Mineral Resource”, “Measured Mineral Resource”, “Indicated Mineral Resource” and “Inferred Mineral Resource” are defined in and required to be disclosed by NI 43-101, these terms are not defined terms under Industry Guide 7 and are normally not permitted to be used in reports and registration statements filed with the SEC. United States readers are cautioned not to assume that any part or all of mineral deposits in these categories will ever be converted into reserves. In addition, “Inferred Mineral Resources” have a great amount of uncertainty as to their existence, and great uncertainty as to their economic and legal feasibility. A significant amount of exploration must be completed in order to determine whether an Inferred Mineral Resource may be upgraded to a higher category. Under Canadian regulations, estimates of Inferred Mineral Resources may not form the basis of feasibility or pre-feasibility studies, except in rare cases. United States readers are cautioned not to assume that all or any part of an Inferred Mineral Resource exists or is economically or legally mineable. Disclosure of “contained ounces” in a resource is permitted disclosure under Canadian regulations if such disclosure includes the grade or quality and the quantity for each category of Mineral Resource and Mineral Reserve; however, the SEC normally only permits issuers to report mineralization that does not constitute “reserves” by SEC standards as in place tonnage and grade without reference to unit measures.
Accordingly, information contained in this MD&A containing descriptions of the Goldcorp’s mineral deposits may not be comparable to similar information made public by United States companies subject to the reporting and disclosure requirements under the United States federal securities laws and the rules and regulations thereunder.
Third Quarter Report – 2016
(in United States dollars, tabular amounts in millions, except where noted)
FULL YEAR FINANCIAL AND OPERATIONAL HIGHLIGHTS
Net earnings of $162 million, or $0.19 per share, compared to a net loss of $4.2 billion, or loss of $5.03 per share, in 2015. Net earnings were negatively affected by $0.12 per share of non-cash or other items that the Company believes are not reflective of the performance of the underlying operations.
Operating cash flows of $799 million and adjusted operating cash flows of $1.1 billion(1). Available liquidity was $3.17 billion at December 31, 2016.
Gold production of 2,873,000 ounces at all-in sustaining costs ("AISC") of $856 per ounce, compared to 3,464,000 ounces at AISC of $894 in 2015(1). Gold production was in line with the Company's 2016 guidance with AISC at the low end of the Company's guidance of between $850 and $925 per ounce and was $38 per ounce, or 4%, lower than 2015. The decrease in AISC during the year reflects the Company's focus on cost reductions and the positive effects of the strengthening US dollar. The impact of these reductions was partially offset by lower production at Peñasquito and the exhaustion of surface stockpiles at Cerro Negro and Éléonore.
Renewed growth strategy projected to achieve a 20% increase in gold production, 20% increase in gold reserves and a 20% reduction in our AISC over the next five years. The Company expects the ramp-up to nameplate capacity at Cerro Negro and Éléonore, a continued focus on productivity and efficiency improvements at our existing camps and the advancement of our robust project pipeline to position the Company to deliver significant growth in net asset value per share.
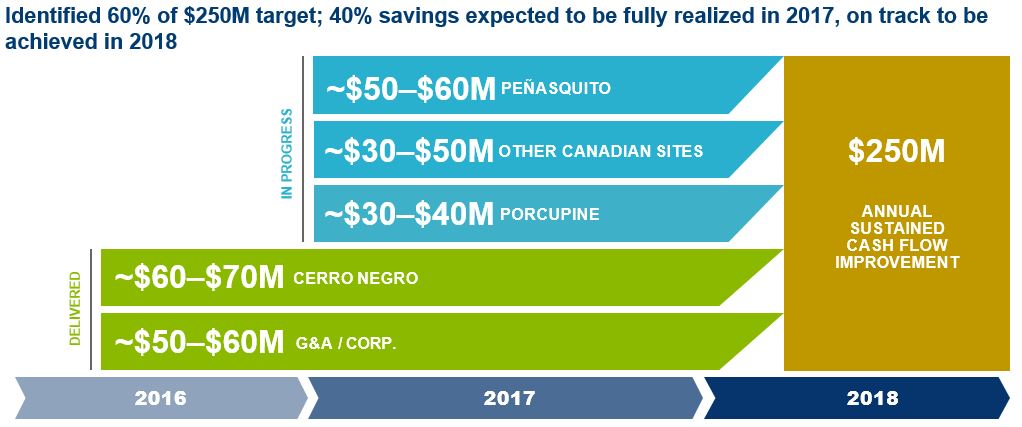
Identified 60% of the targeted $250 million in sustainable efficiencies; 40% delivered by the end of 2016. The Company is well underway toward achieving its $250 million target in sustainable annual efficiencies by 2018 as initiatives at Cerro Negro and corporate offices have been implemented with associated annual savings of $65 million and $50 million, respectively. A further $35 million of improvement initiatives have been identified at Porcupine.
Optimized the portfolio. Following the acquisition of the Coffee project in July 2016, the Company announced in January 2017 that it entered into agreements to sell each of its Los Filos mine in Mexico for estimated consideration of $438 million, and its 100% interest in the Cerro Blanco project in Guatemala for potential consideration of up to approximately $50 million, including contingent consideration. Both transactions are expected to close in the first quarter of 2017. The acquisition and asset sales are aligned with the Company's strategy to focus on large scale camps, that it believes can deliver economies of scale.
| |
| (1) | The Company has included non-GAAP performance measures on an attributable (or Goldcorp's share) basis throughout this document. AISC per ounce and adjusted operating cash flows are non-GAAP financial performance measures with no standardized definition under IFRS. For further information and detailed reconciliations, please see pages 46-52 of this MD&A. |
Third Quarter Report – 2016
(in United States dollars, tabular amounts in millions, except where noted)
OVERVIEW
Goldcorp is a leading gold producer focused on responsible mining practices, with production from a portfolio of long-life high quality assets throughout the Americas that it believes positions the Company to deliver long-term value.
The Company’s principal producing mining properties are comprised of the Éléonore, Musselwhite, Porcupine and Red Lake mines in Canada; the Peñasquito mine in Mexico; the Cerro Negro mine in Argentina; and the Pueblo Viejo mine (40.0% interest) in the Dominican Republic.
The Company’s current sources of operating cash flows are primarily from the sale of gold, silver, lead, zinc and copper. Goldcorp's principal product is gold doré with the refined gold bullion sold primarily in the London spot market. As a result, Goldcorp is not dependent on a particular purchaser with regard to the sale of the gold doré. In addition to gold, the Company also produces silver, copper, lead and zinc primarily from concentrate produced at the Peñasquito and Alumbrera mines, which is sold to third party smelters and refineries.
Goldcorp has an investment-grade credit rating, supported by a strong balance sheet, and remains 100% unhedged to gold sales, providing full exposure to gold prices.
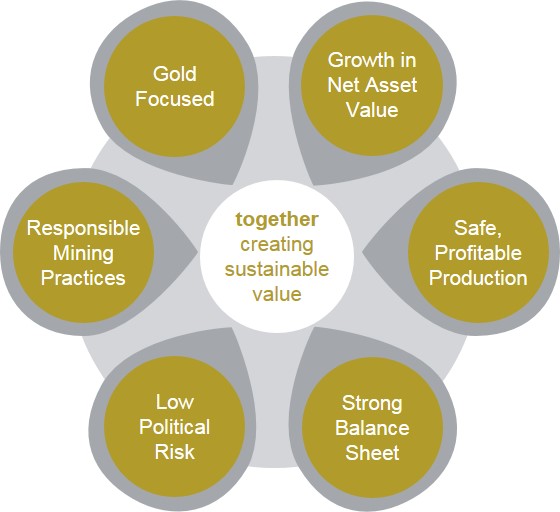
STRATEGY
Goldcorp's vision is to create sustainable value for all of its stakeholders by focusing on growing net asset value (“NAV”) per share to generate long-term shareholder value. With a portfolio of large, long-life assets that provide economies of scale, coupled with low cash costs and underpinned by a strong balance sheet, Goldcorp continues to optimize its portfolio of assets and reinvest in the pipeline of organic opportunities to drive increasing NAV per share.
The Company completed a reorganization of its leadership and operations in 2016, moving to a lean, decentralized model. Under the decentralized model, the mine general managers are accountable for growing the NAV of their individual businesses while the focus of the corporate office will be to provide governance, oversight and allocate capital. These changes are expected to result in a streamlined organization focused on delivering long-term shareholder value.
The Company has laid out a growth strategy that is expected to deliver a 20% increase in gold production, a 20% increase in gold reserves and a 20% reduction in all-in sustaining costs over the next five years. In this pursuit, Goldcorp is committed to being responsible stewards of the environment and building collaborative partnerships with communities, governments and all other stakeholders for mutual success.
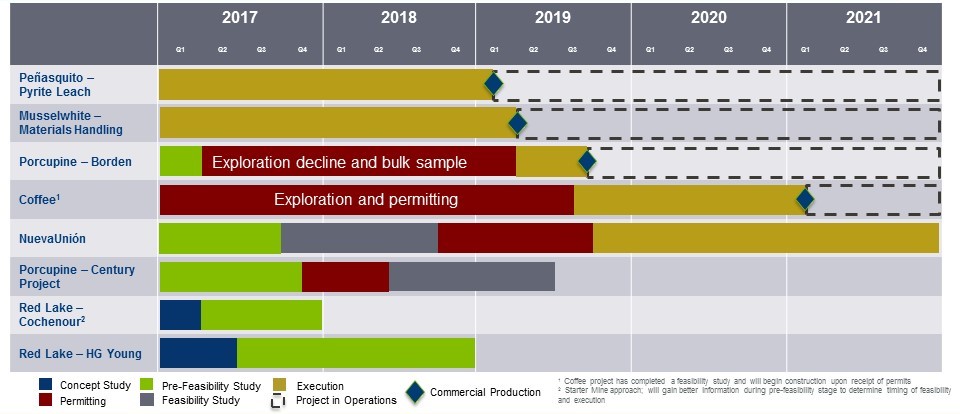
Over the next five years, the Company expects gold production to increase to approximately 3 million ounces. This is a result of the ramp-up to nameplate capacity at Cerro Negro and Éléonore, increased grades at Peñasquito following an intensive stripping campaign, the execution of the Pyrite Leach project at Peñasquito and the Materials Handling project at Musselwhite, and initial production from the Borden project and the Coffee project. This growth profile excludes production potential from the Cochenour and HG Young projects at the Red Lake camp, the Century project at the Porcupine camp and the NuevaUnión project in Chile.
The Company expects AISC to decrease by 20% to approximately $700(1) per ounce over the next five years, driven by a company-wide program launched in 2016 to drive down costs and deliver productivity improvements which is expected to result in approximately $250 million in annual sustainable efficiencies. Costs are also expected to decrease as a result of increased metal production, lower sustaining capital expenditures and continued portfolio optimization. The Company expects reserves to increase by 20% to 50 million ounces over the next five years from the conversion of existing resources at the Century project, Peñasquito, Cerro Negro and Pueblo Viejo and exploration at our extensive and diversified portfolio of mining camps in the Americas.
Third Quarter Report – 2016
(in United States dollars, tabular amounts in millions, except where noted)
With a solid balance sheet, Goldcorp believes it is well-positioned to weather gold price volatility. The Company's capital allocation strategy focuses on investing in its pipeline of organic growth opportunities, further debt reduction and returning capital to its shareholders by paying a sustainable dividend. Furthermore, Goldcorp has the flexibility to take advantage of corporate development opportunities in lower political risk jurisdictions that would be accretive to NAV per share, and leverage its exploration spending in the most efficient way possible through small toehold investments in junior mining companies.
(1) Refer to footnote (3) on page 23 of this MD&A regarding the Company's projection of AISC.
2016 ACHIEVEMENTS
Progress Delivering $250 million of Sustainable Annual Cash Flow Improvements:
During 2016, the Company began implementing a productivity and cost optimization program to deliver $250 million in sustainable annual efficiencies by 2018. Cerro Negro initiated the effort in the second quarter with substantial workforce reductions and other improvement initiatives to reduce costs by $65 million, which were partially offset by temporary setbacks in lower productivity caused by labour disruptions. Goldcorp continues to work on optimizing productivity at Cerro Negro through intensive training of its workforce and productivity improvements. At Porcupine, the Company is targeting $35 million in efficiency improvements and cost reductions in 2017 resulting from improved development rates and productivity at Hoyle Pond, improved productivity at Hollinger and improved recovery and costs at the mill. Further, Goldcorp identified and began executing $50 million in cost reductions in 2016 from general and administrative expenses and capital expenditures from its corporate offices, relative to its 2016 budget. Peñasquito is in the early stages of the productivity and cost optimization efforts, but Goldcorp expects to realize over $50 million in operating cash flow improvements relative to 2016 actual results. Potential opportunities at Peñasquito relate to improved mining and processing and overall equipment effectiveness, and ongoing cost reductions from major contracts. Red Lake and Éléonore started their productivity and cost optimization improvement programs in the first quarter of 2017 and, along with Musselwhite, Goldcorp expects it will attain the balance of the $250 million target by 2018.
Organizational Restructuring and Executive and Senior Management Appointments:
Effective January 1, 2017, Todd White, most recently Senior Vice President, Technical Services and Business Excellence, was appointed Executive Vice-President and Chief Operating Officer. Todd has over two decades of experience in the mining sector. Prior to joining Goldcorp in 2014, he was the Senior Vice President, South America at Newmont Mining Corporation. Since joining Goldcorp he has focused on driving a culture of continuous performance improvement and implemented advancements in efficiency and sustainability through technical innovation.
As part of the Company's organizational re-design in 2016, the Company strengthened the senior management team with the recruitment of several key individuals. Paul Harbidge was appointed Senior Vice President, Exploration reporting to Todd White. Paul is responsible for the development, implementation and management of the global exploration function within the decentralized model. Paul brings over 20 years of mining experience to Goldcorp, most recently as head of exploration at Randgold Resources Limited.
Jason Attew was appointed Senior Vice President, Corporate Development & Strategy, reporting to Russell Ball, Executive Vice President, Chief Financial Officer and Corporate Development. In his role, Jason leads the optimization of the Company’s portfolio of assets, while evaluating new opportunities that are consistent with the Company's strategy of increasing NAV per share. Jason is a mining and metals banking executive with over 20 years of experience.
Third Quarter Report – 2016
(in United States dollars, tabular amounts in millions, except where noted)
Wade Bristol was appointed Senior Vice President, Canada, and is responsible for the overall leadership of the Canadian mining operations. Wade joined Goldcorp in July 2014 as the Vice President, Mine Improvement & Support. Prior to Goldcorp he served in various General Manager capacities for Newmont Mining Corporation in North America.
Steven Thomas was appointed to the new role of Chief Financial Officer, Canada, reporting to Wade Bristol, Senior Vice President, Canada and David Splett was appointed to the new role of Chief Financial Officer, Latin America, reporting to Joe Dick, Senior Vice President, Latin America. As part of the regional leadership teams, Steven and David provide financial analysis, interpretation and metrics to facilitate strategic decision making related to the management of the regional businesses. Steven brings over 30 years of financial experience to Goldcorp, with the last 13 years in the mining industry with De Beers Canada Inc. David brings with him over 24 years of experience in the resource industry, most recently as Vice President, Finance for Mosaic Corporation.
Board of Directors Appointment:
In September 2016, the Company announced the appointment Charlie Sartain to its Board of Directors, effective as of January 1, 2017. Mr. Sartain is a mining engineer with over 30 years of mining experience and was previously the Chief Executive Officer of Xstrata's global copper business. His extensive technical knowledge and operational experience will be invaluable as the Company continues to optimize its portfolio and advance the organic pipeline of opportunities.
Advanced Project Pipeline:
Aligned with the Company's strategy to reinvest returns in a pipeline of organic opportunities, Goldcorp committed over a billion dollars of growth capital in 2016. This capital will support the growth in NAV of the Company through an estimated 20% growth in production over the next five years and a 20% decrease in AISC. Growth capital for 2016 included expenditures on the Coffee project following its acquisition on July 19, 2016, Peñasquito's Pyrite Leach project ("PLP"), with an expected capital investment of approximately $420 million, and Musselwhite's Materials Handling project ("MHP"), with an expected capital investment of approximately $90 million. Each of the PLP and MHP are expected to increase gold production commencing in 2019 and the Company is targeting to achieve commercial production at the Coffee project in the first quarter of 2021. During 2016, Goldcorp also advanced the Borden project, located approximately 180 kilometres south-west of Goldcorp's Porcupine mine, where first gold is targeted for 2019.
Renewed Exploration Focus:
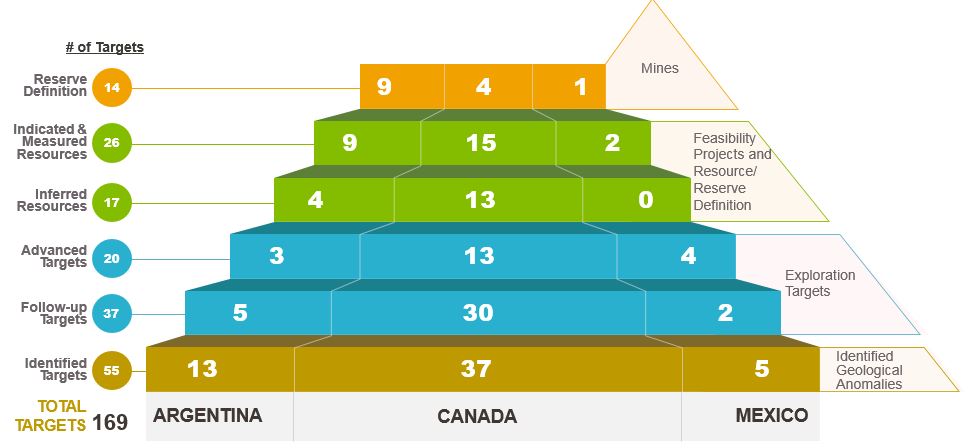
Goldcorp’s exploration strategy is twofold. Firstly, mineral reserve replacement is expected through the conversion of mineral resources and extending known mineralization at the mine sites. Secondly, the development of a pipeline of targets with increasing degrees of confidence are expected to deliver opportunities for future discoveries. The Company implemented this strategy in the third quarter of 2016 by applying both rigorous geological and stringent economic filters to rank and prioritize targets which will then either be advanced or rejected, while generative work ensures a constant supply of new targets. Goldcorp's primary focus is on brownfields exploration and the leverage of the exploration potential within the mining camps to increase the project NAV through new discoveries at Porcupine, Red Lake, Musselwhite, Éléonore, the Coffee project, Peñasquito, Cerro Negro and Pueblo Viejo.
The Company's approach to greenfield exploration is to make toehold investments in junior mining companies which operate in geological prospective terranes and have the technical capabilities to make discoveries that meet Goldcorp’s strategic filters.
Goldcorp restructured its Geology group in 2016 to support its exploration strategy, adding a core team of expert geoscientists covering the principal disciplines of structural geology, geophysics and geochemistry, together with a chief geologist and Directors for the Canadian and Latin American regions who will provide support to the field teams in achieving their objectives.
Third Quarter Report – 2016
(in United States dollars, tabular amounts in millions, except where noted)
Corporate Developments:
Acquisition of Kaminak Gold Corporation
On July 19, 2016, the Company completed the acquisition of 100% of the issued and outstanding common shares of Kaminak Gold Corporation ("Kaminak") pursuant to a plan of arrangement (the "Arrangement") for total consideration of approximately C$530 million, including transaction costs. Under the Arrangement, each common share of Kaminak was exchanged for 0.10896 common shares of Goldcorp.
Kaminak's principal asset is the 100% owned Coffee project ("Coffee"), a hydrothermal gold deposit located approximately 130 kilometres south of the City of Dawson, Yukon. Coffee is a high-grade, open pit, heap leach mining project with total gold indicated mineral resources of 3.0 million ounces, inclusive of total gold probable mineral reserves of 2.2 million ounces, and inferred mineral resources of 2.2 million ounces as outlined in the feasibility study prepared for Kaminak by JDS Energy and Mining Inc. in January 2016. The Company estimates average annual gold production of approximately 200,000 ounces for the first five years of production based on Kaminak's feasibility study. The Coffee land package, comprising over 60,000 hectares, demonstrates potential for near-mine discoveries and the potential for the development of a large scale camp that can deliver economies of scale.
The acquisition of Kaminak is consistent with the Company's strategy of partnering with junior exploration companies to identify and develop mining districts with significant exploration potential. Coffee is located within a politically stable jurisdiction and provides Goldcorp with an opportunity to add high quality ounces to our development pipeline at low AISC.
Divestitures
Aligned with the Company's strategy to continually upgrade its portfolio through the divestiture of non-core assets and strengthen its balance sheet, Goldcorp entered into agreements in January 2017 to sell each of its Los Filos Mine in Mexico and its 100% interest in the Cerro Blanco project in Guatemala as described below.
On January 4, 2017, the Company entered into an agreement to sell its 100% interest in the Cerro Blanco project, located in Guatemala, to Bluestone Resources Inc. (“Bluestone”). Under the terms of the agreement, Goldcorp will receive consideration at closing of $18 million in cash, a 1% Net Smelter Return royalty on production, and common shares of Bluestone representing approximately 9.9% of the issued and outstanding shares upon completion of the transaction. Goldcorp will receive an additional $15 million in cash upon declaration of commercial production at Cerro Blanco.
On January 11, 2017, Goldcorp entered into a share purchase agreement (the “Agreement”) with Leagold Mining Corporation (“Leagold”), pursuant to which it has agreed to sell its Los Filos mine in Mexico to Leagold. Under the terms of the Agreement, Goldcorp will receive estimated consideration of $438 million, consisting of $279 million in cash (subject to certain closing adjustments), $71 million in Leagold common shares, and retain certain tax receivables of approximately $88 million. The common shares issued to Goldcorp as consideration are expected to represent approximately 30% of the issued and outstanding shares of Leagold following the closing of the transaction. In connection with the transaction, Goldcorp recognized a reversal of a 2015 impairment in mining interests at Los Filos of approximately $59 million. The transaction is subject to customary closing conditions and is expected to close in the first quarter of 2017.
Acquisition of Gold Stream at El Morro
On February 7, 2017, the Company entered into a binding agreement with New Gold Inc. pursuant to which it agreed to purchase New Gold's 4% gold stream on the El Morro deposit, part of the company's 50/50 NuevaUnión joint venture, for cash consideration of $65 million. The transaction is expected to close in the first quarter of 2017.
Strengthened Balance Sheet:
As Goldcorp exited an intensive phase of capital spending with the completion of construction of the Cerro Negro and Éléonore mines in 2015, the Company focused on deleveraging and strengthening its balance sheet in 2016. At December 31, 2016, the Company's debt was $2.5 billion, a $180 million, or 7%, decrease from December 31, 2015. Including the debt of the Company's associates, at December 31, 2016, the Company's debt was $2.7 billion, a $330 million, or 11%, decrease from December 31, 2015(1). The decrease in the Company's debt was primarily due to the repayment of the Company's Argentine debt in the fourth quarter of 2016. With the repayment of these loans, the Company has no debt repayable until March 2018, when the Company's $500 million notes become due. The remaining $2.0 billion, or 80%, of the Company's debt is not repayable until after 2020.
Liquidity is expected to further improve in the first quarter of 2017 from the expected closing of the sale of the Los Filos mine and Cerro Blanco project.
(1) Includes the Company's share of debt of $160 million and $nil and debt repayments (net) of $100 million and $50 million relating to the Company's investments in Pueblo Viejo and Alumbrera, respectively.
Third Quarter Report – 2016
(in United States dollars, tabular amounts in millions, except where noted)
MARKET OVERVIEW
Gold
The market price of gold is the primary driver of Goldcorp's profitability. The price of gold can fluctuate widely and is affected by a number of industry and macroeconomic factors including the sale or purchase of gold by central banks and financial institutions, interest rates, exchange rates, inflation or deflation, global and regional supply and demand and the political and economic conditions of major gold-producing and gold-consuming countries throughout the world.

The gold market was split during 2016, with a promising rally over the first six months all but erased in a seven-week period following the November US presidential elections. Despite the decline in gold prices in late 2016, in the face of a strong US dollar and the threat of higher interest rates, gold still managed to finish the year with a gain of approximately 8%. After starting 2016 at its lowest price for the year at $1,063 per ounce, the metal rallied steadily to a peak of $1,375 per ounce in early July, aided by geopolitical uncertainty surrounding Britain’s future in the European Union. The metal, however, failed to hold these gains, and closed the year at $1,151 per ounce, well off its peak. The Company realized an average gold price of $1,244 per ounce in 2016 (an 8% increase compared to $1,153 per ounce in 2015) and $1,181 per ounce in the fourth quarter of 2016. Political uncertainty surrounding the transition to a new US government in 2017 is likely to influence the market over the next 12 months, as will elections in a number of European countries and the unknown impact on long-term physical demand of India’s recent demonetization of high value bank notes and efforts to reduce the use of cash in the economy.
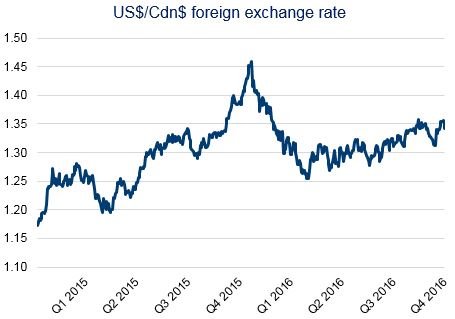
Currency markets
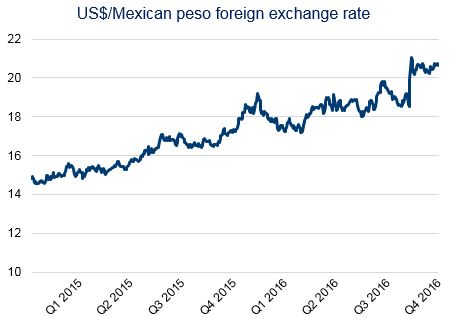
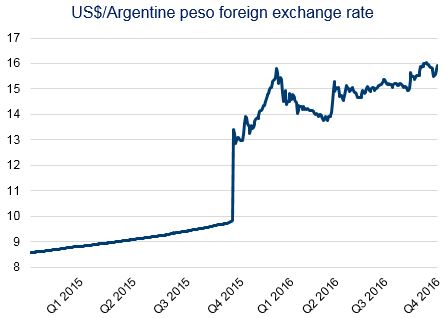
The results of Goldcorp's mining operations are affected by the US dollar exchange rates. The Company has exposure to the Canadian dollar relating to its Red Lake, Éléonore, Porcupine and Musselwhite operations, exposure to the Mexican peso relating to its Peñasquito and Los Filos operations, exposure to the Argentine peso relating to its Cerro Negro operation, exposure to the Dominican Republic peso relating to its investment in Pueblo Viejo and exposure to the Guatemalan quetzal relating to its Marlin operation. The Company's exposure to the Mexican peso and Guatemalan quetzal is expected to partially decrease in the second quarter of 2017 after the expected closing of the sale of the Los Filos mine and closure of the Marlin mine, respectively.
Fluctuations in the US dollar can cause the volatility of costs reported in US dollars. In addition, monetary assets and liabilities that are denominated in non-US dollar currencies, such as cash and cash equivalents and value-added taxes are subject to currency risk. Goldcorp is further exposed to currency risk through non-monetary assets and liabilities of entities whose taxable profit or tax loss are denominated in non-US dollar currencies. Changes in exchange rates give rise to temporary differences resulting in deferred tax liabilities with the resulting deferred tax charged or credited to income tax expense.
Goldcorp's financial risk management policy allows the hedging of foreign exchange exposure to reduce the risk associated with currency fluctuations. The Company enters into Mexican peso currency hedge contracts to purchase Mexican pesos at pre-determined US dollar amounts. These contracts are entered into to normalize operating expenses and capital spend at Peñasquito expressed in US dollar terms.
Third Quarter Report – 2016
(in United States dollars, tabular amounts in millions, except where noted)
Currency markets were volatile throughout 2016 as markets fluctuated due to changing expectations of interest rate increases in the US, as well as the impact of Brexit and the US presidential elections. The Canadian dollar weakened slightly during the year, whereas the Mexican peso continued to underperform and traded to historic lows against the US dollar late in the year.
Following the Argentine government elimination of currency controls in late 2015, the Argentine peso continued to weaken in 2016, punctuated by significant volatility in the first half of the year.
Argentine Economy
Argentina's political and economic landscape has undergone significant change over the past year, and this has impacted Cerro Negro. The new Argentine government implemented structural measures at the end of 2015 and in the first quarter of 2016 to reduce or remove controls and restrictions on capital flows and foreign exchange. While these changes have eased restrictions, the economy continues to recover slowly with some obstacles yet to be overcome. The official annual inflation rate stands at more than 40 percent. The increase in the inflation rate was expected as many subsidies were eliminated. Economic activity, while slow in 2016, is expected to start recovering in 2017 in response to the government’s market-oriented reforms.
Third Quarter Report – 2016
(in United States dollars, tabular amounts in millions, except where noted)
OVERVIEW OF ANNUAL FINANCIAL AND OPERATING RESULTS
|
| | | | | | | | | |
| | 2016 |
| 2015 |
| 2014 |
|
| Financial Results | | | |
Revenues (1)(2) | $ | 3,510 |
| $ | 4,375 |
| $ | 3,436 |
|
Net earnings (loss) from continuing operations (2) | $ | 162 |
| $ | (4,203 | ) | $ | (2,168 | ) |
| Net earnings (loss) | $ | 162 |
| $ | (4,157 | ) | $ | (2,159 | ) |
Net earnings (loss) from continuing operations per share (2) | | | |
| – Basic and diluted | $ | 0.19 |
| $ | (5.08 | ) | $ | (2.67 | ) |
| Net earnings (loss) per share | | | |
| – Basic and diluted | $ | 0.19 |
| $ | (5.03 | ) | $ | (2.66 | ) |
| Operating cash flow | $ | 799 |
| $ | 1,430 |
| $ | 1,014 |
|
| Adjusted operating cash flow | $ | 1,120 |
| $ | 1,651 |
| $ | 1,393 |
|
| Expenditures on mining interests (cash basis) | $ | 744 |
| $ | 1,238 |
| $ | 2,126 |
|
| – Sustaining | $ | 537 |
| $ | 705 |
| $ | 731 |
|
| – Expansionary | $ | 207 |
| $ | 533 |
| $ | 1,395 |
|
| Dividends paid | $ | 97 |
| $ | 370 |
| $ | 488 |
|
Operating Results (3) | | | |
| Gold produced (thousands of ounces) | 2,873 |
| 3,464 |
| 2,871 |
|
Gold sold (thousands of ounces) (1) | 2,869 |
| 3,591 |
| 2,673 |
|
| Silver produced (thousands of ounces) | 28,100 |
| 40,400 |
| 36,800 |
|
| Copper produced (thousands of pounds) | 68,900 |
| 51,500 |
| 84,800 |
|
| Lead produced (thousands of pounds) | 109,400 |
| 173,900 |
| 152,300 |
|
| Zinc produced (thousands of pounds) | 262,900 |
| 388,800 |
| 329,700 |
|
| Average realized gold price (per ounce) | $ | 1,244 |
| $ | 1,153 |
| $ | 1,264 |
|
Cash costs: by-product (per ounce) (4) | $ | 573 |
| $ | 605 |
| $ | 542 |
|
Cash costs: co-product (per ounce) (5) | $ | 649 |
| $ | 685 |
| $ | 668 |
|
| All-in sustaining costs (per ounce) | $ | 856 |
| $ | 894 |
| $ | 949 |
|
All-injury frequency rate (6) | 1.12 |
| 1.26 |
| 1.50 |
|
| |
| (1) | Excludes pre-commissioning sales ounces from Cerro Negro prior to January 1, 2015, and Éléonore prior to April 1, 2015 as costs incurred, net of proceeds from sales, were credited against capitalized project costs. |
| |
| (2) | In accordance with the requirements of IFRS 5 – Non-current assets held for sale and discontinued operations, the Wharf mine was classified as a discontinued operation for the year ended December 31, 2015, accordingly the 2014 comparative information for Wharf has been re-presented. The sale of Wharf was completed on February 20, 2015. |
| |
| (3) | The Company has presented the non-GAAP performance measures on an attributable (or Goldcorp's share) basis in the table above. AISC and adjusted operating cash flows are non-GAAP financial performance measures with no standardized definition under IFRS. For further information and detailed reconciliations, please see pages 46-52 of this report. |
| |
| (4) | Total cash costs: by-product, per ounce, is calculated net of Goldcorp’s share of by-product sales revenues (by-product silver sales revenues for Cerro Negro, Marlin and Pueblo Viejo; by-product lead, zinc and copper sales revenues and 75% of silver sales revenues for Peñasquito at market silver prices, and 25% of silver sales revenues for Peñasquito at $4.09 per silver ounce (2015 – $4.07 per silver ounce) sold to Silver Wheaton Corp. and by-product copper and silver sales revenues for Alumbrera). |
| |
| (5) | Total cash costs: co-product, per ounce, is calculated by allocating Goldcorp’s share of production costs to each co-product (Alumbrera (copper); Marlin (silver); Pueblo Viejo (silver and copper); Peñasquito (silver, lead and zinc)) based on the ratio of actual sales volumes multiplied by budget metal prices (see page 46). |
| |
| (6) | Based on 200,000 hours worked. |
Third Quarter Report – 2016
(in United States dollars, tabular amounts in millions, except where noted)
REVIEW OF ANNUAL FINANCIAL RESULTS
Year ended December 31, 2016 compared to the year ended December 31, 2015
Net earnings for the year ended December 31, 2016 were $162 million, or $0.19 per share, compared to a net loss of $4,157 million, or $5.03 per share, for the year ended December 31, 2015. The net loss in 2015 was primarily due to the impairment of mining interests and goodwill recognized in the fourth quarter of 2015, partially offset by gains on the disposition of the investment in Tahoe Resources Inc. and the sale of Wharf in 2015.
Earnings from operations, associates and joint ventures for the year ended December 31, 2016 was $369 million, compared to a loss from operations, associates and joint ventures of $4,863 million for the year ended December 31, 2015. The increase in earnings was primarily due to the impairment expense recognized in 2015 compared to a reversal of impairment in 2016, favourable foreign exchange impacts on production costs, a reduction in depreciation and depletion due to lower sales volumes and the impact of the impairments recognized in 2015, and higher gold and silver prices, partially offset by lower expected sales volumes and operational challenges at Peñasquito and Cerro Negro.
Net earnings and earnings per share in the years ended December 31, 2016 and 2015 were affected by, among other things, the following non-cash or other items that management believes are not reflective of the performance of the underlying operations (items are denoted as (increases)/decreases to net earnings and net earnings per share):
|
| | | | | | | | | | | | | | | | | | |
| | Year ended December 31, 2016 | Year ended December 31, 2015 |
| (in millions, except per share) | Pre-tax |
| After-tax |
| Per share ($/share) |
| Pre-tax | After-tax | Per share ($/share) |
Negative deferred tax effects of foreign exchange on tax assets and liabilities and losses (1) | $ | — |
| $ | 88 |
| $ | 0.10 |
| $ | — |
| $ | 362 |
| $ | 0.44 |
|
| Impairment (reversal) expense, net | $ | (49 | ) | $ | (49 | ) | $ | (0.06 | ) | $ | 4,906 |
| $ | 3,896 |
| $ | 4.71 |
|
| Restructuring costs | $ | 50 |
| $ | 34 |
| $ | 0.04 |
| $ | — |
| $ | — |
| $ | — |
|
| Unrealized foreign exchange loss on Argentine peso denominated construction value-added tax receivable | $ | 26 |
| $ | 26 |
| $ | 0.03 |
| $ | 75 |
| $ | 75 |
| $ | 0.09 |
|
| Revisions in estimates and liabilities incurred on reclamation and closure cost obligations at inactive and closed sites | $ | (17 | ) | $ | (11 | ) | $ | (0.01 | ) | $ | (39 | ) | $ | (28 | ) | $ | (0.03 | ) |
Mine-site severance (2) | $ | 13 |
| $ | 13 |
| $ | 0.02 |
| $ | — |
| $ | — |
| $ | — |
|
| Gains on dispositions of, and dilution of ownership interest in, mining interests | $ | — |
| $ | — |
| $ | — |
| $ | (414 | ) | $ | (372 | ) | $ | (0.45 | ) |
| Gain on sale of Wharf | $ | — |
| $ | — |
| $ | — |
| $ | (65 | ) | $ | (43 | ) | $ | (0.05 | ) |
| |
| (1) | Negative deferred tax effects of foreign exchange on tax assets and liabilities and losses of $88 million in the year ended December 31, 2016 (year ended December 31, 2015 – $362 million) is composed of a foreign exchange loss on the translation of current and deferred income tax assets and liabilities, arising primarily from acquisitions and dispositions, of $189 million (year ended December 31, 2015 – $544 million), partially offset by Argentine tax deductible foreign exchange losses on US dollar denominated debt in local currency of $101 million (year ended December 31, 2015 – $182 million). |
| |
| (2) | Mine-site severance relates to workforce reductions at the Company's Marlin mine as it is scheduled to close by the end of the first quarter of 2017. |
Revenues
|
| | | | | | | | | |
| | | 2016 (1) | 2015 (1) | Change % |
| Gold | | | |
| | Revenue (millions) | $ | 2,861 |
| $ | 3,502 |
| (18 | )% |
| | Ounces sold (thousands) | 2,308 |
| 3,052 |
| (24 | )% |
| | Average realized price | $ | 1,243 |
| $ | 1,151 |
| 8 | % |
| Silver | | | |
| | Revenue (millions) | $ | 384 |
| $ | 541 |
| (29 | )% |
| | Ounces sold (thousands) | 26,639 |
| 41,776 |
| (36 | )% |
| | Average realized price | $ | 15.14 |
| $ | 13.80 |
| 10 | % |
| Other metals | | | |
| | Revenue (millions) | $ | 265 |
| $ | 332 |
| (20 | )% |
| Total revenue (millions) | $ | 3,510 |
| $ | 4,375 |
| (20 | )% |
| |
| (1) | Excludes attributable share of revenues from the Company's associates. |
Third Quarter Report – 2016
(in United States dollars, tabular amounts in millions, except where noted)
Revenues decreased by $865 million, or 20%, primarily due to decreases in gold and silver sales volumes of 24% and 36%, respectively. The lower sales volumes were primarily a result of lower production at Peñasquito due to lower ore grade and recovery, and at Cerro Negro due to lower mill throughput from stockpiled ore processed in 2015. The impact of the decrease in sales volumes was partially offset by higher realized prices for gold and silver of 8% and 10%, respectively.
Production Costs
|
| | | | | | | | |
| Years ended December 31 | 2016 |
| 2015 |
| Change % |
| Raw materials and consumables | $ | 937 |
| $ | 998 |
| (6 | )% |
| Salaries and employee benefits | 500 |
| 582 |
| (14 | )% |
| Contractors | 408 |
| 486 |
| (16 | )% |
| Royalties | 69 |
| 93 |
| (26 | )% |
| Mine-site severance | 13 |
| — |
| — |
|
| Write down of inventories to net realizable value | 10 |
| 158 |
| (94 | )% |
| Revision of reclamation and closure cost provision | (17 | ) | (39 | ) | 56 | % |
| Change in inventories | (5 | ) | 114 |
| (104 | )% |
| Other | 151 |
| 188 |
| (20 | )% |
| Total Production costs | $ | 2,066 |
| $ | 2,580 |
| (20 | )% |
Production costs decreased by $514 million, or 20%, primarily due to the favourable impact of the strengthening US dollar against the Mexican peso (approximately $80 million) and the Canadian dollar (approximately $30 million); the impact of the devaluation of the Argentine peso when it became a floating exchange rate in December 2015 (approximately $75 million), the impact of lower inventory carrying value reductions at Los Filos in 2016 compared to 2015 (approximately $150 million); the impact of 115,000 ounces produced in 2014 at Cerro Negro being sold in 2015 (approximately $80 million) and an overall decrease in costs due to lower production (approximately $100 million).
Depreciation and Depletion
|
| | | | | | | | |
| | 2016 | 2015 | Change % |
| Depreciation and Depletion (millions) | $ | 1,024 |
| $ | 1,493 |
| (31 | )% |
Sales ounces (thousands) (1) | 2,308 |
| 3,052 |
| (24 | )% |
| Depreciation and Depletion per ounce | $ | 444 |
| $ | 489 |
| (9 | )% |
| |
| (1) | Excludes attributable share of revenues from the Company's associates. |
Depreciation and depletion decreased by $469 million, or 31%, mainly due to lower sales volumes at Peñasquito and Cerro Negro and the impact of impairments on mining interests recognized in the fourth quarter of 2015.
Share of Net Earnings (Loss) of Associates and Joint Venture
|
| | | | | | | | | |
| (in millions) | 2016 | 2015 | Change $ |
| Pueblo Viejo | $ | 169 |
| $ | 53 |
| $ | 116 |
|
| Alumbrera | — |
| (62 | ) | 62 |
|
| NuevaUnión | 2 |
| — |
| 2 |
|
| Tahoe | — |
| 8 |
| (8 | ) |
| Share of net earnings (loss) of associates and joint venture | $ | 171 |
| $ | (1 | ) | $ | 172 |
|
The increase in the Company’s share of earnings of associates and joint venture of $172 million for the year ended December 31, 2016 compared to the year ended December 31, 2015 was primarily due to an increase in net earnings from Pueblo Viejo in 2016 compared to 2015 and a net loss of $62 million from Alumbrera in 2015. The increase in net earnings from Pueblo Viejo in 2016 compared to 2015 was primarily due to higher production, lower operating costs, the receipt of insurance proceeds relating to the oxygen plant failures in 2015 and lower depreciation and depletion costs. With respect to Alumbrera, at December 31, 2015, the Company recognized an impairment of its investment in Alumbrera and the carrying amount of its interest was reduced to zero. As at January 1, 2016, the Company has discontinued recognizing its share of losses of Alumbrera and did not recognize its share of earnings of Alumbrera for the year ended December 31, 2016, as future earnings will be recognized by the Company only after the Company's share of future earnings equals its share of losses not recognized.
Third Quarter Report – 2016
(in United States dollars, tabular amounts in millions, except where noted)
Impairment reversal (expense)
|
| | | | | | |
| (in millions) | 2016 |
| 2015 |
|
| Red Lake | $ | — |
| $ | (1,213 | ) |
| Porcupine | — |
| (123 | ) |
| Éléonore | — |
| (398 | ) |
| Peñasquito | — |
| (1,181 | ) |
| Los Filos | 59 |
| (752 | ) |
| Marlin | (10 | ) | (293 | ) |
| Alumbrera | — |
| (107 | ) |
| Project Corridor | — |
| (200 | ) |
| Pueblo Viejo | — |
| (610 | ) |
| Other | — |
| (29 | ) |
| Impairment reversal (expense) | $ | 49 |
| $ | (4,906 | ) |
The 2016 net impairment reversal was comprised of a reversal of impairment at Los Filos of $59 million, which was based on the expected proceeds from the sale to Leagold, offset by an impairment expense at Marlin of $10 million relating to land.
At December 31, 2015, the Company’s market capitalization deficiency was an indicator of impairment. This necessitated a recoverable value assessment on all of the Company's assets and an impairment charge of $4,906 million ($3,896 million, net of tax) of mining interests and goodwill was booked as a result.
Corporate Administration
Corporate administration expenses decreased by $20 million in 2016 compared to 2015 due primarily to reductions in corporate and regional office costs associated with the Company's productivity and cost optimization program to deliver $250 million in sustainable annual efficiencies by 2018 and the favourable impact of the strengthening US dollar of approximately $4 million.
Restructuring Charges
Restructuring costs were $50 million for the year ended December 31, 2016 compared to $nil for the year ended December 31, 2015. The restructuring costs related primarily to severance costs associated with involuntary and voluntary workforce reductions to increase efficiencies at mine sites and corporate offices.
Gain (Loss) on Derivatives
The net gain on derivatives of $3 million for the year ended December 31, 2016 was comprised of unrealized gains on warrants of $9 million, partially offset by net losses on foreign currency contracts. The net loss on derivatives of $54 million for the year ended December 31, 2015 was primarily comprised of net losses on foreign currency and commodity contracts. In 2016, the Company hedged Mexican peso currency exposure, whereas in 2015, the Company hedged Mexican peso and Canadian dollar currency exposure as well as lead, zinc and heating oil. In addition, in 2016, the Company designated a portion of its Mexican peso currency contracts as cash flow hedges, where the effective portion of the change in fair value of the hedge is recognized in Other comprehensive income until the hedged transaction occurs.
Gain on Dilution of Ownership Interest in Associate
The gain on dilution of ownership interest in associate of $99 million ($95 million, net of tax) in the year ended December 31, 2015 related to the dilution of the Company's investment in Tahoe to 25.9% on April 1, 2015 as a result of Tahoe’s acquisition of Rio Alto.
Gain on Disposition of Mining Interests
The $315 million gain on disposition of mining interests in the year ended December 31, 2015 arose on the disposition of the Company's remaining 25.9% investment in Tahoe for a total gain of $299 million ($252 million, net of tax), and the sale of the Arturo project for which the Company recognized a gain of $16 million ($11 million, net of tax).
Third Quarter Report – 2016
(in United States dollars, tabular amounts in millions, except where noted)
Other Expenses
Other expense of $13 million for the year ended December 31, 2016 was mainly comprised of a $68 million foreign exchange loss arising primarily from value-added tax receivables denominated in Mexican and Argentine pesos, partially offset by $49 million of interest income on loans held with Pueblo Viejo and short term investments and gains on dispositions of investments in securities. For the year ended December 31, 2015, other expense of $50 million was comprised primarily of $52 million of net foreign exchange losses arising on value added tax receivables denominated in Mexican and Argentine pesos and losses on sales of investments in securities, partially offset by interest income arising on the Company's loans held with Pueblo Viejo and cash and cash equivalents.
Income Tax Expense (Recovery)
Income tax expense for the year ended December 31, 2016 of $60 million represented a 27% rate (year ended December 31, 2015 – income tax recovery of $485 million representing a 10% rate) and was impacted by:
| |
| • | A $189 million foreign exchange loss on the translation of deferred income tax assets and liabilities arising primarily from acquisitions, compared to a $501 million foreign exchange loss for the year ended December 31, 2015; and |
| |
| • | A higher effective tax rate in 2016 compared to 2015, after adjusting for the above noted item and non-deductible share-based compensation expense. The increase in the effective tax rate for the 2016 year was primarily due to a significant portion of the 2015 impairments not being tax effected due to uncertainty of future loss utilization and the impairment of equity investments not being tax effected. These results were partially offset by higher after-tax income from associates in 2016 (primarily from Pueblo Viejo) compared to 2015. |
Net Earnings from Discontinued Operations
Net earnings from discontinued operations of $46 million for the year ended December 31, 2015 was comprised of a $43 million net gain on the sale of Wharf and $3 million of net earnings of Wharf until February 20, 2015, the date of disposition.
AISC
AISC were $856 per ounce(1) for the year ended December 31, 2016, compared to $894 per ounce for the year ended December 31, 2015. The decrease in AISC was primarily due to the favourable impact of the strengthening US dollar against the Mexican peso and the Canadian dollar, the impact of the devaluation of the Argentine peso when it became a floating exchange rate in December 2015 and lower production costs, partially offset by lower sales volumes at Peñasquito, Cerro Negro, Red Lake and Marlin.
| |
| (1) | AISC per ounce is a non-GAAP financial performance measure with no standardized definition under IFRS. For further information and detailed reconciliations, please see pages 46-52 of this report. |
Third Quarter Report – 2016
(in United States dollars, tabular amounts in millions, except where noted)
OVERVIEW OF QUARTERLY FINANCIAL AND OPERATING RESULTS
|
| | | | | | | | | | | | | | | | | | | | | | | | | | | | | | |
| | 2016 | 2015 |
| | Q1 |
| Q2 |
| Q3 |
| Q4 |
| Total |
| Q1 |
| Q2 |
| Q3 |
| Q4 |
| Total |
|
| Financial Results | | | | | | | | | | |
Revenues (1)(2) | $ | 944 |
| $ | 753 |
| $ | 915 |
| $ | 898 |
| $ | 3,510 |
| $ | 1,017 |
| $ | 1,188 |
| $ | 1,098 |
| $ | 1,072 |
| $ | 4,375 |
|
Net earnings (loss) from continuing operations (2) | $ | 80 |
| $ | (78 | ) | $ | 59 |
| $ | 101 |
| $ | 162 |
| $ | (139 | ) | $ | 398 |
| $ | (191 | ) | $ | (4,271 | ) | $ | (4,203 | ) |
| Net earnings (loss) | $ | 80 |
| $ | (78 | ) | $ | 59 |
| $ | 101 |
| $ | 162 |
| $ | (87 | ) | $ | 392 |
| $ | (191 | ) | $ | (4,271 | ) | $ | (4,157 | ) |
Net earnings (loss) from continuing operations per share (2) | | | | | | | | | | |
| – Basic and diluted | $ | 0.10 |
| $ | (0.09 | ) | $ | 0.07 |
| $ | 0.12 |
| $ | 0.19 |
| $ | (0.17 | ) | $ | 0.48 |
| $ | (0.23 | ) | $ | (4.90 | ) | $ | (5.08 | ) |
| Net earnings (loss) per share | | | | | | | | | | |
| – Basic and diluted | $ | 0.10 |
| $ | (0.09 | ) | $ | 0.07 |
| $ | 0.12 |
| $ | 0.19 |
| $ | (0.11 | ) | $ | 0.47 |
| $ | (0.23 | ) | $ | (5.14 | ) | $ | (5.03 | ) |
| Operating cash flow | $ | 59 |
| $ | 234 |
| $ | 267 |
| $ | 239 |
| $ | 799 |
| $ | 58 |
| $ | 528 |
| $ | 443 |
| $ | 401 |
| $ | 1,430 |
|
Adjusted operating cash flow (3) | $ | 89 |
| $ | 307 |
| $ | 341 |
| $ | 383 |
| $ | 1,120 |
| $ | 118 |
| $ | 523 |
| $ | 506 |
| $ | 504 |
| $ | 1,651 |
|
| Expenditures on mining interests (cash basis) | $ | 182 |
| $ | 177 |
| $ | 168 |
| $ | 217 |
| $ | 744 |
| $ | 408 |
| $ | 330 |
| $ | 249 |
| $ | 251 |
| $ | 1,238 |
|
| – Sustaining | $ | 140 |
| $ | 140 |
| $ | 112 |
| $ | 145 |
| $ | 537 |
| $ | 160 |
| $ | 193 |
| $ | 164 |
| $ | 188 |
| $ | 705 |
|
| – Expansionary | $ | 42 |
| $ | 37 |
| $ | 56 |
| $ | 72 |
| $ | 207 |
| $ | 248 |
| $ | 137 |
| $ | 85 |
| $ | 63 |
| $ | 533 |
|
| Dividends paid | $ | 51 |
| $ | 16 |
| $ | 14 |
| $ | 16 |
| $ | 97 |
| $ | 122 |
| $ | 124 |
| $ | 75 |
| $ | 49 |
| $ | 370 |
|
Operating Results (3) | | | | | | | | | | |
| Gold produced (thousands of ounces) | 784 |
| 613 |
| 715 |
| 761 |
| 2,873 |
| 725 |
| 908 |
| 922 |
| 909 |
| 3,464 |
|
Gold sold (thousands of ounces) (1) | 799 |
| 616 |
| 686 |
| 768 |
| 2,869 |
| 827 |
| 903 |
| 942 |
| 918 |
| 3,591 |
|
| Silver produced (thousands of ounces) | 7,700 |
| 5,300 |
| 7,700 |
| 7,400 |
| 28,100 |
| 8,500 |
| 10,400 |
| 11,300 |
| 10,200 |
| 40,400 |
|
| Copper produced (thousands of pounds) | 17,200 |
| 14,400 |
| 16,900 |
| 20,400 |
| 68,900 |
| 9,200 |
| 8,600 |
| 12,300 |
| 21,400 |
| 51,500 |
|
| Lead produced (thousands of pounds) | 29,000 |
| 17,100 |
| 33,700 |
| 29,600 |
| 109,400 |
| 36,700 |
| 47,500 |
| 49,200 |
| 40,500 |
| 173,900 |
|
| Zinc produced (thousands of pounds) | 71,100 |
| 38,300 |
| 75,200 |
| 78,300 |
| 262,900 |
| 82,500 |
| 105,500 |
| 111,500 |
| 89,300 |
| 388,800 |
|
| Average realized gold price (per ounce) | $ | 1,203 |
| $ | 1,277 |
| $ | 1,333 |
| $ | 1,181 |
| $ | 1,244 |
| $ | 1,217 |
| $ | 1,189 |
| $ | 1,114 |
| $ | 1,098 |
| $ | 1,153 |
|
Cash costs: by-product (per ounce) (4) | $ | 557 |
| $ | 728 |
| $ | 554 |
| $ | 481 |
| $ | 573 |
| $ | 585 |
| $ | 547 |
| $ | 597 |
| $ | 687 |
| $ | 605 |
|
Cash costs: co-product (per ounce) (5) | $ | 604 |
| $ | 716 |
| $ | 657 |
| $ | 619 |
| $ | 649 |
| $ | 670 |
| $ | 656 |
| $ | 670 |
| $ | 739 |
| $ | 685 |
|
| All-in sustaining costs (per ounce) | $ | 836 |
| $ | 1,067 |
| $ | 812 |
| $ | 747 |
| $ | 856 |
| $ | 885 |
| $ | 853 |
| $ | 858 |
| $ | 977 |
| $ | 894 |
|
| |
| (1) | Excludes pre-commissioning sales ounces from and Éléonore prior to April 1, 2015 as costs incurred, net of proceeds from sales, were credited against capitalized project costs. |
| |
| (2) | In accordance with the requirements of IFRS 5 – Non-current assets held for sale and discontinued operations, Wharf was classified as a discontinued operation for the year ended December 31, 2015. The sale of Wharf was completed on February 20, 2015. |
| |
| (3) | The Company has presented the non-GAAP performance measures on an attributable (or Goldcorp's share) basis in the table above. AISC and adjusted operating cash flows are non-GAAP financial performance measures with no standardized definition under IFRS. For further information and detailed reconciliations, please see pages 46-52 of this report. |
| |
| (4) | Total cash costs: by-product, per ounce, is calculated net of Goldcorp’s share of by-product sales revenues (by-product silver sales revenues for Cerro Negro, Marlin and Pueblo Viejo; by-product lead, zinc and copper sales revenues and 75% of silver sales revenues for Peñasquito at market silver prices, and 25% of silver sales revenues for Peñasquito at $4.09 per silver ounce (2015 – $4.07 per silver ounce) sold to Silver Wheaton Corp. and by-product copper sales revenues for Alumbrera). |
| |
| (5) | Total cash costs: co-product, per ounce, is calculated by allocating Goldcorp’s share of production costs to each co-product (Alumbrera (copper); Marlin (silver); Pueblo Viejo (silver and copper); Peñasquito (silver, lead and zinc)) based on the ratio of actual sales volumes multiplied by budget metal prices (see page 46). |
Third Quarter Report – 2016
(in United States dollars, tabular amounts in millions, except where noted)
REVIEW OF FOURTH QUARTER FINANCIAL RESULTS
Three months ended December 31, 2016 compared to the three months ended December 31, 2015
Net earnings for the three months ended December 31, 2016 were $101 million, or $0.12 per share, compared to a net loss of $4,271 million, or $5.14 per share, for the three months ended December 31, 2015. The net loss in 2015 compared to the net earnings in 2016 was driven by the impairment of mining interest and goodwill in the fourth quarter of 2015 compared to a reversal of impairment in 2016, a decrease in production costs, primarily as result of the strengthening US dollar and decreases in inventory carrying value reductions at Los Filos, a decrease in depreciation and depletion charges as a result of lower sales volumes and the impact of the impairment in the fourth quarter of 2016, an increase in income tax expense, and the impact of a 7% increase in the average realized gold sales price compared to the fourth quarter of 2015. These increases were partially offset by a decrease in revenues as a result of lower sales volumes.
Net earnings and earnings per share in the fourth quarter of 2016 and net loss and loss per share in the fourth quarter of 2015 were affected by, among other things, the following non-cash or other items that management believes are not reflective of the performance of the underlying operations (items are denoted as (increases)/decreases to net earnings and net earnings per share):
|
| | | | | | | | | | | | | | | | | | |
| | Three months ended December 31, 2016 | Three months ended December 31, 2015 |
| (in millions, except per share) | Pre-tax | After-tax |
| Per share ($/share) |
| Pre-tax | After-tax | Per share
($/share) |
| Impairment (reversal) expense, net | $ | (49 | ) | $ | (49 | ) | $ | (0.06 | ) | $ | 4,906 |
| $ | 3,896 |
| $ | 4.69 |
|
Negative deferred tax effects of foreign exchange on tax assets and liabilities and losses (1) | $ | — |
| $ | 46 |
| $ | 0.05 |
| $ | — |
| $ | 99 |
| $ | 0.12 |
|
| Unrealized foreign exchange loss on Argentine peso denominated construction value-added tax receivable | $ | 4 |
| $ | 4 |
| $ | — |
| $ | 55 |
| $ | 55 |
| $ | 0.07 |
|
Mine-site severance (2) | $ | 13 |
| $ | 13 |
| $ | 0.02 |
| $ | — |
| $ | — |
| $ | — |
|
| Restructuring costs | $ | 5 |
| $ | 3 |
| $ | — |
| $ | — |
| $ | — |
| $ | — |
|
| Revisions in estimates and liabilities incurred on reclamation and closure cost obligations at inactive and closed sites | $ | (17 | ) | $ | (12 | ) | $ | (0.01 | ) | $ | (59 | ) | $ | (41 | ) | $ | (0.05 | ) |
| |
| (1) | Negative deferred tax effects of foreign exchange on tax assets and liabilities and losses of $46 million in the three months ended December 31, 2016 (three months ended December 31, 2015 – $99 million) is primarily composed of a foreign exchange loss on the translation of current and deferred income tax assets and liabilities, arising primarily from acquisitions and dispositions, of $68 million (three months ended December 31, 2015 – $242 million), partially offset by Argentine tax deductible foreign exchange losses on US dollar denominated debt in local currency of $22 million (three months ended December 31, 2015 – $143 million). |
| |
| (2) | Mine-site severance relates to workforce reductions at the Company's Marlin mine as it is scheduled to close by the end of the first quarter of 2017. |
Revenues
|
| | | | | | | | | |
| | | 2016 (1) | 2015 (1) | Change % |
| Gold | | | |
| | Revenue (millions) | $ | 713 |
| $ | 877 |
| (19 | )% |
| | Ounces sold (thousands) | 609 |
| 800 |
| (24 | )% |
| | Average realized price | $ | 1,178 |
| $ | 1,099 |
| 7 | % |
| Silver | | | |
| | Revenue (millions) | $ | 95 |
| $ | 125 |
| (24 | )% |
| | Ounces sold (thousands) | 7,114 |
| 10,237 |
| (31 | )% |
| | Average realized price | $ | 14.27 |
| $ | 13.07 |
| 9 | % |
| Other metals | | | |
| | Revenue (millions) | $ | 90 |
| $ | 70 |
| 29 | % |
| Total revenue (millions) | $ | 898 |
| $ | 1,072 |
| (16 | )% |
| |
| (1) | Excludes attributable share of revenues from the Company's associates. |
Third Quarter Report – 2016
(in United States dollars, tabular amounts in millions, except where noted)
Revenues decreased by $174 million, or 16%, primarily due to decreases in gold and silver sales volumes of 24% and 31%, respectively. The lower sales volumes were primarily a result of lower production at Peñasquito due to lower ore grade and recovery, and at Cerro Negro due to lower mill throughput from stockpiled ore processed in the fourth quarter of 2015. The impact of the decrease in sales volumes was partially offset by higher realized prices for gold and silver of 7% and 9%, respectively.
Production Costs
Production costs decreased by $146 million, or 22%, primarily due to the impact of higher inventory carrying value reductions at Los Filos (approximately $110 million) in the fourth quarter of 2015 compared to the fourth quarter of 2016.
Depreciation and Depletion
|
| | | | | | | | |
| | 2016 | 2015 | Change % |
| Depreciation and Depletion (millions) | $ | 254 |
| $ | 421 |
| (40 | )% |
| Sales ounces (thousands) | 609 |
| 800 |
| (24 | )% |
| Depreciation and Depletion per ounce | $ | 417 |
| $ | 526 |
| (21 | )% |
Depreciation and depletion decreased by $167 million, or 40%, mainly due to lower sales volumes at Peñasquito and Cerro Negro and the impact of impairments on mining interests recognized in the fourth quarter of 2015.
Share of Net Earnings (Loss) of Associates and Joint Venture
|
| | | | | | | | | |
| (in millions) | 2016 | 2015 | Change $ |
| Pueblo Viejo | $ | 60 |
| $ | 13 |
| $ | 47 |
|
| Alumbrera | — |
| (37 | ) | 37 |
|
| NuevaUnión | — |
| — |
| — |
|
| Tahoe | — |
| — |
| — |
|
| Share of net earnings (loss) of associates and joint venture | $ | 60 |
| $ | (24 | ) | $ | 84 |
|
The Company’s share of earnings of associates and joint venture increased by $84 million in the fourth quarter of 2016 compared to the same period in the prior year primarily due to an increase in net earnings from Pueblo Viejo and a net loss of $37 million from Alumbrera in the fourth quarter of 2015. The increase in net earnings from Pueblo Viejo in the fourth quarter of 2016 compared to the same period in the prior year was primarily due to higher sales volumes and the receipt of insurance proceeds relating to the oxygen plant failures in 2015. With respect to Alumbrera, at December 31, 2015, the Company recognized an impairment of its investment in Alumbrera and the carrying amount of its interest was reduced to zero. As at January 1, 2016, the Company discontinued recognizing its share of losses of Alumbrera and did not recognize its share of earnings of Alumbrera for the three months ended December 31, 2016 as future earnings will be recognized by the Company only after the Company's share of future earnings equals its share of losses not recognized.
Impairment reversal (expense)
The 2016 net impairment reversal was comprised of a reversal of impairment at Los Filos of $59 million, which was based on the expected proceeds from the sale to Leagold, offset by an impairment expense at Marlin of $10 million relating to land.
At December 31, 2015, the Company’s market capitalization deficiency was an indicator of impairment. This necessitated a recoverable value assessment on all of the Company's assets and an impairment charge of $4,906 million ($3,896 million, net of tax) of mining interests and goodwill was booked as a result.
Corporate Administration
Corporate administration expenses decreased by $10 million in the fourth quarter of 2016 compared to the fourth quarter of 2015 primarily due to the Company's cost savings initiatives.
Restructuring Charges
Restructuring costs were $5 million in the three months ended December 31, 2016 compared to $nil in the three months ended December 31, 2015. The restructuring costs in the fourth quarter of 2016 related primarily to severance costs associated with the involuntary and voluntary workforce reductions to increase efficiencies at mine sites.
Third Quarter Report – 2016
(in United States dollars, tabular amounts in millions, except where noted)
Other Expenses
Other Expenses decreased by $68 million for the three months ended December 31, 2016 compared to the three months ended December 31, 2015 primarily due to a decrease in foreign exchange losses which arose primarily on value added tax receivables denominated in Mexican and Argentine pesos.
Income Tax Expense (Recovery)
Income tax expense for the three months ended December 31, 2016 of $38 million represented a 27% rate (three months ended December 31, 2015 – income tax recovery of $840 million representing a16% rate) and was impacted by:
| |
| • | A $68 million foreign exchange loss on the translation of deferred income tax assets and liabilities arising primarily from acquisitions, compared to a $199 million foreign exchange loss for the three months ended December 31, 2015; and |
| |
| • | A higher effective tax rate in the fourth quarter of 2016 compared to the fourth quarter of 2015, after adjusting for the above noted item and non-deductible share-based compensation expense. The higher effective tax rate in the fourth quarter of 2016 was primarily due to a significant portion of the 2015 impairments not being tax effected due to the uncertainty of future loss utilization and the impairment of equity investments not being tax effected. These results were partially offset by higher after-tax income from associates (primarily from Pueblo Viejo) compared to the fourth quarter of 2015. |
AISC
AISC were $747 per ounce(1) for the three months ended December 31, 2016, compared to $977 per ounce for the three months ended December 31, 2015. The decrease in AISC was primarily due to lower production costs and the favourable impact of the strengthening US dollar against the Argentine and Mexican pesos, partially offset by lower sales volumes at Cerro Negro, Los Filos, and Éléonore.
| |
| (1) | AISC per ounce is a non-GAAP financial performance measure with no standardized definition under IFRS. For further information and detailed reconciliations, please see pages 46-52 of this report. |
Third Quarter Report – 2016
(in United States dollars, tabular amounts in millions, except where noted)
FINANCIAL POSITION AND LIQUIDITY
The following table summarizes Goldcorp's cash flow activity:
|
| | | | | | |
| | Years Ended December 31 |
| | 2016 |
| 2015 |
|
| Cash flow | | |
| From continuing operations provided by operating activities | $ | 799 |
| $ | 1,423 |
|
| From continuing operations used in investing activities | (654 | ) | (426 | ) |
| From continuing operations used in financing activities | (294 | ) | (1,256 | ) |
| From discontinued operations | — |
| 104 |
|
| Decrease in cash and cash equivalents | (149 | ) | (155 | ) |
| Effect of exchange rate changes on cash and cash equivalents | — |
| (1 | ) |
| Cash and cash equivalents, beginning of period | 326 |
| 482 |
|
| Cash and cash equivalents reclassified as held for sale | (20 | ) | — |
|
| Cash and cash equivalents, end of period | $ | 157 |
| $ | 326 |
|
Cash flow provided from operating activities for the year ended December 31, 2016 compared to the year ended December 31, 2015 decreased mainly due to lower production and sales volumes, primarily at Cerro Negro and Peñasquito, partially offset by an increase in the realized gold price. The average realized gold price increased 8% for 2016 compared to 2015.
The increase in cash flow used in investing activities of $228 million in 2016 compared to 2015 was mainly due to proceeds received from the disposition of the Company's remaining investment in Tahoe of $788 million, net of transaction costs, in the second quarter of 2015. This increase was partially offset by a decrease in expenditures on mining interest for the year ended December 31, 2016 compared to the year ended December 31, 2015.
Expenditures on mining interests (including deposits on mining interest expenditures) were as follows:
|
| | | | | | |
| | Years Ended December 31 |
| | 2016 |
| 2015 |
|
| Peñasquito (including Camino Rojo) | $ | 230 |
| $ | 200 |
|
| Cerro Negro | 97 |
| 247 |
|
| Red Lake (including Cochenour) | 100 |
| 170 |
|
| Éléonore | 94 |
| 267 |
|
| Porcupine (including Borden) | 62 |
| 97 |
|
| Musselwhite | 37 |
| 38 |
|
| Other | 76 |
| 159 |
|
| Total | $ | 696 |
| $ | 1,178 |
|
The decrease in expenditures on mining interests for the year ended December 31, 2016 compared to the year ended December 31, 2015 reflected the completion of major construction projects in 2015, most significantly at Cerro Negro and Éléonore as they achieved commercial production in January and April 2015, respectively. In addition, expenditures at Red Lake decreased primarily to reduced project activities as Cochenour reentered the advanced exploration study phase to better define the deposit. Expenditures at Porcupine decreased as a result of the completion of the Hoyle Deep project in April 2016. Other expenditures decreased as a result of lower expenditures at Marlin as it approaches the end of its mine life and at Los Filos due to the revised life of mine plan that includes a smaller pit and lower stripping costs.
The decrease of $962 million in cash used in financing activities in 2016 as compared to 2015 was due to credit facility repayments of $840 million in 2015 as compared to $nil in 2016. The $30 million withdrawn against the credit facility in 2016 was offset by an increase in Cerro Negro debt repayments as compared to the year ended December 31, 2015. The decrease was further explained by a decrease in dividends paid of $273 million for the year ended December 31, 2016 due to a reduction in the Company's dividend payments. Effective April 1, 2016, the Company’s Board of Directors reduced the annual dividend to $0.08 per share and amended the dividend payment schedule such that dividends were paid quarterly commencing in June 2016 as a prudent measure to increase financial flexibility.
Third Quarter Report – 2016
(in United States dollars, tabular amounts in millions, except where noted)
In June 2016, Goldcorp implemented a Dividend Reinvestment Plan ("DRIP"), which offers shareholders an opportunity to increase their investment in Goldcorp without additional transaction costs by receiving dividend payments in the form of common shares of the Company. The DRIP allows shareholders to reinvest their cash dividends into common shares issued from treasury at a 3% percent discount to the average market price calculated at the time of dividend payment. Participation in the DRIP is optional and does not affect shareholders' cash dividends unless they elect to participate in the DRIP. During the year ended December 31, 2016, the Company issued 319,483 common shares to shareholders who participated in the DRIP.
During 2016, the Company completed the extension of its $3.0 billion credit facility term by one year to June 22, 2021. The unsecured floating rate facility bears interest at LIBOR plus 150 basis points when drawn, based on Goldcorp's current BBB+/Baa3 rating, and is intended to be used for liquidity and general corporate purposes.
At December 31, 2016, the Company had $3.17 billion of available liquidity held in $0.20 billion of cash and cash equivalents and short term investments, and an undrawn credit facility of $2.97 billion.
The Company may from time to time seek to retire or repurchase our outstanding debt in open market purchases, privately negotiated transactions or otherwise. Such repurchases, if any, will depend upon prevailing market conditions, our liquidity requirements, contractual restrictions and other factors. The amount of debt retired or repurchased may be material.
Commitments
In the normal course of business, the Company enters into contracts that give rise to commitments for future minimum payments. The following table summarizes the remaining contractual maturities of the Company's financial liabilities and operating and capital commitments at December 31, 2016, shown in contractual undiscounted cashflow:
|
| | | | | | | | | | | | | | | |
| | Within 1 year |
| 2 to 3 years |
| 4 to 5 years |
| Over 5 years |
| Total |
|
| Financial Liabilities | | | | | |
Accounts payable and accrued liabilities (1) | $ | 462 |
| $ | — |
| $ | — |
| $ | — |
| $ | 462 |
|
| Derivative liabilities designated as hedging instruments | 14 |
| 8 |
| — |
| — |
| 22 |
|
| Debt repayments (principal portion) | 30 |
| 500 |
| 550 |
| 1,450 |
| 2,530 |
|
| Interest payments on debt | 93 |
| 168 |
| 153 |
| 608 |
| 1,022 |
|
| Other | 1 |
| 3 |
| 2 |
| 17 |
| 23 |
|
| Total Financial liabilities | 600 |
| 679 |
| 705 |
| 2,075 |
| 4,059 |
|
| Other Commitments | | | | | |
Capital expenditure commitments (2) | 64 |
| 11 |
| — |
| — |
| 75 |
|
| Reclamation and closure cost obligations | 69 |
| 86 |
| 26 |
| 1,605 |
| 1,786 |
|
Minimum rental and lease payments (3) | 3 |
| 8 |
| 7 |
| 17 |
| 35 |
|
| Other | 165 |
| 14 |
| — |
| 63 |
| 242 |
|
| Total Other Commitments | 301 |
| 119 |
| 33 |
| 1,685 |
| 2,138 |
|
| Total Financial Liabilities and Commitments | $ | 901 |
| $ | 798 |
| $ | 738 |
| $ | 3,760 |
| $ | 6,197 |
|
| |
(1) | Excludes accrued interest on debt which is disclosed separately in the above table. |
| |
(2) | Contractual commitments are defined as agreements that are enforceable and legally binding. Certain of the contractual commitments may contain cancellation clauses; however, the Company discloses the contractual maturities of the Company's operating and capital commitments based on management's intent to fulfill the contract. |
| |
(3) | Excludes the Company's minimum finance lease payments. |
At December 31, 2016, the Company had letters of credit outstanding in the amount of $423 million (December 31, 2015 – $580 million) of which $303 million (December 31, 2015 – $275 million) represented guarantees for reclamation obligations and $nil (December 31, 2015 – $211 million) represented guarantees for certain of the Company's Argentine debt. The Company's capital commitments for the next twelve months amounted to $64 million at December 31, 2016.
Third Quarter Report – 2016
(in United States dollars, tabular amounts in millions, except where noted)
In addition, certain of the mining properties in which the Company has interests are subject to royalty arrangements based on their net smelter returns ("NSRs"), modified NSRs, net profits interest ("NPI") and/or net earnings. Royalties are expensed at the time of sale of gold and other metals. For the year ended December 31, 2016, royalties included in production costs amounted to $69 million (2015 – $93 million). At December 31, 2016, the significant royalty arrangements of the Company and its associates and joint venture were as follows:
|
| |
| Mining properties: | |
| Musselwhite | 1.25 – 5% of NPI |
| Éléonore | 2.2 – 3.5% of NSR |
| Peñasquito | 2% of NSR and 0.5% of gross income on sale of gold and silver |
| Cerro Negro | 3% of modified NSR and 1% of net earnings |
| Alumbrera | 3% of modified NSR plus 20 – 30% of net proceeds after capital recovery and changes in working capital |
| Pueblo Viejo | 3.2% of NSR |
| NuevaUnión | 1.5% – 2% modified NSR on portions of the property and 2% NPI |
| Coffee | 2% of NSR |
| Other mines | 0.5% of gross income on sale of gold and silver or 5% of NSR |
Capital Resources
The capital of the Company consists of items included in shareholders’ equity and debt net of cash and cash equivalents and short term investments as follows:
|
| | | | | | |
| | At December 31
2016 |
| At December 31
2015 |
|
| Shareholders’ equity | $ | 13,415 |
| $ | 12,848 |
|
| Debt | 2,510 |
| 2,688 |
|
| | 15,925 |
| 15,536 |
|
| Less: Cash and cash equivalents | (157 | ) | (326 | ) |
| Short term investments | (43 | ) | (57 | ) |
| | $ | 15,725 |
| $ | 15,153 |
|
The Company manages its capital structure and makes adjustments in light of changes in its economic environment and the risk characteristics of the Company’s assets. To effectively manage the entity’s capital requirements, the Company has instituted a rigorous planning, budgeting and forecasting process to help determine the funds required to ensure the Company has the appropriate liquidity to meet its operating and growth objectives. The Company ensures that there are sufficient committed loan facilities to meet its short-term business requirements, taking into account its anticipated cash flows from operations and its holdings of cash and cash equivalents and short term investments.
Outstanding Share Data
As at February 15, 2017, there were 854 million common shares of the Company issued and outstanding and 10 million stock options outstanding which are exercisable into common shares at exercise prices ranging between C$20.27 per share to C$48.72 per share and 3 million restricted stock units outstanding.
Third Quarter Report – 2016
(in United States dollars, tabular amounts in millions, except where noted)
GUIDANCE
Consistent with Goldcorp’s focus on profitable ounces and growing NAV per share, forecast gold production is expected to be 2.5 million ounces (+/- 5%), in line with previous 2017 guidance after accounting for the recently announced sale of Los Filos and the closure of Marlin. AISC are expected to be approximately $850 per ounce(2) (+/- 5%) as the Company continues to realize savings from its $250 million target in annual sustainable efficiencies. The Company’s five year growth outlook is focused on growing production by 20% to 3 million ounces, reducing AISC by 20% to $700 per ounce and growing gold reserves by 20% to 50 million ounces.
Mine-by-mine forecast 2017 gold production and AISC are as follows:
|
| | |
| Mine | Gold Production (1,2) (oz) | AISC (1,2,3) ($/oz) |
| Peñasquito | 410,000 | $825 |
| Cerro Negro | 410,000 | $685 |
| Pueblo Viejo | 415,000 | $530 |
| Éléonore | 315,000 | $985 |
| Red Lake | 300,000 | $870 |
| Porcupine | 285,000 | $900 |
| Musselwhite | 265,000 | $715 |
| Other | 100,000 | $1,250 |
| Consolidated | 2,500,000 (+/- 5%) | $850 (+/-5%) |
2017 Financial Guidance
Total cash costs on a by-product basis are expected to be $500 (+/- 5%)(2). Sustaining capital expenditures are forecast to be $700 million (+/- 5%). Expansionary, or growth capital is expected to be $600 million (+/- 5%) with the majority of the spending on key projects including Peñasquito's PLP, Musselwhite's MHP, Borden, Coffee, Cochenour and NuevaUnión.
Company-wide exploration expenditures in 2017 are expected to total $100 million, of which approximately 40% is expected to be expensed. Corporate administration expense is forecast to be approximately $160 million, which includes share-based compensation of approximately $50 million. Depreciation and depletion expense is expected to be $435 per ounce. The effective tax rate on net income before share-based compensation is expected to be approximately 40% to 45%.
Five-Year Forecast
Year-by-year gold production and AISC are forecast as follows:
|
| | |
| Year | Gold Production (oz) (+/-5%) | AISC ($/oz) (+/-5%) |
| 2017 | 2,500,000 | $850 |
| 2018 | 2,500,000 | $800 |
| 2019 | 2,700,000 | $750 |
| 2020 | 3,000,000 | $700 |
| 2021 | 3,000,000 | $700 |
Third Quarter Report – 2016
(in United States dollars, tabular amounts in millions, except where noted)
Price and cost assumptions used to forecast total cash costs and gold equivalent calculations include:
|
| | |
| | 2017 - 2018 | 2019 - 2021 |
| Gold (oz) | $1,250 | $1,250 |
| Silver (oz) | $19.00 | $19.00 |
| Copper (lb) | $2.25 | $2.25 |
| Zinc (lb) | $1.00 | $0.90 |
| Lead (lb) | $0.89 | $0.80 |
| Foreign exchange (respectively to the US$) | | |
| Canadian dollar | $1.30 | $1.30 |
| Mexican peso | 19.00 | 16.25 |
| |
| (1) | Guidance projections (“Guidance”) are considered “forward-looking statements” and represent management’s good faith estimates or expectations of future production results as of the date hereof. Guidance is based upon certain assumptions, including, but not limited to, metal prices, oil prices, certain exchange rates and other assumptions. Such assumptions may prove to be incorrect and actual results may differ materially from those anticipated. Consequently, Guidance cannot be guaranteed. As such, investors are cautioned not to place undue reliance upon Guidance and forward-looking statements as there can be no assurance that the plans, assumptions or expectations upon which they are placed will occur. |
| |
| (2) | The Company has presented the non-GAAP performance measures on an attributable (or Goldcorp's share) basis. AISC per ounce and cash costs: by-product are non-GAAP financial performance measures with no standardized definition under IFRS. For further information, please see pages 46-52 of this report. |
| |
| (3) | The Company’s projected AISC are not based on GAAP total production cash costs, which forms the basis of the Company’s cash costs: by-product. The projected range of AISC is anticipated to be adjusted to include sustaining capital expenditures, corporate administrative expense, exploration and evaluation costs and reclamation cost accretion and amortization, and exclude the effects of expansionary capital, tax payments, dividends and financing costs. Projected GAAP total production cash costs for the full year would require inclusion of the projected impact of future included and excluded items, including items that are not currently determinable, but may be significant, such as sustaining capital expenditures, reclamation cost accretion and amortization and tax payments. Due to the uncertainty of the likelihood, amount and timing of any such items, the Company does not have information available to provide a quantitative reconciliation of projected AISC to a total production cash costs projection. |
Third Quarter Report – 2016
(in United States dollars, tabular amounts in millions, except where noted)
OPERATIONAL REVIEW
The Company’s principal producing mining properties are comprised of the Peñasquito mine in Mexico; the Cerro Negro mine in Argentina; the Pueblo Viejo mine (40.0% interest) in the Dominican Republic and the Red Lake, Éléonore, Porcupine, and Musselwhite mines in Canada. Cerro Negro and Éléonore achieved commercial production effective January 1, 2015 and April 1, 2015, respectively.
Operating results of operating segments are reviewed by the Company's chief operating decision maker ("CODM") to make decisions about resources to be allocated to the segments and to assess their performance. The Company considers each individual mine site as operating segments for financial reporting purposes except as noted below. Effective January 1, 2016, the CODM reviews the results of the Company's mines that have short mine lives and are headed for closure together as one operating segment. Accordingly, the Company has grouped Los Filos and Marlin into one operating segment, Other mines. On the same basis, the Company has presented its 37.5% interest in Alumbrera in the Other associate operating segment due to its short mine life. Effective July 1, 2016, NuevaUnión results and El Morro were presented in Other. The segment information for the three months and year ended December 31, 2015 has been adjusted to reflect the Company's reportable operating segments for the three months and year ended December 31, 2016.
The Company’s 100% interests in the Cochenour and Borden projects in Canada are included in the Red Lake and Porcupine reportable operating segments, respectively. The Company's 50% interest in the NuevaUnión project in Chile and 100% interest in the Coffee project in the Yukon are included in Other.
The Company’s principal product is gold doré with the refined gold bullion sold primarily in the London spot market. Concentrate produced at Peñasquito and Alumbrera, containing both gold and by-product metals, is sold to third party smelters and traders.
Segmented Financial and Operating Highlights
|
| | | | | | | | | | | |
| Year ended December 31 | | Revenue ($ millions) |
| Gold produced (000's of ounces) |
| Gold sold (000's of ounces) |
| Total cash costs: by-product ($/oz) (1), (4) |
| AISC ($/oz) (2), (4) |
|
| Peñasquito | 2016 | 1,044 |
| 465 |
| 449 |
| 483 |
| 937 |
|
| | 2015 | 1,646 |
| 860 |
| 893 |
| 320 |
| 544 |
|
| Cerro Negro | 2016 | 532 |
| 363 |
| 382 |
| 505 |
| 705 |
|
| | 2015 | 790 |
| 507 |
| 580 |
| 600 |
| 769 |
|
| Red Lake | 2016 | 388 |
| 324 |
| 313 |
| 582 |
| 872 |
|
| | 2015 | 427 |
| 376 |
| 366 |
| 572 |
| 906 |
|
| Éléonore | 2016 | 346 |
| 274 |
| 278 |
| 875 |
| 981 |
|
| | 2015 | 259 |
| 268 |
| 231 |
| 911 |
| 1,007 |
|
| Porcupine | 2016 | 343 |
| 277 |
| 275 |
| 688 |
| 898 |
|
| | 2015 | 315 |
| 274 |
| 273 |
| 776 |
| 1,078 |
|
| Musselwhite | 2016 | 321 |
| 261 |
| 260 |
| 538 |
| 678 |
|
| | 2015 | 311 |
| 270 |
| 269 |
| 599 |
| 766 |
|
| Other mines | 2016 | 536 |
| 346 |
| 351 |
| 771 |
| 914 |
|
| | 2015 | 627 |
| 442 |
| 440 |
| 937 |
| 1,249 |
|
Other (2) | 2016 | — |
| — |
| — |
| — |
| 75 |
|
| | 2015 | — |
| — |
| — |
| — |
| 70 |
|
| Total before associates | 2016 | 3,510 |
| 2,310 |
| 2,308 |
| 622 |
| 951 |
|
| | 2015 | 4,375 |
| 2,997 |
| 3,052 |
| 603 |
| 916 |
|
Pueblo Viejo (4) | 2016 | 607 |
| 467 |
| 467 |
| 343 |
| 439 |
|
| | 2015 | 542 |
| 382 |
| 450 |
| 495 |
| 607 |
|
Other associate (4) | 2016 | 257 |
| 96 |
| 94 |
| 509 |
| 603 |
|
| | 2015 | 188 |
| 74 |
| 73 |
| 1,264 |
| 1,670 |
|
Wharf (5) | 2016 | — |
| — |
| — |
| — |
| — |
|
| | 2015 | 19 |
| 11 |
| 16 |
| 941 |
| 996 |
|
| Total – including associates | 2016 | 4,374 |
| 2,873 |
| 2,869 |
| 573 |
| 856 |
|
| | 2015 | 5,124 |
| 3,464 |
| 3,591 |
| 605 |
| 894 |
|
Third Quarter Report – 2016
(in United States dollars, tabular amounts in millions, except where noted)
|
| | | | | | | | | | | |
| Three months ended December 31 | | Revenue ($ millions) |
| Gold produced (000's of ounces) |
| Gold sold (000's of ounces) |
| Total cash costs: by-product ($/oz) (1), (4) |
| AISC ($/oz) (2), (4) |
|
| Peñasquito | 2016 | 362 |
| 183 |
| 185 |
| 205 |
| 487 |
|
| | 2015 | 354 |
| 170 |
| 195 |
| 451 |
| 687 |
|
| Cerro Negro | 2016 | 90 |
| 66 |
| 70 |
| 778 |
| 1,024 |
|
| | 2015 | 166 |
| 147 |
| 132 |
| 577 |
| 872 |
|
| Red Lake | 2016 | 87 |
| 88 |
| 76 |
| 608 |
| 932 |
|
| | 2015 | 102 |
| 100 |
| 92 |
| 610 |
| 959 |
|
Éléonore (3) | 2016 | 82 |
| 65 |
| 69 |
| 965 |
| 1,075 |
|
| | 2015 | 112 |
| 105 |
| 103 |
| 677 |
| 761 |
|
| Porcupine | 2016 | 76 |
| 66 |
| 63 |
| 733 |
| 985 |
|
| | 2015 | 82 |
| 74 |
| 74 |
| 769 |
| 1,031 |
|
| Musselwhite | 2016 | 87 |
| 75 |
| 74 |
| 511 |
| 696 |
|
| | 2015 | 92 |
| 81 |
| 83 |
| 527 |
| 699 |
|
| Other mines | 2016 | 114 |
| 65 |
| 72 |
| 729 |
| 880 |
|
| | 2015 | 164 |
| 116 |
| 121 |
| 1,379 |
| 1,642 |
|
Other (2) | 2016 | — |
| — |
| — |
| — |
| 59 |
|
| | 2015 | — |
| — |
| — |
| — |
| 64 |
|
| Total before associates and discontinued operations | 2016 | 898 |
| 608 |
| 609 |
| 561 |
| 869 |
|
| | 2015 | 1,072 |
| 793 |
| 800 |
| 698 |
| 1,009 |
|
Pueblo Viejo (4) | 2016 | 168 |
| 127 |
| 132 |
| 202 |
| 311 |
|
| | 2015 | 108 |
| 90 |
| 93 |
| 502 |
| 608 |
|
Other associate (4) | 2016 | 80 |
| 26 |
| 27 |
| 56 |
| 140 |
|
| | 2015 | 58 |
| 26 |
| 25 |
| 1,028 |
| 1,274 |
|
| Total – including associates and discontinued operations | 2016 | 1,146 |
| 761 |
| 768 |
| 481 |
| 747 |
|
| | 2015 | 1,238 |
| 909 |
| 918 |
| 687 |
| 977 |
|
| |
| (1) | Total cash costs: by-product, per ounce, is calculated net of Goldcorp’s share of by-product sales revenues (by-product copper sales revenues for Alumbrera; by-product silver sales revenues for Marlin and Pueblo Viejo; and by-product lead and zinc sales revenues and 75% of silver sales revenues for Peñasquito at market silver prices, and 25% of silver sales revenues for Peñasquito at $4.09 per silver ounce (2015 – $4.07 per silver ounce) sold to Silver Wheaton). |
| |
| (2) | For the purpose of calculating AISC, the Company includes corporate administration expense, capital expenditures incurred at the Company's regional and head office corporate offices and regional office exploration expense as corporate AISC in the "Other" category. These costs are not allocated to the individual mine sites as the Company measures its operations' performance on AISC directly incurred at the mine site. AISC for Other is calculated using total corporate expenditures and the Company's consolidated gold sales ounces. |
| |
| (3) | Gold produced in 2015 include pre-commercial production ounces from Éléonore. However, gold sold excludes pre-commissioning sales ounces from Éléonore, prior to April 1, 2015 as these ounces were credited against capitalized project costs. |
| |
| (4) | The Company has included certain non-GAAP performance measures including the Company’s share of the applicable production, sales and financial information of Alumbrera, Pueblo Viejo and NuevaUnión (formerly referred to as Project Corridor), throughout this document. Total cash costs: by-product and AISC are non-GAAP performance measures with no standardized definition under IFRS. For further information and detailed reconciliations, please see pages 46-52 of this report. |
| |
| (5) | In accordance with the requirements of IFRS 5 – Non-current assets held for sale and discontinued operations, Wharf was classified as a discontinued operation for the year ended December 31, 2016. The sale of Wharf was completed on February 20, 2015. |
Third Quarter Report – 2016
(in United States dollars, tabular amounts in millions, except where noted)
OPERATIONAL REVIEW
Peñasquito, Mexico (100%-owned)
|
| | | | | | | | | | | | | |
| | Three months ended December 31 | | Year ended December 31 |
| Operating Data | 2016 |
| 2015 |
| Change |
| | 2016 |
| 2015 |
| Change |
|
| Tonnes of ore mined – sulphide (thousands) | 14,342 |
| 9,784 |
| 47 | % | | 46,735 |
| 39,079 |
| 20 | % |
| Tonnes of ore mined – oxide (thousands) | — |
| 65 |
| (100 | )% | | 1,106 |
| 3,038 |
| (64 | )% |
| Tonnes of waste removed (thousands) | 27,501 |
| 38,590 |
| (29 | )% | | 133,771 |
| 151,924 |
| (12 | )% |
| Tonnes of total material moved (thousands) | 41,843 |
| 48,441 |
| (14 | )% | | 181,612 |
| 194,041 |
| (6 | )% |
| Ratio of waste to ore | 1.9 |
| 3.9 |
| (51 | )% | | 2.8 |
| 3.6 |
| (22 | )% |
| Average Gold head grade (grams/tonne) | 0.95 |
| 0.79 |
| 20 | % | | 0.70 |
| 1.00 |
| (30 | )% |
| Average Silver head grade (grams/tonne) | 21.98 |
| 26.88 |
| (18 | )% | | 22.98 |
| 28.25 |
| (19 | )% |
| Average Lead head grade | 0.20 | % | 0.27 | % | (26 | )% | | 0.22 | % | 0.30 | % | (27 | )% |
| Average Zinc head grade | 0.58 | % | 0.63 | % | (8 | )% | | 0.54 | % | 0.68 | % | (21 | )% |
| Sulphide Ore | | |
|
| | | | |
| Tonnes of ore milled (thousands) | 9,243 |
| 9,854 |
| (6 | )% | | 34,112 |
| 38,870 |
| (12 | )% |
| Average Gold recovery rate | 69 | % | 68 | % | 1 | % | | 63 | % | 72 | % | (13 | )% |
| Average Silver recovery rate | 81 | % | 81 | % | — | % | | 79 | % | 80 | % | (1 | )% |
| Average Lead recovery rate | 78 | % | 72 | % | 8 | % | | 72 | % | 71 | % | 1 | % |
| Average Zinc recovery rate | 80 | % | 77 | % | 4 | % | | 77 | % | 79 | % | (3 | )% |
| Concentrates Produced – Payable Metal Produced | | |
|
| | | | |
| Gold (thousands of ounces) | 181 |
| 162 |
| 12 | % | | 450 |
| 833 |
| (46 | )% |
| Silver (thousands of ounces) | 4,790 |
| 6,329 |
| (24 | )% | | 17,628 |
| 25,284 |
| (30 | )% |
| Lead (thousands of pounds) | 29,600 |
| 40,500 |
| (27 | )% | | 109,400 |
| 173,900 |
| (37 | )% |
| Zinc (thousands of pounds) | 78,300 |
| 89,300 |
| (12 | )% | | 262,900 |
| 388,800 |
| (32 | )% |
| Lead concentrate (dry metric tonnes) | 33,500 |
| 39,000 |
| (14 | )% | | 117,600 |
| 159,300 |
| (26 | )% |
| Zinc concentrate (dry metric tonnes) | 76,600 |
| 90,600 |
| (15 | )% | | 273,400 |
| 375,100 |
| (27 | )% |
| Oxide Ore | | |
|
| | | | |
| Tonnes of ore processed (thousands of ounces) | — |
| 65 |
| (100 | )% | | 1,106 |
| 3,038 |
| (64 | )% |
| Produced (thousands of ounces) | | |
|
| | | | |
| Gold Produced (thousands of ounces) | 2 |
| 8 |
| (75 | )% | | 15 |
| 28 |
| (46 | )% |
| Silver Produced (thousands of ounces) | 40 |
| 130 |
| (69 | )% | | 275 |
| 642 |
| (57 | )% |
| Total Payable Metal Produced | | |
|
| | | | |
| Gold (thousands of ounces) | 183 |
| 170 |
| 8 | % | | 465 |
| 860 |
| (46 | )% |
| Silver (thousands of ounces) | 4,830 |
| 6,459 |
| (25 | )% | | 17,903 |
| 25,927 |
| (31 | )% |
| Lead (thousands of pounds) | 29,600 |
| 40,500 |
| (27 | )% | | 109,400 |
| 173,900 |
| (37 | )% |
| Zinc (thousands of pounds) | 78,300 |
| 89,300 |
| (12 | )% | | 262,900 |
| 388,800 |
| (32 | )% |
Gold equivalent (thousands of ounces) (1) | 347 |
| 369 |
| (6 | )% | | 1,050 |
| 1,689 |
| (38 | )% |
Third Quarter Report – 2016
(in United States dollars, tabular amounts in millions, except where noted)
|
| | | | | | | | | | | | | | | | | |
| | Three months ended December 31 | | Year ended December 31 |
| | 2016 |
| 2015 |
| Change |
| | 2016 |
| 2015 |
| Change |
|
| Sulphide and Oxide Ores – Payable Metal Sold | | | | | | | |
| Gold (thousands of ounces) | 185 |
| 195 |
| (5 | )% | | 449 |
| 893 |
| (50 | )% |
| Silver (thousands of ounces) | 5,038 |
| 6,794 |
| (26 | )% | | 17,592 |
| 27,087 |
| (35 | )% |
| Lead (thousands of pounds) | 33,600 |
| 41,700 |
| (19 | )% | | 110,000 |
| 178,400 |
| (38 | )% |
| Zinc (thousands of pounds) | 70,500 |
| 98,000 |
| (28 | )% | | 259,800 |
| 388,200 |
| (33 | )% |
Total Cash Costs: By-product (per ounce) (3) | $ | 205 |
| $ | 451 |
| (55 | )% | | $ | 483 |
| $ | 320 |
| 51 | % |
Total Cash Costs: Co-product (per ounce) (3) | $ | 598 |
| $ | 612 |
| (2 | )% | | $ | 780 |
| $ | 562 |
| 39 | % |
| AISC (per ounce) | $ | 487 |
| $ | 687 |
| (29 | )% | | $ | 937 |
| $ | 544 |
| 72 | % |
| Mining cost (per tonne) | $ | 1.79 |
| $ | 2.11 |
| (15 | )% | | $ | 1.98 |
| $ | 2.09 |
| (5 | )% |
| Milling cost (per tonne) | $ | 5.25 |
| $ | 6.41 |
| (18 | )% | | $ | 5.76 |
| $ | 6.61 |
| (13 | )% |
| General and administrative cost (per tonne milled) | $ | 3.26 |
| $ | 2.96 |
| 10 | % | | $ | 2.57 |
| $ | 2.28 |
| 13 | % |
| Off-site cost per tonne sold (lead) | $ | 597 |
| $ | 690 |
| (13 | )% | | $ | 630 |
| $ | 662 |
| (5 | )% |
| Off-site cost per tonne sold (zinc) | $ | 339 |
| $ | 323 |
| 5 | % | | $ | 317 |
| $ | 338 |
| (6 | )% |
| Financial Data (in millions) | | | | | | | |
Revenues (2) | $ | 362 |
| $ | 354 |
| 2 | % | | $ | 1,044 |
| $ | 1,646 |
| (37 | )% |
| Production costs | $ | 183 |
| $ | 221 |
| (17 | )% | | $ | 698 |
| $ | 890 |
| (22 | )% |
| Depreciation and depletion | $ | 78 |
| $ | 100 |
| (22 | )% | | $ | 243 |
| $ | 391 |
| (38 | )% |
| Earnings (loss) from operations | $ | 100 |
| $ | (1,152 | ) | n/a |
| | $ | 99 |
| $ | (821 | ) | n/a |
|
| Expenditures on mining interests (cash basis) | $ | 64 |
| $ | 50 |
| 28 | % | | $ | 235 |
| $ | 202 |
| 16 | % |
| – Sustaining | $ | 49 |
| $ | 41 |
| 20 | % | | $ | 195 |
| $ | 186 |
| 5 | % |
| – Expansionary | $ | 15 |
| $ | 9 |
| 67 | % | | $ | 40 |
| $ | 16 |
| 150 | % |
| |
| (1) | Gold equivalent ounces are calculated using the following assumptions: $1,100 per ounce of gold; by-product metal prices of $16.50 per ounce of silver; $0.90 per pound of zinc; and $0.95 per pound of lead (2015 – $1,300; $22.00; $0.90; and $0.90 respectively). By-product metals are converted to gold equivalent ounces by multiplying by-product metal production with the associated by-product metal price and dividing it by the gold price. |
| |
| (2) | Includes 25% of silver ounces sold to Silver Wheaton at $4.09 per ounce (2015 – $4.07 ounce). The remaining 75% of silver ounces are sold at market rates. |
| |
| (3) | The calculation of total cash costs per ounce of gold is net of by-product silver, lead and zinc sales revenues. If silver, lead and zinc were treated as co-products, total cash costs for the three months and year ended December 31, 2016 would have been $598 per ounce of gold, $7.88 per ounce of silver, $0.69 per pound of lead and $0.67 per pound of zinc, and $780 per ounce of gold, $9.81 per ounce of silver, $0.87 per pound of lead and $0.79 per pound of zinc, respectively (three months and year ended December 31, 2015 – $612, $8.60, $0.76, and $0.72, and $562, $8.00, $0.68, and $0.69, respectively). Production costs are allocated to each co-product based on the ratio of actual sales volumes multiplied by budget metal prices (see page 46). The actual and budget silver price for Peñasquito takes into consideration that 25% of silver ounces are sold to Silver Wheaton at $4.09 per ounce (2015 – $4.07 ounce) with the remaining 75% of silver ounces sold at market rates. |
Operating Highlights
Gold production for 2016 was 46% lower than 2015 primarily due to lower ore grade as a result of mine sequencing, lower throughput due to harder ore types processed, a longer than anticipated period to ramp up to full production following a planned 10 day shut down in the second quarter, and lower recoveries associated with processing low grade stockpiled ore. In 2015, the mine sequence had ore sourced from the comparatively higher grade area of Phase 5C.
During 2016 Peñasquito stockpiled an additional 12.6 million tonnes of sulphide ore due to the high carbon content. As part of the Pyrite Leach project, a carbon pre-flotation facility is being constructed, which is anticipated to be completed in the second quarter of 2018, which is expected to allow for the efficient processing of the higher carbon content ore.
Financial Highlights
Earnings from operations of $99 million in 2016 compared to earnings of $360 million in 2015 (excluding the $1,181 million impairment in mining interest). Earnings decreased as lower production resulted in lower revenues, partially offset by lower depreciation and production costs. Production costs decreased as productivity in the pit improved significantly during 2016 due to improved pit conditions with large and wide cut-backs being established, continued focus on balancing truck haulage with available loading units, and optimization of drill-and-blast activities. The ongoing cost efficiency initiatives are expected to result in further productivity improvements in 2017.
Third Quarter Report – 2016
(in United States dollars, tabular amounts in millions, except where noted)
AISC for 2016 were 72% higher than 2015 due to lower gold production, partially offset by higher by-product credits per ounce, lower operating costs, and the devaluation of the Mexican peso.
The Northern Well Field project reached full production capacity during the fourth quarter of 2016 and is expected to satisfy Peñasquito's long-term water requirements. The project was delivered within budget and project demobilization activities were substantially complete in December.
Fourth Quarter 2016 Results
Gold production for the fourth quarter of 2016 was 8% higher than the fourth quarter of 2015, as the mine sequenced into higher grade Phase 5D ore in the last quarter of 2016. Phase 5D is expected to produce high grade ore until the third quarter of 2017.
AISC for the fourth quarter of 2016 were 29% lower than the fourth quarter of 2015 due to higher gold production and lower production costs.
2017 Outlook
Peñasquito is expected to produce 410,000 ounces of gold (+/-5%). The decrease compared to 2016 is due to lower grades as the high-grade ore from Phase 5D is expected to be mined by the third quarter of 2017, and more low-grade ore from the stockpiles will be processed during the year.
In addition, the pit will undergo a significant stripping campaign for Phase 6D, a higher grade portion of the pit, with current plans to begin mining Phase 6D in the fourth quarter of 2018. Pre-stripping of the Chile Colorado pit is expected to commence in the second quarter of 2017, with mining of ore expected to commence in late 2018.
AISC is expected to be $825 per ounce (+/-5%). The decrease compared to 2016 is due to productivity improvements that are expected to be partially offset by lower gold production. Sustaining capital is expected to be higher than normal in 2017 as the mine plan requires increased stripping in 2017 compared to 2016 and the tailings dam is being raised.
Third Quarter Report – 2016
(in United States dollars, tabular amounts in millions, except where noted)
Cerro Negro, Argentina (100%-owned)
|
| | | | | | | | | | | | | | | | | |
| | Three months ended December 31 | | Year ended December 31 |
| Operating Data | 2016 |
| 2015 |
| Change |
| | 2016 |
| 2015 |
| Change |
|
| Tonnes of ore mined (thousands) | 166 |
| 313 |
| (47 | )% | | 811 |
| 845 |
| (4 | )% |
| Tonnes of ore milled (thousands) | 166 |
| 330 |
| (50 | )% | | 827 |
| 1,256 |
| (34 | )% |
| Average mill Gold grade (grams/tonne) | 14.43 |
| 15.34 |
| (6 | )% | | 14.35 |
| 13.47 |
| 7 | % |
| Average mill Silver grade (grams/tonne) | 112.7 |
| 163.6 |
| (31 | )% | | 132.1 |
| 180.4 |
| (27 | )% |
| Average Gold recovery rate | 96 | % | 94 | % | 2 | % | | 95 | % | 94 | % | 1 | % |
| Average Silver recovery rate | 88 | % | 86 | % | 2 | % | | 87 | % | 83 | % | 5 | % |
| Gold Produced (thousands of ounces) | 66 |
| 147 |
| (55 | )% | | 363 |
| 507 |
| (28 | )% |
| Silver Produced (thousands of ounces) | 478 |
| 1,489 |
| (68 | )% | | 3,087 |
| 6,100 |
| (49 | )% |
Gold equivalent ounces produced (thousands of ounces)(1) | 73 |
| 173 |
| (58 | )% | | 410 |
| 611 |
| (33 | )% |
| Gold Sold (thousands of ounces) | 70 |
| 132 |
| (47 | )% | | 382 |
| 580 |
| (34 | )% |
| Silver Sold (thousands of ounces) | 540 |
| 1,450 |
| (63 | )% | | 3,308 |
| 7,395 |
| (55 | )% |
Total Cash Costs: By-product (per ounce) (2) | $ | 778 |
| $ | 577 |
| 35 | % | | $ | 505 |
| $ | 600 |
| (16 | )% |
Total Cash Costs: Co-product (per ounce) (2) | $ | 810 |
| $ | 627 |
| 29 | % | | $ | 574 |
| $ | 667 |
| (14 | )% |
| AISC (per ounce) | $ | 1,024 |
| $ | 872 |
| 17 | % | | $ | 705 |
| $ | 769 |
| (8 | )% |
| Mining cost (per tonne) | $ | 111.93 |
| $ | 87.50 |
| 28 | % | | $ | 102.42 |
| $ | 108.77 |
| (6 | )% |
| Milling cost (per tonne) | $ | 39.05 |
| $ | 43.59 |
| (10 | )% | | $ | 40.47 |
| $ | 42.94 |
| (6 | )% |
| General and administrative cost (per tonne milled) | $ | 160.30 |
| $ | 110.30 |
| 45 | % | | $ | 127.61 |
| $ | 113.33 |
| 13 | % |
| Financial Data (in millions) | | | | | | | |
| Revenues | $ | 90 |
| $ | 166 |
| (46 | )% | | $ | 532 |
| $ | 790 |
| (33 | )% |
| Production costs | $ | 64 |
| $ | 97 |
| (34 | )% | | $ | 249 |
| $ | 465 |
| (46 | )% |
| Depreciation and depletion | $ | 45 |
| $ | 76 |
| (41 | )% | | $ | 217 |
| $ | 348 |
| (38 | )% |
| Earnings (loss) from operations | $ | (23 | ) | $ | (8 | ) | 188 | % | | $ | 52 |
| $ | (23 | ) | n/a |
|
| Expenditures on mining interests (cash basis) | $ | 22 |
| $ | 47 |
| (53 | )% | | $ | 97 |
| $ | 247 |
| (61 | )% |
| – Sustaining | $ | 15 |
| $ | 39 |
| (62 | )% | | $ | 68 |
| $ | 95 |
| (28 | )% |
| – Expansionary | $ | 7 |
| $ | 8 |
| (13 | )% | | $ | 29 |
| $ | 152 |
| (81 | )% |
| |
| (1) | Gold equivalent ounces are calculated using the following assumptions: $1,100 per ounce of gold and a by-product metal price of $16.50 per ounce of silver (2015 – $1,300 and $22.00, respectively). By-product metals are converted to gold equivalent ounces by multiplying by-product metal production with the associated by-product metal price and dividing it by the gold price. |
| |
| (2) | The calculation of total cash costs per ounce of gold is net of by-product silver sales revenues. If silver were treated as a co-product, average total cash costs at Cerro Negro for the three months and year ended December 31, 2016 would be $810 per ounce of gold and $12.14 per ounce of silver and $574 per ounce of gold and $8.74 per ounce of silver, respectively (three months and year ended December 31, 2015 – $627 and $9.85, $667 and $10.46, respectively). Production costs are allocated to each co-product based on the ratio of actual sales volumes multiplied by budget metal prices (see page 46). |
Operating Highlights
Gold production for 2016 was 28% lower than 2015 primarily due to production in 2015 included processing 410,000 tonnes of ore from stockpiles and 4% lower mine production in 2016. The ramp up of mining operations at Cerro Negro was impacted by labour disruptions associated with the workforce reduction that was undertaken as part of the restructuring process in the second quarter to align costs and staffing levels with production capability. Management implemented a maintenance and supply chain improvement program during the second half of 2016 to improve underground equipment availability.
Financial Highlights
Earnings from operations were $52 million in 2016 compared to a loss of $23 million in 2015. Earnings increased due to a decrease in production costs of $216 million including the elimination of Argentina's tax on doré exports, a devaluation of the Argentine peso and a higher realized gold price, partially offset by lower gold production and inflation.
Third Quarter Report – 2016
(in United States dollars, tabular amounts in millions, except where noted)
AISC for 2016 were 8% lower than 2015 due to lower sustaining capital costs, partially offset by lower gold production. On a per unit basis, mining costs held steady with lower tonnes matching lower costs, while milling unit costs improved 6% as cost control measures more than offset lower milled tonnes.
Sustaining capital expenditures decreased by 28% as management established new investment rates in the mine related to the cost management program. Expansionary capital expenditures decreased by 81% due to the completion of the Cerro Negro construction phase activities in early 2015.
Fourth Quarter 2016 Results
Gold production for the fourth quarter of 2016 was 55% lower than the fourth quarter of 2015 due to the processing in 2015 of 47,000 tonnes from the stockpile and the 2016 work stoppages that were associated with the workforce reduction.
AISC for the fourth quarter of 2016 were 17% higher than the fourth quarter of 2015 due to lower production partially offset by lower production costs.
2017 Outlook
Cerro Negro is expected to produce 410,000 ounces of gold (+/-5%). The increase compared to 2016 is due to the continued ramp up of the mine as development rates improve. The production ramp-up to 4,000 tonnes per day is expected to be achieved during the second half of 2018.
During the fourth quarter of 2016 the prefeasibility study on the optimal mine design, development execution plan, and production schedule was completed. The plan has development at Mariana Norte continuing to ramp up through 2017 with first ore production expected in 2018. Development of the Emilia vein is expected to begin in the second half of 2017 and is expected to replace production from Eureka in 2019.
AISC is expected to be $685 per ounce (+/-5%), similar to 2016, as a result of lower grades and higher sustaining capital, offset by continued optimization of the cost structure.
Sustaining capital for 2017 is mainly for mine development, expansion of the tailings dam facility and equipment purchases. Cerro Negro has commenced a prefeasibility study to determine whether filtered tailings and/or paste backfill would have a positive effect on NAV.
Third Quarter Report – 2016
(in United States dollars, tabular amounts in millions, except where noted)
Pueblo Viejo, Dominican Republic (40%-owned)
(tabular amounts below represent Goldcorp's proportionate 40% share)
|
| | | | | | | | | | | | | | | | | |
| | Three months ended December 31 | | Year ended December 31 |
| Operating Data | 2016 |
| 2015 |
| Change |
| | 2016 |
| 2015 |
| Change |
|
| Tonnes of ore mined (thousands) | 1,741 |
| 2,851 |
| (39 | )% | | 7,452 |
| 7,368 |
| 1 | % |
| Tonnes of waste removed (thousands) | 1,671 |
| 1,324 |
| 26 | % | | 8,066 |
| 7,789 |
| 4 | % |
| Ratio of waste to ore | 1.0 |
| 0.5 |
| 100 | % | | 1.1 |
| 1.1 |
| — | % |
| Tonnes of ore processed (thousands) | 826 |
| 546 |
| 51 | % | | 3,018 |
| 2,767 |
| 9 | % |
| Average mill head grade (grams/tonne) | 5.07 |
| 5.93 |
| (15 | )% | | 5.28 |
| 4.94 |
| 7 | % |
| Average recovery rate | 93 | % | 86 | % | 8 | % | | 91 | % | 87 | % | 5 | % |
| Gold Produced (thousands of ounces) | 127 |
| 90 |
| 41 | % | | 467 |
| 382 |
| 22 | % |
| Gold Sold (thousands of ounces) | 132 |
| 93 |
| 42 | % | | 467 |
| 450 |
| 4 | % |
Total Cash Costs: By-product (per ounce)(1) | $ | 202 |
| $ | 502 |
| (60 | )% | | $ | 343 |
| $ | 495 |
| (31 | )% |
Total Cash Costs: Co-product (per ounce)(1) | $ | 252 |
| $ | 529 |
| (52 | )% | | $ | 380 |
| $ | 516 |
| (26 | )% |
| AISC (per ounce) | $ | 311 |
| $ | 608 |
| (49 | )% | | $ | 439 |
| $ | 607 |
| (28 | )% |
| Mining cost (per tonne) | $ | 2.98 |
| $ | 2.83 |
| 5 | % | | $ | 2.82 |
| $ | 2.69 |
| 5 | % |
| Milling cost (per tonne) | $ | 18.91 |
| $ | 60.76 |
| (69 | )% | | $ | 37.88 |
| $ | 50.63 |
| (25 | )% |
| General and administrative cost (per tonne milled) | $ | 9.79 |
| $ | 15.36 |
| (36 | )% | | $ | 10.67 |
| $ | 11.62 |
| (8 | )% |
Financial Data (in millions) (2) | | | | | | | |
| Revenues | $ | 168 |
| $ | 108 |
| 56 | % | | $ | 607 |
| $ | 542 |
| 12 | % |
| Production costs | $ | 36 |
| $ | 52 |
| (31 | )% | | $ | 185 |
| $ | 242 |
| (24 | )% |
| Depreciation and depletion | $ | 3 |
| $ | 22 |
| (86 | )% | | $ | 35 |
| $ | 120 |
| (71 | )% |
| Earnings (loss) from operations | $ | 129 |
| $ | (576 | ) | n/a |
| | $ | 387 |
| $ | (429 | ) | n/a |
|
| Expenditures on mining interests (cash basis) | $ | 12 |
| $ | 7 |
| 71 | % | | $ | 40 |
| $ | 41 |
| (2 | )% |
| – Sustaining | $ | 12 |
| $ | 7 |
| 71 | % | | $ | 40 |
| $ | 41 |
| (2 | )% |
| – Expansionary | $ | — |
| $ | — |
| — |
| | $ | — |
| $ | — |
| — |
|
| |
| (1) | The calculation of total cash costs per ounce of gold is net of by-product silver sales revenue. If silver were treated as a co-product, total cash costs for the three months and year ended December 31, 2016 would be $252 per ounce of gold and $3.43 per ounce of silver and $380 per ounce of gold and $5.16 per ounce of silver, respectively (three months and year ended December 31, 2015 – $529 and $7.92, $516 and $7.74, respectively). Production costs are allocated to each co-product based on the ratio of actual sales volumes multiplied by budget metal prices (see page 33). |
| |
| (2) | The Company’s 40% interest in Pueblo Viejo is classified as an investment in associate and is accounted for using the equity method with the Company’s share of net earnings and net assets separately disclosed in the Consolidated Statements of Earnings (Loss) and Consolidated Balance Sheets, respectively. The financial data disclosed in the table represents the financial data of Pueblo Viejo on a proportionate rather than equity basis. For the three months and year ended December 31, 2016, the Company's equity earnings from Pueblo Viejo were $60 million and $169 million, respectively (three months and year ended December 31, 2015 – equity earnings of $13 million and $53 million and an impairment charge of $610 million, respectively). |
Operating Highlights
Gold production for 2016 was 22% higher than 2015 primarily due to higher ore milled, grades and recoveries. Ore milled in 2016 increased by 9% in comparison with 2015 as a consequence of lower tonnage processed in 2015 primarily due to the oxygen plant failure in November. Higher gold recovery in 2016 was a result of ore processed containing lower organic carbon than in 2015. The increase in head grades was attributable to the mining sequence.
Material mined in 2016 was slightly above 2015 as a result of improvements in the utilization of equipment, the use of contractors to perform re-handle activities, and a more efficient loading fleet.
Financial Highlights
Earnings from operations were $387 million in 2016 compared to earnings of $181 million in 2015 (excluding the $610 million 2015 impairment in mining interest). Earnings increased from higher revenues from increased production, a higher gold price, lower production costs, the receipt of insurance proceeds relating to the oxygen plant failure in 2015 and lower depreciation and depletion costs.
Third Quarter Report – 2016
(in United States dollars, tabular amounts in millions, except where noted)
AISC for 2016 were 28% lower than 2015 due to lower operating costs and higher production. Operating costs were lower in 2016 than 2015 primarily due to lower maintenance costs which resulted from a major maintenance shutdown in late 2015, and lower power costs due to reduced rates.
Sustaining capital expenditures for 2016 were in line with 2015.
Fourth Quarter 2016 Results
Gold production in the fourth quarter of 2016 was 41% higher than the fourth quarter of 2015 primarily due to higher throughput as the mill experienced an oxygen plant failure which reduced throughput in the fourth quarter of 2015.
AISC for the fourth quarter of 2016 were 49% lower than the fourth quarter 2015 due to higher gold production and lower production costs. Higher production in 2016 resulted from lower throughput in 2015 due to the oxygen plant failure. Lower production costs in 2016 were primarily due to the receipt of insurance proceeds related to the oxygen plant failure.
2017 Outlook
Pueblo Viejo is expected to produce 415,000 ounces of gold (+/-5%). The decrease compared to 2016 is due to lower grade. AISC is expected to be $530 per ounce (+/-5%). The increase compared to 2016 is due to the insurance proceeds received in 2016 and higher sustaining capital expenditures.
Third Quarter Report – 2016
(in United States dollars, tabular amounts in millions, except where noted)
Red Lake, Canada (100%-owned)
|
| | | | | | | | | | | | | | | | | |
| | Three months ended December 31 | | Year ended December 31 |
| Operating Data | 2016 |
| 2015 |
| Change |
| | 2016 |
| 2015 |
| Change |
|
| Tonnes of ore milled (thousands) | 170 |
| 201 |
| (15 | )% | | 646 |
| 646 |
| — | % |
| Average mill head grade (grams/tonne) | 15.04 |
| 15.57 |
| (3 | )% | | 16.18 |
| 18.44 |
| (12 | )% |
| Average recovery rate | 96 | % | 95 | % | 1 | % | | 96 | % | 96 | % | — | % |
Gold Produced (thousands of ounces)(1) | 88 |
| 100 |
| (12 | )% | | 324 |
| 376 |
| (14 | )% |
| Gold Sold (thousands of ounces) | 76 |
| 92 |
| (17 | )% | | 313 |
| 366 |
| (14 | )% |
| Total Cash Costs: By-product (per ounce) | $ | 608 |
| $ | 610 |
| — | % | | $ | 582 |
| $ | 572 |
| 2 | % |
| AISC (per ounce) | $ | 932 |
| $ | 959 |
| (3 | )% | | $ | 872 |
| $ | 906 |
| (4 | )% |
| Mining cost (per tonne) | $ | 199.65 |
| $ | 170.34 |
| 17 | % | | $ | 196.49 |
| $ | 198.63 |
| (1 | )% |
Milling cost (per tonne) (1) | $ | 43.05 |
| $ | 39.64 |
| 9 | % | | $ | 45.77 |
| $ | 48.56 |
| (6 | )% |
| General and administrative cost (per tonne milled) | $ | 90.50 |
| $ | 58.99 |
| 53 | % | | $ | 66.75 |
| $ | 70.26 |
| (5 | )% |
| Financial Data (in millions) | | | | | | | |
| Revenues | $ | 87 |
| $ | 102 |
| (15 | )% | | $ | 388 |
| $ | 427 |
| (9 | )% |
| Production costs | $ | 42 |
| $ | 51 |
| (18 | )% | | $ | 179 |
| $ | 196 |
| (9 | )% |
| Depreciation and depletion | $ | 33 |
| $ | 32 |
| 3 | % | | $ | 123 |
| $ | 123 |
| — | % |
| Earnings (loss) from operations | $ | 5 |
| $ | (1,201 | ) | n/a |
| | $ | 64 |
| $ | (1,132 | ) | n/a |
|
| Expenditures on mining interests (cash basis) | $ | 24 |
| $ | 38 |
| (37 | )% | | $ | 100 |
| $ | 170 |
| (41 | )% |
| – Sustaining | $ | 22 |
| $ | 25 |
| (12 | )% | | $ | 78 |
| $ | 93 |
| (16 | )% |
| – Expansionary | $ | 2 |
| $ | 13 |
| (85 | )% | | $ | 22 |
| $ | 77 |
| (71 | )% |
| |
| (1) | Included in tonnes of ore milled and gold ounces produced for the fourth quarter and year ended 2016 year are 21,000 tonnes (2015 - 11,000 tonnes) and 35,000 tonnes (2015 - 27,000 tonnes), respectively, from the Cochenour project. |
Operating Highlights
Gold production for 2016 was 14% lower than 2015 primarily due to lower grade. Grade was lower as the High Grade Zone and Campbell continued to deplete and production was replaced with lower grade ore from Upper Red Lake. In 2015, Red Lake focused on the conversion of mining methods to longhole mining in the High Grade Zone, mechanized bulk mining in the Upper Red Lake Zone, and tele-remote mining to provide additional economic tonnes to offset the depletion of the High Grade Zone.
Financial Highlights
Earnings from operations of $64 million in 2016 compared to earnings of $81 million in 2015 (excluding the $1,213 million 2015 impairment in mining interest). The earnings decrease was due to lower sold ounces, partially offset by higher gold prices as well as lower mining, processing, administration and exploration costs.
AISC in 2016 were 4% lower than 2015 due to lower production costs and lower sustaining capital that was partially offset by lower gold production.
Sustaining capital expenditures for 2016 decreased by 16% due to efficiency improvements in development unit costs. Expansionary capital declined by 71% as project activities at Cochenour decreased significantly in 2016, with work focusing on geological understanding of the ore body in order to support development of the Cochenour starter mine concept study.
Fourth Quarter 2016 Results
Gold production for the fourth quarter of 2016 was 12% lower than the fourth quarter of 2015 due to lower tonnes from the depletion of the Campbell mine as well as a focus on mine development to increase mining front availability.
AISC in the fourth quarter of 2016 were 3% lower than the fourth quarter of 2015 due to lower production costs and lower sustaining capital, offset by lower gold production.
Third Quarter Report – 2016
(in United States dollars, tabular amounts in millions, except where noted)
2017 Outlook
Red Lake is expected to produce 300,000 ounces of gold (+/-5%). The decrease compared to 2016 is due to lower grades as the High Grade Zone depletes. At Red Lake there are two key growth projects, Cochenour and HG Young, that are advancing through the Company's investment framework that have the potential to provide new sources of ore over the long-term.
AISC is expected to be $870 per ounce (+/-5%), comparable to 2016 as lower operating costs are offset by lower production. The site is focused on realizing new cost efficiencies through the rationalization of site infrastructure and initiatives. The Number One Shaft was placed on care and maintenance in the third quarter of 2016, the Red Lake mill was placed on care and maintenance in the first quarter of 2017 and the Campbell shaft is expected be placed on care and maintenance in the second quarter of 2017.
Third Quarter Report – 2016
(in United States dollars, tabular amounts in millions, except where noted)
Éléonore, Canada (100%-owned)
|
| | | | | | | | | | | | | | | | | |
| | Three months ended December 31 | | Year ended December 31 |
| Operating Data | 2016 |
| 2015 |
| Change |
| | 2016 |
| 2015 |
| Change |
|
| Tonnes of ore mined (thousands) | 401 |
| 428 |
| (6 | )% | | 1,688 |
| 1,381 |
| 22 | % |
| Tonnes of ore milled (thousands) | 399 |
| 517 |
| (23 | )% | | 1,688 |
| 1,707 |
| (1 | )% |
| Average mill head grade (grams/tonne) | 5.50 |
| 7.57 |
| (27 | )% | | 5.48 |
| 5.91 |
| (7 | )% |
| Average recovery rate | 90 | % | 85 | % | 6 | % | | 90 | % | 86 | % | 5 | % |
| Gold Produced (thousands of ounces) | 65 |
| 105 |
| (38 | )% | | 274 |
| 268 |
| 2 | % |
| Gold Sold (thousands of ounces) | 69 |
| 103 |
| (33 | )% | | 278 |
| 265 |
| 5 | % |
| Total Cash Costs: By-product (per ounce) | $ | 965 |
| $ | 677 |
| 43 | % | | $ | 875 |
| $ | 911 |
| (4 | )% |
| AISC (per ounce) | $ | 1,075 |
| $ | 761 |
| 41 | % | | $ | 981 |
| $ | 1,007 |
| (3 | )% |
| Mining cost (per tonne) | $ | 72.71 |
| $ | 58.26 |
| 25 | % | | $ | 65.24 |
| $ | 73.58 |
| (11 | )% |
| Milling cost (per tonne) | $ | 36.03 |
| $ | 37.85 |
| (5 | )% | | $ | 37.45 |
| $ | 39.37 |
| (5 | )% |
| General and administrative cost (per tonne milled) | $ | 38.96 |
| $ | 32.31 |
| 21 | % | | $ | 35.68 |
| $ | 36.09 |
| (1 | )% |
| Financial Data (in millions) | | | | | | | |
Revenues (1) | $ | 82 |
| $ | 112 |
| (27 | )% | | $ | 346 |
| $ | 259 |
| 34 | % |
| Production costs | $ | 66 |
| $ | 65 |
| 2 | % | | $ | 243 |
| $ | 201 |
| 21 | % |
| Depreciation and depletion | $ | 39 |
| $ | 59 |
| (34 | )% | | $ | 146 |
| $ | 137 |
| 7 | % |
| Loss from operations | $ | (24 | ) | $ | (410 | ) | (94 | )% | | $ | (43 | ) | $ | (476 | ) | (91 | )% |
| Expenditures on mining interests (cash basis) | $ | 32 |
| $ | 30 |
| 7 | % | | $ | 94 |
| $ | 267 |
| (65 | )% |
| – Sustaining | $ | 8 |
| $ | 8 |
| — | % | | $ | 28 |
| $ | 21 |
| 33 | % |
| – Expansionary | $ | 24 |
| $ | 22 |
| 9 | % | | $ | 66 |
| $ | 246 |
| (73 | )% |
| |
| (1) | During the pre-commissioning production period (prior to April 1, 2015), costs incurred, net of proceeds from sales of $48 million, were offset against capitalized mining costs and are referred to as pre-operating expenditures. |
Operating Highlights
Gold production for 2016 was 2% higher than 2015 due to an increase in mined tonnes, which was partially offset by the exhaustion of surface stockpiles that contributed to mill feed in 2015. Éléonore mined 22% more tonnes in 2016 than 2015 as mining on four levels was established and higher productivity was achieved with the completion of the production shaft in the fourth quarter of 2016 and the ore handling system on the 690 meter level.
Financial Highlights
Loss from operations of $43 million in 2016 compared to a loss from operations of $78 million in 2015 (excluding the $398 million 2015 impairment in mining interest). The loss decreased as a result of a higher realized gold price, as well as lower production costs on a per unit basis as the mine completed key infrastructure.
AISC for 2016 were 3% lower than 2015 due to increased efficiencies resulting in lower operating costs. Mining costs per tonne decreased by 11% as the mine increased output and greater efficiency was achieved from the completion of the production shaft and ore handling systems.
Sustaining capital expenditures for the year ended 2016 increased 33% compared to 2015 as the mine continued to expand operations. Expansionary capital expenditures decreased by 73% as the majority of the permanent mine infrastructure was completed in 2015.
Fourth Quarter 2016 Results
Gold production for the fourth quarter of 2016 was 38% lower than the fourth quarter of 2015 due to lower milled tonnes and lower grade. Lower milled tonnes were the result of the depletion of surface stockpiles in 2015 and lower grades were consistent with the mine plan.
AISC for the fourth quarter of 2016 was 41% higher than the fourth quarter of 2015 due to lower production.
Third Quarter Report – 2016
(in United States dollars, tabular amounts in millions, except where noted)
2017 Outlook
Eleonore expects to produce 315,000 ounces of gold (+/-5%). The increase compared to 2016 is due to the continued ramp up of the mine. The production ramp-up into full capacity is expected to continue into 2018 with the anticipated addition of a fifth production horizon. A life of mine study is underway to determine the sustainable mining rate from the Roberto deposit.
AISC is expected to be $985 per ounce (+/-5%). While there is expected to be a decrease in operating costs as the mine benefits from a full year of production from the permanent ore handling system, including the production shaft, and efficiencies from higher throughput rates, this is expected to be offset by higher sustaining capital related to tailings management facility expansion.
Third Quarter Report – 2016
(in United States dollars, tabular amounts in millions, except where noted)
Porcupine, Canada (100%-owned)
|
| | | | | | | | | | | | | | | | | |
| | Three months ended December 31 | | Year ended December 31 |
| Operating Data | 2016 |
| 2015 |
| Change |
| | 2016 |
| 2015 |
| Change |
|
| Tonnes of ore milled (thousands) | 808 |
| 1,118 |
| (28 | )% | | 3,491 |
| 4,015 |
| (13 | )% |
| Average mill head grade (grams/tonne) | 2.78 |
| 2.43 |
| 14 | % | | 2.64 |
| 2.37 |
| 11 | % |
| Average recovery rate | 92 | % | 89 | % | 3 | % | | 92 | % | 90 | % | 2 | % |
| Gold Produced (thousands of ounces) | 66 |
| 74 |
| (11 | )% | | 277 |
| 274 |
| 1 | % |
| Gold Sold (thousands of ounces) | 63 |
| 74 |
| (15 | )% | | 275 |
| 273 |
| 1 | % |
| Total Cash Costs: By-product (per ounce) | $ | 733 |
| $ | 769 |
| (5 | )% | | $ | 688 |
| $ | 776 |
| (11 | )% |
| AISC (per ounce) | $ | 985 |
| $ | 1,031 |
| (4 | )% | | $ | 898 |
| $ | 1,078 |
| (17 | )% |
| Mining cost underground (per tonne) | $ | 127.37 |
| $ | 85.85 |
| 48 | % | | $ | 105.81 |
| $ | 101.35 |
| 4 | % |
| Mining cost open pit (per tonne) | $ | 4.70 |
| $ | 4.92 |
| (4 | )% | | $ | 4.94 |
| $ | 5.56 |
| (11 | )% |
| Milling cost (per tonne) | $ | 8.20 |
| $ | 7.67 |
| 7 | % | | $ | 7.75 |
| $ | 8.47 |
| (9 | )% |
| General and administrative cost (per tonne milled) | $ | 10.52 |
| $ | 11.23 |
| (6 | )% | | $ | 10.83 |
| $ | 12.34 |
| (12 | )% |
| Financial Data (in millions) | | | | | | | |
| Revenues | $ | 76 |
| $ | 82 |
| (7 | )% | | $ | 343 |
| $ | 315 |
| 9 | % |
Production costs (1) | $ | 8 |
| $ | (4 | ) | n/a |
| | $ | 151 |
| $ | 142 |
| 6 | % |
| Depreciation and depletion | $ | 7 |
| $ | 14 |
| (50 | )% | | $ | 63 |
| $ | 50 |
| 26 | % |
| Earnings (loss) from operations | $ | 59 |
| $ | (52 | ) | n/a |
| | $ | 123 |
| $ | (1 | ) | n/a |
|
| Expenditures on mining interests (cash basis) | $ | 21 |
| $ | 26 |
| (19 | )% | | $ | 62 |
| $ | 97 |
| (36 | )% |
| – Sustaining | $ | 15 |
| $ | 15 |
| — | % | | $ | 46 |
| $ | 67 |
| (31 | )% |
| – Expansionary | $ | 6 |
| $ | 11 |
| (45 | )% | | $ | 16 |
| $ | 30 |
| (47 | )% |
| |
| (1) | Production costs for the fourth quarter of 2016 were $46 million compared to $53 million in 2015, excluding a change in estimate of reclamation costs for closed sites. |
Operating Highlights
Gold production for 2016 was comparable to 2015 as lower ounces from the Dome underground were offset by higher production from the Hollinger Open Pit, which commenced 24 hour a day production in October 2015 and displaced the lower grade stockpile ore processed in 2015. New efficiencies for ore and people movement were realized in 2016 at Hoyle Pond with the completion of the Hoyle Deep winze.
Financial Highlights
Earnings from operations were $123 million in 2016 compared to earnings of $122 million in 2015 (excluding the $123 million 2015 impairment in mining interest).
AISC for 2016 were 17% lower than 2015 due to lower sustaining capital expenditures as Hoyle Deep was completed early in 2016. Expansionary capital decreased in 2016 as construction at Hollinger ended in 2015.
Fourth Quarter 2016 Results
Gold production for the fourth quarter of 2016 was 11% lower than the fourth quarter of 2015 due to planned lower production from the depletion of the Dome underground and lower tonnes were milled as depletion of the low grade stockpile was partially offset by the increased production at Hollinger Open Pit.
AISC for the fourth quarter of 2016 were 4% lower than the fourth quarter of 2015 due to lower production costs, partially offset by lower gold production.
2017 Outlook
Porcupine is expected to produce 285,000 ounces (+/-5%), with AISC expected to be $900 per ounce (+/-5%), consistent with 2016.
Third Quarter Report – 2016
(in United States dollars, tabular amounts in millions, except where noted)
Musselwhite, Canada (100%-owned)
|
| | | | | | | | | | | | | | | | | |
| | Three months ended December 31 | | Year ended December 31 |
| Operating Data | 2016 |
| 2015 |
| Change |
| | 2016 |
| 2015 |
| Change |
|
| Tonnes of ore milled (thousands) | 348 |
| 314 |
| 11 | % | | 1,188 |
| 1,209 |
| (2 | )% |
| Average mill head grade (grams/tonne) | 7.13 |
| 7.95 |
| (10 | )% | | 7.17 |
| 7.15 |
| — | % |
| Average recovery rate | 95 | % | 97 | % | (2 | )% | | 96 | % | 97 | % | (1 | )% |
| Gold Produced (thousands of ounces) | 75 |
| 81 |
| (7 | )% | | 261 |
| 270 |
| (3 | )% |
| Gold Sold (thousands of ounces) | 74 |
| 83 |
| (11 | )% | | 260 |
| 269 |
| (3 | )% |
| Total Cash Costs: By-product (per ounce) | $ | 511 |
| $ | 527 |
| (3 | )% | | $ | 538 |
| $ | 599 |
| (10 | )% |
| AISC (per ounce) | $ | 696 |
| $ | 699 |
| — | % | | $ | 678 |
| $ | 766 |
| (11 | )% |
| Mining cost (per tonne) | $ | 55.03 |
| $ | 59.55 |
| (8 | )% | | $ | 60.41 |
| $ | 65.18 |
| (7 | )% |
| Milling cost (per tonne) | $ | 13.46 |
| $ | 11.97 |
| 12 | % | | $ | 12.95 |
| $ | 13.01 |
| — | % |
| General and administrative cost (per tonne milled) | $ | 34.31 |
| $ | 40.03 |
| (14 | )% | | $ | 40.75 |
| $ | 39.44 |
| 3 | % |
| Financial Data (in millions) | | | | | | | |
| Revenues | $ | 87 |
| $ | 92 |
| (5 | )% | | $ | 321 |
| $ | 311 |
| 3 | % |
| Production costs | $ | 37 |
| $ | 40 |
| (8 | )% | | $ | 140 |
| $ | 150 |
| (7 | )% |
| Depreciation and depletion | $ | 12 |
| $ | 19 |
| (37 | )% | | $ | 59 |
| $ | 63 |
| (6 | )% |
| Earnings from operations | $ | 38 |
| $ | 33 |
| 15 | % | | $ | 118 |
| $ | 92 |
| 28 | % |
| Expenditures on mining interests (cash basis) | $ | 18 |
| $ | 13 |
| 38 | % | | $ | 37 |
| $ | 38 |
| (3 | )% |
| – Sustaining | $ | 12 |
| $ | 13 |
| (8 | )% | | $ | 29 |
| $ | 38 |
| (24 | )% |
| – Expansionary | $ | 6 |
| $ | — |
| — |
| | $ | 8 |
| $ | — |
| — |
|
Operating Highlights
Gold production for 2016 was comparable to 2015. Mining activities continued to primarily be based in the PQ Deep and Lynx zones.
Financial Highlights
Earnings from operations were $118 million in 2016 compared to earnings of $92 million in 2015. Earnings increased due to higher gold prices and continued cost reduction efforts, partially offset by lower ounces sold.
AISC for 2016 were 11% lower than 2015 due to lower production costs and lower sustaining capital, partially offset by lower gold production.
Sustaining capital expenditures for 2016 decreased by 24% primarily as a result of lower capital development.
Fourth Quarter 2016 Results
Gold production for the fourth quarter of 2016 was 7% lower than the fourth quarter of 2015 due to lower head grade and a lower recovery rate.
AISC for the fourth quarter of 2016 were essentially unchanged from the fourth quarter of 2015 due to reduced operating costs, offset by lower gold production.
2017 Outlook
Musselwhite is expected to produce 265,000 ounces of gold (+/-5%) in line with 2016. AISC is expected to be $715 per ounce (+/-5%), in line with 2016.
Third Quarter Report – 2016
(in United States dollars, tabular amounts in millions, except where noted)
OTHER MINE SITE OPERATING AND FINANCIAL DATA
The Company's Other operations consist of Los Filos (100%-owned) in Mexico, Marlin (100%-owned) in Guatemala, and Alumbrera (37.5%-owned) in Argentina.
Los Filos, Mexico (100%-owned)
|
| | | | | | | | | | | | | | | | | |
| | Three months ended December 31 | | Year ended December 31 |
| Operating Data | 2016 |
| 2015 |
| Change |
| | 2016 |
| 2015 |
| Change |
|
| Tonnes of ore mined (thousands) | 2,130 |
| 5,482 |
| (61 | )% | | 10,717 |
| 18,738 |
| (43 | )% |
| Tonnes of waste removed (thousands) | 1,950 |
| 8,368 |
| (77 | )% | | 13,344 |
| 43,862 |
| (70 | )% |
| Ratio of waste to ore | 0.9 |
| 1.6 |
| (44 | )% | | 1.3 |
| 2.4 |
| (46 | )% |
| Tonnes of ore processed (thousands) | 2,205 |
| 5,468 |
| (60 | )% | | 10,809 |
| 18,607 |
| (42 | )% |
| Average grade processed (grams/tonne) | 0.78 |
| 0.78 |
| — | % | | 0.82 |
| 0.76 |
| 8 | % |
| Gold Produced (thousands of ounces) | 37 |
| 75 |
| (51 | )% | | 231 |
| 273 |
| (15 | )% |
| Gold Sold (thousands of ounces) | 45 |
| 77 |
| (42 | )% | | 235 |
| 271 |
| (13 | )% |
Total Cash Costs: By-product (per ounce) (1) | $ | 806 |
| $ | 2,004 |
| (60 | )% | | $ | 756 |
| $ | 1,313 |
| (42 | )% |
AISC (per ounce) (1) | $ | 977 |
| $ | 2,131 |
| (54 | )% | | $ | 878 |
| $ | 1,488 |
| (41 | )% |
| Financial Data (in millions) | | | | | | | |
| Expenditures on mining interests (cash basis) | $ | 5 |
| $ | 9 |
| (44 | )% | | $ | 24 |
| $ | 43 |
| (44 | )% |
| – Sustaining | $ | 5 |
| $ | 9 |
| (44 | )% | | $ | 24 |
| $ | 43 |
| (44 | )% |
| – Expansionary | $ | — |
| $ | — |
| — |
| | $ | — |
| $ | — |
| — |
|
| |
| (1) | Cash reductions to the carrying value of the heap leach ore inventory to net realizable value were recorded during the three months and year ended December 31, 2015 for $92 million and $131 million, respectively. Total cash costs by-product and AISC, excluding the impact of carrying value reduction for the year ended 2015 were $829 per ounce and $1,003 per ounce, respectively (three months ended December 31, 2015, $811 per ounce and $937 per ounce, respectively). |
Operating Highlights
On January 12, 2017 the Company announced the sale of Los Filos to Leagold which is expected to close by the end of the first quarter of 2017.
Commencing in 2016, Los Filos has been operating under a revised life of mine plan that includes a smaller pit and lower stripping costs.
Gold production for 2016 was 15% lower than 2015 primarily due to the revision of the mine plan. The lower tonnes placed on the heap leach pad that reduced gold production were partially offset by higher grade ore mined and higher recovered ounces from enhanced recovery strategies for the leach pad inventories, including higher solution flow, high pressure solution injection and deeper surface ripping.
AISC for 2016 were 41% lower than 2015 due to the 2015 year end heap leach inventory being reduced by $131 million to net realizable value. Excluding the impact of the heap leach write down, AISC for 2016 were 12% lower than 2015 due to lower operating costs, a weaker Mexican peso and lower sustaining capital expenditures, partially offset by lower gold production.
Sustaining capital expenditures for the year ended 2016 were 44% lower than 2015 as a result of lower development costs tied to the revised life of mine plan.
Fourth Quarter 2016 Results
Gold production for the fourth quarter of 2016 was 51% lower than fourth quarter of 2015 due to the revision of the mine plan. The lower tonnes placed on the heap leach pad that reduced gold production were partially offset by higher recovered ounces from enhanced recovery strategies for the leach pad inventories.
Excluding the impact of the heap leach write down, AISC for fourth quarter of 2016 was in line with 2015.
Third Quarter Report – 2016
(in United States dollars, tabular amounts in millions, except where noted)
Marlin, Guatemala (100% owned)
|
| | | | | | | | | | | | | | | | | |
| | Three months ended December 31 | | Year ended December 31 |
| Operating Data | 2016 |
| 2015 |
| Change |
| | 2016 |
| 2015 |
| Change |
|
| Tonnes of ore milled (thousands) | 266 |
| 310 |
| (14 | )% | | 1,006 |
| 1,310 |
| (23 | )% |
| Average mill Gold grade (grams/tonne) | 3.39 |
| 4.12 |
| (18 | )% | | 3.65 |
| 4.12 |
| (11 | )% |
| Average mill Silver grade (grams/tonne) | 203 |
| 198 |
| 3 | % | | 184 |
| 185 |
| (1 | )% |
| Average Gold recovery rate | 97 | % | 97 | % | — | % | | 97 | % | 97 | % | — | % |
| Average Silver recovery rate | 96 | % | 95 | % | 1 | % | | 96 | % | 95 | % | 1 | % |
| Gold Produced (thousands of ounces) | 28 |
| 41 |
| (32 | )% | | 115 |
| 169 |
| (32 | )% |
| Silver Produced (thousands of ounces) | 1,651 |
| 1,884 |
| (12 | )% | | 5,747 |
| 7,338 |
| (22 | )% |
Gold equivalent ounces produced (thousands of ounces)(1) | 52 |
| 73 |
| (29 | )% | | 201 |
| 293 |
| (31 | )% |
| Gold Sold (thousands of ounces) | 27 |
| 44 |
| (39 | )% | | 116 |
| 169 |
| (31 | )% |
| Silver Sold (thousands of ounces) | 1,536 |
| 1,993 |
| (23 | )% | | 5,739 |
| 7,294 |
| (21 | )% |
Total Cash Costs: By-product (per ounce) (2) | $ | 600 |
| $ | 287 |
| 109 | % | | $ | 803 |
| $ | 336 |
| 139 | % |
Total Cash Costs: Co-product (per ounce) (2) | $ | 874 |
| $ | 563 |
| 55 | % | | $ | 977 |
| $ | 611 |
| 60 | % |
| AISC (per ounce) | $ | 716 |
| $ | 787 |
| (9 | )% | | $ | 986 |
| $ | 868 |
| 14 | % |
| Financial Data (in millions) | | | | | | | |
| Expenditures on mining interests (cash basis) | $ | — |
| $ | 17 |
| (100 | )% | | $ | 2 |
| $ | 67 |
| (97 | )% |
| – Sustaining | $ | — |
| $ | 17 |
| (100 | )% | | $ | 2 |
| $ | 67 |
| (97 | )% |
| – Expansionary | $ | — |
| $ | — |
| — |
| | $ | — |
| $ | — |
| — |
|
| |
| (1) | Gold equivalent ounces are calculated using the following assumptions: $1,100 per ounce of gold and a by-product metal price of $16.50 per ounce of silver (2015 – $1,300; $22.00, respectively). By-product metals are converted to gold equivalent ounces by multiplying by-product metal production with the associated by-product metal price and dividing it by the gold price. |
| |
| (2) | The calculation of total cash costs per ounce of gold is net of by-product silver sales revenues. If silver were treated as a co-product, average total cash costs at Marlin for the three months and year ended December 31, 2016 would be $874 per ounce of gold and $12.20 per ounce of silver and $977 per ounce of gold and $13.60 per ounce of silver, respectively (three months and year ended December 31, 2015 – $563 and $8.71, and $611 and $9.42, respectively). Production costs are allocated to each co-product based on the ratio of actual sales volumes multiplied by budget metal prices (see page 46). |
Operating Highlights
The Marlin mine has commenced closure activities and the remaining production is expected to be completed by the end of the first quarter of 2017.
Gold production for 2016 was 32% lower than 2015 primarily due to less ore from remnant mining and 11% lower head grade. Tonnes processed were 23% lower in line with the reduced mine production.
AISC for 2016 were 14% higher than 2015 due to lower gold production, partially offset by lower sustaining capital expenditures.
Sustaining capital expenditures for 2016 were negligible due to the short mine life.
Fourth Quarter 2016 Results
Gold production for the fourth quarter of 2016 was 32% lower than the fourth quarter of 2015 due to 14% lower tonnes processed and 18% lower head grade.
AISC for the fourth quarter of 2016 were 9% lower than the fourth quarter of 2015 due to lower sustaining capital expenditures, partially offset by lower gold production.
Third Quarter Report – 2016
(in United States dollars, tabular amounts in millions, except where noted)
Alumbrera, Argentina (37.5%-owned)
(tabular amounts below represent Goldcorp's proportionate 37.5% share)
|
| | | | | | | | | | | | | | | | | |
| | Three months ended December 31 | | Year ended December 31 |
| Operating Data | 2016 |
| 2015 |
| Change |
| | 2016 |
| 2015 |
| Change |
|
| Tonnes of ore mined (thousands) | 3,269 |
| 3,117 |
| 5 | % | | 12,567 |
| 14,227 |
| (12 | )% |
| Tonnes of waste removed (thousands) | 1,215 |
| 3,563 |
| (66 | )% | | 9,478 |
| 17,119 |
| (45 | )% |
| Ratio of waste to ore | 0.4 |
| 1.1 |
| (64 | )% | | 0.8 |
| 1.2 |
| (33 | )% |
| Tonnes of ore milled (thousands) | 3,501 |
| 3,165 |
| 11 | % | | 12,999 |
| 12,401 |
| 5 | % |
| Average mill Gold grade (grams/tonne) | 0.31 |
| 0.35 |
| (11 | )% | | 0.33 |
| 0.27 |
| 22 | % |
| Average mill Copper grade | 0.30 | % | 0.36 | % | (17 | )% | | 0.28 | % | 0.24 | % | 17 | % |
| Average Gold recovery rate | 76 | % | 72 | % | 6 | % | | 71 | % | 67 | % | 6 | % |
| Average Copper recovery rate | 88 | % | 86 | % | 2 | % | | 84 | % | 74 | % | 14 | % |
| Gold Produced (thousands of ounces) | 26 |
| 26 |
| — | % | | 96 |
| 74 |
| 30 | % |
| Copper Produced (thousands of pounds) | 20,200 |
| 21,300 |
| (5 | )% | | 67,700 |
| 51,100 |
| 32 | % |
Gold equivalent ounces produced (thousands of ounces)(1) | 80 |
| 77 |
| 4 | % | | 273 |
| 198 |
| 38 | % |
| Gold Sold (thousands of ounces) | 27 |
| 25 |
| 8 | % | | 94 |
| 73 |
| 29 | % |
| Copper Sold (thousands of pounds) | 21,400 |
| 16,900 |
| 27 | % | | 66,500 |
| 51,000 |
| 30 | % |
Total Cash Costs: By-product (per ounce) (2) | $ | 56 |
| $ | 1,028 |
| (95 | )% | | $ | 509 |
| $ | 1,264 |
| (60 | )% |
Total Cash Costs: Co-product (per ounce) (2) | $ | 644 |
| $ | 813 |
| (21 | )% | | $ | 723 |
| $ | 954 |
| (24 | )% |
| AISC (per ounce) | $ | 140 |
| $ | 1,274 |
| (89 | )% | | $ | 603 |
| $ | 1,670 |
| (64 | )% |
| Financial Data (in millions) | | | | | | | |
| Expenditures on mining interests (cash basis) | $ | 1 |
| $ | 4 |
| (75 | )% | | $ | 1 |
| $ | 18 |
| (94 | )% |
| – Sustaining | $ | 1 |
| $ | 4 |
| — |
| | $ | 1 |
| $ | 18 |
| (94 | )% |
| – Expansionary | $ | — |
| $ | — |
| — | % | | $ | — |
| $ | — |
| — | % |
| |
| (1) | Gold equivalent ounces are calculated using the following assumptions: $1,100 per ounce of gold and a by-product metal price of $2.75 per pound of copper (2015 – $1,300 and $3.00, respectively). By-product metals are converted to gold equivalent ounces by multiplying by-product metal production with the associated by-product metal price and dividing it by the gold price. |
| |
| (2) | The calculation of total cash costs per ounce of gold is net of by-product copper sales revenue. If copper were treated as a co-product, total cash costs for the three months and year ended December 31, 2016 would be $644 per ounce and gold and $1.81 per pound of copper and $723 per ounce of gold and $1.97 per pound of copper, respectively (three months and year ended December 31, 2015 – $813 and $2.32, $954 and $2.69, respectively). Production costs are allocated to each co-product based on the ratio of actual sales volumes multiplied by budget metal prices (see page 46). |
Operating Highlights
Gold and copper production for 2016 were 30% and 32%, higher, respectively, than 2015 primarily due to higher ore milled, grades and recoveries.
Head grades were higher than 2015 due to ore mined from the higher grade areas of phase 12 of Alumbrera pit, while in 2015 ore mined was from the lower grade phase 11 portion of the pit. Ore milled in 2016 was higher than 2015 due to softer ore from Bajo el Durazno pit and higher mill utilization. Higher gold recoveries were due to better head grades. Copper recoveries were higher due to better head grades than 2015 and due to the presence of soluble copper material in 2015.
AISC for 2016 were 64% lower than 2015 due to higher production volume, lower sustaining capital expenditures, a weaker Argentine Peso and lower production taxes due to elimination by the government in February 2016 of the eight percent export duty.
Fourth Quarter 2016 Results
Gold production in the fourth quarter of 2016 was consistent with the fourth quarter of 2015. Copper production was 5% lower than the fourth quarter of 2015 due to lower head grade.
AISC for the fourth quarter of 2016 were 89% lower than the fourth quarter of 2015 due to lower waste material moved, higher by-product copper credits, lower sustaining capital expenditures, and a weaker Argentine Peso.
Third Quarter Report – 2016
(in United States dollars, tabular amounts in millions, except where noted)
PROJECTS PIPELINE
The Company has numerous projects underway that provide potential growth in NAV. The current anticipated project milestones for 2017 through 2021 are outlined below.
Growth capital for 2016 included Peñasquito's Pyrite Leach project and Musselwhite's Materials Handling project that were approved by the Company's Board of Directors on July 27, 2016, expenditures on the Coffee project following its acquisition on July 19, 2016 and other internal growth projects that are in various stages of Goldcorp's investment framework. Growth capital in 2015 included significant capital spending on completing the Éléonore and Cerro Negro mines.
Expenditures relating to growth projects for the year ended December 31, 2016 were as follows (in millions):
|
| | | | | | | |
| | | Year ended December 31 |
| Project | | 2016 | 2015 |
| Peñasquito – Pyrite Leach | | $ | 38 |
| $ | 17 |
|
| Musselwhite – Materials Handling | | $ | 8 |
| $ | — |
|
| Red Lake – HG Young | | $ | 9 |
| $ | 25 |
|
| Red Lake – Cochenour | | $ | 22 |
| $ | 77 |
|
| Porcupine – Borden | | $ | 16 |
| $ | 23 |
|
| Coffee | | $ | 14 |
| $ | — |
|
| NuevaUnión (50%) | | $ | 10 |
| $ | 13 |
|
| Eleonore | | $ | 66 |
| $ | 246 |
|
| Cerro Negro | | $ | 29 |
| $ | 152 |
|
| Other | | $ | 4 |
| $ | 5 |
|
| TOTAL | | $ | 216 |
| $ | 558 |
|
Of the $216 million and $558 million of expenditures for the years ended December 31, 2016 and 2015, respectively, $207 million and $533 million are included in expenditures on mining interests as expansionary capital and $9 million and $25 million (relating to HG Young), respectively, have been expensed as exploration.
Third Quarter Report – 2016
(in United States dollars, tabular amounts in millions, except where noted)
Peñasquito: Pyrite Leach Project
The Pyrite Leach Project (“PLP”) received Board approval on July 27, 2016, with an expected capital investment of approximately $420 million based on a feasibility study completed in December 2015. At Peñasquito, the PLP is expected to increase overall gold and silver recovery by treating the zinc tailings before discharge to the tailings storage facility. The PLP is expected to provide annual incremental production of 100,000-140,000 gold ounces and approximately 4-6 million silver ounces commencing in 2019.
PLP achieved 65% engineering progress by the end of 2016, while procurement activities are well advanced to support execution. Major works contractors are mobilizing on site and construction of permanent facilities has been initiated. As part of the PLP, a carbon pre-flotation facility is being constructed, anticipated to be completed in the second quarter of 2018.
Project expenditures have been included as expansionary capital in expenditures on mining interests in Peñasquito.
Musselwhite: Materials Handling Project
The Materials Handling Project received Board approval on July 27, 2016, with an expected capital investment of approximately $90 million. The project will construct an underground winze and associated infrastructure which will result in reduced reliance on truck haulage and is expected to increase production by approximately 20% and reduce operating costs by approximately 10%. Completion of the project is expected by the first quarter of 2019.
During 2016, the contractor team was mobilized and development for the project is advancing. At the end of 2016 approximately 90% of the detailed engineering had been completed.
Project expenditures will be included as expansionary capital in expenditures on mining interests in Musselwhite.
Red Lake: HG Young Project
The 100%-owned HG Young project is an exploration discovery in close proximity to the Company's 100%-owned Red Lake mine.
During 2016, exploration drilling continued with a focus on expanding the current resource and upgrading the structural understanding of the mineralized system. During the first quarter of 2017, the geological interpretation and block models will be updated and used to update the HG Young concept study. Assuming a positive business case in the concept study, the Company expects to commence a pre-feasibility study, which currently anticipates a decline from surface providing access to higher confidence areas for further exploration and bulk sampling.
Project expenditures are currently being expensed as exploration in Red Lake.
Red Lake: Cochenour Project
The 100%-owned Cochenour project combines the existing workings of the historic Cochenour mine with the Bruce Channel gold discovery in the Red Lake camp. Cochenour is expected to provide an additional source of ore feed for the Red Lake Mine.
During 2016, exploration drilling continued with a focus on improving the confidence in the resource and structural models. A bulk sample from the 3990 and 4060 levels was processed through a sample tower to support grade predictability and then processed through the Red Lake Mill where reconciliation was favourable. The concept study will be completed during the first quarter of 2017 following which a pre-feasibility study is expected to commence. To date the concept study has shown positive economics for a starter mine.
The Company is undertaking the necessary work at Cochenour with the intention of converting a portion of the 0.29 million ounces (0.6 million tonnes at 15.03 grams per tonne) of measured and indicated resources into a mineral reserve and expects that the estimate will be included as part of the Company's June 30, 2017 reserve and resource update. The development access and further geological understanding obtained from a starter mine would be evaluated to support additional development and mining.
Project expenditures have been included as expansionary capital in expenditures on mining interests in Red Lake.
Third Quarter Report – 2016
(in United States dollars, tabular amounts in millions, except where noted)
Porcupine: Century Project
The 100%-owned Century Project is a potential large-scale open pit mine and related processing facility at the Dome mine. The current mineral resource estimate in the Dome open pit is 4.5 million ounces (130.6 million tonnes at 1.07 grams per tonne) of measured and indicated resources and 0.9 million ounces (35 million tonnes at 0.81 grams per tonne) of inferred resources, with potential to further extend open pit mining well below the existing Dome open pit.
A concept study is underway to examine engineering, waste rock management and economics and to evaluate development of an expanded open pit mine and related processing facility. The Company expects the concept study to be completed in the first quarter of 2017 and expects to commence a pre-feasibility study immediately thereafter. In addition to the current mineral resource estimate at the Dome pit, the pre-feasibility study will incorporate a review of additional potential mill feed, including the Pamour Open Pit, which has a current reserve estimate of 1.1 million ounces (31.9 million tonnes at 1.02 grams per tonne) and measured and indicated resource estimate of 0.7 million ounces (21.7 million tonnes at 1.01 grams per tonne), and the Pamour West Open Pit, which has a current measured and indicated resource estimate of 0.8 million ounces (24.5 million tonnes at 1.00 grams per tonne). The Company is undertaking the necessary work at the Dome open pit with the intention of converting a portion of the measured and indicated mineral resources into an initial mineral reserve and expects that the estimate will be included as part of the Company's June 30, 2017 reserve and resource update.
Porcupine: Borden Project
The 100%-owned Borden Project is located near Chapleau in Ontario, approximately 160 kilometres west of the Company's Porcupine mine, and comprises 786 square kilometres of claims.
All material required permits, including the Advance Exploration permit, have been received to allow for the construction of a ramp into the deposit and the extraction of a 30,000 tonne bulk sample. The ramp design for the purpose of the bulk sample is expected to be sufficient for ultimate mining purposes. The underground platforms developed from the ramp access will further support exploration drilling of a deposit that remains open at depth and laterally. A final feasibility study is expected to occur by the end of the first quarter of 2019 after the completion of a bulk sample. With the expected ramp completion and minimal additional infrastructure required for full scale mining, the Company expects to reach commercial production six months following bulk sample extraction.
Project expenditures have been included as expansionary capital in expenditures on mining interests in Porcupine.
NuevaUnión Project (formerly "Project Corridor")
The 50%-owned NuevaUnión Project comprises the El Morro gold/copper deposit and the Relincho copper/molybdenum deposit and is one of the largest undeveloped copper-gold-molybdenum projects in the Americas.
A preliminary economic assessment ("PEA") was completed during the third quarter of 2015. The PEA contemplates ore from the La Fortuna deposit being conveyed to a concentrator at the Relincho deposit, resulting in a mine life of approximately 32 years, a reduced environmental footprint, and sustainable benefits to the community (through local employment and business opportunities, and robust community investment), lower operating costs, and improved capital efficiency. NuevaUnión has commenced engagement with indigenous communities and other stakeholders to help guide the project's development. The project commenced a pre-feasibility study in October 2016 which is expected to be completed in the fourth quarter of 2017 following which a feasibility study is expected to commence. The Environmental Impact Assessment baseline and the consulting process with communities continues to progress.
Coffee Project
The 100%-owned Coffee project is a structurally hosted hydrothermal deposit located approximately 130 kilometres south of the City of Dawson,Yukon. The Coffee land package, comprising over 60,000 hectares, demonstrates potential for near-mine discoveries, with mineralization remaining open along strike and at depth and the potential for the discovery of a major new mineral system.
Since the acquisition of Coffee on July 19, 2016, First Nation and community consultation activities progressed along with the review and optimization of the feasibility study and planning for upgrades to site infrastructure. In addition, the Environmental Socioeconomic Assessment application was being prepared and is expected to be submitted in the first quarter of 2017. The Company expects permitting and construction to take about four years with commercial production targeted for the first quarter of 2021.
RESERVES AND RESOURCES
Goldcorp has updated their Mineral Reserves and Resource Estimates based on receipt of updated estimates from Pueblo Viejo (Barrick Gold Corporation), Alumbrera (Glencore plc) and Relincho and San Nicholas (Teck Resources Limited).
Third Quarter Report – 2016
(in United States dollars, tabular amounts in millions, except where noted)
NON-GAAP FINANCIAL PERFORMANCE MEASURES
The Company has included certain non-GAAP performance measures throughout this document. These performance measures are employed by the Company to measure its operating and economic performance internally and to assist in business decision-making as well as providing key performance information to senior management. The Company believes that, in addition to conventional measures prepared in accordance with GAAP, certain investors and other stakeholders also use this information to evaluate the Company’s operating and economic performance; however, these non-GAAP performance measures do not have any standardized meaning. Accordingly, these performance measures are intended to provide additional information and should not be considered in isolation or as a substitute for measures of performance prepared in accordance with GAAP. The Company’s primary business is gold production and its future development and current operations focus are on maximizing returns from gold production, with other metal production being incidental to the gold production process. As a result, the Company's non-GAAP performance measures are disclosed on a per gold ounce basis.
The Company calculates its non-GAAP performance measures on an attributable basis. Attributable performance measures include the Company’s mining operations and projects, and the Company’s share of Alumbrera, Pueblo Viejo, and NuevaUnión (formerly referred to as Project Corridor) subsequent to the formation of the joint venture on November 24, 2015. The inclusion of NuevaUnión in the Company's non-GAAP performance measures only impacts the Company's adjusted operating cash flow metric at this time as it is a development stage project. The Company believes that disclosing certain performance measures on an attributable basis provides useful information about the Company’s operating and economic performance, and reflects the Company’s view of its core mining operations.
Non-GAAP Measure - Total Cash Costs: by-product
Total cash costs: by-product incorporate Goldcorp’s share of all production costs, including adjustments to inventory carrying values, adjusted for changes in estimates in reclamation and closure costs at the Company’s closed mines which are non-cash in nature, and include Goldcorp’s share of by-product silver, lead, zinc and copper credits, and treatment and refining charges included within revenue. Additionally, cash costs are adjusted for realized gains and losses arising on the Company’s commodity and foreign currency contracts which the Company enters into to mitigate its exposure to fluctuations in by-product metal prices, heating oil prices and foreign exchange rates, which may impact the Company’s operating costs.
In addition to conventional measures, the Company assesses this per ounce measure in a manner that isolates the impacts of gold production volumes, the by-product credits, and operating costs fluctuations such that the non-controllable and controllable variability is independently addressed. The Company uses total cash costs: by product per gold ounce to monitor its operating performance internally, including operating cash costs, as well as in its assessment of potential development projects and acquisition targets. The Company believes this measure provides investors and analysts with useful information about the Company’s underlying cash costs of operations and the impact of by-product credits on the Company’s cost structure and is a relevant metric used to understand the Company’s operating profitability and ability to generate cash flow. When deriving the production costs associated with an ounce of gold, the Company includes by-product credits as the Company considers that the cost to produce the gold is reduced as a result of the by-product sales incidental to the gold production process, thereby allowing the Company’s management and other stakeholders to assess the net costs of gold production.
The Company reports total cash costs: by-product on a gold ounces sold basis. In the gold mining industry, this is a common performance measure but does not have any standardized meaning. The Company follows the recommendations of the Gold Institute Production Cost Standard. The Gold Institute, which ceased operations in 2002, was a non-regulatory body and represented a global group of producers of gold and gold products. The production cost standard developed by the Gold Institute remains the generally accepted standard of reporting cash costs of production by gold mining companies.
The Company also reports total cash costs: co-product as a secondary metric to provide further information to the Company's stakeholders. Total cash costs: co-product, per gold ounce, are calculated by allocating Goldcorp‘s share of production costs to each co-product based on the ratio of actual sales volumes multiplied by budget metal prices, as compared to realized sales prices. The Company uses budget prices to eliminate price volatility and improve co-product cash cost reporting comparability between periods. The budget metal prices used in the calculation of total cash costs: co-product were as follows:
|
| | | | | | | | | |
| | 2016 |
| 2015 |
| 2014 |
|
| Gold (per ounce) | $ | 1,100 |
| $ | 1,200 |
| $ | 1,200 |
|
| Silver (per ounce) | $ | 15 |
| $ | 18 |
| $ | 20 |
|
| Copper (per pound) | $ | 2.53 |
| $ | 3.00 |
| $ | 3.00 |
|
| Lead (per pound) | $ | 0.80 |
| $ | 0.95 |
| $ | 1.00 |
|
| Zinc (per pound) | $ | 0.80 |
| $ | 1.00 |
| $ | 0.90 |
|
Third Quarter Report – 2016
(in United States dollars, tabular amounts in millions, except where noted)
The following tables provide a reconciliation of total cash costs: by-product per ounce to the consolidated financial statements:
Year ended December 31, 2016:
|
| | | | | | | | | | | | | | | | | | | | |
| | Production Costs (1) | By-Product Credits | Non-cash Reclamation and Closure Cost Obligations
| Treatment and Refining Charges on Concentrate Sales | Total Cash Costs: by-product | Ounces (thousands) | Total Cash Costs: by-product per ounce (2), (3) |
| Peñasquito | $ | 698 |
| $ | (604 | ) | $ | — |
| $ | 123 |
| $ | 217 |
| 449 |
| $ | 483 |
|
| Cerro Negro | 249 |
| (56 | ) | — |
| — |
| 193 |
| 382 |
| 505 |
|
| Red Lake | 179 |
| (1 | ) | 2 |
| 2 |
| 182 |
| 313 |
| 582 |
|
| Éléonore | 243 |
| — |
| — |
| — |
| 243 |
| 278 |
| 875 |
|
| Porcupine | 151 |
| — |
| 38 |
| — |
| 189 |
| 275 |
| 688 |
|
| Musselwhite | 140 |
| — |
| — |
| — |
| 140 |
| 260 |
| 538 |
|
| Other mines | 414 |
| (98 | ) | (44 | ) | — |
| 272 |
| 351 |
| 771 |
|
| Corporate | (8 | ) | — |
| 8 |
| — |
| — |
| — |
| — |
|
| Total before associates | $ | 2,066 |
| $ | (759 | ) | $ | 4 |
| $ | 125 |
| $ | 1,436 |
| 2,308 |
| $ | 622 |
|
| Pueblo Viejo | 185 |
| (25 | ) | — |
| — |
| 160 |
| 467 |
| 343 |
|
| Other associate | 185 |
| (159 | ) | — |
| 21 |
| 47 |
| 94 |
| 509 |
|
| TOTAL | $ | 2,436 |
| $ | (943 | ) | $ | 4 |
| $ | 146 |
| $ | 1,643 |
| 2,869 |
| $ | 573 |
|
Year ended December 31, 2015:
|
| | | | | | | | | | | | | | | | | | | | | | | |
| | Production Costs (1) | By-Product Credits | Non-cash Reclamation and Closure Cost Obligations | Treatment and Refining Charges on Concentrate Sales | Net Hedging Gain/Loss | Total Cash Costs: by-product | Ounces (thousands) | Total Cash Costs: by-product per ounce (2), (3) |
| Peñasquito | $ | 890 |
| $ | (812 | ) | $ | — |
| $ | 187 |
| $ | 21 |
| $ | 286 |
| 893 |
| $ | 320 |
|
| Cerro Negro | 465 |
| (116 | ) | — |
| — |
| — |
| 349 |
| 580 |
| 600 |
|
| Red Lake | 196 |
| — |
| — |
| — |
| 13 |
| 209 |
| 366 |
| 572 |
|
| Éléonore | 200 |
| — |
| — |
| — |
| 10 |
| 210 |
| 231 |
| 911 |
|
| Porcupine | 141 |
| — |
| 57 |
| — |
| 14 |
| 212 |
| 273 |
| 776 |
|
| Musselwhite | 150 |
| — |
| — |
| — |
| 11 |
| 161 |
| 269 |
| 599 |
|
| Other mines | 523 |
| (119 | ) | (3 | ) | — |
| 11 |
| 412 |
| 440 |
| 937 |
|
| Corporate | 15 |
| — |
| (15 | ) | — |
| 3 |
| 3 |
| — |
| — |
|
| Total before associates and discontinued operations | $ | 2,580 |
| $ | (1,047 | ) | $ | 39 |
| $ | 187 |
| $ | 83 |
| $ | 1,842 |
| 3,052 |
| $ | 604 |
|
| Pueblo Viejo | 242 |
| (19 | ) | — |
| — |
| — |
| 223 |
| 450 |
| 495 |
|
| Other associate | 197 |
| (122 | ) | — |
| 17 |
| — |
| 92 |
| 73 |
| 1,264 |
|
| Discontinued Operations | 15 |
| — |
| | — |
| — |
| 15 |
| 16 |
| 941 |
|
| TOTAL | $ | 3,034 |
| $ | (1,188 | ) | $ | 39 |
| $ | 204 |
| $ | 83 |
| $ | 2,172 |
| 3,591 |
| $ | 605 |
|
Third Quarter Report – 2016
(in United States dollars, tabular amounts in millions, except where noted)
Three months ended December 31, 2016:
|
| | | | | | | | | | | | | | | | | | | | |
| | Production Costs (1) | By-Product Credits | Non-cash Reclamation and Closure Cost Obligations | Treatment and Refining Charges on Concentrate Sales | Total Cash Costs: by-product | Ounces (thousands) | Total Cash Costs: by-product per ounce (2), (3) |
| Peñasquito | $ | 182 |
| $ | (180 | ) | $ | — |
| $ | 36 |
| $ | 38 |
| 185 |
| $ | 205 |
|
| Cerro Negro | 64 |
| (9 | ) | — |
| — |
| 55 |
| 70 |
| 778 |
|
| Red Lake | 43 |
| (1 | ) | 2 |
| 2 |
| 46 |
| 76 |
| 608 |
|
| Éléonore | 66 |
| — |
| — |
| — |
| 66 |
| 69 |
| 965 |
|
| Porcupine | 8 |
| — |
| 38 |
| — |
| 46 |
| 63 |
| 733 |
|
| Musselwhite | 38 |
| — |
| — |
| — |
| 38 |
| 74 |
| 511 |
|
| Other mines | 123 |
| (25 | ) | (44 | ) | — |
| 54 |
| 72 |
| 729 |
|
| Corporate | (8 | ) | — |
| 8 |
| — |
| — |
| — |
| — |
|
| Total before associates | $ | 516 |
| $ | (215 | ) | $ | 4 |
| $ | 38 |
| $ | 343 |
| 609 |
| $ | 561 |
|
| Pueblo Viejo | 35 |
| (8 | ) | — |
| — |
| 27 |
| 132 |
| 202 |
|
| Other associate | 51 |
| (58 | ) | — |
| 7 |
| — |
| 27 |
| 56 |
|
| TOTAL | $ | 602 |
| $ | (281 | ) | $ | 4 |
| $ | 45 |
| $ | 370 |
| 768 |
| $ | 481 |
|
Three months ended December 31, 2015:
|
| | | | | | | | | | | | | | | | | | | | | | | |
| | Production Costs (1) | By-Product Credits | Non-cash Reclamation and Closure Cost Obligations | Treatment and Refining Charges on Concentrate Sales | Net Hedging Gain/Loss | Total Cash Costs: by-product | Ounces (thousands) | Total Cash Costs: by-product per ounce (2), (3) |
| Peñasquito | $ | 221 |
| $ | (186 | ) | $ | — |
| $ | 46 |
| $ | 8 |
| $ | 89 |
| 195 |
| $ | 451 |
|
| Cerro Negro | 97 |
| (20 | ) | — |
| — |
| — |
| 77 |
| 132 |
| 577 |
|
| Red Lake | 51 |
| — |
| — |
| — |
| 4 |
| 55 |
| 92 |
| 610 |
|
| Éléonore | 64 |
| — |
| — |
| — |
| 5 |
| 69 |
| 103 |
| 677 |
|
| Porcupine | (4 | ) | — |
| 57 |
| — |
| 4 |
| 57 |
| 74 |
| 769 |
|
| Musselwhite | 40 |
| — |
| — |
| — |
| 3 |
| 43 |
| 83 |
| 527 |
|
| Other mines | 199 |
| (33 | ) | (3 | ) | — |
| 4 |
| 167 |
| 121 |
| 1,379 |
|
| Corporate | (6 | ) | — |
| 6 |
| — |
| 1 |
| 1 |
| — |
| — |
|
| Total before associates and discontinued operations | $ | 662 |
| $ | (239 | ) | $ | 60 |
| $ | 46 |
| $ | 29 |
| $ | 558 |
| 800 |
| $ | 698 |
|
| Pueblo Viejo | 52 |
| (5 | ) | — |
| — |
| — |
| 47 |
| 93 |
| 502 |
|
| Other associate | 56 |
| (36 | ) | — |
| 6 |
| — |
| 26 |
| 25 |
| 1,028 |
|
| TOTAL | $ | 770 |
| $ | (280 | ) | $ | 60 |
| $ | 52 |
| $ | 29 |
| $ | 631 |
| 918 |
| $ | 687 |
|
| |
| (1) | $20 million and $69 million in royalties are included in production costs for the three months and year ended December 31, 2016, respectively (three months and year ended December 31, 2015– $23 million and $93 million, respectively). |
| |
| (2) | Total cash costs: by-product per ounce may not calculate based on amounts presented in these tables due to rounding. |
| |
| (3) | If silver, lead, zinc and copper for Peñasquito, silver for Marlin, silver and copper for Pueblo Viejo, and copper for Alumbrera were treated as co-products, Goldcorp's share of total cash costs: co-product from continuing operations for the three months and year ended December 31, 2016, would be $619 and $649 per ounce of gold, $8.73 and $10.17 per ounce of silver, $1.81 and $1.960 per pound of copper, $0.67 and $0.79 per pound of zinc, and $0.69 and $0.87 per pound of lead, respectively (three months and year ended December 31, 2015 – $739 and $684 per ounce of gold. $8.85 and $8.67 per ounce of silver, $2.31 and $2.66 per pound of copper, $0.72 and $0.69 per pound of zinc, and $0.76 and $0.68 per pound of lead, respectively). |
Third Quarter Report – 2016
(in United States dollars, tabular amounts in millions, except where noted)
NON-GAAP MEASURE – AISC
AISC include total production cash costs incurred at the Company’s mining operations, which forms the basis of the Company’s by-product cash costs. Additionally, the Company includes sustaining capital expenditures, corporate administrative expense, exploration and evaluation costs, and reclamation cost accretion and amortization. The measure seeks to reflect the full cost of gold production from current operations, therefore expansionary capital is excluded. Certain other cash expenditures, including tax payments, dividends and financing costs are also excluded.
The Company believes that this measure represents the total costs of producing gold from current operations, and provides the Company and other stakeholders of the Company with additional information of the Company’s operational performance and ability to generate cash flows. AISC, as a key performance measure, allows the Company to assess its ability to support capital expenditures and to sustain future production from the generation of operating cash flows. This information provides management with the ability to more actively manage capital programs and to make more prudent capital investment decisions.
The Company reports AISC on a gold ounces sold basis. This performance measure was adopted as a result of an initiative undertaken within the gold mining industry; however, this performance measure has no standardized meaning and should not be considered in isolation or as a substitute for measures of performance prepared in accordance with GAAP. The Company follows the guidance note released by the World Gold Council, which became effective January 1, 2014. The World Gold Council is a non-regulatory market development organization for the gold industry whose members comprise global senior gold mining companies.
The following tables provide a reconciliation of AISC per ounce to the consolidated financial statements:
Year ended December 31, 2016:
|
| | | | | | | | | | | | | | | | | | | | | | | |
| | Total cash costs: by-product | Corporate Administration | Exploration and evaluation costs | Reclamation cost accretion and amortization | Sustaining capital expenditures | Total AISC | Ounces (thousands) | Total AISC per ounce (1) |
| Peñasquito | $ | 217 |
| $ | — |
| $ | 2 |
| $ | 6 |
| $ | 195 |
| $ | 420 |
| 449 |
| $ | 937 |
|
| Cerro Negro | 193 |
| — |
| 1 |
| 7 |
| 68 |
| 269 |
| 382 |
| 705 |
|
| Red Lake | 182 |
| — |
| 11 |
| 2 |
| 78 |
| 273 |
| 313 |
| 872 |
|
| Éléonore | 243 |
| — |
| — |
| 2 |
| 28 |
| 273 |
| 278 |
| 981 |
|
| Porcupine | 189 |
| — |
| 2 |
| 9 |
| 46 |
| 246 |
| 275 |
| 898 |
|
| Musselwhite | 140 |
| — |
| 5 |
| 3 |
| 29 |
| 177 |
| 260 |
| 678 |
|
| Other mines | 272 |
| — |
| 9 |
| 16 |
| 26 |
| 323 |
| 351 |
| 914 |
|
| Corporate | — |
| 187 |
| 2 |
| — |
| 26 |
| 215 |
| — |
| 75 |
|
| Total before associates | $ | 1,436 |
| $ | 187 |
| $ | 32 |
| $ | 45 |
| $ | 496 |
| $ | 2,196 |
| 2,308 |
| $ | 951 |
|
| Pueblo Viejo | 160 |
| — |
| — |
| 4 |
| 40 |
| 204 |
| 467 |
| 439 |
|
| Other associate | 47 |
| — |
| — |
| 8 |
| 1 |
| 56 |
| 94 |
| 603 |
|
| TOTAL | $ | 1,643 |
| $ | 187 |
| $ | 32 |
| $ | 57 |
| $ | 537 |
| $ | 2,456 |
| 2,869 |
| $ | 856 |
|
Third Quarter Report – 2016
(in United States dollars, tabular amounts in millions, except where noted)
Year ended December 31, 2015:
|
| | | | | | | | | | | | | | | | | | | | | | | |
| | Total cash costs: by-product | Corporate Administration | Exploration and evaluation costs | Reclamation cost accretion and amortization | Sustaining capital expenditures | Total AISC | Ounces (thousands) | Total AISC per ounce (1) |
| Peñasquito | $ | 286 |
| $ | — |
| $ | 3 |
| $ | 10 |
| $ | 186 |
| $ | 485 |
| 893 |
| $ | 544 |
|
| Cerro Negro | 349 |
| — |
| 1 |
| 3 |
| 95 |
| 448 |
| 580 |
| 769 |
|
| Red Lake | 209 |
| — |
| 27 |
| 3 |
| 93 |
| 332 |
| 366 |
| 906 |
|
| Éléonore | 210 |
| — |
| — |
| 1 |
| 21 |
| 232 |
| 231 |
| 1,007 |
|
| Porcupine | 212 |
| — |
| 1 |
| 14 |
| 67 |
| 294 |
| 273 |
| 1,078 |
|
| Musselwhite | 161 |
| — |
| 6 |
| 1 |
| 38 |
| 206 |
| 269 |
| 766 |
|
| Other mines | 412 |
| — |
| 8 |
| 19 |
| 110 |
| 549 |
| 440 |
| 1,249 |
|
| Corporate | 3 |
| 207 |
| 5 |
| — |
| 35 |
| 250 |
| — |
| 70 |
|
| Total before associates and discontinued operations | $ | 1,842 |
| $ | 207 |
| $ | 51 |
| $ | 51 |
| $ | 645 |
| $ | 2,796 |
| 3,052 |
| $ | 916 |
|
| Pueblo Viejo | 223 |
| — |
| — |
| 10 |
| 41 |
| 274 |
| 450 |
| 607 |
|
| Other associate | 92 |
| — |
| — |
| 11 |
| 18 |
| 121 |
| 73 |
| 1,670 |
|
| Discontinued Operations | 15 |
| 1 |
| — |
| — |
| 1 |
| 17 |
| 16 |
| 996 |
|
| TOTAL | $ | 2,172 |
| $ | 208 |
| $ | 51 |
| $ | 72 |
| $ | 705 |
| $ | 3,208 |
| 3,591 |
| $ | 894 |
|
Three months ended December 31, 2016:
|
| | | | | | | | | | | | | | | | | | | | | | | |
| | Total cash costs: by-product | Corporate Administration | Exploration and evaluation costs | Reclamation cost accretion and amortization | Sustaining capital expenditures | Total AISC | Ounces (thousands) | Total AISC per ounce (1) |
| Peñasquito | $ | 38 |
| $ | — |
| $ | — |
| $ | 2 |
| $ | 49 |
| $ | 89 |
| 185 |
| $ | 487 |
|
| Cerro Negro | 55 |
| — |
| 1 |
| 1 |
| 15 |
| 72 |
| 70 |
| 1,024 |
|
| Red Lake | 46 |
| — |
| 2 |
| — |
| 22 |
| 70 |
| 76 |
| 932 |
|
| Éléonore | 66 |
| — |
| — |
| 1 |
| 8 |
| 75 |
| 69 |
| 1,075 |
|
| Porcupine | 46 |
| — |
| — |
| — |
| 15 |
| 61 |
| 63 |
| 985 |
|
| Musselwhite | 38 |
| — |
| 1 |
| 1 |
| 12 |
| 52 |
| 74 |
| 696 |
|
| Other mines | 54 |
| — |
| 3 |
| 4 |
| 5 |
| 66 |
| 72 |
| 880 |
|
| Corporate | — |
| 38 |
| 1 |
| — |
| 6 |
| 45 |
| — |
| 59 |
|
| Total before associates | $ | 343 |
| $ | 38 |
| $ | 8 |
| $ | 9 |
| $ | 132 |
| $ | 530 |
| 609 |
| 869 |
|
| Pueblo Viejo | 27 |
| — |
| — |
| 1 |
| 12 |
| 40 |
| 132 |
| 311 |
|
| Other associate | — |
| — |
| — |
| 2 |
| 1 |
| 3 |
| 27 |
| 140 |
|
| TOTAL | $ | 370 |
| $ | 38 |
| $ | 8 |
| $ | 12 |
| $ | 145 |
| $ | 573 |
| 768 |
| 747 |
|
Third Quarter Report – 2016
(in United States dollars, tabular amounts in millions, except where noted)
Three months ended December 31, 2015:
|
| | | | | | | | | | | | | | | | | | | | | | | |
| | Total cash costs: by-product | Corporate Administration | Exploration and evaluation costs | Reclamation cost accretion and amortization | Sustaining capital expenditures | Total AISC | Ounces (thousands) | Total AISC per ounce (1) |
| Peñasquito | $ | 89 |
| $ | — |
| $ | 2 |
| $ | 2 |
| $ | 41 |
| $ | 134 |
| 195 |
| $ | 687 |
|
| Cerro Negro | 77 |
| — |
| 1 |
| — |
| 39 |
| 117 |
| 132 |
| 872 |
|
| Red Lake | 55 |
| — |
| 6 |
| 1 |
| 25 |
| 87 |
| 92 |
| 959 |
|
| Éléonore | 69 |
| — |
| — |
| — |
| 8 |
| 77 |
| 103 |
| 761 |
|
| Porcupine | 57 |
| — |
| — |
| 4 |
| 15 |
| 76 |
| 74 |
| 1,031 |
|
| Musselwhite | 43 |
| — |
| 1 |
| — |
| 13 |
| 57 |
| 83 |
| 699 |
|
| Other mines | 167 |
| — |
| 2 |
| 4 |
| 26 |
| 199 |
| 121 |
| 1,642 |
|
| Corporate | 1 |
| 48 |
| — |
| — |
| 10 |
| 59 |
| — |
| 64 |
|
| Total before associates and discontinued operations | $ | 558 |
| $ | 48 |
| $ | 12 |
| $ | 11 |
| $ | 177 |
| $ | 806 |
| 800 |
| $ | 1,009 |
|
| Pueblo Viejo | 47 |
| — |
| — |
| 3 |
| 7 |
| 57 |
| 93 |
| 608 |
|
| Other associate | 26 |
| — |
| — |
| 2 |
| 4 |
| 32 |
| 25 |
| 1,274 |
|
| Discontinued Operations | — |
| — |
| — |
| — |
| — |
| — |
| — |
| — |
|
| TOTAL | $ | 631 |
| $ | 48 |
| $ | 12 |
| $ | 16 |
| $ | 188 |
| $ | 895 |
| 918 |
| $ | 977 |
|
| |
| (1) | AISC may not calculate based on amounts presented in these tables due to rounding. |
Sustaining capital expenditures are defined as those expenditures which do not increase annual gold ounce production at a mine site and excludes all expenditures at the Company’s projects and certain expenditures at the Company’s operating sites which are deemed expansionary in nature. This definition includes, but is not limited to, capitalized stripping costs at open pit mines and underground mine development. The following table reconciles sustaining capital expenditures to the Company’s total capital expenditures for continuing operations:
|
| | | | | | | | | | | | |
| | Three months ended December 31 | Year ended December 31 |
| | 2016 |
| 2015 |
| 2016 |
| 2015 |
|
| Expenditures on mining interests per consolidated financial statements | $ | 203 |
| $ | 240 |
| $ | 696 |
| $ | 1,178 |
|
| Payment of finance lease obligations per consolidated financial statements | 1 |
| 2 |
| 5 |
| 2 |
|
Expenditures on mining interests by Alumbrera, Pueblo Viejo and NuevaUnión (formerly Project Corridor) (1) | 13 |
| 9 |
| 43 |
| 58 |
|
| Goldcorp’s share of expenditures on mining interests and deposits | $ | 217 |
| $ | 251 |
| $ | 744 |
| $ | 1,238 |
|
| Sustaining capital expenditures | $ | 145 |
| $ | 188 |
| $ | 537 |
| $ | 705 |
|
| Expansionary capital expenditures | 72 |
| 63 |
| 207 |
| 533 |
|
| | $ | 217 |
| $ | 251 |
| $ | 744 |
| $ | 1,238 |
|
| |
| (1) | Expenditures on mining interests by Alumbrera, Pueblo Viejo and NuevaUnión (formerly Project Corridor) represent mining interest expenditures, net of additional funding investments, which are included in expenditures on mining interests per the consolidated financial statements. |
Third Quarter Report – 2016
(in United States dollars, tabular amounts in millions, except where noted)
Non-GAAP Measure - Adjusted Operating Cash Flows
Adjusted operating cash flows comprises Goldcorp’s share of operating cash flows, calculated on an attributable basis to include the Company's share of Alumbrera, Pueblo Viejo and NuevaUnión's operating cash flows. The Company believes that, in addition to conventional measures prepared in accordance with GAAP, the Company and certain investors use this information to evaluate the Company’s performance and ability to operate without reliance on additional external funding or use of available cash.
In prior years, adjusted operating cash flows was presented on an attributable basis before working capital changes to provide a consistent measure of the Company’s performance of its core business operations as the Company, at times, can experience changes in working capital from one period to another. In the current year, the Company revised its presentation of adjusted operating cash flows to use operating cash flows as shown on the Company’s statement of cash flows and adjusts it to include operating cash flows of the Company’s associates. The Company believes this measure provides a better measure of cash available to the Company for financing and investing purposes.
The following table provide a reconciliation of net cash provided by operating activities in the consolidated financial statements to Goldcorp’s share of adjusted operating cash flows:
|
| | | | | | | | | | | | |
| | Three months ended December 31 | Year ended December 31 |
| | 2016 |
| 2015 |
| 2016 |
| 2015 |
|
| Net cash provided by operating activities of continuing operations | $ | 239 |
| $ | 401 |
| $ | 799 |
| $ | 1,423 |
|
| Adjusted operating cash flows provided by Alumbrera, Pueblo Viejo and NuevaUnión | 144 |
| 103 |
| 321 |
| 221 |
|
| Goldcorp’s share of adjusted operating cash flows | $ | 383 |
| $ | 504 |
| $ | 1,120 |
| $ | 1,644 |
|
| Including discontinued operations | | | | |
| Adjusted operating cash flows – Wharf | — |
| — |
| — |
| 7 |
|
| Goldcorp’s share of adjusted operating cash flows including discontinued operations | $ | 383 |
| $ | 504 |
| $ | 1,120 |
| $ | 1,651 |
|
FINANCIAL INSTRUMENTS RISK EXPOSURE
The Company manages its exposure to financial risks, including credit risk, liquidity risk, currency risk, interest rate risk and price risk, in accordance with its Financial Risk Management Policy. The Company’s Board of Directors oversees management’s risk management practices by setting trading parameters and reporting requirements. The Financial Risk Management Policy provides a framework for the Company to manage the risks it is exposed to in various markets and to protect itself against adverse price movements. All transactions undertaken are to support the Company’s ongoing business. The Company does not acquire or issue derivative financial instruments for trading or speculative purposes.
The following describes the types of risks that the Company is exposed to, and its objectives and policies for managing those risk exposures:
Credit risk is the risk that the counterparty to a financial instrument will cause a financial loss for the Company by failing to discharge its obligations. Credit risk is primarily associated with trade receivables; however, it also arises on cash and cash equivalents, short term investments, derivative assets, other receivables and accrued interest receivable. To mitigate exposure to credit risk on financial assets, the Company has established policies to limit the concentration of credit risk, to ensure counterparties demonstrate minimum acceptable credit worthiness and to ensure liquidity of available funds.
The Company closely monitors its financial assets and does not have any significant concentration of credit risk. The Company sells its products exclusively to large international financial institutions and other organizations with strong credit ratings. The historical level of customer defaults is negligible and, as a result, the credit risk associated with trade receivables at December 31, 2016 is considered to be negligible. The Company invests its cash and cash equivalents and short term investments in highly-rated corporations and government issuances in accordance with its Short-term Investment Policy and the credit risk associated with its investments is considered to be low. Foreign currency contracts are entered into with large international financial institutions with strong credit ratings.
Third Quarter Report – 2016
(in United States dollars, tabular amounts in millions, except where noted)
The Company’s maximum exposure to credit risk is as follows:
|
| | | | | | |
| At December 31
2016 |
| At December 31
2015 |
|
| Cash and cash equivalents | $ | 157 |
| $ | 326 |
|
| Short term investments | 43 |
| 57 |
|
| Accounts receivable arising from sales of metal concentrates | 77 |
| 49 |
|
| Other current and non-current receivables | 8 |
| 12 |
|
| Current and non-current derivative asset | 7 |
| 1 |
|
| Accrued interest receivable | 31 |
| 75 |
|
| | $ | 323 |
| $ | 520 |
|
Liquidity risk is the risk that the Company will encounter difficulty in meeting obligations associated with financial liabilities. The Company has in place a rigorous planning, budgeting and forecasting process to help determine the funds required to support the Company’s normal operating requirements on an ongoing basis, its expansionary plans and its dividend distributions. The Company ensures that sufficient committed loan facilities exist to meet its short-term business requirements, taking into account its anticipated cash flows from operations and its holdings of cash and cash equivalents.
During the year ended December 31, 2016, the Company generated operating cash flows from continuing operations, one of the Company's main sources of liquidity, of $799 million (2015 – $1,423 million). At December 31, 2016, Goldcorp held cash and cash equivalents of $157 million (December 31, 2015 – $326 million), short term investments of $43 million (December 31, 2015 – $57 million), and had working capital of $791 million (December 31, 2015 – $282 million), $430 million of which was comprised of the Company's net assets held for sale (December 31, 2015 – $nil), which the Company defines as current assets less current liabilities.
On June 22, 2016, the Company extended the term of its $3.0 billion revolving credit facility to June 22, 2021. During the year ended December 31, 2016, the Company utilized its revolving credit facility and up to $400 million was drawn against the facility in 2016 (2015 – up to $1.3 billion). At December 31, 2016, the balance outstanding on the revolving credit facility was $30 million (December 31, 2015 – $nil) with $2.97 billion available for the Company's use (December 31, 2015 – $3.0 billion). Certain of the Company's borrowings are subject to various financial and general covenants with which the Company was in compliance as at December 31, 2016.
At December 31, 2016, the Company had letters of credit outstanding in the amount of $423 million (December 31, 2015 – $580 million) of which $303 million (December 31, 2015 – $275 million) represented guarantees for reclamation obligations and $nil (December 31, 2015 – $211 million) represented guarantees for certain of the Company's Argentine debt. The Company's capital commitments for the next twelve months amounted to $64 million at December 31, 2016.
Currency risk
Currency risk is the risk that the fair values or future cash flows of the Company’s financial instruments will fluctuate because of changes in foreign exchange rates. Exchange rate fluctuations may affect the costs that the Company incurs in its operations. Gold, silver, copper, lead and zinc are sold in US dollars and the Company’s costs are incurred principally in US dollars, Canadian dollars, Mexican pesos, Argentinean pesos, Dominican Republic pesos and Guatemalan quetzals. The appreciation or depreciation of non-US dollar currencies against the US dollar can increase or decrease, respectively, the cost of metal production and capital expenditures in US dollar terms. The Company also holds cash and cash equivalents that are denominated in non-US dollar currencies which are subject to currency risk. Accounts receivable and other current and non-current assets denominated in non-US dollar currencies relate to goods and services taxes, income taxes, value-added taxes and insurance receivables. The Company is further exposed to currency risk through non-monetary assets and liabilities of entities whose taxable profit or tax loss are denominated in non-US dollar currencies. Changes in exchange rates give rise to temporary differences resulting in a deferred tax liability or asset with the resulting deferred tax charged or credited to income tax expense. At December 31, 2016, the Company had $3.6 billion of deferred income tax liabilities, which arose primarily from the acquisitions of Placer Dome Inc.’s assets and Glamis Gold Ltd. in 2006, and Camino Rojo and Cerro Negro in 2010, and which are denominated in foreign currencies.
During the year ended December 31, 2016, and in accordance with its Financial Risk Management Policy, the Company entered into Mexican peso forward contracts to purchase Mexican pesos at pre-determined US dollar amounts. These contracts were entered into to normalize operating, corporate and capital expenses incurred by the Company’s Peñasquito operations as expressed in US dollar terms.
Third Quarter Report – 2016
(in United States dollars, tabular amounts in millions, except where noted)
The Company hedges a portion of its future forecasted Mexican Pesos denominated operating and capital expenditures to reduce the currency risk exposure to the Mexican peso.
The Company is exposed to currency risk through the following financial assets and liabilities, income and other taxes receivables (payables) and deferred income tax assets and liabilities denominated in foreign currencies:
|
| | | | | | | | | | | | | | | |
| At December 31, 2016 | Cash and cash equivalents | Accounts receivable and other current and non-current assets | Accounts payable and accrued liabilities and non-current liabilities | Income taxes receivable (payable), current and non-current | Deferred income tax liabilities |
| Canadian dollar | $ | — |
| $ | 26 |
| $ | (217 | ) | $ | 4 |
| $ | (708 | ) |
| Mexican peso | 11 |
| 146 |
| (88 | ) | (127 | ) | (2,354 | ) |
| Argentine peso | 1 |
| 200 |
| (41 | ) | (2 | ) | (558 | ) |
| Guatemalan quetzal | 1 |
| 7 |
| (21 | ) | 6 |
| — |
|
| | $ | 13 |
| $ | 379 |
| $ | (367 | ) | $ | (119 | ) | $ | (3,620 | ) |
| At December 31, 2015 | | | | | |
| Canadian dollar | $ | 2 |
| $ | 38 |
| $ | (217 | ) | $ | 71 |
| $ | (803 | ) |
| Mexican peso | 20 |
| 210 |
| (185 | ) | (145 | ) | (2,332 | ) |
| Argentine peso | 7 |
| 200 |
| (97 | ) | (10 | ) | (561 | ) |
| Guatemalan quetzal | 2 |
| 8 |
| (27 | ) | 6 |
| (11 | ) |
| | $ | 31 |
| $ | 456 |
| $ | (526 | ) | $ | (78 | ) | $ | (3,707 | ) |
During the year ended December 31, 2016, the Company recognized a net foreign exchange loss of $68 million (2015 – loss of $52 million), excluding the foreign exchange loss relating to taxes. During the year ended December 31, 2016, the Company recognized a net foreign exchange loss of $162 million in income tax expense on income taxes receivable/(payable) and deferred income taxes (2015 – $572 million). Based on the Company’s net foreign currency exposures at December 31, 2016, depreciation or appreciation of applicable foreign currencies against the US dollar would have resulted in the following decrease or increase in the Company's net earnings:
|
| | | | | | | |
| At December 31, 2016 | Possible exposure (1) | Impact on earnings excluding currency exposure related to taxes | Impact on earnings from foreign exchange exposure related to taxes |
| Canadian dollar | 10% | $ | 16 |
| $ | 90 |
|
| Mexican peso | 15% | 9 |
| 68 |
|
| Argentine peso | 15% | 21 |
| 85 |
|
(1) Calculated based on 2016 historical fluctuation of foreign exchange rate.
(2) There is insignificant currency risk related to Guatemalan quetzal due to the minimal fluctuation of the currency.
Interest rate risk
Interest rate risk is the risk that the fair values and future cash flows of the Company's financial instruments will fluctuate because of changes in market interest rates. The Company is exposed to interest rate cash flow risk primarily on its outstanding debt subject to floating rates of interest, its share of the Pueblo Viejo project financing, its cash and cash equivalents, and interest-bearing receivables. The Company is exposed to interest rate fair value risk primarily on its debt subject to fixed rates of interest. The Company monitors its exposure to interest rates and is comfortable with its exposures given its mix of fixed-and floating-rate debt, with 99% of total debt at December 31, 2016 subject to fixed rates, and the relatively low rate on its US dollar debt which comprised 100% of total debt at December 31, 2016. The weighted-average interest rate paid by the Company during the year ended December 31, 2016 on its US dollar debt subject to floating rates of interest was 2.0% (2015 – 1.4% ). At December 31, 2016, all Argentine debt, which was subject to floating rates of interest, was fully repaid. The average interest rate earned by the Company during the year ended December 31, 2016 on its cash and cash equivalents was 0.14% (2015 – 0.32%). A 10% increase or decrease in the interest earned from financial institutions on deposits held would result in a nominal increase or decrease in the Company’s net earnings. There was no significant change in the Company's exposure to interest rate risk during the year ended December 31, 2016.
Third Quarter Report – 2016
(in United States dollars, tabular amounts in millions, except where noted)
Price risk
Price risk is the risk that the fair value or future cash flows of the Company’s financial instruments will fluctuate because of changes in market prices. There was no significant change to the Company’s exposure to price risk during the year ended December 31, 2016.
The Company has a policy not to hedge gold sales. In accordance with the Company’s Financial Risk Management Policy, the Company may hedge up to 50%, 30%, and 10% of its by-product base metal sales volume over the next twelve months, subsequent thirteen to twenty-four months, and subsequent twenty-five to thirty-six months, respectively, to manage its exposure to fluctuations in base metal prices. As at December 31, 2016, the Company did not have any hedges relating to its by-product base metal sales.
The Company holds certain investments in available-for-sale equity securities which are measured at fair value, being the closing share price of each equity security, at the balance sheet date. The Company is exposed to changes in share prices which would result in gains and losses being recognized in other comprehensive income.
OTHER RISKS AND UNCERTAINTIES
This section describes the principal risk and uncertainties that could have an adverse effect on our business and financial results.
Commodity Prices
The majority of our revenues are derived from the sale of gold and silver, and to a lesser extent, copper, lead and zinc. The price of the Company’s Common Shares, its financial results and exploration, and its development and mining activities in the future may be materially adversely affected by declines in the price of gold, silver, copper, lead and zinc. Gold, silver, copper, lead and zinc prices fluctuate widely and are affected by numerous factors beyond the Company’s control, such as the sale or purchase of metals by various central banks and financial institutions, interest rates, exchange rates, inflation or deflation, fluctuation in the value of the United States dollar and foreign currencies, global and regional supply and demand, and the political and economic conditions of major metals-producing and metals-consuming countries throughout the world. The prices of gold, silver, copper, lead and zinc fluctuate widely, and future price declines could cause continued development of, and commercial production from, our properties to be uneconomic. Depending on the price of gold, silver, copper, lead and zinc, cash flow from mining operations may not be sufficient and the Company could be forced to discontinue production at, may lose its interest in, or may be forced to sell, some of its properties. Future production from the Company’s mining properties is dependent on the price of gold, silver, copper, lead and zinc that are adequate to make these properties economically viable.
Estimates of Future Production
The Company prepares estimates and projections of its future production. Any such information is forward-looking and no assurance can be given that such estimates will be achieved. These estimates are based on existing mine plans and other assumptions which change from time to time, including the availability, accessibility, sufficiency and quality of ore, the Company’s costs of production, its ability to sustain and increase production levels, the sufficiency of its infrastructure, the performance of its workforce and equipment, the ability to maintain and obtain mining interests and permits and the Company’s compliance with existing and future laws and regulations. The Company’s actual production may vary from estimates for a variety of reasons, including: actual ore mined varying from estimates of grade, tonnage, dilution and metallurgical and other characteristics; short-term operating factors relating to the ore reserves, such as the need for sequential development of orebodies and the processing of new or different ore grades; revisions to mine plans; unusual or unexpected orebody formations; risks and hazards associated with mining; natural phenomena, such as inclement weather conditions, water availability, floods, and earthquakes; and unexpected labor shortages, strikes, local community opposition or blockades. Failure to achieve the estimated forecasts could have an adverse impact on the Company’s future cash flows, business, results of operations and financial condition.
Foreign Operations
The majority of the Company’s foreign operations were conducted in Mexico, Argentina, the Dominican Republic, Guatemala and Chile, and as such the Company’s operations are exposed to various levels of political, economic and other risks and uncertainties. These risks and uncertainties vary from country to country and include, but are not limited to, terrorism; hostage taking; military repression; expropriation; extreme fluctuations in currency exchange rates; high rates of inflation; labour unrest; the risks of war or civil unrest; renegotiation or nullification of existing concessions, licenses, permits and contracts; ability of governments to unilaterally alter agreements; government imposed supply laws, including laws establishing, among other things, profit margins, production quotas, maximum and minimum price levels and the ability to confiscate merchandise in certain circumstances; surface land access issues; illegal mining; changes in taxation policies; restrictions on foreign exchange and repatriation; and changing political conditions, currency controls and governmental regulations that favour or require the awarding of contracts to local contractors or require foreign contractors to employ citizens of, or purchase supplies from, a particular jurisdiction.
In addition, adverse changes in mining or investment policies or shifts in political attitude in Mexico, Argentina, the Dominican Republic, Guatemala and Chile may adversely affect the Company’s operations or profitability. Operations may be affected in varying degrees by government regulations with respect to, but not limited to, restrictions on production, price controls, export controls, import restrictions, such as restrictions applicable
Third Quarter Report – 2016
(in United States dollars, tabular amounts in millions, except where noted)
to, among other things, equipment, services and supplies, currency remittance, income taxes, expropriation of property, foreign investment, maintenance of claims, environmental legislation, land use, surface land access, land claims of local people, water use and mine safety.
Failure to comply strictly with applicable laws, regulations and local practices relating to mineral right applications and tenure, environmental requirements, land and water use, could result in loss, reduction or expropriation of entitlements, or the imposition of additional local or foreign parties as joint venture partners with carried or other interests. The occurrence of these various factors and uncertainties related to the economic and political risks of operating in foreign jurisdictions cannot be accurately predicted and could have a material adverse effect on the Company’s operations or profitability.
Government Regulation
The Company’s mining, processing, development and mineral exploration activities are subject to various laws governing prospecting, development, production, taxes, labour standards and occupational health, mine safety, toxic substances, land use, water use, land claims of local people and other matters. No assurance can be given that new rules and regulations will not be enacted or that existing rules and regulations will not be applied in a manner which could limit or curtail production or development. Amendments to current laws and regulations governing operations and activities of mining and milling or more stringent implementation thereof could have a material adverse impact on the operations and financial position of the Company. Changes to laws regarding mining royalties or taxes, or other elements of a country’s fiscal regime, may also adversely affect the Company’s costs of operations and financial results.
In addition, governments continue to struggle with deficits and concerns over the effects of depressed economies, which has resulted in the mining and metals sector being targeted to raise revenue. Governments are continually assessing the fiscal terms of the economic rent for a mining company to exploit resources in their countries. Numerous countries, including, but not limited to, Argentina, Australia, Brazil, Chile, the Dominican Republic, Guatemala, Honduras, Mexico and Venezuela, have implemented changes to their respective mining regimes that reflect increased government control or participation in the mining sector, including changes of law affecting foreign ownership and take-overs, mandatory government participation, taxation and royalties, working conditions, rates of exchange, exchange control, exploration licensing, export duties, repatriation of income or return of capital, environmental protection, as well as requirements for local goods, supplies and employment of local and community staff or contractors or other benefits to be provided to local residents.
The occurrence of mining regime changes in both developed and developing countries adds uncertainties that cannot be accurately predicted and any future adverse changes in government policies or legislation in the jurisdictions in which the Company operates that affect foreign ownership, mineral exploration, development or mining activities, may affect our viability and profitability.
In December 2016, the State of Zacatecas in Mexico approved new purported environmental taxes that became effective January 1, 2017. Certain operations at the Company’s Peñasquito mine may be subject to these taxes. The Company is not able to estimate the amount of the taxes with sufficient reliability. The Company disputes the legality and constitutionality of the taxes and intends to file legal claims against the taxes before the Mexican courts.
Environmental Regulation
The Company’s operations are subject to environmental regulation in the various jurisdictions in which it operates. These regulations mandate, among other things, the maintenance of air and water quality standards and land reclamation. They also set out limitations on the generation, transportation, storage and disposal of solid and hazardous waste. Environmental legislation is evolving in a manner that will likely require stricter standards and enforcement, increased fines and penalties for non-compliance, more stringent environmental assessments of proposed projects and a heightened degree of responsibility for companies and their officers, directors and employees. There is no assurance that future changes in environmental regulation, if any, will not adversely affect the Company’s financial position and results of operations.
Cost Risk
The Company is exposed to industry wide cost pressures on capital and operating expenditures which increases the Company's risk relating to the profitability of its operations and the economic returns on its exploration and development stage projects. The Company continues to enter into certain hedging strategies to mitigate certain currency exposures and continues to implement cost management strategies to mitigate this risk.
Operational Risks Associated with Restructuring and Cost-efficiency Initiatives
The Company is in the process of implementing initiatives relating to its strategic restructuring, including the reduction of mining low margin ore and the implementation of cost-efficiency initiatives. Any future combination of these measures to increase net asset value and improve profitability will be influenced by the actual benefits and savings achieved and by the Company's ability to sustain these ongoing improvements. Strategic restructuring and cost cutting efforts may involve various risks, including, but not limited to, labour unrest and potential for strikes or road blockades.
Third Quarter Report – 2016
(in United States dollars, tabular amounts in millions, except where noted)
Information Systems Security Threats
Targeted attacks on the Company's systems (or on systems of third parties that we rely on), failure or non-availability of a key information technology (“IT”) system or a breach of security measures designed to protect the Company's IT systems could result in disruptions to our operations, extensive personal injury, property damage or financial or reputational risks. The Company has implemented and tested system controls and disaster recovery infrastructure for certain IT systems. As the threat landscape is ever-changing, the Company's continuous mitigation efforts include the following: risk prioritized controls to protect against known and emerging threats; tools to provide automated monitoring and alerting; and backup and recovery systems to restore systems and return to normal operations.
On April 16, 2016, the Company was made aware that its IT systems had been attacked by an external party. While the attack did not result in any material loss to the Company or interrupt our day-to-day operations, there can be no assurance that the Company will not experience any such losses in the future. The Company's risk and exposure to these matters cannot be fully mitigated because of, among other things, the evolving nature of these threats. As cyber threats continue to evolve, the Compny may be required to expend additional resources to continue to modify or enhance protective measures or to investigate and remediate any security vulnerabilities.
Other Risks
For further information regarding the Company’s operational risks, please refer to the section entitled “Description of the Business - Risk Factors” in the Company's most recent Annual Information Form available on SEDAR at www.sedar.com and on EDGAR at www.sec.gov.
ACCOUNTING MATTERS
Basis of Preparation
The Company’s consolidated financial statements have been prepared in accordance with IFRS as issued by the IASB, effective as of December 31, 2016. IFRS comprises IFRSs, International Accounting Standards (“IASs”), and interpretations issued by the IFRS Interpretations Committee (“IFRICs”) and the former Standing Interpretations Committee (“SICs”). The Company’s significant accounting policies are described in note 3 of the Company's consolidated financial statements for the year ended December 31, 2016.
Critical Judgements and Estimates
The Company’s management makes judgements in its process of applying the Company’s accounting policies in the preparation of its consolidated financial statements. In addition, the preparation of the financial data requires that the Company’s management make assumptions and estimates of the impacts of uncertain future events on the carrying amounts of the Company’s assets and liabilities at the end of the reporting period, and the reported amounts of revenues and expenses during the reporting period. Actual results may differ from those estimates as the estimation process is inherently uncertain. Estimates are reviewed on an ongoing basis based on historical experience and other factors that are considered to be relevant under the circumstances. Revisions to estimates and the resulting impacts on the carrying amounts of the Company’s assets and liabilities are accounted for prospectively.
Management has made the following critical judgements and estimates:
Critical Judgements in Applying Accounting Policies:
The critical judgements that the Company’s management has made in the process of applying the Company’s accounting policies, apart from those involving estimations, that have the most significant effect on the amounts recognized in the Company’s consolidated financial statements are as follows:
(a)Operating levels intended by management
Prior to a mine being capable of operating at levels intended by management, costs incurred are capitalized as part of the costs of the related mining properties and proceeds from mineral sales are offset against costs capitalized. Depletion of capitalized costs for mining properties begins when the mine is capable of operating at levels intended by management. Management considers several factors in determining when a mining property is capable of operating at levels intended by management.
The Company determined that the Cerro Negro and Éléonore mines were capable of operating at levels intended by management effective January 1, 2015 and April 1, 2015, respectively.
Third Quarter Report – 2016
(in United States dollars, tabular amounts in millions, except where noted)
(b)Economic recoverability and probability of future economic benefits of exploration, evaluation and development costs
Management has determined that exploratory drilling, evaluation, development and related costs incurred which have been capitalized are economically recoverable. Management uses several criteria in its assessments of economic recoverability and probability of future economic benefit including geologic and metallurgic information, history of conversion of mineral deposits to proven and probable reserves, scoping and feasibility studies, accessible facilities, existing permits and life of mine plans.
(c)Functional currency
The functional currency for each of the Company’s subsidiaries and investments in associates, is the currency of the primary economic environment in which the entity operates. The Company has determined the functional currency of each entity is the US dollar. Determination of functional currency may involve certain judgements to determine the primary economic environment and the Company reconsiders the functional currency of its entities if there is a change in events and conditions which determined the primary economic environment.
(d)Asset held for sale and discontinued operation
The Company applies judgment to determine whether an asset or disposal group is available for immediate sale in its present condition and that its sale is highly probable and therefore should be classified as held for sale at the balance sheet date. Conditions that support a highly probable sale include the following: an appropriate level of management is committed to a plan to sell the asset or disposal group, an active program to locate a buyer and complete the plan has been initiated, the asset or disposal group has been actively marketed for sale at a price that is reasonable in relation to its current fair value, and the sale of the asset or disposal group is expected to qualify for recognition as a completed sale within one year from the date of classification as held for sale. At December 31, 2016, the Company concluded that the assets and liabilities of Los Filos met the criteria for classification as held for sale. Accordingly, the group of assets and liabilities were presented separately under current assets and current liabilities, respectively, and measured at the lower of its carrying amount and fair value less costs of disposal, being its carrying amount. A reversal of impairment loss of $59 million was recorded for Los Filos during the year ended December 31, 2016 to increase its carrying amount to its recoverable amount. The assets of Los Filos will not be depreciated while they are classified as held for sale.
The Company also applies judgement to determine whether a component of the Company that either has been disposed of, or is classified as held for sale, meets the criteria of a discontinued operation. The key area that involves management judgement in this determination is whether the component represents a separate major line of business or geographical area of operation. Given that the Company will continue to operate in Mexico after the disposal of Los Filos, Los Filos is not considered to be a separate major line of business or geographical area of operation, thus it is not considered to be a discontinued operation. Wharf, being the Company's sole mining operation in the United States at the time of its classification to asset held for sale, was considered to be a major geographical area of operation. Therefore, Wharf met the criteria for discontinued operation and its results have been presented as net earnings and cash flows from discontinued operation for the year ended December 31, 2015.
(e)Business combinations
Determination of whether a set of assets acquired and liabilities assumed constitute the acquisition of a business or asset may require the Company to make certain judgements as to whether or not the assets acquired and liabilities assumed include the inputs, processes and outputs necessary to constitute a business as defined in IFRS 3 – Business Combinations. If an acquired set of assets and liabilities includes goodwill, the set is presumed to be a business. Based on an assessment of the relevant facts and circumstances, the Company concluded that the acquisitions of Kaminak and Probe on July 19, 2016 and March 13, 2015, respectively, did not meet the criteria of a business combination and the transactions have been accounted for as acquisitions of assets.
(f)Determination of control of subsidiaries and joint arrangements
Judgement is required to determine when the Company has control of subsidiaries or joint control of joint arrangements. This requires an assessment of the relevant activities of the investee, being those activities that significantly affect the investee's returns, including operating and capital expenditure decision-making, financing of the investee, and the appointment, remuneration and termination of key management personnel; and when the decisions in relation to those activities are under the control of the Company or require unanimous consent from the investors. Judgement is also required when determining the classification of a joint arrangement as a joint venture or a joint operation through an evaluation of the rights and obligations arising from the arrangement. Changes to the Company's access to those rights and obligations may change the classification of that joint arrangement. Based on assessment of the relevant facts and circumstances, primarily,
Third Quarter Report – 2016
(in United States dollars, tabular amounts in millions, except where noted)
the requirement for unanimous agreement on management decisions relating to the development and operation of the arrangement, the Company concluded that NuevaUnión met the criteria to be classified as a joint venture.
(g)Impairment and impairment reversal indicators
The Company considers both external and internal sources of information in assessing whether there are any indications that cash-generating unit's are impaired or reversal of impairment is needed. External sources of information the Company considers include changes in the market, economic and legal environment in which the Company operates that are not within its control and are expected to affect the recoverable amount of CGUs. Internal sources of information the Company considers include the manner in which mining properties and plant and equipment are being used or are expected to be used and indications of economic performance of the assets. The primary external factors considered are changes in spot and forecast metal prices, changes in laws and regulations and the Company's market capitalization relative to its net asset carrying amount. Primary internal factors considered are the Company's current mine performance against expectations, movements in reserve and resources, life of mine plans and exploration results as primary indicators.
Management concluded that there were no impairment or impairment reversal indicators as of December 31, 2016 other than for the Los Filos and Marlin mines. As at December 31, 2015, management concluded that market capitalization deficiency constituted an indicator of impairment for all CGUs.
(h)Income taxes
The Company’s operations involve dealing with uncertainties and judgments in the application of complex tax regulations in multiple jurisdictions. The final taxes paid are dependent upon many factors, including negotiations with taxing authorities in various jurisdictions and resolution of disputes arising from tax audits. The Company recognizes potential liabilities and records tax liabilities for anticipated tax audit issues based on its judgement of whether, and the extent to which, additional taxes will be due. The Company adjusts these reserves in light of changing facts and circumstances; however, due to the complexity of some of these uncertainties, the ultimate resolution may result in a payment that is materially different from the Company’s current estimate of the tax liabilities. If the Company’s estimate of tax liabilities proves to be less than the ultimate assessment, an additional charge to expense would result. If the estimate of tax liabilities proves to be greater than the ultimate assessment, a tax benefit would result.
(i)Contingencies
Contingencies can be either possible assets or liabilities arising from past events which, by their nature, will be resolved only when one or more uncertain future events occur or fail to occur. Such contingencies include, but are not limited to, environmental obligations, litigation, regulatory proceedings, tax matters and losses results from other events and developments. The assessment of the existence and potential impact of contingencies inherently involves the exercise of significant judgement regarding the outcome of future events.
Key Sources of Estimation Uncertainty
The significant assumptions about the future and other major sources of estimation uncertainty as at the end of the reporting period that have a significant risk of resulting in a material adjustment to the carrying amounts of the Company’s assets and liabilities are as follows:
| |
| (a) | Impairment and reversal of impairment of mining interests and goodwill |
In determining the recoverable amounts of the Company’s mining interests and goodwill, the Company makes estimates of the discounted future after-tax cash flows expected to be derived from the Company’s mining properties, costs to sell the mining properties and the appropriate discount rate. The projected cash flows are significantly affected by changes in assumptions related to metal selling prices, changes in the amount of recoverable reserves, resources, and exploration potential, production cost estimates, future capital expenditures, discount rates and exchange rates.
Continued access to the estimated recoverable reserves, resources and exploration potential of the Company’s mining interests and goodwill is a key assumption in determining their recoverable amounts. The ability to maintain existing or obtain necessary mining concessions, surface rights title, and water concessions is integral to the access of the reserves, resources and exploration potential. A mining concession gives its holder the right to carry out mining activities in the area covered by that concession and take ownership of any minerals found, but it does not always grant surface access rights. In some jurisdictions surface access rights must be separately negotiated with the owner of the surface lands and in the event of a dispute or failed negotiations, administrative legal process may be available. In other jurisdictions, surface access rights may be granted along with mining rights. Water concessions provide its holder the right to specified levels of water usage and are granted based on water availability in the source area.
Third Quarter Report – 2016
(in United States dollars, tabular amounts in millions, except where noted)
Significant changes in metal price forecasts, estimated future costs of production, capital expenditures, the amount of recoverable reserves, resources, and exploration potential, and/or the impact of changes in current economic conditions may result in a write-down or reversal of impairment of the carrying amounts of the Company’s mining interests and/or goodwill.
During the year ended December 31, 2016, the Company recognized a net impairment reversal of $49 million (2015 – $4,906 million), in respect of the carrying amounts of certain mining interests, including the Company's investments in associates and joint venture. The $4,906 million of impairment expense recognized in 2015 included $479 million and $917 million of impairment charges for goodwill and investments in associates and joint venture, respectively.
At December 31, 2016, the carrying amounts of the Company’s mining interests and goodwill were $19,572 million and $nil, respectively (December 31, 2015 – $19,469 million and $nil, respectively).
| |
| (b) | Heap leach ore inventories and mine operating costs |
In determining mine operating costs recognized in the Consolidated Statements of Earnings (Loss), the Company’s management makes estimates of quantities of ore stacked on leach pads and in process and the recoverable gold in this material to determine the average costs of finished goods sold during the period. Changes in these estimates can result in a change in mine operating costs of future periods and carrying amounts of inventories. At December 31, 2016, the carrying amounts of heap leach ore inventories amounted to $12 million, excluding heap leach ore inventories of $235 million classified to asset held for sale related to the Los Filos divestiture (December 31, 2015 – $260 million).
| |
| (c) | Inventory net realizable value |
In determining the net realizable value of heap leach ore and stockpiled ore, the Company estimates future metal selling prices, production forecasts, realized grades and recoveries, timing of processing, and future costs to convert the inventories into saleable form. Reductions in metal price forecasts, increases in estimated future costs to convert, reductions in the amount of recoverable ounces, and a delay in timing of processing can result in a write-down of the carrying amounts of the Company’s work-in-process, heap leach ore and stockpiled ore inventory. During the year ended December 31, 2016, the Company recorded a write down of $11 million, as a result of the carrying amount of certain inventory exceeding net realizable value (December 31, 2015 – $206 million). Of the $11 million of impairment, $10 million and $1 million (December 31, 2015 – $158 million and $48 million) was recorded as Production costs and Depreciation and depletion in the Consolidated Statements of Earnings (Loss), respectively.
| |
| (d) | Depreciation and depletion |
The carrying amounts of the Company’s mining properties are depleted based on recoverable ounces contained in proven and probable reserves and a portion of resources. The Company includes a portion of resources where it is considered probable that those resources will be economically extracted. Changes to estimates of recoverable ounces and depletable costs including changes resulting from revisions to the Company’s mine plans and changes in metal price forecasts can result in changes to future depletion rates.
For plants and equipment not depleted based on recoverable ounces, they are depleted on a straight-line basis. Changes to estimates of the useful life and residual value may be impacted by the Company's mine plans and rate of usage on these equipment.
| |
| (e) | Deferred stripping costs |
In determining whether stripping costs incurred during the production phase of a mining property relate to reserves and resources that will be mined in a future period and therefore should be capitalized, the Company makes estimates of the stripping activity over the life of the component of reserves and resources which have been made accessible. Changes in estimated strip ratios can result in a change to the future capitalization of stripping costs incurred. At December 31, 2016, the carrying amount of stripping costs capitalized and included in mining properties was $205 million (December 31, 2015 – $163 million).
In assessing the probability of realizing income tax assets recognized, management makes estimates related to expectations of future taxable income, applicable tax opportunities, expected timing of reversals of existing temporary differences and the likelihood that tax positions taken will be sustained upon examination by applicable tax authorities. In making its assessments, management gives additional weight to positive and negative evidence that can be objectively verified. Estimates of future taxable income are based on forecasted cash flows from operations and the application of existing tax laws in each jurisdiction. Forecasted cash flows from operations are based on life of mine projections internally developed and reviewed by management. Weight is attached to tax planning opportunities that are within the
Third Quarter Report – 2016
(in United States dollars, tabular amounts in millions, except where noted)
Company’s control, and are feasible and implementable without significant obstacles. The likelihood that tax positions taken will be sustained upon examination by applicable tax authorities is assessed based on individual facts and circumstances of the relevant tax position evaluated in light of all available evidence. Where applicable tax laws and regulations are either unclear or subject to ongoing varying interpretations, it is reasonably possible that changes in these estimates can occur that materially affect the amounts of income tax assets recognized. At the end of each reporting period, the Company reassesses unrecognized income tax assets.
| |
| (g) | Estimated reclamation and closure costs |
The Company’s provision for reclamation and closure cost obligations represents management’s best estimate of the present value of the future cash outflows required to settle the liability which reflects estimates of future costs, inflation, movements in foreign exchange rates, assumptions of risks associated with the future cash outflows and assumptions of probabilities of alternative estimates of future cash outflows, and the applicable risk-free interest rates for discounting those future cash outflows. Significant judgements and estimates are required in forming assumptions of future activities, future cash outflows and the timing of those cash outflows. These assumptions are formed based on environmental and regulatory requirements and the Company’s environmental policies which may give rise to constructive obligations. The Company’s assumptions are reviewed at the end of each reporting period and adjusted to reflect management’s current best estimate and changes in any of the above factors can result in a change to the provision recognized by the Company. At December 31, 2016, the Company’s total provision for reclamation and closure cost obligations was $622 million (December 31, 2015 – $702 million). The undiscounted value of these obligations was $1,786 million (December 31, 2015 – $1,914 million).
For the purpose of calculating the present value of the provision for reclamation and closure cost obligations, the Company discounts the estimated future cash outflows using the risk-free interest rate applicable to the future cash outflows, which is the appropriate US Treasury risk-free rate which reflects the reclamation lifecycle estimated for all sites, including operating and inactive mines and development projects. For those sites with a greater than 100-year reclamation lifecycle, a long-term risk-free rate is applied.
For the year ended December 31, 2016, the Company applied a 20-year risk-free rate of 2.94% (2015 – 20-year risk-free rate of 2.67%) to all sites with the exception of those sites with a reclamation lifecycle of greater than 100 years where a 5.0% (2015 – 5.0%) risk-free rate was applied, which resulted in a weighted average discount rate of 4.1% (2015 – 4.1%).
Changes to reclamation and closure cost obligations are recorded with a corresponding change to the carrying amounts of the related mining properties (for operating mines and development projects) and as production costs (for inactive and closed mines) for the period. Adjustments to the carrying amounts of related mining properties can result in a change to future depletion expense.
Due to the size, complexity and nature of the Company’s operations, various legal and tax matters are outstanding from time to time. In the event that management’s estimate of the future resolution of these matters changes, the Company will recognize the effects of the changes in its consolidated financial statements on the date such changes occur.
Changes in Accounting Policies
Application of new and revised accounting standards
The Company has applied the amendments to IFRSs included in the Annual Improvements to IFRSs 2012-2014 Cycle which were effective for annual periods beginning on or after January 1, 2016. The amendments did not have an impact on the Company's consolidated financial statements.The Company has not early adopted any amendment, standard or interpretation that has been issued by the IASB but is not yet effective.
Changes in Accounting Standards Not Yet Effective
Revenue recognition
In May 2014, the IASB issued IFRS 15 – Revenue from Contracts with Customers ("IFRS 15") which supersedes IAS 11 – Construction Contracts; IAS 18 – Revenue; IFRIC 13 – Customer Loyalty Programmes; IFRIC 15 – Agreements for the Construction of Real Estate; IFRIC 18 – Transfers of Assets from Customers; and SIC 31 – Revenue – Barter Transactions involving Advertising Services. IFRS 15 establishes a single five-step model framework for determining the nature, amount, timing and uncertainty of revenue and cash flows arising from a contract with a customer. On July 22, 2015 the IASB confirmed a one-year deferral of the effective date of IFRS 15 to January 1, 2018. The Company plans to apply IFRS 15 at the date it becomes effective.
Third Quarter Report – 2016
(in United States dollars, tabular amounts in millions, except where noted)
The Company is currently evaluating the potential impact of applying IFRS 15, primarily analyzing its doré and concentrate sale agreements. The Company does not anticipate any changes in the gross amounts of revenue recognized but the timing of revenue recognized may differ under the new standard if the timing of transfer of control to customers is deferred and/or if there are additional performance obligations which are currently not recognized separately, such as shipping and insurance services arranged by the Company on behalf of the customers.
Financial instruments
In July 2014, the IASB issued the final version of IFRS 9 – Financial Instruments ("IFRS 9") to replace IAS 39 – Financial Instruments: Recognition and Measurement. IFRS 9 provides a revised model for recognition and measurement of financial instruments and a single, forward-looking 'expected loss' impairment model. IFRS 9 also includes a substantially reformed approach to hedge accounting. The standard is effective for annual periods beginning on or after January 1, 2018, with early adoption permitted. The Company plans to apply IFRS 9 at the date it becomes effective.
The following summarizes the expected impact of IFRS 9 upon adoption:
| |
| • | The classification of financial assets and liabilities is expected to remain consistent under IFRS 9 with the possible exception of equity securities. Under IFRS 9, the Company will have the option to designate equity securities as financial assets at fair value through other comprehensive income, where they will be recorded initially at fair value with changes in fair value recognized in other comprehensive income which will not be subsequently transferred into earnings (loss). If the Company does not make this election, changes in fair value of the equity securities will be recognized in earnings (loss). |
| |
| • | The introduction of the new "expected credit loss" impairment model is not expected to have an impact on the Company, given the Company sells its products exclusively to large international financial institutions and other organizations with strong credit ratings, the negligible historical level of customer default and the short term nature of the Company's receivables. |
| |
| • | The reformed approach to hedge accounting is not expected to have a significant impact on the Company. Under the current standard, companies can elect to record basis adjustments against the carrying amount of the non-financial asset or in earnings at the same time the non-financial item affects earnings. Under IFRS 9, it is mandatory to record the basis adjustments against the carrying amount of the non-financial asset and the Company has elected this as its policy choice under the current standard. Additionally, supplementary documentation and on-going assessment of hedge effectiveness may be required under the new standard. However, these requirements are not expected to have a material impact on the hedging arrangements of the Company. |
Leases
In January 2016, the IASB issued IFRS 16 – Leases ("IFRS 16") which replaces IAS 17 – Leases and its associated interpretative guidance. IFRS 16 applies a control model to the identification of leases, distinguishing between a lease and a service contract on the basis of whether the customer controls the asset being leased. For those assets determined to meet the definition of a lease, IFRS 16 introduces significant changes to the accounting by lessees, introducing a single, on-balance sheet accounting model that is similar to current finance lease accounting, with limited exceptions for short-term leases or leases of low value assets. Lessor accounting remains similar to current accounting practice. The standard is effective for annual periods beginning on or after January 1, 2019, with early application permitted for entities that apply IFRS 15. The Company plans to apply IFRS 16 at the date it becomes effective.
Upon the adoption of IFRS 16, the Company anticipates to record a material balance of lease assets and associated lease liabilities related to leases with a term of 12 months or more previously classified as operating leases on the Consolidated Balance Sheet at January 1, 2019. Due to the recognition of additional lease assets and liabilities, a higher amount of depreciation expense and interest on lease liabilities will be recorded under IFRS 16 compared to the current standard. Additionally, a corresponding reduction in general and administrative costs and/or production costs is expected. Lastly, the Company expects a reduction in operating cash outflows with a corresponding increase in financing cash outflows under IFRS 16. The Company has not quantified these impacts at this time.
CONTROLS AND PROCEDURES
Disclosure Controls and Procedures
The Company’s management, with the participation of its President and Chief Executive Officer and Executive Vice President, Chief Financial Officer and Corporate Development, has evaluated the effectiveness of the Company’s disclosure controls and procedures. Based upon the results of that evaluation, the Company’s President and Chief Executive Officer and Executive Vice President, Chief Financial Officer and Corporate Development have concluded that, as of December 31, 2016, the Company’s disclosure controls and procedures were effective to provide reasonable assurance that the information required to be disclosed by the Company in reports it files is recorded, processed, summarized and reported, within the appropriate time periods and is accumulated and communicated to management, including the President and Chief Executive Officer and Executive Vice President, Chief Financial Officer and Corporate Development, as appropriate to allow timely decisions regarding required disclosure.
Third Quarter Report – 2016
(in United States dollars, tabular amounts in millions, except where noted)
Internal Control Over Financial Reporting
The Company’s management, with the participation of its President and Chief Executive Officer and Executive Vice President, Chief Financial Officer and Corporate Development, is responsible for establishing and maintaining adequate internal control over financial reporting. Under the supervision of the President and Chief Executive Officer and Executive Vice President, Chief Financial Officer and Corporate Development, the Company’s internal control over financial reporting is a process designed to provide reasonable assurance regarding the reliability of financial reporting and the preparation of financial statements for external purposes in accordance with IFRS. The Company’s internal control over financial reporting includes policies and procedures that:
| |
| • | pertain to the maintenance of records that accurately and fairly reflect, in reasonable detail, the transactions and dispositions of assets of the Company; |
| |
| • | provide reasonable assurance that transactions are recorded as necessary to permit preparation of financial statements in accordance with IFRS and that the Company’s receipts and expenditures are made only in accordance with authorizations of management and the Company’s Directors; and |
| |
| • | provide reasonable assurance regarding prevention or timely detection of unauthorized acquisition, use, or disposition of the Company’s assets that could have a material effect on the Company’s consolidated financial statements. |
The Company’s management, with the participation of its President and Chief Executive Officer and its Executive Vice President, Chief Financial Officer and Corporate Development, assessed the effectiveness of the Company’s internal control over financial reporting. In making this assessment, management used the criteria set forth in Internal Control - Integrated Framework (2013) issued by the Committee of Sponsoring Organizations of the Treadway Commission. Based on this assessment, management and the President and Chief Executive Officer and Executive Vice President, Chief Financial Officer and Corporate Development have concluded that, as of December 31, 2016, the Company’s internal control over financial reporting was effective.
There has been no change in the Company’s internal control over financial reporting during the year ended December 31, 2016 that has materially affected, or is reasonably likely to materially affect, the Company’s internal control over financial reporting.
Limitations of Controls and Procedures
The Company’s management, including the President and Chief Executive Officer and Executive Vice President, Chief Financial Officer and Corporate Development, believes that any disclosure controls and procedures or internal control over financial reporting, no matter how well conceived and operated, can provide only reasonable, not absolute, assurance that the objectives of the control system are met. Further, the design of a control system must reflect the fact that there are resource constraints, and the benefits of controls must be considered relative to their costs. Because of the inherent limitations in all control systems, they cannot provide absolute assurance that all control issues and instances of fraud, if any, within the Company have been prevented or detected. These inherent limitations include the realities that judgments in decision-making can be faulty, and that breakdowns can occur because of simple error or mistake. Additionally, controls can be circumvented by the individual acts of some persons, by collusion of two or more people, or by unauthorized override of the control. The design of any control system also is based in part upon certain assumptions about the likelihood of future events, and there can be no assurance that any design will succeed in achieving its stated goals under all potential future conditions. Accordingly, because of the inherent limitations in a cost effective control system, misstatements due to error or fraud may occur and not be detected.
|
| | |
| GOLDCORP INC |
| GOLD AND SILVER RESERVES AND RESOURCES SUMMARY TABLE |
| Effective June 30, 2016 |
| Reserves | Contained Gold (Moz) | Contained Silver (Moz) |
| Proven | 19.0 | 465.5 |
| Probable | 22.8 | 226.2 |
| Proven & Probable | 41.8 | 691.6 |
| | | |
| Resources | | |
| Measured | 8.0 | 142.0 |
| Indicated | 35.5 | 366.8 |
| Measured & Indicated | 43.4 | 508.8 |
| Inferred | 22.0 | 80.6 |
|
| | | | |
| GOLDCORP INC |
PROVEN AND PROBABLE RESERVES (1)(4)(5) |
| Effective June 30, 2016 |
| |
| Based on attributable ounces |
| GOLD | Mt | Au g/t | Moz |
| Alumbrera (37.5%) | Argentina | 16.54 | 0.39 | 0.21 |
| Borden | Canada | 4.12 | 7.14 | 0.95 |
| Camino Rojo | Mexico | 75.52 | 0.70 | 1.70 |
| Cerro Negro | Argentina | 16.66 | 9.06 | 4.85 |
| Coffee | Canada | 46.36 | 1.45 | 2.16 |
| El Morro (50.0%) | Chile | 299.53 | 0.46 | 4.46 |
| Éléonore | Canada | 23.44 | 6.07 | 4.57 |
| Los Filos | Mexico | 40.71 | 1.12 | 1.47 |
| Marlin | Guatemala | 0.50 | 4.10 | 0.07 |
| Musselwhite | Canada | 8.21 | 6.39 | 1.69 |
| Peñasquito Heap Leach | Mexico | 10.47 | 0.40 | 0.13 |
| Peñasquito Mill | Mexico | 589.00 | 0.52 | 9.89 |
| Porcupine | Canada | 45.70 | 1.55 | 2.28 |
| Pueblo Viejo (40.0%) | Dominican Republic | 57.21 | 2.93 | 5.39 |
| Red Lake | Canada | 7.55 | 8.36 | 2.03 |
| TOTAL GOLD | 1,241.52 | 1.05 | 41.83 |
| SILVER | Mt | Ag g/t | Moz |
| Camino Rojo | Mexico | 75.52 | 14.22 | 34.53 |
| Cerro Negro | Argentina | 16.66 | 66.70 | 35.73 |
| Los Filos | Mexico | 40.71 | 7.44 | 9.73 |
| Marlin | Guatemala | 0.50 | 191.04 | 3.10 |
| Peñasquito Heap Leach | Mexico | 10.47 | 22.56 | 7.60 |
| Peñasquito Mill | Mexico | 589.00 | 30.05 | 569.07 |
| Pueblo Viejo (40.0%) | Dominican Republic | 57.21 | 17.33 | 31.87 |
| TOTAL SILVER | 790.09 | 27.23 | 691.64 |
|
| | | | |
| COPPER | Mt | % Cu | Mlbs |
| Alumbrera (37.5%) | Argentina | 17 | 0.23 | 84 |
| El Morro (50.0%) | Chile | 300 | 0.49 | 3,251 |
| Pueblo Viejo (40.0%) | Dominican Republic | 57 | 0.10 | 120 |
| Relincho (50.0%) | Chile | 620 | 0.37 | 5,087 |
| TOTAL COPPER | 993 | 0.39 | 8,543 |
| LEAD | Mt | % Pb | Mlbs |
| Peñasquito Mill | Mexico | 589 | 0.28 | 3,684 |
| TOTAL LEAD | 589 | 0.28 | 3,684 |
| ZINC | Mt | % Zn | Mlbs |
| Peñasquito Mill | Mexico | 589 | 0.69 | 8,927 |
| TOTAL ZINC | 589 | 0.69 | 8,927 |
| MOLYBDENUM | Mt | % Mo | Mlbs |
| Relincho (50.0%) | Chile | 620 | 0.017 | 239 |
| TOTAL MOLYBDENUM | 620 | 0.017 | 239 |
|
| | | | |
GOLDCORP INC MEASURED AND INDICATED RESOURCES (1)(2)(3)(4)(6) Effective June 30, 2016
Based on attributable ounces |
| GOLD | Mt | Au g/t | Moz |
| Alumbrera (37.5%) | Argentina | 15.94 | 0.28 | 0.14 |
| Borden | Canada | 3.02 | 5.77 | 0.56 |
| Camino Rojo | Mexico | 223.08 | 1.05 | 7.50 |
| Cerro Blanco | Guatemala | 2.05 | 12.69 | 0.84 |
| Cerro Negro | Argentina | 6.84 | 6.23 | 1.37 |
| Cochenour | Canada | 0.60 | 15.03 | 0.29 |
| Coffee | Canada | 17.69 | 1.21 | 0.69 |
| El Morro (50.0%) | Chile | 46.18 | 0.41 | 0.61 |
| Éléonore | Canada | 5.14 | 5.66 | 0.93 |
| Los Filos | Mexico | 381.82 | 0.82 | 10.02 |
| Marlin | Guatemala | 0.46 | 4.55 | 0.07 |
| Musselwhite | Canada | 2.88 | 4.98 | 0.46 |
| Noche Buena | Mexico | 55.00 | 0.37 | 0.65 |
| Peñasquito Heap Leach | Mexico | 22.56 | 0.21 | 0.15 |
| Peñasquito Mill | Mexico | 303.49 | 0.27 | 2.66 |
| Porcupine | Canada | 223.22 | 1.19 | 8.52 |
| Pueblo Viejo (40.0%) | Dominican Republic | 70.43 | 2.33 | 5.27 |
| Red Lake | Canada | 4.48 | 16.79 | 2.42 |
| San Nicolas (21.0%) | Mexico | 19.26 | 0.46 | 0.28 |
| TOTAL GOLD | 1,404.13 | 0.96 | 43.43 |
| SILVER | Mt | Ag g/t | Moz |
| Camino Rojo | Mexico | 223.08 | 9.02 | 64.72 |
| Cerro Blanco | Guatemala | 2.05 | 40.13 | 2.64 |
| Cerro Negro | Argentina | 6.84 | 52.17 | 11.48 |
| Los Filos | Mexico | 381.82 | 8.49 | 104.28 |
| Marlin | Guatemala | 0.46 | 193.86 | 2.89 |
| Noche Buena | Mexico | 55.00 | 12.35 | 21.84 |
| Peñasquito Heap Leach | Mexico | 22.56 | 26.38 | 19.13 |
|
| | | | |
| Peñasquito Mill | Mexico | 303.49 | 24.51 | 239.14 |
| Pueblo Viejo (40.0%) | Dominican Republic | 70.43 | 11.54 | 26.14 |
| San Nicolas (21.0%) | Mexico | 19.26 | 26.70 | 16.53 |
| TOTAL SILVER | 1,084.99 | 14.59 | 508.79 |
| COPPER | Mt | % Cu | Mlbs |
| Alumbrera | Argentina | 16 | 0.28 | 98 |
| El Morro (50.0%) | Chile | 46 | 0.42 | 427 |
| Pueblo Viejo (40.0%) | Dominican Republic | 70 | 0.09 | 133 |
| Relincho (50.0%) | Chile | 199 | 0.32 | 1,421 |
| San Nicolas (21.0%) | Mexico | 19 | 1.24 | 527 |
| TOTAL COPPER | 350 | 0.34 | 2,605 |
| LEAD | Mt | % Pb | Mlbs |
| Camino Rojo | Mexico | 147 | 0.08 | 260 |
| Peñasquito Mill | Mexico | 303 | 0.22 | 1,469 |
| TOTAL LEAD | 450 | 0.17 | 1,729 |
| ZINC | Mt | % Zn | Mlbs |
| Camino Rojo | Mexico | 147 | 0.27 | 876 |
| Peñasquito Mill | Mexico | 303 | 0.54 | 3,600 |
| San Nicolas (21.0%) | Mexico | 19 | 1.68 | 713 |
| TOTAL ZINC | 470 | 0.50 | 5,189 |
| MOLYBDENUM | Mt | % Mo | Mlbs |
| Relincho (50.0%) | Chile | 199 | 0.011 | 48 |
| TOTAL MOLYBDENUM | 199 | 0.011 | 48 |
|
| | | | |
GOLDCORP INC INFERRED RESOURCES (1)(2)(3)(4)(6) Effective June 30, 2016
Based on attributable ounces |
| GOLD | Mt | Au g/t | Moz |
| Alumbrera (37.5%) | Argentina | 1.50 | 0.26 | 0.01 |
| Borden | Canada | 2.30 | 5.49 | 0.41 |
| Camino Rojo | Mexico | 17.16 | 0.88 | 0.49 |
| Cerro Blanco | Guatemala | 0.75 | 9.34 | 0.23 |
| Cerro Negro | Argentina | 2.13 | 4.15 | 0.28 |
| Cochenour | Canada | 3.91 | 17.09 | 2.15 |
| Coffee | Canada | 52.35 | 1.31 | 2.21 |
| El Morro (50.0%) | Chile | 339.03 | 0.30 | 3.23 |
| Éléonore | Canada | 9.73 | 7.52 | 2.35 |
| Los Filos | Mexico | 162.65 | 0.76 | 4.00 |
| Marlin | Guatemala | 0.04 | 6.68 | 0.01 |
| Musselwhite | Canada | 6.80 | 5.48 | 1.20 |
| Noche Buena | Mexico | 4.94 | 0.22 | 0.03 |
| Peñasquito Heap Leach | Mexico | 0.04 | 0.01 | — |
| Peñasquito Mill | Mexico | 28.22 | 0.30 | 0.27 |
| Porcupine | Canada | 45.15 | 1.64 | 2.38 |
| Pueblo Viejo (40.0%) | Dominican Republic | 1.90 | 2.05 | 0.12 |
| Red Lake | Canada | 4.58 | 17.77 | 2.62 |
| San Nicolas (21.0%) | Mexico | 2.28 | 0.26 | 0.02 |
| TOTAL GOLD | 685.45 | 1.00 | 22.00 |
| | | | |
|
| | | | |
| | | | |
| SILVER | Mt | Ag g/t | Moz |
| Camino Rojo | Mexico | 17.16 | 9.06 | 5.00 |
| Cerro Blanco | Guatemala | 0.75 | 43.61 | 1.06 |
| Cerro Negro | Argentina | 2.13 | 32.06 | 2.19 |
| Los Filos | Mexico | 162.65 | 9.80 | 51.25 |
| Marlin | Guatemala | 0.04 | 333.44 | 0.39 |
| Noche Buena | Mexico | 4.94 | 8.08 | 1.28 |
| Peñasquito Heap Leach | Mexico | 0.04 | 5.02 | 0.01 |
| Peñasquito Mill | Mexico | 28.22 | 19.37 | 17.58 |
| Pueblo Viejo (40.0%) | Dominican Republic | 1.90 | 9.76 | 0.60 |
| San Nicolas (21.0%) | Mexico | 2.28 | 17.40 | 1.27 |
| TOTAL SILVER | 220.10 | 11.39 | 80.63 |
| COPPER | Mt | % Cu | Mlbs |
| Alumbrera (37.50%) | Argentina | 2 | 0.15 | 5 |
| El Morro (50.0%) | Chile | 339 | 0.35 | 2,595 |
| Pueblo Viejo (40.0%) | Dominican Republic | 2 | 0.02 | 1 |
| Relincho (50.0%) | Chile | 305 | 0.38 | 2,550 |
| San Nicolas (21.0%) | Mexico | 2 | 1.24 | 62 |
| TOTAL COPPER | 650 | 0.36 | 5,213 |
| LEAD | Mt | % Pb | Mlbs |
| Camino Rojo | Mexico | 10 | 0.07 | 15 |
| Peñasquito Mill | Mexico | 28 | 0.21 | 128 |
| TOTAL LEAD | 38 | 0.17 | 143 |
| ZINC | Mt | % Zn | Mlbs |
| Camino Rojo | Mexico | 10 | 0.24 | 53 |
| Peñasquito Mill | Mexico | 28 | 0.31 | 193 |
| San Nicolas (21.0%) | Mexico | 2 | 0.97 | 49 |
| TOTAL ZINC | 41 | 0.33 | 295 |
| MOLYBDENUM | Mt | % Mo | Mlbs |
| Relincho (50.0%) | Chile | 305 | 0.013 | 88 |
| TOTAL MOLYBDENUM | 305 | 0.013 | 88 |
*Numbers may not add up due to rounding
**For additional information on the 2016 mineral reserves and mineral resources (“MRMR”) refer to the MRMR tables that can be found at www.goldcorp.com
|
| | | |
| Goldcorp June 30, 2016 Reserve and Resource Reporting Notes: |
| | | | |
| 1 | All Mineral Reserves or Ore Reserves have been estimated in accordance with the CIM Definition Standards or the JORC Code. The JORC Code has been accepted for current disclosure rules in Canada under NI 43-101. Subject to note 4 below, all Mineral Reserves, Ore Reserves and Mineral Resources set out in the tables above or elsewhere in this release have been reviewed and approved by Gil Lawson, P.Eng., Vice President of Geology and Mine Planning, Goldcorp, who is a qualified person as defined under National Instrument 43-101. |
| 2 | All Mineral Resources are reported exclusive of those Mineral Resources that were converted to Mineral Reserves. |
| 3 | Mineral Resources which are not Mineral Reserves do not have demonstrated economic viability. |
| 4 | Mineral Reserves and Mineral Resources are reported effective June 30, 2016, with the following conditions or exceptions: |
| | (i) (ii) (iii) (iv)
(v)
| Mineral Reserves and Mineral Resources for Pueblo Viejo are as per information provided by Barrick Gold Corporation effective December 31, 2016. Mineral Reserves and Mineral Resources for Relincho and San Nicolas are as per information provided by Teck Resources Limited effective December 31, 2016. Mineral Reserves and Mineral Resources for Alumbrera are as per information provided by Glencore plc effective December 31, 2016. Mineral Reserves and Mineral Resources for Coffee are as per information provided by Kaminak Gold Corporation effective the transaction date of July 19, 2016. Mineral Reserves and Mineral Resources for Los Filos are effective December 31, 2016. |
| 5 | Mineral Reserves are estimated using appropriate recovery rates and US$ commodity prices of $1,200 per ounce of gold, $18.00 per ounce of silver, $2.75 per pound of copper, $0.90 per pound of lead, and $0.95 per pound of zinc, unless otherwise noted below: |
| | (i) | Alumbrera | $1,300/oz gold, $2.31/lb copper |
| | (ii) | Pueblo Viejo | $1,200/oz gold, $16.50/oz silver, $3.00/lb copper |
| | (iv) | Relincho | $13.70/lb molybdenum, $2.80/lb copper |
| 6 | Mineral Resources are estimated using US$ commodity prices of $1,400 per ounce of gold, $20 per ounce of silver, $3.00 per pound of copper, $1.00 per pound of lead, and $1.00 per pound of zinc, unless otherwise noted below; |
| | (i) | Alumbrera | $1,300/oz gold, $3.06/lb copper |
| | (ii) | El Morro | $1,200/oz gold, $2.75/lb copper |
| | (iii) | Pueblo Viejo | $1,500/oz gold, $17.50/oz silver, $3.25/lb copper |
| | (iv) | Relincho | $13.70/lb molybdenum, $2.80/lb copper |
| | (v) | San Nicolas | $1,275/oz gold, $22.50/oz silver, $2.75/lb copper, $1.00/lb zinc |