

(in United States dollars, tabular amounts in millions, except where noted)
Exhibit 99.1
MANAGEMENT’S DISCUSSION AND ANALYSIS
OF FINANCIAL CONDITION AND RESULTS OF OPERATIONS
FOR THE THREE AND NINE MONTHS ENDED SEPTEMBER 30, 2018
This Management’s Discussion and Analysis (“MD&A”) should be read in conjunction with the condensed interim consolidated financial statements of Goldcorp Inc. (“Goldcorp” or “the Company”) for the three and nine months ended September 30, 2018 and related notes thereto which have been prepared in accordance with International Accounting Standard 34 – Interim Financial Reporting of International Financial Reporting Standards (“GAAP” or “IFRS”) as issued by the International Accounting Standards Board (“IASB”). All figures are in United States (“US”) dollars unless otherwise noted. References to C$ are to Canadian dollars. This MD&A has been prepared as of October 24, 2018.
TABLE OF CONTENTS
GOLDCORP | 1
(in United States dollars, tabular amounts in millions, except where noted)
CAUTIONARY STATEMENT REGARDING FORWARD-LOOKING STATEMENTS
This MD&A contains "forward-looking statements" within the meaning of Section 27A of the United States Securities Act of 1933, as amended, Section 21E of the United States Exchange Act of 1934, as amended, the United States Private Securities Litigation Reform Act of 1995, or in releases made by the United States Securities and Exchange Commission ("SEC"), all as may be amended from time to time, and "forward-looking information" under the provisions of applicable Canadian securities legislation, concerning the business, operations and financial performance and condition of Goldcorp. Forward-looking statements include, but are not limited to, statements with respect to the future price of gold, silver, zinc, copper and lead, the estimation of Mineral Reserves and Mineral Resources (as each term is defined below), the realization of Mineral Reserve estimates, the timing and amount of estimated future production, costs of production, targeted cost reductions, capital expenditures, costs and timing of the development of new deposits, success of exploration activities, permitting and certification time lines, timing and cost of construction and expansion projects, hedging practices, currency exchange rate fluctuations, requirements for additional capital, government regulation of mining operations, environmental risks, unanticipated reclamation expenses, health, safety and diversity initiatives, timing and possible outcome of pending litigation, title disputes or claims and limitations on insurance coverage. Generally, these forward-looking statements can be identified by the use of words such as "plans", "expects", "is expected", "budget", "scheduled", "estimates", "forecasts", "intends", "anticipates", "believes", or variations or comparable language of such words and phrases or statements that certain actions, events or results "may", "could", "would", "should", "might" or "will", "occur" or "be achieved" or the negative connotation thereof.
Forward-looking statements are necessarily based upon a number of factors and assumptions that, if untrue, could cause the actual results, performances or achievements of Goldcorp to be materially different from future results, performances or achievements expressed or implied by such statements. Such statements and information are based on numerous assumptions regarding Goldcorp’s present and future business strategies and the environment in which Goldcorp will operate in the future, including the price of gold, anticipated costs and ability to achieve goals. Certain important factors that could cause actual results, performances or achievements to differ materially from those in the forward-looking statements include, among others, gold price volatility, discrepancies between actual and estimated production, Mineral Reserves and Mineral Resources and metallurgical recoveries, mining operational and development risks, litigation risks, regulatory restrictions (including environmental regulatory restrictions and liability), changes in national and local government legislation, taxation, controls or regulations and/or change in the administration of laws, policies and practices, expropriation or nationalization of property and political or economic developments in Canada, the United States, Mexico, Argentina, the Dominican Republic, Chile or other jurisdictions in which the Company does or may carry on business in the future, delays, suspension and technical challenges associated with capital projects, higher prices for fuel, steel, power, labour and other consumables, currency fluctuations, the speculative nature of gold exploration, the global economic climate, dilution, share price volatility, competition, loss of key employees, additional funding requirements and defective title to mineral claims or property. Although Goldcorp believes its expectations are based upon reasonable assumptions and has attempted to identify important factors that could cause actual actions, events or results to differ materially from those described in forward-looking statements, there may be other factors that cause actions, events or results not to be as anticipated, estimated or intended.
Forward-looking statements are subject to known and unknown risks, uncertainties and other important factors that may cause the actual results, level of activity, performance or achievements of Goldcorp to be materially different from those expressed or implied by such forward-looking statements, including but not limited to: future prices of gold, silver, zinc, copper and lead; mine development and operating risks; possible variations in ore reserves, grade or recovery rates; risks related to international operations, including economic and political instability in foreign jurisdictions in which Goldcorp operates; risks related to current global financial conditions; risks related to joint venture operations; actual results of current exploration activities; actual results of current reclamation activities; environmental risks; conclusions of economic evaluations; changes in project parameters as plans continue to be refined; failure of plant, equipment or processes to operate as anticipated; accidents, labour disputes and other risks of the mining industry; risks associated with cost-efficiency initiatives; delays in obtaining governmental approvals or financing or in the completion of development or construction activities; risks related to the integration of acquisitions; risks related to indebtedness and the service of such indebtedness, as well as those factors discussed in the section entitled "Description of the Business - Risk Factors” in Goldcorp’s most recent annual information form available on SEDAR at www.sedar.com and on EDGAR at www.sec.gov. Although Goldcorp has attempted to identify important factors that could cause actual results to differ materially from those contained in forward-looking statements, there may be other factors that cause results not to be as anticipated, estimated or intended. There can be no assurance that such statements will prove to be accurate, as actual results and future events could differ materially from those anticipated in such statements. Accordingly, readers should not place undue reliance on forward-looking statements. Forward-looking statements are made as of the date hereof and, accordingly, are subject to change after such date. Except as otherwise indicated by Goldcorp, these statements do not reflect the potential impact of any non-recurring or other special items or of any disposition, monetization, merger, acquisition, other business combination or other transaction that may be announced or that may occur after the date hereof. Forward-looking statements are provided for the purpose of providing information about management’s current expectations and plans and allowing investors and others to get a better understanding of Goldcorp's operating environment. Goldcorp does not intend or undertake to publicly update any forward-looking statements that are included in this document, whether as a result of new information, future events or otherwise, except in accordance with applicable securities laws.
GOLDCORP | 2
(in United States dollars, tabular amounts in millions, except where noted)
CAUTIONARY STATEMENT REGARDING CERTAIN MEASURES OF PERFORMANCE
This MD&A presents certain measures, including "total cash costs: by-product", "total cash costs: co-product", "all-in sustaining costs", "adjusted operating cash flow", "EBITDA", "adjusted EBITDA" and "adjusted net debt", that are not recognized measures under IFRS. This data may not be comparable to data presented by other gold producers. For a reconciliation of these measures to the most directly comparable financial information presented in the consolidated financial statements prepared in accordance with IFRS, see Non-GAAP Financial Performance Measures in this MD&A. The Company believes that these generally accepted industry measures are realistic indicators of operating performance and are useful in performing year over year comparisons. However, these non-GAAP measures should be considered together with other data prepared in accordance with IFRS, and these measures, taken by themselves, are not necessarily indicative of operating costs or cash flow measures prepared in accordance with IFRS. This MD&A also contains information as to estimated future all-in sustaining costs. The estimates of future all-in sustaining costs are not based on total production cash costs calculated in accordance with IFRS, which forms the basis of the Company’s cash costs: by-product. The estimates of future all-in sustaining costs are anticipated to be adjusted to include sustaining capital expenditures, corporate administrative expense, exploration and evaluation costs and reclamation cost accretion and amortization, and exclude the effects of expansionary capital, tax payments, dividends and financing costs. Projected IFRS total production cash costs for the full year would require inclusion of the projected impact of future included and excluded items, including items that are not currently determinable, but may be significant, such as sustaining capital expenditures, reclamation cost accretion and amortization and tax payments. Due to the uncertainty of the likelihood, amount and timing of any such items, the Company does not have information available to provide a quantitative reconciliation of projected all-in sustaining costs to a total production cash costs projection.
CAUTIONARY NOTE REGARDING MINERAL RESERVES AND MINERAL RESOURCES
Scientific and technical information contained in this MD&A was reviewed and approved by Ivan Mullany, FAusIMM, Senior Vice-President, Technical Services for Goldcorp, and a "qualified person" as defined by Canadian Securities Administrators' National Instrument 43-101 - Standards of Disclosure for Mineral Projects ("NI 43-101"). All Mineral Reserves and Mineral Resources have been estimated in accordance with the standards of the Canadian Institute of Mining, Metallurgy and Petroleum ("CIM") and NI 43-101, or the Australasian Code for Reporting of Exploration Results, Mineral Resources and Ore Reserves equivalent. All Mineral Resources are reported exclusive of Mineral Reserves. Mineral Resources that are not Mineral Reserves do not have demonstrated economic viability. Information on data verification performed on the mineral properties mentioned in this MD&A that are considered to be material mineral properties to the Company are contained in Goldcorp’s most recent annual information form and the technical report for each of those properties, all available on SEDAR at www.sedar.com.
Cautionary Note to United States investors concerning estimates of measured, indicated and inferred resources: The Mineral Reserve and Mineral Resource estimates contained in this MD&A have been prepared in accordance with the requirements of Canadian securities laws, which differ from the requirements of United States securities laws and use terms that are not recognized by the SEC. Canadian reporting requirements for disclosure of mineral properties are governed by NI 43-101. The definitions used in NI 43-101 are incorporated by reference from the CIM Definition Standards adopted by CIM Council on May 10, 2014 (the "CIM Definition Standards"). U.S. reporting requirements are governed by the SEC Industry Guide 7 ("Industry Guide 7") under the United States Securities Act of 1933, as amended. These reporting standards have similar goals in terms of conveying an appropriate level of confidence in the disclosures being reported but embody different approaches and definitions. For example, the terms "Mineral Reserve", "Proven Mineral Reserve" and "Probable Mineral Reserve" are Canadian mining terms as defined in in NI 43-101, and these definitions differ from the definitions in Industry Guide 7. Under Industry Guide 7 standards, a "final" or "bankable" feasibility study is required to report reserves and the primary environmental analysis or report must be filed with the appropriate governmental authority. Further, under Industry Guide 7, mineralization may not be classified as "reserve" unless the determination has been made that the mineralization could be economically and legally produced or extracted at the time the reserve determination is made.
While the terms "Mineral Resource", "Measured Mineral Resource", "Indicated Mineral Resource" and "Inferred Mineral Resource" are defined in and required to be disclosed by NI 43-101, these terms are not defined terms under Industry Guide 7 and are normally not permitted to be used in reports and registration statements filed with the SEC. United States readers are cautioned not to assume that any part or all of mineral deposits in these categories will ever be converted into reserves. In addition, "Inferred Mineral Resources" have a great amount of uncertainty as to their existence and their economic and legal feasibility. A significant amount of exploration must be completed in order to determine whether an Inferred Mineral Resource may be upgraded to a higher category. Under Canadian regulations, estimates of Inferred Mineral Resources may not form the basis of feasibility or pre-feasibility studies, except in rare cases. United States readers are cautioned not to assume that all or any part of an Inferred Mineral Resource exists or is economically or legally mineable. Disclosure of "contained ounces" in a resource is permitted disclosure under Canadian regulations if such disclosure includes the grade or quality and the quantity for each category of Mineral Resource and Mineral Reserve; however, the SEC normally only permits issuers to report mineralization that does not constitute "reserves" by SEC standards as in place tonnage and grade without reference to unit measures.
Accordingly, information contained in this MD&A containing descriptions of Goldcorp’s mineral deposits may not be comparable to similar information made public by United States companies subject to the reporting and disclosure requirements under the United States federal securities laws and the rules and regulations thereunder.
GOLDCORP | 3
(in United States dollars, tabular amounts in millions, except where noted)
FINANCIAL AND OPERATIONAL HIGHLIGHTS FOR THE THREE MONTHS ENDED SEPTEMBER 30, 2018
Net loss was $101 million, or $0.12 per share. Results for the three months ended September 30, 2018 included a non-cash foreign currency translation loss of $0.04 per share. Operating results were impacted primarily by lower production of all metals at the Peñasquito mine due to lower throughput and planned lower grades from stockpiles during the commissioning of the now fully constructed Peñasquito Pyrite Leach Project. Operating cash flows and adjusted operating cash flows(1) for the three months ended September 30, 2018 were $193 million and $171 million, respectively, compared to $315 million and $308 million, respectively, for the three months ended September 30, 2017.
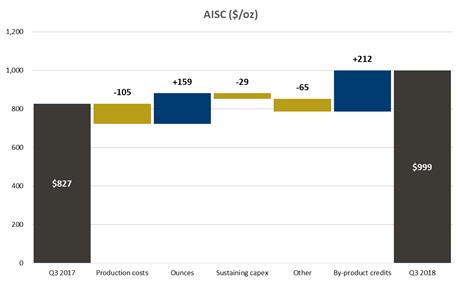
Gold production of 503,000 ounces at all-in sustaining costs(1) ("AISC") of $999 per ounce, compared to 633,000 ounces at AISC of $827 per ounce for the three months ended September 30, 2017. Goldcorp expects gold production and operating costs to improve substantially in the fourth quarter of 2018 to approximately 620,000 ounces of gold at AISC of approximately $750 per ounce as substantially all of Peñasquito’s production will come from higher grade ore from the main Peñasco pit, and Éléonore and Cerro Negro continue their ramp ups to optimum production rates.
Significant project milestones reached in support of the Company’s 20/20/20 growth plan and Beyond 20/20 program. Commissioning of the Peñasquito Pyrite Leach Project commenced, with first gold and commercial production expected in the fourth quarter of 2018. The Century Gold Project submitted its Associated Project Description to regulatory authorities in July 2018 and the Yukon Environmental and Socio-Economic Board deemed the Coffee Project adequate in August 2018.
An additional $30 million of sustainable annual efficiencies identified, bringing the Company closer to reaching its goal of achieving $350 million of sustainable annual efficiencies by the end of 2019. Building on the momentum from achieving $250 million of the efficiencies by mid-2018 and identifying the additional $30 million of efficiencies during the third quarter of 2018, work is underway across Goldcorp’s operations to identify the remaining opportunities that are expected to drive the Company towards realizing its 20/20/20 plan.
Proven and Probable Gold Mineral Reserves are 52.8 Million Ounces. Goldcorp’s mineral reserves increased at Musselwhite with the higher-grade extension of PQ Deeps and the addition of the WEL zone and at Cerro Negro, with an inaugural mineral reserve estimate at the Silica Cap. Overall mineral reserves additions at Goldcorp-operated sites essentially replaced depletion over the 12-month period.
(1) | The Company has included non-GAAP performance measures on an attributable (or Goldcorp's share) basis throughout this document. Adjusted operating cash flows and AISC per ounce are non-GAAP financial performance measures with no standardized definition under IFRS. For further information and detailed reconciliations, please see pages 34 - 43 of this MD&A. |
(2) | Refer to footnote (4) on page 19 of this MD&A regarding the Company's projection of AISC. |
GOLDCORP | 4
(in United States dollars, tabular amounts in millions, except where noted)
BUSINESS OVERVIEW
Goldcorp is a leading gold producer focused on responsible mining practices, with production from a portfolio of long-life, high quality assets throughout the Americas, which the Company believes positions it to deliver long-term value.
The Company’s principal producing mining properties are comprised of the Éléonore, Musselwhite, Porcupine and Red Lake mines in Canada; the Peñasquito mine in Mexico; the Cerro Negro mine in Argentina; and the Pueblo Viejo mine (40.0% interest) in the Dominican Republic. The Company's significant projects include the Borden, Century Gold and Coffee projects in Canada, and the NuevaUnión (50% interest) and Norte Abierto (50% interest) projects in Chile.
The Company’s current sources of operating cash flows are primarily from the sale of gold, silver, zinc, copper and lead. Goldcorp's principal product is refined gold bullion sold primarily in the London spot market. In addition to gold, the Company also produces silver, zinc, copper and lead primarily from concentrate produced at the Peñasquito mine, which is sold to third party smelters and refineries.
Goldcorp has an investment-grade credit rating, supported by a strong balance sheet, and remains 100% unhedged to gold sales, providing full exposure to gold prices.
STRATEGY
Goldcorp's vision is to create sustainable value for its stakeholders by growing net asset value ("NAV") per share to generate long-term shareholder value. With a portfolio of long-life, high quality assets that provide economies of scale, coupled with low AISC per ounce and underpinned by a strong balance sheet, Goldcorp has optimized its portfolio of assets and is reinvesting in a strong pipeline of organic opportunities to drive increasing margins and returns on investment.
In 2016, the Company outlined its 20/20/20 growth plan under which it expects to deliver a 20% increase in gold production, a 20% reduction in AISC per ounce and a 20% increase in gold reserves by 2021. In the first quarter of 2018, the Company introduced its Beyond 20/20 program, which is focused on the potential for organic growth through the development of the Company's long-term portfolio, such as the Century Gold Project at the Porcupine camp, NuevaUnión and Norte Abierto.
Goldcorp is committed to being a responsible steward of the environment and building collaborative partnerships with communities, governments and all other stakeholders for mutual success.
Goldcorp believes its strong balance sheet provides the Company with flexibility and the ability to manage the risk of gold and commodity price volatility. The Company's capital allocation strategy focuses on investing in its pipeline of organic growth opportunities, further debt reduction and returning capital to its shareholders by paying a sustainable dividend. Furthermore, Goldcorp leverages its exploration spending in the most efficient way possible through investments in junior mining companies.
CORPORATE DEVELOPMENTS
Advanced Project Pipeline
In 2016, the Company committed over one billion dollars of capital in a pipeline of organic growth opportunities, which are expected to support the growth in NAV of the Company by increasing production and decreasing AISC per ounce. During the third quarter of 2018, the Company continued to advance these organic growth opportunities and projects in the Company’s long-term portfolio, making significant progress on key permitting and project milestones. At Peñasquito, the Pyrite Leach Project ("PLP") completed construction, and pre-commissioning activities, together with area-based commissioning, commenced. First gold and commercial production are expected in the fourth quarter of 2018. The Carbon Pre-flotation plant, a component of the PLP which allows Peñasquito to process a variety of different ore sources, including significant amounts already in stockpiles, achieved commercial production on October 1, 2018. At Borden, bulk sample extraction began in August 2018, two months ahead of schedule, and operating permits are expected in the fourth quarter of 2018. The Company’s Century Gold Project advanced during the third quarter of 2018 with the submission of the Associated Project Description to the Canadian Environmental Assessment Agency and continued work on the optimized pre-feasibility study. Lastly, another significant project milestone was reached at the Coffee Project in August 2018 as the project was deemed adequate by the Yukon Environmental and Socio-economic Assessment Board. Engineering on the project continued to advance with 22% of engineering completed at the end of the third quarter of 2018; production is still expected to commence in 2021.
GOLDCORP | 5
(in United States dollars, tabular amounts in millions, except where noted)
Progress Towards Delivering $250 million of Sustainable Annual Efficiencies
Since announcing the program to achieve $250 million in annual sustainable efficiencies in 2016, the Company embarked upon numerous cost reduction and productivity improvement initiatives across the portfolio. The Company successfully executed these productivity and cost optimization programs, achieving $250 million in annual sustainable efficiencies by June 30, 2018. Building upon this momentum, the Company extended the program at the end of June 2018, targeting additional improvements of $100 million to be achieved by the end of 2019. During the third quarter of 2018, $30 million of efficiencies were identified and are expected to begin contributing to the program in early 2019. These initiatives are mainly related to operational improvements at Cerro Negro and cross-portfolio sourcing practices. Work is also underway across Goldcorp’s operations to define the projects that will contribute the remaining $70 million in sustainable annual efficiencies. Opportunities being evaluated include mobile equipment, crusher, and processing productivity improvements at Peñasquito, as well as trucking and material handling improvements at Éléonore. These initiatives are expected to continue to drive the Company towards its AISC and production goals.
Board Appointment
Mrs. Cristina Bitar was appointed to the Company’s Board of Directors on October 24, 2018. Mrs. Bitar is a senior partner at Azerta, a strategic communication and public affair agency in Chile and Peru. She has been elected nine times as one of 100 Leading Women in Chile by El Mercurio, a Chilean newspaper, and Mujeres Empresarias, a women's business leadership organization. She was awarded the Universidad del Pacífico’s Women of the XXI Century recognition, granted to professional women for their contributions in different sectors. Mrs. Bitar holds a BA in Economics and Sociology from Dartmouth College and an MBA from the Universidad de Chile and Tulane University. She is a Board member of the largest private pension fund in Chile, AFP Provida, a Metlife Company, a permanent columnist in La Segunda newspaper, a member of the Public Policy Council Libertad y Desarrollo, and a Founding and Council member of Comunidad Mujer, a non-governmental organization that promotes women's rights and gender equality. In addition, she is a professor in the Masters of Communications Degree program at the Universidad Adolfo Ibañez in Santiago, Chile. Since 2008, Mrs. Bitar has also been a member of the Young Global Leaders organization at the World Economic Forum.
MARKET OVERVIEW
Gold
The market price of gold is the primary driver of Goldcorp's profitability. The price of gold can fluctuate widely and is affected by a number of macroeconomic factors, including the sale or purchase of gold by central banks and financial institutions, interest rates, exchange rates, inflation or deflation, global and regional supply and demand and the political and economic conditions of major gold-producing and gold-consuming countries throughout the world.
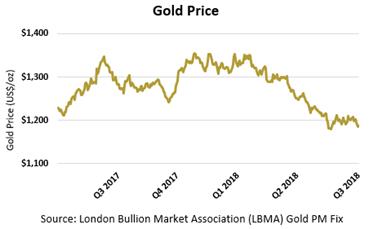
Following a disappointing second quarter of 2018, the price of gold started the third quarter of 2018 at $1,253 per ounce and rallied to $1,266 over the next week before selling pressure resumed. The price declined steadily until the middle of August when a quarterly low of $1,160 was registered before recovering to a price of $1,202 per ounce by the end of the month. The market traded in a tight range around $1,200 per ounce during September, ultimately closing the third quarter of 2018 at $1,193 per ounce, for an overall loss for the quarter of $60 per ounce, or 5%. On an attributable basis, the Company realized an average gold price of $1,205 per ounce in the third quarter of 2018, a 6% decrease compared to $1,287 per ounce in the third quarter of 2017, and a 7% decrease compared to $1,289 per ounce in the second quarter of 2018. Market expectations for further tightening of U.S. monetary policy
GOLDCORP | 6
(in United States dollars, tabular amounts in millions, except where noted)
throughout 2018 and 2019 is dampening the current price outlook for gold, however increasing trade and geopolitical tensions between the US and China could act to provide a degree of safe haven demand at current levels.
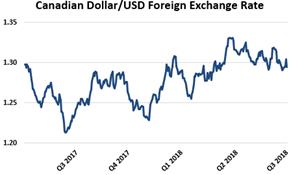
Currency Markets
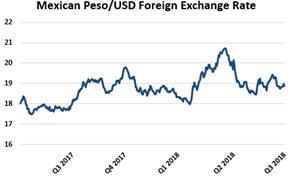
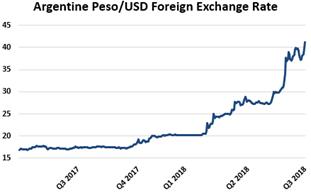
The results of Goldcorp's mining operations are affected by changes in the US dollar exchange rate compared to currencies of the countries in which Goldcorp has foreign operations. The Company has exposure to the Canadian dollar relating to its Éléonore, Musselwhite, Porcupine and Red Lake operations and the Coffee, Century Gold and Borden projects, exposure to the Mexican peso relating to its Peñasquito operation, exposure to the Argentine peso at its Cerro Negro operation, exposure to the Dominican Republic peso relating to its investment in Pueblo Viejo and exposure to the Chilean peso with respect to its NuevaUnión and Norte Abierto joint ventures.
Fluctuations in the US dollar can cause volatility of costs reported in US dollars. In addition, monetary assets and liabilities that are denominated in non-US dollar currencies, such as cash and cash equivalents and value-added taxes, are subject to currency risk. Goldcorp is further exposed to currency risk through non-monetary assets and liabilities of entities whose taxable profit or tax loss are denominated in non-US dollar currencies. Changes in exchange rates give rise to temporary differences resulting in deferred tax assets and liabilities with the resulting deferred tax charged or credited to income tax expense.
Goldcorp's financial risk management policy allows the hedging of foreign exchange exposure to reduce the risk associated with currency fluctuations. The Company enters into Mexican peso currency hedge contracts to purchase Mexican pesos at pre-determined US dollar amounts. These contracts are entered into to normalize operating expenses and capital expenditures at Peñasquito, expressed in US dollar terms.
Currency markets continued to experience general volatility during the third quarter of 2018. Movements in both the Canadian dollar and Mexican peso were largely influenced by expectations set by the United States government’s approach to trade policy renegotiations for NAFTA. A new tri-lateral agreement (USMCA) was negotiated at the end of the third quarter of 2018, and formally agreed to on October 1, 2018. Market optimism surrounding the deal allowed the Canadian dollar and Mexican peso to finish the quarter up 2% and 6%, respectively. The Bank of Canada is expected to continue its rate hiking schedule apace with the United States into 2019, limiting the impact of broad US dollar strength that has led to a general weakening of global currencies in 2018.
The Argentine peso’s rapid devaluation continued in the third quarter of 2018, losing a further 46% of its value during the quarter and reaching a new historic low of 41.25 on September 28, 2018. Macroeconomic concerns about the Argentine economy and debt sustainability of the Argentine Government drove the rapid devaluation of the currency during the quarter. The new set of macro policies under the new International Monetary Fund agreement, including the introduction of a temporary export tax and spending cuts to achieve a zero primary fiscal deficit in 2019, may help restore confidence to reduce concerns about financing needs and inflation expectations. Further, the Central Bank of Argentina introduced a new monetary policy framework to reduce inflation through a monetary targeting regime to replace inflation targeting as of October 1, 2018 with the objective of restoring credibility. The Central Bank will continue to intervene in the foreign exchange market to keep the Argentine peso within a band between USD/ARS of 34 to 44, adjusting on a daily basis at a 3% monthly pace between October 1, 2018 and year-end, before resetting the range next year.
GOLDCORP | 7
(in United States dollars, tabular amounts in millions, except where noted)
Foreign Exchange Rate Sources:
(a) | Canadian Dollar/USD: Bank of Canada Daily Average |
(b) | Mexican Peso/USD: Central Bank of Mexico Current Day Fixing |
(c) | Argentine Peso/USD: Central Bank of Argentina Current Day Fixing |
OVERVIEW OF QUARTERLY FINANCIAL AND OPERATING RESULTS
| | September 30 | | | June 30 | | | March 31 | | | December 31 | | | September 30 | |
| | 2018 | | | 2017 | | | 2018 | | | 2017 | | | 2018 | | | 2017 | | | 2017 | | | 2016 | | | 2017 | | | 2016 | |
Financial Results | | | | | | | | | | | | | | | | | | | | | | | | | | | | | | | | | | | | | | | | |
Revenues | | $ | 621 | | | $ | 866 | | | $ | 793 | | | $ | 822 | | | $ | 846 | | | $ | 882 | | | $ | 853 | | | $ | 898 | | | $ | 866 | | | $ | 915 | |
Net (loss) earnings | | $ | (101 | ) | | $ | 111 | | | $ | (131 | ) | | $ | 135 | | | $ | 67 | | | $ | 170 | | | $ | 242 | | | $ | 101 | | | $ | 111 | | | $ | 59 | |
Net (loss) earnings per share | | | | | | | | | | | | | | | | | | | | | | | | | | | | | | | | | | | | | | | | |
– Basic and diluted | | $ | (0.12 | ) | | $ | 0.13 | | | $ | (0.15 | ) | | $ | 0.16 | | | $ | 0.08 | | | $ | 0.20 | | | $ | 0.28 | | | $ | 0.12 | | | $ | 0.13 | | | $ | 0.07 | |
Operating cash flow | | $ | 193 | | | $ | 315 | | | $ | 158 | | | $ | 158 | | | $ | 271 | | | $ | 227 | | | $ | 511 | | | $ | 239 | | | $ | 315 | | | $ | 267 | |
Adjusted operating cash flow (1) | | $ | 171 | | | $ | 308 | | | $ | 310 | | | $ | 320 | | | $ | 350 | | | $ | 315 | | | $ | 401 | | | $ | 306 | | | $ | 308 | | | $ | 401 | |
Adjusted EBITDA (1) | | $ | 237 | | | $ | 400 | | | $ | 334 | | | $ | 432 | | | $ | 433 | | | $ | 427 | | | $ | 448 | | | $ | 477 | | | $ | 400 | | | $ | 491 | |
Expenditures on mining interests (cash basis) | | $ | 318 | | | $ | 291 | | | $ | 318 | | | $ | 233 | | | $ | 287 | | | $ | 186 | | | $ | 420 | | | $ | 217 | | | $ | 291 | | | $ | 168 | |
– Sustaining | | $ | 129 | | | $ | 143 | | | $ | 127 | | | $ | 133 | | | $ | 119 | | | $ | 113 | | | $ | 187 | | | $ | 145 | | | $ | 143 | | | $ | 112 | |
– Expansionary | | $ | 189 | | | $ | 148 | | | $ | 191 | | | $ | 100 | | | $ | 168 | | | $ | 73 | | | $ | 233 | | | $ | 72 | | | $ | 148 | | | $ | 56 | |
Dividends paid | | $ | 16 | | | $ | 15 | | | $ | 15 | | | $ | 16 | | | $ | 14 | | | $ | 15 | | | $ | 16 | | | $ | 16 | | | $ | 15 | | | $ | 14 | |
Operating Results (1) | | | | | | | | | | | | | | | | | | | | | | | | | | | | | | | | | | | | | | | | |
Gold produced (thousands of ounces) | | | 503 | | | | 633 | | | | 571 | | | | 635 | | | | 590 | | | | 655 | | | | 646 | | | | 761 | | | | 633 | | | | 715 | |
Gold sold (thousands of ounces) | | | 508 | | | | 606 | | | | 562 | | | | 649 | | | | 585 | | | | 646 | | | | 633 | | | | 768 | | | | 606 | | | | 686 | |
Silver produced (thousands of ounces) | | | 4,900 | | | | 7,000 | | | | 6,100 | | | | 7,400 | | | | 6,800 | | | | 7,100 | | | | 7,100 | | | | 7,400 | | | | 7,000 | | | | 7,700 | |
Zinc produced (thousands of pounds) | | | 63,400 | | | | 98,400 | | | | 77,500 | | | | 84,100 | | | | 88,700 | | | | 80,700 | | | | 96,500 | | | | 78,300 | | | | 98,400 | | | | 75,200 | |
Copper produced (thousands of pounds) | | | 3,200 | | | | 6,300 | | | | 6,600 | | | | 7,900 | | | | 5,400 | | | | 9,700 | | | | 4,500 | | | | 20,400 | | | | 6,300 | | | | 16,900 | |
Lead produced (thousands of pounds) | | | 27,500 | | | | 38,300 | | | | 26,800 | | | | 26,100 | | | | 27,000 | | | | 32,400 | | | | 36,500 | | | | 29,600 | | | | 38,300 | | | | 33,700 | |
Average realized gold price (per ounce) | | $ | 1,205 | | | $ | 1,287 | | | $ | 1,289 | | | $ | 1,256 | | | $ | 1,337 | | | $ | 1,236 | | | $ | 1,286 | | | $ | 1,181 | | | $ | 1,287 | | | $ | 1,333 | |
Cash costs: by-product (per ounce) (2) | | $ | 683 | | | $ | 483 | | | $ | 527 | | | $ | 510 | | | $ | 511 | | | $ | 540 | | | $ | 462 | | | $ | 481 | | | $ | 483 | | | $ | 554 | |
Cash costs: co-product (per ounce) (3) | | $ | 701 | | | $ | 663 | | | $ | 700 | | | $ | 644 | | | $ | 696 | | | $ | 701 | | | $ | 627 | | | $ | 619 | | | $ | 663 | | | $ | 657 | |
All-in sustaining costs (per ounce) | | $ | 999 | | | $ | 827 | | | $ | 850 | | | $ | 800 | | | $ | 810 | | | $ | 800 | | | $ | 870 | | | $ | 747 | | | $ | 827 | | | $ | 812 | |
(1) | The Company has presented the non-GAAP performance measures on an attributable (or Goldcorp's share) basis in the table above. Adjusted operating cash flows, Adjusted EBITDA, Cash cost by-product (per ounce) and AISC are non-GAAP financial performance measures with no standardized definition under IFRS. For further information and detailed reconciliations, please see pages 34 - 43 of this report. |
(2) | Total cash costs: by-product, per ounce, is calculated net of Goldcorp’s share of by-product sales revenues (by-product silver sales revenues for Cerro Negro, Marlin, prior to closure, and Pueblo Viejo; by-product lead, zinc and copper sales revenues and 75% of silver sales revenues for Peñasquito at market silver prices, and 25% of silver sales revenues for Peñasquito at $4.17 per silver ounce (2017 – $4.13 per silver ounce) sold to Wheaton Precious Metals Corp. ("Wheaton") and by-product copper sales revenues for Peñasquito and Alumbrera). |
(3) | Total cash costs: co-product, per ounce, is calculated by allocating Goldcorp’s share of production costs to each co-product (Alumbrera (copper); Marlin (silver); Pueblo Viejo (silver and copper); Peñasquito (silver, lead and zinc)) based on the ratio of actual sales volumes multiplied by budget metal prices (see page 35). |
GOLDCORP | 8
(in United States dollars, tabular amounts in millions, except where noted)
REVIEW OF THIRD QUARTER FINANCIAL RESULTS
Three months ended September 30, 2018 compared to the three months ended September 30, 2017
The net loss for the three months ended September 30, 2018 was $101 million, or $0.12 per share, compared to net earnings of $111 million, or $0.13 per share, for the three months ended September 30, 2017. The net loss in the third quarter of 2018 compared to net earnings in the same period in 2017 was primarily due to a decrease in production volumes, primarily at Peñasquito due to a planned transition from higher grade ore in the Peñasco pit, to lower grade ore from stockpiles, the impact of decreases in average gold and by-product metal prices and a decrease in deferred tax recoveries arising from changes in foreign exchange rates.
Net earnings and earnings per share for the three months ended September 30, 2018 and 2017 were affected by, among other things, the following significant non-cash or other items that management believes are not reflective of the performance of the underlying operations (items are denoted as having (increased)/decreased net earnings and net earnings per share in the three months ended September 30, 2018 and 2017):
| | Three months ended September 30, 2018 | | | Three months ended September 30, 2017 | |
(in millions, except per share) | | Pre-tax | | | After-tax | | | Per share ($/share) | | | Pre-tax | | | After-tax | | | Per share ($/share) | |
Non-cash foreign exchange losses (gains) on deferred tax balances and other | | $ | 1 | | | $ | 37 | | | $ | 0.04 | | | $ | 11 | | | $ | (30 | ) | | $ | (0.03 | ) |
Revenues
Three months ended September 30 | | 2018 (1) | | | 2017 (1) | | | Change | |
Gold | | | | | | | | | | | | |
Revenue (millions) | | $ | 477 | | | $ | 628 | | | | (24 | )% |
Ounces sold (thousands) | | | 395 | | | | 490 | | | | (19 | )% |
Average realized price ($/ounce) | | $ | 1,206 | | | $ | 1,287 | | | | (6 | )% |
Silver | | | | | | | | | | | | |
Revenue (millions) | | $ | 60 | | | $ | 90 | | | | (33 | )% |
Ounces sold (thousands) | | | 5,016 | | | | 6,780 | | | | (26 | )% |
Average realized price ($/ounce) | | $ | 12.51 | | | $ | 14.01 | | | | (11 | )% |
Zinc | | | | | | | | | | | | |
Revenue (millions) | | $ | 62 | | | $ | 117 | | | | (47 | )% |
Pounds sold (thousands) | | | 64,200 | | | | 92,400 | | | | (31 | )% |
Average realized price | | $ | 1.10 | | | $ | 1.43 | | | | (23 | )% |
Other metals | | | | | | | | | | | | |
Revenue (millions) | | $ | 22 | | | $ | 31 | | | | (29 | )% |
Total revenue (millions) | | $ | 621 | | | $ | 866 | | | | (28 | )% |
(1) | Excludes attributable share of revenues from the Company's associates. Revenues are shown net of applicable treatment and refining charges. |
Revenues for the third quarter of 2018 decreased by $245 million, or 28%, compared to the same period in 2017 primarily due to decreases in sales volumes of all metals, and decreases in the average realized price of gold and by-product metals. The decreases in gold and by-product metal volumes were primarily due to lower sales volumes at Peñasquito as a result of the planned transition from higher grade ore in the Peñasco pit, to lower grade ore from stockpiles.
GOLDCORP | 9
(in United States dollars, tabular amounts in millions, except where noted)

Production Costs
Production costs for the third quarter of 2018 decreased by $35 million, or 8%, when compared to the same period in 2017 primarily due to the following: the favourable impact from the devaluation of the Argentine peso at Cerro Negro, offset partly by inflation in Argentina and the impact of Cerro Negro’s continued ramp up; a decrease in production costs at Peñasquito resulting from continuing cost optimization efforts, despite the impact of market price increases for diesel and electricity; and a decrease in production costs at Porcupine due to the closure of the higher cost Dome Underground at the end of 2017 and productivity improvements at Hollinger open pit.
Depreciation and Depletion
Three months ended September 30 | | 2018 (1) | | | 2017 (1) | | | Change | |
Depreciation and depletion (millions) | | $ | 227 | | | $ | 250 | | | | (9 | )% |
Sales ounces (thousands) | | | 395 | | | | 490 | | | | (19 | )% |
Depreciation and depletion per ounce | | $ | 575 | | | $ | 510 | | | | 13 | % |
(1) | Excludes attributable share of depreciation and depletion from the Company's associates. |
Depreciation and depletion in the three months ended September 30, 2018 decreased by $23 million, or 9%, when compared to the same period in 2017 due to a decrease in sales volumes, offset partly by an increase in depreciation and depletion per ounce. The decrease in sales volumes was primarily due to lower sales volumes at Peñasquito whereas the increase in depreciation and depletion per ounce was mainly due to a higher depletable cost base at Peñasquito in 2018.
Share of Net Earnings Related to Associates and Joint Venture
The Company’s share of net earnings related to associates and joint venture decreased by $14 million in the three months ended September 30, 2018 compared to the same period in 2017 due to a decrease in net earnings from Pueblo Viejo. The decrease in net earnings from Pueblo Viejo was primarily due to higher production costs and depreciation and depletion. The increase in Pueblo Viejo’s production costs was due to the impact of higher fuel, power and maintenance costs whereas the increase in depreciation and depletion was due to the impact of the reversal of the previously recognized impairment in the fourth quarter of 2017.
Corporate Administration
Corporate administration expense decreased by $19 million in the three months ended September 30, 2018 compared to the same period in 2017 mainly due to the timing of expenses associated with corporate services being recharged to the Company’s operating sites. These services include strategic sourcing and procurement services, which were centralized at the beginning of fiscal 2018 as part of the Company’s program to realize $250 million in annual sustainable efficiencies, and information technology support services.
GOLDCORP | 10
(in United States dollars, tabular amounts in millions, except where noted)
Other Income/Expense
Other income of $5 million for the three months ended September 30, 2018 was comprised primarily of interest income on loans held with Pueblo Viejo.
Other expense of $1 million for the three months ended September 30, 2017 was comprised primarily of foreign exchange losses arising from value added tax receivables denominated in Argentine pesos, net of foreign exchange gains on Canadian dollar cash balances, offset partly by gains on dispositions of securities and interest income on loans held with Pueblo Viejo.
Income Tax Expense
The income tax expense of $16 million for the three months ended September 30, 2018 resulted in a negative 19% tax rate (three months ended September 30, 2017 - $19 million income tax recovery and a negative 21% tax rate) and was impacted primarily by currency translations. The impact of changes in foreign exchange rates on deferred tax balances, current tax balances and intra-group financing arrangements, and tax rate differences resulted in a $31 million income tax expense for the three months ended September 30, 2018 (three months ended September 30, 2017 - $53 million income tax recovery). Other items resulted in a $14 million income tax expense for the three months ended September 30, 2018 (three months ended September 30, 2017 - $16 million income tax expense).
Effective tax rate
The loss before income taxes of $85 million for the three months ended September 30, 2018 was impacted primarily by the following items: $6 million of non-deductible share-based compensation expense (three months ended September 30, 2017 - $5 million); $13 million of after-tax income related to associates and joint venture (primarily Pueblo Viejo) that are not subject to further income tax in the accounts of the Company (three months ended September 30, 2017 - $27 million); and $1 million of non-cash foreign exchange losses which are not subject to income tax (three months ended September 30, 2017 - $10 million).
After adjusting the income tax expense (recovery) and loss or earnings before income taxes, the effective income tax rate for the three months ended September 30, 2018 was 32% (three months ended September 30, 2017 – 23%).
AISC
AISC(1) per ounce was $999 for the three months ended September 30, 2018, compared to $827 per ounce for the three months ended September 30, 2017. The increase in AISC per ounce was due primarily to lower by-product credits ($212 per ounce) and lower gold sales ($159 per ounce), offset partly by lower production costs ($105 per ounce), lower G&A and exploration expenses ($65 per ounce), and lower sustaining capital ($29 per ounce). The decrease in by-product credits was primarily due to lower by-product sales volumes and prices for all metals. The decrease in gold sales was primarily due to lower sales at Peñasquito and Cerro Negro due to planned mine sequencing. The decrease in production costs was primarily due to the following: the favourable impact from the devaluation of the Argentine peso at Cerro Negro, offset partly by inflation in Argentina and the impact of Cerro Negro’s continued ramp up; a decrease in production costs at Peñasquito resulting from continuing cost optimization efforts, despite the impact of market price increases for diesel and electricity; and a decrease in production costs at Porcupine due to the closure of the higher cost Dome Underground at the end of 2017 and productivity improvements at Hollinger open pit. These decreases in production costs were offset by an increase in production costs at Pueblo Viejo due to higher fuel, power, and maintenance costs.
GOLDCORP | 11
(in United States dollars, tabular amounts in millions, except where noted)
(1) | AISC per ounce is a non-GAAP financial performance measure with no standardized definition under IFRS. For further information and detailed reconciliations, please see pages 34 - 43 of this report. |
GOLDCORP | 12
(in United States dollars, tabular amounts in millions, except where noted)
REVIEW OF THIRD QUARTER FINANCIAL RESULTS
Nine months ended September 30, 2018 compared to the nine months ended September 30, 2017
The net loss for the nine months ended September 30, 2018 was $165 million, or $0.19 per share, compared to net earnings of $416 million, or $0.48 per share, for the same period in 2017. The net loss for the nine months ended September 30, 2018, compared to net earnings in the same period in 2017, was primarily due to an increase in deferred tax expense arising from currency devaluations, particularly in Argentina, the impact of a decrease in production volumes, primarily due to mine sequencing at Peñasquito, offset partly by increases at Cerro Negro and Éléonore, a decrease in net earnings relating to the Company's investment in Pueblo Viejo and an increase in unrealized foreign exchange losses arising primarily on value added tax receivables denominated in local currencies as a result of the currency devaluations. These negative impacts to earnings were offset partly by the impact of more favourable treatment and refining charges and a 2% increase in the average realized gold price.
Net earnings and earnings per share for the nine months ended September 30, 2018 and 2017 were affected by, among other things, the following significant non-cash or other items that management believes are not reflective of the performance of the underlying operations (items are denoted as having (increased)/decreased net earnings and net earnings per share in the nine months ended September 30, 2018 and 2017):
| | Nine months ended September 30, 2018 | | | Nine months ended September 30, 2017 | |
(in millions, except per share) | | Pre-tax | | | After-tax | | | Per share ($/share) | | | Pre-tax | | | After-tax | | | Per share ($/share) | |
Non-cash foreign exchange losses (gains) on deferred tax balances and other | | $ | 21 | | | $ | 192 | | | $ | 0.22 | | | $ | (6 | ) | | $ | (152 | ) | | $ | (0.17 | ) |
Reduction in Goldcorp's share of Pueblo Viejo's earnings relating to settlement of a Dominican Republic tax audit | | $ | 17 | | | $ | 17 | | | $ | 0.02 | | | $ | - | | | $ | - | | | $ | - | |
Gain from reduction in provision for Alumbrera's reclamation costs | | $ | (30 | ) | | $ | (30 | ) | | $ | (0.03 | ) | | $ | (26 | ) | | $ | (26 | ) | | $ | (0.03 | ) |
Revenues
Nine months ended September 30 | | 2018 (1) | | | 2017 (1) | | | Change | |
Gold | | | | | | | | | | | | |
Revenue (millions) | | $ | 1,685 | | | $ | 1,916 | | | | (12 | )% |
Ounces sold (thousands) | | | 1,318 | | | | 1,526 | | | | (14 | )% |
Average realized price ($/ounce) | | $ | 1,281 | | | $ | 1,259 | | | | 2 | % |
Silver | | | | | | | | | | | | |
Revenue (millions) | | $ | 226 | | | $ | 282 | | | | (20 | )% |
Ounces sold (thousands) | | | 17,044 | | | | 20,730 | | | | (18 | )% |
Average realized price ($/ounce) | | $ | 13.75 | | | $ | 14.27 | | | | (4 | )% |
Zinc | | | | | | | | | | | | |
Revenue (millions) | | $ | 277 | | | $ | 296 | | | | (6 | )% |
Pounds sold (thousands) | | | 225,900 | | | | 266,600 | | | | (15 | )% |
Average realized price | | $ | 1.34 | | | $ | 1.31 | | | | 2 | % |
Other metals | | | | | | | | | | | | |
Revenue (millions) | | $ | 72 | | | $ | 76 | | | | (5 | )% |
Total revenue (millions) | | $ | 2,260 | | | $ | 2,570 | | | | (12 | )% |
(1) | Excludes attributable share of revenues from the Company's associates. Revenues are shown net of applicable treatment and refining charges. |
GOLDCORP | 13
(in United States dollars, tabular amounts in millions, except where noted)
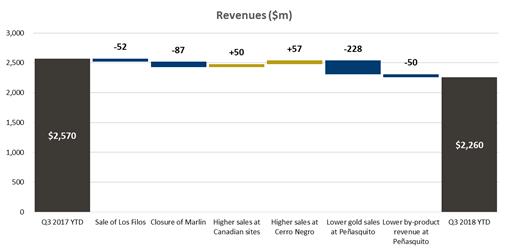
Revenues for the nine months ended September 30, 2018 decreased by $310 million, or 12%, compared to the same period in 2017 primarily due to decreases in gold, silver and zinc sales volumes of 14%, 18% and 15%, respectively, offset partly by a 2% increase in the average realized price of gold and lower treatment and refining charges. The decrease in gold sales volumes was primarily due to lower sales volumes at Peñasquito and the impacts of the sale of Los Filos and closure of Marlin in 2017, offset partly by higher gold sales volumes at Cerro Negro and Éléonore. The decrease in by-product revenues was due to lower silver sales volumes at Peñasquito due to the planned transition from higher grade ore in the Peñasco pit, to lower grade ore from stockpiles. Additionally, lower silver volumes resulted from the closure of Marlin in the second quarter of 2017 while the increases in gold sales volumes at Cerro Negro and Éléonore reflected their continued ramp ups.
Production Costs
Production costs for the nine months ended September 30, 2018 decreased by $105 million, or 7%, when compared to the same period in 2017 primarily due to the following: the favourable impact from the devaluation of the Argentine Peso at Cerro Negro, offset partly by inflation in Argentina; the closure of Marlin in the second quarter of 2017 ($61 million), the divestiture of Los Filos in April 2017 ($39 million); lower production costs at Peñasquito as a result of its cost optimization efforts, despite the impact of market price increases for diesel and electricity; and a decrease in production costs at Porcupine due to the closure of the higher cost Dome Underground at the end of 2017 and productivity improvements at Hollinger open pit. These decreases in production costs were offset partly by increases in production costs at Cerro Negro and Éléonore associated with their ramp ups.
Depreciation and Depletion
Nine months ended September 30 | | 2018 (1) | | | 2017 (1) | | | Change | |
Depreciation and depletion (millions) | | $ | 734 | | | $ | 735 | | | | 0 | % |
Sales ounces (thousands) | | | 1,318 | | | | 1,526 | | | | (14 | )% |
Depreciation and depletion per ounce | | $ | 557 | | | $ | 482 | | | | 16 | % |
(1) | Excludes attributable share of depreciation and depletion from the Company's associates. |
Depreciation and depletion for the nine months ended September 30, 2018 was consistent with the same period in 2017 as the impact of a decrease in sales volumes was offset by an increase in depreciation and depletion per ounce. The decrease in sales volumes was primarily due to the impacts of the sale of Los Filos in April 2017, the closure of Marlin in the second quarter of 2017, and lower sales volumes at Peñasquito, offset partly by higher sales volumes at Éléonore and Cerro Negro. The increase in depreciation and depletion per ounce was mainly due to a higher depletable cost base at Peñasquito in 2018.
GOLDCORP | 14
(in United States dollars, tabular amounts in millions, except where noted)
Share of Net Earnings Related to Associates and Joint Venture
Nine months ended September 30 | | 2018 | | | 2017 | | | Change | |
Pueblo Viejo | | $ | 33 | | | $ | 94 | | | | (65 | )% |
Alumbrera | | | 30 | | | | 33 | | | | (9 | )% |
NuevaUnión | | | (1 | ) | | | 1 | | | | (200 | )% |
Leagold | | | (2 | ) | | | — | | | | — | |
Share of net earnings related to associates and joint venture | | $ | 60 | | | $ | 128 | | | | (53 | )% |
The Company’s share of net earnings related to associates and joint venture decreased by $68 million in the nine months ended September 30, 2018 compared to the same period in 2017 primarily due to a $61 million decrease in net earnings from Pueblo Viejo. The decrease in net earnings from Pueblo Viejo was driven by lower revenues, an increase in tax expense arising from the settlement of a Dominican Republic tax audit, higher production costs due to the impact of higher fuel, power and maintenance costs and higher depreciation and depletion due to the impact of the reversal of the previously recognized impairment in the fourth quarter of 2017.
The Company’s share of net earnings related to Alumbrera in both the nine months ended September 30, 2018 and 2017 related to a reduction in the Company's provision to fund its share of Alumbrera’s reclamation costs, which was classified as Share of Net Earnings Related to Associates and Joint Venture. The reduction in the nine months ended September 30, 2018 reduced the provision to nil and was the result of improved operating cashflows associated with a 10-year extension of Alumbrera’s mine life which was approved in April 2018.
Other Income/Expense
Other income of $2 million for the nine months ended September 30, 2018 was comprised primarily of interest income on loans held with Pueblo Viejo and a gain associated with the dilution of the Company’s investment in Leagold to 12%, mostly offset by foreign exchange losses arising primarily on value added tax receivables denominated in Argentine pesos.
Other income of $22 million for the nine months ended September 30, 2017 was comprised primarily of interest income on loans held with Pueblo Viejo, gains on dispositions of investments in securities and foreign exchange gains arising primarily on cash balances denominated in Canadian dollars and Mexican pesos and value added tax receivables denominated in Mexican pesos, offset partly by foreign exchange losses on value added tax receivables denominated in Argentine pesos.
Income Tax Expense
The income tax expense of $176 million for the nine months ended September 30, 2018 resulted in a 1,600% tax rate (nine months ended September 30, 2017 - $124 million income tax recovery and a negative 42% tax rate) and was impacted primarily by currency translations. The impact of changes in foreign exchange rates on deferred tax balances, current tax balances and intra-group financing arrangements, and tax rate differences resulted in a $166 million income tax expense for the nine months ended September 30, 2018 (nine months ended September 30, 2017 - $179 million income tax recovery). Other items resulted in a $18 million income tax expense for the nine months ended September 30, 2018 (nine months ended September 30, 2017 - $9 million income tax recovery).
Effective tax rate
Earnings before income taxes of $11 million for the nine months ended September 30, 2018 was impacted primarily by the following items: $20 million of non-deductible share-based compensation expense (nine months ended September 30, 2017 - $22 million); $60 million of after-tax income related to associates and joint venture (primarily Pueblo Viejo and Alumbrera) that are not subject to further income tax in the accounts of the Company (nine months ended September 30, 2017 - $128 million); $13 million gain on the dilution of the Leagold equity investment which is not subject to income tax (nine months ended September 30, 2017 - $nil); and $21 million of non-cash foreign exchange losses which are not subject to income tax (nine months ended September 30, 2017 - $6 million of foreign exchange gains). Additionally, earnings before income taxes for the nine months ended September 30, 2017 was impacted by a $6 million loss on disposition of mining interest and a net impairment reversal of $3 million.
After adjusting the income tax expense (recovery) and loss or earnings before income taxes, the effective income tax rate for the nine months ended September 30, 2018 was 38% (nine months ended September 30, 2017 – 35%).
GOLDCORP | 15
(in United States dollars, tabular amounts in millions, except where noted)
AISC
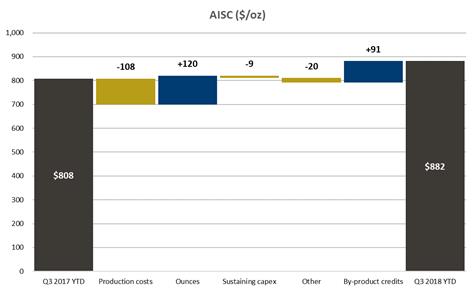
AISC(1) per ounce was $882 for the nine months ended September 30, 2018, compared to $808 per ounce for the nine months ended September 30, 2017. The increase in AISC per ounce was primarily due to lower gold sales ($120 per ounce) and lower by-product credits ($91 per ounce), offset partly by lower production costs ($108 per ounce) and lower corporate administration and exploration expenses ($20 per ounce). The decrease in gold sales was primarily due to lower sales at Peñasquito due to planned transition from higher grade ore in the Peñasco pit, to lower grade ore from stockpiles during 2018, and the impacts of the sale of Los Filos and closure of Marlin in the first half of 2017, offset partly by an increase in gold sales at Cerro Negro and Éléonore associated with their ramp ups. The decrease in by-product credits was primarily due to lower by-product sales for all metals, including the impact of the closure of Marlin and Alumbrera mining operations ending in August 2018, a 3% decrease in the average realized price of silver and a 2% decrease in the average realized price of lead, offset partly by a 2% increase in the average realized price of zinc. The decrease in production costs was primarily due to the following: the favourable impact from the devaluation of the Argentine Peso at Cerro Negro, offset partly by inflation in Argentina; the closure of Marlin and sale of Los Filos in 2017; lower production costs at Peñasquito as a result of its cost optimization efforts, despite the impact of market price increases for diesel and electricity; and a decrease in production costs at Porcupine due to the closure of the higher cost Dome Underground at the end of 2017 and productivity improvements at Hollinger open pit. These decreases in production costs were offset partly by increases in production costs at Cerro Negro and Éléonore associated with their ramp ups.
(1) | AISC per ounce is a non-GAAP financial performance measure with no standardized definition under IFRS. For further information and detailed reconciliations, please see pages 34 - 43 of this report. |
GOLDCORP | 16
(in United States dollars, tabular amounts in millions, except where noted)
LIQUIDITY AND CAPITAL RESOURCES
The following table summarizes Goldcorp's cash flow activity:
| | Three months ended September 30 | | | Nine months ended September 30 | |
| | 2018 | | | 2017 | | | 2018 | | | 2017 | |
Cash flow | | | | | | | | | | | | | | | | |
From continuing operations provided by operating activities | | $ | 193 | | | $ | 315 | | | $ | 622 | | | $ | 700 | |
From continuing operations used in investing activities | | | (328 | ) | | | (239 | ) | | | (882 | ) | | | (742 | ) |
From continuing operations provided by (used in) financing activities | | | 142 | | | | (1 | ) | | | 199 | | | | 20 | |
Increase (decrease) in cash and cash equivalents | | | 7 | | | | 75 | | | | (61 | ) | | | (22 | ) |
Cash and cash equivalents, beginning of period | | | 118 | | | | 80 | | | | 186 | | | | 157 | |
Increase in cash and cash equivalents reclassified as held for sale | | | — | | | | — | | | | — | | | | 20 | |
Cash and cash equivalents, end of period | | $ | 125 | | | $ | 155 | | | $ | 125 | | | $ | 155 | |
Cash flow provided by operating activities for the three months ended September 30, 2018 decreased by $122 million, compared to the same period in the prior year, primarily due to a decrease in production volumes, primarily at Peñasquito, and the impact of decreases in average realized metal prices.
The decrease in cash flow of $78 million provided by operating activities for the nine months ended September 30, 2018 compared to the same period in the prior year was primarily due to a decrease in production volumes, primarily at Peñasquito due to planned mine sequencing, offset partly by increases at Cerro Negro and Éléonore. The decrease in operating cash flow due to lower production volumes was offset partly by the impact of more favourable treatment and refining charges and a 2% increase in the average realized gold price.
The increase in cash flow used in investing activities for the three and nine months ended September 30, 2018 compared to the same periods in 2017 was primarily due to an increase in expenditures on mining interests of $40 million and $212 million, respectively, and net proceeds received in 2017 on the sale of Los Filos and Cerro Blanco, offset partly by cash used in connection with the acquisition of the Cerro Casale Project in 2017.
Expenditures on mining interests (including deposits on mining interest expenditures) were as follows:
| | Three months ended September 30 | | | Nine months ended September 30 | |
| | 2018 | | | 2017 | | | 2018 | | | 2017 | |
Éléonore | | $ | 21 | | | $ | 25 | | | $ | 52 | | | $ | 83 | |
Musselwhite | | | 20 | | | | 11 | | | | 62 | | | | 36 | |
Porcupine | | | 38 | | | | 24 | | | | 99 | | | | 74 | |
Red Lake | | | 16 | | | | 18 | | | | 57 | | | | 55 | |
Peñasquito | | | 132 | | | | 151 | | | | 411 | | | | 304 | |
Cerro Negro | | | 19 | | | | 20 | | | | 61 | | | | 58 | |
Other | | | 47 | | | | 16 | | | | 124 | | | | 56 | |
Total | | $ | 293 | | | $ | 265 | | | $ | 866 | | | $ | 666 | |
The increase in expenditures on mining interests during the three and nine months ended September 30, 2018 compared to the same periods in the prior year was due primarily to an increase in expansionary capital of $43 million and $229 million, respectively, related primarily to the construction of the PLP at Peñasquito.
Cash flow provided by financing activities for the three and nine months ended September 30, 2018 increased as compared to the same period in 2017 primarily due to net borrowings of $160 million and $250 million in the three and nine months ended September 30, 2018, respectively, as compared to net credit facility repayments of $976 million and $854 million in the same periods in 2017.
On March 14, 2018, the Company entered into three one-year non-revolving term loan agreements, totaling $400 million. The term loans bear interest at LIBOR plus 0.65%, reset monthly, and are repayable before March 14, 2019 without penalty. The proceeds from the term loans were used to repay the $500 million note that was due on March 15, 2018.
GOLDCORP | 17
(in United States dollars, tabular amounts in millions, except where noted)
On June 29, 2018, the Company completed the extension of its $3.0 billion credit facility term by one year to June 30, 2023. The unsecured, floating rate facility bears interest at LIBOR plus 140 basis points when drawn and 20 basis points on the undrawn amount, based on Goldcorp’s current bond ratings, and is intended to be used for liquidity and general corporate purposes.
At September 30, 2018, the Company's net debt and adjusted net debt(1) was $2.6 billion and $2.4 billion, respectively. At September 30, 2018, excluding cash and cash equivalents held at associates of $208 million, the Company had $2.82 billion of available liquidity, comprised of $166 million of cash and cash equivalents and short-term investments, and $2.65 billion available on its $3.0 billion credit facility.
The Company may from time to time seek to retire or repurchase its outstanding debt in open market purchases, privately negotiated transactions or otherwise. Such repurchases, if any, will depend upon prevailing market conditions, the Company's liquidity requirements, contractual restrictions and other factors. The amount of debt retired or repurchased may be material.
(1) | The Company has presented the non-GAAP performance measures on an attributable (or Goldcorp's share) basis. Adjusted net debt is a non-GAAP financial performance measure with no standardized definition under IFRS. For further information, please see pages 34 - 43 of this report. |
Outstanding Share Data
As at October 24, 2018, there were 869 million common shares of the Company issued and outstanding and 5 million stock options outstanding, which are exercisable into common shares at exercise prices ranging between C$20.27 per share to C$30.41 per share, and 3 million restricted share units outstanding.
GUIDANCE (1)
In the fourth quarter of 2018, Goldcorp expects to produce approximately 620,000 ounces of gold at AISC of approximately $750 per ounce and by-product cash costs of approximately $500 per ounce.
Complete production and cost guidance for fiscal 2018 is provided below.
Production Estimates (2) | | | | | | | | Units | | 2018E | |
Gold Production | | | | | | | | Moz | | | 2.28 | |
Silver Production | | | | | | | | Moz | | | 26 | |
Zinc Production | | | | | | | | Mlbs | | | 300 | |
Lead Production | | | | | | | | Mlbs | | | 125 | |
| | | | | | | | | | | | |
Costs Estimates (2, 3) | | | | | | | | Units | | 2018E | |
AISC (4) | | | | | | | | $/oz | | | 850 | |
By-product Cash Costs | | | | | | | | $/oz | | | 550 | |
| | | | | | | | | | | | |
Capital Expenditures Estimates | | | | | | | | Units | | 2018E | |
Sustaining Capital (2, 5) | | | | | | | | $M | | | 550 | |
Expansionary Capital (2, 5) | | | | | | | | $M | | | 750 | |
Other 2018 Estimates | | 2018E |
Corporate Administration ($M) (including non-cash stock compensation of $40M) | | $140 |
Exploration ($M) (2, 6) | | $125 |
Depreciation and depletion ($/oz) (2) | | $485 |
Tax rate (2) | | 45 - 50% |
Overall metal production and AISC are expected to be in line with previous projections to 2021, according to the Company’s 20/20/20 plan. In addition, gold mineral reserves are expected to increase by 20% to 60 million ounces by 2021 supported by the exploration potential and ongoing programs across the Company's operating assets, joint ventures and projects.
(1) | Guidance projections (“Guidance”) are considered “forward-looking statements” and represent management’s good faith estimates or expectations of future production results as of the date hereof. Guidance is based upon certain assumptions, including, but not limited to, metal prices, fuel prices, certain exchange rates and other assumptions. Such assumptions may prove to be incorrect and actual results may differ materially from those anticipated. Consequently, Guidance cannot be guaranteed. As such, investors are cautioned not to place undue reliance upon Guidance and forward-looking statements as there can be |
GOLDCORP | 18
(in United States dollars, tabular amounts in millions, except where noted)
| no assurance that the plans, assumptions or expectations upon which they are placed will occur. See the "Cautionary Statement Regarding Forward-Looking Statements". |
(2) | The Company has presented the non-GAAP performance measures on an attributable (or Goldcorp's share) basis. AISC per ounce and cash costs: by-product are non-GAAP financial performance measures with no standardized definition under IFRS. For further information, please see pages 34 - 43 of this report. |
(3) | The assumptions below were used to forecast total cash costs through the end of 2018: |
| | | | 2018 |
Gold (oz) | | | | $1,200 |
Silver (oz) | | | | $14.45 |
Copper (lb) | | | | $2.80 |
Zinc (lb) | | | | $1.15 |
Lead (lb) | | | | $0.90 |
Foreign exchange (respectively to the US$) | | | | |
Canadian dollar | | | | $1.30 |
Mexican peso | | | | $19.00 |
(4) | The Company’s projected AISC are not based on GAAP total production cash costs, which forms the basis of the Company’s cash costs: by-product. The projected range of AISC is anticipated to be adjusted to include sustaining capital expenditures, corporate administrative expense, mine-site exploration and evaluation costs and reclamation cost accretion and amortization and exclude the effects of expansionary capital and non-sustaining expenditures. Projected GAAP total production cash costs for the full year would require inclusion of the projected impact of future included and excluded items, including items that are not currently determinable, but may be significant, such as sustaining capital expenditures, reclamation cost accretion and amortization. Due to the uncertainty of the likelihood, amount and timing of any such items, the Company does not have information available to provide a quantitative reconciliation of projected AISC to a total production cash costs projection. |
(5) | Excludes capitalized exploration costs (see footnote 6). Expansionary capital includes capital costs for those projects which are in execution and/or have an approved feasibility study. Projects without an approved feasibility study only include capital costs to the next stage gate. |
(6) | Approximately 40% of exploration spending is expected to be expensed and approximately 60% is expected to be capitalized. Approximately 50% of exploration spending is considered sustaining and approximately 50% is considered expansionary. |
GOLDCORP | 19
(in United States dollars, tabular amounts in millions, except where noted)
OPERATIONAL REVIEW
The Company’s principal producing mining properties are comprised of the Éléonore, Musselwhite, Porcupine and Red Lake mines in Canada; the Peñasquito mine in Mexico; the Cerro Negro mine in Argentina; and the Pueblo Viejo mine (40.0% interest) in the Dominican Republic.
Operating results of operating segments are reviewed by the Company's chief operating decision maker to make decisions about resources to be allocated to the segments and to assess their performance. The Company considers each individual operating mine as an operating segment for financial reporting purposes except for Alumbrera and Leagold as their financial results do not meet the quantitative threshold required for segment disclosure purposes. As a result, Alumbrera and Leagold are included in Other mines. The operating results presented below include the results of Leagold up to May 24, 2018, the date on which the Company ceased to have significant influence over Leagold and no longer recognized Leagold as an investment in associate. Subsequent to May 24, 2018, the Company’s investment in Leagold is accounted for as an equity security.
The Company’s 100% interest in the HG Young Project is included in the Red Lake reporting operating segment while the Borden and Century projects are included in the Porcupine reportable operating segments. The Company's 50% interests in the NuevaUnión and Norte Abierto projects in Chile, and 100% interest in the Coffee project in the Yukon, are included in Other mines.
The Company’s principal product is gold bullion which is sold primarily in the London spot market. Concentrate produced at Peñasquito and Alumbrera, containing both gold and by-product metals, is sold to third party smelters and traders.
Segmented Financial and Operating Highlights
Three months ended September 30 | Revenue ($ millions) | | Gold produced (000's of ounces) | | Gold sold (000's of ounces) | | Total cash costs: by- product ($/oz) (1), (4) | | AISC ($/oz) (3), (4) | | Earnings (loss) from mine operations ($ millions) | |
Peñasquito | 2018 | | 193 | | | 38 | | | 50 | | | 958 | | | 1,968 | | | (55 | ) |
| 2017 | | 395 | | | 133 | | | 133 | | | (168 | ) | | 288 | | | 120 | |
Cerro Negro | 2018 | | 135 | | | 96 | | | 103 | | | 459 | | | 520 | | | 14 | |
| 2017 | | 166 | | | 115 | | | 118 | | | 510 | | | 712 | | | 19 | |
Pueblo Viejo (4) | 2018 | | 129 | | | 101 | | | 99 | | | 507 | | | 738 | | | 42 | |
| 2017 | | 128 | | | 101 | | | 95 | | | 452 | | | 612 | | | 70 | |
Red Lake | 2018 | | 64 | | | 67 | | | 52 | | | 822 | | | 1,092 | | | 7 | |
| 2017 | | 49 | | | 43 | | | 38 | | | 981 | | | 1,417 | | | (6 | ) |
Éléonore | 2018 | | 103 | | | 86 | | | 86 | | | 737 | | | 902 | | | (3 | ) |
| 2017 | | 95 | | | 77 | | | 74 | | | 802 | | | 1,067 | | | 3 | |
Porcupine | 2018 | | 71 | | | 59 | | | 58 | | | 754 | | | 996 | | | 3 | |
| 2017 | | 89 | | | 75 | | | 70 | | | 758 | | | 978 | | | 3 | |
Musselwhite | 2018 | | 55 | | | 45 | | | 46 | | | 794 | | | 983 | | | 8 | |
| 2017 | | 72 | | | 58 | | | 57 | | | 587 | | | 674 | | | 28 | |
Other mines (2) | 2018 | | 26 | | | 11 | | | 14 | | | 1,094 | | | 1,239 | | | 16 | |
| 2017 | | 42 | | | 31 | | | 21 | | | 1,361 | | | 1,611 | | | (19 | ) |
Other (3) | 2018 | | — | | | — | | | — | | | — | | | 54 | | | (5 | ) |
| 2017 | | — | | | — | | | — | | | — | | | 78 | | | (8 | ) |
Attributable segment total (4) | 2018 | | 776 | | | 503 | | | 508 | | | 683 | | | 999 | | | 27 | |
| 2017 | | 1,036 | | | 633 | | | 606 | | | 483 | | | 827 | | | 210 | |
Less associates and joint venture | 2018 | | (155 | ) | | (112 | ) | | (113 | ) | | (576 | ) | | (798 | ) | | (57 | ) |
| 2017 | | (170 | ) | | (132 | ) | | (116 | ) | | (617 | ) | | (793 | ) | | (53 | ) |
Total - Consolidated | 2018 | | 621 | | | 391 | | | 395 | | | 713 | | | 1,056 | | | (30 | ) |
| 2017 | | 866 | | | 501 | | | 490 | | | 451 | | | 835 | | | 157 | |
GOLDCORP | 20
(in United States dollars, tabular amounts in millions, except where noted)
Nine months ended September 30 | Revenue ($ millions) | | Gold produced (000's of ounces) | | Gold sold (000's of ounces) | | Total cash costs: by- product ($/oz) (1), (4) | | AISC ($/oz) (3), (4) | | Earnings (loss) from mine operations ($ millions) | |
Peñasquito | 2018 | | 808 | | | 209 | | | 220 | | | (7 | ) | | 681 | | | 48 | |
| 2017 | | 1,086 | | | 393 | | | 404 | | | (18 | ) | | 336 | | | 306 | |
Cerro Negro | 2018 | | 493 | | | 343 | | | 350 | | | 438 | | | 550 | | | 90 | |
| 2017 | | 436 | | | 322 | | | 313 | | | 487 | | | 689 | | | 52 | |
Pueblo Viejo (4) | 2018 | | 387 | | | 277 | | | 280 | | | 483 | | | 653 | | | 145 | |
| 2017 | | 403 | | | 311 | | | 304 | | | 403 | | | 525 | | | 230 | |
Red Lake | 2018 | | 209 | | | 189 | | | 163 | | | 887 | | | 1,152 | | | 16 | |
| 2017 | | 189 | | | 150 | | | 150 | | | 879 | | | 1,206 | | | (5 | ) |
Éléonore | 2018 | | 302 | | | 238 | | | 237 | | | 849 | | | 1,001 | | | (19 | ) |
| 2017 | | 269 | | | 221 | | | 214 | | | 846 | | | 1,115 | | | (9 | ) |
Porcupine | 2018 | | 245 | | | 191 | | | 190 | | | 750 | | | 965 | | | 24 | |
| 2017 | | 241 | | | 196 | | | 192 | | | 791 | | | 1,012 | | | - | |
Musselwhite | 2018 | | 203 | | | 154 | | | 158 | | | 715 | | | 891 | | | 56 | |
| 2017 | | 210 | | | 169 | | | 168 | | | 652 | | | 789 | | | 70 | |
Other mines (2) | 2018 | | 114 | | | 63 | | | 57 | | | 954 | | | 1,024 | | | 29 | |
| 2017 | | 296 | | | 161 | | | 156 | | | 839 | | | 936 | | | 4 | |
Other (3) | 2018 | | — | | | — | | | — | | | — | | | 77 | | | (19 | ) |
| 2017 | | — | | | — | | | — | | | — | | | 70 | | | (19 | ) |
Attributable segment total (4) | 2018 | | 2,761 | | | 1,664 | | | 1,655 | | | 569 | | | 882 | | | 370 | |
| 2017 | | 3,130 | | | 1,923 | | | 1,901 | | | 512 | | | 808 | | | 629 | |
Less associates and joint venture | 2018 | | (501 | ) | | (340 | ) | | (337 | ) | | (563 | ) | | (716 | ) | | (174 | ) |
| 2017 | | (560 | ) | | (389 | ) | | (375 | ) | | (509 | ) | | (635 | ) | | (229 | ) |
Total - Consolidated | 2018 | | 2,260 | | | 1,324 | | | 1,318 | | | 571 | | | 924 | | | 196 | |
| 2017 | | 2,570 | | | 1,534 | | | 1,526 | | | 512 | | | 851 | | | 400 | |
| (1) | Total cash costs: by-product, per ounce, is calculated net of Goldcorp’s share of by-product sales revenues (by-product copper sales revenues for Alumbrera; by-product silver sales revenues for Marlin and Pueblo Viejo; and by-product lead and zinc sales revenues and 75% of silver sales revenues for Peñasquito at market silver prices, and 25% of silver sales revenues for Peñasquito at $4.17 per silver ounce (2017 – $4.13 per silver ounce) sold to Wheaton). If silver, copper, lead and zinc were treated as co-products, total cash costs for the three and nine months ended September 30, 2018 would have been $701 and $701 per ounce of gold, respectively (three and nine months ended September 30, 2017 – $663 and $669, respectively). Production costs are allocated to each co-product based on the ratio of actual sales volumes multiplied by budget metal prices (see page 35). |
| (2) | As described above, the Company's investments in Alumbrera and Leagold, up to May 24, 2018, the date on which the Company ceased to have significant influence over Leagold, have been included in 'Other' for segment reporting purposes. They have been disclosed separately in these tables, in 'Other mines', along with Los Filos up to the date of its disposal on April 7, 2017 and Marlin up to the date of its closure in the second quarter of 2017, to provide visibility into the impact of the Company's corporate administration expense on AISC. |
| (3) | For the purpose of calculating AISC, the Company has included corporate administration expense, capital expenditures incurred at the Company's regional and head corporate offices and regional office exploration expense as corporate AISC in the "Other" category. These costs are not allocated to the individual mine sites as the Company measures its operations' performance on AISC directly incurred at the mine site. AISC for Other was calculated using total corporate expenditures and the Company's total attributable gold sales ounces. |
| (4) | The Company has included certain non-GAAP performance measures including the Company’s share of the applicable production, sales and financial information of Pueblo Viejo, Alumbrera, Leagold and NuevaUnión throughout this document. Total cash costs: by-product and AISC are non-GAAP performance measures with no standardized definition under IFRS. For further information and detailed reconciliations, please see pages 34 - 43 of this report. |
GOLDCORP | 21
(in United States dollars, tabular amounts in millions, except where noted)
OPERATIONAL REVIEW
Peñasquito, Mexico (100%-owned)
| | Three months ended September 30 | | Nine months ended September 30 |
Operating Data | | 2018 | | | 2017 | | | Change | | 2018 | | | 2017 | | | Change |
Tonnes of ore milled (thousands) | | | 8,274 | | | | 9,251 | | | (11)% | | | 26,318 | | | | 27,501 | | | (4)% |
Mill head grade | | | | | | | | | | | | | | | | | | | | |
Gold grade (grams/tonne) | | | 0.29 | | | | 0.71 | | | (59)% | | | 0.42 | | | | 0.73 | | | (42)% |
Silver grade (grams/tonne) | | | 21.24 | | | | 26.31 | | | (19)% | | | 21.83 | | | | 23.18 | | | (6)% |
Lead grade | | 0.25% | | | 0.26% | | | (4)% | | 0.21% | | | 0.23% | | | (9)% |
Zinc grade | | 0.53% | | | 0.69% | | | (23)% | | 0.57% | | | 0.63% | | | (10)% |
Mill Recovery Rate | | | | | | | | | | | | | | | | | | | | |
Gold recovery | | 51% | | | 70% | | | (27)% | | 61% | | | 67% | | | (9)% |
Silver recovery | | 74% | | | 84% | | | (12)% | | 81% | | | 82% | | | (1)% |
Lead recovery | | 62% | | | 77% | | | (19)% | | 71% | | | 75% | | | (5)% |
Zinc recovery | | 78% | | | 82% | | | (5)% | | 81% | | | 81% | | | — % |
Payable Metal Produced | | | | | | | | | | | | | | | | | | | | |
Gold (thousands of ounces) | | | 38 | | | | 133 | | | (71)% | | | 209 | | | | 393 | | | (47)% |
Silver (thousands of ounces) | | | 3,618 | | | | 5,837 | | | (38)% | | | 13,234 | | | | 16,004 | | | (17)% |
Lead (thousands of pounds) | | | 27,500 | | | | 38,300 | | | (28)% | | | 81,300 | | | | 96,800 | | | (16)% |
Zinc (thousands of pounds) | | | 63,400 | | | | 98,400 | | | (36)% | | | 229,600 | | | | 263,200 | | | (13)% |
Payable Metal Sold | | | | | | | | | | | | | | | | | | | | |
Gold (thousands of ounces) | | | 50 | | | | 133 | | | (62)% | | | 220 | | | | 404 | | | (46)% |
Silver (thousands of ounces) | | | 4,204 | | | | 5,910 | | | (29)% | | | 14,093 | | | | 16,411 | | | (14)% |
Lead (thousands of pounds) | | | 29,900 | | | | 36,200 | | | (17)% | | | 82,500 | | | | 94,800 | | | (13)% |
Zinc (thousands of pounds) | | | 64,200 | | | | 92,400 | | | (31)% | | | 225,900 | | | | 266,600 | | | (15)% |
Total Cash Costs: By-product (per ounce) | | $ | 958 | | | $ | (168 | ) | | 670 % | | $ | (7 | ) | | $ | (18 | ) | | 61 % |
Total Cash Costs: Co-product (per ounce) | | $ | 939 | | | $ | 664 | | | 41 % | | $ | 772 | | | $ | 645 | | | 20 % |
AISC (per ounce) | | $ | 1,968 | | | $ | 288 | | | 583 % | | $ | 681 | | | $ | 336 | | | 103 % |
Financial Data (in millions) | | | | | | | | | | | | | | | | | | | | |
Revenues (1) | | $ | 193 | | | $ | 395 | | | (51)% | | $ | 808 | | | $ | 1,086 | | | (26)% |
Production costs | | $ | 175 | | | $ | 198 | | | (12)% | | $ | 522 | | | $ | 564 | | | (7)% |
Depreciation and depletion | | $ | 73 | | | $ | 77 | | | (5)% | | $ | 238 | | | $ | 216 | | | 10 % |
Earnings (loss) from mine operations | | $ | (55 | ) | | $ | 120 | | | (146)% | | $ | 48 | | | $ | 306 | | | (84)% |
Expenditures on mining interests (cash basis) | | $ | 134 | | | $ | 152 | | | (12)% | | $ | 416 | | | $ | 308 | | | 35 % |
– Sustaining | | $ | 49 | | | $ | 58 | | | (16)% | | $ | 141 | | | $ | 135 | | | 4 % |
– Expansionary | | $ | 85 | | | $ | 94 | | | (10)% | | 275 | | | $ | 173 | | | 59 % |
| (1) | Includes 25% of silver ounces sold to Wheaton at $4.17 per ounce (2017 – $4.13 ounce). The remaining 75% of silver ounces are sold at market rates. |
GOLDCORP | 22
(in United States dollars, tabular amounts in millions, except where noted)
Third Quarter Operating and Financial Highlights
Gold production for the three and nine months ended September 30, 2018 was lower than the same periods in the prior year as a result of the planned transition from higher grade ore in the Peñasco pit to lower grade ore from stockpiles during 2018. This transition facilitated the stripping campaign in the Peñasco pit and the pre-stripping campaign in the newly developed Chile Colorado pit. Production in the third quarter of 2018 was impacted by a reduction in mill throughput as much harder low-grade stockpiles were processed during commissioning of the Carbon Pre-flotation plant (“CPP”), a component of the PLP. The CPP commissioning proceeded as planned and the circuit is successfully treating high-carbon ore, with focus now moving to optimization of the circuit in anticipation of improving concentrate quality. On October 1, 2018, the Company achieved commercial production for the CPP.
In the fourth quarter of 2018, following commissioning of the PLP and the commencement of mining in the Chile Colorado pit, higher grade ore and higher mill tonnes are planned. Compared to the third quarter of 2018, the Company expects fourth quarter 2018 tonnes milled to be approximately 15% higher, with gold, silver, lead, and zinc grades increasing by approximately 45%, 50%, 10%, and 10%, respectively.
Losses from mine operations for the three months ended September 30, 2018 compared to earnings from mine operations in the same period in the prior year arose primarily due to lower revenues, offset partly by lower production costs and depreciation and depletion. Earnings from mine operations for the nine months ended September 30, 2018 were lower than the same period in the prior year primarily due to lower revenues and higher depreciation and depletion, offset partly by lower production costs. Production costs for the three and nine months ended September 30, 2018 were lower compared to the same periods in the prior year primarily due to continuing cost optimization efforts, despite the impact of market price increases for diesel and electricity. Depreciation and depletion for the three months ended September 30, 2018 was lower primarily due to lower gold sales volumes, offset partly by a higher depletable cost base in 2018. Depreciation and depletion for the nine months ended September 30, 2018 was higher primarily due to a higher depletable cost base in 2018.
AISC per ounce for the three and nine months ended September 30, 2018 was higher than the same periods in the prior year due to lower gold sales volume and lower by-product metal credits, offset partly by lower sustaining capital expenditures and lower concentrate treatment and refining charges. Provisional pricing adjustments on by-product metal credits had a negative impact of $7 million during the third quarter of 2018, or $140 per ounce, on Peñasquito’s AISC in the third quarter of 2018.
Expansionary capital related to the PLP (see the Project Pipeline section below) and Chile Colorado pre-stripping, both of which are expected to be completed during the fourth quarter of 2018.
GOLDCORP | 23
(in United States dollars, tabular amounts in millions, except where noted)
Cerro Negro, Argentina (100%-owned)
| | Three months ended September 30 | | Nine months ended September 30 |
Operating Data | | 2018 | | | 2017 | | | Change | | 2018 | | | 2017 | | | Change |
Tonnes of ore milled (thousands) | | | 269 | | | | 260 | | | 3 % | | | 785 | | | | 767 | | | 2 % |
Gold mill head grade (grams/tonne) | | | 10.75 | | | | 14.32 | | | (25)% | | | 13.61 | | | | 13.47 | | | 1 % |
Silver mill head grade (grams/tonne) | | | 97.23 | | | | 123.27 | | | (21)% | | | 130.47 | | | | 116.76 | | | 12 % |
Gold recovery rate | | 97% | | | 96% | | | 1 % | | 96% | | | 96% | | | — % |
Silver recovery rate | | 83% | | | 83% | | | — % | | 85% | | | 86% | | | (1)% |
Gold Produced (thousands of ounces) | | | 96 | | | | 115 | | | (17)% | | | 343 | | | | 322 | | | 7 % |
Silver Produced (thousands of ounces) | | | 774 | | | | 836 | | | (7)% | | | 2,942 | | | | 2,425 | | | 21 % |
Gold Sold (thousands of ounces) | | | 103 | | | | 118 | | | (13)% | | | 350 | | | | 313 | | | 12 % |
Silver Sold (thousands of ounces) | | | 812 | | | | 870 | | | (7)% | | | 2,951 | | | | 2,360 | | | 25 % |
Total Cash Costs: By-product (per ounce) | | $ | 459 | | | $ | 510 | | | (10)% | | $ | 438 | | | $ | 487 | | | (10)% |
Total Cash Costs: Co-product (per ounce) | | $ | 510 | | | $ | 568 | | | (10)% | | $ | 506 | | | $ | 550 | | | (8)% |
AISC (per ounce) | | $ | 520 | | | $ | 712 | | | (27)% | | $ | 550 | | | $ | 689 | | | (20)% |
Financial Data (in millions) | | | | | | | | | | | | | | | | | | | | |
Revenues | | $ | 135 | | | $ | 166 | | | (19)% | | $ | 493 | | | $ | 436 | | | 13 % |
Production costs | | $ | 63 | | | $ | 75 | | | (16)% | | $ | 204 | | | $ | 194 | | | 5 % |
Depreciation and depletion | | $ | 58 | | | $ | 72 | | | (19)% | | $ | 199 | | | $ | 190 | | | 5 % |
Earnings from mine operations | | $ | 14 | | | $ | 19 | | | (26)% | | $ | 90 | | | $ | 52 | | | 73 % |
Expenditures on mining interests (cash basis) | | $ | 19 | | | $ | 20 | | | (5)% | | $ | 61 | | | $ | 58 | | | 5 % |
– Sustaining | | $ | 5 | | | $ | 16 | | | (69)% | | $ | 35 | | | $ | 50 | | | (30)% |
– Expansionary | | $ | 14 | | | $ | 4 | | | 250 % | | $ | 26 | | | $ | 8 | | | 225 % |
GOLDCORP | 24
(in United States dollars, tabular amounts in millions, except where noted)
Third Quarter Operating and Financial Highlights
Gold production for the three months ended September 30, 2018 was lower than the same period in the prior year primarily due to planned lower mill grades as a result of mine sequencing in Mariana Central and Eureka, offset partly by continued improved dilution control and higher tonnes milled as mine production continues to ramp up. The mine tonnage run rate for September was in excess of 3,100 tonnes of ore per day, while maintaining development rates consistent with prior quarters. Gold production for the nine months ended September 30, 2018 was higher than the same period in the prior year primarily due to higher tonnes milled, and a 13% increase in development rates compared to the same period in the prior year. Management expects continued ramp up to achieve nominal run rates of 4,000 tonnes per day to the mill by the end of 2018, supported by the commencement of an auxiliary shift at the beginning of October. To date, this additional shift has resulted in an increase of approximately 600 tonnes of mined ore per day. Compared to the third quarter of 2018, the Company expects fourth quarter 2018 tonnes milled to be approximately 25% higher, with gold and silver grades increasing by approximately 30% and 40%, respectively.
Mariana Norte development and underground infrastructure was prioritized during the third quarter of 2018, with ramp breakthrough achieved on August 27, 2018. Development of the Emilia vein will continue for the remainder of 2018 and into the third quarter of 2019. Both development projects are expected to commence production in 2019, supplementing declining Eureka production. Excavation and portal infrastructure construction at the San Marcos portal was initiated in the third quarter of 2018, in anticipation of commencement of underground development during the first quarter of 2019. Detailed planning work is underway on the integration of the existing Bajo Negro deposit with the new Silica Cap and Gato Salvaje deposits, upon which initial reserves have now been declared. These deposits make up the Eastern District mining complex of Cerro Negro upon which initial development is expected to begin in 2019. A concept study to define optimization options for the mine is expected to be completed in the fourth quarter of 2018, including potential mine and mill expansions and grade optimization scenarios.
Earnings from mine operations for the three months ended September 30, 2018 were lower than the same period in the prior year due to lower revenues, offset partly by lower production costs and lower depreciation and depletion. Earnings from mine operations for the nine months ended September 30, 2018 were higher than the same period in the prior year due to higher revenues, offset partly by higher production costs and depreciation and depletion due to the higher sales volumes. Production costs and depreciation and depletion for the three months ended September 30, 2018 were lower than the same period in the prior year primarily due to the lower sales volumes and currency fluctuations. Production costs during 2018 have been favourably impacted by devaluation of the Argentine Peso, offset partly by inflation in Argentina.
AISC per ounce for the three and nine months ended September 30, 2018 was lower than the same periods in the prior year. In the three months ended September 30, 2018, this was due to a decrease in production costs and sustaining capital expenditures, offset partly by lower gold sales. In the nine months ended September 30, 2018, this was due to higher gold sales and lower sustaining capital expenditures, offset partly by higher production costs. AISC per ounce during 2018 has been favourably impacted by the devaluation of the Argentine Peso, offset partly by inflation in Argentina.
GOLDCORP | 25
(in United States dollars, tabular amounts in millions, except where noted)
Pueblo Viejo, Dominican Republic (40%-owned)
(tabular amounts below represent Goldcorp's proportionate 40% share)
| | Three months ended September 30 | | Nine months ended September 30 |
Operating Data | | 2018 | | | 2017 | | | Change | | 2018 | | | 2017 | | | Change |
Tonnes of ore milled (thousands) | | | 790 | | | | 712 | | | 11 % | | | 2,429 | | | | 2,279 | | | 7 % |
Mill head grade (grams/tonne) | | | 4.60 | | | | 4.77 | | | (4)% | | | 3.98 | | | | 4.60 | | | (13)% |
Recovery rate | | 86% | | | 93% | | | (8)% | | 90% | | | 93% | | | (3)% |
Gold Produced (thousands of ounces) | | | 101 | | | | 101 | | | — % | | | 277 | | | | 311 | | | (11)% |
Gold Sold (thousands of ounces) | | | 99 | | | | 95 | | | 4 % | | | 280 | | | | 304 | | | (8)% |
Total Cash Costs: By-product (per ounce) | | $ | 507 | | | $ | 452 | | | 12 % | | $ | 483 | | | $ | 403 | | | 20 % |
Total Cash Costs: Co-product (per ounce) | | $ | 553 | | | $ | 492 | | | 12 % | | $ | 538 | | | $ | 445 | | | 21 % |
AISC (per ounce) | | $ | 738 | | | $ | 612 | | | 21 % | | $ | 653 | | | $ | 525 | | | 24 % |
Financial Data (in millions) (1) | | | | | | | | | | | | | | | | | | | | |
Revenues | | $ | 129 | | | $ | 128 | | | 1 % | | $ | 387 | | | $ | 403 | | | (4)% |
Production costs | | $ | 60 | | | $ | 49 | | | 22 % | | $ | 164 | | | $ | 144 | | | 14 % |
Depreciation and depletion | | $ | 27 | | | $ | 9 | | | 200 % | | $ | 78 | | | $ | 29 | | | 169 % |
Earnings from mine operations | | $ | 42 | | | $ | 70 | | | (40)% | | $ | 145 | | | $ | 230 | | | (37)% |
Expenditures on mining interests (cash basis) | | $ | 22 | | | $ | 15 | | | 47 % | | $ | 44 | | | $ | 34 | | | 29 % |
– Sustaining | | $ | 22 | | | $ | 15 | | | 47 % | | $ | 44 | | | $ | 34 | | | 29 % |
– Expansionary | | $ | 0 | | | $ | 0 | | | n/a | | $ | 0 | | | $ | 0 | | | n/a |
(1) | The Company’s 40% interest in Pueblo Viejo is classified as an investment in associate and is accounted for using the equity method with the Company’s share of net earnings and net assets separately disclosed in the Consolidated Statements of Earnings and Consolidated Balance Sheets, respectively. The financial data disclosed in the table represents the financial data of Pueblo Viejo on a proportionate rather than equity basis. For the three and nine months ended September 30, 2018, the Company's equity earnings from Pueblo Viejo were $13 million and $33 million, respectively (three and nine months ended September 30, 2017 – equity earnings of $27 million and $94 million, respectively). |
Third Quarter Operating and Financial Highlights
Gold production for the three months ended September 30, 2018 was consistent with the same period in the prior year due to increased tonnes milled, which offset the lower head grade and recovery rates. Gold production for the nine months ended September 30, 2018 was lower than the same periods in the prior year primarily due to lower head grades and lower recovery rates, offset partly by increased tonnes milled. The decrease in head grades was attributable to the expected decline in pit ore grades for these periods and unexpected delays in transitioning to higher grade ore benches in phases 5 and 6 in the Moore pit. The lower than expected recoveries resulted from increased processing of lower grade materials and carbonaceous ore. Tonnes milled increased for the three and nine months ended September 30, 2018 compared with the same periods in the prior year primarily due to improved mill availability. Compared to the third quarter of 2018, the Company expects fourth quarter 2018 tonnes milled to be approximately 20% higher, with recoveries increasing by approximately 5%, and gold and silver grades decreasing by approximately 15% and 20%, respectively.
Earnings from mine operations for the three and nine months ended September 30, 2018 were lower than the same periods in the prior year primarily due to higher production costs and higher depreciation and depletion. Production costs for the three and nine months ended September 30, 2018 were higher than the same periods in the prior year primarily due to the impact of higher fuel, power, and maintenance costs. Higher depreciation and depletion costs were a result of the reversal of the previously recorded impairment at the end of 2017 and a reduction in the useful life of certain assets.
AISC per ounce for the three and nine months ended September 30, 2018 was higher than the same periods in the prior year primarily due to lower gold sales volume, higher production costs, and higher sustaining capital expenditures.
GOLDCORP | 26
(in United States dollars, tabular amounts in millions, except where noted)
Red Lake, Canada (100%-owned)
| | Three months ended September 30 | | Nine months ended September 30 |
Operating Data | | 2018 | | | 2017 | | | Change | | 2018 | | | 2017 | | | Change |
Tonnes of ore milled (thousands) | | | 203 | | | | 154 | | | 32 % | | | 576 | | | | 414 | | | 39 % |
Mill head grade (grams/tonne) | | | 10.92 | | | | 11.25 | | | (3)% | | | 10.86 | | | | 12.64 | | | (14)% |
Recovery rate | | | 94 | % | | 93% | | | 1 % | | | 94 | % | | 94% | | | — % |
Gold Produced (thousands of ounces) | | | 67 | | | | 43 | | | 56 % | | | 189 | | | | 150 | | | 26 % |
Gold Sold (thousands of ounces) | | | 52 | | | | 38 | | | 37 % | | | 163 | | | | 150 | | | 9 % |
Total Cash Costs: By-product (per ounce) | | $ | 822 | | | $ | 981 | | | (16)% | | $ | 887 | | | $ | 879 | | | 1 % |
AISC (per ounce) | | $ | 1,092 | | | $ | 1,417 | | | (23)% | | $ | 1,152 | | | $ | 1,206 | | | (4)% |
Financial Data (in millions) | | | | | | | | | | | | | | | | | | | | |
Revenues | | $ | 64 | | | $ | 49 | | | 31 % | | $ | 209 | | | $ | 189 | | | 11 % |
Production costs | | $ | 44 | | | $ | 37 | | | 19 % | | $ | 145 | | | $ | 132 | | | 10 % |
Depreciation and depletion | | $ | 13 | | | $ | 18 | | | (28)% | | $ | 48 | | | $ | 62 | | | (23)% |
Earnings (loss) from mine operations | | $ | 7 | | | $ | (6 | ) | | 217 % | | $ | 16 | | | $ | (5 | ) | | 420 % |
Expenditures on mining interests (cash basis) | | $ | 16 | | | $ | 18 | | | (11)% | | $ | 57 | | | $ | 55 | | | 4 % |
– Sustaining | | $ | 13 | | | $ | 16 | | | (19)% | | $ | 40 | | | $ | 46 | | | (13)% |
– Expansionary | | $ | 3 | | | $ | 2 | | | 50 % | | $ | 17 | | | $ | 9 | | | 89 % |
Third Quarter Operating and Financial Highlights
Gold production for the three and nine months ended September 30, 2018 was higher than the same periods in the prior year due to higher tonnes milled despite lower grades as Red Lake has substantially completed its planned transition to a bulk mining operation, with the majority of ore production coming from long hole mining. With the increased use of bulk mining methods, the milling rate increased 32% and 39%, respectively, in the three and nine months ended September 30, 2018, as compared to the same periods in the prior year. Compared to the third quarter of 2018, the Company expects fourth quarter 2018 tonnes milled and gold grades to remain consistent, while realizing the benefits of investments in cost reduction and productivity initiatives implemented earlier in 2018.
Earnings from mine operations for the three and nine months ended September 30, 2018 compared to losses in the same periods in the prior year were a result of higher revenues and lower depreciation and depletion, offset partly by higher production costs. Lower depreciation and depletion is the result of a lower depletable cost base in 2018.
AISC per ounce for the three and nine months ended September 30, 2018 was lower than the same periods in the prior year as a result of higher gold sales and lower sustaining capital expenditures, offset partly by an increase in production costs.
Expansionary capital related primarily to development of the starter mine at Cochenour.
GOLDCORP | 27
(in United States dollars, tabular amounts in millions, except where noted)
Éléonore, Canada (100%-owned)
| | Three months ended September 30 | | Nine months ended September 30 |
Operating Data | | 2018 | | | 2017 | | | Change | | 2018 | | | 2017 | | | Change |
Tonnes of ore milled (thousands) | | | 470 | | | | 442 | | | 6 % | | | 1,344 | | | | 1,353 | | | (1)% |
Mill head grade (grams/tonne) | | | 6.28 | | | | 5.85 | | | 7 % | | | 6.02 | | | | 5.45 | | | 10 % |
Recovery rate | | 93% | | | 92% | | | 1 % | | 92% | | | 91% | | | 1 % |
Gold Produced (thousands of ounces) | | | 86 | | | | 77 | | | 12 % | | | 238 | | | | 221 | | | 8 % |
Gold Sold (thousands of ounces) | | | 86 | | | | 74 | | | 16 % | | | 237 | | | | 214 | | | 11 % |
Total Cash Costs: By-product (per ounce) | | $ | 737 | | | $ | 802 | | | (8)% | | $ | 849 | | | $ | 846 | | | 1 % |
AISC (per ounce) | | $ | 902 | | | $ | 1,067 | | | (15)% | | $ | 1,001 | | | $ | 1,115 | | | (10)% |
Financial Data (in millions) | | | | | | | | | | | | | | | | | | | | |
Revenues | | $ | 103 | | | $ | 95 | | | 8 % | | $ | 302 | | | $ | 269 | | | 12 % |
Production costs | | $ | 63 | | | $ | 59 | | | 7 % | | $ | 201 | | | $ | 181 | | | 11 % |
Depreciation and depletion | | $ | 43 | | | $ | 33 | | | 30 % | | $ | 120 | | | $ | 97 | | | 24 % |
(Loss) earnings from mine operations | | $ | (3 | ) | | $ | 3 | | | (200)% | | $ | (19 | ) | | $ | (9 | ) | | (111)% |
Expenditures on mining interests (cash basis) | | $ | 21 | | | $ | 26 | | | (19)% | | $ | 53 | | | $ | 84 | | | (37)% |
– Sustaining | | $ | 15 | | | $ | 18 | | | (17)% | | $ | 35 | | | $ | 54 | | | (35)% |
– Expansionary | | $ | 6 | | | $ | 8 | | | (25)% | | $ | 18 | | | $ | 30 | | | (40)% |
Third Quarter Operating and Financial Highlights
Gold production for the three and nine months ended September 30, 2018 was higher than the same periods in the prior year, reflecting the ongoing ramp up and contribution of higher grade ore during the third quarter of 2018. The ramp up at Éléonore led to an increase in tonnes milled of 6% for the three months ended September 30, 2018 compared to the same period in the prior year. Compared to the third quarter of 2018, the Company expects fourth quarter 2018 tonnes milled to be approximately 15% higher, with gold grades increasing by approximately 10%, as part of the expected mine sequencing and continued ramp up process. The mine is expected to exit the year at a sustained mining production rate over 6,000 tonnes per day for an annual gold production rate of 400,000 ounces.
Losses from mine operations for the three and nine months ended September 30, 2018 were higher than the same period in the prior year primarily due to increased production costs and higher depreciation and depletion, offset partly by higher revenues. Increased depreciation and depletion costs are a result of higher gold sales and a decrease in the depletable ounce base. With the increased flexibility in the mine sequence and the continuous improvement work deployed, cash costs per ounce are expected to continue decreasing in the fourth quarter of 2018.
AISC per ounce for the three and nine months ended September 30, 2018 was lower than the same period in the prior year primarily due to higher gold sales and lower sustaining capital expenditures. Sustaining capital expenditures were lower due to timing of underground infrastructure, and lower sustaining capital development requirements. The Company expects AISC per ounce to continue to decrease in 2018 as Éléonore continues to ramp up.
Expansionary capital expenditures continued to decrease in 2018 with the completion of the majority of the infrastructure and development required for Horizon 5.
GOLDCORP | 28
(in United States dollars, tabular amounts in millions, except where noted)
Porcupine, Canada (100%-owned)
| | Three months ended September 30 | | Nine months ended September 30 |
Operating Data | | 2018 | | | 2017 | | | Change | | 2018 | | | 2017 | | | Change |
Tonnes of ore milled (thousands) | | | 931 | | | | 881 | | | 6 % | | | 2,666 | | | | 2,335 | | | 14 % |
Mill head grade (grams/tonne) | | | 2.17 | | | | 2.83 | | | (23)% | | | 2.38 | | | | 2.81 | | | (15)% |
Recovery rate | | 92% | | | 92% | | | — % | | 92% | | | 92% | | | — % |
Gold Produced (thousands of ounces) | | | 59 | | | | 75 | | | (21)% | | | 191 | | | | 196 | | | (3)% |
Gold Sold (thousands of ounces) | | | 58 | | | | 70 | | | (17)% | | | 190 | | | | 192 | | | (1)% |
Total Cash Costs: By-product (per ounce) | | $ | 754 | | | $ | 758 | | | (1)% | | $ | 750 | | | $ | 791 | | | (5)% |
AISC (per ounce) | | $ | 996 | | | $ | 978 | | | 2 % | | $ | 965 | | | $ | 1,012 | | | (5)% |
Financial Data (in millions) | | | | | | | | | | | | | | | | | | | | |
Revenues | | $ | 71 | | | $ | 89 | | | (20)% | | $ | 245 | | | $ | 241 | | | 2 % |
Production costs | | $ | 44 | | | $ | 54 | | | (19)% | | $ | 143 | | | $ | 155 | | | (8)% |
Depreciation and depletion | | $ | 24 | | | $ | 32 | | | (25)% | | $ | 78 | | | $ | 86 | | | (9)% |
Earnings from mine operations | | $ | 3 | | | $ | 3 | | | — % | | $ | 24 | | | $ | 0 | | | n/a |
Expenditures on mining interests (cash basis) | | $ | 38 | | | $ | 24 | | | 58 % | | $ | 99 | | | $ | 74 | | | 34 % |
– Sustaining | | $ | 10 | | | $ | 12 | | | (17)% | | $ | 30 | | | $ | 33 | | | (9)% |
– Expansionary | | $ | 28 | | | $ | 12 | | | 133 % | | $ | 69 | | | $ | 41 | | | 68 % |
Third Quarter Operating and Financial Highlights
Gold production for the three and nine months ended September 30, 2018 was lower than the same periods in the prior year due to lower mill head grade, offset partly by increased tonnes milled. Gold production reflects the loss of higher grade material from the Dome underground, which closed on December 31, 2017, and a decrease in higher grade material from Hoyle underground, offset partly from an increase in tonnes milled from the Hollinger open pit. The mine optimization at Hoyle continues to focus on improving development, dilution control, and material movements to further increase mining rates, while the open pit is expected to deliver higher grades in the fourth quarter of 2018. Compared to the third quarter of 2018, the Company expects fourth quarter 2018 tonnes milled to be approximately 10% higher and grade to be approximately 5% higher, as more production is anticipated from the higher-grade Hoyle underground mine.
Earnings from mine operations for the three months ended September 30, 2018 were consistent with the same period in the prior year due to lower production costs and depreciation and depletion, offset by lower revenues. Earnings from mine operations for the nine months ended September 30, 2018 were higher than the same periods in the prior year as a result of lower production costs and lower depreciation and depletion. Production costs for the three and nine months ended September 30, 2018 were lower mainly due to the closure of the higher cost Dome Underground at the end of 2017 and productivity improvements at Hollinger open pit. Depreciation and depletion for the three and nine months ended September 30, 2018 was lower primarily due to lower gold sales volumes and an increase in the depletable ounce base.
AISC per ounce for the three months ended September 30, 2018 was consistent with the same period in the prior year primarily due to lower gold sales volumes, which were offset by lower production costs and sustaining capital expenditures. AISC per ounce for the nine months ended September 30, 2018 was lower than the same period in the prior year primarily due to lower production costs and sustaining capital expenditures, with similar gold sales volumes.
Expansionary capital related to the commissioning and optimization of the Waste to Ore demonstration plant, the development and construction activities at the Borden and study costs at the Century Gold Project (see the Project Pipeline section below).
GOLDCORP | 29
(in United States dollars, tabular amounts in millions, except where noted)
Musselwhite, Canada (100%-owned)
| | Three months ended September 30 | | Nine months ended September 30 |
Operating Data | | 2018 | | | 2017 | | | Change | | 2018 | | | 2017 | | | Change |
Tonnes of ore milled (thousands) | | | 245 | | | | 331 | | | (26)% | | | 792 | | | | 912 | | | (13)% |
Mill head grade (grams/tonne) | | | 5.87 | | | | 5.68 | | | 3 % | | | 6.26 | | | | 5.95 | | | 5 % |
Recovery rate | | 96% | | | 97% | | | (1)% | | 96% | | | 96% | | | — % |
Gold Produced (thousands of ounces) | | | 45 | | | | 58 | | | (22)% | | | 154 | | | | 169 | | | (9)% |
Gold Sold (thousands of ounces) | | | 46 | | | | 57 | | | (19)% | | | 158 | | | | 168 | | | (6)% |
Total Cash Costs: By-product (per ounce) | | $ | 794 | | | $ | 587 | | | 35 % | | $ | 715 | | | $ | 652 | | | 10 % |
AISC (per ounce) | | $ | 983 | | | $ | 674 | | | 46 % | | $ | 891 | | | $ | 789 | | | 13 % |
Financial Data (in millions) | | | | | | | | | | | | | | | | | | | | |
Revenues | | $ | 55 | | | $ | 72 | | | (24)% | | $ | 203 | | | $ | 210 | | | (3)% |
Production costs | | $ | 37 | | | $ | 33 | | | 12 % | | $ | 113 | | | $ | 109 | | | 4 % |
Depreciation and depletion | | $ | 10 | | | $ | 11 | | | (9)% | | $ | 34 | | | $ | 31 | | | 10 % |
Earnings from mine operations | | $ | 8 | | | $ | 28 | | | (71)% | | $ | 56 | | | $ | 70 | | | (20)% |
Expenditures on mining interests (cash basis) | | $ | 20 | | | $ | 11 | | | 82 % | | $ | 62 | | | $ | 36 | | | 72 % |
– Sustaining | | $ | 8 | | | $ | 1 | | | 700 % | | $ | 24 | | | $ | 15 | | | 60 % |
– Expansionary | | $ | 12 | | | $ | 10 | | | 20 % | | $ | 38 | | | $ | 21 | | | 81 % |
Third Quarter Operating and Financial Highlights
Gold production for the three and nine months ended September 30, 2018 was lower than the same periods in the prior year primarily due to lower tonnes milled, offset partly by higher grades. The mine continued to focus on increasing development rates, which were 40% higher in the third quarter of 2018 compared to the same period in the prior year and is expected to open additional mining fronts allowing Musselwhite to meet higher production rates. The longer haulage distance in the lower mine and generation of waste associated with the Materials Handling Project (“MHP”) has negatively impacted mine production during 2018 and is expected to continue until commissioning is completed, projected in the third quarter of 2019, after which sustained underground productivity improvements are expected to be realized.
The increase in development in the third quarter of 2018 is expected to positively impact mine sequence and flexibility. Compared to the third quarter of 2018, the Company expects fourth quarter 2018 tonnes milled to be approximately 20% higher, with gold grades increasing by approximately 5%.
Earnings from mine operations for the three and nine months ended September 30, 2018 were lower than the same periods in the prior year, primarily due to lower gold sales and higher production costs resulting from the increased development rates.
AISC per ounce for the three and nine months ended September 30, 2018 was higher than the same periods in the prior year due to lower gold sales, higher production costs, and higher sustaining capital expenditures. Sustaining capital expenditures increased mainly due to increased development rates compared to 2017.
Expansionary capital primarily related to construction of the Materials Handling Project (see the Project Pipeline section below).
GOLDCORP | 30
(in United States dollars, tabular amounts in millions, except where noted)
PROJECT PIPELINE
The current anticipated milestones for 2018 through 2021 for the Company's numerous projects are outlined below
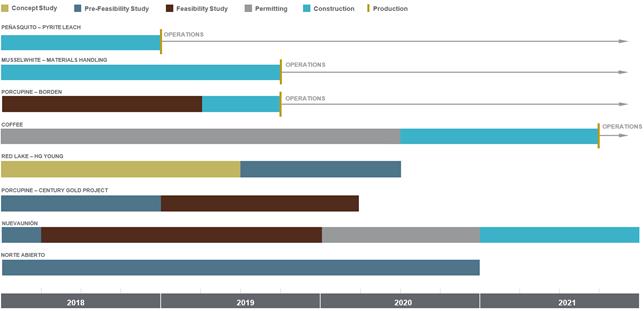
Expenditures relating to projects for the three and nine months ended September 30, 2018 and 2017 were as follows (in millions):
| | Three months ended September 30 | | | Nine months ended September 30 | |
| | 2018 | | | 2017 | | | 2018 | | | 2017 | |
Peñasquito | | $ | 87 | | | $ | 92 | | | $ | 277 | | | $ | 169 | |
Cerro Negro | | | 15 | | | | 4 | | | | 38 | | | | 8 | |
Red Lake | | | 6 | | | | 2 | | | | 26 | | | | 10 | |
Éléonore | | | 6 | | | | 8 | | | | 18 | | | | 30 | |
Porcupine | | | 28 | | | | 16 | | | | 69 | | | | 49 | |
Musselwhite | | | 12 | | | | 10 | | | | 38 | | | | 21 | |
Coffee | | | 24 | | | | 9 | | | | 47 | | | | 18 | |
Norte Abierto | | | 4 | | | | - | | | | 20 | | | | - | |
NuevaUnión | | | 11 | | | | 8 | | | | 28 | | | | 22 | |
Other | | | 5 | | | | 3 | | | | 21 | | | | 5 | |
Total | | $ | 198 | | | $ | 152 | | | $ | 582 | | | $ | 332 | |
Of the $198 million and $582 million of project expenditures for the three and nine months ended September 30, 2018 ($152 million and $332 million for the three and nine months ended September 30, 2017), $189 million and $548 million ($148 million and $321 million for the three and nine months ended September 30, 2017) were included in expenditures on mining interests as expansionary capital. Certain costs have been expensed as non-sustaining project and exploration costs.
Peñasquito: Pyrite Leach Project
At the end of the third quarter of 2018, the PLP was fully constructed and undergoing pre-commissioning activities together with area-based commissioning. Feedstock was introduced into the rougher circuit during the third quarter of 2018. First gold and commercial production are expected in the fourth quarter of 2018.
GOLDCORP | 31
(in United States dollars, tabular amounts in millions, except where noted)
The CPP component of the project is now allowing Peñasquito to process a variety of different ore sources, including significant amounts already in stockpiles. The project was completed under budget and assigned to the operations team in May 2018, with commercial production achieved on October 1, 2018.
Musselwhite: Materials Handling Project
The MHP is advancing and has achieved 80% overall project completion. In the third quarter of 2018, sinking operations were commissioned, shaft steel and mechanical infrastructure was erected in the headworks, and hoist mechanicals were in place and ready for dry commissioning. Approximately 65% of the ground support was installed in the upper section of the winze and reaming of the lower section of the winze was completed. Ground conditions in the winze have slowed ground support progress and completion of this activity is now expected in the second quarter of 2019. Major infrastructure components, including the hoist plant, material crushing circuit, and truck loadout are expected to be completed by the end of the first quarter of 2019. Capital costs of the project remain on budget, despite the longer time to complete ground support, and commissioning is now expected in the third quarter of 2019.
Porcupine: Century Gold Project
In the third quarter of 2018, the project continued advancing work on the optimized pre-feasibility study and submitted the Associated Project Description in accordance with the Canadian Environmental Assessment Agency (CEAA) 2012 requirements. Baseline field studies and modelling are underway to support the permitting process.
In the first half of 2018, the project advanced a series of trade-off studies with a focus on evaluating the latest technologies to determine the single preferred option. The studies concluded on a 300 tonne and 150 tonne truck and shovel configuration for the Dome and Pamour pits, respectively, as well as a 50,000 tonne per day mill. Conclusions from the trade-off studies suggest there is approximately a 15% improvement in operating costs compared to the base case pre-feasibility study. The single preferred option has been selected and a series of optimizations in the areas of ore sorting and autonomous haulage are underway to add further value to the project. The optimized pre-feasibility study and feasibility study are expected to be completed during the fourth quarter of 2018 and first quarter of 2020, respectively.
Porcupine: Borden Project
In the third quarter of 2018, ramp development reached 1,884 metres, on schedule, with a corresponding depth of 314 metres. Bulk sample extraction began in August, two months ahead of schedule, with a first zone of extraction on levels 225 and 240. Early results from the bulk sample are confirming the geological model.
All operating permits are expected to be obtained by the fourth quarter of 2018, allowing an increased pace of development as well as construction of the remaining critical mine infrastructure including a ventilation raise and secondary egress. Permit applications for industrial sewage, air and water have been processed through the 30-day Environmental Registry phase and are currently being finalized.
With an all-electric underground mine operation, it is estimated that operating costs will be reduced by over $9 million per year due to the elimination of approximately two million litres of diesel fuel, and with reduced ventilation needs, a decrease of approximately 32,000 MWh of electricity and a corresponding decrease in propane required to heat the ventilation. As well, a reduction in annual green house gas emissions of more than 7,000 tonnes, or 70%, over a baseline mine is expected. Associated with this, the Government of Ontario has agreed to invest $5 million into the deployment of the all-electric fleet through its target greenhouse gas program.
The mine is scheduled to begin commercial production in the second half of 2019.
Coffee Project
Since the acquisition of the Coffee Project in July 2016, the Company has accelerated and expanded the scope of exploration in this developing new gold camp. Goldcorp acquired the project not only for the high-grade heap leach Coffee gold deposit, but also to participate in the development of the growing mineral wealth within the highly prospective Tintina Gold Province.
The project was deemed adequate by the Yukon Environmental and Socio-economic Assessment Board in August 2018. This is a positive step forward though the first stage of the permitting process outlined within the Yukon Environmental and Socio-economic Assessment Act. Public consultation is underway and expected to be completed by the end of November 2018.
GOLDCORP | 32
(in United States dollars, tabular amounts in millions, except where noted)
Engineering on the project continued to advance with 22% of engineering completed, with the target of being 90% complete by the time the final regulatory approval is received.
Red Lake: HG Young Project
The HG Young Project continued to advance with development on 14 level complete, rehabilitation on 21 level complete, and ongoing diamond drilling for the project from surface and underground platforms. Phase 2 of development on 14 level towards the mineralization is planned to start in the fourth quarter of 2018.
Assuming a positive outcome of the concept study, the Company expects to commence the development of the preferred material handling system to facilitate production and to provide parameters for a starter mine plan by late 2019.
Norte Abierto Project
Since acquisition in mid-2017, a dedicated project team has been established in Santiago and Copiapo.
In 2018, the project continues to progress through the initial stage of planned studies with the following key activities and milestones:
| • | Stakeholder engagement including communities, local and federal authorities and agencies, and commercial partners; |
| • | Trade-off engineering studies of key value drivers including mining, metallurgy, water, power, and tailings; |
| • | Completed the geological models update in the third quarter of 2018 for both Cerro Casale and Caspiche with the information from the previous drilling campaign; and |
| • | Completed all key preparation works for the upcoming drilling campaign commencing in October 2018 at Cerro Casale, Caspiche, and satellite targets building on previous results. |
Trade-off studies for the single preferred option on the combined project are expected to be completed in 2019 and the pre-feasibility study is expected to be completed in 2020.
NuevaUnión Project
In the third quarter of 2018, the project kicked off the feasibility study and continued development of documents for the Environmental Impact Assessment permits.
The Pre-Feasibility study (“PFS”) confirmed the synergies expected through combining Teck and Goldcorp’s previously separate Relincho and La Fortuna deposits and the benefits of ongoing early engagement with communities and Indigenous peoples, including:
| • | Long life asset that can operate through multiple price cycles; |
| • | Phased development approach that reduces initial capital investment and execution risk; |
| • | Low cash costs in the first phases of development; |
| • | Extended mine life from 32 to 36 years, not including 206 million tonnes of Inferred Mineral Resources contained within the current pit designs; |
| • | Reduced environmental footprint, infrastructure requirements and energy and water use; |
| • | The use of desalinated water during operations, to minimize the use of freshwater resources; |
| • | Relocation of the tailings facility from the agriculturally important Huasco River watershed to the Relincho site; and |
| • | Significant further resource expansion potential and project optimization opportunities. |
The PFS design covers a processing plant, tailings management facilities and ancillary facilities at the Relincho site and a conveyor system to transport ore from the La Fortuna mine to the plant site at Relincho. It also includes power transmission lines and substations, a desalination plant, concentrate filtration plant, port and marine structures on the coast and both desalinated water and concentrate pipeline and pumping systems between the coast and the plant site.
The project is a long-life development opportunity. Numerous opportunities to improve project economics were identified in the PFS, some of which are included in the current project design, such as the use of High Pressure Grinding Rolls in the comminution circuit. Project economics will be released with the completion of the feasibility study expected during the second half of 2019.
GOLDCORP | 33
(in United States dollars, tabular amounts in millions, except where noted)
2018 Reserves and Resources Update
Goldcorp’s proven and probable gold mineral reserves as of June 30, 2018 totaled 52.8 million ounces, compared to 53.5 million ounces as of June 30, 2017 as exploration success at the Company’s operated mines essentially replaced mineral reserves depleted from production and a small net loss in mineral reserves from depletion was experienced at the Company’s non-operated mines, including Pueblo Viejo.
Measured and Indicated gold mineral resources decreased slightly from 37.1 million ounces at June 30, 2017 to 35.2 million ounces at June 30, 2018, primarily due to the impact of the successful conversion of indicated mineral resources into proven and probable mineral reserves at Musselwhite, Cerro Negro, Peñasquito and Porcupine. Inferred gold mineral resources decreased to 17.5 million ounces at June 30, 2018 from 20.0 million ounces at June 30, 2017.
Mineral reserve estimates were based on a gold price of $1,200 per ounce while mineral resources were estimated using a gold price of $1,400 per ounce. Gold price assumptions were unchanged from last year’s estimates. Complete mineral reserve and mineral resource information, including tonnes and grades for all metals and details of the assumptions used in the calculations, can be found in the table and associated notes below and have been posted at www.goldcorp.com.
NON-GAAP FINANCIAL PERFORMANCE MEASURES
The Company has included certain non-GAAP performance measures throughout this document. These performance measures are employed by the Company to measure its operating and economic performance internally and to assist in business decision-making as well as providing key performance information to senior management. The Company believes that, in addition to conventional measures prepared in accordance with GAAP, certain investors and other stakeholders also use this information to evaluate the Company’s operating and financial performance; however, these non-GAAP performance measures do not have any standardized meaning. Accordingly, these performance measures are intended to provide additional information and should not be considered in isolation or as a substitute for measures of performance prepared in accordance with GAAP. The Company’s primary business is gold production and its future development and current operations focus are on maximizing returns from gold production, with other metal production being incidental to the gold production process. As a result, where applicable, the Company's non-GAAP performance measures are disclosed on a per gold ounce basis.
The Company calculates its non-GAAP performance measures on an attributable basis. Attributable performance measures include the Company’s mining operations and projects, and the Company’s share of Pueblo Viejo, Alumbrera, and NuevaUnión. Attributable performance measures also included Leagold up to May 24, 2018, the date on which the Company ceased to have significant influence over Leagold. The inclusion of NuevaUnión in the Company's non-GAAP performance measures primarily impacts the Company's adjusted operating cash flow metric at this time as it is a development stage project. The Company believes that disclosing certain performance measures on an attributable basis provides useful information about the Company’s operating and financial performance and reflects the Company’s view of its core mining operations.
Non-GAAP Measure - Total Cash Costs: by-product
Total cash costs: by-product incorporate Goldcorp’s share of all production costs, including adjustments to inventory carrying values, adjusted for changes in estimates in reclamation and closure costs at the Company’s closed mines which are non-cash in nature, and include Goldcorp’s share of by-product silver, zinc, lead, and copper credits, and treatment and refining charges included within revenue. Additionally, cash costs are adjusted for realized gains and losses arising on the Company’s commodity and foreign currency contracts which the Company enters into to mitigate its exposure to fluctuations in by-product metal prices, heating oil prices and foreign exchange rates, which may impact the Company’s operating costs.
In addition to conventional measures, the Company assesses this per ounce measure in a manner that isolates the impacts of gold production volumes, the by-product credits, and operating costs fluctuations such that the non-controllable and controllable variability is independently addressed. The Company uses total cash costs: by-product per gold ounce to monitor its operating performance internally, including operating cash costs, as well as in its assessment of potential development projects and acquisition targets. The Company believes this measure provides investors and analysts with useful information about the Company’s underlying cash costs of operations and the impact of by-product credits on the Company’s cost structure and is a relevant metric used to understand the Company’s operating profitability and ability to generate cash flow. When deriving the production costs associated with an ounce of gold, the Company includes by-product credits as the Company considers that the cost to produce the gold is reduced as a result of the by-product sales incidental to the gold production process, thereby allowing the Company’s management and other stakeholders to assess the net costs of gold production.
GOLDCORP | 34
(in United States dollars, tabular amounts in millions, except where noted)
The Company reports total cash costs: by-product on a gold ounces sold basis. In the gold mining industry, this is a common performance measure but does not have any standardized meaning. The Company follows the recommendations of the Gold Institute Production Cost Standard. The Gold Institute, which ceased operations in 2002, was a non-regulatory body and represented a global group of producers of gold and gold products. The production cost standard developed by the Gold Institute remains the generally accepted standard of reporting cash costs of production by gold mining companies.
The Company also reports total cash costs: co-product as a secondary metric to provide further information to the Company's stakeholders. Total cash costs: co-product, per gold ounce, are calculated by allocating Goldcorp‘s share of production costs to each co-product based on the ratio of actual sales volumes multiplied by budget metal prices, as compared to realized sales prices. The Company uses budget prices to eliminate price volatility and improve co-product cash cost reporting comparability between periods. The budget metal prices used in the calculation of total cash costs: co-product were as follows:
| | 2018 | | | 2017 | | | 2016 | |
Gold (per ounce) | | $ | 1,300 | | | $ | 1,250 | | | $ | 1,100 | |
Silver (per ounce) | | $ | 19.00 | | | $ | 19.00 | | | $ | 15.00 | |
Copper (per pound) | | $ | 2.75 | | | $ | 2.25 | | | $ | 2.53 | |
Zinc (per pound) | | $ | 1.30 | | | $ | 1.00 | | | $ | 0.80 | |
Lead (per pound) | | $ | 1.10 | | | $ | 0.89 | | | $ | 0.80 | |
The following tables provide a reconciliation of total cash costs: by-product per ounce to the consolidated financial statements:
Three months ended September 30, 2018:
| | Production Costs (1) | | | By-Product Credits | | | Treatment and Refining Charges on Concentrate Sales | | | Other | | | Total Cash Costs: by- product | | | Ounces (thousands) | | | Total Cash Costs: by- product per ounce (2), (3) | |
Peñasquito | | $ | 175 | | | $ | (148 | ) | | $ | 17 | | | $ | 4 | | | $ | 48 | | | | 50 | | | $ | 958 | |
Cerro Negro | | | 63 | | | | (12 | ) | | | — | | | | (4 | ) | | | 47 | | | | 103 | | | | 459 | |
Pueblo Viejo | | | 60 | | | | (9 | ) | | | — | | | | — | | | | 51 | | | | 99 | | | | 507 | |
Red Lake | | | 44 | | | | — | | | | — | | | | — | | | | 44 | | | | 52 | | | | 822 | |
Éléonore | | | 63 | | | | — | | | | — | | | | — | | | | 63 | | | | 86 | | | | 737 | |
Porcupine | | | 44 | | | | (1 | ) | | | — | | | | 1 | | | | 44 | | | | 58 | | | | 754 | |
Musselwhite | | | 37 | | | | — | | | | — | | | | — | | | | 37 | | | | 46 | | | | 794 | |
Other mines | | | 10 | | | | (12 | ) | | | 1 | | | | 15 | | | | 14 | | | | 14 | | | | 1,094 | |
Corporate | | | (2 | ) | | | — | | | | — | | | | 2 | | | | — | | | | — | | | | — | |
TOTAL - Attributable basis | | $ | 494 | | | $ | (182 | ) | | $ | 18 | | | $ | 18 | | | $ | 348 | | | | 508 | | | $ | 683 | |
Less associates and joint ventures | | | (70 | ) | | | 21 | | | | (1 | ) | | | (16 | ) | | | (66 | ) | | | (113 | ) | | | (576 | ) |
Total - Consolidated | | $ | 424 | | | $ | (161 | ) | | $ | 17 | | | $ | 2 | | | $ | 282 | | | | 395 | | | $ | 713 | |
GOLDCORP | 35
(in United States dollars, tabular amounts in millions, except where noted)
Three months ended September 30, 2017:
| | Production Costs (1) | | | By-Product Credits | | | Treatment and Refining Charges on Concentrate Sales | | | Other | | | Total Cash Costs: by- product | | | Ounces (thousands) | | | Total Cash Costs: by- product per ounce (2), (3) | |
Peñasquito | | $ | 198 | | | $ | (252 | ) | | $ | 32 | | | $ | — | | | $ | (22 | ) | | | 133 | | | $ | (168 | ) |
Cerro Negro | | | 75 | | | | (15 | ) | | | — | | | | 1 | | | | 61 | | | | 118 | | | | 510 | |
Pueblo Viejo | | | 49 | | | | (7 | ) | | | — | | | | — | | | | 42 | | | | 95 | | | | 452 | |
Red Lake | | | 37 | | | | — | | | | — | | | | — | | | | 37 | | | | 38 | | | | 981 | |
Éléonore | | | 59 | | | | — | | | | — | | | | — | | | | 59 | | | | 74 | | | | 802 | |
Porcupine | | | 54 | | | | (1 | ) | | | — | | | | — | | | | 53 | | | | 70 | | | | 758 | |
Musselwhite | | | 33 | | | | — | | | | — | | | | — | | | | 33 | | | | 57 | | | | 587 | |
Other mines | | | 60 | | | | (15 | ) | | | 2 | | | | (19 | ) | | | 28 | | | | 21 | | | | 1,361 | |
TOTAL - Attributable basis | | $ | 565 | | | $ | (290 | ) | | $ | 34 | | | $ | (18 | ) | | $ | 291 | | | | 606 | | | $ | 483 | |
Less associates and joint ventures | | | (106 | ) | | | 22 | | | | (2 | ) | | | 15 | | | | (71 | ) | | | (116 | ) | | | (617 | ) |
Total - Consolidated | | $ | 459 | | | $ | (268 | ) | | $ | 32 | | | $ | (3 | ) | | $ | 220 | | | | 490 | | | $ | 451 | |
Nine months ended September 30, 2018:
| | Production Costs (1) | | | By-Product Credits | | | Treatment and Refining Charges on Concentrate Sales | | | Other | | | Total Cash Costs: by- product | | | Ounces (thousands) | | | Total Cash Costs: by- product per ounce (2), (3) | |
Peñasquito | | $ | 522 | | | $ | (579 | ) | | $ | 55 | | | $ | 1 | | | $ | (1 | ) | | | 220 | | | $ | (7 | ) |
Cerro Negro | | | 204 | | | | (47 | ) | | | — | | | | (4 | ) | | | 153 | | | | 350 | | | | 438 | |
Pueblo Viejo | | | 164 | | | | (29 | ) | | | — | | | | — | | | | 135 | | | | 280 | | | | 483 | |
Red Lake | | | 145 | | | | — | | | | — | | | | — | | | | 145 | | | | 163 | | | | 887 | |
Éléonore | | | 201 | | | | — | | | | — | | | | — | | | | 201 | | | | 237 | | | | 849 | |
Porcupine | | | 143 | | | | (1 | ) | | | — | | | | 1 | | | | 143 | | | | 190 | | | | 750 | |
Musselwhite | | | 113 | | | | — | | | | — | | | | — | | | | 113 | | | | 158 | | | | 715 | |
Other mines | | | 79 | | | | (44 | ) | | | 4 | | | | 15 | | | | 54 | | | | 57 | | | | 954 | |
Corporate | | | 2 | | | | — | | | | — | | | | (2 | ) | | | - | | | | — | | | | — | |
TOTAL - Attributable basis | | $ | 1,573 | | | $ | (700 | ) | | $ | 59 | | | $ | 11 | | | $ | 943 | | | | 1,655 | | | $ | 569 | |
Less associates and joint ventures | | | (243 | ) | | | 73 | | | | (4 | ) | | | (16 | ) | | | (190 | ) | | | (337 | ) | | | (563 | ) |
Total - Consolidated | | $ | 1,330 | | | $ | (627 | ) | | $ | 55 | | | $ | (5 | ) | | $ | 753 | | | | 1,318 | | | $ | 571 | |
GOLDCORP | 36
(in United States dollars, tabular amounts in millions, except where noted)
Nine months ended September 30, 2017:
| | Production Costs (1) | | | By-Product Credits | | | Treatment and Refining Charges on Concentrate Sales | | | Other | | | Total Cash Costs: by- product | | | Ounces (thousands) | | | Total Cash Costs: by- product per ounce (2), (3) | |
Peñasquito | | $ | 564 | | | $ | (678 | ) | | $ | 107 | | | $ | — | | | $ | (7 | ) | | | 404 | | | $ | (18 | ) |
Cerro Negro | | | 194 | | | | (41 | ) | | | — | | | | — | | | | 153 | | | | 313 | | | | 487 | |
Pueblo Viejo | | | 144 | | | | (22 | ) | | | — | | | | — | | | | 122 | | | | 304 | | | | 403 | |
Red Lake | | | 132 | | | | — | | | | — | | | | — | | | | 132 | | | | 150 | | | | 879 | |
Éléonore | | | 181 | | | | — | | | | — | | | | — | | | | 181 | | | | 214 | | | | 846 | |
Porcupine | | | 155 | | | | (1 | ) | | | — | | | | (2 | ) | | | 152 | | | | 192 | | | | 791 | |
Musselwhite | | | 109 | | | | — | | | | — | | | | — | | | | 109 | | | | 168 | | | | 652 | |
Other mines | | | 249 | | | | (109 | ) | | | 8 | | | | (18 | ) | | | 130 | | | | 156 | | | | 839 | |
TOTAL - Attributable basis | | $ | 1,728 | | | $ | (851 | ) | | $ | 115 | | | $ | (20 | ) | | $ | 972 | | | | 1,901 | | | $ | 512 | |
Less associates and joint ventures | | | (293 | ) | | | 96 | | | | (8 | ) | | | 15 | | | | (190 | ) | | | (375 | ) | | | (509 | ) |
Total - Consolidated | | $ | 1,435 | | | $ | (755 | ) | | $ | 107 | | | $ | (5 | ) | | $ | 782 | | | | 1,526 | | | $ | 512 | |
| (1) | $12 million and $45 million of royalties are included in production costs for the three and nine months ended September 30, 2018, respectively (three and nine months ended September 30, 2017 – $19 million and $60 million, respectively). |
| (2) | Total cash costs: by-product per ounce may not calculate based on amounts presented in these tables due to rounding. |
| (3) | If silver, lead, zinc and copper for Peñasquito, silver for Marlin, silver and copper for Pueblo Viejo, and copper for Alumbrera were treated as co-products, Goldcorp's share of total cash costs: co-product for the three and nine months ended September 30, 2018 would be $701 and $701 per ounce of gold, $10.58 and $9.15 per ounce of silver, $2.57 and $2.41 per pound of copper, $1.05 and $0.87 per pound of zinc, and $0.96 and $0.85 per pound of lead, respectively (three and nine months ended September 30, 2017 – $663 and $669 per ounce of gold, $8.88 and $8.93 per ounce of silver, $3.01 and $2.19 per pound of copper, $0.69 and $0.70 per pound of zinc, and $0.71 and $0.81 per pound of lead, respectively). |
GOLDCORP | 37
(in United States dollars, tabular amounts in millions, except where noted)
NON-GAAP MEASURE – AISC
AISC include total production cash costs incurred at the Company’s mining operations, which forms the basis of the Company’s by-product cash costs. Additionally, the Company includes sustaining capital expenditures, corporate administrative expense, mine-site exploration and evaluation costs, and reclamation cost accretion and amortization. The measure seeks to reflect the full cost of gold production from current operations, therefore expansionary capital and non-sustaining expenditures are excluded. Certain other cash expenditures, including tax payments, dividends and financing costs are also excluded.
The Company believes that this measure represents the total costs of producing gold from current operations and provides the Company and other stakeholders of the Company with additional information of the Company’s operational performance and ability to generate cash flows. AISC, as a key performance measure, allows the Company to assess its ability to support capital expenditures and to sustain future production from the generation of operating cash flows. This information provides management with the ability to more actively manage capital programs and to make more prudent capital investment decisions.
The Company reports AISC on a gold ounces sold basis. This performance measure was adopted as a result of an initiative undertaken within the gold mining industry; however, this performance measure has no standardized meaning and should not be considered in isolation or as a substitute for measures of performance prepared in accordance with GAAP. The Company follows the guidance note released by the World Gold Council, which became effective January 1, 2014 in calculating AISC. The World Gold Council is a non-regulatory market development organization for the gold industry whose members comprise global senior gold mining companies.
As described above, AISC include total production cash costs incurred at the Company's mining operations, which forms the basis of the Company's cash costs: by-product and which are reconciled to reported production costs in the tables above.
The following tables provide a reconciliation of AISC per ounce to the consolidated financial statements:
Three months ended September 30, 2018:
| | Total cash costs: by- product | | | Corporate Administration | | | Exploration and evaluation costs | | | Reclamation cost accretion and amortization | | | Sustaining capital expenditures | | | Total AISC | | | Ounces (thousands) | | | Total AISC per ounce (1) | |
Peñasquito | | $ | 48 | | | $ | — | | | $ | — | | | $ | 2 | | | $ | 49 | | | $ | 99 | | | | 50 | | | $ | 1,968 | |
Cerro Negro | | | 47 | | | | — | | | | — | | | | — | | | | 5 | | | | 52 | | | | 103 | | | | 520 | |
Pueblo Viejo | | | 51 | | | | — | | | | — | | | | 2 | | | | 22 | | | | 75 | | | | 99 | | | | 738 | |
Red Lake | | | 44 | | | | — | | | | 1 | | | | — | | | | 13 | | | | 58 | | | | 52 | | | | 1,092 | |
Éléonore | | | 63 | | | | — | | | | — | | | | — | | | | 15 | | | | 77 | | | | 86 | | | | 902 | |
Porcupine | | | 44 | | | | — | | | | 1 | | | | 2 | | | | 10 | | | | 57 | | | | 58 | | | | 996 | |
Musselwhite | | | 37 | | | | — | | | | — | | | | — | | | | 8 | | | | 45 | | | | 46 | | | | 983 | |
Other mines | | | 14 | | | | — | | | | — | | | | 2 | | | | — | | | | 16 | | | | 14 | | | | 1,239 | |
Corporate (2) | | | — | | | | 21 | | | | — | | | | — | | | | 7 | | | | 29 | | | | — | | | | 54 | |
TOTAL - Attributable basis | | $ | 348 | | | $ | 21 | | | $ | 2 | | | $ | 8 | | | $ | 129 | | | $ | 508 | | | | 508 | | | $ | 999 | |
Less associates and joint ventures | | | (66 | ) | | | — | | | | — | | | | (3 | ) | | | (22 | ) | | | (91 | ) | | | (113 | ) | | | (798 | ) |
Total - Consolidated | | $ | 282 | | | $ | 21 | | | $ | 2 | | | $ | 5 | | | $ | 107 | | | $ | 417 | | | | 395 | | | $ | 1,056 | |
GOLDCORP | 38
(in United States dollars, tabular amounts in millions, except where noted)
Three months ended September 30, 2017:
| | Total cash costs: by- product | | | Corporate Administration | | | Exploration and evaluation costs | | | Reclamation cost accretion and amortization | | | Sustaining capital expenditures | | | Total AISC | | | Ounces (thousands) | | | Total AISC per ounce (1) | |
Peñasquito | | $ | (22 | ) | | $ | — | | | $ | 1 | | | $ | 2 | | | $ | 58 | | | $ | 39 | | | | 133 | | | $ | 288 | |
Cerro Negro | | | 61 | | | | — | | | | 5 | | | | 2 | | | | 16 | | | | 84 | | | | 118 | | | | 712 | |
Pueblo Viejo | | | 42 | | | | — | | | | — | | | | 2 | | | | 15 | | | | 59 | | | | 95 | | | | 612 | |
Red Lake | | | 37 | | | | — | | | | 1 | | | | — | | | | 16 | | | | 54 | | | | 38 | | | | 1,417 | |
Éléonore | | | 59 | | | | — | | | | 2 | | | | — | | | | 18 | | | | 79 | | | | 74 | | | | 1,067 | |
Porcupine | | | 53 | | | | — | | | | 1 | | | | 3 | | | | 12 | | | | 69 | | | | 70 | | | | 978 | |
Musselwhite | | | 33 | | | | — | | | | 2 | | | | 2 | | | | 1 | | | | 38 | | | | 57 | | | | 674 | |
Other mines | | | 28 | | | | — | | | | 0 | | | | 4 | | | | 1 | | | | 33 | | | | 21 | | | | 1,611 | |
Corporate (2) | | | — | | | | 40 | | | | 1 | | | | — | | | | 6 | | | | 47 | | | | — | | | | 78 | |
TOTAL - Attributable basis | | $ | 291 | | | $ | 40 | | | $ | 13 | | | $ | 15 | | | $ | 143 | | | $ | 502 | | | | 606 | | | $ | 827 | |
Less associates and joint ventures | | | (71 | ) | | | — | | | | — | | | | (6 | ) | | | (16 | ) | | | (93 | ) | | | (116 | ) | | | (793 | ) |
Total - Consolidated | | $ | 220 | | | $ | 40 | | | $ | 13 | | | $ | 9 | | | $ | 127 | | | $ | 409 | | | | 490 | | | $ | 835 | |
Nine months ended September 30, 2018:
| | Total cash costs: by- product | | | Corporate Administration | | | Exploration and evaluation costs | | | Reclamation cost accretion and amortization | | | Sustaining capital expenditures | | | Total AISC | | | Ounces (thousands) | | | Total AISC per ounce (1) | |
Peñasquito | | $ | (1 | ) | | $ | — | | | $ | 4 | | | $ | 7 | | | $ | 141 | | | $ | 151 | | | | 220 | | | $ | 681 | |
Cerro Negro | | | 153 | | | | — | | | | 2 | | | | 1 | | | | 35 | | | | 191 | | | | 350 | | | | 550 | |
Pueblo Viejo | | | 135 | | | | — | | | | — | | | | 4 | | | | 44 | | | | 183 | | | | 280 | | | | 653 | |
Red Lake | | | 145 | | | | — | | | | 1 | | | | 2 | | | | 40 | | | | 188 | | | | 163 | | | | 1,152 | |
Éléonore | | | 201 | | | | — | | | | — | | | | 1 | | | | 35 | | | | 237 | | | | 237 | | | | 1,001 | |
Porcupine | | | 143 | | | | — | | | | 4 | | | | 6 | | | | 30 | | | | 183 | | | | 190 | | | | 965 | |
Musselwhite | | | 113 | | | | — | | | | 2 | | | | 1 | | | | 24 | | | | 140 | | | | 158 | | | | 891 | |
Other mines | | | 54 | | | | — | | | | — | | | | 2 | | | | 2 | | | | 58 | | | | 57 | | | | 1,024 | |
Corporate (2) | | | — | | | | 101 | | | | 3 | | | | — | | | | 24 | | | | 128 | | | | — | | | | 77 | |
TOTAL - Attributable basis | | $ | 943 | | | $ | 101 | | | $ | 16 | | | $ | 24 | | | $ | 375 | | | $ | 1,459 | | | | 1,655 | | | $ | 882 | |
Less associates and joint ventures | | | (190 | ) | | | — | | | | — | | | | (6 | ) | | | (46 | ) | | | (242 | ) | | | (337 | ) | | | (716 | ) |
Total - Consolidated | | $ | 753 | | | $ | 101 | | | $ | 16 | | | $ | 18 | | | $ | 329 | | | $ | 1,217 | | | | 1,318 | | | $ | 924 | |
GOLDCORP | 39
(in United States dollars, tabular amounts in millions, except where noted)
Nine months ended September 30, 2017:
| | Total cash costs: by- product | | | Corporate Administration | | | Exploration and evaluation costs | | | Reclamation cost accretion and amortization | | | Sustaining capital expenditures | | | Total AISC | | | Ounces (thousands) | | | Total AISC per ounce (1) | |
Peñasquito | | $ | (7 | ) | | $ | — | | | $ | 2 | | | $ | 6 | | | $ | 135 | | | $ | 136 | | | | 404 | | | $ | 336 | |
Cerro Negro | | | 153 | | | | — | | | | 7 | | | | 6 | | | | 50 | | | | 216 | | | | 313 | | | | 689 | |
Pueblo Viejo | | | 122 | | | | — | | | | — | | | | 4 | | | | 34 | | | | 160 | | | | 304 | | | | 525 | |
Red Lake | | | 132 | | | | — | | | | 2 | | | | 1 | | | | 46 | | | | 181 | | | | 150 | | | | 1,206 | |
Éléonore | | | 181 | | | | — | | | | 3 | | | | 1 | | | | 54 | | | | 239 | | | | 214 | | | | 1,115 | |
Porcupine | | | 152 | | | | — | | | | 2 | | | | 8 | | | | 33 | | | | 195 | | | | 192 | | | | 1,012 | |
Musselwhite | | | 109 | | | | — | | | | 6 | | | | 2 | | | | 15 | | | | 132 | | | | 168 | | | | 789 | |
Other mines | | | 130 | | | | — | | | | 1 | | | | 11 | | | | 3 | | | | 145 | | | | 156 | | | | 936 | |
Corporate (2) | | | — | | | | 112 | | | | 2 | | | | — | | | | 19 | | | | 133 | | | | — | | | | 70 | |
TOTAL - Attributable basis | | $ | 972 | | | $ | 112 | | | $ | 25 | | | $ | 39 | | | $ | 389 | | | $ | 1,537 | | | | 1,901 | | | $ | 808 | |
Less associates and joint ventures | | | (190 | ) | | | — | | | | — | | | | (13 | ) | | | (35 | ) | | | (238 | ) | | | (375 | ) | | | (635 | ) |
Total - Consolidated | | $ | 782 | | | $ | 112 | | | $ | 25 | | | $ | 26 | | | $ | 354 | | | $ | 1,299 | | | | 1,526 | | | $ | 851 | |
| (1) | AISC may not calculate based on amounts presented in these tables due to rounding. |
| (2) | AISC for Corporate is calculated using total corporate expenditures and the Company's attributable gold sales ounces. |
Sustaining capital expenditures are defined as those expenditures which do not increase annual gold ounce production at a mine site and excludes all expenditures at the Company’s projects and certain expenditures at the Company’s operating sites which are deemed expansionary in nature. Sustaining capital expenditures can include, but are not limited to, capitalized stripping costs at open pit mines, underground mine development, mining and milling equipment and tailings dam raises. The following table reconciles sustaining capital expenditures to the Company’s total capital expenditures for continuing operations:
| | Three months ended September 30 | | | Nine months ended September 30 | |
| | 2018 | | | 2017 | | | 2018 | | | 2017 | |
Expenditures on mining interests per consolidated financial statements | | $ | 293 | | | $ | 265 | | | $ | 866 | | | $ | 666 | |
Payment of finance lease obligations per consolidated financial statements | | | 2 | | | | 2 | | | | 6 | | | | 5 | |
Expenditures on mining interests by Pueblo Viejo, Alumbrera, Leagold and NuevaUnión (1) | | | 23 | | | | 24 | | | | 51 | | | | 39 | |
Goldcorp’s share of expenditures on mining interests and deposits | | $ | 318 | | | $ | 291 | | | $ | 923 | | | $ | 710 | |
Sustaining capital expenditures | | $ | 129 | | | $ | 143 | | | $ | 375 | | | $ | 389 | |
Expansionary capital expenditures | | | 189 | | | | 148 | | | | 548 | | | | 321 | |
| | $ | 318 | | | $ | 291 | | | $ | 923 | | | $ | 710 | |
| (1) | Expenditures on mining interests by Pueblo Viejo, Alumbrera, NuevaUnión and Leagold represent mining interest expenditures, net of additional funding investments, which are included in expenditures on mining interests per the consolidated financial statements. |
GOLDCORP | 40
(in United States dollars, tabular amounts in millions, except where noted)
The following table provides a reconciliation of exploration, evaluation and project costs in the consolidated financial statements to exploration and evaluation costs included in the calculation of Goldcorp’s AISC:
| | Three months ended September 30 | | | Nine months ended September 30 | |
| | 2018 | | | 2017 | | | 2018 | | | 2017 | |
Exploration, evaluation and project costs per the consolidated financial statements | | $ | 24 | | | $ | 19 | | | $ | 63 | | | $ | 40 | |
Project exploration costs | | | (13 | ) | | | — | | | | (13 | ) | | | (3 | ) |
Non-sustaining project costs | | | (9 | ) | | | (6 | ) | | | (34 | ) | | | (12 | ) |
Exploration, evaluation and project costs per AISC | | $ | 2 | | | $ | 13 | | | $ | 16 | | | $ | 25 | |
Non-GAAP Measure - Adjusted Operating Cash Flows
Adjusted operating cash flows comprises Goldcorp’s share of operating cash flows before working capital changes, calculated on an attributable basis to include the Company's share of Pueblo Viejo, Alumbrera, NuevaUnión and Leagold's operating cash flows before working capital changes. The Company believes that, in addition to conventional measures prepared in accordance with GAAP, the Company and certain investors use this information to evaluate the Company’s performance and ability to operate without reliance on additional external funding or use of available cash.
Prior to April 1, 2017, adjusted operating cash flows was presented on an attributable basis using operating cash flows as shown on the Company's statement of cash flows. In the second quarter of 2017, the Company revised its presentation of adjusted operating cash flows to present it on an attributable basis before working capital changes. The Company believes that this measure provides a better measure of the Company's performance of its core business operations as the Company can experience changes in working capital from one period to another which, at times, are not indicative of the performance of the Company’s business operations.
The following table provides a reconciliation of net cash provided by operating activities in the consolidated financial statements to Goldcorp’s share of adjusted operating cash flows:
| | Three months ended September 30 | | | Nine months ended September 30 | |
| | 2018 | | | 2017 | | | 2018 | | | 2017 | |
Net cash provided by operating activities of continuing operations | | $ | 193 | | | $ | 315 | | | $ | 622 | | | $ | 700 | |
Change in working capital | | | (63 | ) | | | (57 | ) | | | 57 | | | | 43 | |
Adjusted operating cash flows provided by Pueblo Viejo, Alumbrera and Leagold | | | 41 | | | | 50 | | | | 152 | | | | 200 | |
Goldcorp’s share of adjusted operating cash flows | | $ | 171 | | | $ | 308 | | | $ | 831 | | | $ | 943 | |
Non-GAAP Measure - EBITDA and Adjusted EBITDA
Earnings before interest, taxes and depreciation and amortization ("EBITDA") is a non-GAAP financial measure which excludes the following items from net earnings:
| • | depreciation and depletion. |
Adjusted EBITDA removes the impact of impairments or reversals of impairment and other non-cash expenses or recoveries and is calculated on an attributable basis to include the Company's share of Pueblo Viejo, Alumbrera, NuevaUnión and Leagold's earnings before interest, taxes and depreciation and depletion. The non-cash expenses and recoveries are removed from the calculation of EBITDA as the Company does not believe they are reflective of the Company's ability to generate liquidity and its core operating results.
GOLDCORP | 41
(in United States dollars, tabular amounts in millions, except where noted)
The Company believes that, in addition to conventional measures prepared in accordance with GAAP, the Company and certain investors use EBITDA and Adjusted EBITDA as an indicator of the Company's ability to generate liquidity by producing operating cash flow to fund working capital needs, service debt obligations and fund capital expenditures. EBITDA is also frequently used by investors and analysts for valuation purposes whereby EBITDA is multiplied by a factor or "EBITDA multiple" that is based on an observed or inferred relationship between EBITDA and market values to determine the approximate total enterprise value of a company.
EBITDA and Adjusted EBITDA are intended to provide additional information to investors and analysts and do not have any standardized definition under IFRS and should not be considered in isolation or as a substitute for measures of performance prepared in accordance with IFRS. EBITDA and Adjusted EBITDA exclude the impact of cash costs of financing activities and taxes, and the effects of changes in operating working capital balances, and therefore are not necessarily indicative of operating profit or cash flow from operations as determined under IFRS. Other companies may calculate EBITDA and Adjusted EBITDA differently.
The following table provides a reconciliation of net earnings in the consolidated financial statements to EBITDA and Adjusted EBITDA:
| | Three months ended September 30 | | | Nine months ended September 30 | |
| | 2018 | | | 2017 | | | 2018 | | | 2017 | |
Net earnings | | $ | (101 | ) | | $ | 111 | | | $ | (165 | ) | | $ | 416 | |
Income tax expense (recovery) | | | 16 | | | | (19 | ) | | | 176 | | | | (124 | ) |
Depreciation and depletion | | | 227 | | | | 250 | | | | 734 | | | | 735 | |
Finance income | | | (9 | ) | | | (10 | ) | | | (28 | ) | | | (29 | ) |
Finance costs | | | 29 | | | | 31 | | | | 85 | | | | 104 | |
EBITDA | | $ | 162 | | | $ | 363 | | | $ | 802 | | | $ | 1,102 | |
Share of net earnings related to associates and joint venture | | | (13 | ) | | | (27 | ) | | | (60 | ) | | | (128 | ) |
Associates and joint venture EBITDA | | | 82 | | | | 59 | | | | 242 | | | | 260 | |
Reversal of impairment of mining interests, net | | | — | | | | — | | | | — | | | | (3 | ) |
Loss on disposition of mining interest, net of transaction costs | | | — | | | | — | | | | — | | | | 6 | |
Non-cash share-based compensation | | | 6 | | | | 5 | | | | 20 | | | | 22 | |
Adjusted EBITDA | | $ | 237 | | | $ | 400 | | | $ | 1,004 | | | $ | 1,259 | |
The following table provides a reconciliation of net cash provided by operating activities in the consolidated financial statements to EBITDA and Adjusted EBITDA:
| | Three months ended September 30 | | | Nine months ended September 30 | |
| | 2018 | | | 2017 | | | 2018 | | | 2017 | |
Net cash provided by operating activities | | $ | 193 | | | $ | 315 | | | $ | 622 | | | $ | 700 | |
Current income tax expense | | | 24 | | | | 70 | | | | 81 | | | | 187 | |
Share of net earnings related to associates and joint venture | | | 13 | | | | 27 | | | | 60 | | | | 128 | |
Reversal of impairment of mining interests, net | | | — | | | | — | | | | — | | | | 3 | |
Increase in working capital | | | (63 | ) | | | (57 | ) | | | 57 | | | | 43 | |
Finance costs | | | 29 | | | | 31 | | | | 85 | | | | 104 | |
Finance income | | | (9 | ) | | | (10 | ) | | | (28 | ) | | | (29 | ) |
Other non-cash adjustments | | | (25 | ) | | | (13 | ) | | | (75 | ) | | | (34 | ) |
EBITDA | | $ | 162 | | | $ | 363 | | | $ | 802 | | | $ | 1,102 | |
Share of net earnings related to associates and joint venture | | | (13 | ) | | | (27 | ) | | | (60 | ) | | | (128 | ) |
Associates and joint venture EBITDA | | | 82 | | | | 59 | | | | 242 | | | | 260 | |
Reversal of impairment of mining interests, net | | | — | | | | 0 | | | | — | | | | (3 | ) |
Loss on disposition of mining interest, net of transaction costs | | | — | | | | 0 | | | | — | | | | 6 | |
Non-cash share-based compensation | | | 6 | | | | 5 | | | | 20 | | | | 22 | |
Adjusted EBITDA | | $ | 237 | | | $ | 400 | | | $ | 1,004 | | | $ | 1,259 | |
GOLDCORP | 42
(in United States dollars, tabular amounts in millions, except where noted)
Non-GAAP Measure - Adjusted Net Debt
Adjusted net debt is comprised of Goldcorp’s short-term and long-term debt less cash and cash equivalents and short term investments, calculated on an attributable basis to include the Company's share of Pueblo Viejo, Alumbrera, Leagold and NuevaUnión's net debt. The Company believes that, in addition to conventional measures prepared in accordance with GAAP, the Company and certain investors use this information to evaluate the Company’s financial position and its ability to take on new debt in the future to expand operations, purchase new assets or withstand adverse economic conditions.
The following table provides a reconciliation of short and long-term debt to adjusted net debt:
| | September 30 2018 | | | December 31 2017 | |
Current portion of long-term debt | | $ | 400 | | | $ | 499 | |
Long-term debt | | | 2,336 | | | | 1,984 | |
Cash and cash equivalents | | | (125 | ) | | | (186 | ) |
Short term investments | | | (41 | ) | | | (48 | ) |
Net Debt | | | 2,570 | | | | 2,249 | |
Debt of associates and joint venture | | | — | | | | — | |
Cash and short term investments of associates and joint venture | | | (208 | ) | | | (163 | ) |
Adjusted Net Debt | | $ | 2,362 | | | $ | 2,086 | |
RISKS AND UNCERTAINTIES
Financial Instruments Risk Exposure
The Company manages its exposure to financial risks, including credit risk, liquidity risk, currency risk, interest rate risk and price risk, in accordance with its Financial Risk Management Policy. The Company's exposures to financial risks and how the Company manages each of those risks are described in note 26(e) to the Company's consolidated financial statements for the year ended December 31, 2017. There were no significant changes to the Company's exposures to those risks or to the Company's management of its exposures during the nine months ended September 30, 2018 except as noted below.
(i) Market risk
Currency risk
Currency risk is the risk that the fair values or future cash flows of the Company’s financial instrument will fluctuate because of changes in foreign exchange rates. Exchange rate fluctuations may affect the costs that the Company incurs in its operations. Gold, silver, copper, lead and zinc are sold in US dollars and the Company’s costs are incurred principally in US dollars, Canadian dollars, Mexican pesos and Argentinean pesos. The appreciation or depreciation of non-US dollar currencies against the US dollar can increase or decrease the cost of metal production and capital expenditures in US dollar terms. The Company also holds cash and cash equivalents that are denominated in non-US dollar currencies which are subject to currency risk. Accounts receivable and other current and non-current assets denominated in non-US dollar currencies relate to goods and services taxes, income taxes, value-added taxes and insurance receivables. The Company is further exposed to currency risk through non-monetary assets and liabilities and tax bases of assets, liabilities and losses of entities whose taxable profit or tax loss are denominated in non-US currencies. Changes in exchange rates give rise to temporary differences resulting in a deferred tax liability or asset with the resulting deferred tax charged or credited to income tax expense.
During the three and nine months ended September 30, 2018, the Company recognized a net foreign exchange loss of $1 million and $21 million, respectively (three and nine months ended September 30, 2017 – loss of $11 million and gain of $6 million, respectively), and a net foreign exchange loss of $23 million and $215 million, respectively, in income tax expense on income taxes receivable (payable) and deferred income taxes (three and nine months ended September 30, 2017 – gain of $24 million and $87 million, respectively).
GOLDCORP | 43
(in United States dollars, tabular amounts in millions, except where noted)
Based on the Company’s net foreign currency exposures at September 30, 2018, depreciation or appreciation of applicable foreign currencies against the US dollar would have resulted in the following increase or decrease in the Company's net loss:
At September 30, 2018 | | Possible exposure (1) | | | Impact on net loss excluding foreign currency exchange exposure related to taxes | | | Impact on net loss from foreign currency exchange exposure related to taxes | |
Canadian dollar | | 10% | | | $ | 12 | | | $ | 105 | |
Mexican peso | | 10% | | | | 9 | | | | 57 | |
Argentine peso (2) | | 25% | | | | 1 | | | | 40 | |
(1) Possible exposure is based on management’s best estimate of the reasonably possible fluctuation of the foreign exchange rates in the next twelve months.
(2) The Argentine peso devalued significantly since the beginning of 2018; as a result, the possible exposure used to estimate the potential impact of the depreciation or appreciation of the Argentine peso to the Company’s net earnings in the table above has been increased to 25% as compared to 15% as included in the Company’s audited Consolidated Financial Statements for the year ended December 31, 2017.
(ii) Liquidity risk
During the three and nine months ended September 30, 2018, the Company generated cash flows from operations, one of the Company's main sources of liquidity, of $193 million and $622 million, respectively (three and nine months ended September 30, 2017 – $315 million and $700 million, respectively). At September 30, 2018, Goldcorp held cash and cash equivalents of $125 million (December 31, 2017 – $186 million) and short-term investments of $41 million (December 31, 2017 – $48 million). At September 30, 2018, the Company's working capital, defined as current assets less current liabilities, was negative $190 million (December 31, 2017 – negative $112 million), which was primarily due to the Company’s one-year non-revolving term loan agreements, totaling $400 million that are due on March 14, 2019. The Company intends to repay the term loans using cash flow from operations, draws on its credit facility, and/or other short-term bank facilities in March 2019.
On March 14, 2018, the Company entered into three one-year non-revolving term loan agreements, totaling $400 million. The term loans bear interest at LIBOR plus 0.65%, reset monthly, and are repayable before March 14, 2019 without penalty. The proceeds from the term loans were used to repay the $500 million 2.125% note that was due on March 15, 2018.
On June 29, 2018, the Company completed the extension of its $3.0 billion credit facility term by one year to June 30, 2023. The unsecured, floating rate facility bears interest at LIBOR plus 140 points when draw and 20 points on the undrawn amount, based on Goldcorp’s current bond ratings, and is intended to be used for liquidity and general corporate purposes. At September 30, 2018, the balance outstanding on the revolving credit facility was $350 million (December 31, 2017 – $nil) with $2.65 billion available for the Company's use (December 31, 2017 – $3.0 billion). Certain of the Company's borrowings are subject to various financial and general covenants with which the Company was in compliance at September 30, 2018.
At September 30, 2018, the Company had letters of credit outstanding in the amount of $421 million (December 31, 2017 – $420 million) of which $325 million (December 31, 2017 – $323 million) represented guarantees for reclamation obligations. The Company's capital commitments for the next twelve months amounted to $343 million at September 30, 2018, including the Company's funding obligation for the Norte Abierto Project for the next twelve months.
Other Risks and Uncertainties
This section describes the principal risks and uncertainties that could have an adverse effect on the Company's business and financial results.
GOLDCORP | 44
(in United States dollars, tabular amounts in millions, except where noted)
Mining Operations
The Company’s operations are subject to all of the hazards and risks normally encountered in the exploration, development and production of gold, silver, zinc, copper and lead including unusual and unexpected geologic formations, seismic activity, rock bursts, rock slides, ground or stope instabilities or failures, cave-ins, mechanical failures, flooding and other conditions involved in the drilling and removal of material, any of which could result in damage to, or destruction of, mines and other producing facilities, damage to life or property, environmental damage and possible legal liability. Mining and milling operations are subject to hazards such as equipment failure or failure of retaining dams around tailings disposal areas which may result in environmental pollution and consequent liability.
The waste rock (including overburden) and tailings produced in the Company’s mining operations represent its largest volume of waste. Managing the volume of waste rock and tailings presents significant environmental, safety and engineering challenges and risks. Waste rock dumps and structures must be engineered, constructed, and monitored to ensure structural stability, to avoid structural collapse, and to monitor the precipitation flow through the waste rock dump, which flow may contain acidic components and potentially mobilize unwanted metals.
The Company maintains large leach pads and tailings impoundments containing viscous material, effectively large rock structures containing both fine sand and coarse rock, which must be engineered, constructed and monitored to assure structural stability and avoid leakages or structural collapse. The Company’s tailings impoundments must have effective programs to suppress fugitive dust emissions, and the Company must effectively monitor and treat acid rock drainage of a structural nature in tailings facilities at all of the Company’s operations. The failure of tailings and other impoundments at any of Goldcorp’s mining operations could cause severe property and environmental damage and loss of life.
Commodity Prices
The majority of the Company's revenues are derived from the sale of gold, silver and zinc, and to a lesser extent, copper and lead. The price of the Company’s Common Shares, its financial results and exploration, and its development and mining activities in the future may be materially adversely affected by a decline in the price of gold, silver, zinc, copper and lead. Gold, silver, zinc, copper and lead prices fluctuate widely and are affected by numerous factors beyond the Company’s control, such as the sale or purchase of metals by various central banks and financial institutions, interest rates, exchange rates, inflation or deflation, fluctuation in the value of the United States dollar and foreign currencies, global and regional supply and demand, and the political and economic conditions of major metals-producing and metals-consuming countries throughout the world. Future price declines could cause continued development of, and commercial production from, certain of Goldcorp’s properties to be uneconomic. Depending on the price of gold, silver, zinc, copper and lead, cash flow from mining operations may not be sufficient and the Company could be forced to discontinue production at, may lose its interest in, or may be forced to sell, some of its properties. Future production from the Company’s mining properties is dependent on the price of gold, silver, zinc, copper and lead that are adequate to make these properties economically viable.
Estimates of Future Production
The Company prepares estimates and projections of its future production. Any such information is forward-looking and no assurance can be given that such estimates will be achieved. These estimates are based on existing mine plans and other assumptions that change from time to time, including the availability, accessibility, sufficiency and quality of ore, the Company’s costs of production, its ability to sustain and increase production levels, the sufficiency of its infrastructure, the performance of its workforce and equipment, the ability to maintain and obtain mining interests and permits and the Company’s compliance with existing and future laws and regulations. The Company’s actual production may vary from estimates for a variety of reasons, including: actual ore mined varying from estimates of grade, tonnage, dilution and metallurgical and other characteristics; short-term operating factors relating to the Mineral Reserves, such as the need for sequential development of orebodies and the processing of new or different ore grades; revisions to mine plans; unusual or unexpected orebody formations; risks and hazards associated with mining; natural phenomena, such as inclement weather conditions, water availability, floods, and earthquakes; and unexpected labor shortages, strikes, local community opposition or blockades. Failure to achieve the estimated forecasts could have an adverse impact on the Company’s future cash flows, business, results of operations and financial condition.
Foreign Operations
The majority of the Company’s foreign operations are conducted in Mexico, Argentina, the Dominican Republic and Chile, and as such the Company’s operations are exposed to various levels of political, economic and other risks and uncertainties. These risks and uncertainties vary from country to country and include, but are not limited to, terrorism; hostage taking; military repression; expropriation; extreme fluctuations in currency exchange rates; high rates of inflation; labour unrest, opposition or blockades; the risks of war, civil unrest, protests or blockades; renegotiation or nullification of existing concessions, licenses, permits and contracts; ability of governments to unilaterally alter agreements; government imposed local contracting and purchase laws, including laws establishing, among other things, profit margins, production quotas, maximum and minimum price levels and the ability to confiscate
GOLDCORP | 45
(in United States dollars, tabular amounts in millions, except where noted)
merchandise in certain circumstances; surface land access issues; illegal mining; changes in taxation policies, practices, regulations and laws and the application thereof; restrictions on foreign exchange and repatriation; and changing political conditions, currency controls and governmental regulations that impose local procurement requirements or require foreign contractors to employ citizens of, or purchase supplies from, a particular jurisdiction.
In addition, adverse changes in mining or investment policies or shifts in political attitude in Mexico, Argentina, the Dominican Republic and Chile may adversely affect the Company’s operations or profitability. Operations may be affected in varying degrees by government regulations with respect to, but not limited to, restrictions on production, price controls, export controls, import restrictions on equipment, services and supplies, currency remittance, income taxes, expropriation of property, foreign investment, maintenance of claims, environmental legislation, land use, surface land access, land claims of local people, water use and mine safety.
Failure to comply strictly with applicable laws, regulations and local practices relating to mineral rights applications and tenure, environmental requirements, land and water use, could result in loss, reduction or expropriation of entitlements, or the imposition of additional local or foreign parties as joint venture partners with carried or other interests. The occurrence of these various factors and uncertainties related to the economic and political risks of operating in foreign jurisdictions cannot be accurately predicted and could have a material adverse effect on the Company’s operations or profitability.
Government Regulation
The Company’s mining, processing, development and mineral exploration activities are subject to various laws governing prospecting, development, production, taxes, labour standards and occupational health, mine safety, toxic substances, land use, water use, land claims of local and indigenous people and other matters. No assurance can be given that new rules and regulations will not be enacted or that existing rules and regulations will not be applied in a manner which could limit or curtail production or development. Amendments to current laws and regulations governing operations and activities of mining and milling or more stringent implementation thereof could have a material adverse impact on the operations and financial position of the Company. Changes to laws regarding mining royalties or taxes, or other elements of a country’s fiscal regime, may also adversely affect the Company’s costs of operations and financial results.
In addition, as governments continue to struggle with deficits and concerns over the effects of depressed economies, the mining and metals sector has been targeted to raise revenue. Governments are continually assessing the fiscal terms of the economic rent for a mining company to exploit resources in their countries. Numerous countries, including, but not limited to, Argentina, Australia, Brazil, Chile, the Dominican Republic, Guatemala, Honduras, Mexico and Venezuela, have implemented changes to their respective mining regimes that reflect increased government control or participation in the mining sector, including changes of law affecting foreign ownership and take-overs, mandatory government participation, taxation and royalties, working conditions, rates of exchange, exchange control, exploration licensing, export duties, repatriation of income or return of capital, environmental protection, as well as requirements for local procurement of goods, supplies and employment or other benefits to be provided to local residents.
The occurrence of mining regime changes in both developed and developing countries adds uncertainties that cannot be accurately predicted and any future adverse changes in government policies or legislation in the jurisdictions in which the Company operates that affect foreign ownership, mineral exploration, development or mining activities, may affect our viability and profitability.
Environmental Regulation
The Company’s operations are subject to environmental regulation in the various jurisdictions in which it operates. These regulations mandate, among other things, the maintenance of air and water quality standards and land reclamation. They also set out limitations on the generation, transportation, storage and disposal of solid and hazardous waste. Environmental legislation is evolving in a manner that will likely, in the future, require stricter standards and enforcement, increased fines and penalties for non-compliance, more stringent environmental assessments of proposed projects and a heightened degree of responsibility for companies and their officers, directors and employees. Continuing issues with tailings dam failures at other companies' operations may increase the likelihood that these stricter standards and enforcement mechanisms will be implemented in the future. The Company can provide no assurance that future changes in environmental regulation will not adversely affect the Company's results of operations. Failure to comply with these laws, regulations and permitting requirements may result in enforcement actions, including orders issued by regulatory or judicial authorities causing operations to cease or be curtailed, and may include corrective measures requiring capital expenditures, installation of additional equipment, or remedial actions. Parties engaged in mining operations or in the exploration or development of mineral properties may also be required to compensate those suffering loss or damage due to the mining activities and may have civil or criminal fines or penalties imposed for violations of applicable laws or regulations. The occurrence of any environmental violation or enforcement action may have an adverse impact on the Company’s reputation and could adversely affect its results of operations. In addition, production at certain of the Company’s mines involves the use of sodium cyanide or other reagents and exposes rock material that could cause toxicity to the environment if released or not properly managed. Should sodium cyanide, other reagents, or contact water be improperly managed, leak or otherwise be discharged from the containment system, the Company may become subject to liability for clean-up work that may not be insured. In the event of any discharges of pollutants into the ground water and the environment, the Company may become subject to liability for hazards that we may not be insured against.
GOLDCORP | 46
(in United States dollars, tabular amounts in millions, except where noted)
Other Risks
For further information regarding the Company’s operational risks, please refer to the section entitled “Description of the Business - Risk Factors” in the Company's most recent annual information form available on SEDAR at www.sedar.com and on EDGAR at www.sec.gov.
ACCOUNTING MATTERS
Basis of Preparation
The Company's unaudited condensed interim consolidated financial statements have been prepared in accordance with International Accounting Standard 34 – Interim Financial Reporting ("IAS 34") as issued by the International Accounting Standards Board ("IASB"). Accordingly, certain disclosures included in the annual financial statements prepared in accordance with International Financial Reporting Standards ("IFRSs") as issued by the IASB have been condensed or omitted. The Company's unaudited condensed interim consolidated financial statements should be read in conjunction with the Company’s audited consolidated financial statements for the year ended December 31, 2017.
The accounting policies applied in the preparation of the Company's unaudited condensed interim consolidated financial statements are consistent with those applied and disclosed in the Company’s audited consolidated financial statements for the year ended December 31, 2017, except for the following:
Financial instruments
On January 1, 2018, the Company adopted IFRS 9 – Financial Instruments ("IFRS 9") which replaced IAS 39 – Financial Instruments: Recognition and Measurement. IFRS 9 provides a revised model for recognition and measurement of financial instruments and a single, forward-looking 'expected loss' impairment model. IFRS 9 also includes significant changes to hedge accounting. The standard is effective for annual periods beginning on or after January 1, 2018. The Company adopted the standard using the modified retrospective approach, except for hedge accounting, which was applied prospectively. IFRS 9 did not impact the Company's accounting policies for the classification and measurement of financial assets and liabilities except for equity securities as described below. The standard also had negligible impact on the carrying amounts of the Company’s financial instruments at the transition date.
The following summarizes the significant changes in IFRS 9 compared to the current standard:
• | IFRS 9 uses a single approach to determine whether a financial asset is classified and measured at amortized cost or fair value. The classification and measurement of financial assets is based on the Company's business models for managing its financial assets and whether the contractual cash flows represent solely payments for principal and interest. Most of the requirements in IAS 39 for classification and measurement of financial liabilities were carried forward in IFRS 9. The change did not impact the carrying amounts of any of our financial assets on the transition date. The Company designated its equity securities as financial assets at fair value through other comprehensive income ("FVTOCI"), where they will be recorded initially at fair value. Subsequent changes in fair value will be recognized in other comprehensive income only and will not be transferred into earnings (loss) upon disposition. As a result of this change, the Company reclassified $46 million of impairment losses recognized in prior years on certain equity securities which continue to be owned by the Company as at January 1, 2018 from opening deficit to accumulated other comprehensive income on January 1, 2018. As a result of adopting IFRS 9, the net change in fair value of the equity securities, including realized and unrealized gains and losses, if any, is now presented as an item that will not be reclassified subsequently to net earnings in the Consolidated Statements of Comprehensive Income. Realized gains and losses on securities derecognized prior to January 1, 2018 have not been restated in prior year comparatives. |
• | The adoption of the new "expected credit loss" impairment model under IFRS 9, as opposed to an incurred credit loss model under IAS 39, had a negligible impact on the carrying amounts of our financial assets on the transition date given the Company transacts exclusively with large international financial institutions and other organizations with strong credit ratings and the negligible historical level of customer default. |
• | The new general hedge accounting requirements retain the three types of hedge accounting mechanisms previously available under IAS 39. Under IFRS 9 however, greater flexibility has been introduced to the types of transactions eligible for hedge accounting, specifically broadening the types of instruments that qualify for hedging instruments and the types of risk components of non-financial items that are eligible for hedge accounting. As a result, certain of the Company's hedging strategies and hedging instruments that did not qualify for hedge accounting previously, primarily the hedging of forecasted concentrate sales, are now eligible for hedge accounting. In addition, the effectiveness test has been replaced with the principle of an "economic relationship". Retrospective assessment of hedge effectiveness is also no longer required. Enhanced disclosure requirements about an entity's risk management activities have also been introduced. As a result, subsequent to the adoption of IFRS 9, the Company hedged a certain percentage of its forecasted zinc and lead sales and designated these contracts as hedges for accounting purposes. These contracts were entered into during the nine months ended September 30, |
GOLDCORP | 47
(in United States dollars, tabular amounts in millions, except where noted)
| 2018. The Company did not designate its economic hedges that existed as at January 1, 2018 as hedges for accounting purposes. |
The Company has also adopted a narrow scope amendment to IFRS 7 - Financial Instruments - Disclosures. As a result of applying the amendment, the Company will add disclosure relating to its risk management strategies for which hedge accounting is applied in its consolidated financial statements for the year ended December 31, 2018.
Revenue recognition
On January 1, 2018, the Company adopted IFRS 15 – Revenue from Contracts with Customers ("IFRS 15") which supersedes IAS 18 – Revenue ("IAS 18"). IFRS 15 establishes a single five-step model framework for determining the nature, amount, timing and uncertainty of revenue and cash flows arising from a contract with a customer. The standard is effective for annual periods beginning on or after January 1, 2018. The Company adopted the standard on January 1, 2018 using the full retrospective approach without applying any practical expedients.
IFRS 15 requires entities to recognize revenue when ‘control’ of goods or services transfers to the customer whereas the previous standard, IAS 18, required entities to recognize revenue when the ‘risks and rewards’ of the goods or services transfer to the customer. The Company concluded there is no change in the timing of revenue recognition of its bullion, doré and concentrate sales under the new standard as the point of transfer of risks and rewards of goods and services and transfer of control occur at the same time. As such, no adjustment was required to the Company's financial statements.
Additionally, IFRS 15 requires entities to apportion the transaction price attributable to contracts from customers to distinct performance obligations on a relative standalone selling price basis. In accordance with the terms of certain of the Company's concentrate agreements, the Company must contract for and pay the shipping and insurance costs necessary to bring the goods to the named destination. Therefore, a portion of the revenue earned under these contracts, representing the obligation to fulfill the shipping and insurance services that occur after the transfer of control, is deferred and recognized over time as the obligations are fulfilled. The impact of this change was insignificant to the Company’s financial statements.
IFRS 15 requires that variable consideration should only be recognized to the extent that it is highly probable that a significant reversal in the amount of cumulative revenue recognized will not occur. The Company concluded that the adjustments relating to the final assay results for the quantity and quality of concentrate sold and the retroactive pricing adjustment for the new annual pricing terms are not significant and does not constrain the recognition of revenue.
Additional disclosures required as a result of adopting IFRS 9 and 15 have been presented in notes 3 and 11 of the notes to the Company's unaudited condensed interim consolidated financial statements for the nine months ended September 30, 2018.
Other narrow scope amendments/interpretations
The Company has adopted narrow scope amendments/interpretations to IFRIC 22 - Foreign Currency Transactions and Advance Consideration, IFRS 2 - Share Based Payments and IAS 1 - Presentation of Financial Statements, which did not have an impact on the Company's unaudited condensed interim consolidated financial statements.
Critical Judgements and Estimates
The Company’s management makes judgements in its process of applying the Company’s accounting policies in the preparation of its unaudited condensed interim consolidated financial statements. In addition, the preparation of the financial data requires that the Company’s management makes assumptions and estimates of the impacts of uncertain future events on the carrying amounts of the Company’s assets and liabilities at the end of the reporting period, and the reported amounts of revenues and expenses during the reporting period. Actual results may differ from those estimates as the estimation process is inherently uncertain. Estimates are reviewed on an ongoing basis based on historical experience and other factors that are considered to be relevant under the circumstances. Revisions to estimates and the resulting impacts on the carrying amounts of the Company’s assets and liabilities are accounted for prospectively.
Certain accounting judgements and estimates have been identified as being "critical" to the presentation of our financial condition and results of operations. Critical judgements and estimates are those that could have a material impact on the consolidated financial statements, are highly uncertain and are where changes are reasonably likely to occur from period to period. The Company's critical accounting judgements and estimates are generally discussed with the Audit Committee each quarter. The critical judgements and estimates applied in the preparation of the Company's unaudited condensed interim consolidated financial statements for the nine months ended September 30, 2018 are consistent with those applied and disclosed in notes 5 and 6 of its audited consolidated financial statements for the year ended December 31, 2017 and the following critical judgments in applying accounting policies:
GOLDCORP | 48
(in United States dollars, tabular amounts in millions, except where noted)
Revenue recognition
Determination of performance obligations
The Company applied judgement to determine if a good or service that is promised to a customer is distinct based on whether the customer can benefit from the good or service on its own or together with other readily available resources and whether the good or service is separately identifiable. Based on these criteria, the Company determined the primary performance obligation relating to its sales contracts is the delivery of the bullion, doré and concentrates. Shipping and insurance services arranged by the Company for its concentrate sales customers that occur after the transfer of control are also considered to be performance obligations.
Transfer of control
Judgement is required to determine when transfer of control occurs relating to the sale of the Company's bullion, doré and concentrate to its customers. Management based its assessment on a number of indicators of control, which include, but are not limited to whether the Company has present right of payment, and whether the physical possession of the goods, significant risks and rewards and legal title have been transferred to the customer.
Variable consideration
Variable consideration should only be recognized to the extent that it is highly probable that a significant reversal in the amount of cumulative revenue recognized will not occur. The Company identified two variable components in the sales proceeds it receives from its concentrate sales. They include (i) adjustments to the final sales price base on differences between the original and final assaying results relating to the quantity and quality of concentrate shipments and (ii) retroactive pricing adjustment based on new annual pricing terms. The Company applied judgement to determine the amount of variable consideration to be recognized during the period for which the likelihood of significant reversal is low.
Based on the Company's proficiency in its assaying process, evidenced by the insignificant amount of historical adjustments from the initial to final assays, the Company concluded the variability in consideration caused by assaying results is negligible. Therefore, the Company does not expect a significant amount of reversal in revenue related to assaying differences.
Changes in Accounting Standards Not Yet Effective
Leases
In January 2016, the IASB issued IFRS 16 – Leases ("IFRS 16") which replaces IAS 17 – Leases and its associated interpretative guidance. IFRS 16 applies a control model to the identification of leases, distinguishing between a lease and a service contract on the basis of whether the customer controls the asset. For those assets determined to meet the definition of a lease, IFRS 16 introduces significant changes to the accounting by lessees, introducing a single, on-balance sheet accounting model that is similar to the current finance lease accounting, with limited exceptions for short-term leases or leases of low value assets. Lessor accounting remains similar to current accounting practice. The standard is effective for annual periods beginning on or after January 1, 2019, with early application permitted for entities that apply IFRS 15. A lessee can choose to apply IFRS 16 using either a full retrospective or a modified retrospective approach. The Company plans to apply IFRS 16 at the date it becomes effective and has selected the modified retrospective transition approach which does not require restatement of comparative periods, instead the cumulative impact of applying IFRS 16 will be accounted for as an adjustment to equity at the start of the accounting period in which it is first applied. The Company will also elect to account for leases with lease terms that end within 12 months of the date of initial application as short term leases whereby the Company will recognize the lease payments as an expense over the lease term.
Upon the adoption of IFRS 16, the Company anticipates it will record a significant balance of lease assets and associated lease liabilities related to leases with a term of 12 months or more on the Consolidated Balance Sheet at January 1, 2019. Due to the recognition of additional lease assets and liabilities, a higher amount of depreciation expense and interest on lease liabilities will be recognized under IFRS 16 as compared to the current standard. Additionally, a reduction in production and corporate administration costs is expected. Lastly, the Company expects a reduction in operating cash outflows with a corresponding increase in financing cash outflows under IFRS 16.
During the third quarter of 2018, the Company continued to make progress on its implementation of IFRS 16, substantially completing the initial identification and assessment of arrangements that may contain leases that qualify for recognition under IFRS 16. These include land easements and service contracts, including certain of the Company’s drilling, repair and maintenance and blasting contracts that contain embedded leases for property, plant and equipment. In addition, the Company commenced work to value the right of use assets and lease liabilities in arrangements determined to be or contain leases and initiated design and configuration of the system the Company is implementing to account for leases under the new standard.
GOLDCORP | 49
(in United States dollars, tabular amounts in millions, except where noted)
At this time, it is not possible for the Company to make reasonable quantitative estimates of the effects of the new standard. The Company expects the time frame to develop and implement the accounting policies, estimates and processes (including the information technology systems) will continue through the fourth quarter of 2018.
CONTROLS AND PROCEDURES
Disclosure Controls and Procedures
The Company’s management, with the participation of its (1) President and Chief Executive Officer and (2) Executive Vice President, Chief Financial Officer and Corporate Development, has evaluated the effectiveness of the Company’s disclosure controls and procedures. Based upon the results of that evaluation, the Company’s President and Chief Executive Officer and Executive Vice President, Chief Financial Officer and Corporate Development have concluded that, as of the end of the period covered by this report, the Company’s disclosure controls and procedures were effective to provide reasonable assurance that the information required to be disclosed by the Company in reports it files is recorded, processed, summarized and reported, within the appropriate time periods and is accumulated and communicated to management, including the President and Chief Executive Officer and Executive Vice President, Chief Financial Officer and Corporate Development, as appropriate to allow timely decisions regarding required disclosure.
Internal Control Over Financial Reporting
The Company’s management, with the participation of its President and Chief Executive Officer and Executive Vice President, Chief Financial Officer and Corporate Development, is responsible for establishing and maintaining adequate internal control over financial reporting. Under the supervision of the President and Chief Executive Officer and Executive Vice President, Chief Financial Officer and Corporate Development, the Company’s internal control over financial reporting is a process designed to provide reasonable assurance regarding the reliability of financial reporting and the preparation of financial statements for external purposes in accordance with IFRS. The Company’s internal control over financial reporting includes policies and procedures that:
| • | pertain to the maintenance of records that accurately and fairly reflect, in reasonable detail, the transactions and dispositions of assets of the Company; |
| • | provide reasonable assurance that transactions are recorded as necessary to permit preparation of financial statements in accordance with IFRS and that the Company’s receipts and expenditures are made only in accordance with authorizations of management and the Company’s Directors; and |
| • | provide reasonable assurance regarding prevention or timely detection of unauthorized acquisition, use, or disposition of the Company’s assets that could have a material effect on the Company’s consolidated financial statements. |
There has been no change in the Company’s internal control over financial reporting during the nine months ended September 30, 2018 that has materially affected, or is reasonably likely to materially affect, the Company’s internal control over financial reporting.
Limitations of Controls and Procedures
The Company’s management, including the President and Chief Executive Officer and Executive Vice President, Chief Financial Officer and Corporate Development, believes that any disclosure controls and procedures or internal control over financial reporting, no matter how well conceived and operated, can provide only reasonable, not absolute, assurance that the objectives of the control system are met. Further, the design of a control system must reflect the fact that there are resource constraints, and the benefits of controls must be considered relative to their costs. Because of the inherent limitations in all control systems, they cannot provide absolute assurance that all control issues and instances of fraud, if any, within the Company have been prevented or detected. These inherent limitations include the realities that judgments in decision-making can be faulty, and that breakdowns can occur because of simple error or mistake. Additionally, controls can be circumvented by the individual acts of some persons, by collusion of two or more people, or by unauthorized override of the control. The design of any control system also is based in part upon certain assumptions about the likelihood of future events, and there can be no assurance that any design will succeed in achieving its stated goals under all potential future conditions. Accordingly, because of the inherent limitations in a cost-effective control system, misstatements due to error or fraud may occur and not be detected.
GOLDCORP | 50
(in United States dollars, tabular amounts in millions, except where noted)
Goldcorp Mineral Reserves
As of June 30, 2018
| | | | PROVEN | | | PROBABLE | | | PROVEN & PROBABLE | |
| Ownership | | Tonnage | | Grade | | Contained | | | Tonnage | | Grade | | Contained | | | Tonnage | | Grade | | Contained | |
Gold | | | | mt | | g/t | | m oz | | | mt | | g/t | | m oz | | | mt | | g/t | | m oz | |
Alumbrera | 37.5% | | | 29.63 | | | 0.40 | | | 0.38 | | | | 1.31 | | | 0.38 | | | 0.02 | | | | 30.94 | | | 0.39 | | | 0.39 | |
Cerro Casale | 50.0% | | | 114.85 | | | 0.65 | | | 2.39 | | | | 483.95 | | | 0.59 | | | 9.23 | | | | 598.80 | | | 0.60 | | | 11.62 | |
Cerro Negro | 100.0% | | | 3.68 | | | 8.11 | | | 0.96 | | | | 14.15 | | | 8.92 | | | 4.06 | | | | 17.83 | | | 8.75 | | | 5.02 | |
Coffee | 100.0% | | | 11.68 | | | 1.47 | | | 0.55 | | | | 25.23 | | | 1.37 | | | 1.11 | | | | 36.91 | | | 1.40 | | | 1.67 | |
Éléonore | 100.0% | | | 3.65 | | | 5.97 | | | 0.70 | | | | 14.14 | | | 5.61 | | | 2.55 | | | | 17.78 | | | 5.69 | | | 3.25 | |
Musselwhite | 100.0% | | | 3.59 | | | 6.57 | | | 0.76 | | | | 7.31 | | | 6.46 | | | 1.52 | | | | 10.91 | | | 6.49 | | | 2.28 | |
NuevaUnión | 50.0% | | | 166.80 | | | 0.55 | | | 2.96 | | | | 121.58 | | | 0.38 | | | 1.50 | | | | 288.37 | | | 0.48 | | | 4.46 | |
Peñasquito | 100.0% | | | 376.43 | | | 0.58 | | | 6.97 | | | | 143.99 | | | 0.46 | | | 2.15 | | | | 520.41 | | | 0.55 | | | 9.12 | |
Porcupine | 100.0% | | | 13.42 | | | 1.64 | | | 0.71 | | | | 216.71 | | | 1.07 | | | 7.42 | | | | 230.13 | | | 1.10 | | | 8.13 | |
Pueblo Viejo | 40.0% | | | 41.42 | | | 2.67 | | | 3.56 | | | | 12.81 | | | 3.06 | | | 1.26 | | | | 54.24 | | | 2.76 | | | 4.82 | |
Red Lake | 100.0% | | | 1.53 | | | 10.24 | | | 0.50 | | | | 7.66 | | | 6.30 | | | 1.55 | | | | 9.19 | | | 6.95 | | | 2.05 | |
Totals | | | | | 766.67 | | | 0.83 | | | 20.44 | | | | 1,048.85 | | | 0.96 | | | 32.37 | | | | 1,815.52 | | | 0.90 | | | 52.81 | |
| | | | | | | | | | | | | | | | | | | | | | | | | | | | | | | | |
Silver | | | | mt | | g/t | | m oz | | | mt | | g/t | | m oz | | | mt | | g/t | | m oz | |
Cerro Casale | 50.0% | | | 114.85 | | | 1.91 | | | 7.04 | | | | 483.95 | | | 1.43 | | | 22.30 | | | | 598.80 | | | 1.52 | | | 29.34 | |
Cerro Negro | 100.0% | | | 3.68 | | | 63.43 | | | 7.51 | | | | 14.15 | | | 60.88 | | | 27.69 | | | | 17.83 | | | 61.40 | | | 35.20 | |
Peñasquito | 100.0% | | | 376.43 | | | 34.56 | | | 418.32 | | | | 143.99 | | | 23.60 | | | 109.26 | | | | 520.41 | | | 31.53 | | | 527.58 | |
Pueblo Viejo | 40.0% | | | 41.42 | | | 17.97 | | | 23.94 | | | | 12.81 | | | 15.55 | | | 6.41 | | | | 54.24 | | | 17.40 | | | 30.35 | |
Totals | | | | | 536.39 | | | 26.49 | | | 456.81 | | | | 654.90 | | | 7.87 | | | 165.66 | | | | 1,191.28 | | | 16.25 | | | 622.48 | |
| | | | | | | | | | | | | | | | | | | | | | | | | | | | | | | | |
Copper | | | | mt | | % | | m lbs | | | mt | | % | | m lbs | | | mt | | % | | m lbs | |
Alumbrera | 37.5% | | | 29.63 | | | 0.38 | | | 245.04 | | | | 1.31 | | | 0.29 | | | 8.27 | | | | 30.94 | | | 0.37 | | | 253.31 | |
Cerro Casale | 50.0% | | | 114.85 | | | 0.19 | | | 480.87 | | | | 483.95 | | | 0.23 | | | 2,408.87 | | | | 598.80 | | | 0.22 | | | 2,889.73 | |
NuevaUnión | 50.0% | | | 442.92 | | | 0.43 | | | 4,212.42 | | | | 571.49 | | | 0.38 | | | 4,755.93 | | | | 1,014.41 | | | 0.40 | | | 8,968.35 | |
Pueblo Viejo | 40.0% | | | 41.42 | | | 0.10 | | | 88.18 | | | | 12.81 | | | 0.10 | | | 28.31 | | | | 54.24 | | | 0.10 | | | 116.49 | |
Totals | | | | | 628.82 | | | 0.36 | | | 5,026.51 | | | | 1,069.57 | | | 0.31 | | | 7,201.37 | | | | 1,698.38 | | | 0.33 | | | 12,227.88 | |
| | | | | | | | | | | | | | | | | | | | | | | | | | | | | | | | |
Lead | | | | mt | | % | | m lbs | | | mt | | % | | m lbs | | | mt | | % | | m lbs | |
Peñasquito | 100.0% | | | 372.77 | | | 0.34 | | | 2,803.62 | | | | 143.55 | | | 0.26 | | | 809.58 | | | | 516.32 | | | 0.32 | | | 3,613.20 | |
Totals | | | | | 372.77 | | | 0.34 | | | 2,803.62 | | | | 143.55 | | | 0.26 | | | 809.58 | | | | 516.32 | | | 0.32 | | | 3,613.20 | |
| | | | | | | | | | | | | | | | | | | | | | | | | | | | | | | | |
Zinc | | | | mt | | % | | m lbs | | | mt | | % | | m lbs | | | mt | | % | | m lbs | |
Peñasquito | 100.0% | | | 372.77 | | | 0.77 | | | 6,314.23 | | | | 143.55 | | | 0.53 | | | 1,680.30 | | | | 516.32 | | | 0.70 | | | 7,994.53 | |
Totals | | | | | 372.77 | | | 0.77 | | | 6,314.23 | | | | 143.55 | | | 0.53 | | | 1,680.30 | | | | 516.32 | | | 0.70 | | | 7,994.53 | |
| | | | | | | | | | | | | | | | | | | | | | | | | | | | | | | | |
Molybdenum | | mt | | % | | m lbs | | | mt | | % | | m lbs | | | mt | | % | | m lbs | |
NuevaUnión | 50.0% | | | 276.12 | | | 0.014 | | | 86.10 | | | | 449.92 | | | 0.017 | | | 171.87 | | | | 726.03 | | | 0.016 | | | 257.98 | |
Totals | | | | | 276.12 | | | 0.014 | | | 86.10 | | | | 449.92 | | | 0.017 | | | 171.87 | | | | 726.03 | | | 0.016 | | | 257.98 | |
* Numbers may not add up due to rounding.
GOLDCORP | 51
(in United States dollars, tabular amounts in millions, except where noted)
Goldcorp Mineral Resources
As of June 30, 2018
| | MEASURED | | INDICATED | | MEASURED & INDICATED | | INFERRED |
| Ownership | Tonnage | Grade | Contained | | Tonnage | Grade | Contained | | Tonnage | Grade | Contained | | Tonnage | Grade | Contained |
Gold | | mt | g/t | m oz | | mt | g/t | m oz | | mt | g/t | m oz | | mt | g/t | m oz |
Alumbrera | 37.5% | 9.38 | 0.39 | 0.12 | | 1.13 | 0.37 | 0.01 | | 10.50 | 0.39 | 0.13 | | 0.34 | 0.31 | 0.00 |
Caspiche | 50.0% | 310.05 | 0.57 | 5.65 | | 391.75 | 0.47 | 5.97 | | 701.80 | 0.51 | 11.62 | | 99.05 | 0.29 | 0.92 |
Cerro Casale | 50.0% | 11.48 | 0.30 | 0.11 | | 136.85 | 0.36 | 1.57 | | 148.32 | 0.35 | 1.69 | | 247.72 | 0.38 | 3.00 |
Cerro Negro | 100.0% | 1.12 | 4.53 | 0.16 | | 6.34 | 5.35 | 1.09 | | 7.46 | 5.23 | 1.25 | | 1.13 | 4.63 | 0.17 |
Coffee | 100.0% | 1.81 | 1.22 | 0.07 | | 22.24 | 0.94 | 0.67 | | 24.05 | 0.96 | 0.74 | | 34.45 | 0.84 | 0.94 |
Éléonore | 100.0% | 0.79 | 6.15 | 0.16 | | 2.39 | 4.67 | 0.36 | | 3.17 | 5.03 | 0.51 | | 3.19 | 5.76 | 0.59 |
Musselwhite | 100.0% | 0.29 | 5.48 | 0.05 | | 1.90 | 4.55 | 0.28 | | 2.20 | 4.67 | 0.33 | | 5.17 | 5.19 | 0.86 |
Noche Buena | 50.0% | — | — | — | | 27.50 | 0.37 | 0.33 | | 27.50 | 0.37 | 0.33 | | 2.47 | 0.22 | 0.02 |
NuevaUnión | 50.0% | 0.19 | 0.47 | 0.00 | | 26.42 | 0.85 | 0.72 | | 26.62 | 0.85 | 0.72 | | 188.52 | 0.55 | 3.34 |
Peñasquito | 100.0% | 94.03 | 0.25 | 0.76 | | 104.77 | 0.24 | 0.81 | | 198.80 | 0.25 | 1.57 | | 14.88 | 0.30 | 0.14 |
Porcupine | 100.0% | 32.70 | 1.23 | 1.30 | | 229.90 | 0.96 | 7.11 | | 262.60 | 1.00 | 8.41 | | 113.03 | 1.03 | 3.74 |
Pueblo Viejo | 40.0% | 5.18 | 2.39 | 0.40 | | 62.61 | 2.47 | 4.97 | | 67.79 | 2.46 | 5.37 | | 18.42 | 2.43 | 1.44 |
Red Lake | 100.0% | 1.52 | 18.15 | 0.89 | | 3.78 | 13.50 | 1.64 | | 5.30 | 14.83 | 2.53 | | 4.93 | 15.10 | 2.39 |
Totals | | 468.54 | 0.64 | 9.67 | | 1,017.57 | 0.78 | 25.53 | | 1,486.11 | 0.74 | 35.20 | | 733.31 | 0.74 | 17.54 |
| | | | | | | | | | | | | | | | |
Silver | | mt | g/t | m oz | | mt | g/t | m oz | | mt | g/t | m oz | | mt | g/t | m oz |
Caspiche | 50.0% | 310.05 | 1.20 | 11.98 | | 391.75 | 1.20 | 15.15 | | 701.80 | 1.20 | 27.12 | | 99.05 | 0.91 | 2.91 |
Cerro Casale | 50.0% | 11.48 | 1.19 | 0.44 | | 136.85 | 1.06 | 4.66 | | 148.32 | 1.07 | 5.10 | | 247.72 | 1.04 | 8.25 |
Cerro Negro | 100.0% | 1.12 | 41.33 | 1.49 | | 6.34 | 36.01 | 7.34 | | 7.46 | 36.81 | 8.83 | | 1.13 | 25.04 | 0.91 |
Noche Buena | 50.0% | — | — | — | | 27.50 | 12.35 | 10.92 | | 27.50 | 12.35 | 10.92 | | 2.47 | 8.08 | 0.64 |
Peñasquito | 100.0% | 94.03 | 28.33 | 85.65 | | 104.77 | 22.76 | 76.67 | | 198.80 | 25.40 | 162.31 | | 14.88 | 13.47 | 6.44 |
Pueblo Viejo | 40.0% | 5.18 | 14.25 | 2.37 | | 62.61 | 13.61 | 27.40 | | 67.79 | 13.66 | 29.77 | | 18.42 | 10.81 | 6.40 |
Totals | | 421.86 | 7.52 | 101.93 | | 729.81 | 6.06 | 142.13 | | 1,151.67 | 6.59 | 244.05 | | 383.67 | 2.07 | 25.56 |
| | | | | | | | | | | | | | | | |
Copper | | mt | % | m lbs | | mt | % | m lbs | | mt | % | m lbs | | mt | % | m lbs |
Alumbrera | 37.5% | 9.38 | 0.40 | 81.68 | | 1.13 | 0.40 | 9.84 | | 10.50 | 0.40 | 91.52 | | 0.34 | 0.21 | 1.56 |
Caspiche | 50.0% | 277.10 | 0.23 | 1,405.07 | | 363.95 | 0.18 | 1,444.27 | | 641.05 | 0.20 | 2,849.34 | | 97.80 | 0.12 | 258.73 |
Cerro Casale | 50.0% | 11.48 | 0.13 | 33.40 | | 136.85 | 0.16 | 495.87 | | 148.32 | 0.16 | 529.27 | | 247.72 | 0.19 | 1,046.80 |
NuevaUnión | 50.0% | 66.41 | 0.24 | 344.34 | | 191.03 | 0.36 | 1,513.28 | | 257.44 | 0.33 | 1,857.62 | | 483.44 | 0.42 | 4,513.52 |
Pueblo Viejo | 40.0% | 5.18 | 0.07 | 7.68 | | 62.61 | 0.08 | 111.73 | | 67.79 | 0.08 | 119.41 | | 18.42 | 0.09 | 34.88 |
Totals | | 369.55 | 0.23 | 1,872.17 | | 755.56 | 0.21 | 3,574.99 | | 1,125.10 | 0.22 | 5,447.16 | | 847.72 | 0.31 | 5,855.49 |
| | | | | | | | | | | | | | | | |
Lead | | mt | % | m lbs | | mt | % | m lbs | | mt | % | m lbs | | mt | % | m lbs |
Peñasquito | 100.0% | 89.88 | 0.29 | 579.65 | | 95.86 | 0.29 | 609.99 | | 185.74 | 0.29 | 1,189.63 | | 14.87 | 0.17 | 54.13 |
Totals | | 89.88 | 0.29 | 579.65 | | 95.86 | 0.29 | 609.99 | | 185.74 | 0.29 | 1,189.63 | | 14.87 | 0.17 | 54.13 |
| | | | | | | | | | | | | | | | |
Zinc | | mt | % | m lbs | | mt | % | m lbs | | mt | % | m lbs | | mt | % | m lbs |
Peñasquito | 100.0% | 89.88 | 0.59 | 1,161.20 | | 95.86 | 0.49 | 1,044.22 | | 185.74 | 0.54 | 2,205.42 | | 14.87 | 0.63 | 206.63 |
Totals | | 89.88 | 0.59 | 1,161.20 | | 95.86 | 0.49 | 1,044.22 | | 185.74 | 0.54 | 2,205.42 | | 14.87 | 0.63 | 206.63 |
| | | | | | | | | | | | | | | | |
Molybdenum | mt | % | m lbs | | mt | % | m lbs | | mt | % | m lbs | | mt | % | m lbs |
NuevaUnión | 50.0% | 66.22 | 0.007 | 10.43 | | 164.60 | 0.011 | 38.27 | | 230.82 | 0.010 | 48.69 | | 294.92 | 0.013 | 83.97 |
Totals | | 66.22 | 0.007 | 10.43 | | 164.60 | 0.011 | 38.27 | | 230.82 | 0.010 | 48.69 | | 294.92 | 0.013 | 83.97 |
* Numbers may not add up due to rounding.
GOLDCORP | 52
(in United States dollars, tabular amounts in millions, except where noted)
Goldcorp June 30, 2018 Mineral Reserve and Mineral Resource Reporting Notes:
1. | All Mineral Reserves and Mineral Resources have been estimated in accordance with the CIM Definition Standards, and in the case of the Alumbrera mine, the Ore Reserves have been estimated in accordance with the JORC Code. The JORC Code has been accepted for current disclosure rules in Canada under NI 43-101 (see below for definition). Except for properties or projects listed in note 4 below, all Mineral Reserves, Ore Reserves and Mineral Resources set out in the tables above or elsewhere in this MD&A have been reviewed and approved by Patrick Garretson, SME Registered Member, Director, Resources and Reserves, Goldcorp, who is a qualified person as defined under NI 43-101. |
2. | All Mineral Resources are reported exclusive of those Mineral Resources that were converted to Mineral Reserves. |
3. | Mineral Resources which are not Mineral Reserves do not have demonstrated economic viability. |
4. | Mineral Reserves and Mineral Resources are reported effective June 30, 2018, with the following conditions or exceptions: |
| (i) | Mineral Reserves and Mineral Resources for Pueblo Viejo are as per information set forth in the technical report entitled “Technical Report on the Pueblo Viejo Project, Sanchez Ramirez province, Dominican Republic” dated March 19, 2018, prepared by Rosmery Cardenas, B.Sc., P.Eng., RPA Principal Geologist, Hugo Miranda, MBA, ChMC(RM), RPA Principal Mining Engineer and Holger Krutzelmann, B.Sc., P.Eng., Associate Principal Metallurgist, with an effective date of December 31, 2017, which is available under the Company’s profile on SEDAR at www.sedar.com. |
| (ii) | Mineral Reserves and Mineral Resources for the Cerro Casale Project are as per public information provided by Barrick Gold Corporation in its 2017-year end report and fourth quarter results report dated February 15, 2018 but have been adjusted to reflect Goldcorp’s 50% ownership in the Norte Abierto joint venture, have an effective date of December 31, 2017 and were estimated under the supervision of Rick Sims, Vice President, Resources and Reserves, of Barrick, Steven Haggarty, Senior Director, Metallurgy, of Barrick and Patrick Garretson, formerly Senior Director, Life of Mine Planning, of Barrick. |
| (iii) | Mineral Resources for the Caspiche Project are as per public information provided by Exeter Resource Corporation in its 2016 Annual Information Form dated March 24, 2017 but have been adjusted to reflect Goldcorp’s 50% ownership in the Norte Abierto joint venture. The Mineral Resource Estimate for the Caspiche Project with an effective date of April 11, 2012 was prepared by Mr. Ted Coupland, MAusIMM(CP), at the time, Director and Principal Geostatistician of Cube Consulting Pty Ltd. |
| (iv) | Mineral Reserves and Mineral Resources for Alumbrera are as per public information provided by Glencore plc in its 2017 year end Resources and Reserves Report with an effective date of December 31, 2017 and have been prepared under the supervision of Flavio Montini who is an employee of Glencore plc. |
5. | Mineral Reserves are estimated using appropriate recovery rates and US$ commodity prices of $1,200 per ounce of gold, $18.00 per ounce of silver, $2.75 per pound of copper, $0.95 per pound of lead, and $1.15 per pound of zinc, unless otherwise noted below: |
(i) | Pueblo Viejo and Cerro Casale | Gold - US$1,200/oz; Silver - US$16.50/oz; Copper - US$2.75/lb |
(ii) | Alumbrera | Gold - US$1,250/oz; Copper - US$2.91/lb |
(iii) | NuevaUnión | Gold - US$1,250/oz; Copper - US$3.00/lb; Molybdenum - US$7.50/lb |
6. | Mineral Resources are estimated using US$ commodity prices of $1,400 per ounce of gold, $20 per ounce of silver, $3.00 per pound of copper, $1.05 per pound of lead, and $1.25 per pound of zinc, unless otherwise noted below: |
(i) | Pueblo Viejo and Cerro Casale | Gold - US$1,500/oz; Silver - US$20.50/oz; Copper - US$3.50/lb |
(ii) | Alumbrera | Gold - US$1,250/oz; Silver - US$15.00/oz; Copper - US$2.75/lb |
(iii) | NuevaUnión | Gold - US$1,250/oz; Copper - US$3.00/lb; Molybdenum - US$7.50/lb |
(iv) | Alumbrera | Gold - US$1,250/oz; Copper - US$2.91/lb |
GOLDCORP | 53