Certain statements contained in this presentation may qualify as “forward-looking statements” within the meaning of Section 27A of the Securities Act of 1933 and Section 21E of the Securities Exchange Act of 1934. All statements other than statements of historical fact should be considered forward-looking statements made in good faith and are intended to qualify for the safe harbor from liability established by the Private Securities Litigation Reform Act of 1995. Words such as “anticipate”, “believe”, “expect”, “estimate”, “forecast”, “goal”, “intend”, “objective”, “plan”, “project”, “seek”, “strategy” and similar expressions are intended to identify forward-looking statements. Such forward- looking statements are subject to risks and uncertainties that could cause actual results to differ materially from those expressed or implied in the statements. These risks and uncertainties include, but are not limited to, the following: general economic conditions on an international, national, state and local level; weather conditions in our marketing areas; changes in commodity costs; changes in the availability of natural gas; “non- routine” or “extraordinary” disruptions in our distribution system; regulatory, legislative and court decisions; competition; the availability and cost of capital; costs and effects of legal proceedings and environmental liabilities; the failure of customers or suppliers to fulfill their contractual obligations; and changes in business strategies. These cautionary statements should not be construed by you to be exhaustive. While SJI believes these forward-looking statements to be reasonable, there can be no assurance that they will approximate actual experience. Further, SJI undertakes no obligation to update or revise any of its forward-looking statements, whether as a result of new information, future events or otherwise. 2
Average annual economic earnings per share growth of at least 6-7% Average annual dividend growth of at least 6-7% (target 50-60% payout ratio) Execute from low-to- moderate risk platform 3
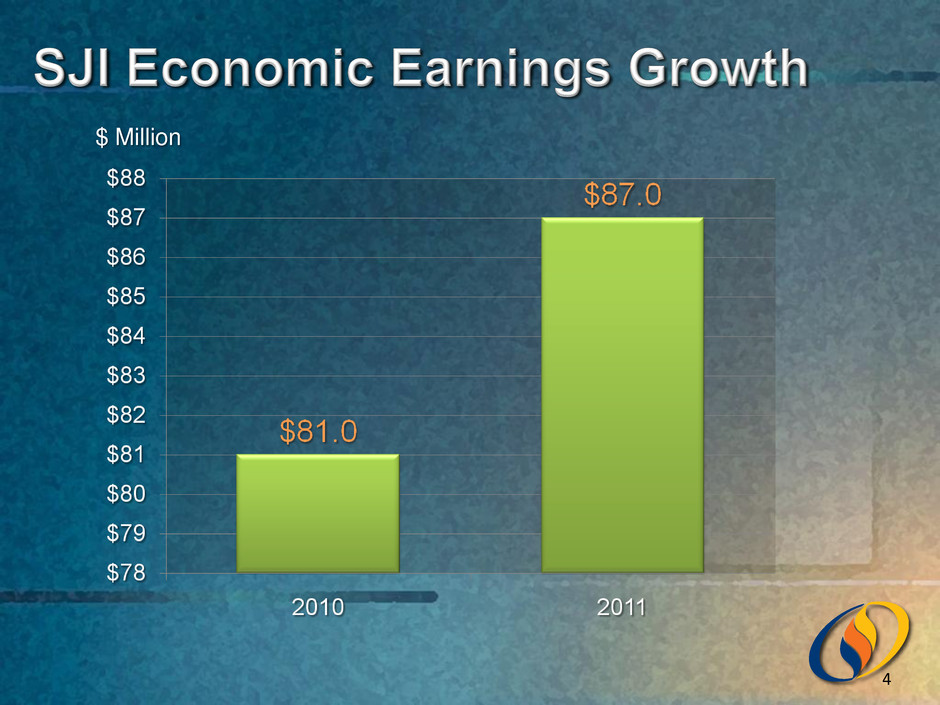
$ Million 4
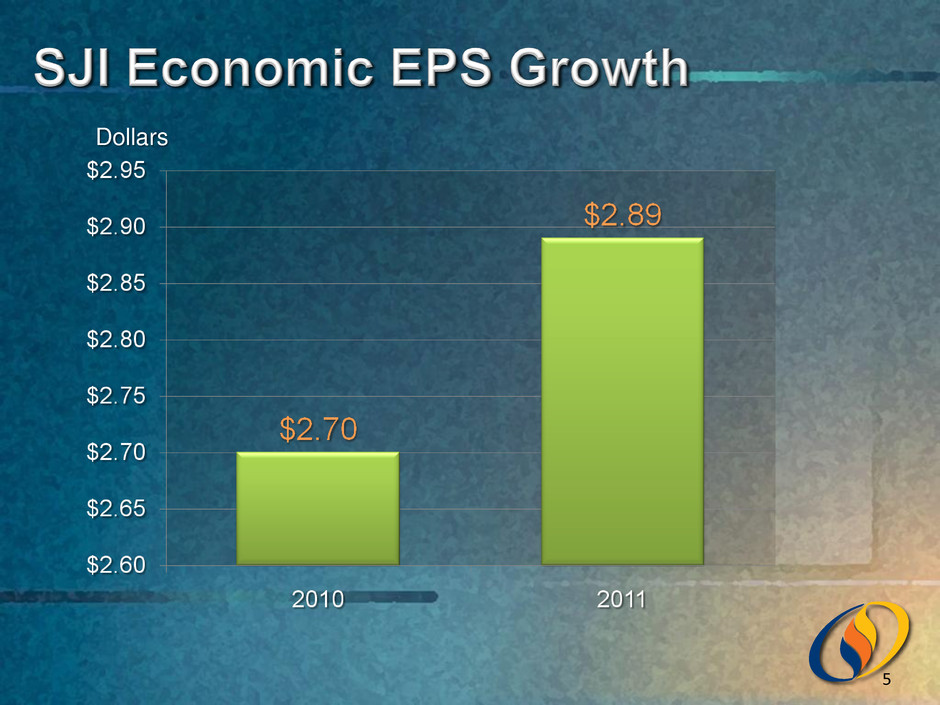
Dollars 5
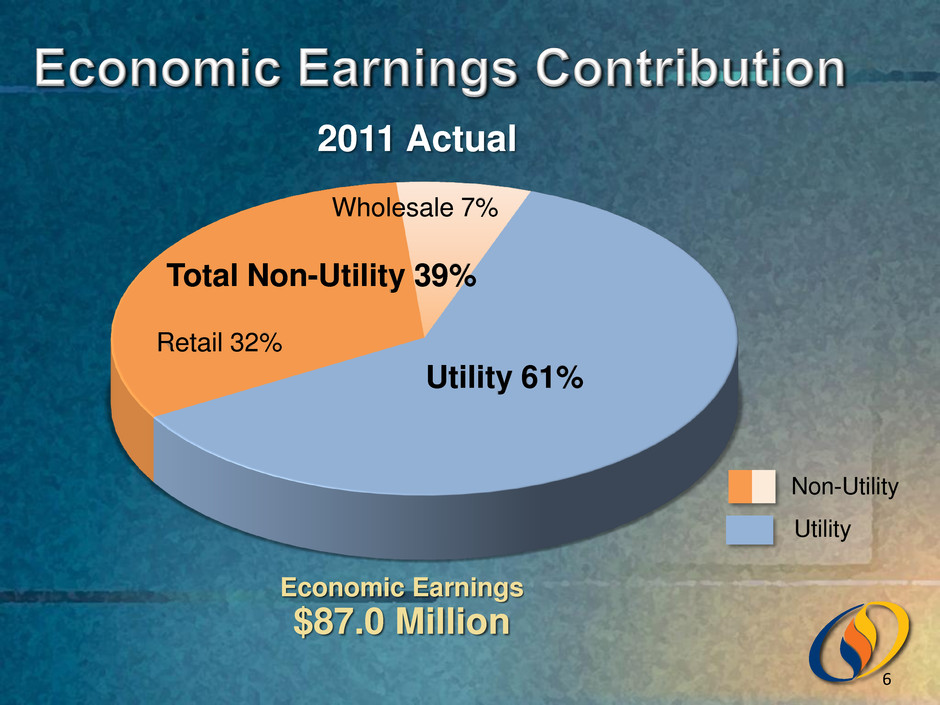
Utility 61% Retail 32% Utility Non-Utility Economic Earnings $87.0 Million 2011 Actual Wholesale 7% Total Non-Utility 39% 6
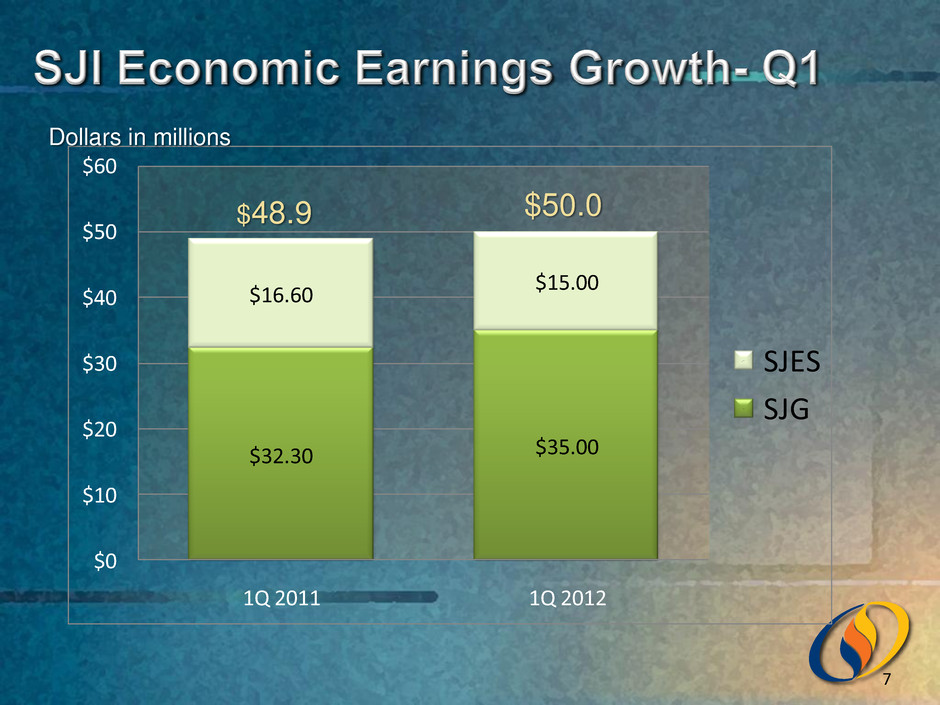
$32.30 $35.00 $16.60 $15.00 $0 $10 $20 $30 $40 $50 $60 1Q 2011 1Q 2012 SJES SJG Dollars in millions $48.9 $50.0 7
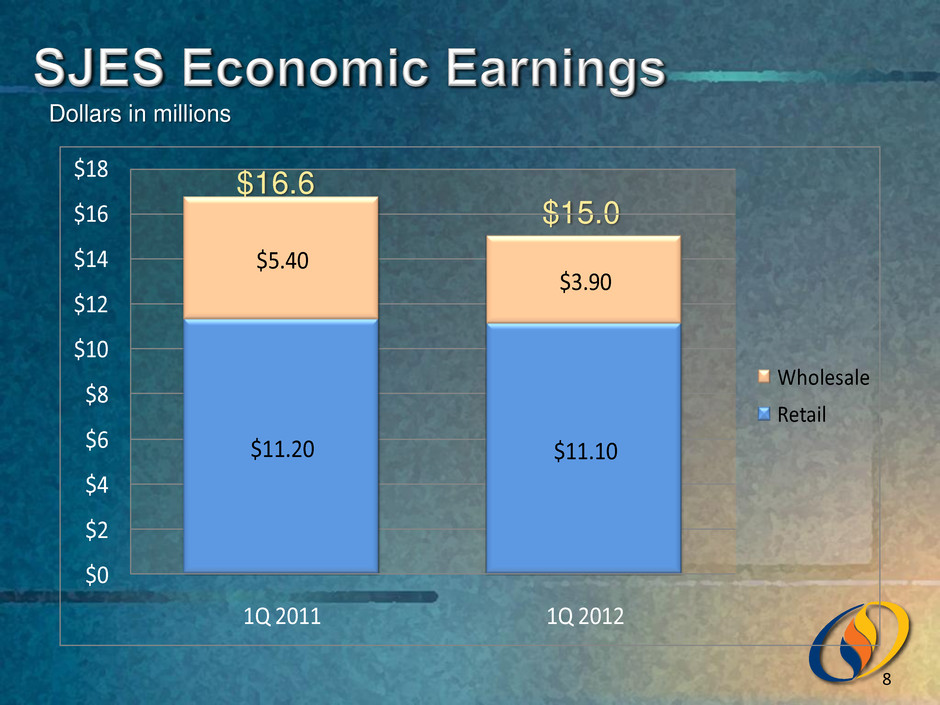
Dollars in millions $16.6 $15.0 8 $11.20 $11.10 $5.40 $3.90 $0 $2 $4 $6 $8 $10 $12 $14 $16 $18 1Q 2011 1Q 2012 Wholesale Retail

Percentage Increase Year Increase Per Share Payout Ratio (Economic Earnings) *Board review of dividend typically occurs at November meeting 2006 8¢ 9.0% 49.7% 2007 10¢ 10.2% 48.2% 2008 11¢ 10.2% 48.8% 2009 13¢ 10.9% 51.4% 2010 14¢ 10.6% 50.2% 2011 15¢ 10.3% 51.8% 9
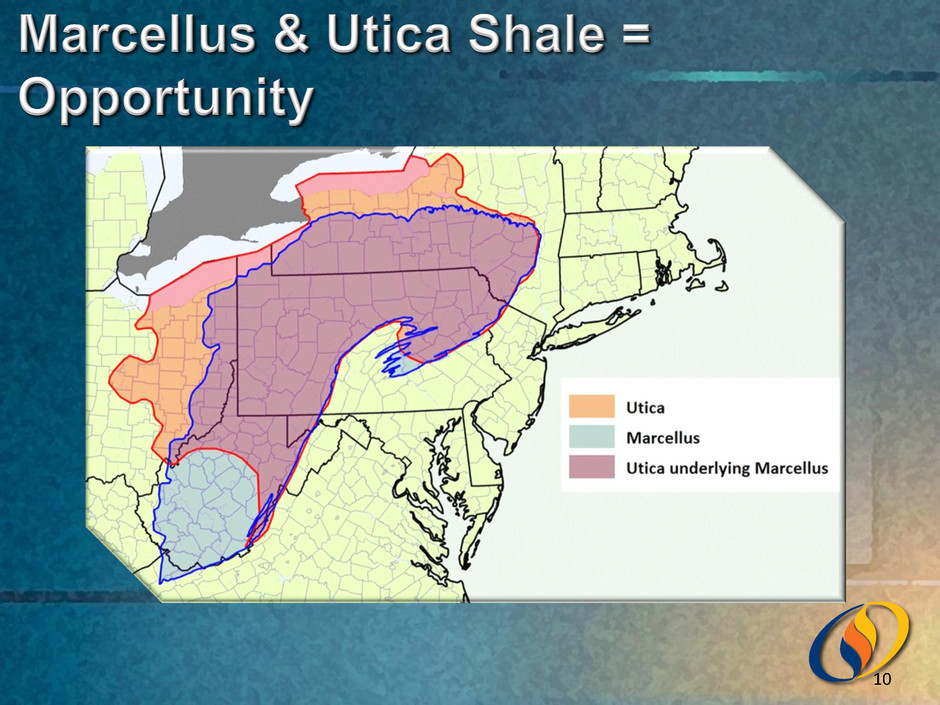
10
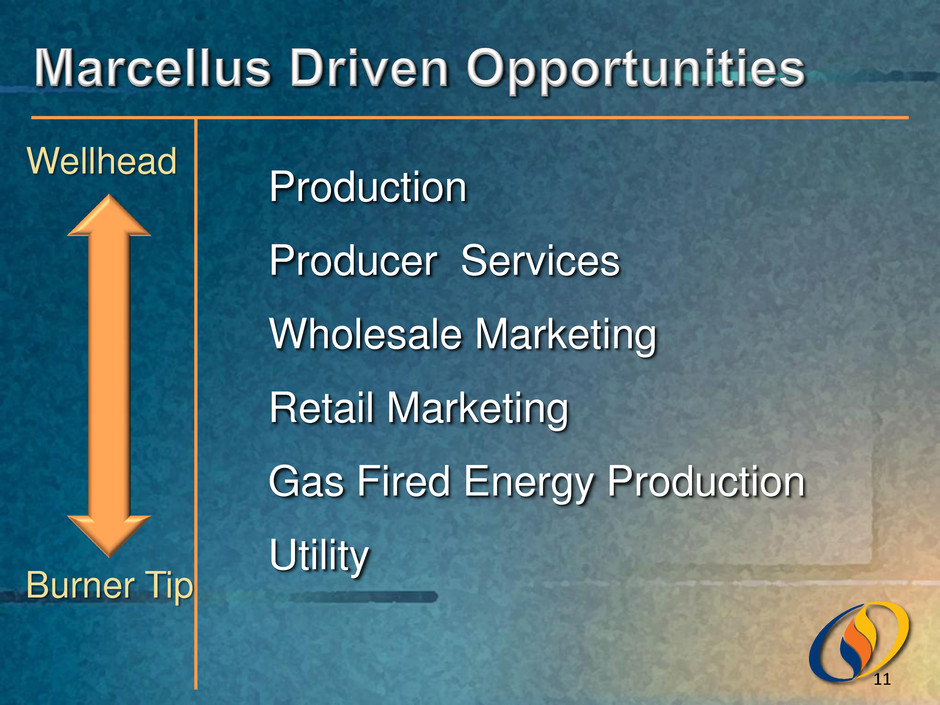
Production Producer Services Wholesale Marketing Retail Marketing Gas Fired Energy Production Utility Wellhead Burner Tip 11
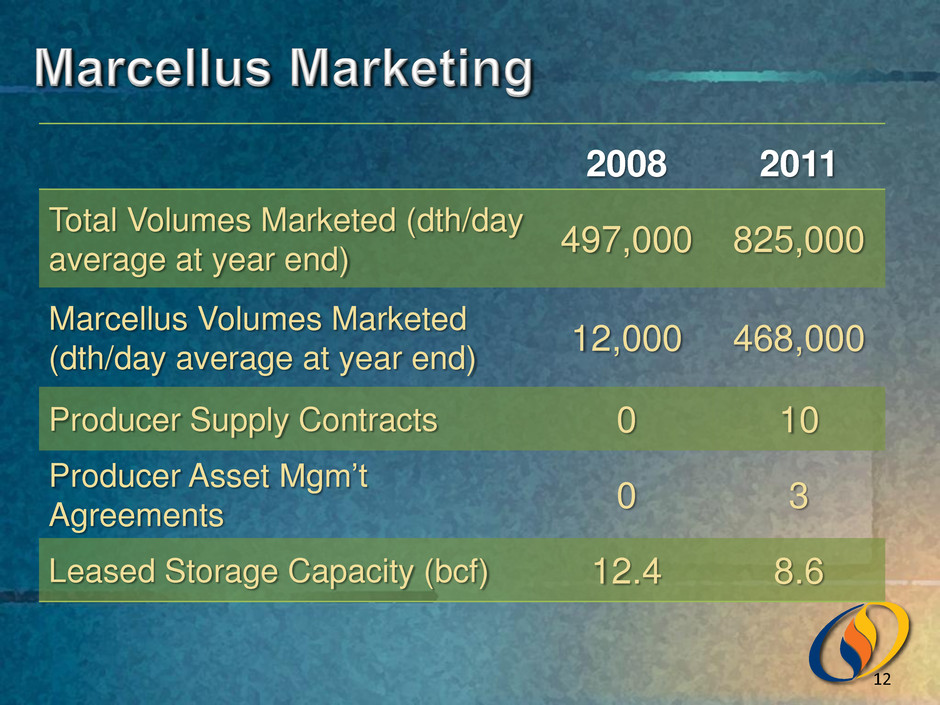
2008 2011 Total Volumes Marketed (dth/day average at year end) 497,000 825,000 Marcellus Volumes Marketed (dth/day average at year end) 12,000 468,000 Producer Supply Contracts 0 10 Producer Asset Mgm’t Agreements 0 3 Leased Storage Capacity (bcf) 12.4 8.6 12
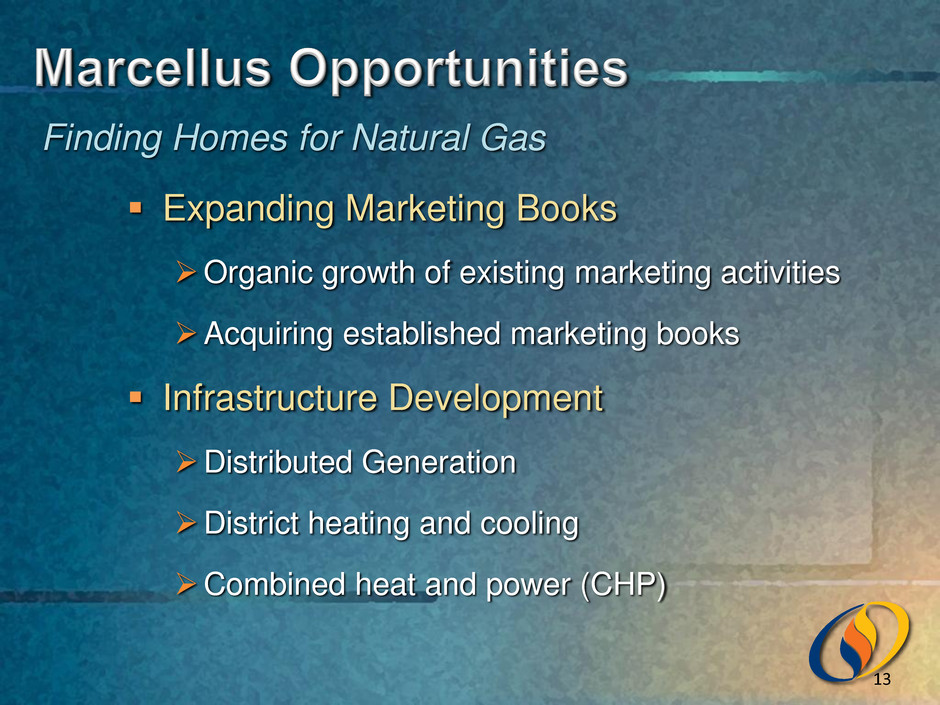
Expanding Marketing Books Organic growth of existing marketing activities Acquiring established marketing books Infrastructure Development Distributed Generation District heating and cooling Combined heat and power (CHP) Finding Homes for Natural Gas 13

*SJI has 50% interest in all Energenic projects Project Operator Project Type Total Investment SJI Equity Investment Ownership Ops Date Contract Term Borgata SJI Thermal $88.6M $27.2M 100% 2003 -2008 20 Years Parx Casino Energenic Thermal $12.5M $1.6M 50% 2009 15 Years Mannington Mills SJI CHP (8.4MW) $2.7M $2.7M 100% 2004 10 Years MTF Cogen Energenic CHP (7.0MW) $27.3M $3.3M 50% 2010 18 years 14
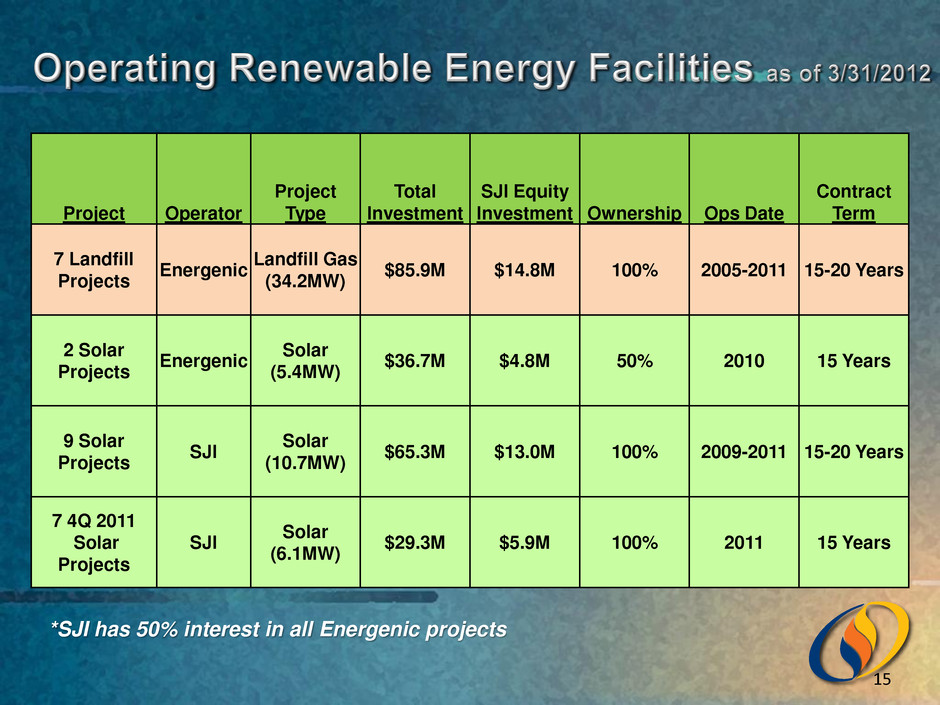
*SJI has 50% interest in all Energenic projects Project Operator Project Type Total Investment SJI Equity Investment Ownership Ops Date Contract Term 7 Landfill Projects Energenic Landfill Gas (34.2MW) $85.9M $14.8M 100% 2005-2011 15-20 Years 2 Solar Projects Energenic Solar (5.4MW) $36.7M $4.8M 50% 2010 15 Years 9 Solar Projects SJI Solar (10.7MW) $65.3M $13.0M 100% 2009-2011 15-20 Years 7 4Q 2011 Solar Projects SJI Solar (6.1MW) $29.3M $5.9M 100% 2011 15 Years 15
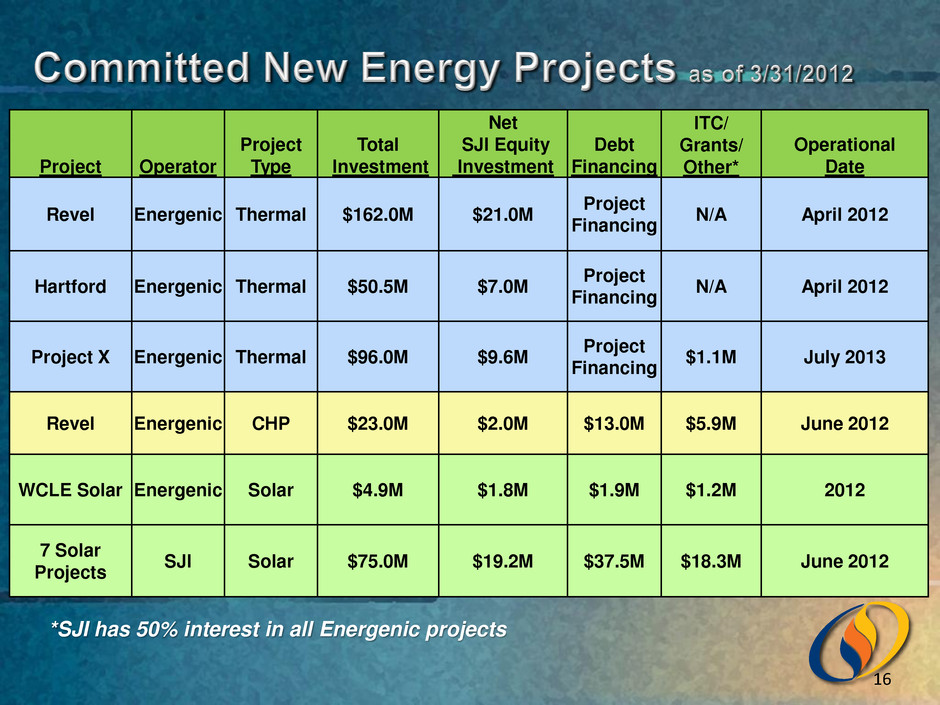
*SJI has 50% interest in all Energenic projects Project Operator Project Type Total Investment Net SJI Equity Investment Debt Financing ITC/ Grants/ Other* Operational Date Revel Energenic Thermal $162.0M $21.0M Project Financing N/A April 2012 Hartford Energenic Thermal $50.5M $7.0M Project Financing N/A April 2012 Project X Energenic Thermal $96.0M $9.6M Project Financing $1.1M July 2013 Revel Energenic CHP $23.0M $2.0M $13.0M $5.9M June 2012 WCLE Solar Energenic Solar $4.9M $1.8M $1.9M $1.2M 2012 7 Solar Projects SJI Solar $75.0M $19.2M $37.5M $18.3M June 2012 16
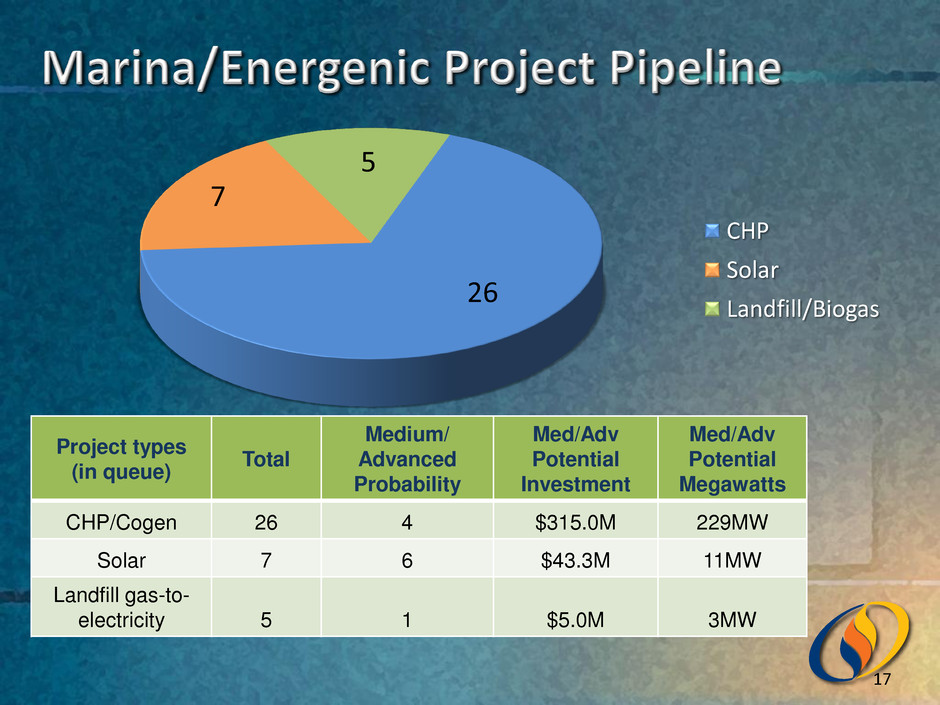
17 Project types (in queue) Total Medium/ Advanced Probability Med/Adv Potential Investment Med/Adv Potential Megawatts CHP/Cogen 26 4 $315.0M 229MW Solar 7 6 $43.3M 11MW Landfill gas-to- electricity 5 1 $5.0M 3MW 26 7 5 CHP Solar Landfill/Biogas
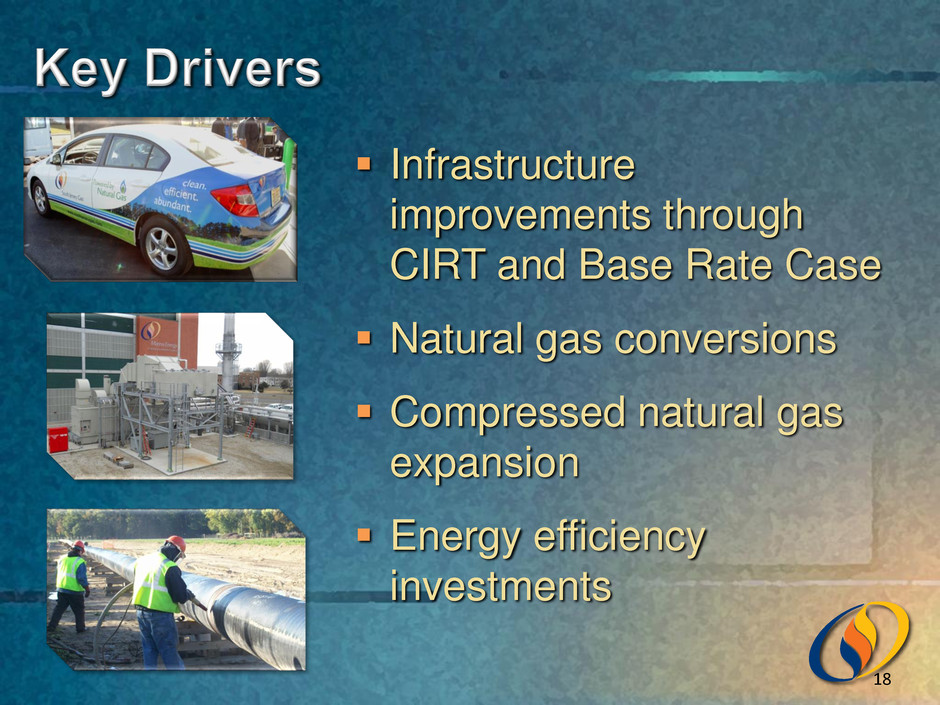
Infrastructure improvements through CIRT and Base Rate Case Natural gas conversions Compressed natural gas expansion Energy efficiency investments 18
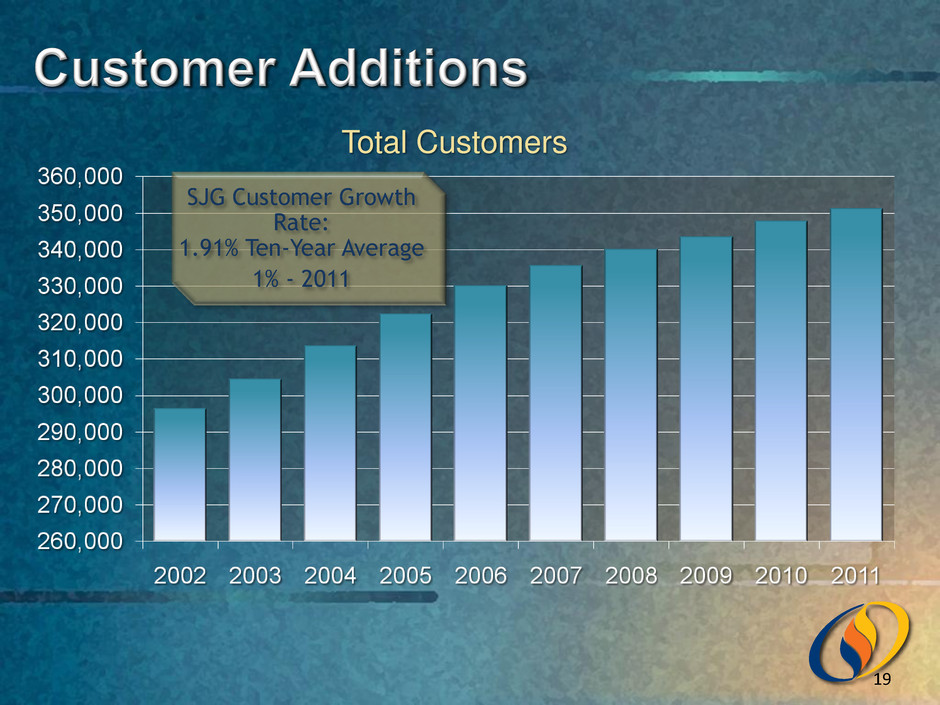
Total Customers SJG Customer Growth Rate: 1.91% Ten-Year Average 1% - 2011 19
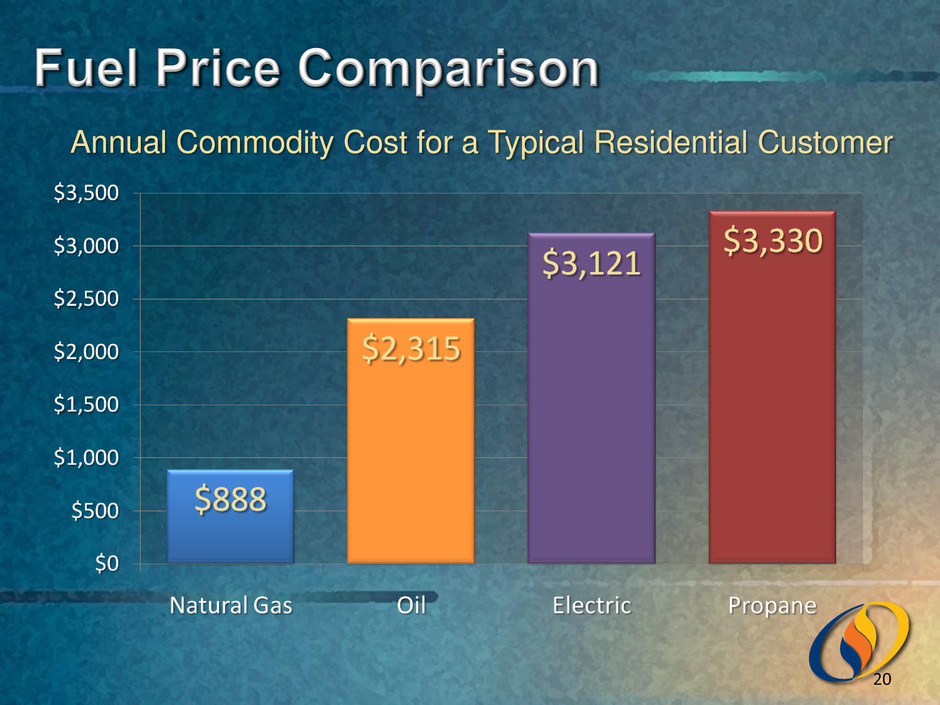
Annual Commodity Cost for a Typical Residential Customer 20
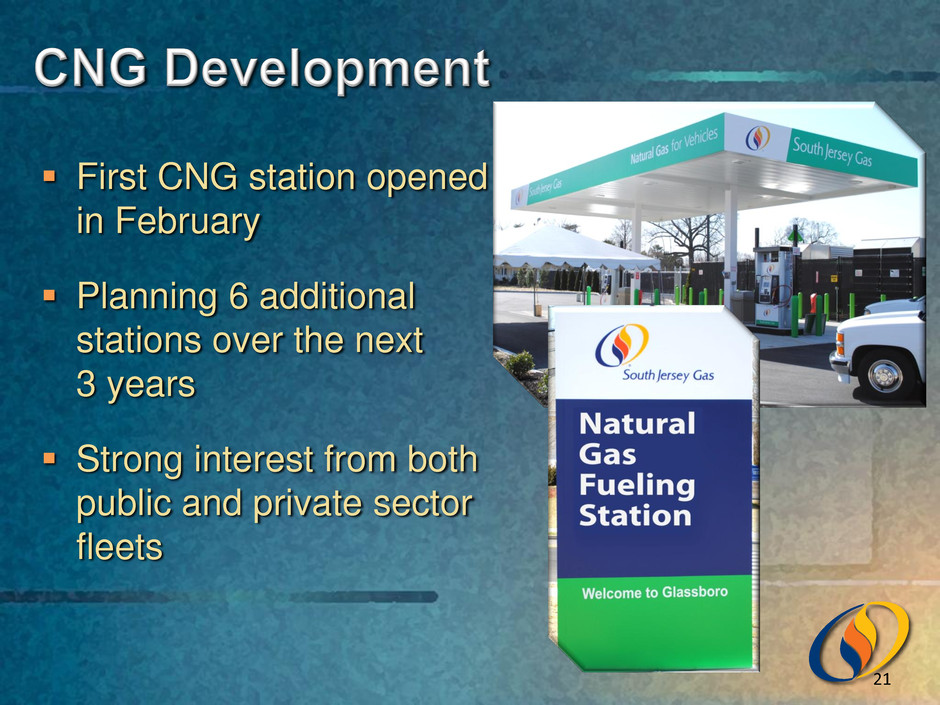
First CNG station opened in February Planning 6 additional stations over the next 3 years Strong interest from both public and private sector fleets 21
$50M of annual investment Targeted 10-year replacement time frame $45 million approved for 2012 Working with BPU to establish long-term program BPU just approved a long-term plan for NJ water companies CIRT Base Rate Case Anticipate having made $200 million of non-revenue producing investment between the last case and the end of 2013 22
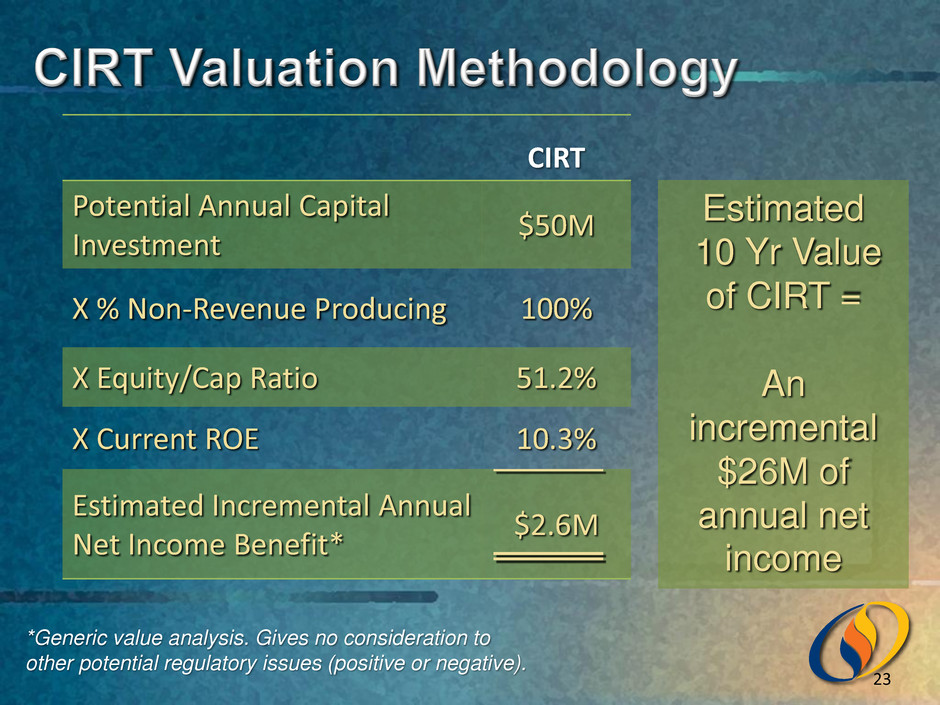
*Generic value analysis. Gives no consideration to other potential regulatory issues (positive or negative). CIRT Potential Annual Capital Investment $50M X % Non-Revenue Producing 100% X Equity/Cap Ratio 51.2% X Current ROE 10.3% Estimated Incremental Annual Net Income Benefit* $2.6M 23 Estimated 10 Yr Value of CIRT = An incremental $26M of annual net income
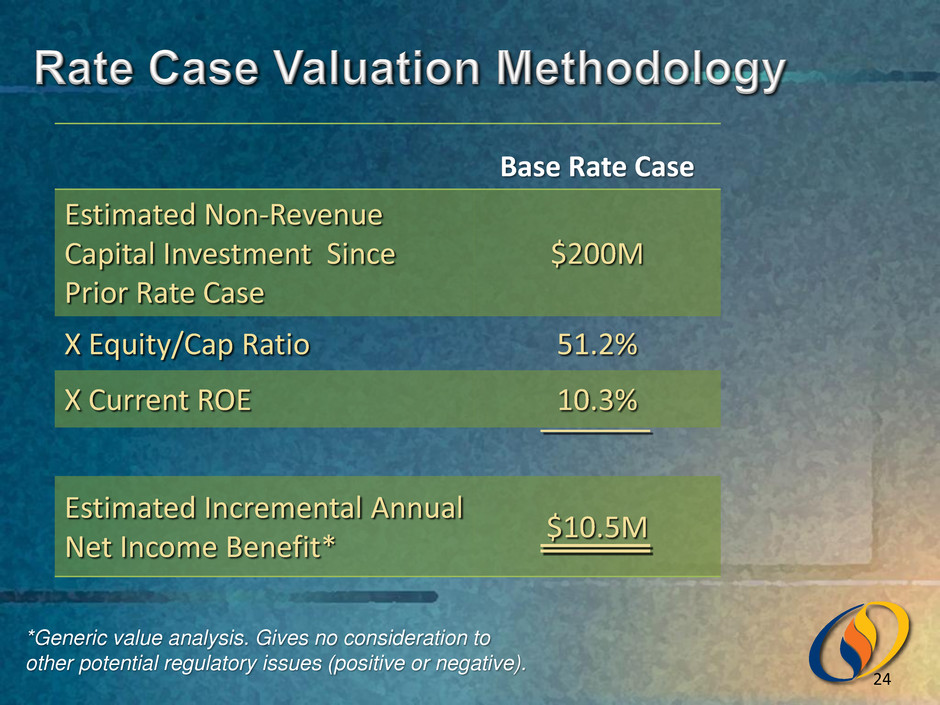
*Generic value analysis. Gives no consideration to other potential regulatory issues (positive or negative). Base Rate Case Estimated Non-Revenue Capital Investment Since Prior Rate Case $200M X Equity/Cap Ratio 51.2% X Current ROE 10.3% Estimated Incremental Annual Net Income Benefit* $10.5M 24

Substantial opportunity for growth Utility contributions project to be an increasing component of SJI’s earnings Earnings growth well above traditional levels is achievable Abundant shale gas provides headroom to keep customer bills low Utility 25
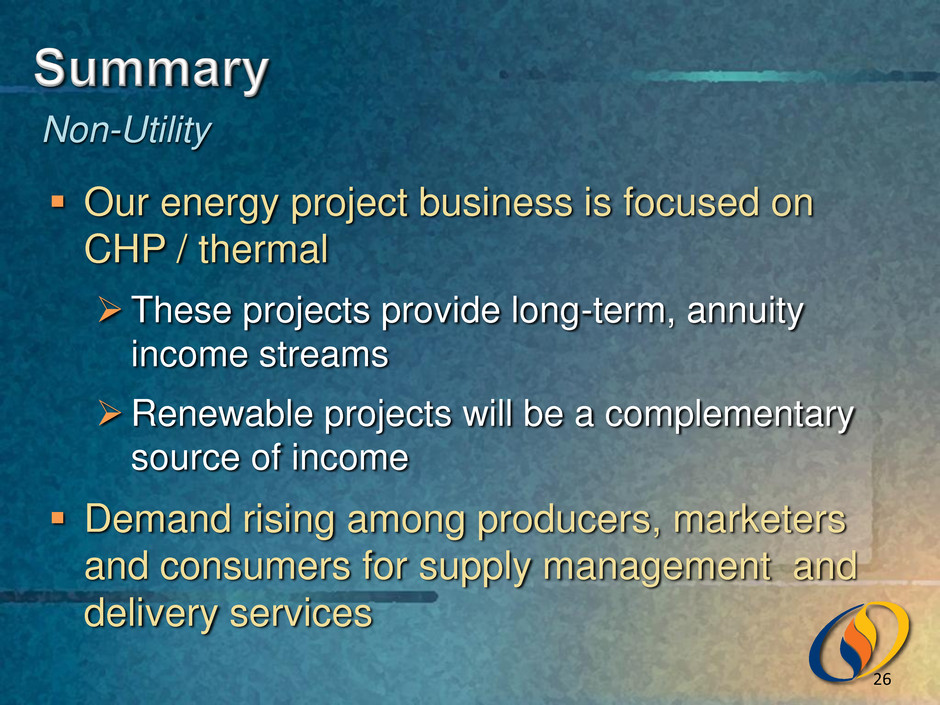
Our energy project business is focused on CHP / thermal These projects provide long-term, annuity income streams Renewable projects will be a complementary source of income Demand rising among producers, marketers and consumers for supply management and delivery services Non-Utility 26

Average annual economic earnings per share growth of at least 6–7% Targeted 2012 economic EPS growth of 4-8% Average annual dividend growth of at least 6–7% with a targeted payout ratio of 50–60% Continue to execute from a low-to-moderate risk platform SJI’s goals remain the same: 27


