Investor Presentation to AGA Financial Forum May 6, 2013 1
Certain statements contained in this presentation may qualify as “forward-looking statements” within the meaning of Section 27A of the Securities Act of 1933 and Section 21E of the Securities Exchange Act of 1934. All statements other than statements of historical fact should be considered forward-looking statements made in good faith and are intended to qualify for the safe harbor from liability established by the Private Securities Litigation Reform Act of 1995. Words such as “anticipate”, “believe”, “expect”, “estimate”, “forecast”, “goal”, “intend”, “objective”, “plan”, “project”, “seek”, “strategy” and similar expressions are intended to identify forward-looking statements. Such forward-looking statements are subject to risks and uncertainties that could cause actual results to differ materially from those expressed or implied in the statements. These risks and uncertainties include, but are not limited to, the following: general economic conditions on an international, national, state and local level; weather conditions in our marketing areas; changes in commodity costs; changes in the availability of natural gas; “non-routine” or “extraordinary” disruptions in our distribution system; regulatory, legislative and court decisions; competition; the availability and cost of capital; costs and effects of legal proceedings and environmental liabilities; the failure of customers or suppliers to fulfill their contractual obligations; and changes in business strategies. These cautionary statements should not be construed by you to be exhaustive. While SJI believes these forward-looking statements to be reasonable, there can be no assurance that they will approximate actual experience. Further, SJI undertakes no obligation to update or revise any of its forward-looking statements, whether as a result of new information, future events or otherwise. 2
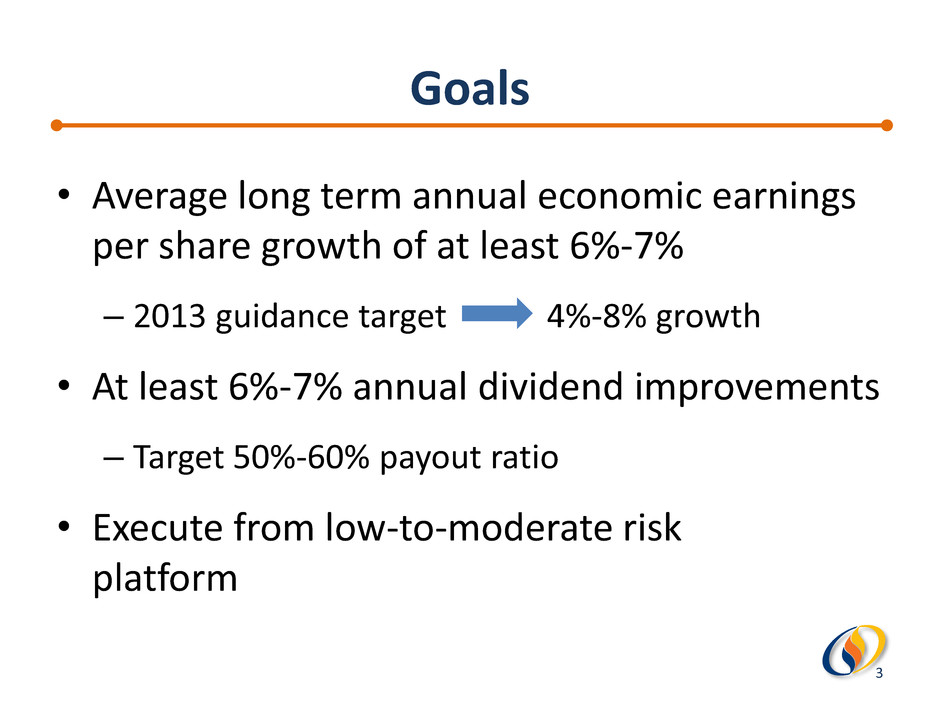
Goals • Average long term annual economic earnings per share growth of at least 6%-7% – 2013 guidance target 4%-8% growth • At least 6%-7% annual dividend improvements – Target 50%-60% payout ratio • Execute from low-to-moderate risk platform 3
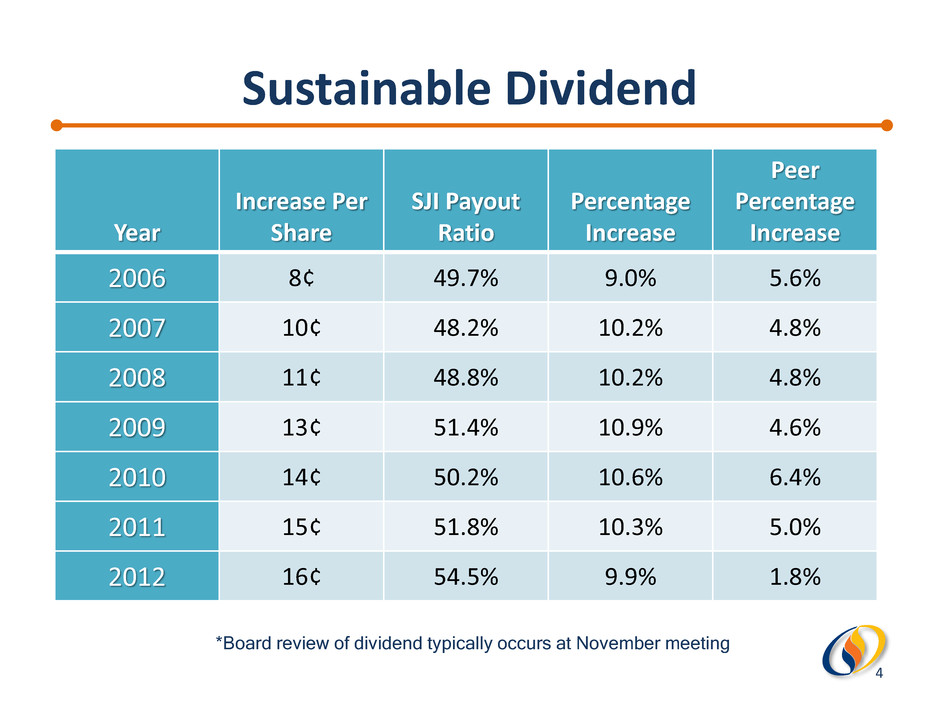
*Board review of dividend typically occurs at November meeting Year Increase Per Share SJI Payout Ratio Percentage Increase Peer Percentage Increase 2006 8¢ 49.7% 9.0% 5.6% 2007 10¢ 48.2% 10.2% 4.8% 2008 11¢ 48.8% 10.2% 4.8% 2009 13¢ 51.4% 10.9% 4.6% 2010 14¢ 50.2% 10.6% 6.4% 2011 15¢ 51.8% 10.3% 5.0% 2012 16¢ 54.5% 9.9% 1.8% Sustainable Dividend 4
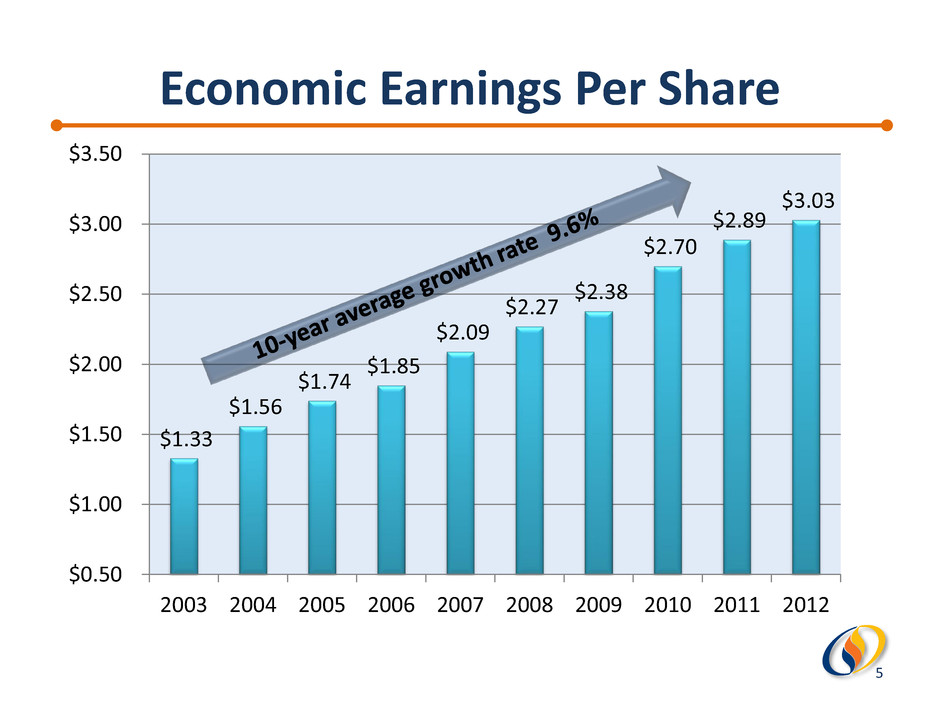
Economic Earnings Per Share $1.33 $1.56 $1.74 $1.85 $2.09 $2.27 $2.38 $2.70 $2.89 $3.03 $0.50 $1.00 $1.50 $2.00 $2.50 $3.00 $3.50 2003 2004 2005 2006 2007 2008 2009 2010 2011 2012 5
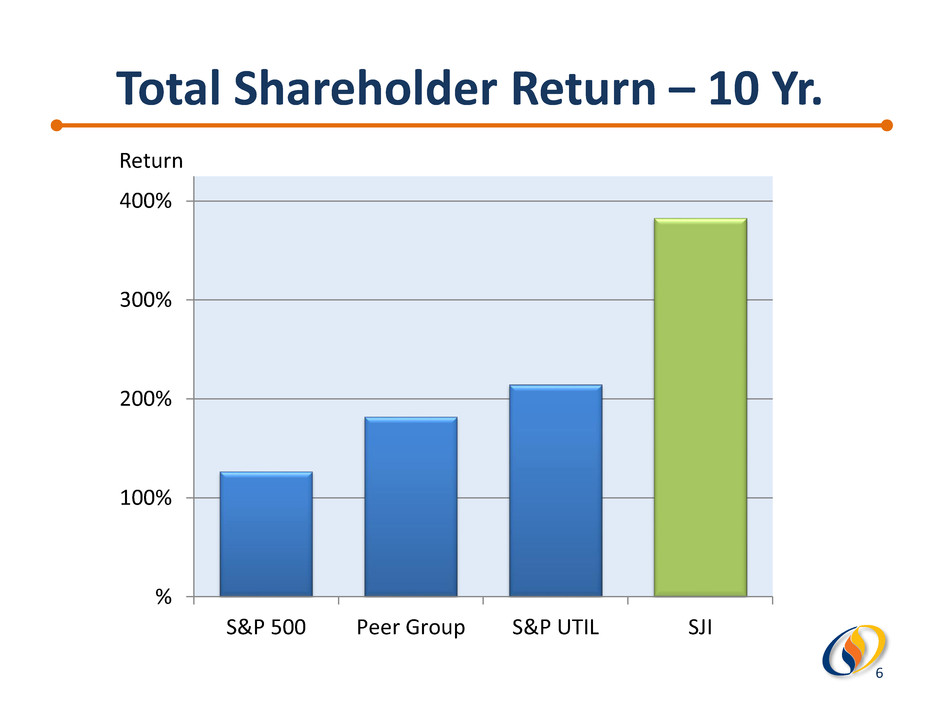
Total Shareholder Return – 10 Yr. % 100% 200% 300% 400% S&P 500 Peer Group S&P UTIL SJI Return 6
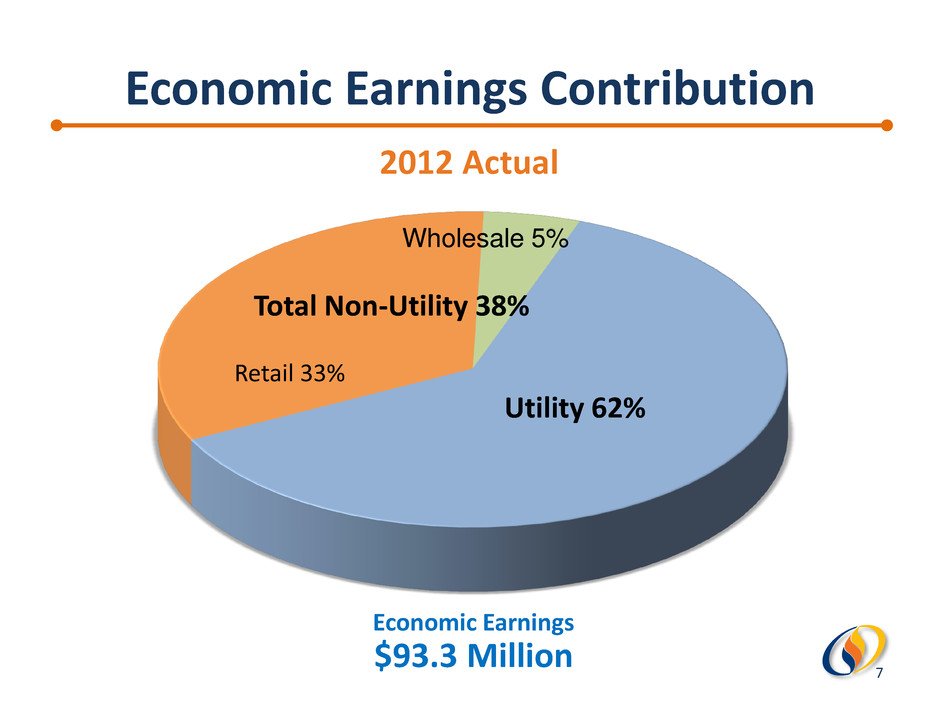
Utility 62% Retail 33% Economic Earnings $93.3 Million 2012 Actual Wholesale 5% Total Non-Utility 38% Economic Earnings Contribution 7
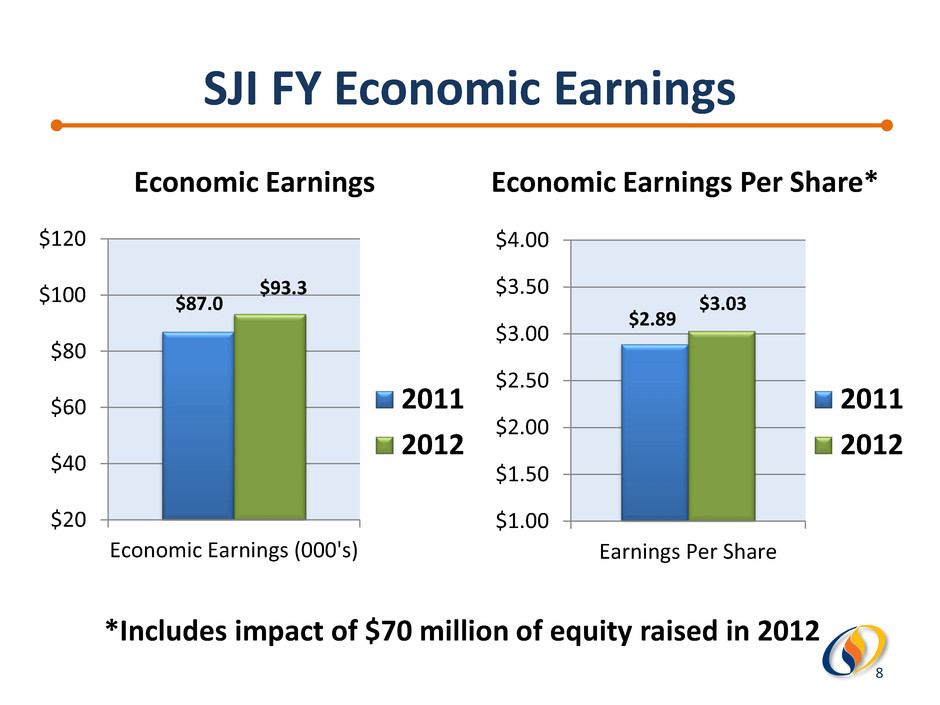
SJI FY Economic Earnings Economic Earnings $20 $40 $60 $80 $100 $120 Economic Earnings (000's) 2011 2012 $87.0 $93.3 Economic Earnings Per Share* $1.00 $1.50 $2.00 $2.50 $3.00 $3.50 $4.00 Earnings Per Share 2011 2012 $2.89 $3.03 *Includes impact of $70 million of equity raised in 2012 8
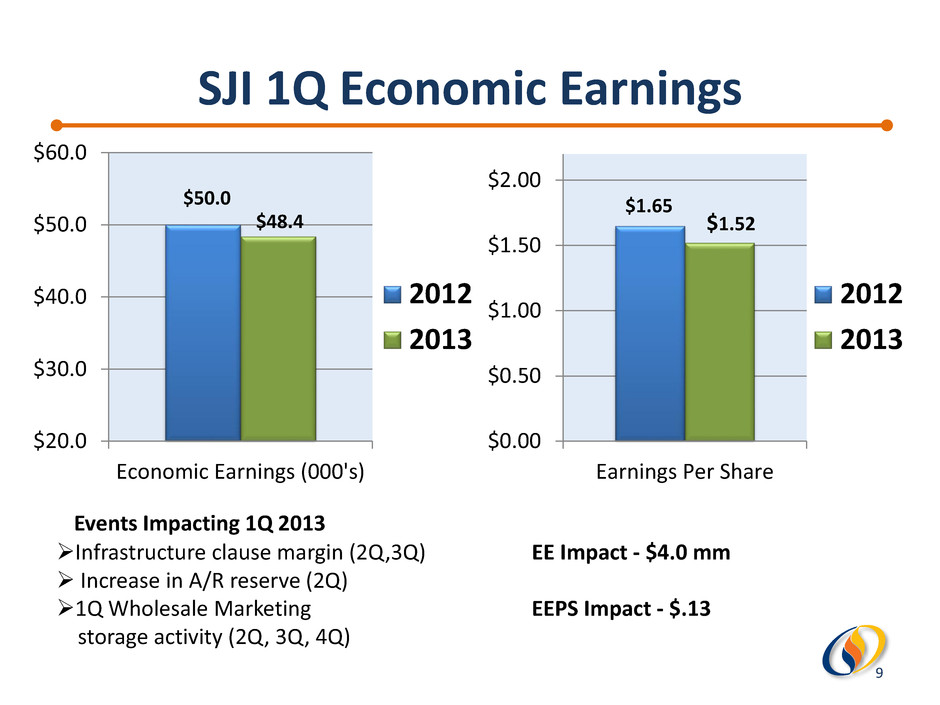
SJI 1Q Economic Earnings $20.0 $30.0 $40.0 $50.0 $60.0 Economic Earnings (000's) 2012 2013 $50.0 $48.4 $0.00 $0.50 $1.00 $1.50 $2.00 Earnings Per Share 2012 2013 $1.65 $1.52 Events Impacting 1Q 2013 Infrastructure clause margin (2Q,3Q) EE Impact - $4.0 mm Increase in A/R reserve (2Q) 1Q Wholesale Marketing EEPS Impact - $.13 storage activity (2Q, 3Q, 4Q) 9
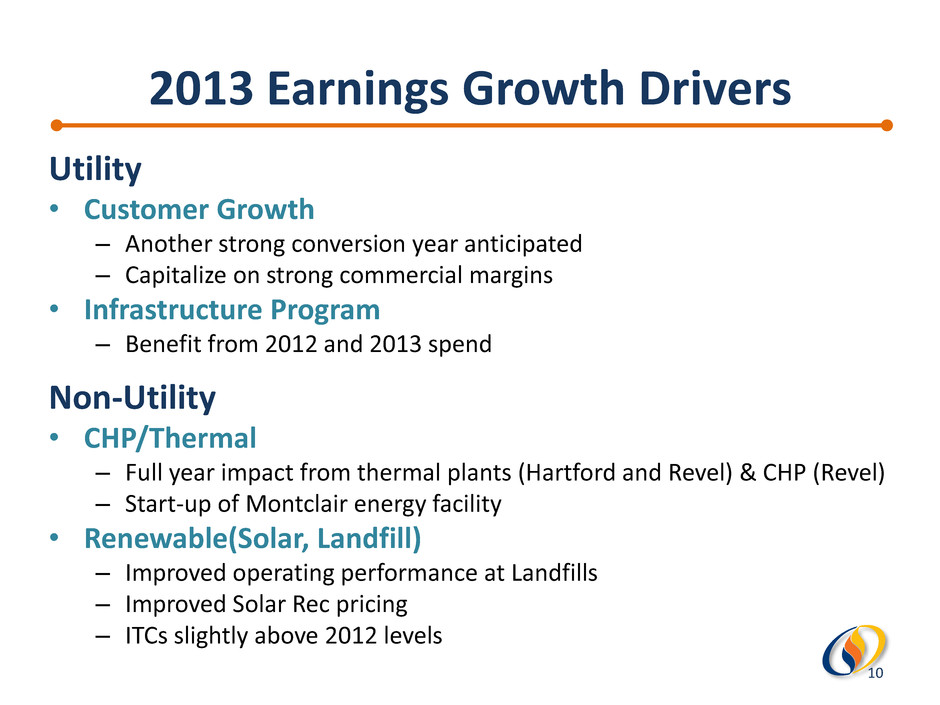
2013 Earnings Growth Drivers Utility • Customer Growth – Another strong conversion year anticipated – Capitalize on strong commercial margins • Infrastructure Program – Benefit from 2012 and 2013 spend Non-Utility • CHP/Thermal – Full year impact from thermal plants (Hartford and Revel) & CHP (Revel) – Start-up of Montclair energy facility • Renewable(Solar, Landfill) – Improved operating performance at Landfills – Improved Solar Rec pricing – ITCs slightly above 2012 levels 10
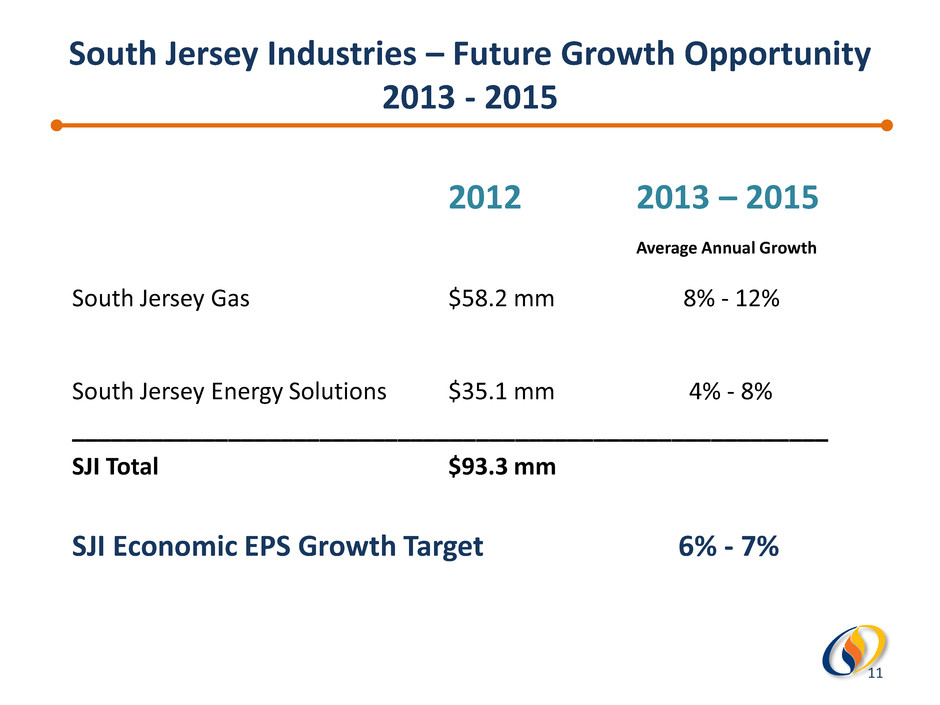
South Jersey Industries – Future Growth Opportunity 2013 - 2015 2012 2013 – 2015 Average Annual Growth South Jersey Gas $58.2 mm 8% - 12% South Jersey Energy Solutions $35.1 mm 4% - 8% __________________________________________________________ SJI Total $93.3 mm SJI Economic EPS Growth Target 6% - 7% 11
12
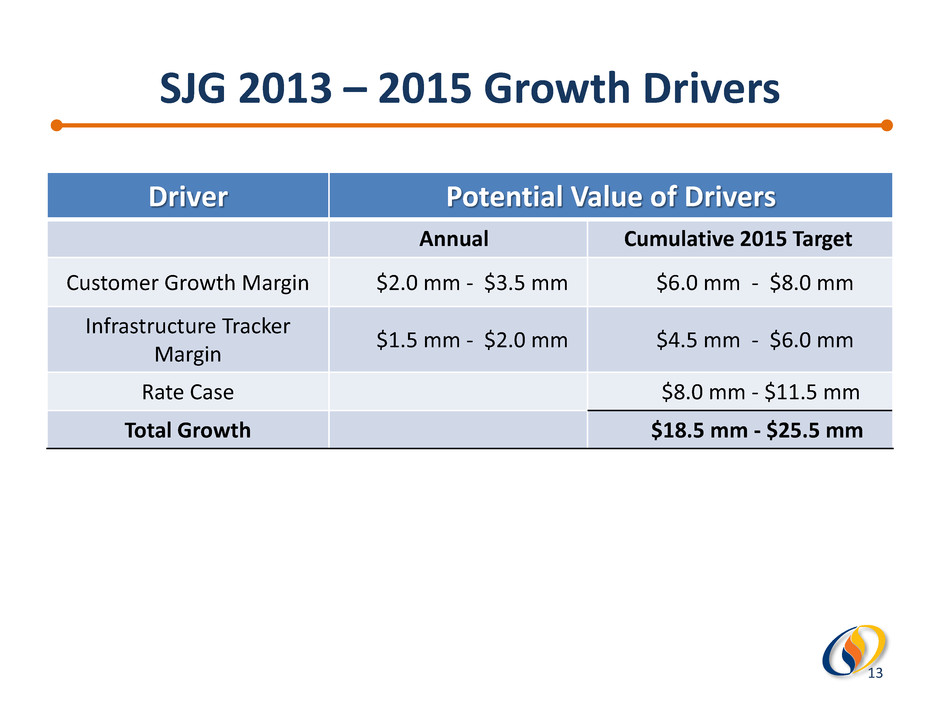
SJG 2013 – 2015 Growth Drivers Driver Potential Value of Drivers Annual Cumulative 2015 Target Customer Growth Margin $2.0 mm - $3.5 mm $6.0 mm - $8.0 mm Infrastructure Tracker Margin $1.5 mm - $2.0 mm $4.5 mm - $6.0 mm Rate Case $8.0 mm - $11.5 mm Total Growth $18.5 mm - $25.5 mm 13
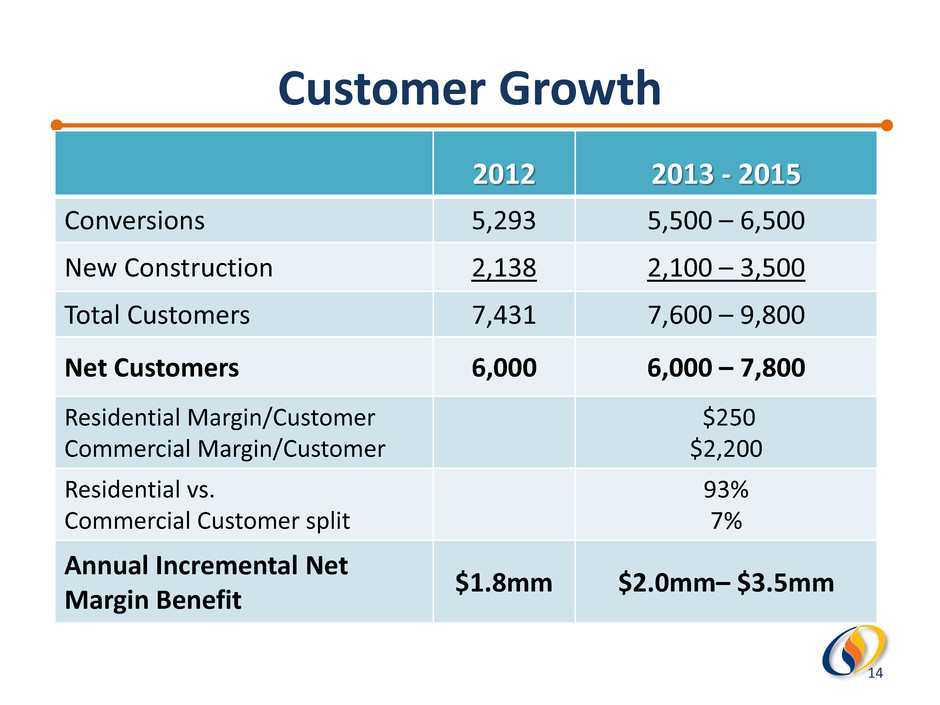
Customer Growth 2012 2013 - 2015 Conversions 5,293 5,500 – 6,500 New Construction 2,138 2,100 – 3,500 Total Customers 7,431 7,600 – 9,800 Net Customers 6,000 6,000 – 7,800 Residential Margin/Customer Commercial Margin/Customer $250 $2,200 Residential vs. Commercial Customer split 93% 7% Annual Incremental Net Margin Benefit $1.8mm $2.0mm– $3.5mm 14
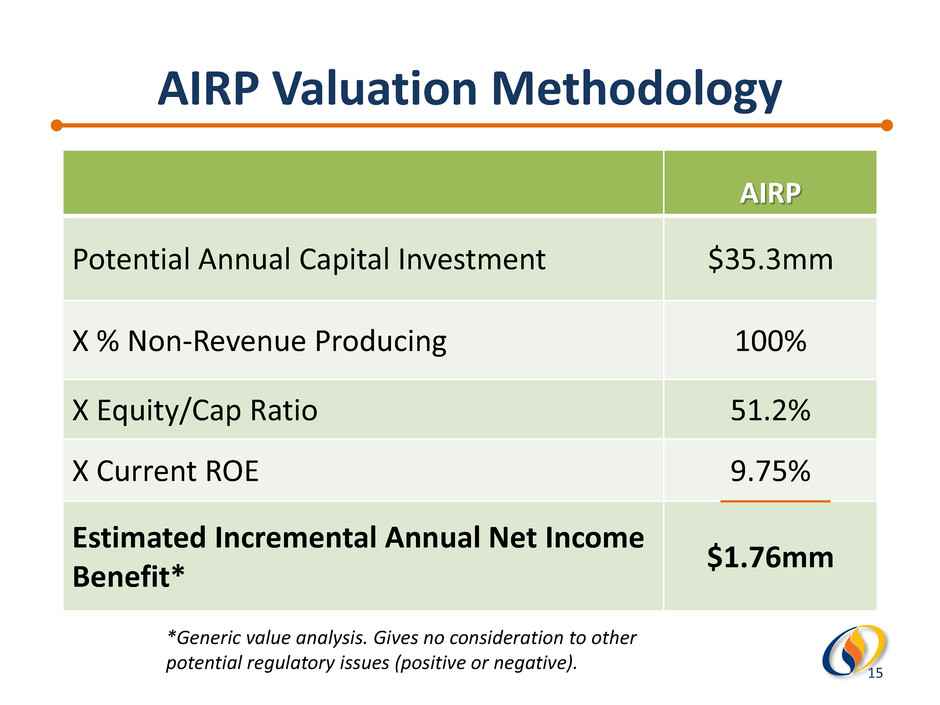
AIRP Valuation Methodology *Generic value analysis. Gives no consideration to other potential regulatory issues (positive or negative). AIRP Potential Annual Capital Investment $35.3mm X % Non-Revenue Producing 100% X Equity/Cap Ratio 51.2% X Current ROE 9.75% Estimated Incremental Annual Net Income Benefit* $1.76mm 15
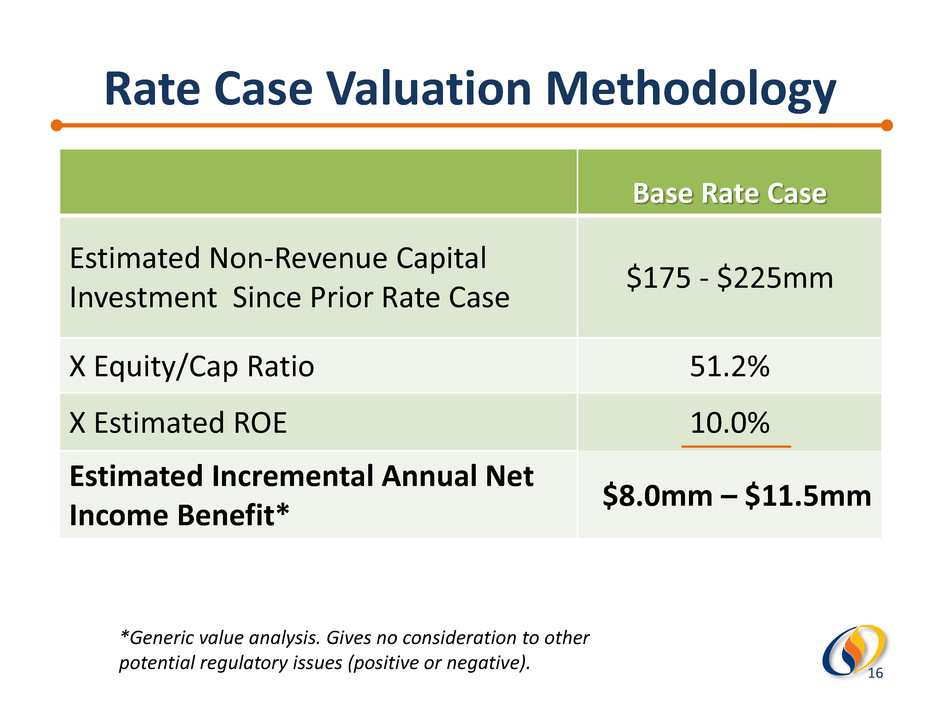
Rate Case Valuation Methodology *Generic value analysis. Gives no consideration to other potential regulatory issues (positive or negative). Base Rate Case Estimated Non-Revenue Capital Investment Since Prior Rate Case $175 - $225mm X Equity/Cap Ratio 51.2% X Estimated ROE 10.0% Estimated Incremental Annual Net Income Benefit* $8.0mm – $11.5mm 16
Electric Generation Opportunities BPU approved contract to serve BL England generating station also provides model to serve additional merchant or CHP projects • Facility becomes operational in 2016 • Investment of approximately $35 million • Annual throughput of approximately 20mm DTs = 267,000 homes 17
Continuation of AIRP • Current program runs through 2016 • Anticipate extension through 2024 to replace 1,081 miles of cast iron and bare steel Long Term Utility Growth Opportunities Hardening of Assets • Post Sandy focus on generation and transmission reliability • Replace low pressure infrastructure with high pressure in coastal communities • Regulatory proposals driving revenue producing utility loans for CHP growth • NJ Master Plan targets significant CHP development Additional Electric Generation • Targeting other sites in South Jersey for conversion to natural gas CNG • SJG developed fueling stations run through rate base • Third party developed stations served by utility 18

19
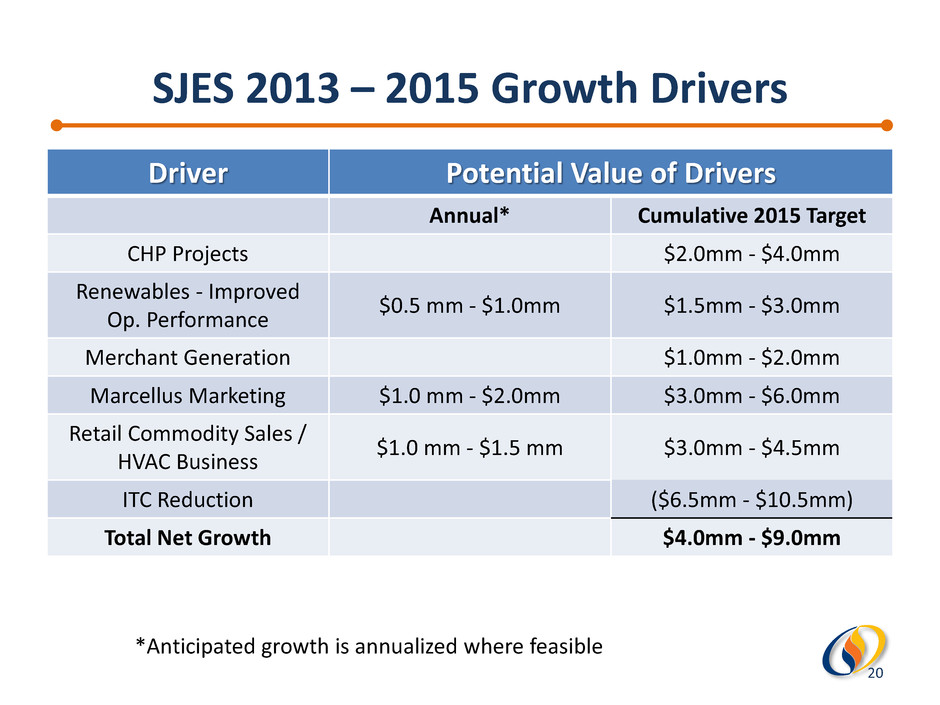
SJES 2013 – 2015 Growth Drivers Driver Potential Value of Drivers Annual* Cumulative 2015 Target CHP Projects $2.0mm - $4.0mm Renewables - Improved Op. Performance $0.5 mm - $1.0mm $1.5mm - $3.0mm Merchant Generation $1.0mm - $2.0mm Marcellus Marketing $1.0 mm - $2.0mm $3.0mm - $6.0mm Retail Commodity Sales / HVAC Business $1.0 mm - $1.5 mm $3.0mm - $4.5mm ITC Reduction ($6.5mm - $10.5mm) Total Net Growth $4.0mm - $9.0mm *Anticipated growth is annualized where feasible 20
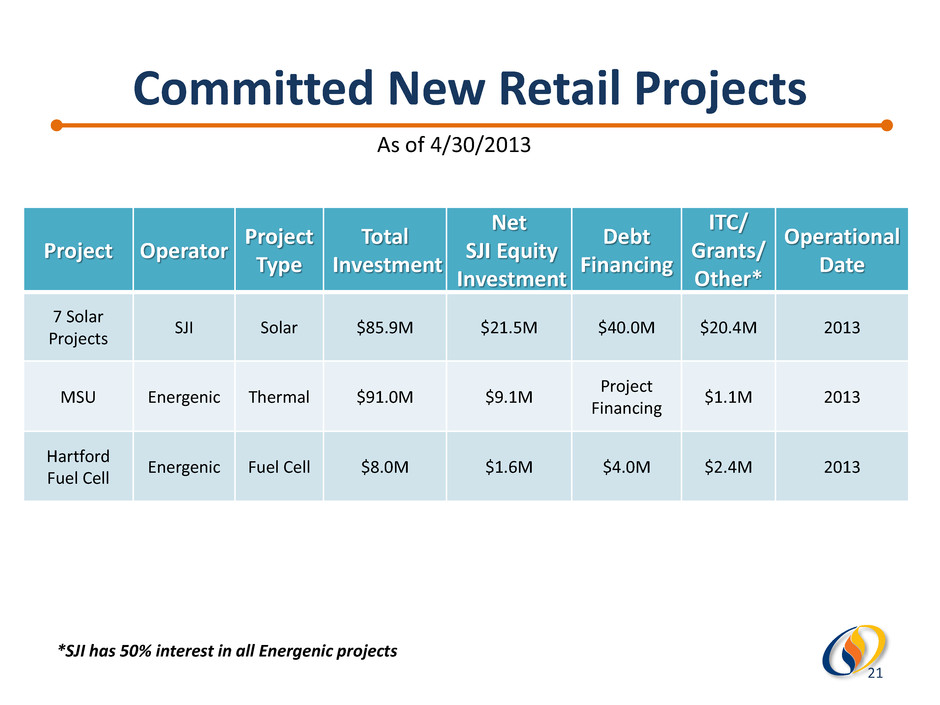
Committed New Retail Projects As of 4/30/2013 *SJI has 50% interest in all Energenic projects Project Operator Project Type Total Investment Net SJI Equity Investment Debt Financing ITC/ Grants/ Other* Operational Date 7 Solar Projects SJI Solar $85.9M $21.5M $40.0M $20.4M 2013 MSU Energenic Thermal $91.0M $9.1M Project Financing $1.1M 2013 Hartford Fuel Cell Energenic Fuel Cell $8.0M $1.6M $4.0M $2.4M 2013 21

CHP/Thermal Project Analytics • Modeled as: – 20% - 30% equity component – ROE of 15% - 20% – Joint venture ownership with long-time partner – Utilizes project financing • Target adding 1-2 new projects per year 22
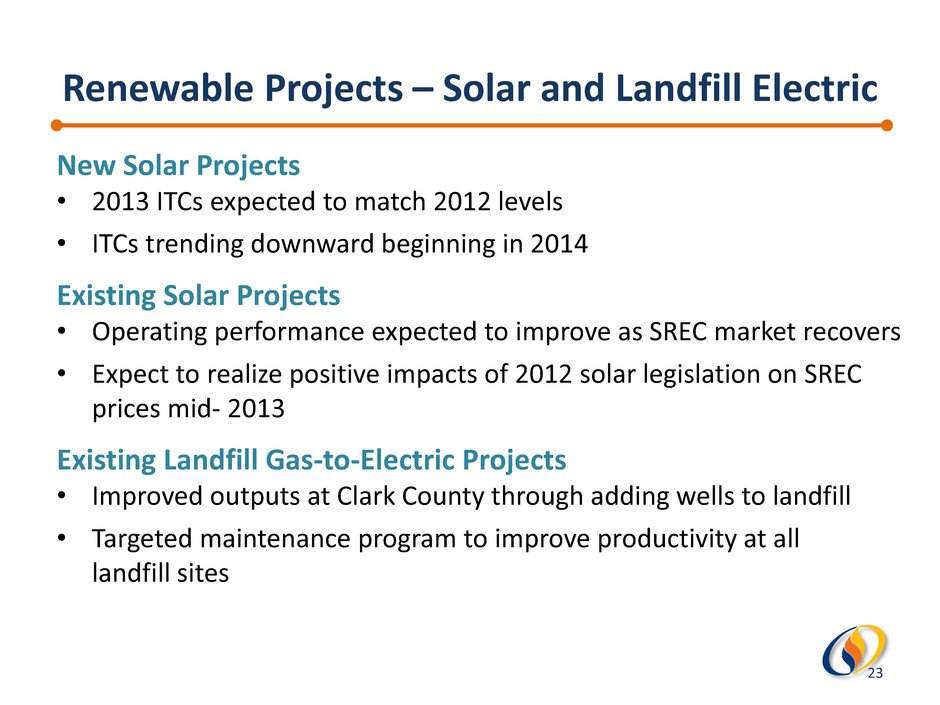
Renewable Projects – Solar and Landfill Electric New Solar Projects • 2013 ITCs expected to match 2012 levels • ITCs trending downward beginning in 2014 Existing Solar Projects • Operating performance expected to improve as SREC market recovers • Expect to realize positive impacts of 2012 solar legislation on SREC prices mid- 2013 Existing Landfill Gas-to-Electric Projects • Improved outputs at Clark County through adding wells to landfill • Targeted maintenance program to improve productivity at all landfill sites 23

Marcellus Marketing Opportunities • Grew volume by 270K DTs in 2012, to approximately 740K DTs / day • Anticipate continuing increases in volumes of approximately 200K DTs per day, per year • Contract terms average 3-10 years, structured on a fee and/or index price basis • Action being taken to reduce reservation fees on leased gas storages 24
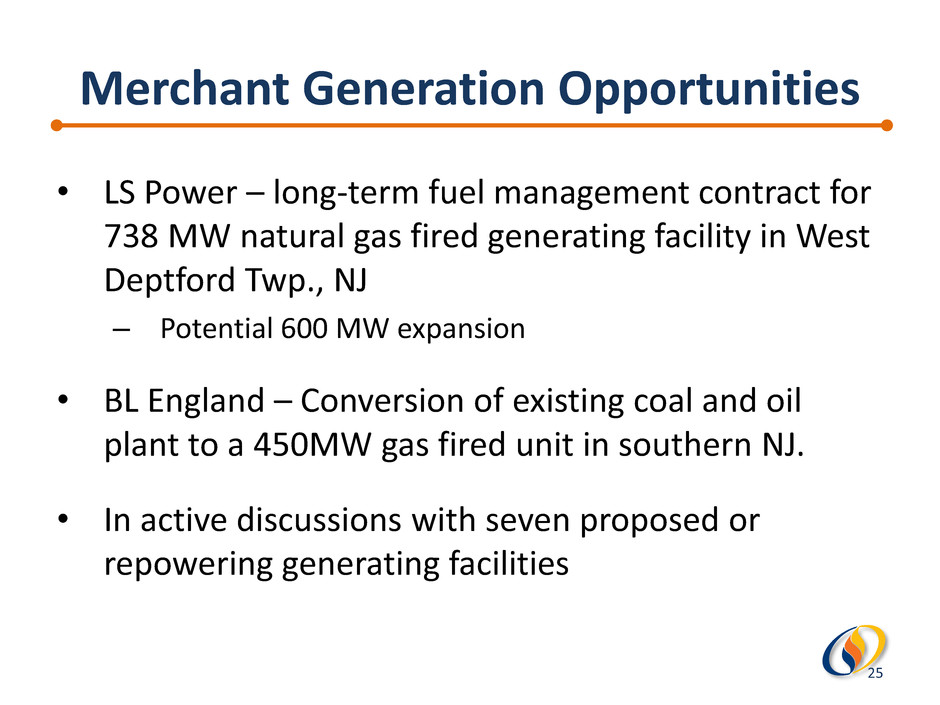
Merchant Generation Opportunities • LS Power – long-term fuel management contract for 738 MW natural gas fired generating facility in West Deptford Twp., NJ – Potential 600 MW expansion • BL England – Conversion of existing coal and oil plant to a 450MW gas fired unit in southern NJ. • In active discussions with seven proposed or repowering generating facilities 25
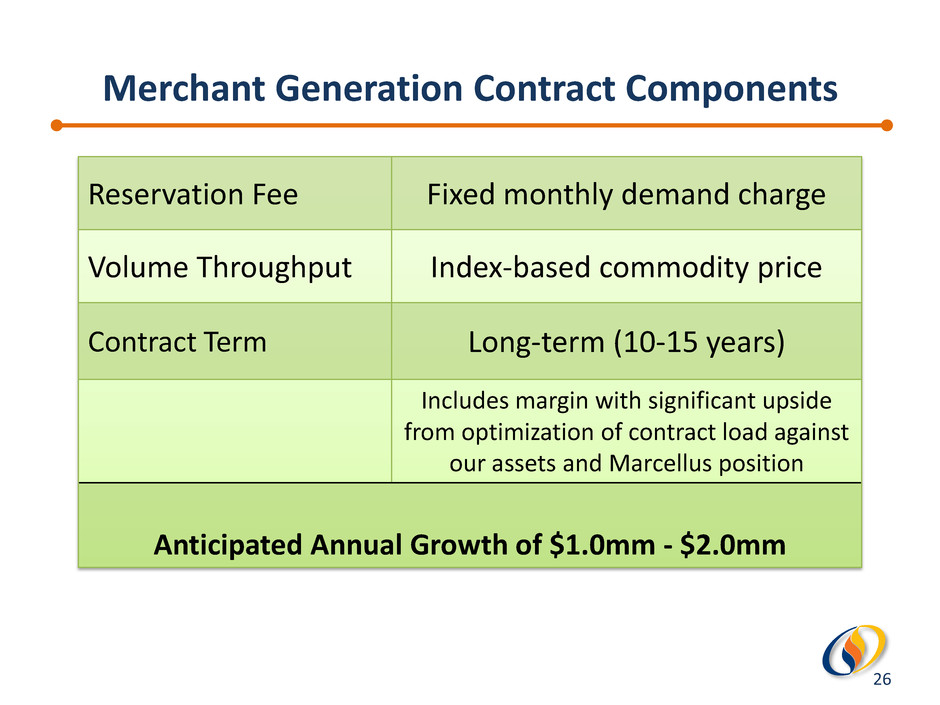
26 Reservation Fee Fixed monthly demand charge Volume Throughput Index-based commodity price Contract Term Long-term (10-15 years) Includes margin with significant upside from optimization of contract load against our assets and Marcellus position Anticipated Annual Growth of $1.0mm - $2.0mm Merchant Generation Contract Components
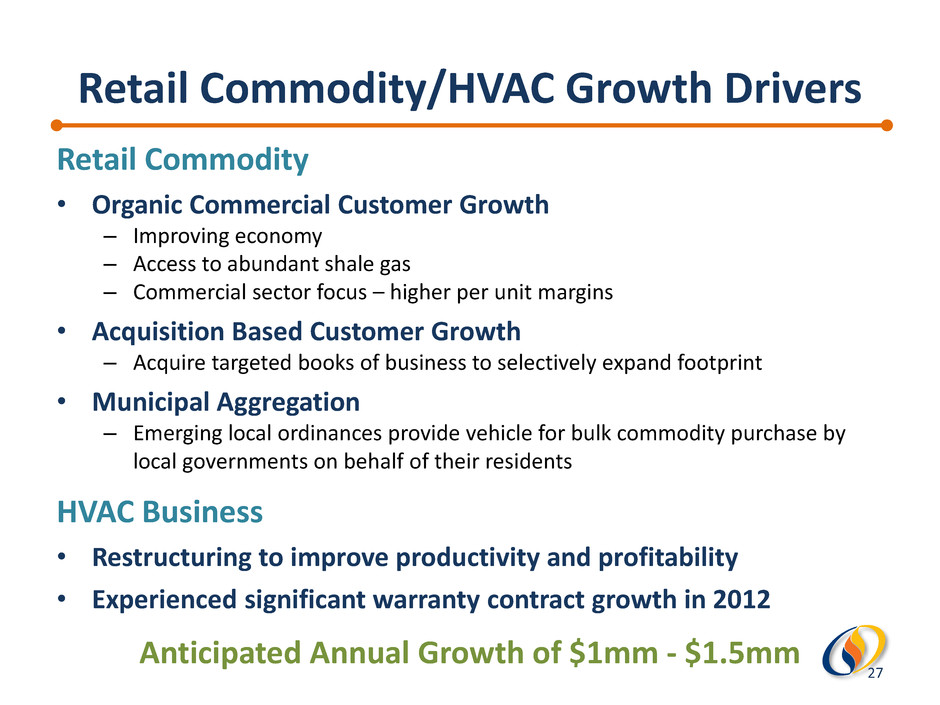
Retail Commodity/HVAC Growth Drivers Retail Commodity • Organic Commercial Customer Growth – Improving economy – Access to abundant shale gas – Commercial sector focus – higher per unit margins • Acquisition Based Customer Growth – Acquire targeted books of business to selectively expand footprint • Municipal Aggregation – Emerging local ordinances provide vehicle for bulk commodity purchase by local governments on behalf of their residents HVAC Business • Restructuring to improve productivity and profitability • Experienced significant warranty contract growth in 2012 Anticipated Annual Growth of $1mm - $1.5mm 27
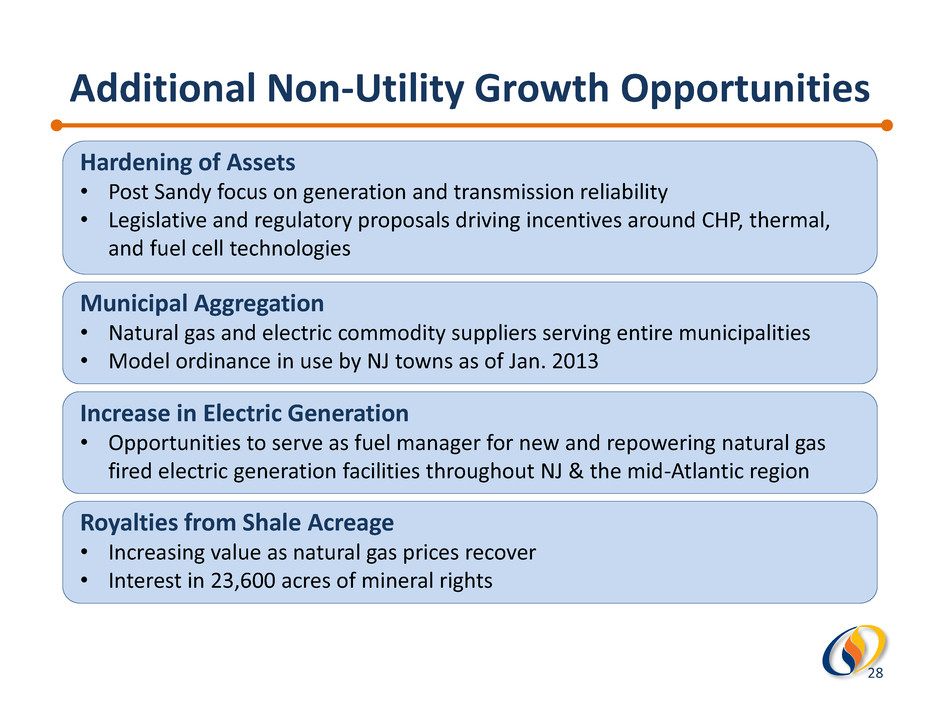
Additional Non-Utility Growth Opportunities Hardening of Assets • Post Sandy focus on generation and transmission reliability • Legislative and regulatory proposals driving incentives around CHP, thermal, and fuel cell technologies Municipal Aggregation • Natural gas and electric commodity suppliers serving entire municipalities • Model ordinance in use by NJ towns as of Jan. 2013 Increase in Electric Generation • Opportunities to serve as fuel manager for new and repowering natural gas fired electric generation facilities throughout NJ & the mid-Atlantic region Royalties from Shale Acreage • Increasing value as natural gas prices recover • Interest in 23,600 acres of mineral rights 28
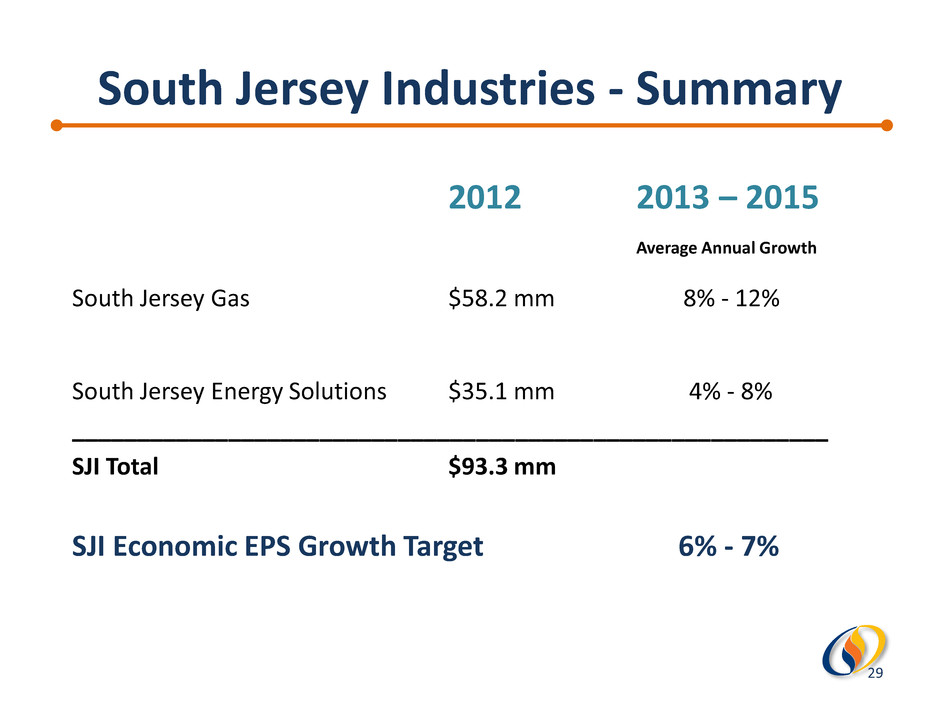
2012 2013 – 2015 Average Annual Growth South Jersey Gas $58.2 mm 8% - 12% South Jersey Energy Solutions $35.1 mm 4% - 8% __________________________________________________________ SJI Total $93.3 mm SJI Economic EPS Growth Target 6% - 7% South Jersey Industries - Summary 29

APPENDIX 30

Marcellus Royalty Investment Potato Creek Acquired Acreage Acres 21,500 2,100 Royalty Percentage 3% 14.5% Net Acres 630 305 MCF per Acre 37,500 37,500 Forecasted Production (BCF) 23.6 9.8 Unit Revenue $4.50 $4.50 Gross Income (in millions) $106.2 $44.1 SJI Investment (in millions) $2.6 $5.4 SJI’s net cash deployed = $500K 31
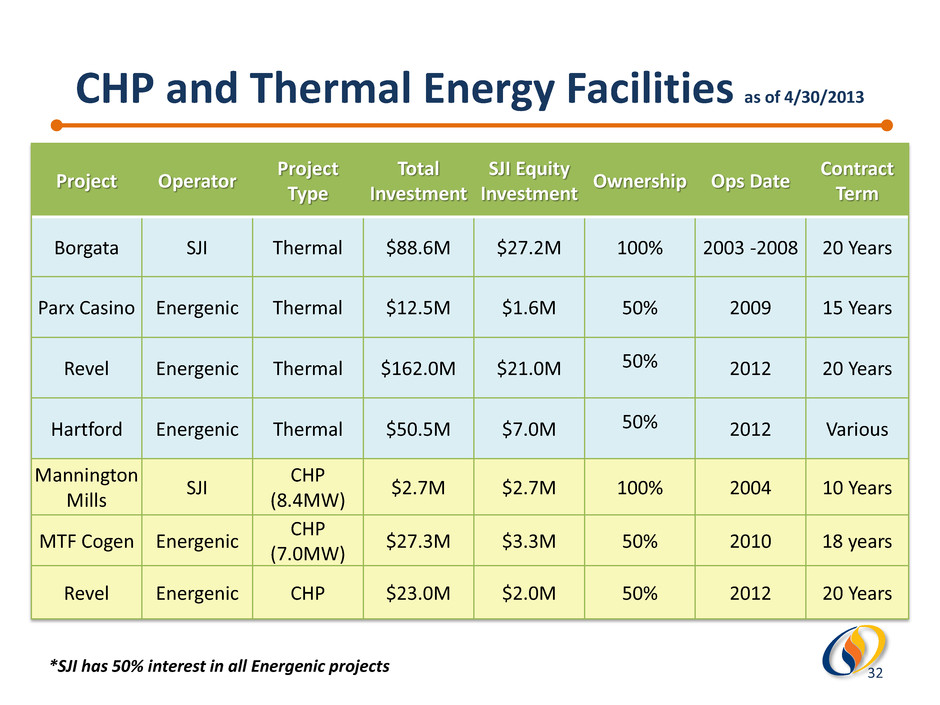
CHP and Thermal Energy Facilities as of 4/30/2013 Project Operator Project Type Total Investment SJI Equity Investment Ownership Ops Date Contract Term Borgata SJI Thermal $88.6M $27.2M 100% 2003 -2008 20 Years Parx Casino Energenic Thermal $12.5M $1.6M 50% 2009 15 Years Revel Energenic Thermal $162.0M $21.0M 50% 2012 20 Years Hartford Energenic Thermal $50.5M $7.0M 50% 2012 Various Mannington Mills SJI CHP (8.4MW) $2.7M $2.7M 100% 2004 10 Years MTF Cogen Energenic CHP (7.0MW) $27.3M $3.3M 50% 2010 18 years Revel Energenic CHP $23.0M $2.0M 50% 2012 20 Years *SJI has 50% interest in all Energenic projects 32
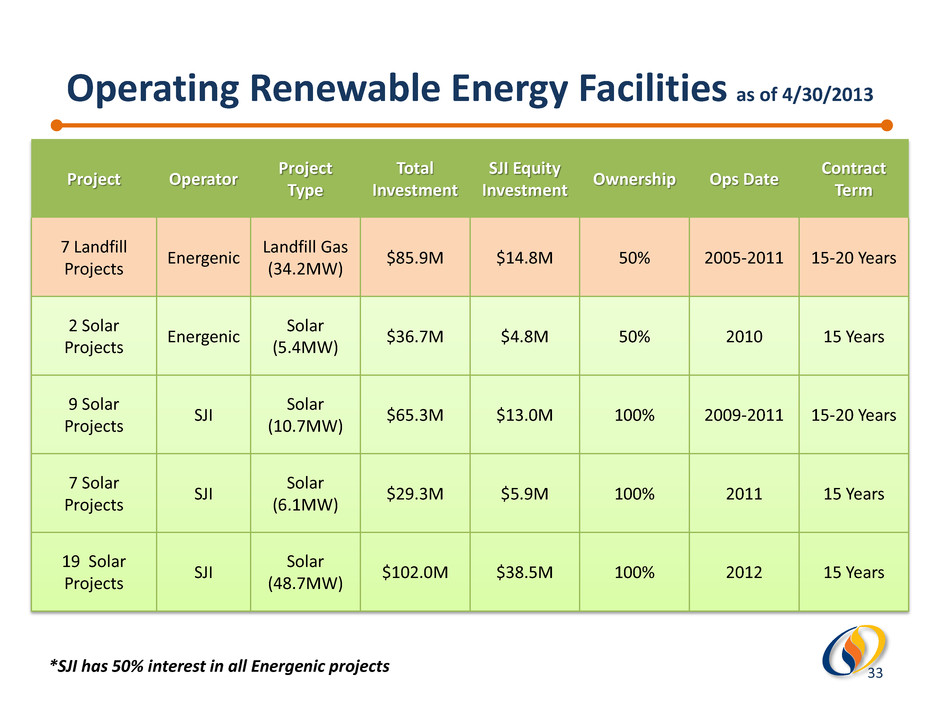
Operating Renewable Energy Facilities as of 4/30/2013 *SJI has 50% interest in all Energenic projects Project Operator Project Type Total Investment SJI Equity Investment Ownership Ops Date Contract Term 7 Landfill Projects Energenic Landfill Gas (34.2MW) $85.9M $14.8M 50% 2005-2011 15-20 Years 2 Solar Projects Energenic Solar (5.4MW) $36.7M $4.8M 50% 2010 15 Years 9 Solar Projects SJI Solar (10.7MW) $65.3M $13.0M 100% 2009-2011 15-20 Years 7 Solar Projects SJI Solar (6.1MW) $29.3M $5.9M 100% 2011 15 Years 19 Solar Projects SJI Solar (48.7MW) $102.0M $38.5M 100% 2012 15 Years 33
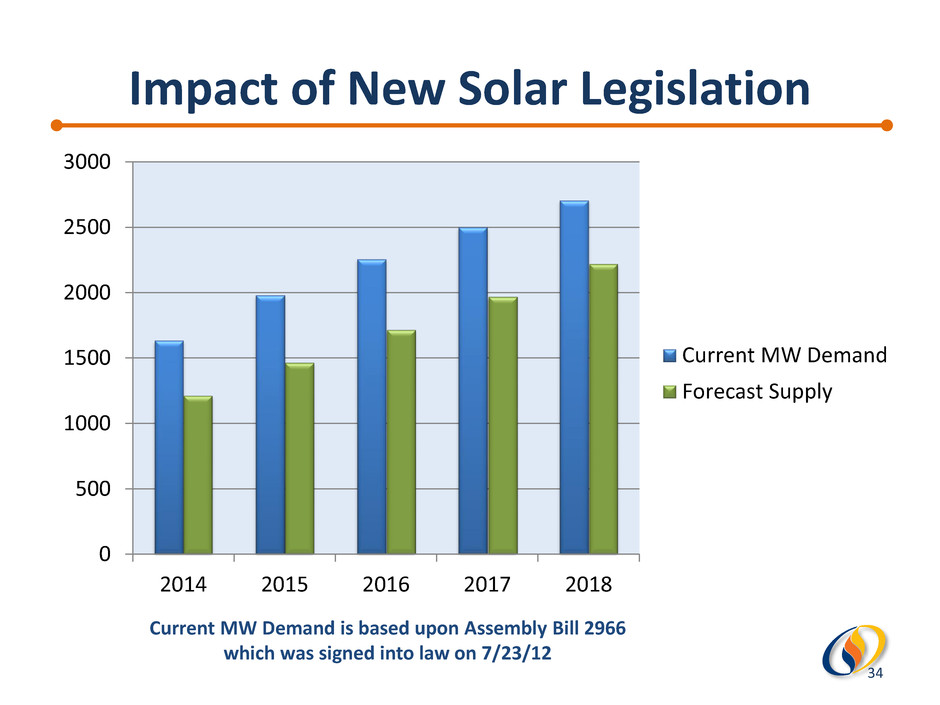
Impact of New Solar Legislation 0 500 1000 1500 2000 2500 3000 2014 2015 2016 2017 2018 Current MW Demand Forecast Supply Current MW Demand is based upon Assembly Bill 2966 which was signed into law on 7/23/12 34
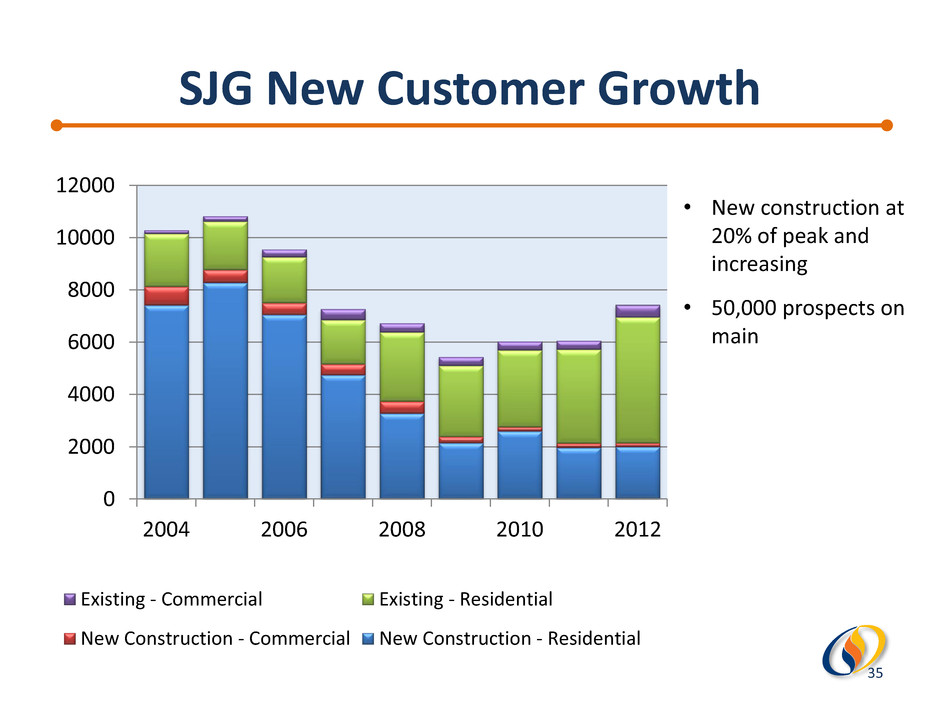
SJG New Customer Growth 0 2000 4000 6000 8000 10000 12000 2004 2006 2008 2010 2012 Existing - Commercial Existing - Residential New Construction - Commercial New Construction - Residential • New construction at 20% of peak and increasing • 50,000 prospects on main 35


