
South Jersey Industries IDEAS Conference – Chicago August 31, 2016
Forward Looking Statements Certain statements contained in this presentation may qualify as “forward-looking statements” within the meaning of Section 27A of the Securities Act of 1933 and Section 21E of the Securities Exchange Act of 1934. All statements other than statements of historical fact should be considered forward-looking statements made in good faith and are intended to qualify for the safe harbor from liability established by the Private Securities Litigation Reform Act of 1995. Words such as “anticipate”, “believe”, “expect”, “estimate”, “forecast”, “goal”, “intend”, “objective”, “plan”, “project”, “seek”, “strategy” and similar expressions are intended to identify forward-looking statements. Such forward-looking statements are subject to risks and uncertainties that could cause actual results to differ materially from those expressed or implied in the statements. These risks and uncertainties include, but are not limited to, the following: general economic conditions on an international, national, state and local level; weather conditions in our marketing areas; changes in commodity costs; changes in the availability of natural gas; “non-routine” or “extraordinary” disruptions in our distribution system; regulatory, legislative and court decisions; competition; the availability and cost of capital; costs and effects of legal proceedings and environmental liabilities; the failure of customers or suppliers to fulfill their contractual obligations; and changes in business strategies. These cautionary statements should not be construed by you to be exhaustive. While SJI believes these forward-looking statements to be reasonable, there can be no assurance that they will approximate actual experience. Further, SJI undertakes no obligation to update or revise any of its forward-looking statements, whether as a result of new information, future events or otherwise. 2

South Jersey Industries Business Overview
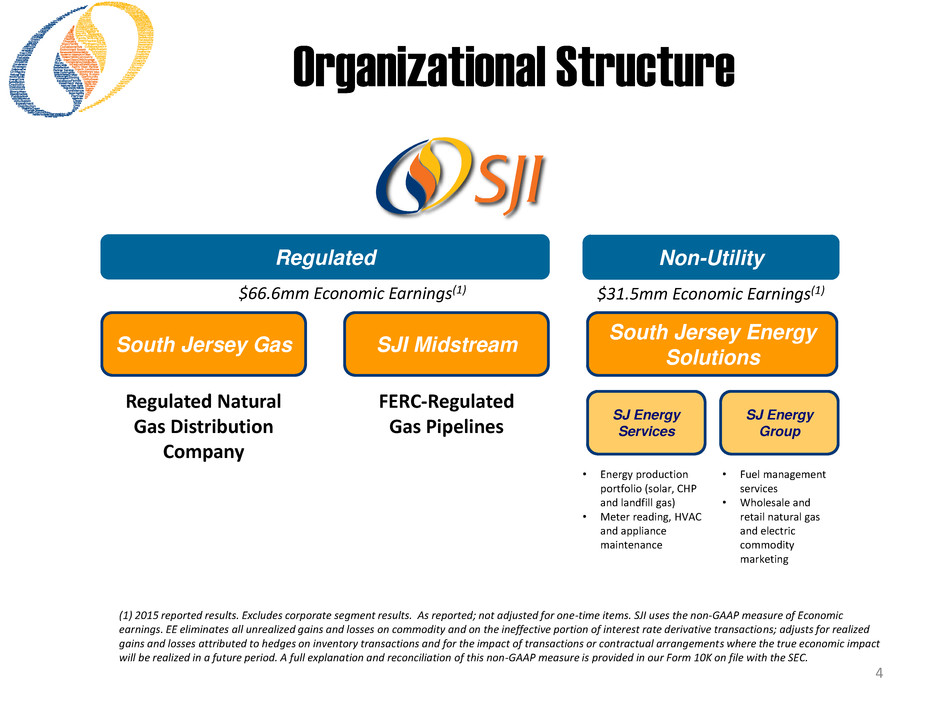
4 South Jersey Gas SJI Midstream South Jersey Energy Solutions Regulated Natural Gas Distribution Company FERC-Regulated Gas Pipelines SJ Energy Services SJ Energy Group • Energy production portfolio (solar, CHP and landfill gas) • Meter reading, HVAC and appliance maintenance • Fuel management services • Wholesale and retail natural gas and electric commodity marketing $66.6mm Economic Earnings(1) $31.5mm Economic Earnings(1) Regulated Non-Utility (1) 2015 reported results. Excludes corporate segment results. As reported; not adjusted for one-time items. SJI uses the non-GAAP measure of Economic earnings. EE eliminates all unrealized gains and losses on commodity and on the ineffective portion of interest rate derivative transactions; adjusts for realized gains and losses attributed to hedges on inventory transactions and for the impact of transactions or contractual arrangements where the true economic impact will be realized in a future period. A full explanation and reconciliation of this non-GAAP measure is provided in our Form 10K on file with the SEC. Organizational Structure
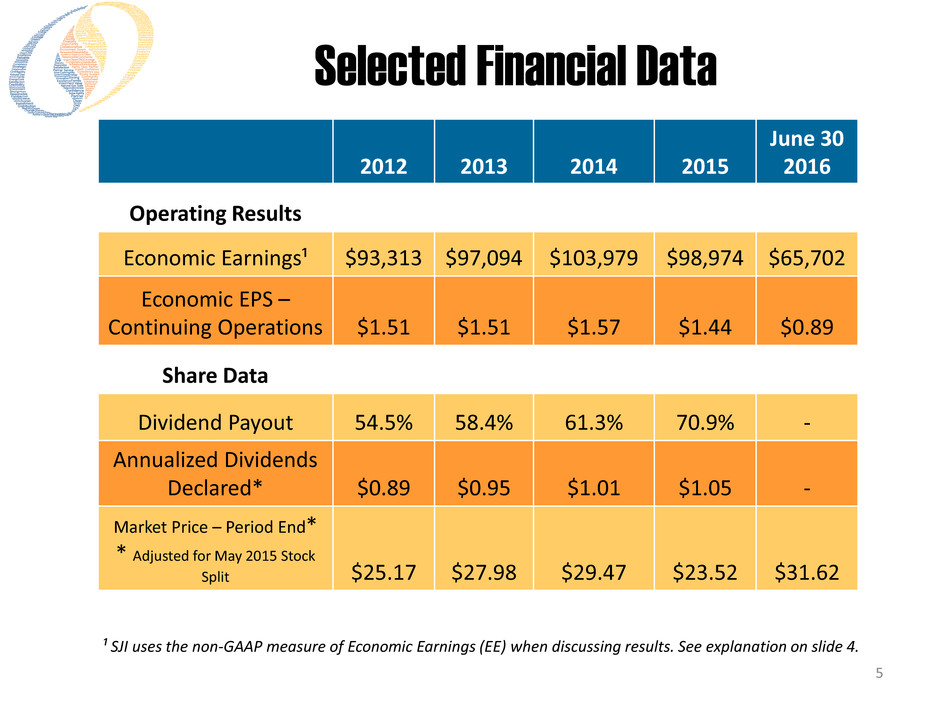
2012 2013 2014 2015 June 30 2016 Operating Results Economic Earnings¹ $93,313 $97,094 $103,979 $98,974 $65,702 Economic EPS – Continuing Operations $1.51 $1.51 $1.57 $1.44 $0.89 Share Data Dividend Payout 54.5% 58.4% 61.3% 70.9% - Annualized Dividends Declared* $0.89 $0.95 $1.01 $1.05 - Market Price – Period End* * Adjusted for May 2015 Stock Split $25.17 $27.98 $29.47 $23.52 $31.62 5 ¹ SJI uses the non-GAAP measure of Economic Earnings (EE) when discussing results. See explanation on slide 4. Selected Financial Data
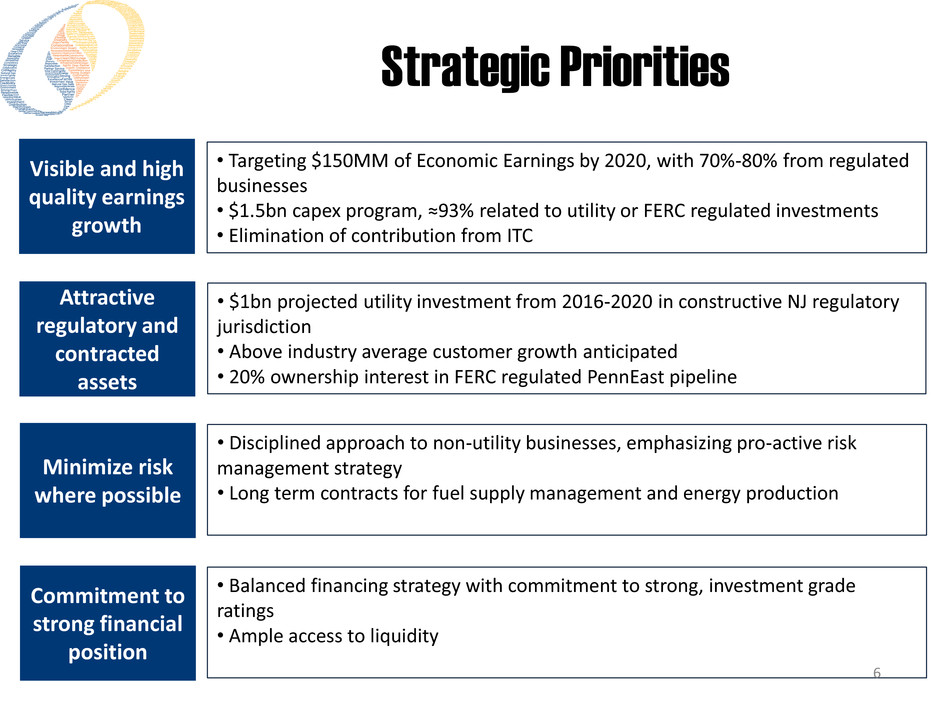
Strategic Priorities • Targeting $150MM of Economic Earnings by 2020, with 70%-80% from regulated businesses • $1.5bn capex program, ≈93% related to utility or FERC regulated investments • Elimination of contribution from ITC • Balanced financing strategy with commitment to strong, investment grade ratings • Ample access to liquidity 6 Visible and high quality earnings growth Attractive regulatory and contracted assets Minimize risk where possible Commitment to strong financial position • $1bn projected utility investment from 2016-2020 in constructive NJ regulatory jurisdiction • Above industry average customer growth anticipated • 20% ownership interest in FERC regulated PennEast pipeline • Disciplined approach to non-utility businesses, emphasizing pro-active risk management strategy • Long term contracts for fuel supply management and energy production
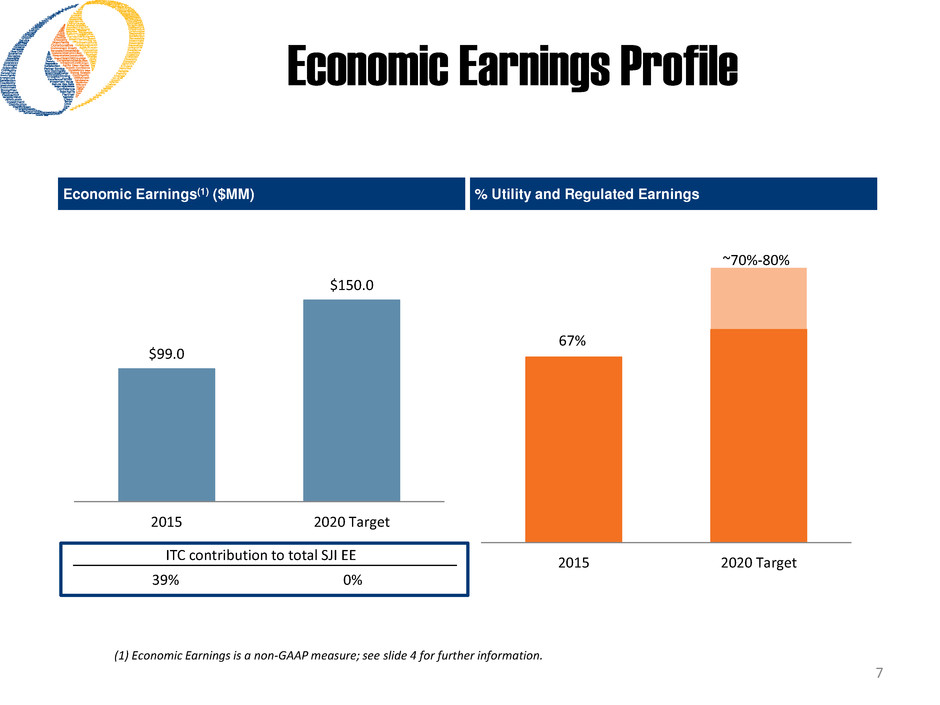
Economic Earnings Profile 7 (1) Economic Earnings is a non-GAAP measure; see slide 4 for further information. $99.0 $150.0 2015 2020 Target Economic Earnings(1) ($MM) % Utility and Regulated Earnings 67% ~70%-80% 2015 2020 TargetITC contribution to total SJI EE 39% 0%
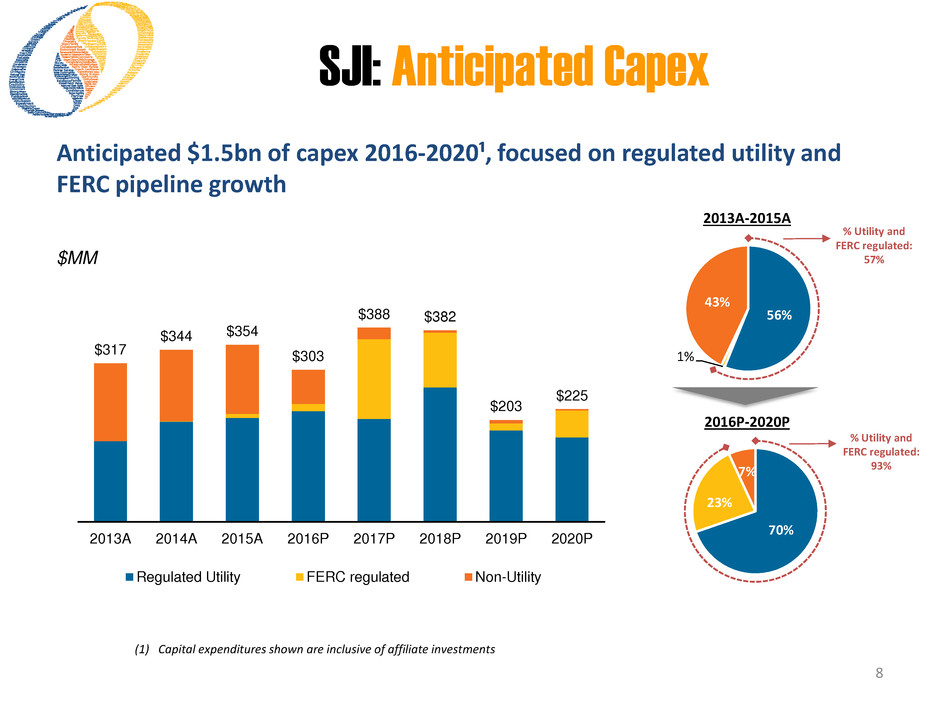
70% 23% 7% 56% 1% 43% 8 $MM Anticipated $1.5bn of capex 2016-2020¹, focused on regulated utility and FERC pipeline growth (1) Capital expenditures shown are inclusive of affiliate investments 2013A-2015A 2016P-2020P % Utility and FERC regulated: 57% % Utility and FERC regulated: 93% $317 $344 $354 $303 $388 $382 $203 $225 2013A 2014A 2015A 2016P 2017P 2018P 2019P 2020P Regulated Utility FERC regulated Non-Utility SJI: Anticipated Capex
South Jersey Gas
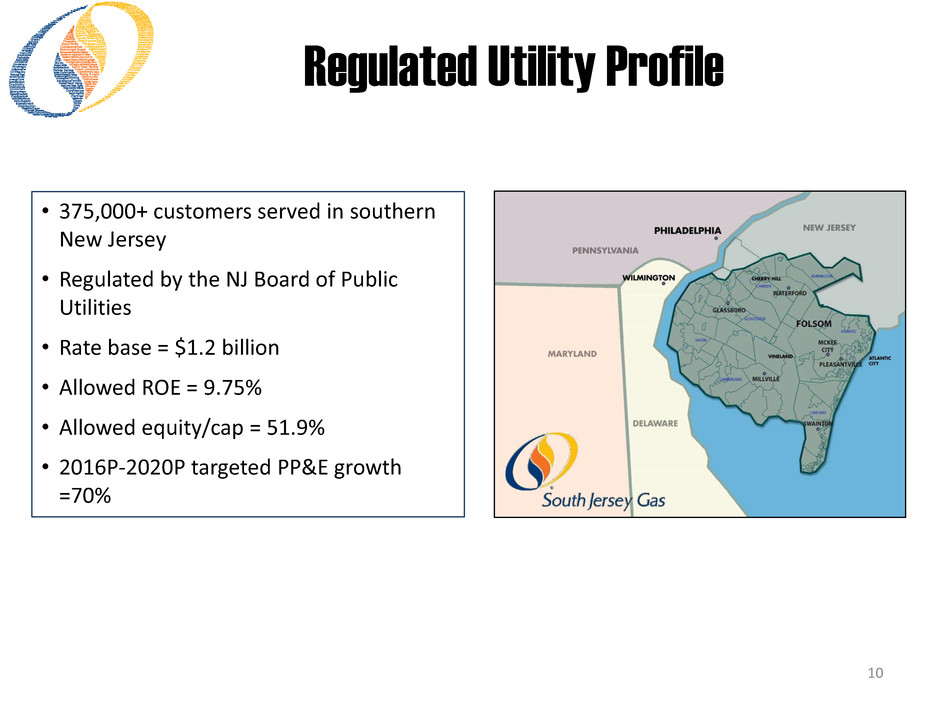
10 • 375,000+ customers served in southern New Jersey • Regulated by the NJ Board of Public Utilities • Rate base = $1.2 billion • Allowed ROE = 9.75% • Allowed equity/cap = 51.9% • 2016P-2020P targeted PP&E growth =70% Regulated Utility Profile
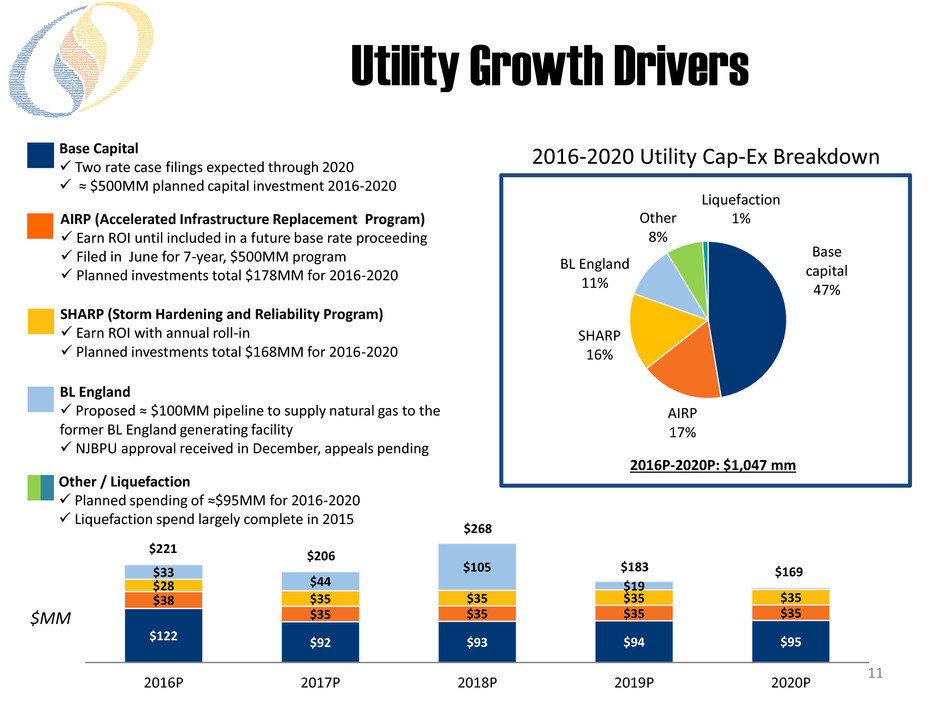
11 $122 $92 $93 $94 $95 $38 $35 $35 $35 $35 $28 $35 $35 $35 $35 $33 $44 $105 $19 $206 $268 $183 $169 2016P 2017P 2018P 2019P 2020P $221 Utility Growth Drivers Base Capital Two rate case filings expected through 2020 ≈ $500MM planned capital investment 2016-2020 Other / Liquefaction Planned spending of ≈$95MM for 2016-2020 Liquefaction spend largely complete in 2015 BL England Proposed ≈ $100MM pipeline to supply natural gas to the former BL England generating facility NJBPU approval received in December, appeals pending AIRP (Accelerated Infrastructure Replacement Program) Earn ROI until included in a future base rate proceeding Filed in June for 7-year, $500MM program Planned investments total $178MM for 2016-2020 SHARP (Storm Hardening and Reliability Program) Earn ROI with annual roll-in Planned investments total $168MM for 2016-2020 Base capital 47% AIRP 17% SHARP 16% Other 8% Liquefaction 1% BL England 11% 2016P-2020P: $1,047 mm 2016-2020 Utility Cap-Ex Breakdown $MM
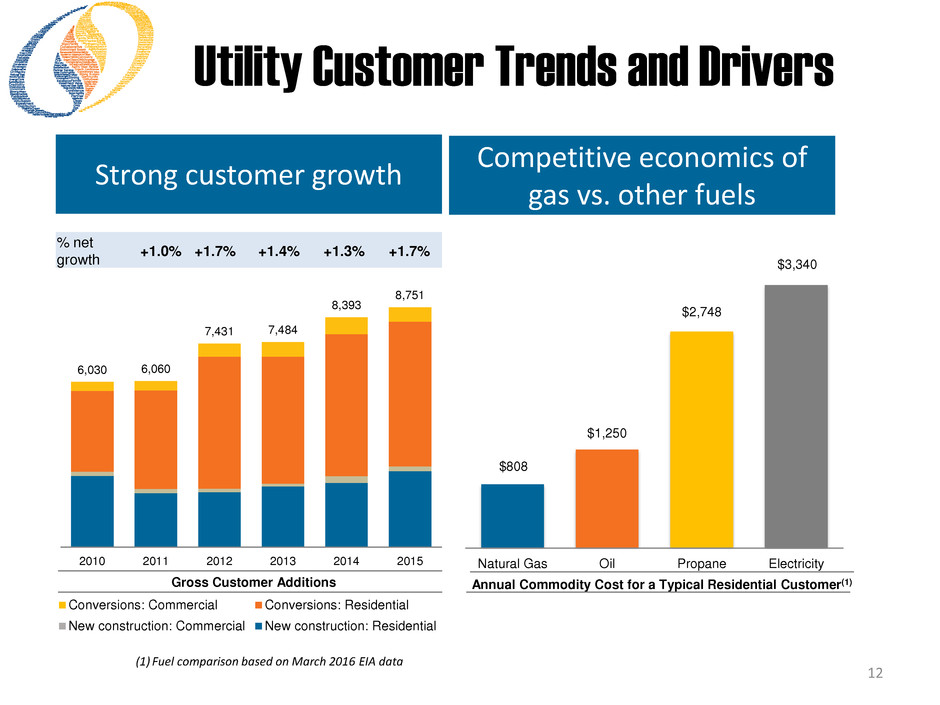
Conversions: Commercial Conversions: Residential New construction: Commercial New construction: Residential 12 % net growth +1.0% +1.7% +1.4% +1.3% +1.7% Strong customer growth $808 $1,250 $2,748 $3,340 Natural Gas Oil Propane Electricity Competitive economics of gas vs. other fuels (1) Fuel comparison based on March 2016 EIA data Annual Commodity Cost for a Typical Residential Customer(1) Gross Customer Additions 6,030 6,060 7,431 7,484 8,393 8,751 2010 2011 2012 2013 2014 2015 Utility Customer Trends and Drivers
SJI Midstream
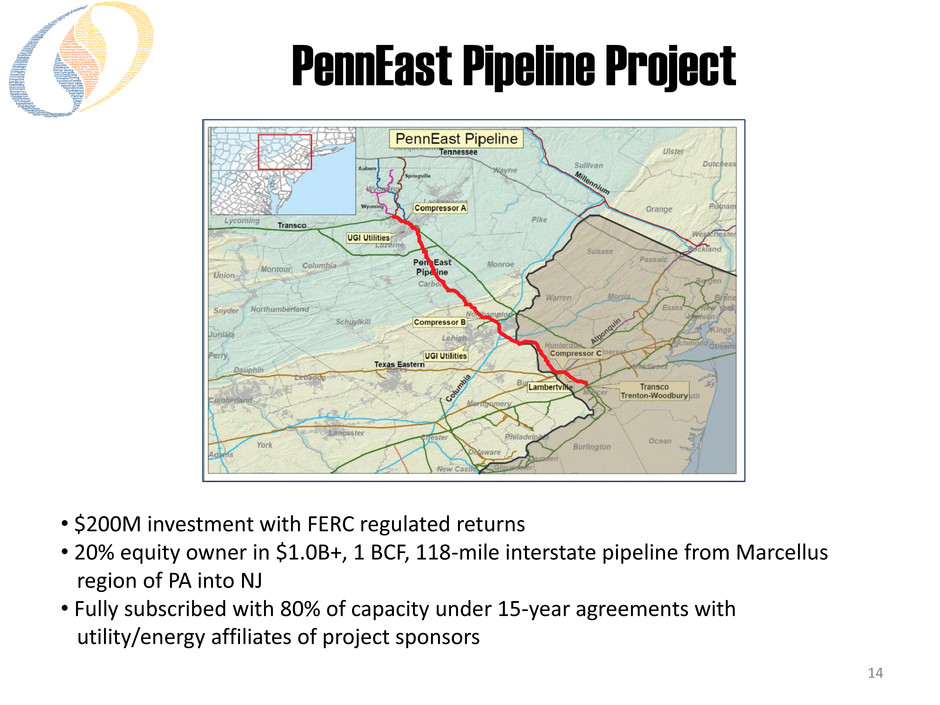
14 PennEast Pipeline Project • $200M investment with FERC regulated returns • 20% equity owner in $1.0B+, 1 BCF, 118-mile interstate pipeline from Marcellus region of PA into NJ • Fully subscribed with 80% of capacity under 15-year agreements with utility/energy affiliates of project sponsors
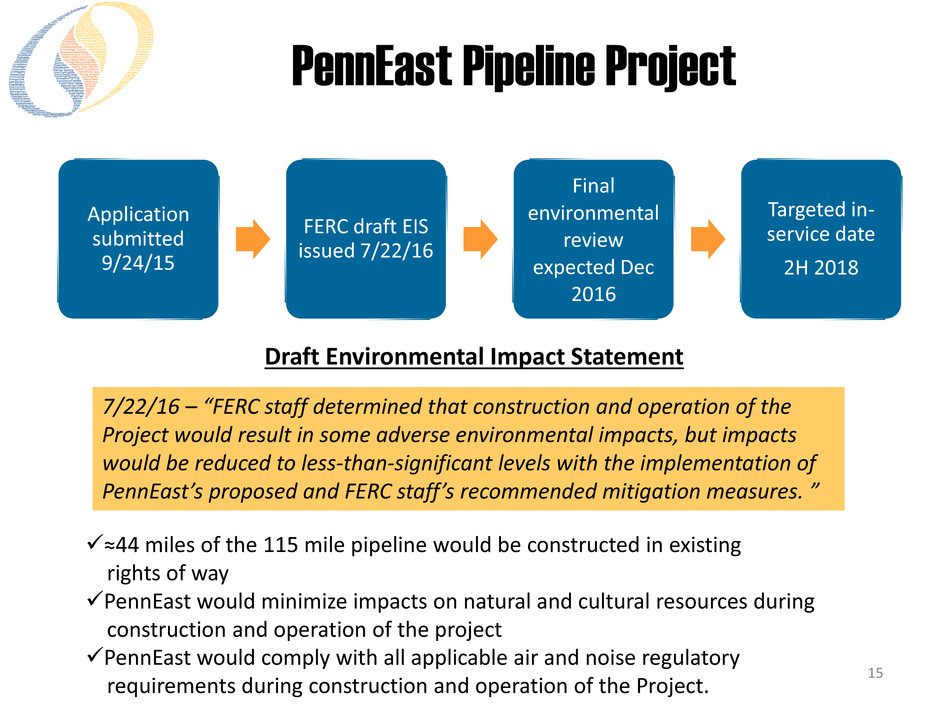
15 PennEast Pipeline Project Application submitted 9/24/15 FERC draft EIS issued 7/22/16 Final environmental review expected Dec 2016 Targeted in- service date 2H 2018 Draft Environmental Impact Statement 7/22/16 – “FERC staff determined that construction and operation of the Project would result in some adverse environmental impacts, but impacts would be reduced to less-than-significant levels with the implementation of PennEast’s proposed and FERC staff’s recommended mitigation measures. ” ≈44 miles of the 115 mile pipeline would be constructed in existing rights of way PennEast would minimize impacts on natural and cultural resources during construction and operation of the project PennEast would comply with all applicable air and noise regulatory requirements during construction and operation of the Project.
South Jersey Energy Solutions
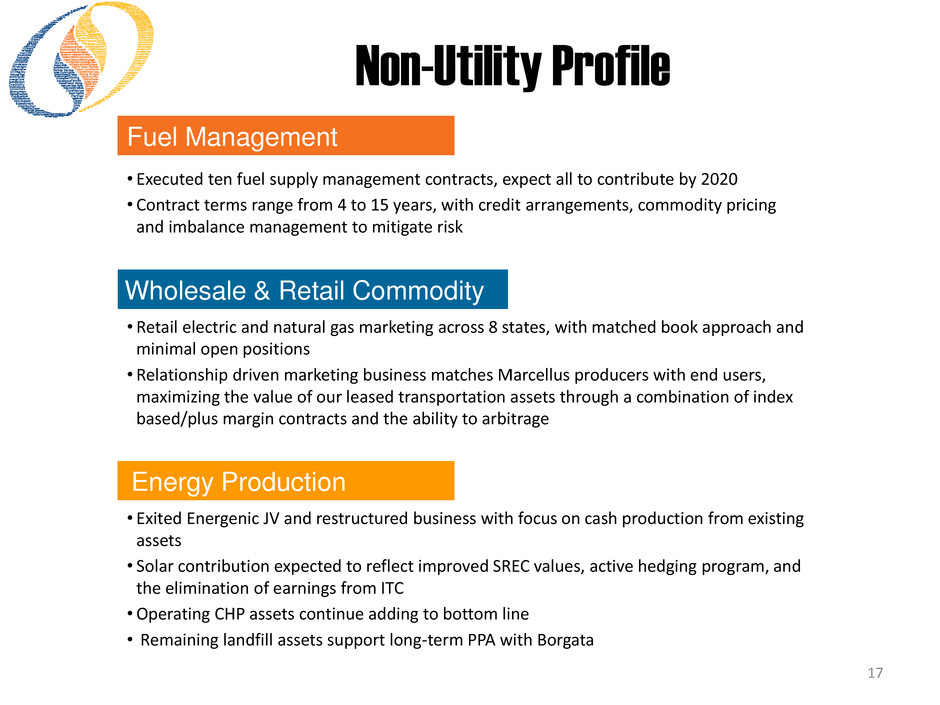
17 • Retail electric and natural gas marketing across 8 states, with matched book approach and minimal open positions • Relationship driven marketing business matches Marcellus producers with end users, maximizing the value of our leased transportation assets through a combination of index based/plus margin contracts and the ability to arbitrage • Executed ten fuel supply management contracts, expect all to contribute by 2020 • Contract terms range from 4 to 15 years, with credit arrangements, commodity pricing and imbalance management to mitigate risk • Exited Energenic JV and restructured business with focus on cash production from existing assets • Solar contribution expected to reflect improved SREC values, active hedging program, and the elimination of earnings from ITC •Operating CHP assets continue adding to bottom line • Remaining landfill assets support long-term PPA with Borgata Non-Utility Profile Wholesale & Retail Commodity Fuel Management Energy Production
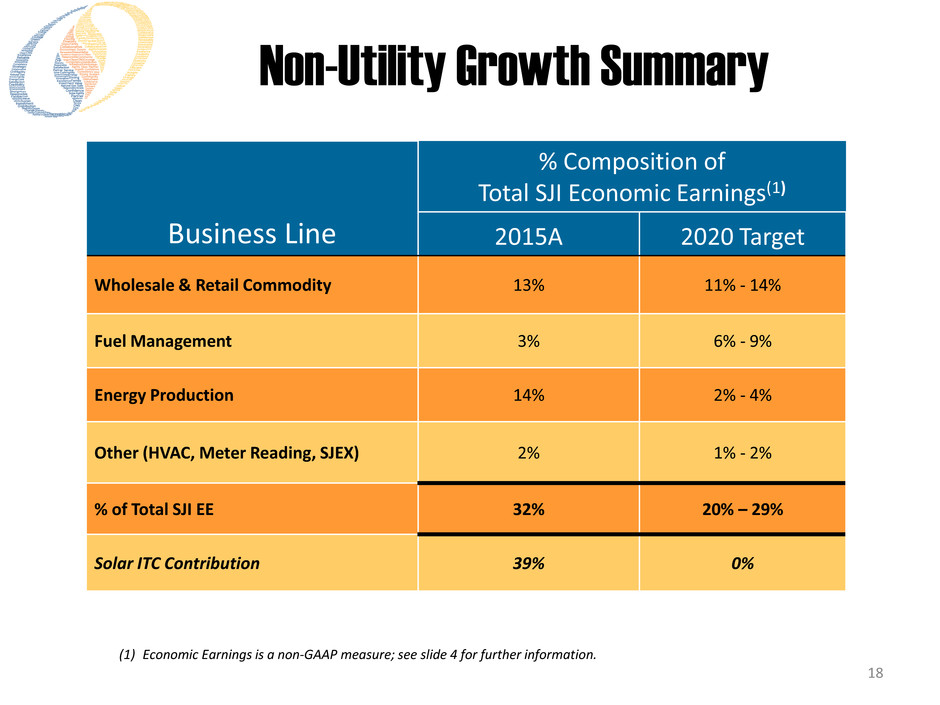
18 Business Line % Composition of Total SJI Economic Earnings(1) 2015A 2020 Target Wholesale & Retail Commodity 13% 11% - 14% Fuel Management 3% 6% - 9% Energy Production 14% 2% - 4% Other (HVAC, Meter Reading, SJEX) 2% 1% - 2% % of Total SJI EE 32% 20% – 29% Solar ITC Contribution 39% 0% (1) Economic Earnings is a non-GAAP measure; see slide 4 for further information. Non-Utility Growth Summary
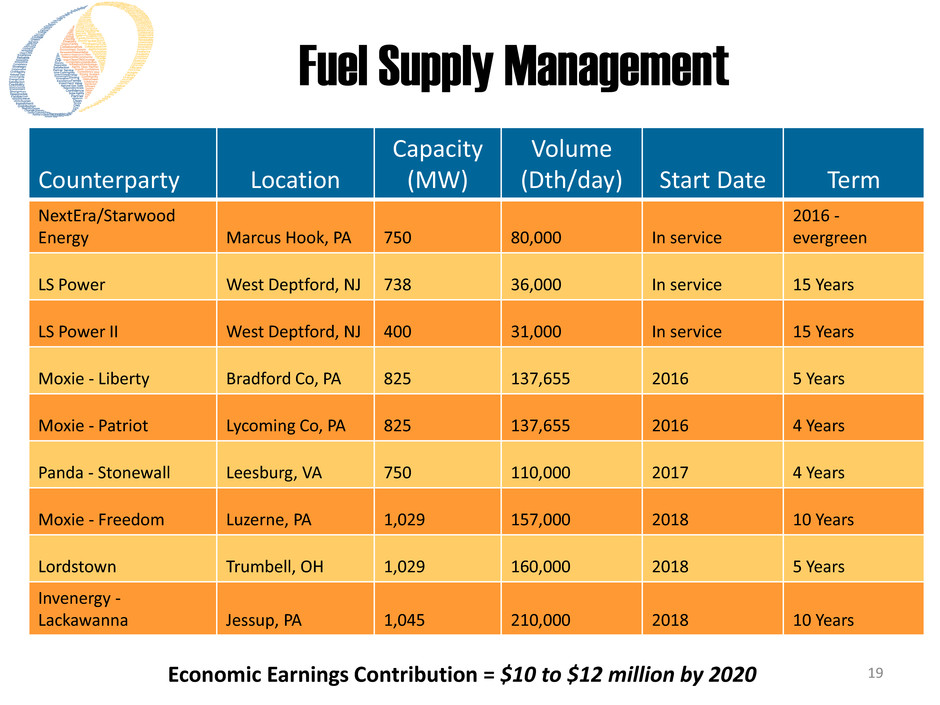
19 Counterparty Location Capacity (MW) Volume (Dth/day) Start Date Term NextEra/Starwood Energy Marcus Hook, PA 750 80,000 In service 2016 - evergreen LS Power West Deptford, NJ 738 36,000 In service 15 Years LS Power II West Deptford, NJ 400 31,000 In service 15 Years Moxie - Liberty Bradford Co, PA 825 137,655 2016 5 Years Moxie - Patriot Lycoming Co, PA 825 137,655 2016 4 Years Panda - Stonewall Leesburg, VA 750 110,000 2017 4 Years Moxie - Freedom Luzerne, PA 1,029 157,000 2018 10 Years Lordstown Trumbell, OH 1,029 160,000 2018 5 Years Invenergy - Lackawanna Jessup, PA 1,045 210,000 2018 10 Years Economic Earnings Contribution = $10 to $12 million by 2020 Fuel Supply Management
South Jersey Industries Performance / Projections
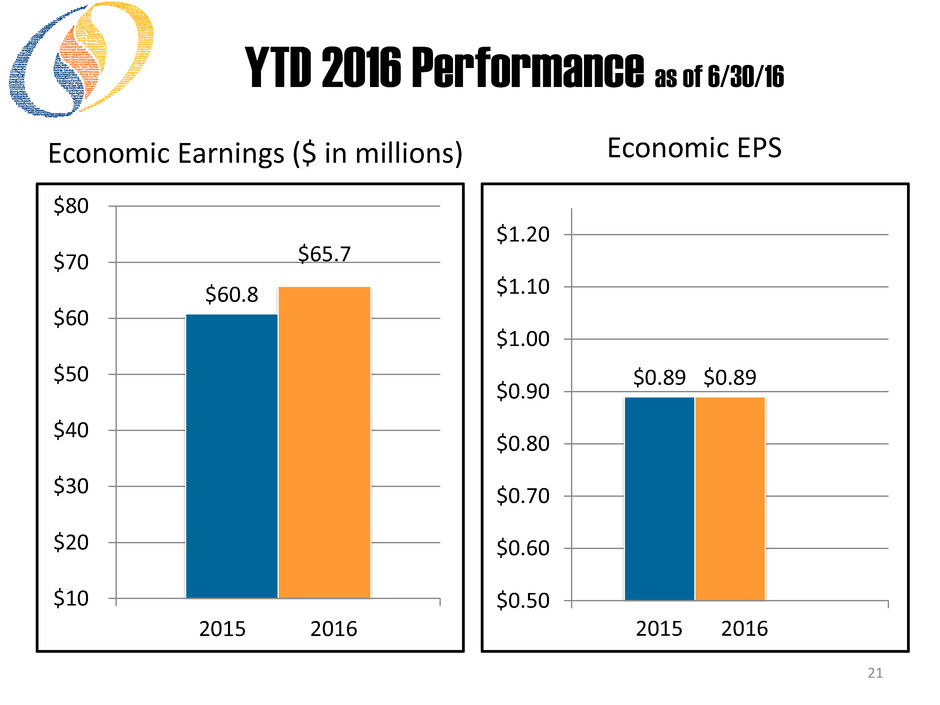
$60.8 $65.7 $10 $20 $30 $40 $50 $60 $70 $80 2015 2016 21 $0.89 $0.89 $0.50 $0.60 $0.70 $0.80 $0.90 $1.00 $1.10 $1.20 2015 20162015 2016 Economic Earnings ($ in millions) Economic EPS YTD 2016 Performance as of 6/30/16
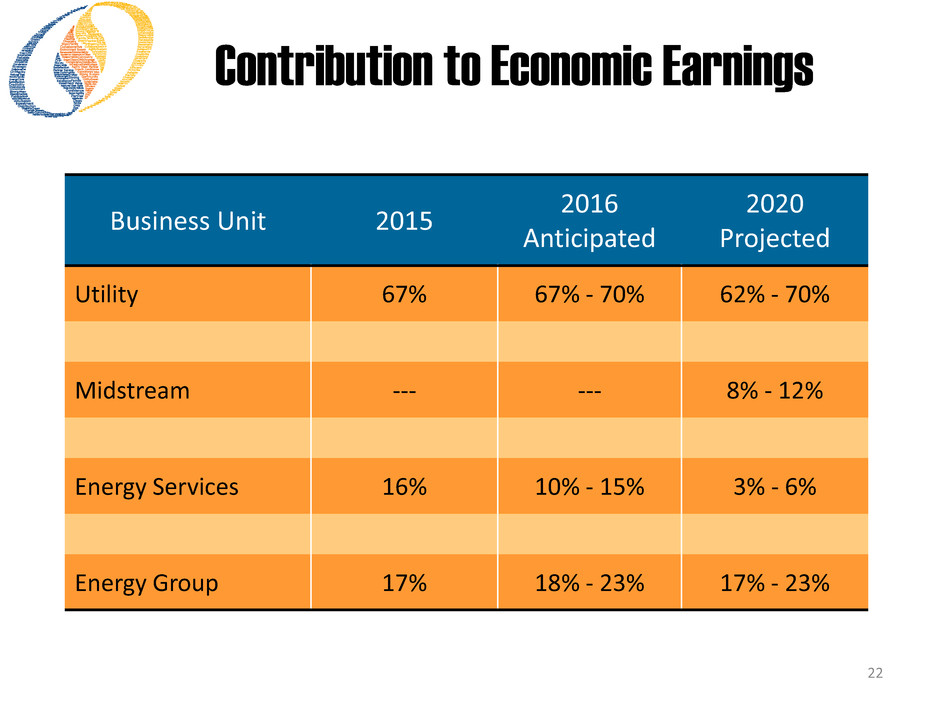
22 Business Unit 2015 2016 Anticipated 2020 Projected Utility 67% 67% - 70% 62% - 70% Midstream --- --- 8% - 12% Energy Services 16% 10% - 15% 3% - 6% Energy Group 17% 18% - 23% 17% - 23% Contribution to Economic Earnings
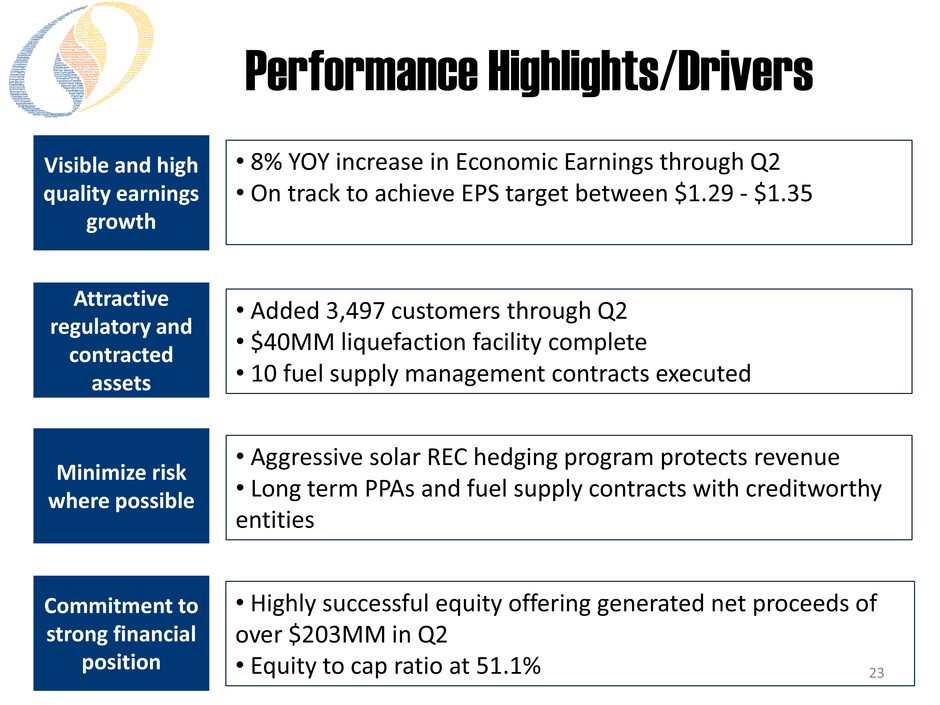
Performance Highlights/Drivers Visible and high quality earnings growth • 8% YOY increase in Economic Earnings through Q2 • On track to achieve EPS target between $1.29 - $1.35 • Highly successful equity offering generated net proceeds of over $203MM in Q2 • Equity to cap ratio at 51.1% 23 Attractive regulatory and contracted assets Minimize risk where possible Commitment to strong financial position • Added 3,497 customers through Q2 • $40MM liquefaction facility complete • 10 fuel supply management contracts executed • Aggressive solar REC hedging program protects revenue • Long term PPAs and fuel supply contracts with creditworthy entities


