South Jersey Industries Q3 2016 Business Update – 11/4/16
Forward Looking Statements Certain statements contained in this presentation may qualify as “forward-looking statements” within the meaning of Section 27A of the Securities Act of 1933 and Section 21E of the Securities Exchange Act of 1934. All statements other than statements of historical fact should be considered forward-looking statements made in good faith and are intended to qualify for the safe harbor from liability established by the Private Securities Litigation Reform Act of 1995. Words such as “anticipate”, “believe”, “expect”, “estimate”, “forecast”, “goal”, “intend”, “objective”, “plan”, “project”, “seek”, “strategy” and similar expressions are intended to identify forward-looking statements. Such forward-looking statements are subject to risks and uncertainties that could cause actual results to differ materially from those expressed or implied in the statements. These risks and uncertainties include, but are not limited to, the following: general economic conditions on an international, national, state and local level; weather conditions in our marketing areas; changes in commodity costs; changes in the availability of natural gas; “non-routine” or “extraordinary” disruptions in our distribution system; regulatory, legislative and court decisions; competition; the availability and cost of capital; costs and effects of legal proceedings and environmental liabilities; the failure of customers or suppliers to fulfill their contractual obligations; and changes in business strategies. These cautionary statements should not be construed by you to be exhaustive. While SJI believes these forward-looking statements to be reasonable, there can be no assurance that they will approximate actual experience. Further, SJI undertakes no obligation to update or revise any of its forward-looking statements, whether as a result of new information, future events or otherwise. 2
Strategic Focus 3 Grow Economic Earnings Improve Quality of Earnings Strengthen Balance Sheet Maintain Low to Moderate Risk Profile

$150 Million By 2020 4 $1.5 Billion of Regulated Capital Investment • B.L. England pipeline project • 1-2 Rate Cases • PennEast Pipeline • Residential natural gas conversions • Target large volume customers • 2016 ≈422K DTs /day on-line • Contributes 3%-5% of total earnings in 2016 • Greater SREC production in strong NJ SREC market • Accelerated Infrastructure Replacement Program (AIRP) • Storm Hardening and Reliability Program (SHARP) • Organic growth in retail commodity business • CNG stations and fleet conversions • 2020 ≈1MM+ DTs/day on-line • Contributes 6%-9% of total earnings in 2020 • Optimize remaining landfill assets • Maximize transport capacity Customer Growth Fuel Management Asset Optimization
5 Key Accomplishments AIRP Energy Production BL England Other • Improved operating performance from existing assets • Strong solar production and SREC price recovery • Successful hedging strategy • On track to achieve EPS target between $1.29 - $1.35 •McKee City liquefaction facility on-line for current heating season •Two additional fuel management contracts contributing in Q3 • Oral arguments on appeals of SJG’s BPU approval completed in October • Decision from appeals court expected by year end • December 1 roll-in of current program investments • 5-year, $302.5M program extension approved 10/31
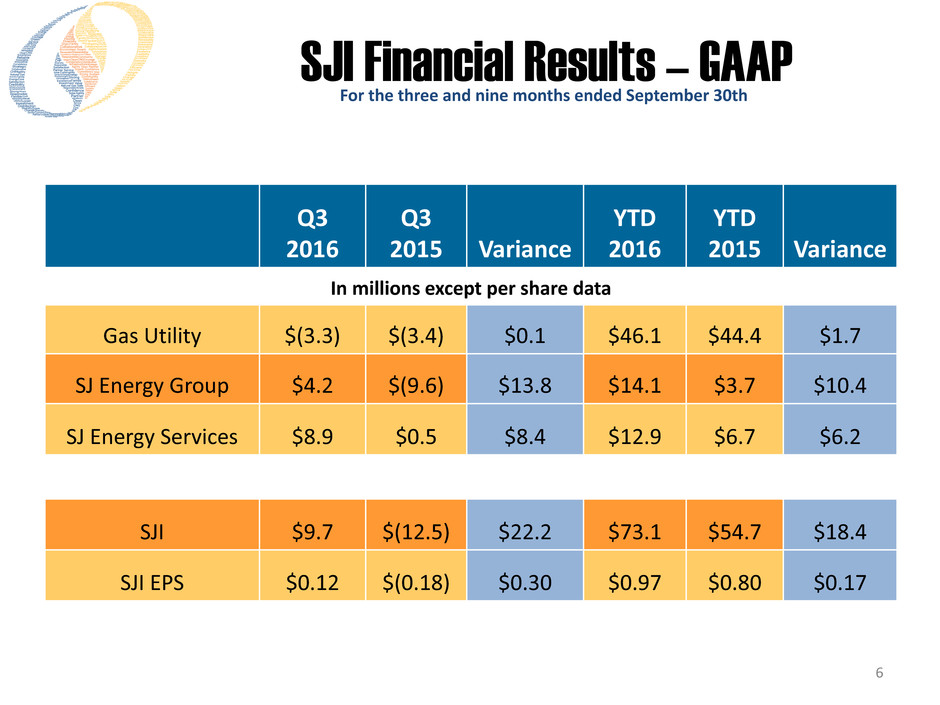
Q3 2016 Q3 2015 Variance YTD 2016 YTD 2015 Variance In millions except per share data Gas Utility $(3.3) $(3.4) $0.1 $46.1 $44.4 $1.7 SJ Energy Group $4.2 $(9.6) $13.8 $14.1 $3.7 $10.4 SJ Energy Services $8.9 $0.5 $8.4 $12.9 $6.7 $6.2 SJI $9.7 $(12.5) $22.2 $73.1 $54.7 $18.4 SJI EPS $0.12 $(0.18) $0.30 $0.97 $0.80 $0.17 6 SJI Financial Results – GAAP For the three and nine months ended September 30th
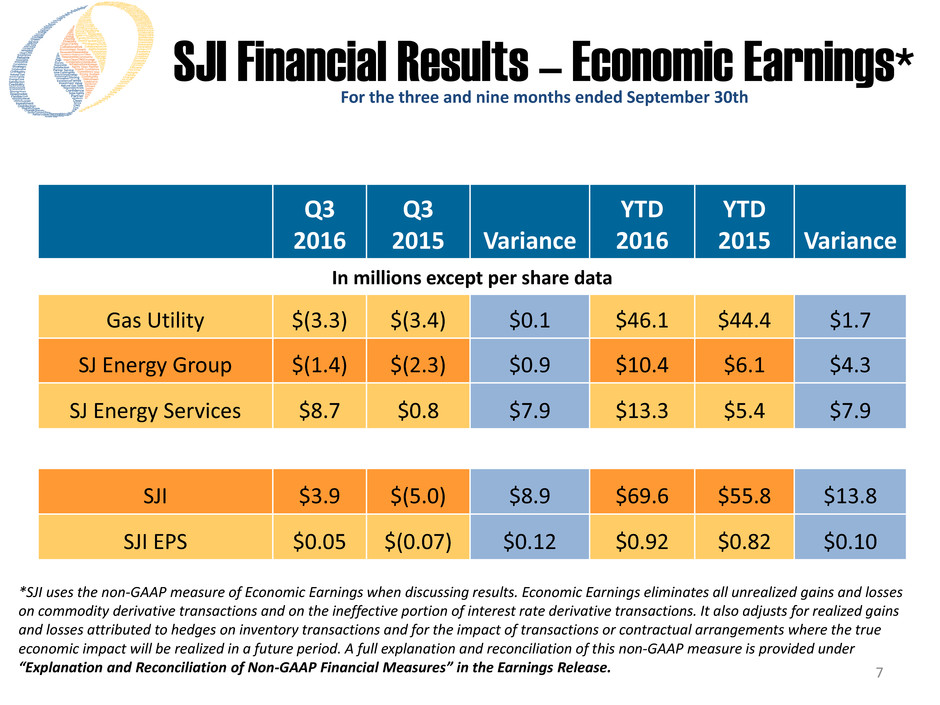
Q3 2016 Q3 2015 Variance YTD 2016 YTD 2015 Variance In millions except per share data Gas Utility $(3.3) $(3.4) $0.1 $46.1 $44.4 $1.7 SJ Energy Group $(1.4) $(2.3) $0.9 $10.4 $6.1 $4.3 SJ Energy Services $8.7 $0.8 $7.9 $13.3 $5.4 $7.9 SJI $3.9 $(5.0) $8.9 $69.6 $55.8 $13.8 SJI EPS $0.05 $(0.07) $0.12 $0.92 $0.82 $0.10 7 SJI Financial Results – Economic Earnings* For the three and nine months ended September 30th *SJI uses the non-GAAP measure of Economic Earnings when discussing results. Economic Earnings eliminates all unrealized gains and losses on commodity derivative transactions and on the ineffective portion of interest rate derivative transactions. It also adjusts for realized gains and losses attributed to hedges on inventory transactions and for the impact of transactions or contractual arrangements where the true economic impact will be realized in a future period. A full explanation and reconciliation of this non-GAAP measure is provided under “Explanation and Reconciliation of Non-GAAP Financial Measures” in the Earnings Release.
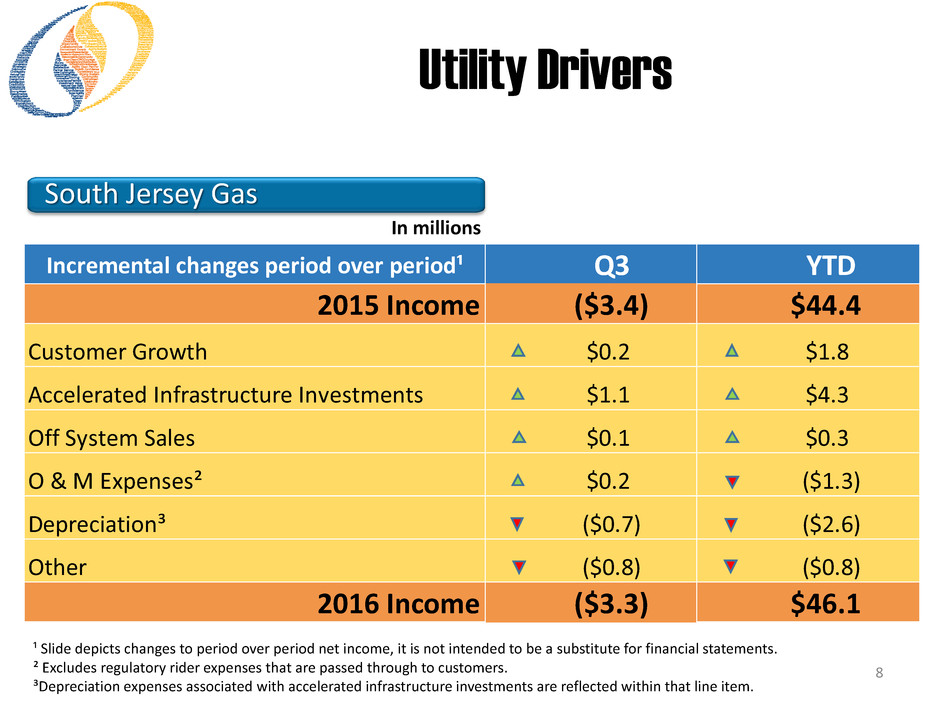
8 Utility Drivers South Jersey Gas Incremental changes period over period¹ Q3 YTD 2015 Income ($3.4) $44.4 Customer Growth $0.2 $1.8 Accelerated Infrastructure Investments $1.1 $4.3 Off System Sales $0.1 $0.3 O & M Expenses² $0.2 ($1.3) Depreciation³ ($0.7) ($2.6) Other ($0.8) ($0.8) 2016 Income ($3.3) $46.1 In millions ¹ Slide depicts changes to period over period net income, it is not intended to be a substitute for financial statements. ² Excludes regulatory rider expenses that are passed through to customers. ³Depreciation expenses associated with accelerated infrastructure investments are reflected within that line item.
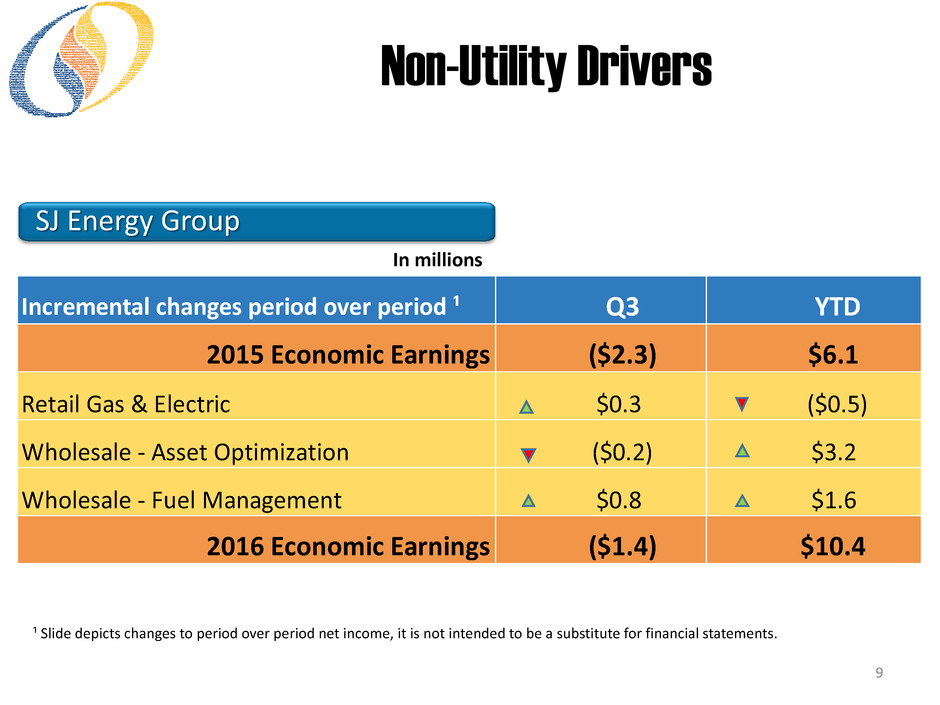
9 Non-Utility Drivers SJ Energy Group In millions Incremental changes period over period ¹ Q3 YTD 2015 Economic Earnings ($2.3) $6.1 Retail Gas & Electric $0.3 ($0.5) Wholesale - Asset Optimization ($0.2) $3.2 Wholesale - Fuel Management $0.8 $1.6 2016 Economic Earnings ($1.4) $10.4 ¹ Slide depicts changes to period over period net income, it is not intended to be a substitute for financial statements.

10 Non-Utility Drivers SJ Energy Services Incremental changes period over period¹ Q3 YTD 2015 Economic Earnings $0.8 $5.4 CHP $0.1 ($1.9) Renewable $3.4 $7.4 Other $0.0 $0.1 ITC $0.5 ($14.0) ACR related recovery/write down $3.9 $16.3 2016 Economic Earnings $8.7 $13.3 In millions ¹ Slide depicts changes to period over period net income, it is not intended to be a substitute for financial statements.
Appendix 11
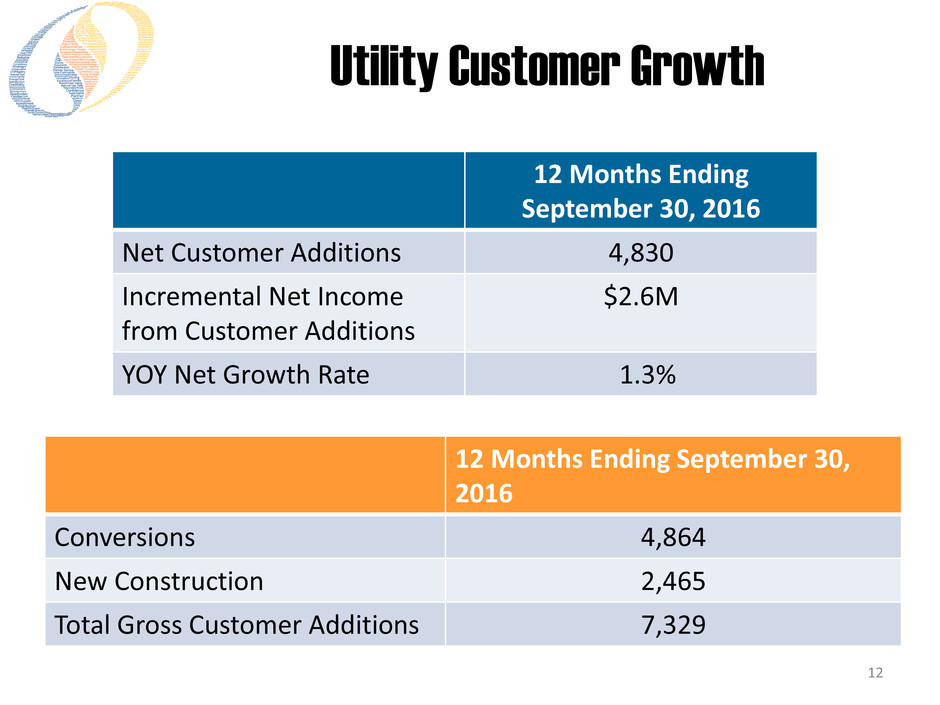
12 Utility Customer Growth 12 Months Ending September 30, 2016 Net Customer Additions 4,830 Incremental Net Income from Customer Additions $2.6M YOY Net Growth Rate 1.3% 12 Months Ending September 30, 2016 Conversions 4,864 New Construction 2,465 Total Gross Customer Additions 7,329
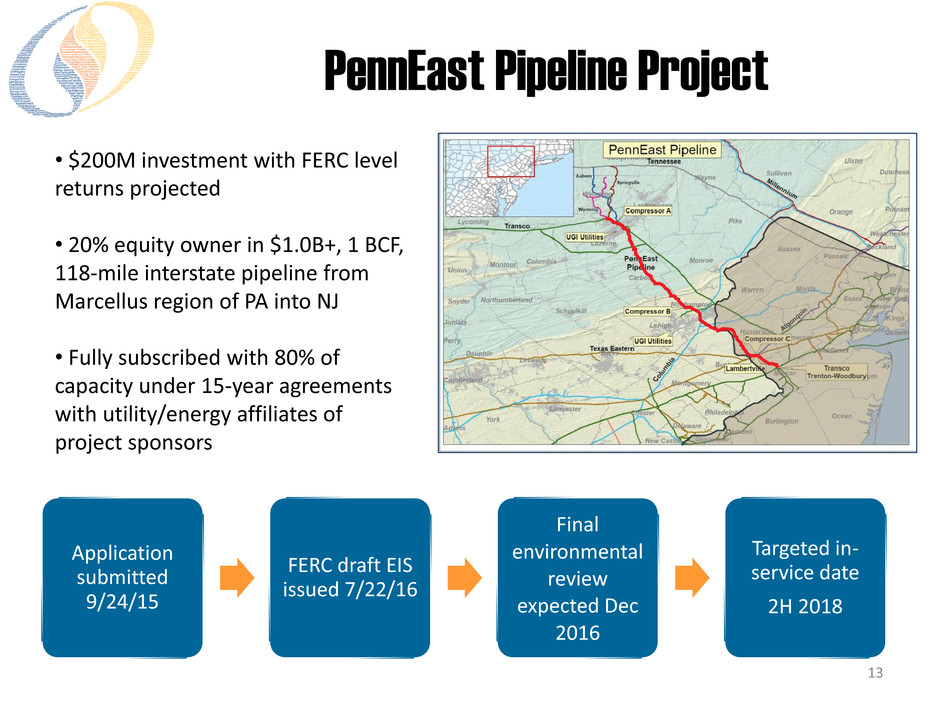
13 PennEast Pipeline Project • $200M investment with FERC level returns projected • 20% equity owner in $1.0B+, 1 BCF, 118-mile interstate pipeline from Marcellus region of PA into NJ • Fully subscribed with 80% of capacity under 15-year agreements with utility/energy affiliates of project sponsors Application submitted 9/24/15 FERC draft EIS issued 7/22/16 Final environmental review expected Dec 2016 Targeted in- service date 2H 2018
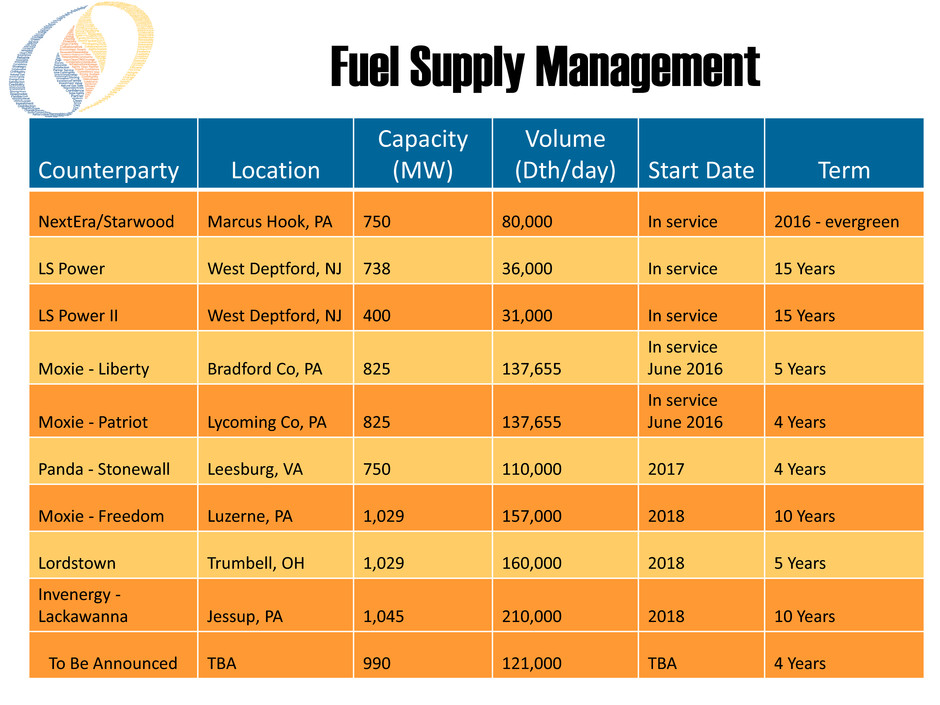
14 Counterparty Location Capacity (MW) Volume (Dth/day) Start Date Term NextEra/Starwood Marcus Hook, PA 750 80,000 In service 2016 - evergreen LS Power West Deptford, NJ 738 36,000 In service 15 Years LS Power II West Deptford, NJ 400 31,000 In service 15 Years Moxie - Liberty Bradford Co, PA 825 137,655 In service June 2016 5 Years Moxie - Patriot Lycoming Co, PA 825 137,655 In service June 2016 4 Years Panda - Stonewall Leesburg, VA 750 110,000 2017 4 Years Moxie - Freedom Luzerne, PA 1,029 157,000 2018 10 Years Lordstown Trumbell, OH 1,029 160,000 2018 5 Years Invenergy - Lackawanna Jessup, PA 1,045 210,000 2018 10 Years To Be Announced TBA 990 121,000 TBA 4 Years Fuel Supply Management
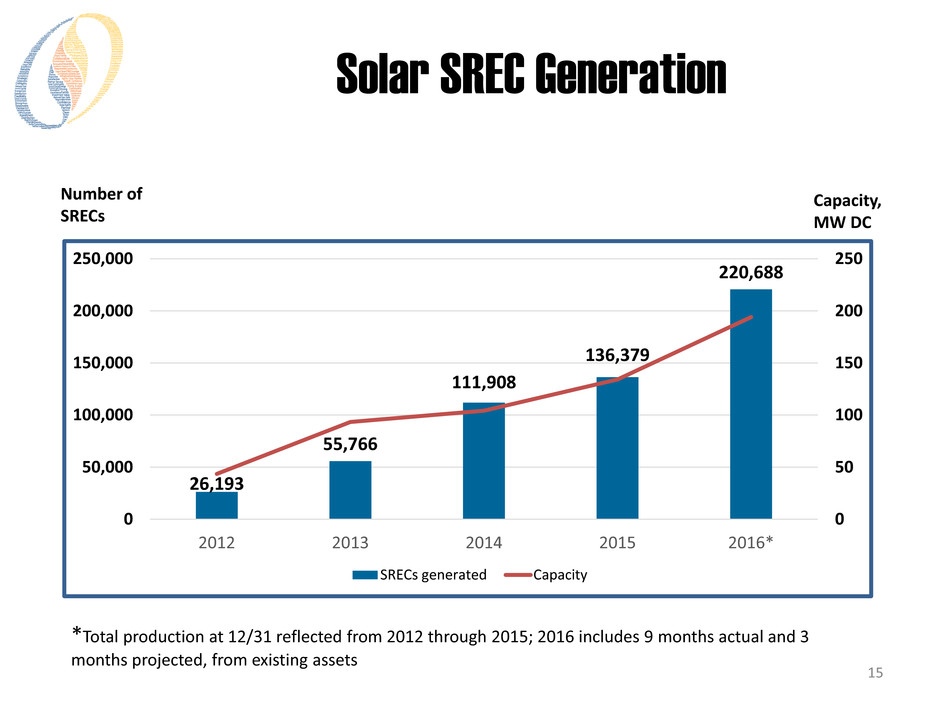
15 Solar SREC Generation *Total production at 12/31 reflected from 2012 through 2015; 2016 includes 9 months actual and 3 months projected, from existing assets 26,193 55,766 111,908 136,379 220,688 0 50 100 150 200 250 0 50,000 100,000 150,000 200,000 250,000 2012 2013 2014 2015 2016* SRECs generated Capacity Number of SRECs Capacity, MW DC


