Exhibit (c)(2)
CONFIDENTIAL

BOARD PRESENTATION REGARDING PROJECT SANTA FE
August 29, 2002

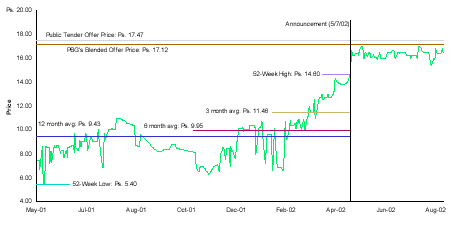
PEPSI-GEMEX HISTORICAL STOCK PRICE PERFORMANCE
MAY 7, 2001 – AUGUST 23, 2002


1
PEPSI-GEMEX VALUATION ANALYSIS
SUMMARY OF VALUATION METHODOLOGIES PERFORMED
| | | | | | | | | | | |
| 1. | | PUBLICLY TRADED
COMPARABLES | | | | 2A. PRECEDENT TRANSACTIONS – MULTIPLES PAID | | | | 2B. PRECEDENT TRANSACTIONS – PREMIUMS PAID |
|
|
|
|
| - -
| | Revenue, EBITDA and EBIT multiples for comparable companies in Latin America Multiples based on LTM figures and 2002 estimates | | - -
| | Multiples paid in similar beverage bottling transactions Multiples based on LTM revenues, EBITDA and EBIT | | - - -
| | Premiums paid in public deals in Mexico and for consumer companies in Latin America Based on premiums for the period four weeks prior to announcement |
| | | |
| 3. | | DISCOUNTED CASH
FLOW ANALYSIS |
|
|
|
|
| - | | Intrinsic value to PBG based on present value of projected cash flows on a stand-alone basis |

2
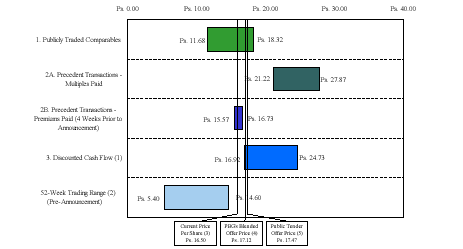
PEPSI-GEMEX VALUATION SUMMARY
THREE PRIMARY VALUATION METHODOLOGIES WERE USED IN ORDER TO ESTIMATE GEMEX’S VALUE ON A STAND-ALONE BASIS. PROJECTED FINANCIAL INFORMATION FOR GEMEX WERE PROVIDED BY PBG MANAGEMENT

| (1) | | Based on a 10-year DCF, a range of 12% — 14% WACC, and 0.5% — 1.5% perpetuity growth rate. |
|
|
|
|
| (2) | | Based on Gemex’s GDS converted to CPO-equivalent in pesos using the GDS price and exchange rate as of April 8, 2002. |
|
|
|
|
| (3) | | As of August 23, 2002. |
|
|
|
|
| (4) | | Based on public tender offer price of Ps. 17.47 (see footnote 5) adjusted for Ps. 172.7 million payment from PepsiCo to PBG. |
|
|
|
|
| (5) | | Based on gross enterprise value of Ps. 11.612 billion, less estimated net debt of Ps. 3.007 billion, plus Ps. 172.7 million payment from PepsiCo, divided by 502.5 million CPO share equivalents as of June 17, 2002. |

3
PEPSI-GEMEX TRANSACTION ANALYSIS
| | | | | | | | | | | | | | | | | | | | | | | | | | | | | | | | | | | | | | | | | | | | | | | | | |
| | | Operating | | Transaction Multiples - | | 1. Publicly Traded | 2A. Precedent Transactions - | 3. DCF Analysis - |
| | | Assumptions(a) | | Blended Offer | | Public Offer | | Comparables | | Multiples Paid | | Implied Multiples |
| | |
| |
| |
| |
| |
| |
|
| FV/LTM Revenues(b) | | Ps. 11,854 | | | 1.0x | | | | 1.0x | | | | 0.8x | | | | — | | | | 1.1x | | | | 1.1x | | | | — | | | | 1.4x | | | | 1.0x | | | | — | | | | 1.3x | |
|
|
|
|
| FV/LTM EBITDA(b) | | | 1,913 | | | | 6.1 | | | | 6.2 | | | | 4.5 | | | | — | | | | 6.5 | | | | 7.0 | | | | — | | | | 9.0 | | | | 6.0 | | | | — | | | | 8.1 | |
|
|
|
|
| FV/LTM EBIT(b) | | | 1,325 | | | | 8.8 | | | | 8.9 | | | | 6.5 | | | | — | | | | 8.5 | | | | 11.0 | | | | — | | | | 13.0 | | | | 8.7 | | | | — | | | | 11.6 | |
|
|
|
|
| FV/2002E Revenues | | Ps. 11,746 | | | 1.0x | | | | 1.0x | | | | 0.8x | | | | — | | | | 1.1x | | | | | | | | N/A | | | | | | | | 1.0x | | | | — | | | | 1.3x | |
|
|
|
|
| FV/2002E EBITDA(c) | | | 1,938 | | | | 6.0 | | | | 6.1 | | | | 4.5 | | | | — | | | | 6.5 | | | | | | | | N/A | | | | | | | | 5.9 | | | | — | | | | 8.0 | |
|
|
|
|
| FV/2002E EBIT(c) | | | 1,296 | | | | 9.0 | | | | 9.1 | | | | 6.5 | | | | — | | | | 8.5 | | | | | | | | N/A | | | | | | | | 8.9 | | | | — | | | | 11.9 | |
| | | Note: 2002E figures based on Peso-denominated reported and estimated results. |
|
|
|
|
| (a) | | Based on PBG management estimates of Gemex on a stand-alone basis. |
|
|
|
|
| (b) | | LTM to June 30, 2002. Inflation adjusted. |
|
|
|
|
| (c) | | Includes add-back of transaction-related costs and expenses and all restructuring charges. |
2B. PRECEDENT TRANSACTIONS – PREMIUMS PAID ANALYSIS
| | | | | | | | | | | | | | | | | |
| | | Based on Ps. 17.12 | | Based on Ps. 17.47 | | Mean Premium | | Mean Premium |
| | | PBG's Blended | | Public Tender | | Paid for Deals | | Paid for Consumer Deals |
| | | Offer Price | | Offer Price | | in Mexico | | in Latin America |
| | |
| |
| |
| |
|
| 1 Week Prior | | | 21.7 | % | | | 24.2 | % | | | N/A | | | | N/A | |
|
|
|
|
| 4 Weeks Prior | | | 29.3 | | | | 31.9 | | | | 26.3 | % | | | 17.6 | % |

4


