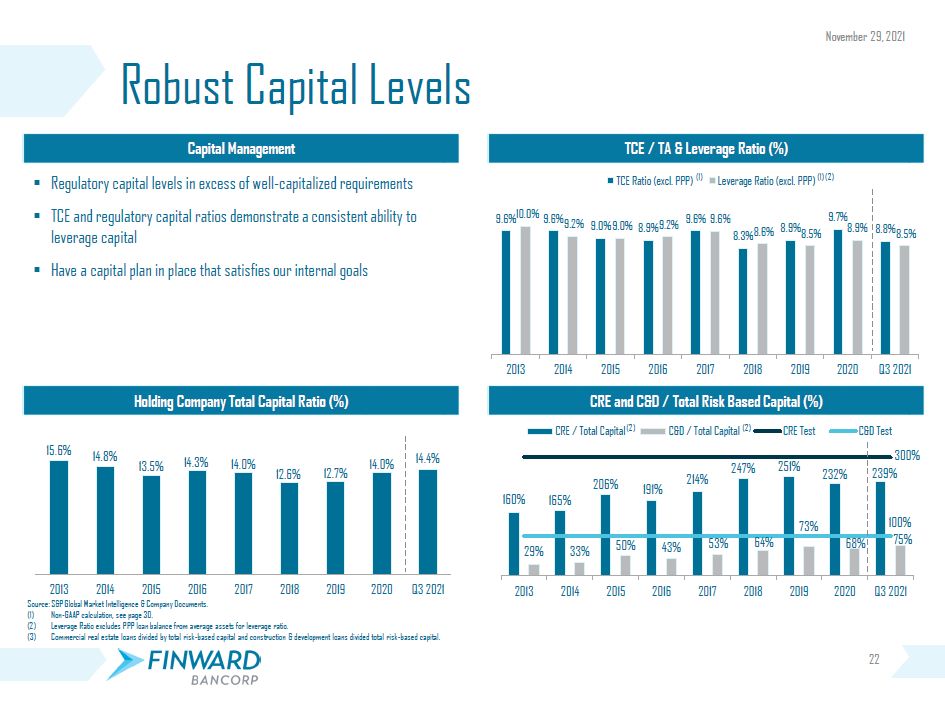
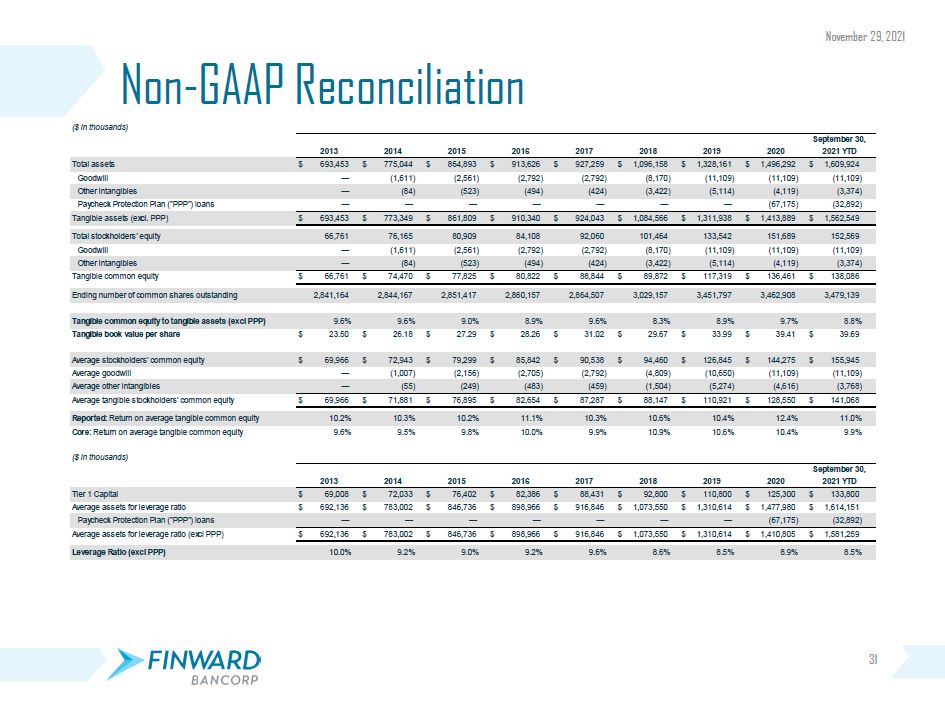
2013 2014 2015 2016 2017 2018 2019 2020 2021 YTD Total assets $ 693,453 $ 775,044 $ 864,893 $ 913,626 $ 927,259 $ 1,096,158 $ 1,328,161 $ 1,496,292 $ 1,609,924 Goodwill — (1,611) (2,561) (2,792) (2,792) (8,170) (11,109) (11,109) (11,109) Other intangibles — (84) (523) (494) (424) (3,422) (5,114) (4,119) (3,374) Paycheck Protection Plan ("PPP") loans — — — — — — — (67,175) (32,892) Tangible assets (excl. PPP) $ 693,453 $ 773,349 $ 861,809 $ 910,340 $ 924,043 $ 1,084,566 $ 1,311,938 $ 1,413,889 $ 1,562,549 Total stockholders' equity 66,761 76,165 80,909 84,108 92,060 101,464 133,542 151,689 152,569 Goodwill — (1,611) (2,561) (2,792) (2,792) (8,170) (11,109) (11,109) (11,109) Other intangibles — (84) (523) (494) (424) (3,422) (5,114) (4,119) (3,374) Tangible common equity $ 66,761 $ 74,470 $ 77,825 $ 80,822 $ 88,844 $ 89,872 $ 117,319 $ 136,461 $ 138,086 Ending number of common shares outstanding 2,841,164 2,844,167 2,851,417 2,860,157 2,864,507 3,029,157 3,451,797 3,462,908 3,479,139 Tangible common equity to tangible assets (excl PPP) 9.6% 9.6% 9.0% 8.9% 9.6% 8.3% 8.9% 9.7% 8.8% Tangible book value per share $ 23.50 $ 26.18 $ 27.29 $ 28.26 $ 31.02 $ 29.67 $ 33.99 $ 39.41 $ 39.69 Average stockholders' common equity $ 69,966 $ 72,943 $ 79,299 $ 85,842 $ 90,538 $ 94,460 $ 126,845 $ 144,275 $ 155,945 Average goodwill — (1,007) (2,156) (2,705) (2,792) (4,809) (10,650) (11,109) (11,109) Average other intangibles — (55) (249) (483) (459) (1,504) (5,274) (4,616) (3,768) Average tangible stockholders' common equity $ 69,966 $ 71,881 $ 76,895 $ 82,654 $ 87,287 $ 88,147 $ 110,921 $ 128,550 $ 141,068 Reported: Return on average tangible common equity 10.2% 10.3% 10.2% 11.1% 10.3% 10.6% 10.4% 12.4% 11.0% Core: Return on average tangible common equity 9.6% 9.5% 9.8% 10.0% 9.9% 10.9% 10.6% 10.4% 9.9% ($ in thousands) 2013 2014 2015 2016 2017 2018 2019 2020 September 30,2021 YTD Tier 1 Capital $ 69,008 $ 72,033 $ 76,402 $ 82,386 $ 88,431 $ 92,800 $ 110,800 $ 125,300 $ 133,800 Average assets for leverage ratio $ 692,136 $ 783,002 $ 846,736 $ 898,966 $ 916,846 $ 1,073,550 $ 1,310,614 $ 1,477,980 $ 1,614,151 Paycheck Protection Plan ("PPP") loans — — — — — — — (67,175) (32,892) Average assets for leverage ratio (excl PPP) $ 692,136 $ 783,002 $ 846,736 $ 898,966 $ 916,846 $ 1,073,550 $ 1,310,614 $ 1,410,805 $ 1,581,259 Leverage Ratio (excl PPP) 10.0% 9.2% 9.0% 9.2% 9.6% 8.6% 8.5% 8.9% 8.5% Non-GAAP Reconciliation($ in thousands) September 30, November 29, 2021 31