| | 
Independent Technical Report
2016 Resources and Reserves Update
Bisha Mine, Eritrea | |
| | Prepared for
Nevsun Resources Ltd. |
| |  |
| | Prepared by

SRK Consulting (Canada) Inc.
Effective Date: 31 December 2016
Issue Date 09 August 2017
2CN010.024
|
| | Independent Technical Report
2016 Resources and Reserves Update
Bisha Mine, Eritrea |
| | Effective Date: 31 December 2016
Release Date: 09 August 2017 |
| | Prepared for | Prepared by |
| | Nevsun Resources Ltd.
760–669 Howe Street
Vancouver, BC V6C 0B4
Canada | SRK Consulting (Canada) Inc.
2200–1066 West Hastings Street
Vancouver, BC V6E 3X2
Canada |
| | Tel: +1 604 623 4700
Web: www.nevsun.com | Tel: +1 604 681 4196
Web: www.srk.com |
| | Project No: 2CN010.024
File Name: Bisha_2016R&R-Update_TechRep_2CN010-024_20170809_aan_cae |
| | Authored By
| | |
| | Philip Jankowski, MAusIMM (CP) | Dr. Anoush Ebrahimi, P.Eng | Dr. Adrian Dance, FAusIMM |
| | Bisha Mining Share Company | SRK Consulting (Canada) Inc. | SRK Consulting (Canada) Inc. |
| | | | |
| | Christopher Elliott, FAusIMM | Neil Winkelmann, FAusIMM | Cameron Scott, P.Eng |
| | SRK Consulting (Canada) Inc. | SRK Consulting (Canada) Inc. | SRK Consulting (Canada) Inc. |
| | | | |
| | Tom Whelan, CPA | | |
| | Nevsun Resources Ltd. | | |
| | | | |
| SRK Consulting |
| NI 43-101 Technical Report Bisha Mine 2016, Eritrea | Page ii |
Important Notice
This report was prepared in accordance with NI 43-101 for Nevsun Resources Ltd. (Nevsun or the Company) by SRK Consulting (Canada) Inc. The quality of information, conclusions, and estimates contained herein is consistent with the level of effort involved in SRK’s services, based on: i) information available at the time of preparation, ii) data supplied by outside sources, and iii) the assumptions, conditions, and qualifications set forth in this report. This report is intended for use by Nevsun subject to the terms and conditions of its contract with SRK and relevant securities legislation. The contract permits Nevsun to file this report as a Technical Report with Canadian securities regulatory authorities pursuant to National Instrument 43-101, Standards of Disclosure for Mineral Projects. The responsibility for this disclosure remains with Nevsun. The user of this document should ensure that this is the most recent Technical Report for the property as it is not valid if a new Technical Report has been issued.
This technical report contains certain non-International Financial Reporting Standards measures. Such measures have non-standardised meaning under International Financial Reporting Standards and may not be comparable to similar measures used by other issuers.
All amounts are expressed in U.S. dollars ($), unless otherwise indicated.
© 2017 SRK Consulting (Canada) Inc.
This document, as a collective work of content and the coordination, arrangement and any enhancement of said content, is protected by copyright vested in SRK Consulting (Canada) Inc.
Outside the purposes legislated under provincial securities laws or as otherwise stipulated in SRK’s client contract, this document shall not be reproduced in full or in any edited, abridged or otherwise amended from unless expressly agreed in writing by SRK.
| PJ/ABE/ADD/CCS/AAN/NMW/CAE | Bisha_2016R&R-Update_TechRep_2CN010-024_20170808_aan_cae | August 2017 |
| SRK Consulting |
| NI 43-101 Technical Report Bisha Mine 2016, Eritrea | Page iii |
Executive Summary
Introduction
This technical report was prepared for Nevsun Resources Ltd. to summarise the results of the resource and reserve update of the Bisha Mine (Bisha, Mine or Project), located in Eritrea. Nevsun holds a 60% interest in the Project, through a 60% interest in Bisha Mining Share Company (BMSC). The Eritrean National Mining Corporation (ENAMCO) holds the remaining 40% interest. BMSC is the operator for the Bisha and Harena mining licences, the mining agreement area, Tabakin Exploration License (Tabakin EL) and Mogoraib River Exploration License (Mogoraib EL) exploration licences.
The contract with SRK Consulting permits Nevsun to file this report as a technical report with the Canadian securities regulatory authorities pursuant to NI 43-101, Standards of Disclosure for Mineral Projects. Except for the purposes legislated under provincial securities law, any other uses of this report by any third party is at that party’s sole risk. The responsibility for this disclosure remains with Nevsun. The user of this document should ensure that this is the most recent technical report for the property, as it is not valid if a new technical report has been issued. Summary of responsibilities by author is shown in Table ES1.
Table ES1: Areas of responsibilities
| Company | Area of Responsibility |
| BMSC | Mineral Resource Estimation, Quality Assurance/Quality Control (QA/QC), Geology |
| SRK | Mineral Reserve Estimate, Geotechnical Engineering, Open Pit Mine Designs, Production Schedule, Mining Costs, Recovery Methods, Processing Capital and Operating Costs, Economics, Site Infrastructure, Environmental and Permitting, Closure Costs |
| Nevsun | Marketing Studies and Contracts |
Property Description
The project is located on a flat to rolling, desert-like plain in the Gash-Barka Region of Eritrea, 237 km by road from the capital, Asmara by paved and all-weather unpaved roads. The principal port for concentrate export is Massawa, a further 113 km from Asmara.
The project area has a hot desert climate with an annual rainfall of 260 mm mainly falling from June to September. The main centre for mining and exploration support is Asmara.
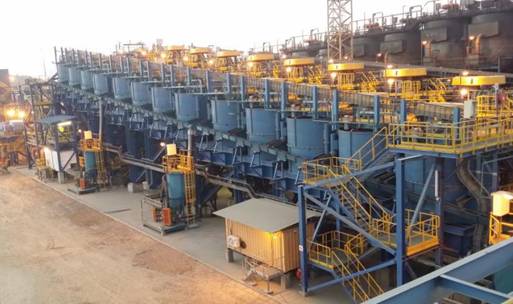
Current onsite operation infrastructure comprises an open pit, process plant, tailings and waste-rock storage facilities, offices and warehouses, medical clinic, maintenance and laboratory facilities, fuel and reagent storage areas, diesel power plant, water supply borefields, and an airstrip. Container port and ship-loading facilities for concentrate are located at Massawa.
The property comprises two mining licences, one mining agreement area and two exploration licences. The licence title and length of terms for each of these are listed below:
| PJ/ABE/ADD/CCS/AAN/NMW/CAE | Bisha_2016R&R-Update_TechRep_2CN010-024_20170808_aan_cae | August 2017 |
| SRK Consulting |
| NI 43-101 Technical Report Bisha Mine 2016, Eritrea | Page iv |
- Bisha Mining Licence: 26 March 2008 to 11 December 2027
- Harena Mining Licence: 6 July 2012 to 5 July 2022
- Bisha Mining Agreement Area: 5 July 2012 to 11 December 2027
- New Mogoraib Exploration Licence: 25 July 2016 to 24 July 2021
- Tabakin Exploration Licence: 25 July 2016 to 24 July 2026
Under the terms of the mining agreement, BMSC has the exclusive right of land use in the Mining Licence Area that is granted within the mining agreement area. This right is subject to the acquisition and settlement of any third-party land-use rights by payment of compensation and/or relocation at the expense of BMSC.
Geological Setting and Mineralisation
The project is located within the 0.85 Ga to 0.55 Ga Arabian-Nubian Shield (ANS) (Barrie et al., 2007). The ANS underlies an area of 1.4 million km2 in the Middle East and northern Africa, exposed on either side of the Red Sea and comprises a collage of volcanic arcs, granitoid intrusions, volcano-sedimentary basins, and shear zones (Johnson and Sloan, 2013). Over 50 Cu-Zn-Pb-Au volcanic-hosted massive sulfide deposits occur in the ANS, which in Eritrea includes the Bisha Main, Harena, Northwest, Hambok and Asheli deposits (all BMSC).
Mineral Resource Estimates
Mineral Resources are classified and reported in accordance with the CIM Definition Standards for Mineral Resources and Mineral Reserves (CIM, 2014). Mineral Resources are reported for the Bisha Main, Harena, Hambok, Northwest and Asheli deposits. At Bisha Main, 11,770 m of drilling in 21 holes was completed in 2016 testing the deposit below the proposed ultimate pit. This work has determined the down dip extent of the deposit. In 2016, 6,080 m of new drilling was completed at Harena continuing to extend the deposit to depth where it remains open. Asheli was discovered in June 2015 by Bisha as part of the Regional Exploration Program. In 2016, 12,918 m of drilling were completed in 28 holes resulting in the definition of a new inferred resource. Mineral Resources for Hambok and Northwest are unchanged since 2014.
Mineral Resource estimates for Bisha Main and Harena reported are inclusive of Mineral Reserves. Mineral Resources for the Bisha Project are summarised in Tables ES2 to ES7.
Table ES2: Consolidated Mineral Resource statement for Bisha Main, Harena, Asheli, Northwest and Hambok deposits, Eritrea, as of 31 December 2016
| Category | Quantity | Grade |
| (000’s t) | (% Zn) | (% Cu) | (g/t Au) | (g/t Ag) |
| Measured | 1,300 | 6.37 | 1.09 | 0.9 | 42 |
| Indicated | 33,670 | 4.10 | 1.01 | 0.5 | 32 |
| Total M+I | 34,970 | 4.18 | 1.02 | 0.6 | 33 |
| Inferred (including stockpiles) | 33,790 | 4.74 | 1.01 | 0.8 | 25 |
| PJ/ABE/ADD/CCS/AAN/NMW/CAE | Bisha_2016R&R-Update_TechRep_2CN010-024_20170808_aan_cae | August 2017 |
| SRK Consulting |
| NI 43-101 Technical Report Bisha Mine 2016, Eritrea | Page v |
Table ES3: Mineral Resource statement for Bisha Main deposit, Eritrea, as of 31 December 2016
| Category | Quantity | Grade |
| (000’s t) | (% Zn) | (% Cu) | (g/t Au) | (g/t Ag) |
| Open Pit |
| Measured | 1,300 | 6.37 | 1.09 | 0.9 | 42 |
| Indicated | 19,310 | 5.70 | 0.97 | 0.7 | 45 |
| Inferred | 790 | | 1.23 | 0.1 | 1 |
| Underground |
| Inferred | 1,460 | 7.44 | 0.73 | 0.9 | |
| Stockpiles |
| Measured | 2,850 | 3.63 | 1.34 | 1.3 | |
| Inferred | 510 | | 0.85 | 0.6 | |
| Notes to be read in conjunction with the Mineral Resource table: |
| (1) | Open Pit Mineral Resources are defined within an optimal Lerchs-Grossman (LG) pit shell, generated using commodity prices for zinc, copper, gold and silver of $1.20/lb Zn, $3.00/lb Cu, $1,265/oz Au and $21/oz Ag respectively using blocks of all Resource categories. The mining cost and total ore based cost (process, G&A and stockpile re-handle) applied were approximately 10% below the long-term view on costs with appropriate ore haulage costs for each satellite deposit. Overall pit slopes varied from 29° to 35.5° NSR cut-offs used were $40.00/t for Oxide and $41.00/t for Primary. |
| (2) | Net Smelter Return values were calculated for each block using all resource categories, commodity prices, recoveries, appropriate smelter terms and downstream costs. Metallurgical recoveries, supported by metallurgical testwork, were applied as follows: Oxide - recoveries of 75% and 22% were applied for gold and silver, respectively; Primary - recoveries to copper concentrate of 85%, 36% and 29% were applied for copper, gold and silver, respectively, and a zinc recovery to zinc concentrate of 85% was applied. |
| (3) | Open Pit Mineral Resources are reported within the pit shell generated using the specified commodity prices, using NSR block grade cut-offs derived as above. Tonnage is rounded to the nearest 10,000 tonnes and grades are rounded to two decimal places for copper and zinc, one decimal place for gold, and zero decimal places for silver. Contained metal for copper and zinc are rounded to the nearest million pounds. Contained metal for silver is rounded to the nearest 10,000 ounces and gold is rounded to the nearest 1,000 ounces. |
| (4) | Rounding may result in apparent summation differences between tonnes, grade and contained metal content. |
| (5) | Tonnage and grade measurements are in metric units. Contained gold and silver ounces are reported as troy ounces, contained copper and zinc pounds as imperial pounds. |
| (6) | Underground Inferred Resources were derived by selecting contiguous blocks outside the optimised resource pit shell, with an NSR cut-off of $100/t, which represents the processing cost plus approximately $60/t mining cost. |
| (7) | Mineral Resources that are not Mineral Reserves do not have demonstrated economic viability. |
| PJ/ABE/ADD/CCS/AAN/NMW/CAE | Bisha_2016R&R-Update_TechRep_2CN010-024_20170808_aan_cae | August 2017 |
| SRK Consulting |
| NI 43-101 Technical Report Bisha Mine 2016, Eritrea | Page vi |
Table ES4: Mineral Resource statement for Harena deposit, Eritrea, as of 31 December 2016
| Category | Quantity | Grade |
| (000’s t) | (% Zn) | (% Cu) | (g/t Au) | (g/t Ag) |
| Open Pit |
| Indicated | 3,950 | 3.16 | 0.87 | 0.6 | 28 |
| Inferred | 2,040 | 2.06 | 0.82 | 0.7 | 28 |
| Underground |
| Inferred | 23,020 | 4.96 | 0.93 | 0.8 | 30 |
| Notes to be read in conjunction with the Mineral Resource table: |
| (1) | Open Pit Mineral Resources are defined within an optimal Lerchs-Grossman (LG) pit shell, generated using commodity prices for zinc, copper, gold and silver of $1.20/lb Zn, $3.00/lb Cu, $1,265/oz Au and $21/oz Ag respectively using blocks of all Resource categories. The mining cost and total ore based cost (process, G&A and stockpile rehandle) applied were approximately 10% below the long term view on costs with appropriate ore haulage costs for each satellite deposit. Overall pit slopes varied from 29° to 35.5° NSR cut-offs used were $40.00/t for Oxide and $41.00/t for Primary. |
| (2) | Net Smelter Return values were calculated for each block using all resource categories, commodity prices, recoveries, appropriate smelter terms and downstream costs. Metallurgical recoveries, supported by metallurgical testwork, were applied as follows: Oxide - recoveries of 75% and 22% were applied for gold and silver, respectively; Primary - recoveries to copper concentrate of 85%, 36% and 29% were applied for copper, gold and silver, respectively, and a zinc recovery to zinc concentrate of 85% was applied. |
| (3) | Open Pit Mineral Resources are reported within the pit shell generated using the specified commodity prices, using NSR block grade cut-off derived as above. Tonnage is rounded to the nearest 10,000 tonnes and grades are rounded to two decimal places for copper and zinc, one decimal place for gold, and zero decimal places for silver. Contained metal for copper and zinc are rounded to the nearest million pounds. Contained metal for silver is rounded to the nearest 10,000 ounces and gold is rounded to the nearest 1,000 ounces. |
| (4) | Rounding may result in apparent summation differences between tonnes, grade and contained metal content. |
| (5) | Tonnage and grade measurements are in metric units. Contained gold and silver ounces are reported as troy ounces, contained copper and zinc pounds as imperial pounds. |
| (6) | Underground Inferred Resources were derived by selecting contiguous blocks outside the optimised resource pit shell, with an NSR cut-off of $100/t, which represents the processing cost plus approximately $60/t mining cost. |
| (7) | Stockpile tonnages and grades are based on surveyed volume and grade control estimated grades; Inferred stockpiles are those that do not have metallurgical testwork demonstrating they are treatable. |
| (8) | Mineral Resources that are not Mineral Reserves do not have demonstrated economic viability. |
Table ES5: Inferred Mineral Resource statement for Asheli deposit, Eritrea as of 31 December 2016
| Zone | Quantity | Grade | NSR ($/t) |
| (000’s t) | (% Zn) | (% Cu) | (g/t Au) | (g/t Ag) | (g/t As) | (% Pb) |
| Low Grade | 1,677 | 5.2 | 1.9 | 0.36 | 28 | 772 | 0.05 | $154 |
| High Grade | 723 | 16.6 | 1.9 | 0.39 | 33 | 734 | 0.14 | $301 |
| Total | 2,400 | 8.6 | 1.9 | 0.37 | 30 | 760 | 0.08 | $199 |
| PJ/ABE/ADD/CCS/AAN/NMW/CAE | Bisha_2016R&R-Update_TechRep_2CN010-024_20170808_aan_cae | August 2017 |
| SRK Consulting |
| NI 43-101 Technical Report Bisha Mine 2016, Eritrea | Page vii |
Table ES6: Mineral Resource statement for Northwest deposit, Eritrea, as of 31 December 2016
| Category | Quantity | Grade |
| (000’s t) | (% Zn) | (% Cu) | (g/t Au) | (g/t Ag) |
| Indicated | | | | | |
| Supergene | 1,020 | | 1.47 | 0.2 | 10 |
| Primary | 2,530 | 1.08 | 1.04 | 0.3 | 13 |
| Inferred | | | | | |
| Oxide | 500 | | | 3.7 | 18 |
| Supergene | 100 | | 0.8 | 3.7 | 19 |
| Primary | 100 | 0.9 | 0.9 | 2.9 | 15 |
| Notes to be read in conjunction with the Resource tables for Northwest above: |
| (1) | No change has occurred Northwest since 2014 which used commodity prices for zinc, copper, gold and silver of $1.05/lb Zn, $3.35/lb Cu, $1,350/oz Au and $23/oz Ag, respectively. Open Pit Mineral Resources are defined within an optimal Lerchs-Grossman (LG) Pit Shell. The mining cost and total ore-based cost (process, G&A and stockpile re-handle) applied were approximately 10% below the long-term view on costs with appropriate ore haulage costs for each satellite deposit. Overall pit slopes varied from 39° to 45°. NSR cut-offs used were: $40.70/t for Oxide, $39.70/t for Supergene and Primary. |
| (2) | Net Smelter Return values were calculated for each block using all resource categories, commodity prices, recoveries, appropriate smelter terms and downstream costs. Metallurgical recoveries, supported by metallurgical testwork, were applied as follows: Oxide - recoveries of 88% and 22% were applied to gold and silver, respectively; Supergene - recoveries of 87%, 46% and 50% were applied for copper, gold and silver, respectively, and zinc has not been assigned a recovery as the values are isolated on the fringes of the deposit; Primary - recoveries to copper concentrate of 87%, 36% and 29% were applied for copper, gold and silver, respectively and recoveries to zinc concentrate of 81%, 36% and 29% were applied for zinc, gold and silver, respectively. |
| (3) | Open Pit Mineral Resources are reported within the pit shell generated using the specified commodity prices, using NSR block grade cut-off derived as above. Tonnage is rounded to the nearest 10,000 tonnes and grades are rounded to two decimal places for copper and zinc, one decimal place for gold and zero decimal places for silver. Tonnages and grades for the Inferred category are further rounded reflecting the uncertainty that attaches to this category. Contained metal for copper and zinc are rounded to the nearest 10,000 pounds. |
| (4) | Rounding as required by reporting guidelines may result in apparent summation differences between tonnes, grade and contained metal content. |
| (5) | Tonnage and grade measurements are in metric units. Contained gold and silver ounces are reported as troy ounces, contained copper and zinc pounds as imperial pounds. |
| PJ/ABE/ADD/CCS/AAN/NMW/CAE | Bisha_2016R&R-Update_TechRep_2CN010-024_20170808_aan_cae | August 2017 |
| SRK Consulting |
| NI 43-101 Technical Report Bisha Mine 2016, Eritrea | Page viii |
Table ES7: Mineral Resource statement for Hambok deposit, Eritrea, as of 31 December 2016
| Category | Quantity | Grade |
| (000’s t) | (% Zn) | (% Cu) | (g/t Au) | (g/t Ag) |
| Indicated | | | | | |
| Primary | 6,860 | 1.86 | 1.14 | 0.2 | 10 |
| Inferred | | | | | |
| Oxide | 20 | | | 1.5 | 17 |
| Notes to be read in conjunction with the Mineral Resource table for Hambok: |
| (1) | No change has occurred to Hambok since 2014, which used commodity prices for zinc, copper, gold and silver of $1.05/lb Zn, $3.35/lb Cu, $1,350/oz Au and $23/oz Ag, respectively. Mineral Resources are defined within an optimal Lerchs-Grossman (LG) Pit Shell. The mining cost and total ore-based cost (process, G&A and stockpile rehandle) applied were approximately 10% below the long-term view on costs with appropriate ore haulage costs for each satellite deposit. Overall pit slope was 40° (preliminary assessment). NSR cut-offs used were: $44.45/t for Oxide and $43.45/t for Primary. |
| (2) | Net Smelter Return values were calculated for each block using all resource categories, commodity prices, recoveries, appropriate smelter terms and downstream costs. Metallurgical recoveries, supported by metallurgical testwork, were applied as follows: Oxide - recoveries of 88% and 22% were applied to gold and silver, respectively; Primary - recoveries to copper concentrate of 88%, 87%, 36% and 29% were applied for copper, zinc, gold and silver, respectively. Preliminary metallurgical characterisation studies, but not full testing, have been completed for Hambok. |
| (3) | Mineral Resources are reported within the pit shell generated using the specified commodity prices, using NSR block grade cut-offs derived as above. Tonnage is rounded to the nearest 10,000 tonnes and grades are rounded to two decimal places for copper and zinc, one decimal place for gold and zero decimal places for silver. Contained metal for copper and zinc are rounded to the nearest 10,000 pounds. |
| (4) | Rounding as required by reporting guidelines may result in apparent summation differences between tonnes, grade and contained metal content. |
| (5) | Tonnage and grade measurements are in metric units. Contained gold and silver ounces are reported as troy ounces, contained copper and zinc pounds as imperial pounds. |
| PJ/ABE/ADD/CCS/AAN/NMW/CAE | Bisha_2016R&R-Update_TechRep_2CN010-024_20170808_aan_cae | August 2017 |
| SRK Consulting |
| NI 43-101 Technical Report Bisha Mine 2016, Eritrea | Page ix |
Mineral Reserve Estimates
The Mineral Reserve statement reported herein is a collaborative effort between SRK, BMSC and Nevsun. The resource model, topography, metallurgical information, geotechnical data, selling costs and commodity prices were provided by BMSC and Nevsun. SRK reviewed the resource model, metallurgical parameters and geotechnical report. In SRK’s opinion, the information provided is accepTable for supporting and reporting Mineral Reserves.
The Mineral Reserve determination is based on information collected by the mineral reserves QP, Dr. Anoush Ebrahimi, P. Eng., during several site visits, the last of which was conducted between 10 May 2017 and 20 May 2017. Additional information was provided by Nevsun and BMSC throughout the course of this study. Other information was obtained from the public domain. SRK has no reason to doubt the reliability of the information provided by BMSC and Nevsun.
This report is based on the following sources of information:
- Discussions with Bisha Mine personnel
- Inspection of the Bisha project area including Harena
- Review of the resource model, metallurgical and geotechnical report provided by BMSC
- Additional information from public domain sources
Factors that affect the Mineral Reserve estimates include, but are not limited to: dilution, commodity prices, offsite costs, metallurgical recoveries, pit slope designs, capital and operating cost estimates, and the effectiveness of managing environmental impacts. SRK believes these potential modifying factors have been adequately accounted for using the assumptions in this report by other QPs and experts. The main factors that affect the reserve estimation are as follows:
- Commodity prices, particularly zinc price
- Processing recoveries
- Ability to execute the mine plan based on the reserve estimate
Combined and reported individually by deposits, the Mineral Reserves are shown in Table ES8, Table ES9 and Table ES10.
| PJ/ABE/ADD/CCS/AAN/NMW/CAE | Bisha_2016R&R-Update_TechRep_2CN010-024_20170808_aan_cae | August 2017 |
| SRK Consulting |
| NI 43-101 Technical Report Bisha Mine 2016, Eritrea | Page x |
Table ES8: Mineral Reserve statement for Bisha Main and Harena deposits, Eritrea, effective 31 December 2016
| Category | Quantity
(000’s t) | Grade | Contained Metal |
| (% Zn) | (% Cu) | (g/t Au) | (g/t Ag) | '000 lbs Zn | '000 lbs Cu | '000 Ozs Au | '000 Ozs Ag |
| Proven | | | | | | | | | |
| Supergene | 12 | | 2.57 | 0.71 | 17 | | 675 | | 7 |
| Primary | 1,047 | 7.43 | 1.05 | 0.76 | 46 | 171,583 | 24,248 | 26 | 1,535 |
| Total Proven | 1,059 | | | | | 171,583 | 24,923 | 26 | 1,541 |
| Probable | | | | | | | | | |
| Supergene | | | | | | | | | |
| Primary | 8,532 | 6.00 | 1.05 | 0.68 | 45 | 1,128,788 | 196,688 | 186 | 12,293 |
| Total Probable | 8,532 | | | | | 1,128,788 | 196,688 | 186 | 12,293 |
| Total Reserve (P&P) |
| Supergene | 12 | | 2.57 | 0.71 | 17 | | 675 | | 7 |
| Primary | 9,579 | 6.16 | 1.05 | 0.69 | 45 | 1,300,371 | 220,936 | 212 | 13,827 |
| Total | 9,591 | | | | | 1,300,371 | 221,611 | 212 | 13,834 |
Table ES9: Mineral Reserve statement for Bisha Main deposit, Eritrea, effective 31 December 2016
| Category | Quantity
(000's t) | Grade | Contained Metal |
| (% Zn) | (% Cu) | (g/t Au) | (g/t Ag) | '000 lbs Zn | '000 lbs Cu | '000 Ozs Au | '000 Ozs Ag |
| Proven |
| Supergene | 12 | | 2.57 | 0.71 | 17 | | 675 | | 7 |
| Primary | 1,047 | 7.43 | 1.05 | 0.76 | 46 | 171,583 | 24,248 | 26 | 1,535 |
| Total Proven | 1,059 | | | | | 171,583 | 24,923 | 26 | 1,541 |
| Probable |
| Supergene | | | | | | | | | |
| Primary | 6,304 | 6.91 | 1.15 | 0.74 | 50 | 1,058,963 | 195,149 | 150 | 10,539 |
| Total Probable | 6,304 | | | | | 1,058,963 | 197,204 | 150 | 10,539 |
| Total Reserve (P&P) |
| Supergene | 12 | | 2.57 | 0.71 | 17 | | 2,730 | | 7 |
| Primary | 7,351 | 6.98 | 1.14 | 0.74 | 50 | 1,230,546 | 219,397 | 176 | 12,074 |
| Total | 7,363 | | | | | 1,230,546 | 222,127 | 176 | 12,081 |
| PJ/ABE/ADD/CCS/AAN/NMW/CAE | Bisha_2016R&R-Update_TechRep_2CN010-024_20170808_aan_cae | August 2017 |
| SRK Consulting |
| NI 43-101 Technical Report Bisha Mine 2016, Eritrea | Page xi |
Table ES10: Mineral Reserve statement for Harena deposit, Eritrea, effective 31 December 2016
| Category | Quantity
(000’s t) | Grade | Contained Metal |
| (% Zn) | (% Cu) | (g/t Au) | (g/t Ag) | '000 lbs Zn | '000 lbs Cu | '000 Ozs Au | '000 Ozs
Ag |
| Probable |
| Primary | 2,228 | 3.43 | 0.75 | 0.50 | 24 | 168,450 | 36,863 | 36 | 1,754 |
| Subtotal | 2,228 | 3.43 | 0.75 | 0.50 | 24 | 168,450 | 36,863 | 36 | 1,754 |
| Notes to be read in conjunction with the Mineral Reserve statement for all of reserve tables above: |
| (1) | NSR cut-off ($US/t): Supergene ore $39.12 and Primary ore, $37.22 at Bisha Main, and $39.78 at Harena. Mineral Reserves are defined within a mine plan, with phase designs guided by Lerch-Grossman (LG) Pit Shells, generated using commodity prices for copper, zinc, gold and silver of $2.70/lb, $1.00/lb, $1,200/oz, $18.00/oz respectively. The reference mining cost was $2.27/t, plus $0.015/t/5 m bench for ore and waste below reference elevations of 540 m amsl for Bisha Main. The total ore-based cost (process, G&A, stockpile and rehandle) is $39.12/t for supergene and $37.22/t primary ores. Harena ore-based costs include an additional $2.56/t overland ore haulage cost. Overall pit slopes varied from 38˚ to 44˚ for Bisha Main and from 29˚ to 36˚ for Harena. |
| (2) | Economic values for multi-metal, multi zones were modelled using Net Smelter Return values. Each block NSR value was calculated using diluted grades, commodity prices, recoveries and appropriate smelter terms and downstream costs. Metallurgical recoveries, supported by metallurgical testwork, were applied as follows: |
| | a. | Bisha Supergene zone: Recoveries of 85%, 54% and 74% were applied for copper, gold and silver respectively. Zinc has not been assigned a recovery. An arsenic recovery of 60% was applied for smelter penalty inclusion in the NSR calculation and cash flow analysis. |
| | b. | Bisha Main Primary zone: Two concentrates are produced from primary ore, copper and zinc concentrates. For copper concentre recoveries of 70%, 15% and 27% were applied for copper, gold and silver respectively. For zinc concentrate a 77% recovery has been applied to zinc. |
| | c. | Copper concentrate grade is 20%. |
| | d. | Zinc concentrate grade is 50%. |
| | e | Harena primary zone: recoveries to copper concentrate of 85%, 36% and 29% were applied for copper, gold and silver respectively. A zinc recovery to zinc concentrate of 85% was applied. |
| (3) | Mineral Reserves are reported within Bisha Main and Harena ultimate pit designs, using NSR block grade, where the marginal cut- off is the total ore based cost stated above. Tonnages are rounded to the nearest 1,000 tonnes. Grades for contained metals are rounded to two decimal places. |
| (4) | Rounding as required by reporting guidelines may result in apparent summation differences between tonnes, grade and contained metal content. |
| (5) | Tonnage and grade measurements are in metrics units. Contained gold and silver ounces are reported as troy ounces, contained copper and zinc pounds as imperial pounds. |
| (6) | The life of mine strip ratios (by weight) for Bisha Main and Harena are 7.1:1 and 7.2:1 respectively. |
| (7) | 0.5 m "skin" of dilution is applied at ore/waste contacts. |
| (8) | 2% mining losses adjustments are made. |
| (9) | 31 December 2016 topography was used for this calculation. |
The Bisha Main Mineral Reserve estimate, contained herein and effective 31 December 2016, is based on information collected by SRK throughout the course of the project, which in turn reflects various technical and economic conditions at the time of reporting. These conditions can change significantly over relatively short periods of time. Consequently, actual results may be variable. This condition includes the amount of capital requirements that requires to satisfy the production rate required at mine.
This report includes technical information that requires calculations to derive sub-totals, totals and weighted averages. Such calculations inherently involve a degree of rounding and consequently introduce a margin of error. Where these occur, SRK does not consider them to be material.
Neither SRK nor the mineral reserves QP is an insider, associate or an affiliate of Nevsun, and neither SRK nor the mineral reserves QP nor any affiliate has acted as advisor to Nevsun, its subsidiaries or its affiliates in connection with this project. The results of the technical work by SRK are not dependent on any prior agreements concerning the conclusions to be reached, nor are there any undisclosed understandings concerning any future business dealings.
| PJ/ABE/ADD/CCS/AAN/NMW/CAE | Bisha_2016R&R-Update_TechRep_2CN010-024_20170808_aan_cae | August 2017 |
| SRK Consulting |
| NI 43-101 Technical Report Bisha Mine 2016, Eritrea | Page xii |
Mining
The Bisha project provides 9.6 Mt of mineable ore at 6.15% Zn, 1.05% Cu, 44.86 g/t Ag and 0.69 g/t Au. This amount of ore will be mined from Bisha Main and Harena pits and can supply the mill up to 2021 Q3.
The Bisha Main and Harena deposits are mined as a conventional open pit operation. At Bisha Main, in-pit haulage for waste will be carried out using 65-tonne haulage trucks in 5 m benches. To control mining dilution and to increase selectivity, smaller excavators will be utilised for ore mining. Harena pit will be mined using the same mining fleet and also in 5 m benches.
Waste rock will be moved and hauled to multiple rock storage facilities based on their geochemical characteristics and period of operation. Some of the mineralised waste will be stockpiled near the pit so that it can be recovered if commodity prices increase from current levels.
The mining operation is conducted by the owner.
Underground Preliminary Economic Assessment
In addition to the mineral reserves defined at Bisha Main pit and Harena pit, SRK investigated the opportunity to exploit the resources located below the ultimate (reserve) pits using underground mining techniques.
The mine plans for Bisha Main underground and Harena underground are based on the same resource models as those used for the Bisha Main and Harena open pits, and do not include any mineralisation already included in the mineral reserve estimates.
Although this Preliminary Economic Assessment (PEA) exploits the mineral resource that has not be captured by the open pit reserves, the mineralised material and contained metal reported in this PEA must not be added to the open pit reserves nor used to infer an overall mine strategy.
The proposed underground PEA is based on an eight year LOM mine plan at Bisha Main UG and about eleven years at Harena UG, with an overlapping production period of seven years. The combined estimated capital requirement for development of the two underground projects is approximately $265M including sustaining capital for the processing plant and TMF expansion.
The proposed underground operations would generate approximately three billion dollars in revenue before treatment/refining charges and royalty payments, and result in the post-tax NPV10% of approximately $84M.
This preliminary economic assessment is preliminary in nature, and includes inferred mineral resources that are considered too geologically speculative to have the economic considerations applied to them that would enable them to be categorised as mineral reserves, and there is no certainty that the preliminary economic assessment will be realised.
| PJ/ABE/ADD/CCS/AAN/NMW/CAE | Bisha_2016R&R-Update_TechRep_2CN010-024_20170808_aan_cae | August 2017 |
| SRK Consulting |
| NI 43-101 Technical Report Bisha Mine 2016, Eritrea | Page xiii |
Processing Plant
BMSC recently commissioned a Phase III expansion of the process plant that includes zinc flotation, zinc concentrate dewatering/handling as well as an upgrade of the two regrind mills.
The plant expansion was commissioned in mid-2016 with an extended period of steady improvement occurring over the past nine months.
Issues with sphalerite activation were experienced by BMSC for most of 2016, resulting in a bulk concentrate being produced instead of a copper concentrate. Recent changes made by BMSC in the copper circuit operation have shown improvements in the copper concentrate quality.
Recently, a saleable copper concentrate has been produced with the quantity of bulk Cu-Zn concentrate diminishing steadily. Final concentrate zinc grade has been below 50% to the end of 2016; however, due to current market conditions and low impurity levels, the zinc concentrate is readily saleable.. Zinc recovery to the zinc concentrate has been steadily improving.
The current mine production plan shows Bisha Main Primary material as the sole source of plant feed. Harena Primary material will come on-line in 2020 after the depletion of Bisha Main material. Mill head grades for Bisha Main Primary material will remain steady (at a Zn/Cu ratio of around 6:1) while Harena head grades will be lower in 2020.
For both the Bisha Main and Harena deposits, most of mineralised material remaining is considered Primary zone, with both copper and zinc grade. The remaining Oxide material is being stockpiled for future consideration; minimal copper-only Supergene remains to be processed.
As of December 2016, the geometallurgical database results showed little/no correlation between CNCu estimates and the copper-zinc selectivity. However, BMSC is using the relative proportion of CNCu and ASCu as a guideline for mill feed blending. They are also actively seeking a modified method for sequential copper analysis that offers a more accurate estimate of copper-zinc selectivity. The same is true for non-sulphide metal ion content as measured by EDTA wash assays.
SRK and TS Technical Services reviewed the Primary material testwork results and made suggestions of estimated metallurgical performance, assuming separate campaign processing of material by Zn/Cu feed ratio or domains. This is because each metallurgical domain will require a particular set of copper rougher flotation conditions to generate both saleable copper and zinc concentrates.
In SRK’s opinion, almost all of the Primary material can generate a saleable copper concentrate, but with varying recovery. The same is true for the zinc concentrate, depending on the Zn/Cu feed ratio.
Issues remain with how BMSC can separately process campaigns of different Zn/Cu domains, including stockpiling material for extended periods. Limited information is available on the effect of sample weathering/oxidation but preliminary indications are it could be significant and at least, require a major change in reagent scheme to process such oxidised material.
| PJ/ABE/ADD/CCS/AAN/NMW/CAE | Bisha_2016R&R-Update_TechRep_2CN010-024_20170808_aan_cae | August 2017 |
| SRK Consulting |
| NI 43-101 Technical Report Bisha Mine 2016, Eritrea | Page xiv |
Capital and Operating Cost Estimates
All cost estimates are shown in real (constant) 2017 US dollars and, no escalation has been applied to either operating or capital costs. The operating and capital costs are based on BMSC’s 2017 budget.
It is assumed that the Harena mine would operate under similar conditions as Bisha Main, using the same mining equipment and no processing plant modifications would be required for Harena ore.
Labour rates reflect current staffing and labour rates at the mine site, as used in the BMSC 2017 budget. The diesel price used for 2017 budget cost estimation is $0.55/L, delivered to site and the cost of electricity is $0.24 per kWh. Annual operating costs for Bisha Main are shown in Table ES11.
Table ES11: Bisha Main LOM site operating cost summary
| Description | LOM Total | 2017 | 2018 | 2019 | 2020 | 2021 |
| ($M) | ($M) | ($M) | ($M) | ($M) | ($M) |
| Open Pit Mining | 196 | 43 | 52 | 56 | 35 | 9 |
| Processing | 167 | 34 | 38 | 36 | 37 | 22 |
| Power Cost | 98 | 20 | 22 | 21 | 22 | 13 |
| General and Administrative | 119 | 25 | 25 | 25 | 25 | 19 |
| Total Operating Cost | 579 | 122 | 137 | 139 | 119 | 63 |
| Note: General and administration costs include the expenses of camps, environment, community and the office in Asmara |
All units of production for copper and zinc circuits are built and functioning as of December 2016. However, to maintain the production rate at 2.4 Mt per year, Bisha Main must invest additional capital, particularly in 2017, decreasing gradually to the end of mine life. Due to higher mining rates in the new production plans the mining fleet will be expanded. The mill is in relatively good condition, hence the requirement for low sustaining capital.
Table ES12 lists the total sustaining capital requirements for different sectors of the Bisha Main operation. Closure costs are estimated at $40M.
Table ES12: LOM sustaining capital and closure cost estimate
| Cost Categories | Cost
($M) |
| Mining equipment | 35 |
| Processing plant | 4 |
| Tailing dam | 14 |
| Technical and engineering | 9 |
| Total | 62 |
| PJ/ABE/ADD/CCS/AAN/NMW/CAE | Bisha_2016R&R-Update_TechRep_2CN010-024_20170808_aan_cae | August 2017 |
| SRK Consulting |
| NI 43-101 Technical Report Bisha Mine 2016, Eritrea | Page xv |
Economic Analysis
The economic analysis of the Bisha Mine was undertaken in a Discounted Cash Flow (DCF) model in Microsoft Excel®. The model used real (constant) 2017 US dollars ($) as the primary currency. The model used mid-period annual discounting at a base case discount rate of 10% and a valuation date of 31 December 2016. Capital costs prior to 1 January, 2017 and debt financing were excluded from the analysis, as are sunk costs and interest payments.
Base commodity prices used in the analysis were as follows:
- Zinc at $1.00 per pound
- Copper at $2.70 per pound
- Silver at $18.00 per troy ounce
- Gold at $1,200 per troy ounce
The analysis demonstrated the Bisha Mine was economically viable from a post-tax discounted cash flow perspective.
Project Access and Infrastructure
Regular international flights service Asmara, the capital city of Eritrea. Asmara is connected to the Property by a 237 km long road, 222 km of which are paved. The remaining 15 km consist of an all-weather unpaved road, which is currently being upgraded. The principal port for importation of heavy equipment is Massawa on the Red Sea coast, which is about 350 km from the Property by road.
The on-site and off-site infrastructure required to operate and support the operation of the Project in accordance with current requirements is in place.
In general, the tailings management facility (TMF) is operating satisfactorily although, in order to maintain a suitable factor of safety, Knight-Piesold (KP, 2016b) has indicated the rate at which TMF water is reclaimed needs to be increased to the maximum possible extent. Provided the Knight-Piesold (KP) recommendations arising from their bi-annual audits are appropriately addressed, it will be possible for the TMF to be safely raised to levels required by the revised mine plan. However, current plan outlined in this document calls for a smaller quantity of tailings then was proposed for the original TMF design.
Groundwater pumped from water bores is the principal source of water for the Project and its processing needs. The groundwater resource significantly exceeds the required abstraction rate, suggesting the current abstraction is sustainable in the long term assuming current average conditions of recharge and groundwater flow. Due to the high rate of evaporation, the Project water balance is net negative; no water has been discharged to the environment in the past, nor is it expected to in the future.
Waste rock from the open pit falls into one of two geochemical categories controlled by lithological makeup: non-potentially acid generating (NAG) or potentially acid generating (PAG). Most of the waste rock is classified as PAG material. Identification of NAG material can only be done by testing. There is currently one NAG dump and one PAG dump on site. NAG material is being used for embankment construction at the TMF. Sufficient real estate exists to expand the waste dumps as required.
| PJ/ABE/ADD/CCS/AAN/NMW/CAE | Bisha_2016R&R-Update_TechRep_2CN010-024_20170808_aan_cae | August 2017 |
| SRK Consulting |
| NI 43-101 Technical Report Bisha Mine 2016, Eritrea | Page xvi |
Environmental and Permits
At this time, the Project has all necessary permits and authorisations to operate the mine.
Environmental issues identified in conjunction with the initial permitting process and ongoing regulatory oversight are being addressed by BMSC. Detailed monitoring plans are in place as part of the impact assessment process and to develop inputs to the final reclamation and closure of the site.
Final reclamation of the pit, waste rock facilities, yards, ROM pad and roads is estimated to cost approximately $7.5M. Reclamation of the TMF, which includes the costs for the placement of a 40 cm cover and the closure spillway, is estimated to be approximately $5.3M. Revegetation is estimated to be approximately $1.3M.
No salvage credits have been assumed for the closure costing.
Demolition and reclamation of the plant and other infrastructure is estimated to be approximately $8.6M. Closure and post closure monitoring costs for a period of 10 years (five years of TMF drain-down and five years of post-closure monitoring) is estimated at $0.5M.
The total reclamation cost is estimated at $40.0M including administrative costs and a 15% contingency. A review of that plan suggests that several important closure steps are missing, specifically a cover and final landform study for the waste dumps, a cover study for the TSF and the development of a social closure plan for the nearby communities. The cost of these studies amounts to approximately $0.3M.
Consistent with this closure cost estimate, Nevsun (2017) confirmed that BMSC has arranged an annually renewable environmental bond of $40M at a cost of 1% per annum. BMSC, in accordance with International Financial Reporting Standards, has accrued $38.3M in its financial records as of 31 March 2017, as a provision for reclamation, remediation, and post-closure monitoring.
Recommendations
Mineral Resource
- To upgrade the Inferred resource to Indicated at all five deposits, infill drilling to a nominal 50 m by 50 m spacing is required.
- To upgrade Indicated resources to Measured, close-spaced drilling (such as grade control drilling) is required. For the Harena, Asheli, Northwest and Hambok deposits, further metallurgical testwork is justified as well.
- Upgrade the Inferred stockpile resource category with additional metallurgical testwork.
| PJ/ABE/ADD/CCS/AAN/NMW/CAE | Bisha_2016R&R-Update_TechRep_2CN010-024_20170808_aan_cae | August 2017 |
| SRK Consulting |
| NI 43-101 Technical Report Bisha Mine 2016, Eritrea | Page xvi |
- Harena deposit remains open down-plunge and further extension drilling is highly likely to add Mineral Resources to this deposit.
- The cost estimate for these recommendations is approximately $25.5M.
Mining
- Obtain the necessary permits to establish a waste dump to the west of the Bisha Main pit. A waste dump in this area will reduce cycle times, and therefore costs, particularly for the waste stripped in the west zone.
- Review the geotechnical assessment for the south-east sector of the Bisha Main pit based on recent exposures in that area. The current geotechnical recommendations are complex and vary considerably with only a small variation in pit wall orientation. In SRK's opinion, there is opportunity to reduce the stripping ratio.
- Review the current procedures for grade control and short-term mine planning (GC&STMP) with a view to establishing a methodology that values the ore according to NSR and can respond relatively quickly to change in commodity process and processing performance.
- Currently, the ore is sorted on run-of-mine (ROM) pads, based on its quality/grade, prior to crushing. SRK recommends utilising the improved GC&STMP procedures (refer to earlier recommendation) to provide the confidence required for direct tipping to the crusher. This reduction in rehandle will reduce the operating costs.
- Consider increasing the width of the two-way haulage roads to at least 25 m (preferred 27 m). This will increase tire life (due to less frequent scrubbing of tire walls on bunds) and generally provide safer operating conditions.
- The cost estimate for these recommendations is about $0.3M.
Processing
SRK includes the following recommendations for future metallurgical testwork, based on a well-established set of metallurgical domains:
- Review of current sequential copper methods being used to estimate the secondary copper content.
- Investigate the effect of weathering/oxidation and methods to reduce the impact of medium to long-term stockpiling of Primary material.
- Sample and evaluate the performance of currently stockpiled Primary material.
- Investigate the effect of primary grind size on copper-zinc selectivity.
- Determine the optimal pH and reagent conditions for each metallurgical domain.
- Establish the sensitivity of results within each domain and whether campaign processing is required, optional or not necessary.
For the BMSC plant operation, SRK also recommends:
| PJ/ABE/ADD/CCS/AAN/NMW/CAE | Bisha_2016R&R-Update_TechRep_2CN010-024_20170808_aan_cae | August 2017 |
| SRK Consulting |
| NI 43-101 Technical Report Bisha Mine 2016, Eritrea | Page xvii |
- A review of all plant measurements to confirm feed conditions are stable and process performance is somewhat predictable.
- Conduct a series of plant trials on a single metallurgical domain where prior lab testwork conditions are applied to the plant while processing the material, to compare lab versus plant performance.
- Minor upgrades to processing plant for water reticulation, pumps, etc.
- The cost estimate for these recommendations is about $0.3M to $0.5M, depending on the number of samples required to provide sufficient confidence in the outcome.
Key Project Risks
Mining
- Achieving the mining rate, that is a function of equipment availability, calculated in production schedule is an important and vital element for success of Bisha project. Failure in reaching to the production rate causes the operating cost to increase and poses the risk of losing the mineable reserve.
- Mineral Reserve calculated in this report is based on input parameters outlined in Section 14. These parameters included commodity prices and processing recoveries. Failure to achieve processing recoveries used in this report will cause the project to lose the income that eventually would affect the amount of Mineral Reserve.
Political
Albeit unlikely, there is a residual risk of unexpected governmental intervention that can lead to potentially significant impacts to a mining operation. An important action to mitigate this risk is to continue to maintain positive relationships with the regulatory agencies and local communities. Additional risk mitigation is available through the 40% interest in the Bisha mine that the Government of Eritrea holds via the ENAMCO.
Economics
As experienced during the Global Financial Crisis in 2008/2009 and during the economic downturn from 2014 to 2016, commodity prices are subject to overall global economic health. Any significant event that shakes consumer confidence in capital markets could lead to depressed commodity prices, resulting in lower than predicted project revenues.
Key Project Opportunities
Mining
Higher commodity prices will generate additional income that consequently can justify mining a larger pit in Bisha Main deposit.
Harena deposit contains some near surface inferred resources. More exploration drilling to confirm Mineral Resource at Harena may help to increase the Mineral Reserve for this deposit.
| PJ/ABE/ADD/CCS/AAN/NMW/CAE | Bisha_2016R&R-Update_TechRep_2CN010-024_20170808_aan_cae | August 2017 |
| SRK Consulting |
| NI 43-101 Technical Report Bisha Mine 2016, Eritrea | Page xix |
Processing
Work is ongoing at site to improve plant performance, with particular emphasis on copper-zinc selectivity. Methods to anticipate poor selectivity are being investigated including sequential copper tests to estimate the secondary copper content as well as non-sulphide metal ions that may be resulting in sphalerite activation.
In SRK’s opinion, well-defined, metallurgical domains need to be established, each with specific operating conditions needed to achieve reasonable selectivity and produce both a copper and zinc concentrate. This might be Zn/Cu feed grade ratios discussed in Section 12 or it might be another feed characteristic or proxy value. Due to the high variability in metallurgical response observed in the plant results to date and historical testwork, it seems reasonable to assume that campaigning of specific metallurgical domains without blending across domains, offers the greatest opportunity for consistent plant performance; this approach assumes oxidation of the stockpiled ore does not adversely impact processing recovery.
Economics
Any significant improvements in commodity prices, concentrate grades or metal recovery rates will lead to substantial increases in project NPV. An increase in production rate will also increase project value, albeit to a lesser extent. If any major project assumptions change due to ongoing work, the economic model should be reviewed and updated to determine the overall impact to project NPV.
| PJ/ABE/ADD/CCS/AAN/NMW/CAE | Bisha_2016R&R-Update_TechRep_2CN010-024_20170808_aan_cae | August 2017 |
| SRK Consulting |
| NI 43-101 Technical Report Bisha Mine 2016, Eritrea | Page xx |
Table of Contents
| PJ/ABE/ADD/CCS/AAN/NMW/CAE | Bisha_2016R&R-Update_TechRep_2CN010-024_20170714_DRAFT_v07_FWB_aan_rev06 | July 2017 |
| SRK Consulting | |
| NI 43-101 Technical Report Bisha Mine 2016, Eritrea | Page xxi |
| PJ/ABE/ADD/CCS/AAN/NMW/CAE | Bisha_2016R&R-Update_TechRep_2CN010-024_20170714_DRAFT_v07_FWB_aan_rev06 | July 2017 |
| SRK Consulting | |
| NI 43-101 Technical Report Bisha Mine 2016, Eritrea | Page xxii |
| PJ/ABE/ADD/CCS/AAN/NMW/CAE | Bisha_2016R&R-Update_TechRep_2CN010-024_20170714_DRAFT_v07_FWB_aan_rev06 | July 2017 |
| SRK Consulting | |
| NI 43-101 Technical Report Bisha Mine 2016, Eritrea | Page xxiii |
| PJ/ABE/ADD/CCS/AAN/NMW/CAE | Bisha_2016R&R-Update_TechRep_2CN010-024_20170714_DRAFT_v07_FWB_aan_rev06 | July 2017 |
| SRK Consulting |
| NI 43-101 Technical Report Bisha Mine 2016, Eritrea | Page xx |
Table of Contents
| PJ/ABE/ADD/CCS/AAN/NMW/CAE | Bisha_2016R&R-Update_TechRep_2CN010-024_20170808_aan_cae | August 2017 |
| SRK Consulting | |
| NI 43-101 Technical Report Bisha Mine 2016, Eritrea | Page xxxi |
| PJ/ABE/ADD/CCS/AAN/NMW/CAE | Bisha_2016R&R-Update_TechRep_2CN010-024_20170808_aan_cae | August 2017 |
| SRK Consulting | |
| NI 43-101 Technical Report Bisha Mine 2016, Eritrea | Page xxxii |
| PJ/ABE/ADD/CCS/AAN/NMW/CAE | Bisha_2016R&R-Update_TechRep_2CN010-024_20170808_aan_cae | August 2017 |
| SRK Consulting | |
| NI 43-101 Technical Report Bisha Mine 2016, Eritrea | Page xxxiii |
| PJ/ABE/ADD/CCS/AAN/NMW/CAE | Bisha_2016R&R-Update_TechRep_2CN010-024_20170808_aan_cae | August 2017 |
| SRK Consulting | |
| NI 43-101 Technical Report Bisha Mine 2016, Eritrea | Page xxiv |
| PJ/ABE/ADD/CCS/AAN/NMW/CAE | Bisha_2016R&R-Update_TechRep_2CN010-024_20170808_aan_cae | August 2017 |
| SRK Consulting | |
| NI 43-101 Technical Report Bisha Mine 2016, Eritrea | Page xxv |
| PJ/ABE/ADD/CCS/AAN/NMW/CAE | Bisha_2016R&R-Update_TechRep_2CN010-024_20170808_aan_cae | August 2017 |
| SRK Consulting | |
| NI 43-101 Technical Report Bisha Mine 2016, Eritrea | Page xxvi |
| PJ/ABE/ADD/CCS/AAN/NMW/CAE | Bisha_2016R&R-Update_TechRep_2CN010-024_20170808_aan_cae | August 2017 |
| SRK Consulting | |
| NI 43-101 Technical Report Bisha Mine 2016, Eritrea | Page xxvii |
| PJ/ABE/ADD/CCS/AAN/NMW/CAE | Bisha_2016R&R-Update_TechRep_2CN010-024_20170808_aan_cae | August 2017 |
| SRK Consulting | |
| NI 43-101 Technical Report Bisha Mine 2016, Eritrea | Page xxviii |
List of Figures
| PJ/ABE/ADD/CCS/AAN/NMW/CAE | Bisha_2016R&R-Update_TechRep_2CN010-024_20170808_aan_cae | August 2017 |
| SRK Consulting | |
| NI 43-101 Technical Report Bisha Mine 2016, Eritrea | Page xxix |
| PJ/ABE/ADD/CCS/AAN/NMW/CAE | Bisha_2016R&R-Update_TechRep_2CN010-024_20170808_aan_cae | August 2017 |
| SRK Consulting | |
| NI 43-101 Technical Report Bisha Mine 2016, Eritrea | Page xxx |
List of Tables
| Table 1.1: Areas of responsibilities. | 35 |
| Table 1.2: List of authors and responsibilities. | 36 |
| Table 1.3: Site visit dates by QPs. | 38 |
| Table 3.1: BMSC mining tenements. | 44 |
| Table 3.2: New Mogoraib EL expenditure requirements. | 45 |
| Table 3.3: Tabakin EL expenditure requirements. | 45 |
| Table 4.1: Distances by road from Asmara to the property. | 49 |
| Table 5.1: Combined Mineral Resource statement for Bisha Main, Harena, Northwest and Hambok deposits, Eritrea, as of 31 December 2013. | 55 |
| Table 5.2: Bisha Main Stage I gold production. | 56 |
| Table 5.3: Bisha Main Stage II copper production. | 56 |
| Table 5.4: Bisha Main Stage III zinc production. | 56 |
| Table 7.1: Average grade and tonnage data for selected VMS camps. | 75 |
| Table 9.1: Bisha Main Deposit drilling analysis. | 81 |
| Table 9.2: Harena Deposit drilling analysis. | 82 |
| Table 9.3: Hambok Deposit drilling analysis. | 82 |
| Table 9.4: Northwest Deposit drilling analysis. | 82 |
| Table 9.5: Asheli Deposit drilling analysis. | 83 |
| Table 9.6: Other prospects drilling summary. | 83 |
| Table 10.1: Analytical laboratory assay techniques. | 86 |
| Table 10.2: Density testwork summary. | 87 |
| Table 10.3: Laboratory blanks analysis. | 88 |
| Table 10.4: Laboratory CRM analysis. | 88 |
| Table 11.1: Site visit dates by QPs. | 91 |
| Table 12.1: Harena rougher flotation results. | 95 |
| Table 12.2: Primary material metallurgical estimates. | 105 |
| Table 13.1: Mineral Resource statement for Bisha Main deposit, Eritrea, as of 31 December 2016. | 109 |
| Table 13.2: Mineral Resource statement for Bisha Main deposit, Eritrea, as of 31 December 2016. | 110 |
| Table 13.3: Mineral Resource statement for Harena deposit, Eritrea, as of 31 December 2016. | 111 |
| Table 13.4: Inferred Mineral Resource statement for Asheli deposit, Eritrea as of 31 December 2016. | 111 |
| Table 13.5: Mineral Resource statement for Northwest deposit, Eritrea, as of 31 December 2016. | 112 |
| Table 13.6: Mineral Resource statement for Hambok deposit, Eritrea, as of 31 December 2016. | 113 |
| Table 13.7: Database bisha201600825.mdb summary. | 113 |
| Table 13.8: Mean grade of each interpreted mineralised domain. | 115 |
| Table 13.9: Top cuts applied. | 116 |
| Table 13.10: Domain 100 resource variogram models, with sills (γ) and ranges (h) | 117 |
| Table 13.11: Domain 101 resource variogram models. | 117 |
| Table 13.12: Domain 102 resource variogram models. | 118 |
| Table 13.13: Domain 200 resource variogram models. | 118 |
| Table 13.14: Domain 201 resource variogram models. | 119 |
| Table 13.15: Domain 202 resource variogram models. | 119 |
| Table 13.16: Domain 203 resource variogram models. | 120 |
| Table 13.17: Domain 300 resource variogram models. | 120 |
| Table 13.18: Domain 301 resource variogram models. | 121 |
| Table 13.19: Domain 302 resource variogram models. | 121 |
| Table 13.20: Domain 303 resource variogram models. | 122 |
| Table 13.21: Domain 304 resource variogram models. | 122 |
| Table 13.22: Domain 400 resource variogram models. | 123 |
| Table 13.23: Domain 401 resource variogram models. | 123 |
| PJ/ABE/ADD/CCS/AAN/NMW/CAE | Bisha_2016R&R-Update_TechRep_2CN010-024_20170808_aan_cae | August 2017 |
| SRK Consulting | |
| NI 43-101 Technical Report Bisha Mine 2016, Eritrea | Page xxxi |
| PJ/ABE/ADD/CCS/AAN/NMW/CAE | Bisha_2016R&R-Update_TechRep_2CN010-024_20170808_aan_cae | August 2017 |
| SRK Consulting | |
| NI 43-101 Technical Report Bisha Mine 2016, Eritrea | Page xxxii |
| Table 13.74: Gold variogram parameters. | 165 |
| Table 13.75: Silver variogram parameters. | 166 |
| Table 13.76: Arsenic variogram parameters. | 167 |
| Table 13.77: Block model definitions. | 167 |
| Table 13.78: Mineral Resource commodity prices. | 169 |
| Table 13.79: Mineral Resource statement for Northwest deposit, Eritrea, as of 31 December 2016. | 171 |
| Table 13.80: Hambok deposit drillhole summary table. | 172 |
| Table 13.81: Variogram parameters for Hambok estimation. | 177 |
| Table 13.82: Block model extents, massive sulphide-hosted mineralisation. | 178 |
| Table 13.83: Mineral Resource commodity prices. | 180 |
| Table 13.84: Mineral Resource statement for Hambok deposit, Eritrea, as of 31 December 2016. | 182 |
| Table 14.1: Commodity prices used for Mineral Reserve estimate. | 184 |
| Table 14.2: Methodology for estimating dilution. | 188 |
| Table 14.3: Results of pit optimisation. | 193 |
| Table 14.4: Mineral Reserve statement for Bisha Main and Harena deposits, Eritrea, as of 31 December 2016 | 197 |
| Table 14.5: Mineral Reserve statement for Bisha Main deposit, Eritrea, as of 31 December 2016. | 197 |
| Table 14.6: Mineral Reserve statement for Harena deposit, Eritrea, as of 31 December 2016. | 198 |
| Table 15.1: Mine design criteria. | 200 |
| Table 15.2: Bisha Main pit Mineral Reserves by phases. | 204 |
| Table 15.3: Production schedule for Bisha project | 208 |
| Table 15.4: List of major mining equipment and their requirements by period. | 211 |
| Table 16.1: Summary of major plant equipment (following Phase III expansion) | 218 |
| Table 16.2: Summary of plant consumables (2017 YTD) | 223 |
| Table 17.1: Dam crest elevation versus TMF storage capacity per stage. | 229 |
| Table 17.2: PAG/NAG waste rock quantity summary. | 232 |
| Table 20.1: Bisha LOM site operating cost summary. | 244 |
| Table 20.2: LOM sustaining capital cost estimate. | 244 |
| Table 20.3: Mining equipment purchase schedule ($M) | 245 |
| Table 20.4: Processing plant sustaining capital | 246 |
| Table 20.5: Mine operating costs. | 247 |
| Table 21.1: Summary LOM production schedule. | 249 |
| Table 21.2: Summary LOM revenue. | 250 |
| Table 21.3: Total project capital expenditures including mine closure. | 251 |
| Table 21.4: Total project operating expenditures. | 251 |
| Table 21.5: LOM average cost per tonne of ore. | 251 |
| Table 21.6: LOM royalty estimate. | 252 |
| Table 21.8: Project key performance indicators. | 252 |
| Table 21.9: NPV sensitivity to changing base commodity prices (Zn, Cu) and cost estimates. | 253 |
| Table 23.1: Bisha Main UG and Harena UG - ground support recommendations. | 259 |
| Table 23.2: Commodity price deck. | 260 |
| Table 23.3: Bisha Main UG - Processing recoveries. | 260 |
| Table 23.4: Bisha Main UG - Underground preliminary costs inputs for design parameters. | 261 |
| Table 23.5: Bisha Main UG - SLC stope geometries. | 261 |
| Table 23.6: Bisha Main UG - SLC stope geometries. | 264 |
| Table 23.7: Bisha Main UG - LOM development and production schedule. | 265 |
| Table 23.8: Bisha Main UG - Labour requirements. | 266 |
| Table 23.9: Bisha Main UG - Lateral development capital cost estimate. | 267 |
| Table 23.10: Bisha Main UG - Annual capital cost estimates. | 268 |
| Table 23.11: Bisha Main UG - Operating cost estimate. | 269 |
| Table 23.12: Bisha Main UG - Contractor annual mobile equipment costs. | 270 |
| PJ/ABE/ADD/CCS/AAN/NMW/CAE | Bisha_2016R&R-Update_TechRep_2CN010-024_20170808_aan_cae | August 2017 |
| SRK Consulting | |
| NI 43-101 Technical Report Bisha Mine 2016, Eritrea | Page xxxiii |
| PJ/ABE/ADD/CCS/AAN/NMW/CAE | Bisha_2016R&R-Update_TechRep_2CN010-024_20170808_aan_cae | August 2017 |
| SRK Consulting |
| NI 43-101 Technical Report Bisha Mine 2016, Eritrea | Page xxxiv |
Acronyms and Abbreviations
| Distance | | ppb | parts per billion |
| µm | micron (micrometre) | | s | second |
| mm | millimetre | | SG | specific gravity |
| cm | centimetre | | V | volt |
| m | metre | | W | watt |
| km | km | | Ω | ohm |
| ” or in | inch | | A | ampere |
| ’ or ft | foot | | K | Thousand |
| Area | | Ø | diameter |
| m2 | square metre | | Acronyms |
| km2 | square km | | ENAMCO | Eritrean National Mining Corporation |
| ha | hectare | | EL | Exploration Licence |
| Volume | | SRK | SRK Consulting (Canada) Inc. |
| L | litre | | CIM | Canadian Institute of Mining |
| m3 | cubic metre | | NI 43-101 | National Instrument 43-101 |
| lcm | loose cubic metre | | QP | Qualified Person |
| bcm | bank cubic metre | | KP | Knight Piésold |
| Mbcm | million bcm | | WSP | WSP Parsons Brinkerhoff |
| Mass | | ANS | Arabian-Nubian Shield |
| kg | kilogram | | AP | Accounts Payable |
| g | gram | | AR | Accounts Receivable |
| t | metric tonne | | BHEM | Borehole Time-Domain Electromagnetic |
| kt | kilotonne | | BMSC | Bisha Mining Share Company |
| lb | pound | | BOCO | Base of Complete Oxidation |
| Mt | megatonne | | COG | cut-off grade |
| oz | troy ounce | | CRM | certified reference materials |
| wmt | wet metric tonne | | DCF | Discounted Cash Flow |
| dmt | dry metric tonne | | EDTA | Ethylenediaminetetraacetic Acid |
| Pressure | | EIA | Environmental Impact Assessment |
| psi | pounds per square inch | | EM | Electromagnetic |
| Pa | pascal | | GC&STMP | grade control and short-term mine planning |
| kPa | kilopascal | | IRC | Impact Review Committee |
| MPa | megapascal | | LG | Lerchs-Grossman |
| Elements and Compounds | | LOM | life of mine |
| Au | Gold | | ML/ARD | Metal leaching/ acid rock drainage |
| Ag | Silver | | MSUL | Massive Sulphide |
| As | Arsenic | | Mtpa | million tonnes per annum |
| Cu | Copper | | NAG | Non-potentially acid generating |
| Fe | Iron | | NPV | net present value |
| S | Sulphur | | NSR | net smelter return |
| Zn | Zinc | | OK | Ordinary Kriging |
| CN | Cyanide | | PAG | Potentially acid generating |
| NaCN | sodium cyanide | | QKNA | Quantitative Kriging Neighbourhood Analysis |
| CNCu | cyanide-soluble copper | | RC | reverse circulation |
| Other | | RQD | Rock Quality Designation |
| °C | degree Celsius | | SI | System of Units |
| °F | degree Fahrenheit | | SMSX | Semi-massive Sulphide |
| elev | elevation | | TMF | Tailings Management Facility |
| m amsl | metres elev. above mean sea level | | TOFR | Top of Fresh Rock |
| hp | horsepower | | tpd | tonnes per day |
| hr | hour | | UG | underground |
| kW | kilowatt | | VMS | Volcanic hosted massive sulphide |
| kWh | kilowatt hour | | WRF | waste rock facility |
| M | Million or mega | | Conversion Factors |
| mph | miles per hour | | 1 tonne | 2,204.62 lb |
| ppm | parts per million | | 1 troy ounce | 31.1035 g |
| PJ/ABE/ADD/CCS/AAN/NMW/CAE | Bisha_2016R&R-Update_TechRep_2CN010-024_20170808_aan_cae | August 2017 |
| SRK Consulting |
| NI 43-101 Technical Report Bisha Mine 2016, Eritrea | Page 35 |
| 1 | Introduction and Terms of Reference |
This technical report was prepared for Nevsun Resources Ltd. (Nevsun) to summarise the results of resource and reserve update on the Bisha Mine (Bisha, Mine or Project), located in Eritrea, Africa. Nevsun holds a 60% interest in the Project, through a 60% interest in Bisha Mining Share Company (BMSC). The Eritrean National Mining Corporation (ENAMCO) holds the remaining 40% interest. BMSC is the operator for the Bisha and Harena mining licences, the mining agreement area, Tabakin Exploration License (Tabakin EL) and Mogoraib River Exploration License (Mogoraib EL) exploration licences.
The contract with SRK Consulting permits Nevsun to file this report as a technical report with the Canadian securities regulatory authorities pursuant to NI 43-101, Standards of Disclosure for Mineral Projects. Except for the purposes legislated under provincial securities law, any other uses of this report by any third party is at that party’s sole risk. The responsibility for this disclosure remains with Nevsun. The user of this document should ensure that this is the most recent technical report for the property, as it is not valid if a new technical report has been issued.
Table 1.1: Areas of responsibilities
| | Company | Area of Responsibility |
| | BMSC | Mineral Resource Estimation, Quality Assurance/Quality Control (QA/QC), Geology, Geotechnical Engineering, Closure Costs |
| | SRK | Mineral Reserve Estimate, Open Pit and Underground Mine Designs, Mine Ventilation and Cooling, Production Schedule, Mining Costs, Recovery Methods, Processing Capital and Operating Costs, Economics, Site Infrastructure, Environmental and Permitting |
| | Nevsun | Marketing Studies and Contracts |
This report has been prepared by SRK with contributions from BMSC and Nevsun. This technical report was written by the authors shown in Table 1.2.
| PJ/ABE/ADD/CCS/AAN/NMW/CAE | Bisha_2016R&R-Update_TechRep_2CN010-024_20170808_aan_cae | August 2017 |
| SRK Consulting |
| NI 43-101 Technical Report Bisha Mine 2016, Eritrea | Page 36 |
| | Table 1.2: List of authors and responsibilities |
| | Author | Company | Area of Responsibility |
| | Chris Elliott, FAusIMM | SRK | Introduction and Terms of Reference, Reliance on Other Experts |
| | Adrian Dance, P.Eng, FAusIMM | SRK | Mineral Processing and Metallurgical Testing, Recovery Methods, Processing Capital and Operating Costs, relevant parts of Executive Summary and Conclusions and Recommendations |
| | Phil Jankowski, MAusIMM (CP) | BMSC | Property Description and Location, Accessibility, Climate, Local Resources, Infrastructure and Physiography, History, Geological Setting and Mineralisation, Deposit Types, Exploration, Drilling, Sample Preparation, Analyses, and Security, Data Verification, Mineral Resource Estimates |
| | Anoush Ebrahimi, P.Eng | SRK | Mineral Reserve Estimates, Mining Methods, Mining Capital and Operating Costs, relevant parts of Executive Summary and Conclusions and Recommendations |
| | Cameron Scott, P.Eng | SRK | Project Infrastructure, Environmental Studies, Permitting, and Social or Community Impact, Closure, relevant parts of Executive Summary and Conclusions and Recommendations |
| | Neil Winkelmann, FAusIMM | SRK | Economic Analysis, Other Relevant Data and Information, relevant parts of Executive Summary and Conclusions and Recommendations |
| | Tom Whelan, CPA | Nevsun | Marketing Studies and Contracts |
Any previous technical reports or literature used in the compilation of this report are referenced in the relevant text as necessary.
All units in this report are based on the International System of Units (SI), except industry standard units, such as troy ounces for the mass of precious metals.
This report uses abbreviations and acronyms common to the mineral industry. Definitions have been provided earlier in the report.
| 1.3 | Basis of Technical Report |
This technical report is an update of the technical report issued by AGP Mining Consultants Inc. (AGP) and Mineralurgy Pty. Ltd. (Mineralurgy) on 24 March 2014, and information collected by SRK during site visits performed by Dr. Anoush Ebrahimi and Mr. Neil Winkelmann during the first six month 2017, and on additional information provided by BMSC and Nevsun throughout the course of SRK’s investigations. SRK has no reason to doubt the reliability of the information provided. Nevsun filed a number of previous Technical Reports on the Bisha Mine:
| | - AGP Mining Consultants, Inc. Peter Munro, BAppSc., Mineralurgy Pty. Ltd. effective date: 31 December 2013, published 24 March 2014.
|
| PJ/ABE/ADD/CCS/AAN/NMW/CAE | Bisha_2016R&R-Update_TechRep_2CN010-024_20170808_aan_cae | August 2017 |
| SRK Consulting |
| NI 43-101 Technical Report Bisha Mine 2016, Eritrea | Page 37 |
| | - AGP (2012). Bisha Polymetallic Operation, Eritrea, Africa, NI 43-101 Technical Report for Nevsun Resources Ltd., as of 31 August 2012.
- Thomas, D., Melnyk, J., Kozak, A., Khera, V. (2011). Nevsun Resources Limited, Bisha Polymetallic Operation Eritrea, Africa, NI 43-101 Technical Report to Nevsun Resources Ltd., effective date 1 January 2011, and revised 29 March 2011.
- Waller, S., Reddy, D., Melnyk, L. (2006). Nevsun Resources (Eritrea) Ltd, NI 43-101 Technical Report on the Feasibility Assessment, Bisha Property, Gash-Barka District, Eritrea: unpublished technical report to Nevsun Resources Ltd., effective date 5 October 2006.
- AMEC (2005). Nevsun Resources (Eritrea) Ltd. Bisha Property, Gash-Barka District, Eritrea, NI 43-101 Technical Report and Preliminary Assessment, 30 December 2005: unpublished technical report to Nevsun Resources Ltd., effective date 30 December 2005.
- AMEC (2004). Technical Report on the Bisha Property and Resource Estimate of the Bisha Deposit, Gash-Barka District, Eritrea, 1 October 2004: unpublished technical report to Nevsun Resources Ltd., effective date 18 November 2004.
- Barrie, C.T., and Giroux, G.H. (2009). Hambok Deposit, Mogoraib Exploration License, Gash- Barka District, Western Eritrea 43-101 Technical Report and Preliminary Resource Assessment Prepared for Sanu Resources Ltd.
|
| 1.4 | Qualifications of SRK and SRK Team |
The SRK Group comprises over 1,400 professionals, offering expertise in a wide range of resource engineering disciplines. The SRK Group’s independence is ensured by the fact that it holds no equity in any project and that its ownership rests solely with its staff. This fact permits SRK to provide its clients with conflict-free and objective recommendations on crucial judgment issues. SRK has a demonstrated track record in undertaking independent assessments of Mineral Resources and Mineral Reserves, project evaluations and audits, technical reports and independent feasibility evaluations to bankable standards on behalf of exploration and mining companies and financial institutions worldwide. The SRK Group has also worked with a large number of major international mining companies and their projects, providing mining industry consultancy service inputs.
In accordance with NI 43-101 guidelines, SRK has visited the Bisha Mine on a number of occasions since 2014 to review geology and exploration protocols.
For the purpose of this reserves update, the QPs listed in Table 1.3 visited the property during the dates indicated to review metallurgical data mining/production and infrastructure.
Mr Ebrahimi also conducted additional site visits in 2017 for the purpose of compiling this technical report.
| PJ/ABE/ADD/CCS/AAN/NMW/CAE | Bisha_2016R&R-Update_TechRep_2CN010-024_20170808_aan_cae | August 2017 |
| SRK Consulting |
| NI 43-101 Technical Report Bisha Mine 2016, Eritrea | Page 38 |
| | Table 1.3: Site visit dates by QPs |
| | Name | Dates |
| | Adrian Dance | Did not visit site for the purpose of this Technical Report |
| | Anoush Ebrahimi | 18 Oct 2016 to 24 Oct 2016 |
| | Cameron Scott | Did not visit site for the purpose of this Technical Report |
| | Neil Winkelmann | 27 May 2015 to 30 May 2015 |
SRK would like to acknowledge the support and collaboration provided by Nevsun and BMSC personnel for this assignment. Their collaboration was greatly appreciated and instrumental to the success of this project.
SRK’s opinion contained herein and effective 31 December, 2016, is based on information collected by SRK throughout the course of SRK’s investigations, which in turn reflect various technical and economic conditions at the time of writing. Given the nature of the mining business, these conditions can change significantly over relatively short periods of time. Consequently, actual results may be significantly more or less favourable.
This report may include technical information that requires subsequent calculations to derive sub-totals, totals and weighted averages. Such calculations inherently involve a degree of rounding and consequently introduce a margin of error. Where these occur, SRK does not consider them to be material.
SRK is not an insider, associate or an affiliate of Nevsun, and neither SRK nor any affiliate has acted as advisor to Nevsun, its subsidiaries or its affiliates in connection with this project. The results of the technical review by SRK are not dependent on any prior agreements concerning the conclusions to be reached, nor are there any undisclosed understandings concerning any future business dealings.
| PJ/ABE/ADD/CCS/AAN/NMW/CAE | Bisha_2016R&R-Update_TechRep_2CN010-024_20170808_aan_cae | August 2017 |
| SRK Consulting |
| NI 43-101 Technical Report Bisha Mine 2016, Eritrea | Page 39 |
| 2 | Reliance on Other Experts |
The authors have relied upon information derived from the following letter, pertaining to mineral tenure, surface rights, permitting, environmental liabilities, and social issues:
| | - Nevsun, 2017, Re: Bisha Operation, letter from Chief Operating Officer of Nevsun to SRK Consultant (Canada) Inc., dated 29 June 2017.
|
The Qualified Persons (QPs) have not reviewed the mineral tenure, nor independently verified the legal status or ownership of the Project area or underlying property agreements. The QPs have relied upon information obtained from the above-mentioned document. This information is used in Sections 3.3, 3.3, and 3.4 of this report.
| 2.2 | Surface Rights and Permitting |
The QPs have relied on information regarding the status of the current Surface Rights, Road Access, and Permits through opinions and data supplied by BMSC experts through the above-mentioned document. This information is used in Sections 3.5 and 3.7 of this report.
| 2.3 | Environmental Liabilities |
The QPs relied on information regarding Environmental Liabilities through opinions and data supplied by BMSC experts through the above-mentioned document. This information is used in Section 19.2 and Section 19.3 of this report.
| 2.4 | Social and Community Impacts |
The QPs have relied on information regarding the status of Social and Community Impacts through opinions and data supplied by BMSC experts through the above-mentioned document. This information is used in Section 19.6 of this report.
| PJ/ABE/ADD/CCS/AAN/NMW/CAE | Bisha_2016R&R-Update_TechRep_2CN010-024_20170808_aan_cae | August 2017 |
| SRK Consulting |
| NI 43-101 Technical Report Bisha Mine 2016, Eritrea | Page 40 |
| 3 | Property Description and Location |
The Property is located 150 km west of Asmara (237 km by road) in Eritrea, East Africa and is centred at 15°28’ N and 37°27’ E (Figure 3.1). It is made up of two mining licences (Bisha which also includes the Northwest Zone and Harena) that cover a total area of 24 km2, and a mining agreement area covering an area of 46.5 km2 over these mining licences. Also included are the Mogoraib and Tabakin exploration licences which cover a combined area of 815 km2.
The Property comprises two mining licences, one mining agreement area and two exploration licences. The licence title and length of terms for each of these are listed below:
Under the terms of the mining agreement, BMSC has the exclusive right of land use in the Mining Licence Area that is granted within the mining agreement area. This right is subject to the acquisition and settlement of any third-party land-use rights by payment of compensation and/or relocation at the expense of BMSC.
Royalties payable include an Eritrean Government gross royalty of 5.0% on precious metals and 3.5% on base metals.
BMSC holds all the necessary permits to support a mining operation.
The environmental compliance requirements are developed during the Mining Licence application. The key environmental issues and environmental bonding’s amounts are set during the SEIA studies and are reviewed annually with the progress of the mine plan. Updates to and approval of the Social and Environmental Management Plan are required every five years or whenever a material change in the operation is undertaken. Similarly, an updated SEIA is required where there is a substantial change or modification to the project. The closure bonding amounts set aside are currently $40M. To date, there have been no compliance issues.
Since exploration and environmental baseline data collection began, considerable effort was spent developing support for the Project by fostering local relationships, developing a strong local workforce, educating stakeholders about the Project and mining in general and providing stakeholders with regular Project updates and, where appropriate, site visits. This program is still ongoing and has been successful in forming good working relationships with the local communities.
BMSC interacts with the community via a dedicated Community Services function which is staffed by nationals. In addition, a Public Relations and corporate social responsibility function is in place.
| PJ/ABE/ADD/CCS/AAN/NMW/CAE | Bisha_2016R&R-Update_TechRep_2CN010-024_20170808_aan_cae | August 2017 |
| SRK Consulting |
| NI 43-101 Technical Report Bisha Mine 2016, Eritrea | Page 41 |

Source: AGP, 2014
Figure 3.1: Location map
| 3.2 | Mining Rights in Eritrea |
Within the State of Eritrea, property title is granted in Agreements with the State of Eritrea under the provisions of Proclamation No. 68/1995 “A Proclamation to Promote the Development of Mineral Resources.”
Licences are granted and identified according to the level of exploration work completed on a property. Properties are granted under the following licence types: prospecting licences, exploration licences, or mining licences. Properties can be obtained under one type of licence and can be converted to the subsequent type if all obligations are met and the titleholder is not in breach of any provisions of the Proclamation and the appropriate application (with fees) are submitted.
A Mining Licence entitles the licensee a 90% interest and the State of Eritrea holds the remaining 10% interest, without cost. The State may acquire up to an additional 30% (total not exceeding 40%) by agreement with the licensee and by funding their share of the development and operating costs.
| PJ/ABE/ADD/CCS/AAN/NMW/CAE | Bisha_2016R&R-Update_TechRep_2CN010-024_20170808_aan_cae | August 2017 |
| SRK Consulting |
| NI 43-101 Technical Report Bisha Mine 2016, Eritrea | Page 42 |
Under the Regulation of Mining Operations (Legal Notice 19/1995), the holder of a Mining Licence shall pay the Eritrean government:
| | - Royalty for all minerals produced
- Income tax in accordance with the Proclamation No. 69/1995
- Licence renewal fee
- Annual rental fees for licence areas (as described above)
|
Additionally, the holder of a licence and his contractors shall pay a 0.5% customs duty on all imports into Eritrea of equipment, machinery, vehicles, and spare parts (excluding sedan style cars and their spare parts) necessary for mining operations.
The royalty to be paid by a licensee pursuant to Article 34 (1) of the proclamation shall be as follows:
| | - For precious minerals the royalty is 5.0%
- For metallic and non-metallic minerals including construction minerals, the royalty is 3.5%
- For geothermal deposits and mineral water, the royalty is 2.0%
|
Notwithstanding this law, a lesser rate of royalty may be provided by agreement with the licensing authority, when it becomes necessary to encourage mining activities.
Taxation rates are described in the Proclamation No. 69/1995 “Proclamation to Provide for Payment of Tax on Income from Mining Operations.” A holder of a mining licence shall pay income tax on the taxable income at a rate of 38%. Taxable income is to be computed on a historical accrual accounting basis by subtracting from gross income for the accounting year by taking into consideration all allowable revenue, expenditure, depreciation, which, for tax purposes, is deducted straight-line over four years, reinvestment deduction and permitted losses.
If any licensee transfers or assigns, wholly or partially, any interest in the licence, the proceeds shall be taxable income to the extent that such consideration exceeds the amount of his un-recovered expenditure.
Withholding taxes and personal income taxes of non-residents of Eritrea are identified within the proclamation. If the licensee contracts a company or person, who is not resident in Eritrea for services in Eritrea, the licensee will pay taxes on behalf of such a person. Taxes will be paid at the rate of 10% on the amount paid. For the purposes of this article in the proclamation, a person is temporarily present in Eritrea if he performs work in the country for more than 183 days in any accounting year. The compensation received by an expatriate employee of the licensee or his contractor shall be subject to an income tax at a flat rate of 20%.
The holder of a Mining Licence producing exporTable minerals can open and operate a foreign currency account in Eritrea and retain abroad a portion of his earnings to be able to pay for importation of machinery, pay for services, for reimbursement of loans and for compensation of employees and other activities that may contribute to enhancement of the mining operations.
| PJ/ABE/ADD/CCS/AAN/NMW/CAE | Bisha_2016R&R-Update_TechRep_2CN010-024_20170808_aan_cae | August 2017 |
| SRK Consulting |
| NI 43-101 Technical Report Bisha Mine 2016, Eritrea | Page 43 |
The Property comprises of two mining licences covering an area of 24.0 km2, (16.5 km2 over the Bisha Main and the Northwest Zone and 7.5 km2 over Harena) and a mining agreement area covering an area of 39 km2). BMSC is the operator for all of the licences.
In October 2012, BMSC purchased the Mogoraib EL from Sanu Resources Ltd. In the first year of tenure, this licence covered 97.4 km2, which was subsequently reduced by 25% yearly increments in accordance with Eritrean policy until 2016. In July 2016, the Mogoraib EL was expanded to an area of 631 km2 and tenure extended to July 2021 (three years without area reduction followed by 2, one year area reductions of 25%).
The Tabakin EL was obtained in July 2016. The tenure of this EL is valid for ten years, to July 2026, and includes an area of 184 km2. No area reductions apply for this ten-year period.
The licence areas that form the Property are shown in Figure 3.2. The mining tenements are summarised in Table 3.1. The expenditure requirements for the Mogoraib EL and the Tabakin EL are provided in Table 3.2 and Table 3.3 respectively.
| PJ/ABE/ADD/CCS/AAN/NMW/CAE | Bisha_2016R&R-Update_TechRep_2CN010-024_20170808_aan_cae | August 2017 |
| SRK Consulting |
| NI 43-101 Technical Report Bisha Mine 2016, Eritrea | Page 44 |
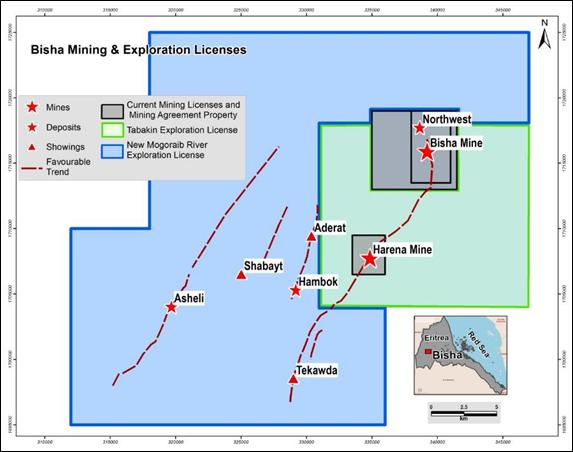
Source: Nevsun, 2016
Figure 3.2: Land tenure map
Table 3.1: BMSC mining tenements
| | Tenement | Area (km2) | Grant Date | Expiry Date |
| | Bisha Mining Licence | 16.5 | 26 March 2008 | 11 Dec 2027 |
| | Harena Mining Licence | 7.5 | 6 July 2012 | 05 July 2022 |
| | Bisha Mining Agreement Area | 46.5 | 5 July 2012 | 11 Dec 2027 |
| | New Mogoraib EL | 631.0 | 25 July 2016 | 24 July 2021 |
| | Tabakin EL | 184.0 | 25 July 2016 | 24 July 2026 |
| PJ/ABE/ADD/CCS/AAN/NMW/CAE | Bisha_2016R&R-Update_TechRep_2CN010-024_20170808_aan_cae | August 2017 |
| SRK Consulting |
| NI 43-101 Technical Report Bisha Mine 2016, Eritrea | Page 45 |
Table 3.2: New Mogoraib EL expenditure requirements
| | Year | Required Expenditure
($) |
| | 2016–2017 | 630,500 |
| | 2017–2018 | 1,261,000 |
| | 2018–2019 | 2,522,000 |
| | 2019–2020 | 3,783,000 |
| | 2020–2021 | 4,255,875 |
| | 2021–2022 | 4,255,875 |
| | 2022–2023 | 6,383,813 |
| | 2023–2024 | 4,787,859 |
| | 2024–2025 | 3,590,895 |
| | 2025–2026 | 2,693,171 |
| | Total | 34,163,987 |
| | Note: Year end occurs on 25 July and EL is assumed to be renewed with 25% area reductions post July 25, 2021. |
Table 3.3: Tabakin EL expenditure requirements
| | Year | Required Expenditure
($) |
| | 2016–2017 | 184,000 |
| | 2017–2018 | 368,000 |
| | 2018–2019 | 736,000 |
| | 2019–2020 | 1,472,000 |
| | 2020–2021 | 2,208,000 |
| | 2021–2022 | 2,944,000 |
| | 2022–2023 | 5,888,000 |
| | 2023–2024 | 5,888,000 |
| | 2024–2025 | 5,888,000 |
| | 2025–2026 | 5,888,000 |
| | Total | 31,464,000 |
| | Note: Year end occurs on 25 July. |
BMSC have the exclusive right to apply for and be granted multiple Mining Licences within the Mining Agreement Area. The Mining Agreement entitles BMSC to apply for a mining licence valid for a period of up to 20 years, with renewal periods of up to ten years providing:
| | - Sufficient ore has been defined to demonstrate continued economic viability of Mining Operations
- BMSC has fulfilled the obligations specified in the Mining Licence and the Mining Agreement
- BMSC is not in breach of any provision of the Mining Proclamation and which would constitute grounds for suspension or revocation of the Mining Licence
|
| PJ/ABE/ADD/CCS/AAN/NMW/CAE | Bisha_2016R&R-Update_TechRep_2CN010-024_20170808_aan_cae | August 2017 |
| SRK Consulting |
| NI 43-101 Technical Report Bisha Mine 2016, Eritrea | Page 46 |
The Eritrean Ministry of Energy and Mines (the Ministry) granted the Bisha Mining Licence on 26 May 2008 and is valid for a period of 20 years. The Harena Mining Licence was granted on 06 July 2012 and is valid for a period of up to ten years, with renewal periods of up to ten years.
An Exploration Licence may be converted to a Mining Licence upon the acceptance by the State of Eritrea of an appropriate feasibility study and Environmental Impact Assessment (EIA) report.
The annual rental fee for an Exploration Licence is 53,200 Nakfa, and the annual licence renewal fee is 6,000 Nakfa (about $3,500 and $400), respectively.
BMSC has surveyed the boundaries of the Mining Licence Area in accordance with the Mining Proclamation law. BMSC is not required to survey the Mining Agreement Area or to place Mining Agreement Area boundary markers. Similarly, exploration licences do not require survey.
In December 2007, BMSC concluded a confidential Mining Agreement with the Government of the State of Eritrea containing all the normal provisions governing the future development and operations for the Bisha Property.
SRK reviewed the confidential document and is satisfied that the terms of the agreement are consistent with the assumptions used in the Mineral Reserve estimation and economic analysis.
| 3.5 | Permits and Authorisation |
For the mining operations, grant of the mining lease provided permission to construct and operate the Bisha Mine. A permit has been granted for use of water from the Mogoraib River and construction of necessary water diversion structures.
These permits are sufficient to ensure that mining activities at Bisha are conducted in accordance with the appropriate National laws. BMSC has conditional approval for the Mining Licence for Harena subject to completion of detailed geotechnical design, hydrogeological studies, and waste rock characterisation testing by the end of December 2012. BMSC completed these studies and results were duly submitted to the relevant authorities before the end of 2012.
BMSC commenced the process for the mine development portion of the Project in 2004, undertaking environmental and socioeconomic baseline studies and an environmental assessment.
The Ministry approved the Terms of Reference for the project environmental and SEIA in March 2006. A SEIA report was completed in December 2006 and submitted to the Ministry.
A Mining Licence for the Project was issued on 26 May 2008. The conditional mining licence for Harena was granted in July 2012. At this time, the Project has all necessary permits and authorisations to operate the mine.
| PJ/ABE/ADD/CCS/AAN/NMW/CAE | Bisha_2016R&R-Update_TechRep_2CN010-024_20170808_aan_cae | August 2017 |
| SRK Consulting |
| NI 43-101 Technical Report Bisha Mine 2016, Eritrea | Page 47 |
| 3.6 | Environmental Considerations |
The key environmental issues assessed by the SEIA studies and the associated risk assessments and environmental management plan for the Project are as follows:
| | - Direct footprint disturbance of 737.4 ha with associated potential for loss of land use, habitat, soils loss and drainage disturbance;
- Groundwater impacts from both extraction of Project supply water from new wells and excavation of an open pit;
- Water quality impacts arising from potential for acid rock drainage (ARD), including the need to ensure that there is adequate post closure monitoring to ensure no post-closure problems with water quality;
- Soil and water quality impacts arising from the storage and use on site of hazardous chemicals, including cyanide;
- Changes to local surface drainage patterns due to construction of a site surface water management system, including flood control and diversion works; and
- Air quality impacts, most significantly from surface haulage on unsealed roads.
|
BMSC has arranged an annually renewable environmental bond of $40M at a cost of 1% per annum. BMSC, in accordance with International Financial Reporting Standards, has accrued $38.3M in its financial records as of 31 March 2017, as a provision for reclamation, remediation and post-closure monitoring.
| PJ/ABE/ADD/CCS/AAN/NMW/CAE | Bisha_2016R&R-Update_TechRep_2CN010-024_20170808_aan_cae | August 2017 |
| SRK Consulting |
| NI 43-101 Technical Report Bisha Mine 2016, Eritrea | Page 48 |
Since exploration and environmental baseline data collection began, considerable effort was spent developing support for the Project by fostering local relationships, developing a strong local workforce, educating stakeholders about the Project and mining in general and providing stakeholders with regular Project updates and, where appropriate, site visits. The key socio-economic issues assessed by the SEIA study and addressed in the proposed social management and related plans are as follows:
| | - Direct footprint disturbance of 737.4 ha with associated potential for displacement of people and their customary use of the land (although it is noted that the affected area is sparsely populated and only lightly used)
- Influx of people seeking employment with associated potential issues, including pressure on existing social infrastructure
- Inward investment and creation of direct and indirect employment opportunity
- To December 31, 2016, the total land rehabilitated was 73.6 ha, including initial rehabilitation (14.5 ha) and offset biodiversity planting (59.1 ha)
|
| PJ/ABE/ADD/CCS/AAN/NMW/CAE | Bisha_2016R&R-Update_TechRep_2CN010-024_20170808_aan_cae | August 2017 |
| SRK Consulting |
| NI 43-101 Technical Report Bisha Mine 2016, Eritrea | Page 49 |
| 4. | Accessibility, Climate, Local Resources, Infrastructure and Physiography |
Summary
The Bisha Project is located on a flat to rolling, desert-like plain in the Gash-Barka Region of Eritrea, 237 km by road from the capital, Asmara by paved and all-weather unpaved roads. The principal port for concentrate export is Massawa, a further 113 km from Asmara.
The project area has a hot desert climate with an annual rainfall of 260 mm, mainly falling from June to September. There are few local resources in the Bisha area; the main centre for mining and exploration support is Asmara.
Current onsite operation infrastructure comprises an open pit, process plant, tailings and waste-rock storage facilities, offices and warehouses, medical clinic, maintenance and laboratory facilities, fuel and reagent storage areas, diesel power plant, water supply borefields, and an airstrip. Container port and ship-loading facilities for concentrate are located at Massawa.
The project area has a hot desert climate with an annual rainfall of 260 mm, mainly falling from June to September. The main centre for mining and exploration support is Asmara.
Access to the Property is by paved road from Asmara to Akordat, and then from Akordat via an all-weather unpaved road, which is currently being upgraded. The drive from Asmara to the Bisha Village by light vehicle takes approximately four hours. The main distances by road to the Bisha Property are summarised in Table 4.1. The principal port for export of concentrate and importation of heavy equipment is Massawa on the Red Sea coast, which is 113 km by paved two-lane highway from Asmara.
Table 4.1: Distances by road from Asmara to the property
| | From | To | Distance (km) | Condition |
| | Asmara | Akordat | 181 | Paved two-lane highway |
| | Akordat | Adi Ibrahim | 28 | Paved, all-weather road |
| | Adi Ibrahim | Hashakito | 19 | All-weather road, half paved |
| | Hashakito | Bisha Village | 5 | Paved, all-weather road |
| | Bisha Village | Bisha Minesite | 4 | Unpaved, all-weather road |
| | Total | 237 | |
| PJ/ABE/ADD/CCS/AAN/NMW/CAE | Bisha_2016R&R-Update_TechRep_2CN010-024_20170808_aan_cae | August 2017 |
| SRK Consulting |
| NI 43-101 Technical Report Bisha Mine 2016, Eritrea | Page 50 |
The climate in the Project area is semi-arid, with elevated temperatures year-round (Figure 4.1). During the hot season in April and May, the average temperature is +42°C, although temperatures may rise to +50°C for short periods. The main rainy season is between June and September, and periodic flooding of the Mogoraib and Barka rivers can result in spectacular flash floods. Occasional rain may also fall during April and May. Total rainfall is sparse, with an annual precipitation between 250 mm and 300 mm. Average evaporation amounts to just under 1900 mm.
The rainy season causes periodic, short-lived difficulty in travel off the main highways, although exploration work is possible year-round. During the period of exploration work by BMSC, the precipitation has only occasionally been sufficient to flood the local rivers. All mining activities are planned on a year-round basis.

Source: BMSC Rainfall data 2004 to 2016; temperature data 2010 to 2016
Figure 4.1: Average monthly temperature and rainfall, Bisha Village weather station
| 4.3 | Local Resources and Infrastructure |
In 2004, Klohn Crippen Berger Ltd. (Klohn Crippen, 2004) conducted a preliminary land-use survey near the proposed mine site. It was determined that approximately 96% of the area was used by local herders as pasture for livestock, and used seasonally for activities including agriculture (dryland crops), domestic livestock migration, and accessing wells and burial sites. Currently, the land is overgrazed, which is related to ongoing drought conditions and pressures from livestock foraging. This study was conducted in consultation with people from local communities.
| PJ/ABE/ADD/CCS/AAN/NMW/CAE | Bisha_2016R&R-Update_TechRep_2CN010-024_20170808_aan_cae | August 2017 |
| SRK Consulting |
| NI 43-101 Technical Report Bisha Mine 2016, Eritrea | Page 51 |
An additional survey was conducted in February 2006 for the six communities within the Bisha area; these included Tekeret, Adi-Ibrihim, Hashakito, Jimmel, Adarat-Harenay and Takawda. Most of the people in the region are located in permanent settlements, but utilise the Bisha area as one of the many used for grazing livestock, planting crops, and accessing watering areas, which in some cases involves migrating distances up to 200 km, as herders move through the region in search of suitable grazing lands.
The village of Mogoraib is the local administration centre for the Dighe Sub-zone within the Gash-Barka Region. The village has a small refugee resettlement site, and subsidiary military and commercial interests. The village contains a well-equipped, eight-person health centre with a nursing staff capable of taking care of small medical problems in preparation for referring patients to larger, better-equipped hospitals in Akordat and Keren. Camp Mogoraib is a military training site located just outside the village boundaries. With the presence of the mine development and exploration project at Bisha, this camp has been re-activated as a security post from its previous care/maintenance basis.
Few basic goods are commercially available in the region, either in Mogoraib or in Akordat. The main centre for support of exploration and project development is the capital city, Asmara.
The local population has no exploration or mining culture, and training of local staff is ongoing.
Current onsite operation infrastructure includes:
| | - Open pit
- Process plant
- Tailings management and waste-rock storage facilities
- Offices
- Maintenance and laboratory facilities
- Fuel storage areas
- Diesel power plant
- Airstrip
|
Additional information regarding the on-site infrastructure is provided in Section 17 of this report.
In addition, BMSC’s off-site infrastructure comprises container port and ship-loading facilities at the port of Massawa.
| PJ/ABE/ADD/CCS/AAN/NMW/CAE | Bisha_2016R&R-Update_TechRep_2CN010-024_20170808_aan_cae | August 2017 |
| SRK Consulting |
| NI 43-101 Technical Report Bisha Mine 2016, Eritrea | Page 52 |
Electric power for the mine and processing plant site is supplied from a diesel-fuelled power station located adjacent to the process facilities. The container port near Massawa receives power from the local utility.
Process water is sourced from recycling within the plant, and additional needs are supplemented from freshwater sources. The process was designed to maximise the recycle of process water, and included installing a tailings slurry thickener to recover process water prior to pumping to the tailings containment system. This approach served to minimise the evaporation losses that result with the typically large water surface area in tailings containment systems. Even though evaporation rates in this region are very high, a tailings-management facility, supernatant water reclaim pumping-system is installed to reclaim seasonal decant water from this source. In addition, water from the pit is pumped to the process plant, which further reduces dependence on raw water.
Freshwater is supplied to the property from groundwater. Two well farms have been established by BMSC, the first approximately 1 km south of the open pit on the western bank of the non-perennial Fereketetet River (which also serves to dewater the Bisha Main pit), and the second 5 km to the west, adjacent to the Mogoraib River. PoTable water sourced from the well fields is pumped to a potable water plant utilising chlorination filtration and ultraviolet radiation treatment.
Current site communication is via radio and a satellite communications system.
The Property is located on a flat to rolling, desert-like plain along the western foot of the Central Highlands (Figure 4.2). The plain is at 560 m amsl and contains scattered vegetation and few trees. Steep hills and ridges rise above the plain; the Bisha, Wade, and Neve peaks reach elevations of up to 1,226 m amsl above the alluvial plain at the southern boundary of the Property. A smaller seasonal tributary, the Fereketetet River, flows north-northwest into the Mogoraib River. The Fereketetet River crosses the Property and passes immediately west of the Bisha Gossan Zone. The property has sufficient power and water to sustain the mining operation, and that the surface rights and tailings storage are adequate to support the continuing mining activities.
| PJ/ABE/ADD/CCS/AAN/NMW/CAE | Bisha_2016R&R-Update_TechRep_2CN010-024_20170808_aan_cae | August 2017 |
| SRK Consulting |
| NI 43-101 Technical Report Bisha Mine 2016, Eritrea | Page 53 |

Source: AGP, 2014
Figure 4.2: Panorama of Bisha Main processing plant and adjacent landscape
| PJ/ABE/ADD/CCS/AAN/NMW/CAE | Bisha_2016R&R-Update_TechRep_2CN010-024_20170808_aan_cae | August 2017 |
| SRK Consulting |
| NI 43-101 Technical Report Bisha Mine 2016, Eritrea | Page 54 |
| 5.1 | Nevsun and BMSC 1998 to 2012 |
In late 1996, Ophir Ventures, a private Canadian company, conducted prospecting in the Bisha area that resulted in the discovery of the surface exposure of the Bisha Main deposit.
Nevsun was granted a prospecting licence for Bisha Main in May 1998; the Bisha Main deposit was discovered in November 2002 by diamond drilling of coincident geophysical and geochemical anomalies associated with a prominent gossan that locally had highly anomalous gold values.
Between 2003 and 2006, 403 diamond drill and 33 reverse circulation holes were completed at Bisha Main to enable completion of a feasibility study. Additional work included mapping, geochemical sampling, trenching, ground and airborne geophysics, metallurgical testwork and environmental baseline studies.
In 2006, BMSC was created with ownership as 60% Nevsun and 40% ENAMCO. Exploration and resource development drilling continued through to 2009. The Northwest and Harena deposits were discovered with 26 and 27 diamond holes respectively being drilled.
In 2009 and 2010, 35 mainly geotechnical holes were completed at Bisha Main and 51 holes were completed at Harena to better define the oxide zone. Thirteen diamond drillholes were drilled to test gravity targets in the Harena area. No significant mineralisation was intersected.
In 2011, 167 diamond drillholes were drilled at Bisha Main for resource definition, metallurgical and geotechnical studies. At Harena, five regional exploration holes were drilled to test coincident gravity/EM/soil geochemical anomalies with no significant mineralisation being encountered. At Northwest, 22 additional diamond drillholes were drilled.
The Bisha Main CIL plant (Stage I) was commissioned in October 2010, and commercial production achieved by February 2011. Construction of a copper flotation circuit (Stage II) was completed in June 2013; copper supergene ore processing commenced in September 2013 with the first shipment of copper concentrate in October 2013 via the port of Massawa.
In 2012, 75 diamond drillholes were drilled and a maiden resource estimate completed. At Harena, exploration diamond drilling included a total of six diamond drillholes with one of the holes intersecting mineralisation peripheral to the Harena open pit. Open pit mining from October 2012 to June 2013 extracted 620,671 tonnes at 0.96 g/t Au that was processed at the Bisha Main plant. The pit is 340 m long, 200 m wide and has a maximum depth of 40 m.
Sanu Resources Ltd., a subsidiary of NGEx Resources of Canada, commenced a regional stream‐sediment sampling and prospecting program in 1998 and identified a number of gold anomalies, as well as, a large gossan (siliceous breccia) at Hambok to the west of Harena. Sanu applied for the Mogoraib River Exploration License in early 2003 (Figure 5.1) and revisited the gossan outcrops ultimately discovering the Hambok deposit.
| PJ/ABE/ADD/CCS/AAN/NMW/CAE | Bisha_2016R&R-Update_TechRep_2CN010-024_20170808_aan_cae | August 2017 |
| SRK Consulting |
| NI 43-101 Technical Report Bisha Mine 2016, Eritrea | Page 55 |
In 2006, exploration drilling at Hambok discovered a massive sulphide deposit to the south of the siliceous breccia outcrop and from that point onward, Hambok became the main focus of exploration activities for Sanu. Work programs included soil sampling, EM, magnetic and gravity surveys and drilling. From 2006 to 2009, Sanu completed 27 diamond drillholes (8,962 m) and 42 RC drillholes (2,675 m) at Hambok defining a resource.
At Aderat, located 4 km north of Hambok, prospecting and soil sampling in 2005 and 2006 defined a small Cu-Zn anomaly. Sanu drilled the anomaly with four diamond holes in 2008, of which one hole (ANK-06) returned 47 m @ 1.2% Zn and 27 m @ 3.56% Zn, 0.75% Cu and 0.87 g/t Au.
At Asheli, rock chip samples returned anomalous gold and base metals values. A coincident gravity signature and EM conductor were thought to represent a potential massive sulphide body. Four diamond holes for 520 m were drilled. Results of the drilling showed gold and silver mineralisation in two holes, one of which had an intersection of 22 m at 1.58 g/t Au.

Source: AGP, 2014
Figure 5.1: Geological map of Mogoraib River EL with prospects
Exploration work by Sanu continued to October 2012, when BMSC purchased the Mogoraib River EL. In the first year of tenure, this licence covered some 97.4 km2, which was subsequently reduced by 25% yearly increments in accordance with Eritrean policy. The area of the Mogoraib River EL is currently covered by BMSC’s New Mogoraib Exploration Licences which was granted in 2016.
| PJ/ABE/ADD/CCS/AAN/NMW/CAE | Bisha_2016R&R-Update_TechRep_2CN010-024_20170808_aan_cae | August 2017 |
| SRK Consulting |
| NI 43-101 Technical Report Bisha Mine 2016, Eritrea | Page 56 |
| 5.3 | Historical Resource Estimates |
Mineral resource estimates have been prepared for the Bisha Project in 2005, 2006, 2001 and 2013. All historical Mineral Resources are summarised in technical reports filed on Sedar. The 2013 Mineral Resources for the Project prepared by AGP are summarised in Table 5.1 for reference. The AGP Mineral Resources were estimated by ordinary kriging. The historical estimate used Mineral Resource categories as outlined in NI 43-101. The historical resources are relevant but are superseded by the Mineral Resources presented in Section 13 of this report and as such should not be relied upon.
Nevsun updates the Bisha resource estimate each year, disclosing them within news releases that can be located on their website:
| | - 2015 – Bisha Mineral Resource Update, effective December 2015
- 2014 – Bisha Mineral Resource Update, effective December 2014
- 2013 – Bisha Mineral Resource Update, effective December 2013
|
Table 5.1: Combined Mineral Resource statement for Bisha Main, Harena, Northwest and Hambok deposits, Eritrea, as of 31 December 2013
| | Domain | Quantity (000s t) | Grade |
| | (% Zn) | (% Cu) | (g/t Au) | (g/t Ag) |
| | Indicated |
| | Oxide | 480 | - | - | 6.6 | 20.0 |
| | Supergene | 8,480 | - | 3.4 | 0.6 | 25.0 |
| | Primary | 32,260 | 4.6 | 1.5 | 0.6 | 36.0 |
| | Total Indicated | 41,220 | 3.6 | 1.9 | 0.7 | 33.6 |
| | Inferred |
| | Oxide | 570 | - | - | 3.4 | 19.0 |
| | Supergene | 110 | - | 1.4 | 3.4 | 18.0 |
| | Primary | 1,752 | 4.2 | 0.8 | 0.7 | 33.0 |
| | Total Inferred | 2,432 | 3.0 | 0.6 | 1.5 | 29.0 |
In 2013, diamond drilling consisted of 27,828 m of exploration and resource development drilling at Bisha Main, the Northwest deposit and Hambok. At Bisha Main, 23 holes for 6,223 m were completed in the immediate Bisha area testing geophysical targets. A further eight holes tested below the northern portion of the Bisha Main deposit. Drilling concluded at Northwest with 93 holes being completed. At Hambok, eight holes were completed to infill areas of the deposit that had large gaps in the geological model. This work allowed for a new open pit constrained Mineral Resource estimate to be completed.
| PJ/ABE/ADD/CCS/AAN/NMW/CAE | Bisha_2016R&R-Update_TechRep_2CN010-024_20170808_aan_cae | August 2017 |
| SRK Consulting |
| NI 43-101 Technical Report Bisha Mine 2016, Eritrea | Page 57 |
A zinc flotation circuit (Stage III) was commissioned in June 2016, with the first shipment of zinc concentrate in September 2016 and commercial production achieved by October 2016. Production statistics are presented in Table 5.2 to Table 5.4.
Table 5.2: Bisha Main Stage I gold production
| | Year | Ore Processed
(t) | Grade
(g/t Au) | Contained Metal
(oz Au doré) |
| | 2011 | 1,806,000 | 7.4 | 379,000 |
| | 2012 | 1,807,000 | 6.2 | 313,000 |
| | 2013 | 887,000 | 3.4 | 92,000 |
| | Total | 4,500,000 | 6.3 | 784,000 |
Table 5.3: Bisha Main Stage II copper production
| | Year | Ore Processed
(t) | Grade
(% Cu) | Contained Metal
(t Cu) |
| | 2013 | 767,000 | 3.9 | 47,500 |
| | 2014 | 1,789,000 | 5.9 | 88,900 |
| | 2015 | 1,929,000 | 3.9 | 61,600 |
| | 2016 | 1,055,000 | 2.8 | 26,500 |
| | Total | 5,540,000 | 4.3 | 224,500 |
Table 5.4: Bisha Main Stage III zinc production
| | Year | Ore Processed
(t) | Grade
(% Zn) | Contained Metal
(t Zn) |
| | 2016 | 1,223,000 | 5.7 | 25,600 |
| | Total | 1,223,000 | 5.7 | 25,600 |
| PJ/ABE/ADD/CCS/AAN/NMW/CAE | Bisha_2016R&R-Update_TechRep_2CN010-024_20170808_aan_cae | August 2017 |
| SRK Consulting |
| NI 43-101 Technical Report Bisha Mine 2016, Eritrea | Page 58 |
| 6 | Geological Setting and Mineralisation |
The BMSC projects are located within the 0.85 Ga to 0.55 Ga Arabian-Nubian Shield (ANS) (Barrie et al., 2007) (Figure 6.1). The ANS underlies an area of 1.4 million km2 in the Middle East and northern Africa, exposed on either side of the Red Sea and comprises a collage of volcanic arcs, granitoid intrusions, volcano-sedimentary basins, and shear zones (Johnson and Slone, 2013). Over 50 Cu Zn-Pb-Au volcanic-hosted massive sulfide deposits occur in the ANS, which in Eritrea include the Bisha Main, Harena, Northwest, Hambok and Asheli deposits (all BMSC).
| PJ/ABE/ADD/CCS/AAN/NMW/CAE | Bisha_2016R&R-Update_TechRep_2CN010-024_20170808_aan_cae | August 2017 |
| SRK Consulting |
| NI 43-101 Technical Report Bisha Mine 2016, Eritrea | Page 59 |
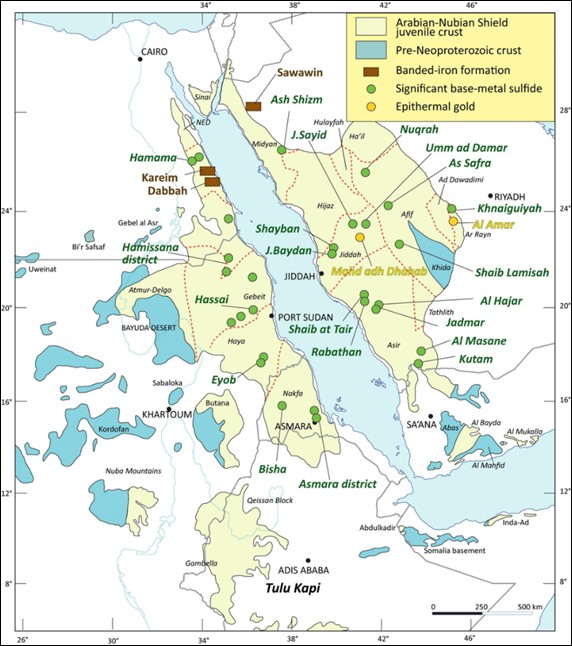
Source: Johnson and Slone, 2013
Figure 6.1: Location and mineralisation of the Arabian-Nubian Shield
The southern ANS in Eritrea comprises four terranes, each with characteristic stratigraphy and structural character (Figure 6.2) (De Souza Filho and Drury, 1998; Barrie et al., 2007). The terranes are separated by north-south trending shear belts, which represent high strain zones formed by complex multiple deformations with strong east-west compression.
The Nakfa terrane consists predominantly of granitoid-greenstone belts and low-grade volcanic and sedimentary rock, and is separated from the Barka and Hagar terranes to the west by the Augaro-Adobha Belt (AAB). The AAB trends NNE-SSW, has a strike length of over 300 km and hosts the Bisha Project.
| PJ/ABE/ADD/CCS/AAN/NMW/CAE | Bisha_2016R&R-Update_TechRep_2CN010-024_20170808_aan_cae | August 2017 |
| SRK Consulting |
| NI 43-101 Technical Report Bisha Mine 2016, Eritrea | Page 60 |
The AAB is highly deformed with double plunging sheath folds, and planar foliations containing shallow plunging stretching lineations. The northern and central AAB is dominated by a north-trending sheath fold, with an axial trace extending some 120 km. Mylonitic fabrics are common in the AAB, dominated by sinistral strike-slip shear (Ghebreab, 1996).
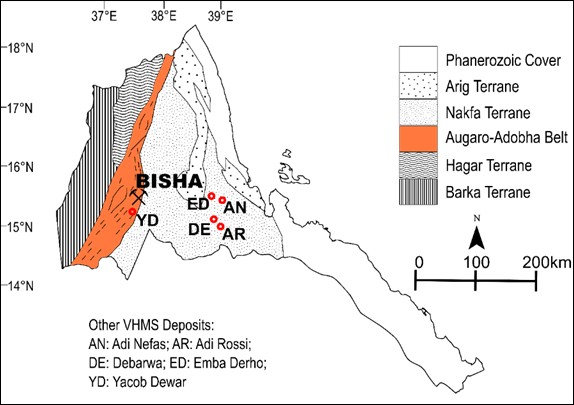
Source: Barrie et al., 2007
Figure 6.2: Neoproterozoic Terranes of Eritrea and selected VMS deposits
The Property is underlain by Neoproterozoic upper green schist to lower amphibolite facies volcanics and sedimentary units of the Augaro-Adobha Belt. The stratigraphy comprises a lower sedimentary sequence of carbonates and fine-grained siliciclastic rocks, including siliceous iron formation; an overlying volcanic sequence of mafic to felsic lapilli and ash crystal lapilli tuffs with intercalated minor mafic flows and hyaloclastite; and an uppermost sequence of fine-grained volcaniclastic and siliciclastic rocks (Figure 6.3).
In the volcanic sequence, rhyolites are the predominant volcanic rock type. These are mostly tuffs, with minor blocky flows and agglomerates. Dacites comprise approximately 5% of the volcanic strata. Other volcanic rocks include tholeiitic basalts. The strata are cut by Neoproterozoic granite-syenite intrusions and minor mafic dykes/sills, and by Cenozoic felsic and mafic dykes. One suite of quartz and feldspar phyric rhyolite/granite dykes is texturally and chemically distinct from the other felsic strata. They occur as rhyolite porphyry, or as granitic rocks.
| PJ/ABE/ADD/CCS/AAN/NMW/CAE | Bisha_2016R&R-Update_TechRep_2CN010-024_20170808_aan_cae | August 2017 |
| SRK Consulting |
| NI 43-101 Technical Report Bisha Mine 2016, Eritrea | Page 61 |
The volcanic sequence hosts the volcanic hosted massive sulphide deposits of Bisha Main, Harena, Northwest, Hambok and Asheli. In the footwall of these deposits, the sequence is bimodal mafic and felsic volcanic rocks, whereas in the hanging wall felsic lithologies predominate.
The Bisha Gabbroic Complex is a large, partly layered, tholeiitic gabbro–gabbro–norite intrusion that forms high hills in the central and southern part of the Property. The complex extends in a north–northeast to south–southwest orientation for 25 km, and has a maximum width of approximately 12 km. The complex is probably coeval or nearly coeval with the strata.
The rock units generally trend north–northeast, with moderate to steep dips to the east and west (Figure 6.4). The Bisha Gabbroic Complex broadly forms a north-plunging antiform that appears overturned, with dips generally steep to the east. It appears that volcanic and sedimentary strata were thrust against this buttress from the west-southwest, forming a nappe-like structure, with internal antiforms and synforms on a scale of hundreds of metres.
The stratigraphy and principal tectonic fabrics at the Property have been disrupted, at least locally, by late-stage brittle faults. Because of the relatively poor exposure in the area, these are expressed in the main as well-developed topographic lineaments.
Footwall alteration is typically pervasive quartz + chlorite alteration of tuffs, which may extend for tens of metres below massive sulphide units. Immediately below the massive sulphides, there is a thin, but variable, (<3 m thick) zone of silicification and K-feldspar replacement (Chisholm et al, 2003). This zone is more variable in intensity and thickness than the chlorite alteration, and in some cases, is entirely absent. Hanging wall alteration is typically pervasive quartz + muscovite alteration of tuffs, which may extend for tens of metres above massive sulphide units.
Other, rarer alteration mineral assemblages include carbonate, epidote, and albite. These alteration styles range from weak and patchy to strong/intense and pervasive.
| PJ/ABE/ADD/CCS/AAN/NMW/CAE | Bisha_2016R&R-Update_TechRep_2CN010-024_20170808_aan_cae | August 2017 |
| SRK Consulting |
| NI 43-101 Technical Report Bisha Mine 2016, Eritrea | Page 62 |
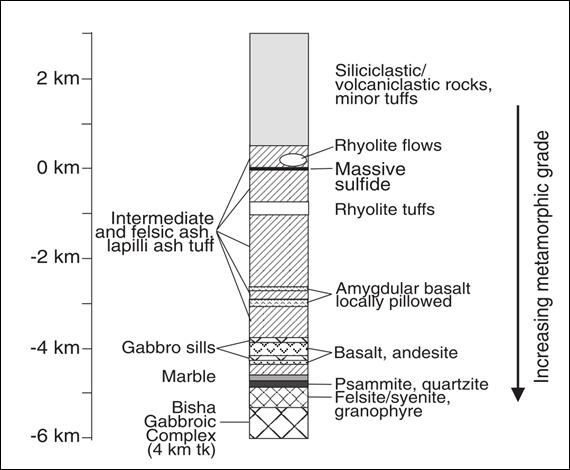
Source: Barrie, 2004
Figure 6.3: Bisha Property stratigraphic section
| PJ/ABE/ADD/CCS/AAN/NMW/CAE | Bisha_2016R&R-Update_TechRep_2CN010-024_20170808_aan_cae | August 2017 |
| SRK Consulting |
| NI 43-101 Technical Report Bisha Mine 2016, Eritrea | Page 63 |
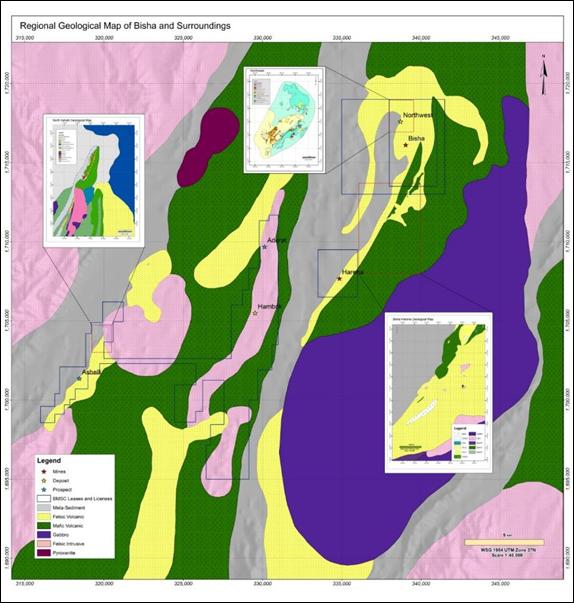
Source: Nevsun, 2017
Figure 6.4: Local geology setting
| 6.3 | Deposit Geology and Mineralisation |
The Bisha Main deposit is a series of four massive sulphide lenses that occur over a 1.2 km north-south trending strike extent. The thickness of the lenses is variable up to 70 m. Mineralisation extends to a depth of 600 m below surface.
The massive sulphide bodies comprise a southern zone and a northern zone (Figure 6.5). The main part of the southern zone strikes approximately 345° and dips steeply to the west, with strike and dip lengths of some 600 m and 500 m respectively. The main part of the northern zone strikes approximately 0° and dips steeply to the west, with strike and dip lengths of some 500 m and 100 m respectively. The southern zone plunges 45° to the south. In the hanging walls of both the southern and northern zones, there are two smaller massive sulphide pods interpreted to be folded limbs of the two main zones.
| PJ/ABE/ADD/CCS/AAN/NMW/CAE | Bisha_2016R&R-Update_TechRep_2CN010-024_20170808_aan_cae | August 2017 |
| SRK Consulting |
| NI 43-101 Technical Report Bisha Mine 2016, Eritrea | Page 64 |
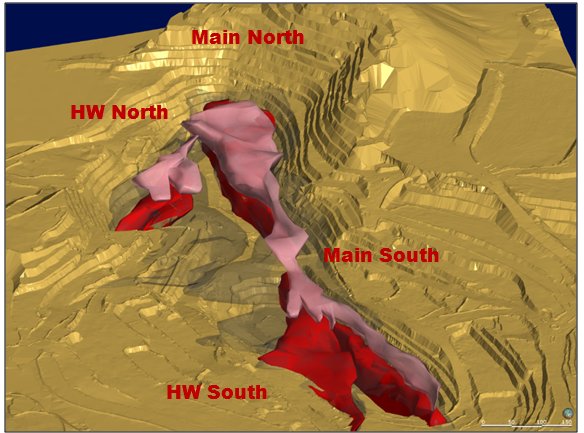
Source: Nevsun, 2017
Note: Looking NE
Figure 6.5: View of Bisha Main massive sulphide, 30 December 2016
The host lithologies are typically strongly foliated rhyolite and rhyolite breccia units interleaved with dark grey, thinly bedded mudstone and polymicitc breccia. The rhyolite association is typical of thick submarine lavas/domes that have coherent cores and quench-fragmented margins. Lithogeochemistry of the mineralised intervals suggests they are upright.
The Bisha Main and Bisha NW massive sulphide deposits formed by means of sub seafloor replacement and impregnation rather that sulphide deposition at the seafloor because: (1) the footwall is strongly to intensely altered and the hanging wall is also strongly altered; (2) the massive sulphide intervals have gradational contacts with “stringer” sulphide both above and below; (3) the massive sulphide appears to occur within thick rhyolite units that do not correspond to seafloor positions (Figure 6.6).
| PJ/ABE/ADD/CCS/AAN/NMW/CAE | Bisha_2016R&R-Update_TechRep_2CN010-024_20170808_aan_cae | August 2017 |
| SRK Consulting |
| NI 43-101 Technical Report Bisha Mine 2016, Eritrea | Page 65 |
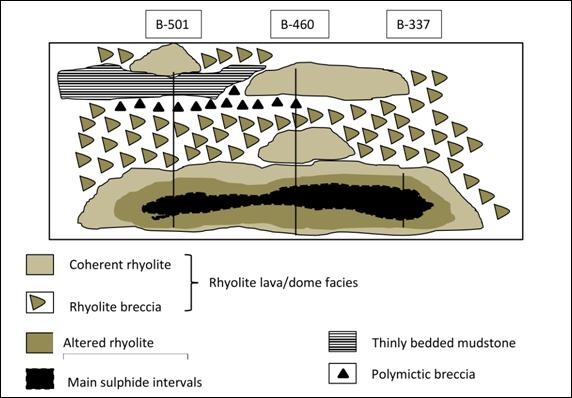
Source: McPhie, 2013
Figure 6.6: Interpreted facies setting for the Bisha Main deposit
The Bisha orebody has been strongly deformed in a complex deformational history with at least four phases. The two hanging wall orebodies are interpreted as being on the west limbs of shallowly SSW plunging open D2 folds that were caused by E-W compression associated with the East African Orogeny (from 700 Ma to 640 Ma, Johnson et al., 2011). These folds were further deformed during D3 with a NE-SW compression. Although the main zones are broadly tabular, in detail the contacts may exhibit open south-plunging fold contacts with amplitudes up to tens of metres which are significant in open pit mining.
The deposit has been deeply weathered, and the weathering profile is complex and locally dependant on lithology and acidic groundwater generated from oxidation of the massive sulphide
Six weathering zones have been defined (Figure 6.7):
| | - Surface Gossan
- Near surface Oxide Zone
- Acid leached zone (locally called “Acid” and “Soap”)
- Poorly consolidated Pyrite Sand
- Supergene copper enrichment zone
- Primary
|
| PJ/ABE/ADD/CCS/AAN/NMW/CAE | Bisha_2016R&R-Update_TechRep_2CN010-024_20170808_aan_cae | August 2017 |
| SRK Consulting |
| NI 43-101 Technical Report Bisha Mine 2016, Eritrea | Page 66 |
The Gossan varies in composition from highly siliceous and ferruginous to massive goethite–hematite–jarosite. The Oxide Zone is up to 50 m deep and is composed of hematite, quartz and clays; in places, original rock textures are preserved. The Oxide zone is enriched in Au, Pb, Ba and Mo and depleted in Cu, Zn, Cd and Co.
The Soap Zone is a white, light yellow or light brown zone, and consists of clay, quartz, barite and possibly anglesite. The Acid Zone is dark grey, and consists of clay, quartz, galena and pyrite. Faint original textures of the protolith may be preserved in both. Both the Acid and the Soap are depleted in Cu, Zn, Cd, Co, Fe and Mn and strongly enriched in Au, Ag, Pb and Ba; they are poorly consolidated and drill recoveries in these zones are generally poor.
The Supergene Zone is up to 20 m thick, and has elevated Cu and Ba and depleted Zn, Cd and Mn. Sphalerite and chalcopyrite are replaced by chalcocite, covellite, digenite and native copper (Ashley, 2013). The Pyrite Sand lies directly above the Supergene Zone and consists of unconsolidated recrystallised pyrite grains; Cu from this Zone has been remobilised and deposited in the Supergene Zone.
Some remobilisation of Cu and Ba from the Primary Zone upwards into the Supergene zone has occurred along steeply dipping basement structures.
The Primary Zone represents the original massive sulphide deposit. The mineralogy is comprised of pyrite and sphalerite, with minor chalcopyrite, covellite, pyrrhotite and galena.
| PJ/ABE/ADD/CCS/AAN/NMW/CAE | Bisha_2016R&R-Update_TechRep_2CN010-024_20170808_aan_cae | August 2017 |
| SRK Consulting |
| NI 43-101 Technical Report Bisha Mine 2016, Eritrea | Page 67 |

Source: Nevsun, 2017
Figure 6.7: Schematic Bisha Main weathering profile
The massive sulphide mineralisation is a tabular body up to 60 m thick that strikes 040° true, dips approximately 60° to the northwest, and plunges shallowly to the southwest (Figure 6.8). It is defined by diamond and minor RC drilling along a strike length of approximately 900 m; the deposit is closed down dip but is open down-plunge to the southwest.
The host rocks to the Harena deposit is a Neoproterozoic bimodal suite of basalts and rhyolite-dacite volcanic rocks. The stratigraphic succession comprises:
| | - A lower footwall unit of rhyolite and dacite tuffs with an intense proximal chlorite-sericite-sillimanite alteration in the immediate footwall of the massive sulphide, and a distal silica-sericite ± biotite alteration;
- At least two stratigraphically distinct massive sulphide units with associated stringer mineralisation on the southeastern or stratigraphically lower side;
|
| PJ/ABE/ADD/CCS/AAN/NMW/CAE | Bisha_2016R&R-Update_TechRep_2CN010-024_20170808_aan_cae | August 2017 |
| SRK Consulting |
| NI 43-101 Technical Report Bisha Mine 2016, Eritrea | Page 68 |
| | - A hanging wall unit of intercalated felsic rocks and fine to medium grained, plagioclase-phyric mafic rocks; there is a distinctive felsic quartz breccia unit along the length of the mineralisation, and the mafic rocks have a moderate silica-chlorite±biotite alteration; and
- An upper sedimentary sequence of graphitic mudstone and greywacke.
|
The rocks are weak to moderately schistose, and small scale folds are also commonly observed in the hanging wall.
The primary massive sulphide units comprise mainly massive sulphide mineralisation with subordinate semi-massive sulphide and volcanic lithologies, and are predominantly made-up of fine to medium-grained subhedral to anhedral pyrite with interstitial and/or enriched layers of sphalerite and chalcopyrite and range from 0.4 m to 100 m thick, averaging 19.8 m. The massive sulphide units have a tabular to lensoidal shape, with the thicker parts of the mineralisation in elongated shallowly SW-plunging shoots. In each massive sulphide unit there is a typical volcanic hosted massive sulphide (VMS) zonation from a Cu-Au-Ag rich base to a Zn-Ba rich top. The associated stringer mineralisation below the massive sulphide occurs in about half the drillholes; where present it is up to 58 m thick and averages 6.6 m. The total mineralised package (massive sulphide plus stringer) averages 23 m thick.
Weathering processes have produced a surface oxide layer 45 m to 50 m thick with associated gossan overlaying a very thin secondary supergene horizon, which grades into a primary massive sulphide horizon at depth. The oxide layer is depleted in Cu and Zn compared to the primary mineralisation, but has elevated Au and Ag. The entire Neoproterozoic sequence is almost completely covered by Quaternary alluvial sediments and soil up to 10 m thick.
| PJ/ABE/ADD/CCS/AAN/NMW/CAE | Bisha_2016R&R-Update_TechRep_2CN010-024_20170808_aan_cae | August 2017 |
| SRK Consulting |
| NI 43-101 Technical Report Bisha Mine 2016, Eritrea | Page 69 |
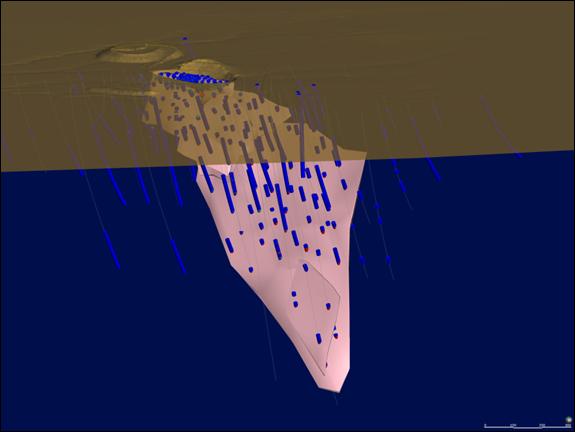
Source: Nevsun, 2017
Figure 6.8: Harena massive sulphide and drilling viewed from south-west
The Northwest deposit (Figure 6.9) comprises a series of poly-metallic massive sulphide lodes that have been defined over a strike length of 800 m (Figure 6.10), striking northeast, and dipping from 70° northwest to sub-vertical. The deposit is thickest at the centre, tapering to widths of less than 8 m at its strike limits. The central portion of the deposit is over 85 m wide. In cross-section, the deposit is a wedge that narrows down-dip. Resource drilling has effectively defined the deposit to a maximum of 250 m below surface. Exploration drilling indicates that a mineralised stringer vein system still exists at depths of 350 m below surface.
The Northwest deposit can be subdivided into three domains. The northern Main Lode is the largest domain, being a copper-dominated massive- and semi-massive sulphide lode that increases in zinc content northwards. The Southern Lode is a zinc- dominated, discontinuous massive- and semi-massive sulphide body. As with the Bisha Main deposit, pyrite is the main sulphide component of the VMS deposit.
A separate narrow VMS lode has been defined on the footwall side of the Northwest deposit (Eastern Lode). The Eastern Lode is poorly drill defined, but for its width carries appreciable copper and zinc base metal grades. The Eastern Lode is at the earliest stages of being defined and understood.
| PJ/ABE/ADD/CCS/AAN/NMW/CAE | Bisha_2016R&R-Update_TechRep_2CN010-024_20170808_aan_cae | August 2017 |
| SRK Consulting |
| NI 43-101 Technical Report Bisha Mine 2016, Eritrea | Page 70 |
As with the Bisha Main deposit, Northwest has a gold oxide cap and supergene copper zone. These parts of the stratigraphy are not as well endowed as Bisha Main in gold, silver, and copper, reflecting the overall lower grade of the underlying Northwest primary mineralisation. The oxide profile is still problematic due to core recovery problems during drilling, a problem also encountered across the Bisha Main deposit. At this stage, there is still significant potential for resource upgrade in the oxide and supergene portions of the Northwest deposit through infill drilling of areas of poorest core recovery.

Source: AGP, 2014
Figure 6.9: Location of Northwest Deposit project area
| PJ/ABE/ADD/CCS/AAN/NMW/CAE | Bisha_2016R&R-Update_TechRep_2CN010-024_20170808_aan_cae | August 2017 |
| SRK Consulting |
| NI 43-101 Technical Report Bisha Mine 2016, Eritrea | Page 71 |
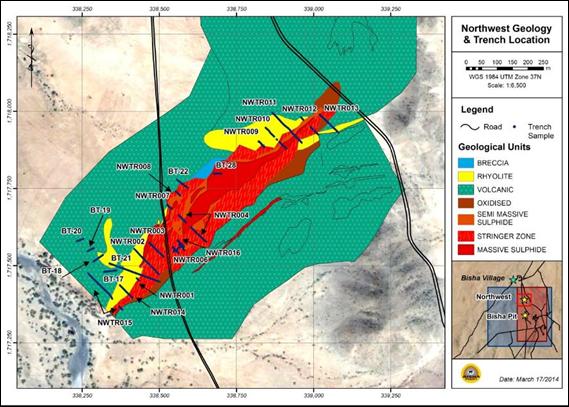
Source: Nevsun, 2017
Figure 6.10: Northwest interpreted geology
The Hambok deposit (Figure 6.11) lies within the Western Nakfa terrane, and is part of a sequence of Late Proterozoic mafic to felsic volcanic rocks, and sedimentary rocks, including pelite, chert, and carbonate units. The deposit comprises a primary copper/zinc sulphide zone, representing the majority of the deposit, and a minor oxide gold component. The primary massive sulphide mineralisation is a single body, with a faulted displacement interpreted at depth in the northeast of the deposit. The massive sulphide zones strike at approximately 015°, dipping steeply to the east, with overall strike and dip lengths of some 975 m and 400 m, respectively. The thickness of the massive sulphide varies from about 5.0 m to 75 m.
| PJ/ABE/ADD/CCS/AAN/NMW/CAE | Bisha_2016R&R-Update_TechRep_2CN010-024_20170808_aan_cae | August 2017 |
| SRK Consulting |
| NI 43-101 Technical Report Bisha Mine 2016, Eritrea | Page 72 |
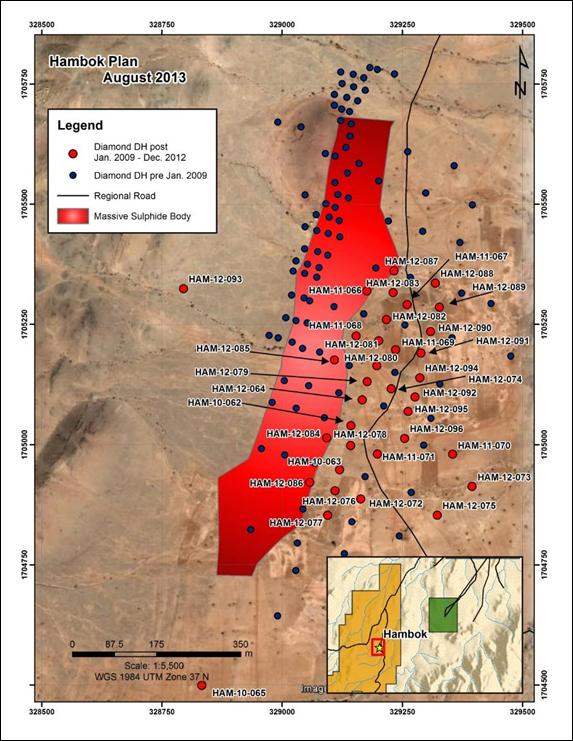
Source: Nevsun, 2013
Figure 6.11: Hambok deposit, drill coverage
The Asheli area (Figure 6.12) comprises various lithologies outcropping generally with north-south strike and dipping steeply to the west. The lowest unit is a series of mafic flows with strong carbonate and moderate chlorite alteration. This unit opens to the south and narrows to the north and is cut by several felsic and mafic dykes.
| PJ/ABE/ADD/CCS/AAN/NMW/CAE | Bisha_2016R&R-Update_TechRep_2CN010-024_20170808_aan_cae | August 2017 |
| SRK Consulting |
| NI 43-101 Technical Report Bisha Mine 2016, Eritrea | Page 73 |
Overlying the mafic is a series of felsic flows; they have moderate to strong sericite alteration and in parts are strongly foliated. Subsidiary lithology within the felsic volcanic rocks include strongly magnetic exhalite and intermediate flows. This bimodal volcanism indicates a near-seafloor setting common for VHMS deposits.
Within the felsic is the Asheli VHMS deposit. This is a tabular, steeply north-plunging shoot 400 m long, 100 m wide and up to 30 m thick composed of pyrite, sphalerite and chalcopyrite. The top of the shoot is 60 m below the natural surface.
Overlying the felsic rocks is a thick gabbroic sill, which is in turn overlain by a thick sequence of finely laminated graphitic sediments and mudstone. This unit is strongly foliated and contains a graphitic horizon with coarse box works after oxidation of pyrite. There are also some siliceous chert and marble beds in this sequence.
| PJ/ABE/ADD/CCS/AAN/NMW/CAE | Bisha_2016R&R-Update_TechRep_2CN010-024_20170808_aan_cae | August 2017 |
| SRK Consulting |
| NI 43-101 Technical Report Bisha Mine 2016, Eritrea | Page 74 |

Source: Nevsun, 2016
Figure 6.12: Geological map of the Asheli area
| PJ/ABE/ADD/CCS/AAN/NMW/CAE | Bisha_2016R&R-Update_TechRep_2CN010-024_20170808_aan_cae | August 2017 |
| SRK Consulting |
| NI 43-101 Technical Report Bisha Mine 2016, Eritrea | Page 75 |
Volcanic-hosted massive sulfide (VMS) deposits form a major part of the world’s reserves of copper, lead and zinc, as well as being producers of gold and silver. Over 800 VMS deposits have been identified around the world (Franklin et al., 1998). These deposits occur in rocks that range in age from the Archean through to the Cenozoic, with notable examples being the deposits of the Iberian Pyrite Belt in Spain and Portugal, Kidd Creek and the Noranda Camp in Canada, and Kuroko in Japan.
VMS are commonly found in clusters, consisting of dozens of individual deposits, around 1 Mt to 10 Mt within a larger mining camp. A selection of VMS camps is tabulated in Table 7.1.
Galley et al. (2005) listed the features common to VMS deposits:
| | - They occur as lenses of polymetallic massive sulphide that form at or near the seafloor in submarine environments;
- Their immediate host rocks can be either volcanic or sedimentary;
- There is typically a mound-shaped to tabular massive sulphide body, typically underlain by stockwork veins and disseminated sulphides;
- They are formed in extensional tectonic settings;
- Deposit clusters are restricted regionally to linear rifts or calderas;
- Proximal alteration zones may extend hundreds of metres away from the massive sulphide;
- Metal contents and metal ratios vary considerably - deposits may be Cu-rich, Au-rich, Cu-Zn-rich or polymetallic (Cu-Zn-Pb-Ag-Au) types;
- Ore metals within sulfide deposits are typically vertically zoned, from Cu at the stratigraphic base to Zn, Pb, Ag, Au and Ba towards the top (Figure 7.1). However, there are many exceptions to this zonation pattern.
|
The widely accepted genetic model for VMS deposits is that they are formed at, or just below, the seafloor, in volcanically-active extensional settings, where convected seawater is drawn into the seafloor down extensional faults. Vent fluids are heated (>200°C) by underlying magmas, and leach metals from the underlying volcanic rock; this metal-rich fluid may also mix with magmatic fluids sourced from sub-volcanic intrusions. The reduced hydrothermal fluid is then driven upwards towards the seafloor via fault pathways, and expelled at or immediately below the seafloor surface.
When in contact with cold seawater, the hydrothermal fluid cools rapidly and precipitates sulfides, sulphates and Fe-oxide minerals. Long lived precipitation eventually builds up a mound of metal-rich sulfide on or immediately beneath the seafloor.
Within a mining camp, VMS deposits tend to be spatially clustered with multiple deposits, commonly forming at a single stratigraphic level. Deposits are localised at the prospect scale by the distribution of synvolcanic extension faults. These extension faults are active during the formation of the deposits and create the permeability required to allow transport of the upward-migrating metal-laden fluids to reach either the sea floor or the immediate sub-sea floor porous environments.
| PJ/ABE/ADD/CCS/AAN/NMW/CAE | Bisha_2016R&R-Update_TechRep_2CN010-024_20170808_aan_cae | August 2017 |
| SRK Consulting |
| NI 43-101 Technical Report Bisha Mine 2016, Eritrea | Page 76 |
The Bisha and Harena are large precious- and base metal-rich VMS deposits; Northwest, Hambok and Asheli are small to medium size VMS deposits.
Table 7.1: Average grade and tonnage data for selected VMS camps
| | Area | Dominant metals | Number of deposits | (% Cu) | (% Zn) | (% Pb) | (g/t Ag) | (g/t Au) | Quantity
(Mt) |
| | Abitibi Belt, Canada | Cu-Zn | 52 | 1.47 | 3.43 | 0.07 | 3.19 | 0.80 | 9.2 |
| | Norwegian Caledonides | Cu-Zn | 38 | 1.41 | 1.53 | 0.05 | | | 3.5 |
| | Bathurst, N.B., Canada | Zn-Pb-Cu | 29 | 0.56 | 5.43 | 2.17 | 62.00 | 0.50 | 8.7 |
| | Green Tuff Belt, Japan | Zn-Pb-Cu | 25 | 1.63 | 3.86 | 0.92 | 95.10 | 0.90 | 5.8 |
| | Iberian Pyrite belt | Cu-Zn | 85 | 0.80 | 2.00 | 0.70 | 26.00 | 0.50 | 20.8 |
| | Australian Palaeozoic | Cu-Zn | 24 | 1.13 | 4.10 | 1.62 | 42.95 | 1.78 | 10.7 |
| | Note: Modified after Lydon (1984) and Large (1992).* This information does not relate to mineralisation on the properties that are the subject of this technical report. The qualified person has been unable to verify the information and the information is not necessarily indicative of the mineralisation on the property that is the subject of this technical report. |
| PJ/ABE/ADD/CCS/AAN/NMW/CAE | Bisha_2016R&R-Update_TechRep_2CN010-024_20170808_aan_cae | August 2017 |
| SRK Consulting |
| NI 43-101 Technical Report Bisha Mine 2016, Eritrea | Page 77 |
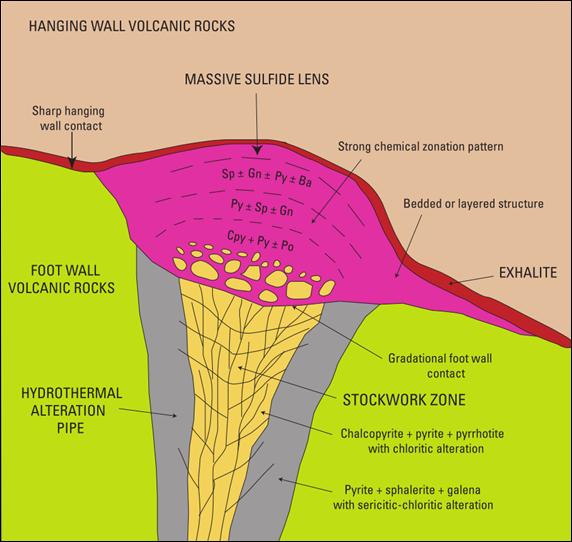
Source: Koski, 2012
Note: Ba: barite; cpy: chalcopyrite; gn: galena; po, pyrrhotite; py: pyrite; sp: sphalerite
Figure 7.1: Idealised massive sulfide lens illustrating zonation features for primary ore minerals
| PJ/ABE/ADD/CCS/AAN/NMW/CAE | Bisha_2016R&R-Update_TechRep_2CN010-024_20170808_aan_cae | August 2017 |
| SRK Consulting |
| NI 43-101 Technical Report Bisha Mine 2016, Eritrea | Page 78 |
In 2014, regional geophysical campaigns comprised of 230 line-km of ground Fixed-Loop Transient Electromagnetic surveying was conducted, and a 2,500 line-km Versatile Transient Electromagnetic airborne (VTEM) survey. In addition, 44 drillholes were surveyed by Borehole Time-Domain Electromagnetic (BHEM). This work produced a significant new extension of Harena and new mineralisation at Aderat on the Mogoraib River EL. A total of 91 drillholes were completed at Bisha Main and Harena, Hambok, Aderat, and Tekawda for 27,300 m of exploration diamond drilling.
In 2015, 35,805 metres of exploration diamond drilling (72 holes), approximately 30 sq. km. of ground geophysical surveying, geophysical surveying of 85 drill holes and other geological work. The main areas of focus were the drilling of the Harena deposit, testing down dip of the Aderat deposit, and exploring the immediate Bisha deposit area along strike to the north. Exploration on the Mogoraib River License resulted in the discovery of the Asheli deposit in mid-2015.
For 2016, a total of 44,210 metres were completed property wide in 91 holes. Forty-three holes (20,595 metres) were drilled at Bisha (21 within the pit and 22 outside of the pit), 36 holes (15,645.5 metres) were completed on the Mogoraib River license (20 Asheli, 5 Shabyt, 2 Railway, 1 Bisha Village), 8 holes were drilled at Harena (6,079.5 metres) and 4 holes (1,890 metres) were completed on the Tabikin license. Additional work consisted of soil sampling, ground and borehole geophysical surveying and geological mapping and prospecting.
| PJ/ABE/ADD/CCS/AAN/NMW/CAE | Bisha_2016R&R-Update_TechRep_2CN010-024_20170808_aan_cae | August 2017 |
| SRK Consulting |
| NI 43-101 Technical Report Bisha Mine 2016, Eritrea | Page 79 |
Since 2002, BMSC has completed 1,186 drill holes totalling approximately 258,400 m (Table 9.1 to Table 9.6).
In 2014, total of 91 drillholes were completed at Bisha Main and Harena, Hambok, Aderat, and Tekawda for 27,300 m of exploration diamond drilling. This drilling was successful in extending the Harena deposit from a depth of 220 m to nearly 450 m below surface while increasing strike length from 300 m to 600 m.
In 2015, a total of 35,805 m of exploration diamond drilling (72 holes) was completed.
At Harena, drilling extended the resource down-plunge, using the results of the BHEM to predict the extension of both Cu-rich and Zn-rich massive sulphide. By the end of the year, the drilling had extended the known extents of the deposit to 600 m below the natural surface.
At Asheli, a blind VMS deposit was discovered by diamond drilling following up on the work completed in 2014. The drillholes intersected massive and semi-massive sulphides hosted in altered felsics, including hole MX-052 that had an intersection of 21 m at 2.29% Cu, 4.50% Zn, 0.45 g/t Au, and 37 g/t Ag. The discovery of Asheli in a style and setting indicative of VMS deposits demonstrates the prospectivity of the Asheli Trend. Further drilling was also completed at Aderat that defined new targets to be tested in the future.
Three deep drillholes at the Bisha Main deposit tested the down-plunge extension of the deposit, with downhole thicknesses ranging from 10 m to 25 m.
In 2016, a total of 44,210 m of diamond drilling was completed in 91 holes. In addition, ground and borehole geophysical surveys and soil and rock sampling programs were completed. Forty-three holes for 20,595 m were drilled at Bisha Main, eight holes for 6,079 m at Harena, 36 holes for 15,645 m were completed on the Mogoraib Exploration License and four holes for 1,890 m on the Tabakin Exploration License.
At Bisha Main, drilling continued to infill the resource to upgrade from Inferred to Indicated. Other activities in the Bisha area included sterilisation drilling for planned waste dumps.
At Harena, drilling was focused on continuing to extend the deposit down-plunge. Drillholes
HX-079 and HX-081 returned 57.4 m at 0.37% Cu and 7.08% Zn and 44.5 m at 0.49% Cu and 6.51% Zn respectively. The deposit remains open down-plunge.
Resource development drilling at Asheli defined the size of the VMS deposit to allow estimation of a maiden Inferred resource. Drilling returned high grade Cu and Zn intervals hosted in highly sericite and chlorite altered felsics. A synoptic map of the 2003 to 2016 exploration works is presented in Figure 9.1.
| PJ/ABE/ADD/CCS/AAN/NMW/CAE | Bisha_2016R&R-Update_TechRep_2CN010-024_20170808_aan_cae | August 2017 |
| SRK Consulting |
| NI 43-101 Technical Report Bisha Mine 2016, Eritrea | Page 80 |
Only DDH were used for resource estimation in the primary zone; for the oxide/supergene gold zones, additional information was derived from the RC holes and trenches. Not all holes were included in the estimation work.
Diamond drilling was completed by Boart Eritrea; RC drilling was carried out in-house, with BMSC employing an Atlas Copco 850 rig.
Much of the massive sulphide mineralisation in the Northwest deposit has been well defined, with drilling spaced at 25 m x 25 m or closer in some areas. Drilling density decreases with depth, with the deposit remaining open at depth and along strike.
The drilling completed across the deposit is of sufficient density and quality for meaningful geological interpretation and Mineral Resource estimation, as described in detail in Section 14 of this report. The recovery problems in the Oxide and supergene Zones were countered by classification of this material as Inferred Resources. Additional drilling will be needed to upgrade the resource category.
| PJ/ABE/ADD/CCS/AAN/NMW/CAE | Bisha_2016R&R-Update_TechRep_2CN010-024_20170808_aan_cae | August 2017 |
| SRK Consulting |
| NI 43-101 Technical Report Bisha Mine 2016, Eritrea | Page 81 |

Source: Nevsun, 2017
Figure 9.1: Summary of Nevsun and BMSC regional exploration activities 2003 to 2016
| PJ/ABE/ADD/CCS/AAN/NMW/CAE | Bisha_2016R&R-Update_TechRep_2CN010-024_20170808_aan_cae | August 2017 |
| SRK Consulting |
| NI 43-101 Technical Report Bisha Mine 2016, Eritrea | Page 82 |
Table 9.1: Bisha Main Deposit drilling analysis
| | Year | No. of Holes | Total Length
(m) | Drillhole Type |
| | 2002 | 6 | 811 | Resource Diamond |
| | 2003 | 48 | 6,725 | Resource Diamond |
| | 2003 | 79 | 9,862 | Resource Diamond |
| | 2004 | 172 | 28,863 | Resource Diamond |
| | 2004 | 41 | 2,152 | Reverse Circulation |
| | 2005 | 58 | 7,520 | Resource Diamond |
| | 2005 | 6 | 937 | Geotechnical |
| | 2005 | 8 | 1,213 | Metallurgical |
| | 2006 | 4 | 1,014 | Resource Diamond |
| | 2009 | 9 | 1,202 | Geotechnical |
| | 2009 | 3 | 224 | Metallurgical |
| | 2010 | 7 | 1,062 | Resource |
| | 2010 | 6 | 478 | Metallurgical |
| | 2011 | 126 | 27,087 | Resource |
| | 2011 | 6 | 696 | Geotechnical |
| | 2011 | 2 | 180 | Metallurgical |
| | 2012 | 7 | 410 | Resource Diamond |
| | 2012 | 12 | 3,049 | Geotechnical |
| | 2013 | 15 | 2,335 | Resource Diamond |
| | 2013 | 12 | 821 | Metallurgical |
| | 2013 | 10 | 1,006 | Metallurgical |
| | 2013 | 8 | 3,889 | Resource Diamond |
| | 2014 | 9 | 2,694 | Resource Diamond |
| | 2015 | 6 | 3,490 | Resource Diamond |
| | 2016 | 47 | 20,839 | Resource Diamond |
| | 2016 | 4 | 402 | Reverse Circulation |
| | 2016 | 2 | 685 | Metallurgical |
| | Total | 713 | 129,639 | |
| PJ/ABE/ADD/CCS/AAN/NMW/CAE | Bisha_2016R&R-Update_TechRep_2CN010-024_20170808_aan_cae | August 2017 |
| SRK Consulting |
| NI 43-101 Technical Report Bisha Mine 2016, Eritrea | Page 83 |
Table 9.2: Harena Deposit drilling analysis
| | Year | No of Holes | Total Length
(m) | Drillhole Type |
| | 2005 | 20 | 2,910 | Resource Diamond |
| | 2005 | 7 | 1,162 | Resource Diamond |
| | 2009 | 17 | 2,164 | Resource Diamond |
| | 2010 | 3 | 450 | Resource Diamond |
| | 2010 | 34 | 2,446 | Resource Diamond |
| | 2011 | 5 | 852 | Resource Diamond |
| | 2011 | 6 | 764 | Resource Diamond |
| | 2011 | 2 | 110 | Reverse Circulation |
| | 2012 | 6 | 1,123 | Resource Diamond |
| | 2012 | 7 | 688 | Reverse Circulation |
| | 2014 | 44 | 15,966 | Resource Diamond |
| | 2015 | 35 | 20,083 | Resource Diamond |
| | 2016 | 7 | 3,679 | Resource Diamond |
| | Total | 193 | 52,396 | |
Table 9.3: Hambok Deposit drilling analysis
| | Year | No of Holes | Total Length
(m) | Drillhole Type |
| | 2006 | 56 | 12387.5 | Resource Diamond |
| | 2007 | 3 | 766 | Resource Diamond |
| | 2010 | 4 | 974 | Resource Diamond |
| | 2011 | 6 | 1877 | Resource Diamond |
| | 2012 | 25 | 8,072 | Resource Diamond |
| | 2013 | 8 | 2,713 | Resource Diamond |
| | 2011 | 16 | 978 | Reverse Circulation |
| | 2012 | 25 | 8,072 | Reverse Circulation |
| | Total | 143 | 35,840 | |
Table 9.4: Northwest Deposit drilling analysis
| | Year | No. of Holes | Total Length
(m) | Drillhole Type |
| | 2003 | 14 | 2,034 | Resource Diamond |
| | 2005 | 26 | 4,568 | Resource Diamond |
| | 2011 | 73 | 13,620 | Resource Diamond |
| | 2012 | 106 | 21,547 | Resource Diamond |
| | 2012 | 8 | 1,568 | Geotechnical |
| | 2012 | 2 | 471 | Metallurgical |
| | 2012 | 47 | 873 | Reverse Circulation |
| | Total | 262 | 42,646 | |
| PJ/ABE/ADD/CCS/AAN/NMW/CAE | Bisha_2016R&R-Update_TechRep_2CN010-024_20170808_aan_cae | August 2017 |
| SRK Consulting |
| NI 43-101 Technical Report Bisha Mine 2016, Eritrea | Page 84 |
Table 9.5: Asheli Deposit drilling analysis
| | Year | No. of Holes | Total Length
(m) | Drillhole Type |
| | 2005 | 4 | 619 | Resource Diamond |
| | 2007 | 4 | 420 | Resource Diamond |
| | 2015 | 18 | 6,317 | Resource Diamond |
| | 2016 | 25 | 10,841 | Resource Diamond |
| | Total | 51 | 18,197 | |
Table 9.6: Other prospects drilling summary
| | Prospect | Years | No. of Holes | Total Length
(m) | Drillhole Type |
| | Aderat | 2006 to 2015 | 37 | 9,877 | Diamond |
| | Akub | 2010 | 1 | 74 | Diamond |
| | Ankerite | 2014 | 2 | 681 | Diamond |
| | Bisha North | 2005 | 11 | 2,393 | Diamond |
| | Bisha Village | 2016 | 1 | 464 | Diamond |
| | Hambok North | 2006 | 2 | 533 | Diamond |
| | MacNab | 2006 | 1 | 130 | Diamond |
| | Mai Melih | 2005 | 3 | 510 | Diamond |
| | Mogoraib North | 2014 | 8 | 1,394 | Diamond |
| | Railway Area | 2016 | 2 | 532 | Diamond |
| | Shabayet | 2007 to 2016 | 10 | 2,954 | Diamond |
| | Tabakin | 2016 | 4 | 1,890 | Diamond |
| | Taebiet | 2007 | 2 | 400 | Diamond |
| | Tekwuda | 2014 | 2 | 494 | Diamond |
| | Total | | 86 | 22,326 | |
| PJ/ABE/ADD/CCS/AAN/NMW/CAE | Bisha_2016R&R-Update_TechRep_2CN010-024_20170808_aan_cae | August 2017 |
| SRK Consulting |
| NI 43-101 Technical Report Bisha Mine 2016, Eritrea | Page 85 |
| 10 | Sample Preparation, Analyses, and Security |
BMSC staff are responsible for the following:
| | - Sample collection
- Core splitting
- Sample preparation of geochemical, pit, trench, rc, core, and grade control samples
- Delivery of samples to the analytical laboratory
- Density determinations
- Sample storage
- Sample security
|
In this report sample preparation, analysis, quality control, and security are described in detail only for sampling since the last Technical Report, however these are very similar to the protocols adopted by BMSC since the commencement of their technical programme.
| 10.1 | Sample Preparation and Analyses |
Diamond drillhole sampling intervals were chosen based on logged lithology unit and marked on the core with crayon and waterproof Tyvek tags. The cutting line was also marked by the logging geologist if there was potential for an apparent bias in mineralisation.
RC chips were logged by project geologists or geological contractors. Sieved specimens were placed into numbered chip trays and logged using standardised geological logging codes onto hardcopy logging forms that were later digitised.
Chip trays were labelled and stored in a locked storage container located at the BMSC exploration camp. Core trays are stored in the covered core logging area. Digital back-up copies of the logs are stored at BMSC’s site office, BMSC’s Asmara office, Nevsun’s head office in Vancouver and Nevsun’s off-site data storage in Vancouver. All hardcopy logs are archived in files, labelled, and stored at BMSC’s site office.
Core recovery has been measured from all core holes completed since 2003. Core recovery and rock quality description (RQD) for each core run (1.5 m or 3 m) were measured at the drill rig as the core was placed in the core boxes.
Recovery is highly variable and a function of lithology, alteration, and rock hardness. Poor core recovery was observed at the near-surface mineralisation in the oxide material and excellent core recovery was observed in the competent supergene and primary massive sulphide mineralisation.
| 10.1.1 | Core Drilling Sampling |
For holes drilled in all the Northwest campaigns and BMSC drilling at Bisha Main and Hambok, holes were sampled for their full length at a target length of 1.0 m per sample. Sample intervals vary based upon mineralogical and lithological contacts. The sample regime is set out by the logging geologist.
| PJ/ABE/ADD/CCS/AAN/NMW/CAE | Bisha_2016R&R-Update_TechRep_2CN010-024_20170714_DRAFT_v07_FWB_aan_rev06 | July 2017 |
| SRK Consulting |
| NI 43-101 Technical Report Bisha Mine 2016, Eritrea | Page 86 |
Standard diamond cutting blades flushed with fresh water are used to halve the core. Highly broken core pieces are cut along the axis if possible or the core is split using a trowel down the middle of the tray row and handpicked or scooped to ensure representative samples are obtained. Cutting lines may be drawn on the core. The remaining half core is returned to the box and boxes stacked in numerical order by hole.
The technicians or samplers under the supervision of technicians place half of the core in individual trays laid out in numerical order. Samples are then placed in a drying oven for 12 hours to 18 hours at between 80°C and 100°C. The samples then pass through a jaw crusher to >75% of sample passing 10 mesh (2 mm) screen. The sample is then split using a Jones-type riffle splitter to achieve a sub-sample weight of approximately 200 g to 300 g. The sample reject is then bagged, labelled with the original sample ID and put into storage at Bisha site. The sub-samples are packed and then placed in large plastic shipping barrels. When samples are ready to be shipped the sample lists are combined with a sample submission form and enclosed with the samples in plastic drums. Samples are despatched to Asmara in BMSC vehicles with BMSC staff and are held at the BMSC Head Office before onward despatch.
Analysis for Northwest samples was carried out by ALS in Vancouver. In this example, the sample information with required analytical procedures is emailed to ALS so that the sample shipment can be tracked and the laboratory is made aware of the pending arrival of samples. The sample barrels are submitted to the Eritrean Ministry of Mines for inspection and submission to customs. A seal is placed on the barrels and the sample barrels are shipped via air transport directly to ALS in Vancouver. At ALS, the samples are pulverised to greater than 85% passing 75 µm.
Analysis for Hambok samples was carried out by Genalysis Intertek (Genalysis) for consistency of analysis with the Sanu campaigns. In this example, the plastic barrels are taken by road to their Horn of Africa preparation facility near Asmara. Here, samples are pulverised and the pulps dispatched by courier to the Genalysis laboratory in Perth, West Australia, for analysis the samples are pulverised to greater than 85% passing 75 µm.
For holes drilled at Bisha Main and Harena that are used in the current Mineral Resource, sampling methods and preparation were the same as those described above, excepting that for the most part holes were sampled only through the mineralised zone. These samples have been assayed at ALS Vancouver, Genalysis in Perth and at the onsite SGS laboratory. A summary of analytical techniques is presented in Table 10.1.
| PJ/ABE/ADD/CCS/AAN/NMW/CAE | Bisha_2016R&R-Update_TechRep_2CN010-024_20170808_aan_cae | August 2017 |
| SRK Consulting |
| NI 43-101 Technical Report Bisha Mine 2016, Eritrea | Page 87 |
Table 10.1: Analytical laboratory assay techniques
| | Laboratory | Analyse | Code | Method | Description | Detection Limit |
| | ALS Vancouver | Au | Au-AA23 | Routine Gold Fire Assay | 30 g, fire assay, AAS finish | 0.005 – 100 ppm Au |
| | ALS Vancouver | Au | Au-GRA21 | Over-limit gold >100 ppm | 30 g fire assay, Gravimetric finish | 0.05 – 1,000 ppm Au |
| | ALS Vancouver | Cu, Pb, Zn, Ag, As, Fe
(41 elements) | ME-ICP41a | Multi-element Aqua Regia Partial Digestion | 1 g, two acid (HN03, HCl) digest, ICP-AES analysis | 5 – 50,000 ppm Cu
10– 50,000 ppm Pb, Zn |
| | ALS Vancouver | Cu, Pb, Zn | OG46 | Over-limit Cu, Pb, Zn | 1 g, two acid (HN03, HCl) digest, ICP-AES analysis | 0.01– 20% Cu, Pb
0.001 – 30% Zn |
| | SGS Bisha | Au | FAA303 | Routine Gold by Fire Assay | 30 g, fire assay, AAS finish | 0.01 - 100 |
| | SGS Bisha | Au | FAA505 | Over-limit gold >100ppm | 30 g fire assay, Gravimetric finish | 0.05 – 1,000 ppm Au |
| | SGS Bisha | Cu, Zn | AAS12B | Aqua Regia Partial Digestion | 0.25 g*, two acid (HN03, HCl) digest, ICP-AES analysis | 0.5 – 10,000 ppm Cu
1 – 10,000 ppm Zn
2 – 10,000 ppm Pb |
| | SGS Bisha | Cu, Zn | AAS23C | Over-limit Cu, Zn | 0.25 g*, two acid (HN03, HCl) digest, ICP-AES analysis | unknown |
| | Genalysis Perth | Cu, Pb, Zn | AR01_OE01 | Multi-element Aqua Regia Partial Digestion | 1 g, two acid (HN03, HCl) digest, ICP-OES analysis | 1 ppm – 2% Cu, Zn
1 – 5,000 ppm Pb
|
| | Genalysis Perth | Cu, Pb, Zn | 4AH_OE01 | Over-limit Cu, Pb, Zn | 1 g, four acid (HN03, HCl, HClO4, HF) digest, ICP-OES analysis | unknown |
| | Genalysis Perth - Sanu | Au | FA50/AAX | Routine Gold by Fire Assay | 50 g, fire assay, AAS finish | Not reported |
| | Genalysis Perth - Sanu | Cu, Pb, Zn | AX/OES | Multi-element multi acid digestion | Multi acid digest (not defined), ICP-OES analysis | Not reported |
| 10.1.2 | Reverse Circulation Drilling Sampling |
RC grade control samples from drilling in the Bisha Main pit are sampled at 1 m intervals. Following riffle splitting the sample is sent to the SGS on-site laboratory. The samples are placed in a drying oven for 12 hours to 18 hours at between 80°C and 100°C. The samples then pass through a jaw crusher to >75% of sample passing 10 mesh (2 mm) screen. The sample is then split using a Jones-type riffle splitter to achieve a sub-sample weight of approximately 200 g to 300 g. The samples are then pulverised to greater than 85% passing 75 µm. A subsample is also retained for additional analytical work.
| | To determine bulk density, samples are taken from drillcore, and from grab samples in the open pit or on ROM stockpiles. Drillcore samples are selected from coherent pieces of core between 10 cm and 15 cm long; grab samples are typically irregularly shaped with dimensions in the 10 cm to 20 cm range. Pit grab samples locations are picked up by the mine survey crew; the northing, easting and RL of the drillcore samples are calculated from the downhole surveys using Surpac. In the database, each grab sample is assigned a lithology based on visual inspection. A listing of the bulk density testwork available is presented in Table 10.2. |
| PJ/ABE/ADD/CCS/AAN/NMW/CAE | Bisha_2016R&R-Update_TechRep_2CN010-024_20170808_aan_cae | August 2017 |
| SRK Consulting |
| NI 43-101 Technical Report Bisha Mine 2016, Eritrea | Page 88 |
Table 10.2: Density testwork summary
| | Prospect | Drillhole | Grabs |
| | Bisha Main | 11,099 | 13,880 |
| | Harena | 4,213 | 3,349 |
| | Hambok | 1,255 | |
| | Northwest | 11,675 | |
| | Asheli | 1,025 | |
| | Mogoraib Prospects | 2,812 | |
| | Tabakin | 119 | |
| | Total | 32,198 | 17,229 |
| 10.3 | Quality Assurance and Quality Control Programs |
From 2003 onwards, all of the core and RC drilling programmes included certified reference materials (CRMs) and also included blanks, twin sample duplicates, and coarse preparation duplicates. Each drill programme report documented the protocols and results of the QA/QC programme. Nevsun purchased the CRMs from Geostats Pty Ltd (Geostat), a well-known and certified reference material manufacturer, located in Australia.
The QA/QC sample insertion protocol employed is as follow.
| | - Six certified CRM control samples per 100 samples; three gold (B, D, and F) and three base metal (A, C, and E)
- One coarse blank sample of barren material per 100 samples plus the random insertion of barren material in mineralised zones
- One quartered core “twin” duplicate sample per 100 samples
- Two coarse preparation duplicates per 100 samples
|
All data is loaded into the AcQuire™ database system established at the Bisha Mine site. Analytical data is examined on a batch-by-batch basis prior to loading to the database, and any QA/QC issues flagged are communicated back to the analytical laboratory for action. Typically, a CRM failure (excursions of more than two standard deviations from the certified mean) triggers a partial re-assay of the batch; a repeated CRM failure triggers a re-assay of the entire batch.
Monthly QA/QC reports are prepared and analysed to monitor the laboratory performance. Summaries of the Blank, Duplicate and CRM performance are tabulated in Table 10.3 to Table 10.4.
| PJ/ABE/ADD/CCS/AAN/NMW/CAE | Bisha_2016R&R-Update_TechRep_2CN010-024_20170808_aan_cae | August 2017 |
| SRK Consulting |
| NI 43-101 Technical Report Bisha Mine 2016, Eritrea | Page 89 |
Table 10.3: Laboratory blanks analysis
| | Laboratory | Element | Assays | Failures | Failure Rate |
| | ALS | Ag | 1,231 | 3 | 0.2% |
| | | Au | 1,207 | 19 | 1.6% |
| | | Cu | 1,180 | 14 | 1.2% |
| | | Zn | 1,230 | 26 | 2.1% |
| | ALS-Perth | Ag | 52 | 0 | 0.0% |
| | | Au | 52 | 2 | 3.8% |
| | | Cu | 1 | 0 | 0.0% |
| | | Zn | 2 | 0 | 0.0% |
| | GEN-Perth | Ag | 888 | 10 | 1.1% |
| | | Au | 959 | 13 | 1.4% |
| | | Cu | 953 | 87 | 9.1% |
| | | Zn | 888 | 26 | 2.9% |
| | SGS-Bisha | Ag | 5,211 | 71 | 1.4% |
| | | Au | 8,295 | 189 | 2.3% |
| | | Cu | 4,711 | 20 | 0.4% |
| | | Zn | 3,918 | 21 | 0.5% |
| | Total | Ag | 7,382 | 84 | 1.1% |
| | | Au | 10,513 | 223 | 2.1% |
| | | Cu | 6,844 | 121 | 1.8% |
| | | Zn | 6,036 | 73 | 1.2% |
Table 10.4: Laboratory CRM analysis
| | Laboratory | Element | Assays | Failures | Failure Rate |
| | ALS | Ag | 1,155 | 66 | 5.7% |
| | | Au | 710 | 21 | 3.0% |
| | | Cu | 1,407 | 76 | 5.4% |
| | | Zn | 1,391 | 69 | 5.0% |
| | ALS-Perth | Ag | 6 | 0 | 0.0% |
| | | Au | 37 | 7 | 18.9% |
| | | Cu | 6 | 0 | 0.0% |
| | | Zn | 7 | 1 | 14.3% |
| | GEN-Perth | Ag | 593 | 76 | 12.8% |
| | | Au | 247 | 8 | 3.2% |
| | | Cu | 1,445 | 92 | 6.4% |
| | | Zn | 1,273 | 105 | 8.2% |
| | SGS-Bisha | Ag | 5,268 | 98 | 1.9% |
| | | Au | 3,754 | 549 | 14.6% |
| | | Cu | 6,465 | 128 | 2.0% |
| | | Zn | 5,760 | 121 | 2.1% |
| | Total | Ag | 7,022 | 240 | 3.4% |
| PJ/ABE/ADD/CCS/AAN/NMW/CAE | Bisha_2016R&R-Update_TechRep_2CN010-024_20170808_aan_cae | August 2017 |
| SRK Consulting |
| NI 43-101 Technical Report Bisha Mine 2016, Eritrea | Page 90 |
The chain-of-custody for core samples collected and being shipped from site is as follows:
| | - Core is transported to the Bisha Village by the drill contractors or BMSC employees and placed in the core logging area
- Logging and sample preparation area is in a fenced compound
- Core samples are crushed and sub-sampled
- Crushed samples are bagged and placed in sealed barrels
- Each barrel has a list of samples written on the outside of the container
- A sample submission form accompanies each barrel
- Barrels are transported to Asmara in mine-owned vehicles arranged by BMSC
|
The sample barrels are submitted to the Eritrean Ministry of Mines for inspection and submission to customs, a customs seal is placed on the barrels and the sample barrels are shipped to Vancouver, where ALS staff receive and clears samples through Canadian customs. Where samples are sent to Genalysis, the chain of custody continues with the pulps couriered from the Horn of Africa preparation laboratory to Perth where the samples are received by Genalysis staff.
Retained pulp, pulp duplicate samples are stored onsite at the Bisha sample preparation facilities. The crushed residues and pulps from grade control sampling are stored at the Bisha site facility for possible additional analysis for approximately 12 months until they are discarded.
The sample collection and preparation, analytical techniques, security and QA/QC protocols are consistent with standard industry practice and are suitable for Mineral Resource estimation and the reporting of exploration results. The sampling procedures are adequate for and consistent with the style of base metal and gold mineralisation found at these deposits. The accuracy and precision of the data gathered is adequate for the purposes to which it has been used in this Technical Report and has been appropriately represented by the resource classifications and rounding applied.
| PJ/ABE/ADD/CCS/AAN/NMW/CAE | Bisha_2016R&R-Update_TechRep_2CN010-024_20170808_aan_cae | August 2017 |
| SRK Consulting |
| NI 43-101 Technical Report Bisha Mine 2016, Eritrea | Page 91 |
| 11.1 | Verifications by Nevsun |
Nevsun and their independent consultants completed several verification programs for the preparation of previous technical reports including studies conducted by AMEC between 2004 and 2011.
The initial process of data verification for the Project was performed by Nevsun, and by external consultancies contracted by Nevsun staff. During the 2006 Feasibility Study (AMEC, 2006), and as part of checks on data for this, and previous technical reports, AMEC reviewed drilling and other exploration and project data. AMEC also submitted independent samples for verification of mineralisation tenor at the Project. As a result, AMEC considered that a reasonable level of verification has been completed, and that no material issues would have been left unidentified from the programs undertaken.
Verification of the data and resource models has also been conducted by reconciliation of predicted production to the recorded mill production. For Supergene copper, the reconciliation between the resource model and the mill production shows the resource model predicts 9% fewer tonnes at a 3% lower grade than mill production plus stockpiles. For Primary zinc, the resource model predicts 9% more tonnes at 14% lower grade than the mill production plus stockpiles for 5% less metal. These variations are considered to demonstrate the overall accuracy of the sampling and assaying methods and the appropriateness of the resource estimation procedures.
SRK was provided with a resource block model in SURPAC format in February 2017 for the Bisha Main and Harena deposits. The models were developed by Bisha Mine geologists and verified by SRK. The models included information on grades, density, rock type and resource classification. The following validation tasks were completed:
| | - Check of estimated block model grades against composited assay data
- Comparison of local “well-informed” block grades with composites contained within those blocks
- Comparison of average assay grades with average block estimates along different directions (i.e., swath plots)
|
SRK concluded that the resource estimation methodology used by Bisha was reasonable and based on industry-accepted methods. Globally, assay data compared well with the current resource model and no issues with the grade estimations were detected.
In accordance with NI 43-101 guidelines, SRK has visited the Bisha Mine on several occasions since 2014.
| PJ/ABE/ADD/CCS/AAN/NMW/CAE | Bisha_2016R&R-Update_TechRep_2CN010-024_20170808_aan_cae | August 2017 |
| SRK Consulting |
| NI 43-101 Technical Report Bisha Mine 2016, Eritrea | Page 92 |
For the purpose of this reserves update, the QPs listed in Table 11.1 visited the property during the dates indicated to review metallurgical data mining/production and infrastructure.
Table 11.1: Site visit dates by QPs
| | Name | Dates |
| | Adrian Dance | Did not visit site for the purpose of this Technical Report |
| | Anoush Ebrahimi | 18 Oct 2016 to 24 Oct 2016 |
| | Cameron Scott | Did not visit site for the purpose of this Technical Report |
| | Neil Winkelmann | 27 May 2015 to 30 May 2015 |
| PJ/ABE/ADD/CCS/AAN/NMW/CAE | Bisha_2016R&R-Update_TechRep_2CN010-024_20170808_aan_cae | August 2017 |
| SRK Consulting |
| NI 43-101 Technical Report Bisha Mine 2016, Eritrea | Page 93 |
| 12 | Mineral Processing and Metallurgical Testing |
A considerable amount of metallurgical testwork has been conducted on the three Bisha Main mineralised material types: Oxide, Supergene and Primary. Since the middle of 2016, the Bisha plant has been processing Primary material, which will be the majority of mill feed from both the Bisha Main and Harena pits. Oxide material has been largely mined out with only small volumes remaining in the current mine plan and stockpiled for future assessment.
The Bisha process plant Phase III expansion was commissioned in mid-2016 with the addition of a zinc flotation circuit, zinc concentrate dewatering/handling and upgrade to the two regrind mills.
Issues with sphalerite (i.e. zinc ore) activation in the copper circuit have been experienced by Bisha for most of 2016, with a bulk Cu-Zn concentrate being produced instead of a copper concentrate in this circuit. Recent changes in the copper flotation circuit have shown improvements in copper concentrate quality.
SRK and TS Technical Services reviewed the historical Primary material testwork results to provide estimates of metallurgical performance for a number of Zn/Cu feed ratio domains. Any material with a Zn/Cu feed ratio of >20 is assumed to produce only a zinc concentrate. These estimates assume separate campaign processing of each domain and not blending of material between domains. In addition, no effect of stockpile weathering/oxidation is considered in these estimates.
In SRK’s opinion, a saleable copper concentrate can be produced from almost all of the material that has been designated as Primary. The same is true for the zinc concentrate, depending on the Zn/Cu feed ratio.
Additional metallurgical testwork is recommended including a review of current secondary copper mineral content, the effect of oxidation/weathering from stockpiles and the effect of grind size/reagent conditions on the copper-zinc selectivity of each metallurgical domain. SRK notes that metallurgical testwork program is ongoing.
| 12.2 | Bisha Main Mineralisation Material Types |
The Bisha Main deposit is comprised of three major mineralisation types: Oxide, Supergene and Primary (Figure 12.1). Oxide material has been largely mined out with only small volumes remaining in the current mine plan and stockpiled for future assessment. Supergene material is high in copper and relatively low in zinc and was being processed until the middle of 2016.
| PJ/ABE/ADD/CCS/AAN/NMW/CAE | Bisha_2016R&R-Update_TechRep_2CN010-024_20170808_aan_cae | August 2017 |
| SRK Consulting |
| NI 43-101 Technical Report Bisha Mine 2016, Eritrea | Page 94 |

Source: AGP, 2014
Figure 12.1: Bisha Main pit section showing two main mineralisation types
| 12.3 | Bisha Main Metallurgical Testwork |
The previous technical report on the Bisha Main deposit (AGP, 2014) contains a summary of the historical testwork programs conducted on the Oxide and Supergene mineralisation zones. As this material is no longer relevant, it is not discussed in this technical report.
For Primary material, a testwork program was conducted in 2014 by ALS Metallurgy in Kamloops, BC Canada on approximately five tonnes of Primary material drillcore (ALS Metallurgy, 2014). In addition to four master composite samples, 47 variability samples were investigated for copper and zinc flotation response. Locked cycle tests were conducted on the master composites while rougher/cleaner copper and zinc flotation tests were performed on the variability samples.
Extensive characterisation work was conducted on all samples including: elemental assays, mineral composition, copper mineral speciation (sequential acid and cyanide leach tests) and EDTA solution wash for non-sulphide metal ion content. Comminution tests were also performed on the master composites. Finally, the effect of sample ageing up to eight weeks on flotation response was investigated.
Relevant conclusions from ALS Metallurgy (2014) include the following.
| | - “Copper performance was quite variable, as a result of the vast array of copper and zinc head grades and the presence of secondary copper sulphides in some samples. The secondary copper sulphides present a distinct challenge: selectivity against sphalerite in the copper circuit is notoriously difficult to achieve in the presence of secondary copper sulphide minerals such as chalcocite/digenite and covellite.”
- “A primary grind sizing of nominally 75 μm P80 was generally sufficient to ensure adequate rougher response from three of the four master composites tested. However, the High Zn Cu Composite, which measured a Zn/Cu ratio of about 15:1, required a primary grind sizing of 41 μm P80 to obtain reasonable rejection of sphalerite from the copper concentrate.”
|
| PJ/ABE/ADD/CCS/AAN/NMW/CAE | Bisha_2016R&R-Update_TechRep_2CN010-024_20170808_aan_cae | August 2017 |
| SRK Consulting |
| NI 43-101 Technical Report Bisha Mine 2016, Eritrea | Page 95 |
| | - “Variability testing was conducted on 46 core intercept samples taken across the primary zone of the deposit. The results from these tests allow preliminary relationships to be developed between head grades and performance. Although further testing would be required to further refine these performance relationships, splitting the samples into groupings based on Zn/Cu ratio provides a good starting point for the prediction of metallurgical performance. The problem then, was identifying samples for which secondary copper sulphides or other elements resulted in the unwanted activation of sphalerite.”
- “Due to significant variation in head grades and mineralogy within this deposit, integration of geological, mining and metallurgical planning will be vital to the success of mining the transition and primary zones of the Bisha Main deposit.”
|
In March 2016, ALS Metallurgy investigated the effect of oxidation on flotation response (ALS Metallurgy, 2016). Two sets of composite samples from the 2014 drillcore were parallel tested: one sourced from nitrogen-purged conditions and one sourced from unpurged bulk material. Sequential copper and zinc flotation testing showed the unpurged material had a decrease in copper-zinc selectivity, which increased the amount of zinc reporting to the copper concentrate. However, increased depressant dosages were effective in reducing this effect.
Flotation response was negatively affected by the duration the samples remained in unpurged storage conditions, and it was recommended by ALS that future metallurgical testing be carried out on new drill core material.
A considerable amount of testwork has been completed by BMSC since the Primary material sequential copper and zinc flotation circuit (Phase III) was commissioned in June 2016. This will be discussed in Section 12.5 as well as the performance estimates made in this report in Section 12.6.
| 12.4 | Harena Metallurgical Testwork |
The Harena deposit will be developed and feed the Bisha process plant starting in late 2022 when Bisha Main mineralised material has been depleted. As Harena material is included in the mine plan, a discussion of the metallurgical testwork conducted to date is relevant.
Historical testwork on Harena mineralised samples is summarised in the previous technical report (AGP, 2014). In mid-2016, ALS Metallurgy in Perth WA Australia conducted open-circuit rougher copper and zinc flotation tests on four composite samples. The four composites originated from intervals of two drillholes. Grades ranged over intervals from 0.27% Cu to 1.39% Cu and from 2.23% Zn to 6.24% Zn. No formal report has been issued by ALS Metallurgy Perth on this testwork. It is unclear how representative the two, 30 m to 40 m intervals from the two drillholes are of the Harena deposit.
Comminution testing was limited to Bond Ball Mill Work Index at an undisclosed closing screen size on Composite 4 and measured 12.3 kWh/t.
The life-of-mine (LOM) expected average grades for Harena open pit are 0.79% Cu and 3.6% Zn, which is within the range covered by the four composites, but does not match any one sample.
| PJ/ABE/ADD/CCS/AAN/NMW/CAE | Bisha_2016R&R-Update_TechRep_2CN010-024_20170808_aan_cae | August 2017 |
| SRK Consulting |
| NI 43-101 Technical Report Bisha Mine 2016, Eritrea | Page 96 |
Copper rougher flotation followed by zinc rougher flotation tests on the four composites showed consistently good copper-zinc selectivity, with 83% to 97% copper recovery to a 12% Cu to 19% Cu concentrate. Zinc performance was also good, with limited zinc being recovered by the copper circuit. Rougher zinc concentrate reported 89% to 98% Zn recovery (Table 12.1).
Table 12.1: Harena rougher flotation results
| | Sample | Product | Mass % | Copper | Zinc |
| | % | % Distn | % | % Distn |
| | Comp 2 | Head | | 0.27 | | 3.69 | |
| | Cu Rougher Conc | 1.4 | 15.7 | 82.7 | 4.50 | 1.75 |
| | Zn Rougher Conc | 8.4 | 0.14 | 4.19 | 42.9 | 97.8 |
| | Comp 3 | Head | | 1.16 | | 2.51 | |
| | Cu Rougher Conc | 6.0 | 18.6 | 97.0 | 2.13 | 5.11 |
| | Zn Rougher Conc | 32.4 | 0.05 | 1.41 | 7.31 | 94.2 |
| | Comp 4 | Head | | 0.72 | | 6.24 | |
| | Cu Rougher Conc | 4.3 | 15.5 | 92.6 | 7.72 | 5.34 |
| | Zn Rougher Conc | 13.0 | 0.15 | 2.79 | 45.1 | 94.0 |
| | Comp 5 | Head | | 1.39 | | 2.23 | |
| | Cu Rougher Conc | 11.4 | 11.8 | 97.4 | 1.79 | 9.20 |
| | Zn Rougher Conc | 19.6 | 0.08 | 1.14 | 10.1 | 89.3 |
| | Note: these results are for rougher flotation only and have a lower concentrate grade than for the final concentrate assumed in the mineral reserve estimate. |
Locked-cycle flotation tests were performed separately on each of these four composites. Unfortunately, the zinc circuit flowsheet was not correctly simulated in the lab tests, with the first zinc cleaner tailings stream returned to the head of the zinc rougher circuit. Consequently, some interpretation was needed for the final zinc concentrate recoveries. Insufficient sample mass did not allow repeat locked-cycle tests or an overall blended composite to be tested.
Final concentrates were not analysed for minor elements other than gold, silver and arsenic.
For the mine planning work and Harena Mineral Reserves, it was assumed that a 26% Cu concentrate could be generated at 85% copper recovery. For the zinc circuit, a 52% Zn concentrate at 85% zinc recovery was estimated from the rougher flotation test results. Ongoing testwork by ALS Perth will provide more confidence in these estimates.
Figure 12.2 and Figure 12.3 show the cumulative concentrate grade versus recovery results for the four locked-cycle tests for copper and zinc. The mine plan estimates are also shown in the figures as large, red icons. For copper, the low-grade Comp 2 test resulted in a lower concentrate grade; otherwise, the remaining samples all followed the sample grade-recovery curve.
| PJ/ABE/ADD/CCS/AAN/NMW/CAE | Bisha_2016R&R-Update_TechRep_2CN010-024_20170808_aan_cae | August 2017 |
| SRK Consulting | |
| NI 43-101 Technical Report Bisha Mine 2016, Eritrea | Page 97 |
For zinc, the recirculation of first cleaner tails affected the concentrate recovery; however, the expected 52% Zn at 85% recovery falls well within the test results.
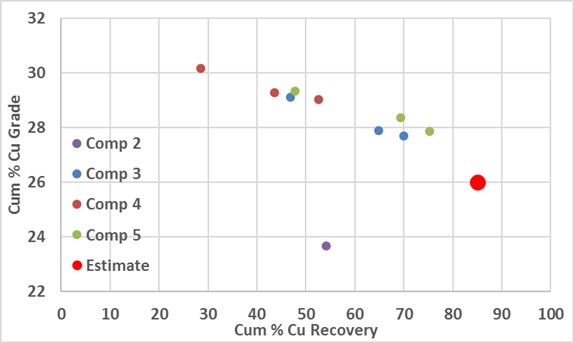
Source: SRK, 2017
Figure 12.2: Harena locked-cycle test copper concentrate grade vs. recovery

Source: SRK, 2017
Figure 12.3: Harena locked-cycle test zinc concentrate grade vs. recovery
| PJ/ABE/ADD/CCS/AAN/NMW/CAE | Bisha_2016R&R-Update_TechRep_2CN010-024_20170808_aan_cae | August 2017 |
| SRK Consulting | |
| NI 43-101 Technical Report Bisha Mine 2016, Eritrea | Page 98 |
| 12.5 | Plant Performance Since Commissioning |
The Bisha Main Phase III plant expansion for Primary material was commissioned in June 2016 with the addition of a zinc flotation circuit as well as zinc concentrate thickening and handling facilities. As part of the expansion, both copper and zinc circuit regrind mills were upgraded to M5000 IsaMills. Details of the Primary material flowsheet are included in Section 16.2.
At start-up of the Phase III plant, BMSC encountered copper-zinc selectivity issues with activated sphalerite reporting to the copper concentrate. Consequently, for the first six months of operation a bulk Cu-Zn concentrate was produced along with a zinc concentrate. The zinc losses to the copper circuit resulted in lower than expected zinc recovery.
Recent changes in copper circuit operation has shown considerable improvement in the quality of copper concentrate, as well as higher recoveries of Cu to copper concentrate and Zn to zinc concentrate.
| 12.5.1 | BMSC Primary Metallurgical Zones |
To develop a better understanding of the Primary material metallurgy, BMSC categorised samples into three zones: Boundary, Problematic and Primary, based on the ratio between zinc and copper recovery, or copper rougher selectivity curves shown in Figure 12.4.

Source: Pietroben, 2016
Figure 12.4: Definition of Bisha primary material zones
Primary zone material exhibited good copper-zinc selectivity, while Boundary zone showed no selectivity and Problematic was in between. Samples from all zones showed variable response in terms of selectivity, including sensitivity to reagent dosage and grind size.
| PJ/ABE/ADD/CCS/AAN/NMW/CAE | Bisha_2016R&R-Update_TechRep_2CN010-024_20170808_aan_cae | August 2017 |
| SRK Consulting | |
| NI 43-101 Technical Report Bisha Mine 2016, Eritrea | Page 99 |
A key factor in assigning each sample as being Primary, Problematic or Boundary is the endpoint of the curve, or total recovery to rougher concentrates. As part of BMSC’s zone definition, Primary material is expected to achieve <26% zinc recovery at 92% copper recovery (shown as dotted lines in Figure 12.4.
| 12.5.2 | Geometallurgical Database |
In late 2016, BMSC conducted an extensive geometallurgical sampling program to better characterise and identify the location of Primary, Problematic and Boundary zone material. At that time, BMSC was reliant on conducting copper rougher flotation tests under a specific set of conditions in order to categorise the sample response.
Figure 12.5 shows the location of the geometallurgical database samples, including 26 diamond-drillholes, grab samples and reverse-circulation (RC) drill chip samples. Red icons are associated with Boundary material, yellow icons with Problematic and green icons with Primary material.
| SRK Consulting |
| NI 43-101 Technical Report Bisha Mine 2016, Eritrea | Page 99 |

Source: Nevsun, 2017
Figure 12.5: Location of geometallurgical samples
All samples were received, prepared, tested and assayed by the on site facilities at BMSC due to restrictions/delays in shipping samples out of the country. No parallel testing was done on geometallurgical samples by an external, commercial laboratory.
A review of the geometallurgical database results by SRK showed a number of quality control issues including poor control of the primary grind size and reconciliation between measured and back-calculated head assays. Consequently, in SRK’s estimate of Primary material performance, greater reliance was placed on the ALS Kamloops 2014 data set (ALS Metallurgy, 2014).
| PJ/ABE/ADD/CCS/AAN/NMW/CAE | Bisha_2016R&R-Update_TechRep_2CN010-024_20170808_aan_cae | August 2017 |
| SRK Consulting |
| NI 43-101 Technical Report Bisha Mine 2016, Eritrea | Page 100 |
| 12.5.3 | Copper Speciation Data |
It is well recognised that one reason for the activation of sphalerite in the copper flotation circuit is the presence of secondary copper minerals (e.g. chalcocite and covellite). Copper mineral speciation estimates by sequential acid and cyanide leach tests were routinely done on both the BMSC geometallurgical samples as well as by the commercial lab testwork programs (both ALS Kamloops and ALS Perth).
Cyanide-soluble copper (CNCu) assays are an estimate of the amount of secondary copper minerals present in the sample. It is recognised that this method can vary between laboratories in the procedure used and is only an estimate. In particular, the possibility of dissolving a portion of the chalcopyrite in the acid leach stage and reporting as CNCu.
Figure 12.4 compares three datasets of CNCu proportions against total copper assay: the Bisha Main drillhole data prior to late 2016, the geometallurgical database and the variability testwork conducted by ALS Metallurgy (2014).

Source: SRK, 2017
Figure 12.6: Cyanide-soluble copper estimates vs. total copper
Over the same range of total copper assays, the KM3960 results showed typically <10% CNCu with only a few samples >30% CNCu. The Bisha Main drillhole data showed up to 50% CNCu with most samples showing 5% to 30% CNCu. The BMSC geometallurgical database showed almost all samples were >20% CNCu and up to 75% CNCu in some cases.
| PJ/ABE/ADD/CCS/AAN/NMW/CAE | Bisha_2016R&R-Update_TechRep_2CN010-024_20170808_aan_cae | August 2017 |
| SRK Consulting |
| NI 43-101 Technical Report Bisha Mine 2016, Eritrea | Page 101 |
In SRK’s opinion, the results from the BMSC sequential copper assays are not consistent with the other two data sets and should be reviewed; including QAQC checks by an external laboratory. It is quite likely that the very high sulphide content (in particular, pyrite) is influencing the test results.
As of December 2016, the geometallurgical database results showed little/no correlation between CNCu estimates and the copper-zinc selectivity. However, BMSC is using the relative proportion of CNCu and ASCu as a guideline for mill feed blending. They are also actively seeking a modified method for sequential copper analysis that offers a more accurate estimate of copper-zinc selectivity.
In SRK’s opinion, one reason for the poor correlation between secondary copper content and copper-zinc selectivity is the high degree of variability observed in the sample response during copper rougher flotation.
In categorising sample response as Boundary, Problematic or Primary, BMSC test procedure is to apply one set of flotation conditions; for example, constant primary grind size and depressant addition based on zinc grade and collector addition based on copper grade.
There are numerous examples in the commercial testwork results where the copper-zinc selectivity was dramatically changed by adjusting reagent dosages and/or grind size. The selectivity curves shown in Figure 12.5 are for a 1.2% Cu, 3.0% Zn sample tested by ALS Kamloops in 2014. Increasing sodium cyanide dosage resulted in a significant shift in zinc response.
| PJ/ABE/ADD/CCS/AAN/NMW/CAE | Bisha_2016R&R-Update_TechRep_2CN010-024_20170808_aan_cae | August 2017 |
| SRK Consulting |
| NI 43-101 Technical Report Bisha Mine 2016, Eritrea | Page 102 |
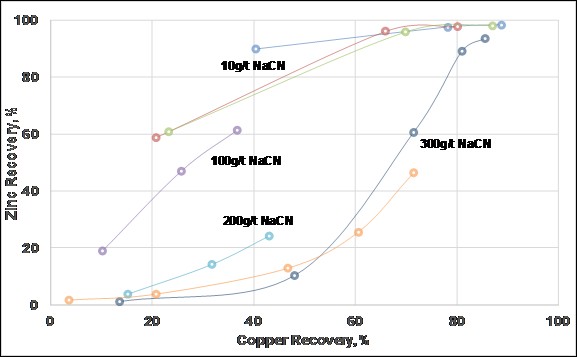
Source: SRK, 2017
Figure 12.7: Example effect of cyanide dosage on Cu-Zn selectivity
As another example, Figure 12.8 shows similar selectivity shifts for two composites tested by ALS Perth in 2016 (Comp 14 was 0.91% Cu, 17.8% Zn and Comp 20 was 0.61% Cu, 5.6% Zn).
It is SRK’s opinion that the majority of samples tested by BMSC in the geometallurgical program categorised as “unselective” (e.g. Boundary and/or Problematic) could produce better copper-zinc selectivity under different grind size/reagent conditions.
Consequently, in updating the metallurgical performance estimates for Primary material, SRK relied heavily on the locked-cycle and variability test results from KM3960 in 2014 as the basis for the relationships. However, as discussed in Section 12.6.2, the BMSC geometallurgical sample results did correlate well with the KM3960 relationships, once the database was filtered.
| PJ/ABE/ADD/CCS/AAN/NMW/CAE | Bisha_2016R&R-Update_TechRep_2CN010-024_20170808_aan_cae | August 2017 |
| SRK Consulting |
| NI 43-101 Technical Report Bisha Mine 2016, Eritrea | Page 103 |

Source: Pietroben, 2017
Figure 12.8: Example effect of sulphate & cyanide dosage on Cu-Zn selectivity
| 12.6 | Metallurgical Performance Estimates |
As the BMSC Phase III plant was experiencing an extended commissioning period in 2016, SRK reviewed all available testwork data to provide estimates of Primary material performance. This work was completed in late 2016 under the technical supervision of Tom Shouldice (TS Technical Services) as an SRK associate.
| 12.6.1 | Primary Material Domains |
In SRK’s review of testwork results, it was apparent that geometallurgical domains are needed to divide the Primary material into zones of relatively consistent performance (i.e. copper-zinc selectivity). Each of these domains would require a particular set of copper rougher flotation conditions to generate saleable copper and zinc concentrates.
To date, sequential copper results or the presence of non-sulphide metal ions (EDTA solution wash) have not been correlated with Primary material selectivity. In the absence of any predictive tool for Primary material response, SRK followed the domains used by ALS Kamloops, based on the Zn/Cu feed grade ratios. Four copper-zinc domains were used:
Zn/Cu <2 Zn/Cu 2 to 4 Zn/Cu 4 to 10 Zn/Cu 10 to 20
Primary material with a Zn/Cu >20 was considered zinc only, with no copper concentrate being produced. Figure 12.9 shows a plan view of the Bisha Main pit with coloured areas for each of these Zn/Cu domains.
| PJ/ABE/ADD/CCS/AAN/NMW/CAE | Bisha_2016R&R-Update_TechRep_2CN010-024_20170808_aan_cae | August 2017 |
| SRK Consulting |
| NI 43-101 Technical Report Bisha Mine 2016, Eritrea | Page 104 |
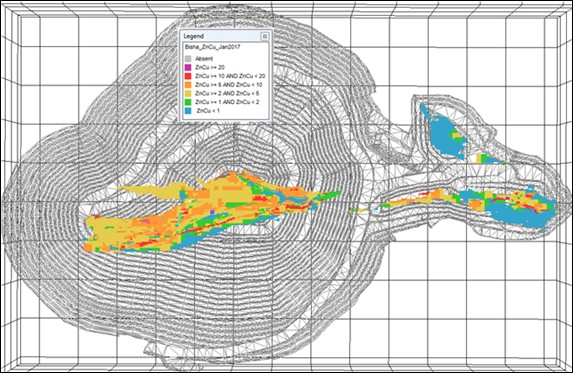
Source: SRK, 2017
Figure 12.9: Plan view of Bisha Main pit showing distribution of Zn-Cu grade zones
As each geometallurgical domain will require particular plant operating conditions to achieve reasonable copper-zinc selectivity, it is expected that BMSC would separately campaign feed material from each domain rather than blend material from different domains. The current BMSC practice is to blend material to maintain a Zn/Cu feed ratio of around 6:1.
The concern with a campaign strategy of processing Primary material is the impact of stockpiling mill feed for an extended period. To date, limited information is available on the effect of stockpiling Primary material and is part of the ongoing testwork program being conducted at ALS Perth. Options to reduce the effect of material oxidation/weathering by covering the stockpiles or shortening the time spent before feeding the mill might need to be considered, based on the results gathered from this testwork.
| 12.6.2 | Metallurgical Relationships |
A review by SRK of the testwork results from KM3960, by ALS Kamloops in 2014 showed some clear relationships for both copper and zinc recovery to the copper rougher concentrate (Figure 12.10). This was observed in the rougher/cleaner variability testwork and confirmed in the locked-cycle tests conducted on the master composites.
Over the range of Zn/Cu feed ratios tested, the copper recovery to rougher concentrate diminished slightly from 90% down to 75%. The zinc recovery relationship was more dramatic, with up to 80% of zinc in the low Zn/Cu domain reporting to the copper rougher concentrate. It should be noted that for samples with low zinc head grades, a reasonable proportion of zinc can report to the final copper concentrate without affecting its saleability.
| PJ/ABE/ADD/CCS/AAN/NMW/CAE | Bisha_2016R&R-Update_TechRep_2CN010-024_20170808_aan_cae | August 2017 |
| SRK Consulting |
| NI 43-101 Technical Report Bisha Mine 2016, Eritrea | Page 105 |

Source: SRK, 2017
Figure 12.10: Primary material recovery relationships by Zn-Cu zone
Across the Bisha Main deposit, the copper grade of Primary material is quite consistent at around 1% Cu while the zinc grade ranges from 0.4% to 20%. Therefore, the Zn-Cu domain categories are predominantly due to increased zinc grades.
Figure 12.11 shows the ALS 2014 and filtered BMSC test results compared with the applied relationship for copper recovery.
| PJ/ABE/ADD/CCS/AAN/NMW/CAE | Bisha_2016R&R-Update_TechRep_2CN010-024_20170808_aan_cae | August 2017 |
| SRK Consulting |
| NI 43-101 Technical Report Bisha Mine 2016, Eritrea | Page 106 |

Source: SRK, 2017
Figure 12.11: Primary material recovery relationships with BMSC Data
Before applying the relationships shown in Figure 12.11 to the BMSC database, the geometallurgical test results were filtered for QAQC issues, low Cu + Zn grades or high Zn/Cu ratios (i.e. zinc only material). After eliminating tests that did not pass on QAQC or grade limits, the remaining geometallurgical results followed the assumed relationships for copper rougher concentrate as well as the ALS 2014 tests. The degree of scatter evident in Figure 12.11 is reflected in the recovery estimates made in the next section.
| 12.6.3 | Summary of Metallurgical Estimates |
After reviewing the final concentrates produced during the locked-cycle testwork by ALS Kamloops in 2014, SRK provided estimates of copper and zinc concentrate grade and recoveries, by Zn/Cu domain (Table 12.2).
Table 12.2: Primary material metallurgical estimates
| | Zn/Cu Domain | Copper Concentrate | Zinc Concentrate |
| | % Cu | % Zn | % Cu Recovery | % Zn | % Cu | % Zn Recovery |
| | < 2 | 30 | 3 | 80% +5, -10% | 52 | 2.0 | 50% +5, -10% |
| | 2 to 4 | 28 | 5 | 75% +10, 10% | 52 | 1.5 | 69% +10, -10% |
| | 4 to 10 | 26 | 5 | 70% +10, -10% | 52 | 1.0 | 77% +10, -10% |
| | 10 to 20 | 20 | 8 | 65% +5, -5% | 52 | 0.5 | 84% +5, -5% |
| | > 20 | Not produced | 52 | 0.5 | 90% +5, -5% |
| PJ/ABE/ADD/CCS/AAN/NMW/CAE | Bisha_2016R&R-Update_TechRep_2CN010-024_20170808_aan_cae | August 2017 |
| SRK Consulting |
| NI 43-101 Technical Report Bisha Mine 2016, Eritrea | Page 107 |
Note that due to the high variability observed in the test results, the Cu to copper concentrate and Zn to zinc concentrate recoveries were given a range of values, up to ±10%. It should also be stated that any impact of stockpiling or material weathering/oxidation is not considered in these estimates.
For low Zn/Cu feed ratio domains, copper performance is very good, but with lower Zn recovery to the zinc concentrate due to the lower head grade. As the Zn/Cu ratio increases, copper recovery lowers and the zinc content of the copper concentrate increases. Similarly, the copper content of the zinc concentrate decreases as the zinc recovery to zinc concentrate increases.
SRK estimates that for all four copper-zinc domains, 20% to 30% Cu in copper concentrate and 52% Zn in zinc concentrate is achievable. This is based on the commercial laboratory testwork results to date and separate campaign processing of each domain. The concentrate grades used for the mineral reserve estimates are discussed further in Section 16 and are based on actual mill performance.
For Zn/Cu feed ratios above 20, it is assumed that no copper concentrate is generated.
Figure 12.12 and Figure 12.13 show the final copper and zinc concentrate recovery versus grades for the SRK estimates compared with the locked cycle test results.
At present, BMSC are improving in their copper circuit performance with saleable copper concentrate being generated since early 2017. This is due to shorter copper flotation times as well as changes in pH conditions as well as collector/depressant reagents.

Source: SRK, 2017
Figure 12.12: Estimated primary material copper concentrate recovery vs. grade
| PJ/ABE/ADD/CCS/AAN/NMW/CAE | Bisha_2016R&R-Update_TechRep_2CN010-024_20170808_aan_cae | August 2017 |
| SRK Consulting |
| NI 43-101 Technical Report Bisha Mine 2016, Eritrea | Page 108 |

Source: SRK, 2017
Figure 12.13: Estimated primary material zinc concentrate recovery vs. grade
In SRK’s opinion, the Bisha is moving closer to achieving the estimates shown in Table 12.2, which would be aided by campaign processing of specific metallurgical domains and not blending material from different domains.
| 12.7 | Conclusions and Recommendations |
For the Bisha Main and Harena deposits, the majority of mineralised material remaining is considered Primary zone, with both copper and zinc grade. The remaining Oxide material is being stockpiled for future consideration; minimal copper-only Supergene remains to be processed.
In June 2016, BMSC commissioned a Phase III expansion of the process plant that includes zinc flotation, zinc concentrate dewatering/handling as well as an upgrade of the two regrind mills.
Issues with sphalerite activation were experienced by BMSC for most of 2016, resulting in a bulk concentrate being produced instead of a copper concentrate. Recent changes made by BMSC in the copper circuit operation have shown improvements in the copper concentrate quality.
As at December 2016, the geometallurgical database results showed little/no correlation between CNCu estimates and the copper-zinc selectivity. However, BMSC is using the relative proportion of CNCu and ASCu as a guideline for mill feed blending. They are also actively seeking a modified method for sequential copper analysis that offers a more accurate estimate of copper-zinc selectivity. The same is true for non-sulphide metal ion content as measured by EDTA wash assays.
| PJ/ABE/ADD/CCS/AAN/NMW/CAE | Bisha_2016R&R-Update_TechRep_2CN010-024_20170808_aan_cae | August 2017 |
| SRK Consulting |
| NI 43-101 Technical Report Bisha Mine 2016, Eritrea | Page 109 |
SRK and TS Technical Services reviewed the Primary material testwork results and made suggestions of estimated metallurgical performance, assuming separate campaign processing of material by Zn/Cu feed ratio or domains. This is because each metallurgical domain will require a particular set of copper rougher flotation conditions to generate both saleable copper and zinc concentrates.
In SRK’s opinion, almost all of the Primary material can generate a saleable copper concentrate, but with varying recovery. The same is true for the zinc concentrate, depending on the Zn/Cu feed ratio.
Issues remain with how BMSC can separately process campaigns of different Zn/Cu domains, including stockpiling material for extended periods. Limited information is available on the effect of sample weathering/oxidation but preliminary indications are it could be significant and at least, require a major change in reagent scheme to process such oxidised material.
SRK includes the following recommendations for future metallurgical testwork, based on a well-established set of metallurgical domains:
| | - Review of current sequential copper methods being used to estimate the secondary copper content
- Investigate the effect of weathering/oxidation and methods to reduce the impact of medium to long-term stockpiling of Primary material
- Sample and evaluate the performance of currently stockpiled Primary material
- Investigate the effect of primary grind size on copper-zinc selectivity
- Determine the optimal pH and reagent conditions for each metallurgical domain
- Establish the sensitivity of results within each domain and whether campaign processing is required, optional or not necessary.
|
For the BMSC plant operation, SRK also recommends:
| | - A review of all plant measurements to confirm feed conditions are stable and process performance is somewhat predictable
- Conduct a series of plant trials on a single metallurgical domain where prior lab testwork conditions are applied to the plant while processing the material, to compare lab versus plant performance.
- Minor upgrades to processing plant for water reticulation, pumps, etc.
- The cost estimate for these recommendations is about $0.3M to $0.5M, depending on the number of samples required to provide sufficient confidence in the outcome
|
| PJ/ABE/ADD/CCS/AAN/NMW/CAE | Bisha_2016R&R-Update_TechRep_2CN010-024_20170808_aan_cae | August 2017 |
| SRK Consulting |
| NI 43-101 Technical Report Bisha Mine 2016, Eritrea | Page 110 |
| 13 | Mineral Resource Estimates |
Mineral Resources are classified and reported in accordance with the CIM Definition Standards for Mineral Resources and Mineral Reserves (May, 2014). Mineral Resources are reported for the Bisha Main, Harena, Hambok, Northwest and Asheli deposits. At Bisha Main, 11,770 m of drilling in 21 holes was completed in 2016 testing the deposit below the proposed ultimate pit. This work has determined the down dip extent of the deposit. In 2016, 6,080 metres of new drilling was completed at Harena continuing to extend the deposit to depth where it remains open. Asheli was discovered in June 2015 by Bisha as part of the Regional Exploration Program. In 2016, 12,918 m of drilling were completed in 28 holes resulting in the definition of a new inferred resource. Mineral Resources for Hambok and Northwest are unchanged since 2014.
Consolidated Mineral Resource estimates for five deposits reported in Table 13.1 are inclusive of Mineral Reserves. Table 13.2 through Table 13.6 show mineral resource estimates for Bisha Main, Harena, Asheli, Northwest and Hambok deposits respectively.
Table 13.1: Mineral Resource statement for Bisha Main deposit, Eritrea, as of 31 December 2016
| | Category | Quantity | Grade |
| | (000’s t) | (% Zn) | (% Cu) | (g/t Au) | (g/t Ag) |
| | Measured | 1,300 | 6.37 | 1.09 | 0.9 | 42 |
| | Indicated | 33,670 | 4.10 | 1.01 | 0.5 | 32 |
| | Total M+I | 34,970 | 4.18 | 1.02 | 0.6 | 33 |
| | Inferred (including stockpiles) | 33,790 | 4.74 | 1.01 | 0.8 | 25 |
| PJ/ABE/ADD/CCS/AAN/NMW/CAE | Bisha_2016R&R-Update_TechRep_2CN010-024_20170808_aan_cae | August 2017 |
| SRK Consulting |
| NI 43-101 Technical Report Bisha Mine 2016, Eritrea | Page 111 |
Table 13.2: Mineral Resource statement for Bisha Main deposit, Eritrea, as of 31 December 2016
| | Domain | Quantity
(000’s t) | Grades |
| | (% Zn) | (% Cu) | (g/t Au) | (g/t Ag) |
| | Measured Open Pit |
| | Oxide | 10 | | | 8.4 | 40 |
| | Supergene | 30 | | 2.97 | 0.6 | 30 |
| | Boundary | 10 | 1.24 | 5.57 | 0.6 | 54 |
| | Primary | 1,250 | 6.62 | 1.02 | 0.8 | 42 |
| | Total Measured | 1,300 | 6.37 | 1.09 | 0.9 | 42 |
| | Indicated Open Pit |
| | Supergene | 110 | | 1.33 | 0.4 | 10 |
| | Boundary | 60 | 1.85 | 1.34 | 0.5 | 24 |
| | Primary | 19,140 | 5.74 | 0.97 | 0.7 | 45 |
| | Total Indicated | 19,310 | 5.70 | 0.97 | 0.7 | 45 |
| | Total M+I | 20,610 | 5.74 | 0.98 | 0.7 | 45 |
| | Inferred Open Pit |
| | Oxide | 10 | | | 1.6 | 25 |
| | Supergene | 780 | 1.85 | 1.23 | 0.1 | 1 |
| | Inferred Underground |
| | Primary | 1,460 | 7.44 | 0.73 | 0.9 | 43 |
| | Stockpiles Inferred |
| | Oxide-Au | 210 | | | 1.2 | 70 |
| | Oxide-Cu | 300 | | 1.45 | 0.2 | 6 |
| | Oxide | 320 | | | 5.1 | 172 |
| | Supergene | 40 | | 2.33 | 0.7 | 38 |
| | Boundary | 2,290 | 4.13 | 1.56 | 0.8 | 39 |
| | Primary | 200 | 4.50 | 0.74 | 0.7 | 36 |
| | Notes to be read in conjunction with the Mineral Resource table: |
| | (1) | Open Pit Mineral Resources are defined within an optimal Lerch-Grossman (LG) Pit Shell, generated using commodity prices for copper, zinc, gold and silver of $3.00/lb, $1.20/lb, $1,265/oz and $21/oz respectively using blocks of all Resource categories. The mining cost and total ore based cost (process, G&A and stockpile rehandle) applied was approximately 10-15% below the long term view on costs. Overall pit slopes varied from 38° to 44°. NSR cut-off used were: $37.50/t for Oxide Phase, $37.00/t for Supergene and $35.00/t for Primary Phase. |
| | (2) | Tonnage is rounded to the nearest 10,000 tonnes and grades are rounded to two decimal places for copper and zinc, one decimal place for gold, and zero decimal places for silver. Contained metal for copper and zinc are rounded to the nearest million pounds. Contained metal for silver is rounded to the nearest 10,000 ounces and gold is rounded to the nearest 1,000 ounces. |
| | (3) | Rounding as required by reporting guidelines may result in apparent summation differences between tonnes, grade and contained metal content. |
| | (4) | Tonnage and grade measurements are in metrics units. Contained gold and silver ounces are reported as troy ounces, contained copper and zinc as avoirdupois pounds. |
| | (5) | The Underground resource was derived by defining a shape around contiguous blocks with an NSR > $100/t outside the optimised resource pit shell. The $100 NSR cut-off represents the processing cost plus approximately $60/t mining cost. |
| | (6) | Stockpile quantities and grades are based on surveyed volume and grade control estimated grades; Inferred stockpiles do not have metallurgical testwork demonstrating they are treatable. |
| PJ/ABE/ADD/CCS/AAN/NMW/CAE | Bisha_2016R&R-Update_TechRep_2CN010-024_20170808_aan_cae | August 2017 |
| SRK Consulting |
| NI 43-101 Technical Report Bisha Mine 2016, Eritrea | Page 112 |
Table 13.3: Mineral Resource statement for Harena deposit, Eritrea, as of 31 December 2016
| | Category | Quantity | Grade |
| | (000’s t) | (% Zn) | (% Cu) | (g/t Au) | (g/t Ag) |
| | Open Pit |
| | Indicated | | | | | |
| | Primary | 3,950 | 3.16 | 0.87 | 0.6 | 28 |
| | Inferred | | | | | |
| | Oxide | 120 | | | 2.0 | 20 |
| | Primary | 1,920 | 2.19 | 0.87 | 0.6 | 28 |
| | Underground |
| | Inferred | | | | | |
| | Primary | 23,020 | 4.96 | 0.93 | 0.8 | 30 |
| | Notes to be read in conjunction with Mineral Resource table: |
| | (1) | Open Pit Mineral Resources are defined within an optimal Lerchs-Grossman (LG) pit shell, generated using commodity prices for copper, zinc, gold and silver of $3.00/lb, $1.20/lb, $1,265/oz and $21/oz respectively using blocks of all Resource categories. The mining cost and total ore based cost (process, G&A and stockpile rehandle) applied was approximately 10% below the long term view on costs with appropriate ore haulage costs for each satellite deposit. Overall pit slopes varied from 29° to 35.5° NSR cut-offs used were $40.00/t for Oxide and $41.00/t for Primary. |
| | (2) | Net Smelter Return values were calculated for each block using all resource categories, commodity prices, recoveries, appropriate smelter terms and downstream costs. Metallurgical recoveries, supported by metallurgical testwork, were applied as follows: Oxide zone: a recovery of 75% and 22% were applied for gold and silver respectively; and Primary zone; recoveries to copper concentrate of 85%, 36% and 29% were applied for copper, gold and silver respectively. A zinc recovery to zinc concentrate of 85% was applied. |
| | (3) | Open Pit Mineral Resources are reported within the pit shell generated using the specified commodity prices, using NSR block grade cut-off derived as above. Tonnage is rounded to the nearest 10,000 tonnes and grades are rounded to two decimal places for copper and zinc, one decimal place for gold, and zero decimal places for silver. Contained metal for copper and zinc are rounded to the nearest million pounds. Contained metal for silver is rounded to the nearest 10,000 ounces and gold is rounded to the nearest 1,000 ounces. |
| | (4) | Rounding may result in apparent summation differences between tonnes, grade and contained metal content. |
| | (5) | Tonnage and grade measurements are in metrics units. Contained gold and silver ounces are reported as troy ounces, contained copper and zinc pounds as imperial pounds. |
| | (6) | Underground Inferred Resources were derived by selecting contiguous blocks outside the optimised resource pit shell, with an NSR cut-off of $100, which represents the processing cost plus approximately $60/t mining cost. |
| | (7) | Mineral Resources that are not Mineral Reserves do not have demonstrated economic viability. |
Table 13.4: Inferred Mineral Resource statement for Asheli deposit, Eritrea as of 31 December 2016
| | Zone | Quantity
(t) | Grade | NSR ($/t) |
| | (% Zn) | (% Cu) | (g/t Au) | (g/t Ag) | (g/t As) | (% Pb) |
| | Low Grade | 1,677,000 | 5.2 | 1.9 | 0.36 | 28 | 772 | 0.05 | $154 |
| | High Grade | 723,000 | 16.6 | 1.9 | 0.39 | 33 | 734 | 0.14 | $301 |
| | Total | 2,400,000 | 8.6 | 1.9 | 0.37 | 30 | 760 | 0.08 | $199 |
| PJ/ABE/ADD/CCS/AAN/NMW/CAE | Bisha_2016R&R-Update_TechRep_2CN010-024_20170808_aan_cae | August 2017 |
| SRK Consulting |
| NI 43-101 Technical Report Bisha Mine 2016, Eritrea | Page 113 |
Table 13.5: Mineral Resource statement for Northwest deposit, Eritrea, as of 31 December 2016
| | Category | Quantity | Grade |
| | (000’s t) | (% Zn) | (% Cu) | (g/t Au) | (g/t Ag) |
| | Indicated | | | | | |
| | Supergene | 1,020 | | 1.47 | 0.2 | 10 |
| | Primary | 2,530 | 1.08 | 1.04 | 0.3 | 13 |
| | Inferred | | | | | |
| | Oxide | 500 | | | 3.7 | 18 |
| | Supergene | 100 | | 0.8 | 3.7 | 19 |
| | Primary | 100 | 0.9 | 0.9 | 2.9 | 15 |
| | Notes to be read in conjunction with Mineral Resource table for Northwest: |
| | (1) | No change has occurred Northwest since 2014 which used commodity prices for copper, zinc, gold and silver of $3.35/lb, $1.05/lb, $1,350/oz and $23/oz, respectively. Open Pit Mineral Resources are defined within an optimal Lerchs-Grossman (LG) Pit Shell. The mining cost and total ore based cost (process, G&A and stockpile re-handle) applied was approximately 10% below the long-term view on costs with appropriate ore haulage costs for each satellite deposit. Overall pit slopes varied from 39˚ to 45˚ for Northwest. NSR cut-off used were: $40.70/t for Oxide Phase, $39.70/t for Supergene and Primary Phase. |
| | (2) | Net Smelter Return values were calculated for each block using all resource categories, commodity prices, recoveries, appropriate smelter terms and downstream costs. Metallurgical recoveries, supported by metallurgical testwork, were applied as follows: |
| | | a. | Oxide Phase; recoveries of 88% and 22% were applied to gold and silver respectively. |
| | | b. | Supergene Phase; recoveries of 87%, 46% and 50% were applied for copper, gold and silver respectively. Zinc has not been assigned a recovery as the values are isolated on the fringes of the deposit. |
| | | c. | Primary Phase; recoveries to copper concentrate of 87%, 36% and 29% were applied for copper, gold and silver respectively. Recoveries to zinc concentrate of 81%, 36% and 29% were applied for zinc, gold and silver respectively. |
| | (3) | Open Pit Mineral Resources are reported within the pit shell generated using the specified commodity prices, using NSR block grade cut-off derived as above. Tonnage is rounded to the nearest 10,000 tonnes and grades are rounded to two decimal places for copper and zinc, one decimal place for gold and zero decimal places for silver. Tonnages and grades for the Inferred category are further rounded reflecting the uncertainty that attaches to this category. Contained metal for copper and zinc are rounded to the nearest ten thousand pounds. |
| | (4) | Rounding as required by reporting guidelines may result in apparent summation differences between tonnes, grade and contained metal content. |
| | (5) | Tonnage and grade measurements are in metrics units. Contained gold and silver ounces are reported as troy ounces, contained copper and zinc pounds as imperial pounds. |
| PJ/ABE/ADD/CCS/AAN/NMW/CAE | Bisha_2016R&R-Update_TechRep_2CN010-024_20170808_aan_cae | August 2017 |
| SRK Consulting |
| NI 43-101 Technical Report Bisha Mine 2016, Eritrea | Page 114 |
Table 13.6: Mineral Resource statement for Hambok deposit, Eritrea, as of 31 December 2016
| | Category | Quantity | Grade |
| | (000’s t) | (% Zn) | (% Cu) | (g/t Au) | (g/t Ag) |
| | Indicated | | | | | |
| | Primary | 6,860 | 1.86 | 1.14 | 0.2 | 10 |
| | Inferred | | | | | |
| | Oxide | 20 | | | 1.5 | 17 |
| | Notes to be read in conjunction with Mineral Resource tables for Hambok: |
| | (1) | No change has occurred to Hambok since 2014 which used commodity prices for copper, zinc, gold and silver of $3.35/lb, $1.05/lb, $1,350/oz and $23/oz, respectively. Mineral Resources are defined within an optimal Lerchs-Grossman (LG) Pit Shell. The mining cost and total ore based cost (process, G&A and stockpile rehandle) applied was approximately 10% below the long term view on costs with appropriate ore haulage costs for each satellite deposit. Overall pit slopes was 40 overall for Hambok (preliminary assessment). NSR cut-off used were: $44.45/t for Oxide Phase and $43.45/t for Primary Phase. |
| | (2) | Net Smelter Return values were calculated for each block using all resource categories, commodity prices, recoveries, appropriate smelter terms and downstream costs. Metallurgical recoveries, supported by metallurgical testwork, were applied as follows: |
| | a. | Oxide Phase; recoveries of 88% and 22% were applied to gold and silver respectively. |
| | b. | Primary Phase; recoveries to copper concentrate of 88%, 87%, 36% and 29% were applied for copper, zinc, gold and silver respectively. Preliminary metallurgical characterisation studies, but not full testing, have been completed for Hambok. |
| | (3) | Mineral Resources are reported within the pit shell generated using the specified commodity prices, using NSR block grade cut-off derived as above. Tonnage is rounded to the nearest 10,000 tonnes and grades are rounded to two decimal places for copper and zinc, one decimal place for gold and zero decimal places for silver. Contained metal for copper and zinc are rounded to the nearest ten thousand pounds. |
| | (4) | Rounding as required by reporting guidelines may result in apparent summation differences between tonnes, grade and contained metal content. |
| | (5) | Tonnage and grade measurements are in metrics units. Contained gold and silver ounces are reported as troy ounces, contained copper and zinc pounds as imperial pounds. |
The Bisha Main deposit data was extracted from the master BMSC site database on 25 August 2016, and includes assays of all resource drillholes up to and including BX-059. The data was loaded into an MS Access database; a summary of records is presented in Table 13.7.
Table 13.7: Database bisha201600825.mdb summary
| | Table | Number of Records |
| | Collar | 713 |
| | Survey | 5,097 |
| | Assay | 51,967 |
| | Geology | 10,703 |
| 13.1.2 | Solid Body Modelling |
To create a mineralisation wireframes, all drillhole intervals logged as massive sulphide were interpreted on cross sections into steeply west dipping units. Internal waste of less than 2 m downhole was included in the interpretation. From the sectional interpretations, three-dimensional wireframes were formed. These wireframes were then classified into five general areas: Main Zone South, Main Zone North, Hanging Wall Massive Sulphide South, Hanging Wall Massive Sulphide North and Hanging Wall Copper.
| PJ/ABE/ADD/CCS/AAN/NMW/CAE | Bisha_2016R&R-Update_TechRep_2CN010-024_20170808_aan_cae | August 2017 |
| SRK Consulting |
| NI 43-101 Technical Report Bisha Mine 2016, Eritrea | Page 115 |
The Massive Sulphide wireframes were then subdivided into Supergene (Cu), Primary (Zn) and Boundary zones (mixed). Statistical analysis of the metal grades in the massive sulphide showed a step change at the base of the Supergene at a 2% Cu grade cut; and a step change at a 1% Zn grade at the top of the Primary Zone. The Boundary is the zone between the base of the Supergene and the top of the Primary; it ranges from 5 m to 20 m thick.
The Zn composites in the massive sulphide have a bimodal distribution; a High Grade Zone was interpreted internal to the Primary massive sulphide at a nominal 10% Zn cut-off.
Surrounding the massive sulphide wireframes, stringer sulphide lithologies were interpreted, conforming to the subsurface replacement origin model for the Bisha Main deposit proposed by McPhie (2013).
Additional mineralised domains modelled include the Gossan, Soap, and Pyritic Sand units.
Weathering surfaces, based upon lithology logs, core photos, and mineral assemblages, were constructed to define the main weathering and oxidation domains. In addition to the surfaces created at the bottom of the supergene material and the kaolin rich/acid zone, two weathering surfaces were created for the base of saprollite and the base of alluvial material.
The Bisha Main database drillholes were intersected with mineralisation wireframes, and the intersections flagged with the Zone number. Assay grades were composited to 2.0 m lengths downhole, using a best fit approach, which resulted in composites of variable but equal length within each coded intersection, ensuring that the composite length was as near as possible to the nominal length. For each Zone, a single composite file was created with the grades in the order Cu, Zn, Pb, Ag, As, and Au. The uncut composite statistics of each domain are tabulated in Table 13.8.
| PJ/ABE/ADD/CCS/AAN/NMW/CAE | Bisha_2016R&R-Update_TechRep_2CN010-024_20170808_aan_cae | August 2017 |
| SRK Consulting |
| NI 43-101 Technical Report Bisha Mine 2016, Eritrea | Page 116 |
Table 13.8: Mean grade of each interpreted mineralised domain
| | Domain | Mineralised Zone | (% Cu) | (% Zn) | (% Pb) | (g/t Ag) | (g/t As) | (g/t Au) |
| | 100 | Gossan | 0.13 | 0.09 | 0.53 | 18.77 | 2,583 | 5.68 |
| | 101 | Soap | 0.19 | 0.03 | 0.10 | 12.74 | 427 | 0.53 |
| | 102 | Sand | 0.37 | 0.02 | 0.96 | 182.73 | 619 | 14.01 |
| | 200 | Main North Supergene | 4.72 | 0.15 | 0.21 | 36.83 | 1,204 | 1.30 |
| | 201 | Main South Supergene | 6.16 | 0.46 | 0.47 | 78.27 | 1,376 | 1.40 |
| | 202 | HW North Supergene | 3.46 | 0.12 | 0.09 | 31.67 | 784 | 1.07 |
| | 203 | HW South Supergene | 4.21 | 0.31 | 0.26 | 40.67 | 1,595 | 0.78 |
| | 204 | Low Grade Supergene | 0.46 | 0.01 | 0.02 | 7.29 | 508 | 0.39 |
| | 300 | Main North Boundary | 1.61 | 1.87 | 0.08 | 23.60 | 775 | 0.76 |
| | 301 | Main South Boundary | 2.27 | 2.66 | 0.30 | 46.87 | 833 | 0.71 |
| | 302 | HW North Boundary | 0.56 | 3.01 | 0.10 | 23.80 | 774 | 0.64 |
| | 303 | HW South Boundary | 1.19 | 1.47 | 0.15 | 25.16 | 1,139 | 0.78 |
| | 304 | Stringer Boundary | 0.51 | 0.20 | 0.05 | 9.25 | 141 | 0.18 |
| | 400 | Main North Primary | 0.44 | 0.96 | 0.03 | 12.03 | 467 | 0.58 |
| | 401 | Main South Primary | 1.03 | 3.09 | 0.11 | 37.38 | 530 | 0.68 |
| | 402 | HW North Primary | 0.42 | 0.64 | 0.01 | 12.32 | 366 | 0.50 |
| | 403 | HW South Primary | 0.39 | 1.73 | 0.11 | 20.13 | 537 | 0.69 |
| | 500 | High Grade Primary | 1.05 | 15.81 | 0.69 | 76.68 | 1,161 | 0.76 |
| | 600 | Stringer Primary | 0.34 | 0.38 | 0.01 | 7.70 | 79 | 0.19 |
| | 700 | HWCU | 1.05 | 0.03 | 0.00 | 0.80 | 228 | 0.01 |
13.1.4 Evaluation of Outliers
Histograms of the distribution of composites were examined for each element in each domain. Special attention was paid to elements with a high coefficient of variance (above 1.5) and obvious outliers or mixed populations.
From this inspection, a set of top cut values were determined, which were intended to reduce the variability of the composite population and reduce the influence of outliers. Not every element in every domain was cut; those that were, are tabulated in Table 13.9.
| PJ/ABE/ADD/CCS/AAN/NMW/CAE | Bisha_2016R&R-Update_TechRep_2CN010-024_20170808_aan_cae | August 2017 |
| SRK Consulting |
| NI 43-101 Technical Report Bisha Mine 2016, Eritrea | Page 117 |
Table 13.9: Top cuts applied
| | Domain | Element | Raw Mean | Raw CV | Top cut | g/t Ag | Cut Mean | Cut CV |
| | 101 | Ag | 12.74 | 6.66 | 1000 | 11.60 | 5.00 | 12.74 |
| | 101 | Au | 0.53 | 8.21 | 60 | 0.48 | 6.77 | 0.53 |
| | 102 | Cu | 0.37 | 4.93 | 5 | 0.23 | 3.42 | 0.37 |
| | 102 | Ag | 182.73 | 2.22 | 1000 | 152.35 | 1.35 | 182.73 |
| | 200 | Pb | 0.20 | 6.69 | 15 | 0.18 | 5.06 | 0.20 |
| | 200 | Ag | 36.83 | 2.05 | 400 | 34.53 | 1.15 | 36.83 |
| | 200 | Au | 1.30 | 4.03 | 40 | 1.16 | 2.76 | 1.30 |
| | 201 | Pb | 0.47 | 3.06 | 5 | 0.39 | 1.79 | 0.47 |
| | 201 | Ag | 78.27 | 2.40 | 400 | 65.92 | 0.95 | 78.27 |
| | 201 | Au | 1.40 | 3.41 | 30 | 1.23 | 2.30 | 1.40 |
| | 202 | Ag | 31.67 | 2.38 | 400 | 29.17 | 1.63 | 31.67 |
| | 202 | Au | 1.07 | 3.26 | 30 | 1.01 | 2.71 | 1.07 |
| | 203 | Pb | 0.26 | 2.54 | 5 | 0.25 | 1.95 | 0.26 |
| | 203 | Au | 0.78 | 1.94 | 10 | 0.74 | 1.38 | 0.78 |
| | 204 | Ag | 7.29 | 2.31 | 100 | 6.59 | 1.40 | 7.29 |
| | 204 | Au | 0.39 | 1.92 | 5 | 0.37 | 1.23 | 0.39 |
| | 600 | Zn | 0.38 | 2.75 | 10 | 0.37 | 2.61 | 0.38 |
| | 600 | Ag | 7.70 | 1.79 | 100 | 7.59 | 1.68 | 7.70 |
| 13.1.5 | Statistical Analysis and Variography |
The spatial continuity of the composites was evaluated for each domain using Snowden Supervisor 8.3. Initial directional experimental variograms sometimes provided poorly structured results; in these instances, a normal-scores transformation was performed on the composite data in order to develop better experimental variograms to facilitate easier modelling of variograms. The modelled variograms based on the normal scores transformed values were back transformed from Gaussian to composite data space by a Hermite polynomial transformation using 30 polynomials.
In general, the Gaussian experimental variograms have a poor to moderate structure, with manipulation of the lags required to produce a clear progression from the nugget to the sill. The modelled variogram parameters are presented in Table 13.10 to Table 13.28.
| PJ/ABE/ADD/CCS/AAN/NMW/CAE | Bisha_2016R&R-Update_TechRep_2CN010-024_20170808_aan_cae | August 2017 |
| SRK Consulting |
| NI 43-101 Technical Report Bisha Mine 2016, Eritrea | Page 118 |
Table 13.10: Domain 100 resource variogram models, with sills (γ) and ranges (h)
| | Element | Nugget | Direction | γ1 | h1 | γ2 | h2 | γ3 | h3 |
| | Cu | 0.09 | 00 to 350 | 0.53 | 20 | 0.38 | 125 | | |
| | | | 00 to 080 | 0.53 | 20 | 0.38 | 35 | | |
| | | | 90 to 000 | 0.53 | 20 | 0.38 | 25 | | |
| | Zn | 0.29 | 00 to 350 | 0.32 | 10 | 0.41 | 135 | | |
| | | | 00 to 080 | 0.32 | 10 | 0.41 | 107 | | |
| | | | 90 to 000 | 0.32 | 10 | 0.41 | 30 | | |
| | Pb | 0.12 | 00 to 350 | 0.56 | 17 | 0.32 | 115 | | |
| | | | 00 to 080 | 0.56 | 17 | 0.32 | 35 | | |
| | | | 90 to 000 | 0.56 | 17 | 0.32 | 35 | | |
| | Ag | 0.23 | 00 to 350 | 0.47 | 27 | 0.30 | 120 | | |
| | | | 00 to 080 | 0.47 | 27 | 0.30 | 90 | | |
| | | | 90 to 000 | 0.47 | 27 | 0.30 | 30 | | |
| | As | 0.06 | 00 to 350 | 0.37 | 20 | 0.57 | 96 | | |
| | | | 00 to 080 | 0.37 | 20 | 0.57 | 60 | | |
| | | | 90 to 000 | 0.37 | 20 | 0.57 | 30 | | |
| | Au | 0.14 | 00 to 350 | 0.48 | 72 | 0.38 | 131 | | |
| | | | 00 to 080 | 0.48 | 72 | 0.38 | 80 | | |
| | | | 90 to 000 | 0.48 | 36 | 0.38 | 38 | | |
Table 13.11: Domain 101 resource variogram models
| | Element | Nugget | Direction | γ1 | h1 | γ2 | h2 | γ3 | h3 |
| | Cu | 0.39 | 00 to 350 | 0.37 | 61 | 0.23 | 148 | | |
| | | | 00 to 080 | 0.37 | 61 | 0.23 | 208 | | |
| | | | 90 to 000 | 0.37 | 61 | 0.23 | 69 | | |
| | Zn | 0.28 | 00 to 350 | 0.50 | 34 | 0.22 | 125 | | |
| | | | 00 to 080 | 0.50 | 34 | 0.22 | 125 | | |
| | | | 90 to 000 | 0.50 | 34 | 0.22 | 40 | | |
| | Pb | 0.31 | 00 to 350 | 0.47 | 22 | 0.23 | 250 | | |
| | | | 00 to 080 | 0.47 | 22 | 0.23 | 200 | | |
| | | | 90 to 000 | 0.47 | 22 | 0.23 | 100 | | |
| | Ag | 0.43 | 00 to 350 | 0.35 | 13 | 0.10 | 31 | 0.12 | 305 |
| | | | 00 to 080 | 0.35 | 13 | 0.10 | 31 | 0.12 | 181 |
| | | | 90 to 000 | 0.35 | 13 | 0.10 | 31 | 0.12 | 70 |
| | As | 0.38 | 00 to 350 | 0.38 | 30 | 0.24 | 145 | | |
| | | | 00 to 080 | 0.38 | 30 | 0.24 | 110 | | |
| | | | 90 to 000 | 0.38 | 30 | 0.24 | 80 | | |
| | Au | 0.14 | 00 to 350 | 0.69 | 17 | 0.17 | 225 | | |
| | | | 00 to 080 | 0.69 | 17 | 0.17 | 150 | | |
| | | | 90 to 000 | 0.69 | 17 | 0.17 | 50 | | |
| PJ/ABE/ADD/CCS/AAN/NMW/CAE | Bisha_2016R&R-Update_TechRep_2CN010-024_20170808_aan_cae | August 2017 |
| SRK Consulting |
| NI 43-101 Technical Report Bisha Mine 2016, Eritrea | Page 119 |
Table 13.12: Domain 102 resource variogram models
| | Element | Nugget | Direction | γ1 | h1 | γ2 | h2 | γ3 | h3 |
| | Cu | 0.54 | Omnidirectional | 0.29 | 15 | 0.17 | 90 | | |
| | Zn | 0.87 | Omnidirectional | 0.08 | 15 | 0.05 | 85 | | |
| | Pb | 0.77 | Omnidirectional | 0.13 | 30 | 0.10 | 120 | | |
| | Ag | 0.93 | Omnidirectional | 0.07 | 30 | | | | |
| | As | 0.43 | Omnidirectional | 0.57 | 60 | | | | |
| | Au | 0.28 | Omnidirectional | 0.31 | 35 | 0.41 | 51 | | |
Table 13.13: Domain 200 resource variogram models
| | Element | Nugget | Direction | γ1 | h1 | γ2 | h2 | γ3 | h3 |
| | Cu | 0.30 | 00 to 000 | 0.26 | 30 | 0.44 | 160 | | |
| | | | 00 to 270 | 0.26 | 30 | 0.44 | 90 | | |
| | | | 90 to 000 | 0.26 | 20 | 0.44 | 23 | | |
| | Zn | 0.27 | 00 to 000 | 0.46 | 10 | 0.26 | 110 | | |
| | | | 00 to 270 | 0.46 | 10 | 0.26 | 25 | | |
| | | | 90 to 000 | 0.46 | 10 | 0.26 | 45 | | |
| | Pb | 0.32 | 00 to 000 | 0.47 | 40 | 0.15 | 80 | 0.06 | 200 |
| | | | 00 to 270 | 0.47 | 10 | 0.15 | 20 | 0.06 | 51 |
| | | | 90 to 000 | 0.47 | 10 | 0.15 | 20 | 0.06 | 23 |
| | Ag | 0.20 | 00 to 000 | 0.58 | 45 | 0.22 | 140 | | |
| | | | 00 to 270 | 0.58 | 22 | 0.22 | 45 | | |
| | | | 90 to 000 | 0.58 | 22 | 0.22 | 45 | | |
| | As | 0.12 | 00 to 000 | 0.47 | 19 | 0.42 | 75 | | |
| | | | 00 to 270 | 0.47 | 19 | 0.42 | 30 | | |
| | | | 90 to 000 | 0.47 | 19 | 0.42 | 30 | | |
| | Au | 0.36 | 00 to 000 | 0.55 | 35 | 0.09 | 130 | | |
| | | | 00 to 270 | 0.55 | 35 | 0.09 | 50 | | |
| | | | 90 to 000 | 0.55 | 35 | 0.09 | 50 | | |
| PJ/ABE/ADD/CCS/AAN/NMW/CAE | Bisha_2016R&R-Update_TechRep_2CN010-024_20170808_aan_cae | August 2017 |
| SRK Consulting |
| NI 43-101 Technical Report Bisha Mine 2016, Eritrea | Page 120 |
Table 13.14: Domain 201 resource variogram models
| | Element | Nugget | Direction | γ1 | h1 | γ2 | h2 | γ3 | h3 |
| | Cu | 0.07 | 00 to 000 | 0.68 | 18 | 0.26 | 125 | | |
| | | | 00 to 270 | 0.68 | 18 | 0.26 | 24 | | |
| | | | 90 to 000 | 0.68 | 18 | 0.26 | 24 | | |
| | Zn | 0.52 | 00 to 000 | 0.29 | 7 | 0.15 | 35 | 75.00 | |
| | | | 00 to 270 | 0.29 | 7 | 0.15 | 35 | 50.00 | |
| | | | 90 to 000 | 0.29 | 7 | 0.15 | 35 | 50.00 | |
| | Pb | 0.35 | 00 to 000 | 0.42 | 11 | 0.17 | 14 | 0.09 | 75 |
| | | | 00 to 270 | 0.42 | 11 | 0.17 | 14 | 0.09 | 25 |
| | | | 90 to 000 | 0.42 | 11 | 0.17 | 14 | 0.09 | 25 |
| | Ag | 0.33 | 00 to 000 | 0.53 | 19 | 0.14 | 90 | | |
| | | | 00 to 270 | 0.53 | 19 | 0.14 | 22 | | |
| | | | 90 to 000 | 0.53 | 19 | 0.14 | 22 | | |
| | As | 0.01 | 00 to 000 | 0.63 | 17 | 0.35 | 95 | | |
| | | | 00 to 270 | 0.63 | 17 | 0.35 | 46 | | |
| | | | 90 to 000 | 0.63 | 17 | 0.35 | 46 | | |
| | Au | 0.53 | 00 to 000 | 0.42 | 16 | 0.05 | 60 | | |
| | | | 00 to 270 | 0.42 | 16 | 0.05 | 19 | | |
| | | | 90 to 000 | 0.42 | 16 | 0.05 | 19 | | |
Table 13.15: Domain 202 resource variogram models
| | Element | Nugget | Direction | γ1 | h1 | γ2 | h2 | γ3 | h3 |
| | Cu | 0.14 | 00 to 000 | 0.55 | 12 | 0.20 | 28 | 0.12 | 77 |
| | | | 00 to 270 | 0.55 | 12 | 0.20 | 28 | 0.12 | 77 |
| | | | 90 to 000 | 0.55 | 12 | 0.20 | 28 | 0.12 | 77 |
| | Zn | 0.22 | 00 to 000 | 0.44 | 5 | 0.26 | 16 | 0.08 | 90 |
| | | | 00 to 270 | 0.44 | 5 | 0.26 | 16 | 0.08 | 20 |
| | | | 90 to 000 | 0.44 | 5 | 0.26 | 16 | 0.08 | 20 |
| | Pb | 0.18 | 00 to 000 | 0.53 | 6 | 0.21 | 27 | 0.08 | 110 |
| | | | 00 to 270 | 0.53 | 6 | 0.21 | 27 | 0.08 | 39 |
| | | | 90 to 000 | 0.53 | 6 | 0.21 | 27 | 0.08 | 30 |
| | Ag | 0.31 | 00 to 000 | 0.38 | 11 | 0.17 | 21 | 0.13 | 93 |
| | | | 00 to 270 | 0.38 | 11 | 0.17 | 21 | 0.13 | 31 |
| | | | 90 to 000 | 0.38 | 11 | 0.17 | 21 | 0.13 | 31 |
| | As | 0.27 | 00 to 000 | 0.55 | 12 | 0.19 | 45 | | |
| | | | 00 to 270 | 0.55 | 12 | 0.19 | 20 | | |
| | | | 90 to 000 | 0.55 | 12 | 0.19 | 20 | | |
| | Au | 0.70 | 00 to 000 | 0.22 | 17 | 0.08 | 37 | | |
| | | | 00 to 270 | 0.22 | 17 | 0.08 | 37 | | |
| | | | 90 to 000 | 0.22 | 17 | 0.08 | 30 | | |
| PJ/ABE/ADD/CCS/AAN/NMW/CAE | Bisha_2016R&R-Update_TechRep_2CN010-024_20170808_aan_cae | August 2017 |
| SRK Consulting |
| NI 43-101 Technical Report Bisha Mine 2016, Eritrea | Page 121 |
Table 13.16: Domain 203 resource variogram models
| | Element | Nugget | Direction | γ1 | h1 | γ2 | h2 | γ3 | h3 |
| | Cu | 0.13 | 00 to 000 | 0.31 | 10 | 0.23 | 40 | 0.33 | 134 |
| | | | 00 to 270 | 0.31 | 10 | 0.23 | 40 | 0.33 | 45 |
| | | | 90 to 000 | 0.31 | 10 | 0.23 | 40 | 0.33 | 45 |
| | Zn | 0.22 | 00 to 000 | 0.47 | 11 | 0.15 | 38 | 0.16 | 158 |
| | | | 00 to 270 | 0.47 | 11 | 0.15 | 38 | 0.16 | 45 |
| | | | 90 to 000 | 0.47 | 11 | 0.15 | 38 | 0.16 | 45 |
| | Pb | 0.29 | 00 to 000 | 0.42 | 13 | 0.29 | 135 | | |
| | | | 00 to 270 | 0.42 | 13 | 0.29 | 30 | | |
| | | | 90 to 000 | 0.42 | 13 | 0.29 | 30 | | |
| | Ag | 0.06 | 00 to 000 | 0.41 | 10 | 0.36 | 65 | 0.17 | 125 |
| | | | 00 to 270 | 0.41 | 10 | 0.36 | 17 | 0.17 | 40 |
| | | | 90 to 000 | 0.41 | 10 | 0.36 | 17 | 0.17 | 40 |
| | As | 0.14 | 00 to 000 | 0.73 | 10 | 0.13 | 35 | | |
| | | | 00 to 270 | 0.73 | 10 | 0.13 | 25 | | |
| | | | 90 to 000 | 0.73 | 10 | 0.13 | 25 | | |
| | Au | 0.27 | 00 to 000 | 0.62 | 13 | 0.11 | 96 | | |
| | | | 00 to 270 | 0.62 | 13 | 0.11 | 21 | | |
| | | | 90 to 000 | 0.62 | 13 | 0.11 | 21 | | |
Table 13.17: Domain 300 resource variogram models
| | Element | Nugget | Direction | γ1 | h1 | γ2 | h2 | γ3 | h3 |
| | Cu | 0.12 | 00 to 015 | 0.3 | 10 | 0.58 | 181 | | |
| | | | 70 to 105 | 0.3 | 10 | 0.58 | 35 | | |
| | | | 20 to 285 | 0.3 | 10 | 0.58 | 20 | | |
| | Zn | 0.1 | 00 to 015 | 0.3 | 6 | 0.20 | 10 | 0.40 | 35 |
| | | | 70 to 105 | 0.3 | 6 | 0.20 | 10 | 0.40 | 15 |
| | | | 20 to 285 | 0.3 | 6 | 0.20 | 10 | 0.40 | 15 |
| | Pb | 0.23 | 00 to 015 | 0.33 | 3 | 0.24 | 10 | 0.20 | 40 |
| | | | 70 to 105 | 0.33 | 3 | 0.24 | 10 | 0.20 | 20 |
| | | | 20 to 285 | 0.33 | 3 | 0.24 | 10 | 0.20 | 20 |
| | Ag | 0.08 | 00 to 015 | 0.26 | 6 | 0.36 | 13 | 0.31 | 67 |
| | | | 70 to 105 | 0.26 | 6 | 0.36 | 13 | 0.31 | 44 |
| | | | 20 to 285 | 0.26 | 6 | 0.36 | 13 | 0.31 | 37 |
| | As | 0.13 | 00 to 015 | 0.33 | 12 | 0.24 | 48 | 0.30 | 154 |
| | | | 70 to 105 | 0.33 | 12 | 0.24 | 48 | 0.30 | 60 |
| | | | 20 to 285 | 0.33 | 12 | 0.24 | 48 | 0.30 | 60 |
| | Au | 0.21 | 00 to 015 | 0.27 | 12 | 0.21 | 37 | 0.32 | 150 |
| | | | 70 to 105 | 0.27 | 12 | 0.21 | 37 | 0.32 | 37 |
| | | | 20 to 285 | 0.27 | 12 | 0.21 | 37 | 0.32 | 38 |
| PJ/ABE/ADD/CCS/AAN/NMW/CAE | Bisha_2016R&R-Update_TechRep_2CN010-024_20170808_aan_cae | August 2017 |
| SRK Consulting |
| NI 43-101 Technical Report Bisha Mine 2016, Eritrea | Page 122 |
Table 13.18: Domain 301 resource variogram models
| | Element | Nugget | Direction | γ1 | h1 | γ2 | h2 | γ3 | h3 |
| | Cu | 0.18 | 54.5 to 149.4 | 0.36 | 14 | 0.46 | 140 | | |
| | | | -28.0 to 191.2 | 0.36 | 14 | 0.46 | 100 | | |
| | | | 20.0 to 270.0 | 0.36 | 14 | 0.46 | 40 | | |
| | Zn | 0.22 | 54.5 to 149.4 | 0.21 | 11 | 0.34 | 47 | 0.23 | 138 |
| | | | -28.0 to 191.2 | 0.21 | 11 | 0.34 | 20 | 0.23 | 90 |
| | | | 20.0 to 270.0 | 0.21 | 11 | 0.34 | 20 | 0.23 | 30 |
| | Pb | 0.12 | 54.5 to 149.4 | 0.25 | 5 | 0.27 | 13 | 0.36 | 145 |
| | | | -28.0 to 191.2 | 0.25 | 5 | 0.27 | 13 | 0.36 | 50 |
| | | | 20.0 to 270.0 | 0.25 | 5 | 0.27 | 13 | 0.36 | 20 |
| | Ag | 0.13 | 54.5 to 149.4 | 0.44 | 10 | 0.16 | 50 | 0.27 | 215 |
| | | | -28.0 to 191.2 | 0.44 | 10 | 0.16 | 50 | 0.27 | 130 |
| | | | 20.0 to 270.0 | 0.44 | 10 | 0.16 | 25 | 0.27 | 45 |
| | As | 0.00 | 54.5 to 149.4 | 0.86 | 12 | 0.14 | 42 | | |
| | | | -28.0 to 191.2 | 0.86 | 12 | 0.14 | 42 | | |
| | | | 20.0 to 270.0 | 0.86 | 12 | 0.14 | 30 | | |
| | Au | 0.15 | 54.5 to 149.4 | 0.32 | 6 | 0.18 | 11 | 0.36 | 111 |
| | | | -28.0 to 191.2 | 0.32 | 6 | 0.18 | 11 | 0.36 | 63 |
| | | | 20.0 to 270.0 | 0.32 | 6 | 0.18 | 11 | 0.36 | 25 |
Table 13.19: Domain 302 resource variogram models
| | Element | Nugget | Direction | γ1 | h1 | γ2 | h2 | γ3 | h3 |
| | Cu | 0.06 | 00 to 030 | 0.24 | 17 | 0.36 | 27 | 0.33 | 63 |
| | | | 70 to 120 | 0.24 | 17 | 0.36 | 27 | 0.33 | 50 |
| | | | 20 to 300 | 0.24 | 17 | 0.36 | 27 | 0.33 | 50 |
| | Zn | 0.12 | 00 to 030 | 0.56 | 20 | 0.26 | 26 | 0.07 | 60 |
| | | | 70 to 120 | 0.56 | 20 | 0.26 | 26 | 0.07 | 40 |
| | | | 20 to 300 | 0.56 | 20 | 0.26 | 26 | 0.07 | 40 |
| | Pb | 0.21 | 00 to 030 | 0.5 | 13 | 0.19 | 30 | 0.10 | 50 |
| | | | 70 to 120 | 0.5 | 13 | 0.19 | 30 | 0.10 | 50 |
| | | | 20 to 300 | 0.5 | 13 | 0.19 | 30 | 0.10 | 50 |
| | Ag | 0.12 | 00 to 030 | 0.23 | 8 | 0.41 | 14 | 0.24 | 20 |
| | | | 70 to 120 | 0.23 | 8 | 0.41 | 14 | 0.24 | 20 |
| | | | 20 to 300 | 0.23 | 8 | 0.41 | 14 | 0.24 | 20 |
| | As | 0.10 | 00 to 030 | 0.2 | 16 | 0.21 | 37 | 0.49 | 90 |
| | | | 70 to 120 | 0.2 | 16 | 0.21 | 37 | 0.49 | 40 |
| | | | 20 to 300 | 0.2 | 16 | 0.21 | 37 | 0.49 | 40 |
| | Au | 0.24 | 00 to 030 | 0.18 | 14 | 0.24 | 18 | 0.33 | 24 |
| | | | 70 to 120 | 0.18 | 14 | 0.24 | 18 | 0.33 | 24 |
| | | | 20 to 300 | 0.18 | 14 | 0.24 | 18 | 0.33 | 24 |
| PJ/ABE/ADD/CCS/AAN/NMW/CAE | Bisha_2016R&R-Update_TechRep_2CN010-024_20170808_aan_cae | August 2017 |
| SRK Consulting |
| NI 43-101 Technical Report Bisha Mine 2016, Eritrea | Page 123 |
Table 13.20: Domain 303 resource variogram models
| | Element | Nugget | Direction | γ1 | h1 | γ2 | h2 | γ3 | h3 |
| | Cu | 0.48 | 00 to 345 | 0.21 | 15 | 0.31 | 130 | | |
| | | | 00 to 075 | 0.21 | 15 | 0.31 | 80 | | |
| | | | 90 to 000 | 0.21 | 15 | 0.31 | 50 | | |
| | Zn | 0.46 | 00 to 345 | 0.16 | 35 | 0.38 | 130 | | |
| | | | 00 to 075 | 0.16 | 35 | 0.38 | 50 | | |
| | | | 90 to 000 | 0.16 | 35 | 0.38 | 50 | | |
| | Pb | 0.70 | 00 to 345 | 0.07 | 30 | 0.23 | 100 | | |
| | | | 00 to 075 | 0.07 | 30 | 0.23 | 45 | | |
| | | | 90 to 000 | 0.07 | 30 | 0.23 | 35 | | |
| | Ag | 0.62 | 00 to 345 | 0.18 | 21 | 0.20 | 90 | | |
| | | | 00 to 075 | 0.18 | 21 | 0.20 | 50 | | |
| | | | 90 to 000 | 0.18 | 21 | 0.20 | 30 | | |
| | As | 0.11 | 00 to 345 | 0.55 | 12 | 0.34 | 135 | | |
| | | | 00 to 075 | 0.55 | 12 | 0.34 | 25 | | |
| | | | 90 to 000 | 0.55 | 12 | 0.34 | 18 | | |
| | Au | 0.20 | 00 to 345 | 0.50 | 16 | 0.30 | 65 | | |
| | | | 00 to 075 | 0.50 | 16 | 0.30 | 20 | | |
| | | | 90 to 000 | 0.50 | 16 | 0.30 | 20 | | |
Table 13.21: Domain 304 resource variogram models
| | Element | Nugget | Direction | γ1 | h1 | γ2 | h2 | γ3 |
| | Cu | 0.35 | 70 to 090 | 0.44 | 54 | 0.15 | 128 | 0.06 |
| | | | 00 to 000 | 0.44 | 40 | 0.15 | 60 | |
| | | | 20 to 270 | 0.44 | 9 | 0.15 | 20 | |
| | Zn | 0.25 | 70 to 090 | 0.36 | 34 | 0.23 | 78 | 0.15 |
| | | | 00 to 000 | 0.36 | 10 | 0.23 | 20 | 0.15 |
| | | | 20 to 270 | 0.36 | 10 | 0.23 | 20 | 0.15 |
| | Pb | 0.25 | 70 to 090 | 0.53 | 17 | 0.16 | 79 | 0.06 |
| | | | 00 to 000 | 0.53 | 17 | 0.16 | 20 | 0.06 |
| | | | 20 to 270 | 0.53 | 10 | 0.16 | 20 | 0.06 |
| | Ag | 0.24 | 70 to 090 | 0.60 | 11 | 0.15 | 115 | |
| | | | 00 to 000 | 0.60 | 11 | 0.15 | 86 | |
| | | | 20 to 270 | 0.60 | 11 | 0.15 | 45 | |
| | As | 0.23 | 70 to 090 | 0.38 | 6 | 0.23 | 45 | 0.16 |
| | | | 00 to 000 | 0.38 | 6 | 0.23 | 20 | 0.16 |
| | | | 20 to 270 | 0.38 | 6 | 0.23 | 20 | 0.16 |
| | Au | 0.19 | 70 to 090 | 0.42 | 5 | 0.22 | 15 | 0.18 |
| | | | 00 to 000 | 0.42 | 5 | 0.22 | 15 | 0.18 |
| | | | 20 to 270 | 0.42 | 5 | 0.22 | 12 | 0.18 |
| PJ/ABE/ADD/CCS/AAN/NMW/CAE | Bisha_2016R&R-Update_TechRep_2CN010-024_20170808_aan_cae | August 2017 |
| SRK Consulting |
| NI 43-101 Technical Report Bisha Mine 2016, Eritrea | Page 124 |
Table 13.22: Domain 400 resource variogram models
| | Element | Nugget | Direction | γ1 | h1 | γ2 | h2 | γ3 | h3 |
| | Cu | 0.12 | 00 to 015 | 0.30 | 10 | 0.58 | 181 | | |
| | | | 70 to 105 | 0.30 | 10 | 0.58 | 35 | | |
| | | | 20 to 285 | 0.30 | 10 | 0.58 | 20 | | |
| | Zn | 0.10 | 00 to 015 | 0.30 | 6 | 0.20 | 10 | 0.40 | 35 |
| | | | 70 to 105 | 0.30 | 6 | 0.20 | 10 | 0.40 | 15 |
| | | | 20 to 285 | 0.30 | 6 | 0.20 | 10 | 0.40 | 15 |
| | Pb | 0.23 | 00 to 015 | 0.33 | 3 | 0.24 | 10 | 0.20 | 40 |
| | | | 70 to 105 | 0.33 | 3 | 0.24 | 10 | 0.20 | 20 |
| | | | 20 to 285 | 0.33 | 3 | 0.24 | 10 | 0.20 | 20 |
| | Ag | 0.08 | 00 to 015 | 0.26 | 6 | 0.36 | 13 | 0.31 | 67 |
| | | | 70 to 105 | 0.26 | 6 | 0.36 | 13 | 0.31 | 44 |
| | | | 20 to 285 | 0.26 | 6 | 0.36 | 13 | 0.31 | 37 |
| | As | 0.13 | 00 to 015 | 0.33 | 12 | 0.24 | 48 | 0.30 | 154 |
| | | | 70 to 105 | 0.33 | 12 | 0.24 | 48 | 0.30 | 60 |
| | | | 20 to 285 | 0.33 | 12 | 0.24 | 48 | 0.30 | 60 |
| | Au | 0.21 | 00 to 015 | 0.27 | 12 | 0.21 | 37 | 0.32 | 150 |
| | | | 70 to 105 | 0.27 | 12 | 0.21 | 37 | 0.32 | 37 |
| | | | 20 to 285 | 0.27 | 12 | 0.21 | 37 | 0.32 | 38 |
Table 13.23: Domain 401 resource variogram models
| | Element | Nugget | Direction | γ1 | h1 | γ2 | h2 | γ3 | h3 |
| | Cu | 0.18 | 54.5 to 149.4 | 0.36 | 14 | 0.46 | 140 | | |
| | | | -28.0 to 191.2 | 0.36 | 14 | 0.46 | 100 | | |
| | | | 20.0 to 270.0 | 0.36 | 14 | 0.46 | 40 | | |
| | Zn | 0.22 | 54.5 to 149.4 | 0.21 | 11 | 0.34 | 47 | 0.23 | 138 |
| | | | -28.0 to 191.2 | 0.21 | 11 | 0.34 | 20 | 0.23 | 90 |
| | | | 20.0 to 270.0 | 0.21 | 11 | 0.34 | 20 | 0.23 | 30 |
| | Pb | 0.12 | 54.5 to 149.4 | 0.25 | 5 | 0.27 | 13 | 0.36 | 145 |
| | | | -28.0 to 191.2 | 0.25 | 5 | 0.27 | 13 | 0.36 | 50 |
| | | | 20.0 to 270.0 | 0.25 | 5 | 0.27 | 13 | 0.36 | 20 |
| | Ag | 0.13 | 54.5 to 149.4 | 0.44 | 10 | 0.16 | 50 | 0.27 | 215 |
| | | | -28.0 to 191.2 | 0.44 | 10 | 0.16 | 50 | 0.27 | 130 |
| | | | 20.0 to 270.0 | 0.44 | 10 | 0.16 | 25 | 0.27 | 45 |
| | As | 0.00 | 54.5 to 149.4 | 0.86 | 12 | 0.14 | 42 | | |
| | | | -28.0 to 191.2 | 0.86 | 12 | 0.14 | 42 | | |
| | | | 20.0 to 270.0 | 0.86 | 12 | 0.14 | 30 | | |
| | Au | 0.15 | 54.5 to 149.4 | 0.32 | 6 | 0.18 | 11 | 0.36 | 111 |
| | | | -28.0 to 191.2 | 0.32 | 6 | 0.18 | 11 | 0.36 | 63 |
| | | | 20.0 to 270.0 | 0.32 | 6 | 0.18 | 11 | 0.36 | 25 |
| PJ/ABE/ADD/CCS/AAN/NMW/CAE | Bisha_2016R&R-Update_TechRep_2CN010-024_20170808_aan_cae | August 2017 |
| SRK Consulting |
| NI 43-101 Technical Report Bisha Mine 2016, Eritrea | Page 125 |
Table 13.24: Domain 402 resource variogram models
| | Element | Nugget | Direction | γ1 | h1 | γ2 | h2 | γ3 | h3 |
| | Cu | 0.06 | 00 to 030 | 0.24 | 17 | 0.36 | 27 | 0.33 | 63 |
| | | | 70 to 120 | 0.24 | 17 | 0.36 | 27 | 0.33 | 50 |
| | | | 20 to 300 | 0.24 | 17 | 0.36 | 27 | 0.33 | 50 |
| | Zn | 0.12 | 00 to 030 | 0.56 | 20 | 0.26 | 26 | 0.07 | 60 |
| | | | 70 to 120 | 0.56 | 20 | 0.26 | 26 | 0.07 | 40 |
| | | | 20 to 300 | 0.56 | 20 | 0.26 | 26 | 0.07 | 40 |
| | Pb | 0.21 | 00 to 030 | 0.50 | 13 | 0.19 | 30 | 0.10 | 50 |
| | | | 70 to 120 | 0.50 | 13 | 0.19 | 30 | 0.10 | 50 |
| | | | 20 to 300 | 0.50 | 13 | 0.19 | 30 | 0.10 | 50 |
| | Ag | 0.12 | 00 to 030 | 0.23 | 8 | 0.41 | 14 | 0.24 | 20 |
| | | | 70 to 120 | 0.23 | 8 | 0.41 | 14 | 0.24 | 20 |
| | | | 20 to 300 | 0.23 | 8 | 0.41 | 14 | 0.24 | 20 |
| | As | 0.10 | 00 to 030 | 0.20 | 16 | 0.21 | 37 | 0.49 | 90 |
| | | | 70 to 120 | 0.20 | 16 | 0.21 | 37 | 0.49 | 40 |
| | | | 20 to 300 | 0.20 | 16 | 0.21 | 37 | 0.49 | 40 |
| | Au | 0.24 | 00 to 030 | 0.18 | 14 | 0.24 | 18 | 0.33 | 24 |
| | | | 70 to 120 | 0.18 | 14 | 0.24 | 18 | 0.33 | 24 |
| | | | 20 to 300 | 0.18 | 14 | 0.24 | 18 | 0.33 | 24 |
Table 13.25: Domain 403 resource variogram models
| | Element | Nugget | Direction | γ1 | h1 | γ2 | h2 | γ3 | h3 |
| | Cu | 0.48 | 00 to 345 | 0.21 | 15 | 0.31 | 130 | | |
| | | | 00 to 075 | 0.21 | 15 | 0.31 | 80 | | |
| | | | 90 to 000 | 0.21 | 15 | 0.31 | 50 | | |
| | Zn | 0.46 | 00 to 345 | 0.16 | 35 | 0.38 | 130 | | |
| | | | 00 to 075 | 0.16 | 35 | 0.38 | 50 | | |
| | | | 90 to 000 | 0.16 | 35 | 0.38 | 50 | | |
| | Pb | 0.70 | 00 to 345 | 0.07 | 30 | 0.23 | 100 | | |
| | | | 00 to 075 | 0.07 | 30 | 0.23 | 45 | | |
| | | | 90 to 000 | 0.07 | 30 | 0.23 | 35 | | |
| | Ag | 0.62 | 00 to 345 | 0.18 | 21 | 0.20 | 90 | | |
| | | | 00 to 075 | 0.18 | 21 | 0.20 | 50 | | |
| | | | 90 to 000 | 0.18 | 21 | 0.20 | 30 | | |
| | As | 0.11 | 00 to 345 | 0.55 | 12 | 0.34 | 135 | | |
| | | | 00 to 075 | 0.55 | 12 | 0.34 | 25 | | |
| | | | 90 to 000 | 0.55 | 12 | 0.34 | 18 | | |
| | Au | 0.20 | 00 to 345 | 0.50 | 16 | 0.30 | 65 | | |
| | | | 00 to 075 | 0.50 | 16 | 0.30 | 20 | | |
| | | | 90 to 000 | 0.50 | 16 | 0.30 | 20 | | |
| PJ/ABE/ADD/CCS/AAN/NMW/CAE | Bisha_2016R&R-Update_TechRep_2CN010-024_20170808_aan_cae | August 2017 |
| SRK Consulting |
| NI 43-101 Technical Report Bisha Mine 2016, Eritrea | Page 126 |
Table 13.26: Domain 500 resource variogram models
| | Element | Nugget | Direction | γ1 | h1 | γ2 | h2 | γ3 | h3 |
| | Cu | 0.59 | 54.5 to 149.4 | 0.30 | 8 | 0.11 | 100 | | |
| | | | -28.0 to 191.2 | 0.30 | 8 | 0.11 | 45 | | |
| | | | 20.0 to 270.0 | 0.30 | 8 | 0.11 | 31 | | |
| | Zn | 0.34 | 54.5 to 149.4 | 0.30 | 6 | 0.14 | 19 | 0.22 | 97 |
| | | | -28.0 to 191.2 | 0.30 | 6 | 0.14 | 19 | 0.22 | 124 |
| | | | 20.0 to 270.0 | 0.30 | 6 | 0.14 | 19 | 0.22 | 20 |
| | Pb | 0.16 | 54.5 to 149.4 | 0.44 | 7 | 0.40 | 90 | | |
| | | | -28.0 to 191.2 | 0.44 | 7 | 0.40 | 13 | | |
| | | | 20.0 to 270.0 | 0.44 | 7 | 0.40 | 12 | | |
| | Ag | 0.28 | 54.5 to 149.4 | 0.26 | 6 | 0.22 | 21 | 0.24 | 150 |
| | | | -28.0 to 191.2 | 0.26 | 6 | 0.22 | 21 | 0.24 | 302 |
| | | | 20.0 to 270.0 | 0.26 | 6 | 0.22 | 21 | 0.24 | 50 |
| | As | 0.71 | 54.5 to 149.4 | 0.12 | 35 | 0.17 | 239 | | |
| | | | -28.0 to 191.2 | 0.12 | 35 | 0.17 | 239 | | |
| | | | 20.0 to 270.0 | 0.12 | 35 | 0.17 | 50 | | |
| | Au | 0.45 | 54.5 to 149.4 | 0.25 | 7 | 0.15 | 23 | 0.15 | 87 |
| | | | -28.0 to 191.2 | 0.25 | 7 | 0.15 | 23 | 0.15 | 96 |
| | | | 20.0 to 270.0 | 0.25 | 7 | 0.15 | 23 | 0.15 | 60 |
Table 13.27: Domain 600 resource variogram models
| | Element | Nugget | Direction | γ1 | h1 | γ2 | h2 | γ3 | h3 |
| | Cu | 0.10 | 00 to 000 | 0.35 | 17 | 0.28 | 79 | 0.27 | 202 |
| | | | 70 to 090 | 0.35 | 17 | 0.28 | 20 | 0.27 | 50 |
| | | | 20 to 270 | 0.35 | 10 | 0.28 | 20 | 0.27 | 50 |
| | Zn | 0.25 | 00 to 000 | 0.36 | 34 | 0.23 | 78 | 0.15 | 165 |
| | | | 70 to 090 | 0.36 | 10 | 0.23 | 20 | 0.15 | 80 |
| | | | 20 to 270 | 0.36 | 10 | 0.23 | 20 | 0.15 | 35 |
| | Pb | 0.25 | 00 to 000 | 0.53 | 17 | 0.16 | 79 | 0.06 | 202 |
| | | | 70 to 090 | 0.53 | 17 | 0.16 | 20 | 0.06 | 50 |
| | | | 20 to 270 | 0.53 | 10 | 0.16 | 20 | 0.06 | 50 |
| | Ag | 0.24 | 00 to 000 | 0.60 | 11 | 0.15 | 115 | | |
| | | | 70 to 090 | 0.60 | 11 | 0.15 | 86 | | |
| | | | 20 to 270 | 0.60 | 11 | 0.15 | 45 | | |
| | As | 0.23 | 00 to 000 | 0.38 | 6 | 0.23 | 45 | 0.16 | 125 |
| | | | 70 to 090 | 0.38 | 6 | 0.23 | 45 | 0.16 | 50 |
| | | | 20 to 270 | 0.38 | 6 | 0.23 | 45 | 0.16 | 100 |
| | Au | 0.19 | 00 to 000 | 0.42 | 5 | 0.22 | 15 | 0.18 | 250 |
| | | | 70 to 090 | 0.42 | 5 | 0.22 | 15 | 0.18 | 80 |
| | | | 20 to 270 | 0.42 | 5 | 0.22 | 15 | 0.18 | 25 |
| PJ/ABE/ADD/CCS/AAN/NMW/CAE | Bisha_2016R&R-Update_TechRep_2CN010-024_20170808_aan_cae | August 2017 |
| SRK Consulting |
| NI 43-101 Technical Report Bisha Mine 2016, Eritrea | Page 127 |
Table 13.28: Domain 700 resource variogram models
| | Element | Nugget | Direction | γ1 | h1 | γ2 | h2 | γ3 | h3 |
| | Cu | 0.54 | 00 to 000 | 0.08 | 9.0 | 0.38 | 85.0 | | |
| | | | 90 to 000 | 0.08 | 6.0 | 0.38 | 18.7 | | |
| | | | 00 to 090 | 0.08 | 6.0 | 0.38 | 18.7 | | |
| | Zn | 0.03 | 00 to 000 | 0.06 | 13.0 | 0.91 | 63.0 | | |
| | | | 90 to 000 | 0.06 | 13.0 | 0.91 | 63.0 | | |
| | | | 00 to 090 | 0.06 | 8.7 | 0.91 | 14.0 | | |
| | Pb | 0.08 | 00 to 000 | 0.03 | 30.0 | 0.89 | 120.0 | | |
| | | | 90 to 000 | 0.03 | 30.0 | 0.89 | 120.0 | | |
| | | | 00 to 090 | 0.03 | 20.0 | 0.89 | 26.7 | | |
| | Ag | 0.25 | 00 to 000 | 0.11 | 13.0 | 0.62 | 120.0 | | |
| | | | 90 to 000 | 0.11 | 13.0 | 0.62 | 80.0 | | |
| | | | 00 to 090 | 0.11 | 13.0 | 0.62 | 26.7 | | |
| | As | | 00 to 000 | | | | | | |
| | | | 90 to 000 | | | | | | |
| | | | 00 to 090 | | | | | | |
| | Au | 0.15 | 00 to 000 | 0.15 | 9.0 | 0.70 | 97.0 | | |
| | | | 90 to 000 | 0.15 | 9.0 | 0.70 | 64.7 | | |
| | | | 00 to 090 | 0.15 | 9.0 | 0.70 | 21.6 | | |
| 13.1.6 | Block Model and Grade Estimation |
Grades of Cu, Zn, Pb, Ag, As, and Au were estimated into the block model using Ordinary Kriging. To choose an optimal set of kriging parameters, a Quantitative Kriging Neighbourhood Analysis (QKNA) (Vann et al., 2003) was completed for each domain on the element likely to be the most economically significant. For a QKNA, the entire set of blocks flagged as mineralisation for each zone was kriged for the most economically significant element; the average slope of regression of the estimate, the number of composites used for each block and negative kriging weights reported after each run. The optimal kriging plan was judged to be the one that gave a significantly better slope of regression than any more restrictive one, but that did not introduce the need for excessive negative kriging weights.
For both the QKNA and the final estimate, an ellipse based search criteria was chosen parallel to the strike and dip of the mineralisation, with a maximum distance chosen to ensure all blocks were estimated in a single pass.
The estimation parameters used for the resource estimate are tabulated in Table 13.29. After the estimation pass, a small number of blocks in some domains remained unestimated; these were assigned grades reflecting the mean grades of the domain (Table 13.30).
After estimation, the grade control model was imported into the resource model to overwrite the resource blocks.
| PJ/ABE/ADD/CCS/AAN/NMW/CAE | Bisha_2016R&R-Update_TechRep_2CN010-024_20170808_aan_cae | August 2017 |
| SRK Consulting |
| NI 43-101 Technical Report Bisha Mine 2016, Eritrea | Page 128 |
Table 13.29: Kriging estimation parameters by mineralisation domain
| | Parameter | D100 | D101 | D102 | D200 | D201 | D202 | D203 |
| | Minimum Composites | 8 | 8 | 4 | 8 | 8 | 8 | 8 |
| | Maximum Composites | 48 | 32 | 24 | 24 | 32 | 32 | 32 |
| | Search Distance | 130 | 225 | 500 | 225 | 150 | 75 | 150 |
| | Z Axis rotation | 350 | 350 | 0 | 0 | 0 | 0 | 0 |
| | X Axis rotation | 0 | 0 | 0 | 0 | 0 | 0 | 0 |
| | Y Axis rotation | 0 | 0 | 0 | 0 | 0 | 0 | 0 |
| | Major:Semi-major ratio | 1.63 | 1.5 | 1 | 1.8 | 5 | 1 | 3 |
| | Major:Minor ratio | 3.25 | 4.5 | 1 | 5.3 | 5 | 1 | 3 |
| | Discretisation (YXZ) | 4:04:02 | 4:04:02 | 4:04:02 | 4:04:02 | 4:04:02 | 4:04:02 | 4:04:02 |
| | Parameter | D204 | D300 | D301 | D302 | D303 | D304 | D400 |
| | Minimum Composites | 8 | 8 | 4 | 4 | 8 | 8 | 8 |
| | Maximum Composites | 24 | 24 | 32 | 32 | 32 | 32 | 32 |
| | Search Distance | 225 | 225 | 150 | 75 | 150 | 350 | 200 |
| | Z Axis rotation | 0 | 0 | 0 | 0 | 0 | 0 | 15 |
| | X Axis rotation | 0 | 0 | 0 | 0 | 0 | 0 | 0 |
| | Y Axis rotation | 0 | 0 | 0 | 0 | 0 | 70 | 70 |
| | Major:Semi-major ratio | 1.8 | 1.8 | 5 | 1 | 3 | 3.5 | 2 |
| | Major:Minor ratio | 5.3 | 5.3 | 5 | 1 | 3 | 3.5 | 2 |
| | Discretisation (YXZ) | 4:04:02 | 4:04:02 | 4:04:02 | 4:04:02 | 4:04:02 | 4:04:02 | 4:04:02 |
| | Parameter | D401 | D402 | D403 | D500 | D600 | D700 |
| | Minimum Composites | 8 | 8 | 8 | 8 | 8 | 8 |
| | Maximum Composites | 24 | 24 | 24 | 48 | 32 | 32 |
| | Search Distance | 180 | 180 | 150 | 140 | 350 | 225 |
| | Z Axis rotation | 150 | 30 | 345 | 150 | 0 | 0 |
| | X Axis rotation | 54 | 0 | 0 | 54 | 0 | 0 |
| | Y Axis rotation | -54 | 70 | 0 | -54 | 70 | 0 |
| | Major:Semi-major ratio | 1.7 | 1.3 | 2.6 | 1 | 3.5 | 1.5 |
| | Major:Minor ratio | 5 | 1.3 | 2.6 | 5 | 3.5 | 4.5 |
| | Discretisation (YXZ) | 4:04:02 | 4:04:02 | 4:04:02 | 4:04:02 | 4:04:02 | 4:04:02 |
Table 13.30: Grade assigned to unestimated blocks
| | Element | Domain 302 | Domain 303 | Domain 304 | Domain 401 |
| | Cu | 0.6 | 2.0 | 0.70 | 1.0 |
| | Zn | 2.0 | 1.0 | 0.05 | 3.0 |
| | Pb | 0.3 | 0.3 | 0.30 | 0.1 |
| | Ag | 90.0 | 35.0 | 25.00 | 35.0 |
| | As | 1800.0 | 1600.0 | 150.00 | 500.0 |
| | Au | 0.8 | 0.6 | 0.00 | 0.7 |
| PJ/ABE/ADD/CCS/AAN/NMW/CAE | Bisha_2016R&R-Update_TechRep_2CN010-024_20170808_aan_cae | August 2017 |
| SRK Consulting |
| NI 43-101 Technical Report Bisha Mine 2016, Eritrea | Page 129 |
For the primary mineralisation region, bulk density sample data consists of 10 cm core samples taken approximately every 5 m downhole, measured using the water immersion method. These results were classified according to the interpreted lithology from which they were taken to create a dataset for each. Obvious outliers were removed (for example, minor massive sulphide in an interpreted waste zone) and the mean densities (Table 13.31) assigned to the primary blocks.
Table 13.31: Grade assigned to unestimated blocks
| | Lithology | Density (t/m3) |
| | Alluvial | 2.0 |
| | Saprolite | 2.0 |
| | Soap | 1.8 |
| | Pyrite Sand | 3.95 |
| | Gossan | 2.25 |
| | HWCU | 1.8 |
| | Massive Sulphide Supergene/Boundary | 4.0 |
| | Massive Sulphide Primary | 4.0 to 4.5 |
| | Massive Sulphide Supergene Waste | 2.3 |
| | Stringer Supergene/Boundary | 4.0 |
| | Stringer Primary | 3.5 |
| | Felsic Dykes Fresh | 2.7 |
| | Felsic Dykes Transition/Oxide | 2.3 |
| | Felsic Tuff Fresh | 2.7 |
| | Felsic Tuff Transition/Oxide | 2.3 |
| 13.1.8 | Model Validation and Sensitivity |
Basic validation checks included ensuring all mineralised blocks were estimated and visual checks of the trends of estimated blocks and composites.
To validate the results of the kriging estimation, the mean declustered cut grades of the input composites were compared to the block estimated grade by domain (Table 13.32). Generally, the estimated grades are within 5% of the declustered composites grades. Swath plots on 50 m northing slices show that the trends of the composites and the blocks are broadly similar, with a moderate amount of smoothing. There are in some cases divergences between composite and block grades at the extreme ends of the model, where a small number of projected composites are having a disproportionate effect on the mean grade of the model.
| PJ/ABE/ADD/CCS/AAN/NMW/CAE | Bisha_2016R&R-Update_TechRep_2CN010-024_20170808_aan_cae | August 2017 |
| SRK Consulting |
| NI 43-101 Technical Report Bisha Mine 2016, Eritrea | Page 130 |
Table 13.32: Comparison between composite and estimated average grades, domain 100 to 203
| | Domain | Element | Composites | Estimate | Variance |
| | 100 | Cu % | 0.12 | 0.12 | 0% |
| | 100 | Zn % | 0.09 | 0.08 | 11% |
| | 100 | Pb % | 0.57 | 0.53 | 7% |
| | 100 | Ag g/t | 21.47 | 20.60 | 4% |
| | 100 | As g/t | 2685.50 | 2542.29 | 5% |
| | 100 | Au g/t | 5.92 | 6.08 | -3% |
| | 101 | Cu % | 0.22 | 0.18 | 18% |
| | 101 | Zn % | 0.04 | 0.03 | 25% |
| | 101 | Pb % | 0.21 | 0.12 | 43% |
| | 101 | Ag g/t | 13.69 | 12.60 | 8% |
| | 101 | As g/t | 429.97 | 397.85 | 7% |
| | 101 | Au g/t | 0.622 | 0.57 | 8% |
| | 102 | Cu % | 0.29 | 0.14 | 52% |
| | 102 | Zn % | 0.02 | 0.02 | 0% |
| | 102 | Pb % | 0.95 | 0.92 | 3% |
| | 102 | Ag g/t | 123.64 | 136.61 | -10% |
| | 102 | As g/t | 674.40 | 672.39 | 0% |
| | 102 | Au g/t | 11.91 | 14.44 | -21% |
| | 200 | Cu % | 4.71 | 4.36 | 7% |
| | 200 | Zn % | 0.17 | 0.19 | -12% |
| | 200 | Pb % | 0.26 | 0.19 | 27% |
| | 200 | Ag g/t | 39.62 | 34.28 | 13% |
| | 200 | As g/t | 1231.58 | 1217.64 | 1% |
| | 200 | Au g/t | 1.37 | 1.16 | 15% |
| | 201 | Cu % | 6.29 | 6.12 | 3% |
| | 201 | Zn % | 0.53 | 0.47 | 11% |
| | 201 | Pb % | 0.43 | 0.38 | 12% |
| | 201 | Ag g/t | 68.13 | 64.37 | 6% |
| | 201 | As g/t | 1405.41 | 1331.76 | 5% |
| | 201 | Au g/t | 1.37 | 1.15 | 16% |
| | 202 | Cu % | 2.83 | 3.31 | -17% |
| | 202 | Zn % | 0.11 | 0.16 | -45% |
| | 202 | Pb % | 0.13 | 0.11 | 15% |
| | 202 | Ag g/t | 32.57 | 28.85 | 11% |
| | 202 | As g/t | 721.32 | 830.45 | -15% |
| | 202 | Au g/t | 1.29 | 1.01 | 22% |
| | 203 | Cu % | 3.18 | 3.20 | -1% |
| | 203 | Zn % | 0.44 | 0.38 | 14% |
| | 203 | Pb % | 0.20 | 0.20 | 0% |
| | 203 | Ag g/t | 36.94 | 35.76 | 3% |
| | 203 | As g/t | 1243.92 | 1353.74 | -9% |
| | 203 | Au g/t | 0.69 | 0.66 | 4% |
| PJ/ABE/ADD/CCS/AAN/NMW/CAE | Bisha_2016R&R-Update_TechRep_2CN010-024_20170808_aan_cae | August 2017 |
| SRK Consulting |
| NI 43-101 Technical Report Bisha Mine 2016, Eritrea | Page 131 |
Table 13.33: Comparison between composite and estimated average grades, domain 204 to 400
| | Domain | Element | Composites | Estimate | Variance |
| | 204 | Cu % | 0.39 | 0.50 | -28% |
| | 204 | Zn % | 0.01 | 0.01 | 0% |
| | 204 | Pb % | 0.03 | 0.02 | 33% |
| | 204 | Ag g/t | 8.54 | 7.01 | 18% |
| | 204 | As g/t | 504.21 | 524.90 | -4% |
| | 204 | Au g/t | 0.46 | 0.36 | 22% |
| | 300 | Cu % | 1.56 | 1.42 | 9% |
| | 300 | Zn % | 1.78 | 1.80 | -1% |
| | 300 | Pb % | 0.08 | 0.07 | 13% |
| | 300 | Ag g/t | 22.58 | 21.52 | 5% |
| | 300 | As g/t | 697.30 | 714.85 | -3% |
| | 300 | Au g/t | 0.68 | 0.69 | -1% |
| | 301 | Cu % | 2.23 | 2.47 | -11% |
| | 301 | Zn % | 2.14 | 3.07 | -43% |
| | 301 | Pb % | 0.23 | 0.29 | -26% |
| | 301 | Ag g/t | 46.07 | 50.88 | -10% |
| | 301 | As g/t | 695.85 | 786.92 | -13% |
| | 301 | Au g/t | 0.76 | 0.05 | 93% |
| | 302 | Cu % | 0.48 | 0.53 | -10% |
| | 302 | Zn % | 2.03 | 3.14 | -55% |
| | 302 | Pb % | 0.07 | 0.17 | -143% |
| | 302 | Ag g/t | 17.87 | 43.76 | -145% |
| | 302 | As g/t | 765.61 | 1150.74 | -50% |
| | 302 | Au g/t | 0.57 | 0.68 | -19% |
| | 303 | Cu % | 1.21 | 0.94 | 22% |
| | 303 | Zn % | 1.68 | 1.64 | 2% |
| | 303 | Pb % | 0.18 | 0.15 | 17% |
| | 303 | Ag g/t | 27.38 | 25.15 | 8% |
| | 303 | As g/t | 1146.26 | 1104.42 | 4% |
| | 303 | Au g/t | 0.72 | 0.73 | -1% |
| | 304 | Cu % | 0.49 | 0.49 | 0% |
| | 304 | Zn % | 0.21 | 0.18 | 14% |
| | 304 | Pb % | 0.05 | 0.05 | 0% |
| | 304 | Ag g/t | 7.69 | 9.29 | -21% |
| | 304 | As g/t | 135.31 | 136.64 | -1% |
| | 304 | Au g/t | 0.16 | 0.17 | -6% |
| | 400 | Cu % | 0.47 | 0.44 | 6% |
| | 400 | Zn % | 1.01 | 0.97 | 4% |
| | 400 | Pb % | 0.04 | 0.03 | 25% |
| | 400 | Ag g/t | 14.19 | 12.29 | 13% |
| | 400 | As g/t | 485.05 | 466.48 | 4% |
| | 400 | Au g/t | 0.61 | 0.59 | 3% |
| PJ/ABE/ADD/CCS/AAN/NMW/CAE | Bisha_2016R&R-Update_TechRep_2CN010-024_20170808_aan_cae | August 2017 |
| SRK Consulting |
| NI 43-101 Technical Report Bisha Mine 2016, Eritrea | Page 132 |
Table 13.34: Comparison between composite and estimate grades, domain 401 to 700
| | Domain | Element | Composites | Estimate | Variance |
| | 401 | Cu % | 1.01 | 0.95 | 6% |
| | 401 | Zn % | 3.04 | 3.13 | -3% |
| | 401 | Pb % | 0.12 | 0.12 | 0% |
| | 401 | Ag g/t | 36.83 | 35.95 | 2% |
| | 401 | As g/t | 508.71 | 523.51 | -3% |
| | 401 | Au g/t | 0.68 | 0.68 | 0% |
| | 402 | Cu % | 0.40 | 0.37 | 8% |
| | 402 | Zn % | 0.53 | 0.51 | 4% |
| | 402 | Pb % | 0.01 | 0.01 | 0% |
| | 402 | Ag g/t | 11.70 | 12.32 | -5% |
| | 402 | As g/t | 327.13 | 324.66 | 1% |
| | 402 | Au g/t | 0.51 | 0.48 | 6% |
| | 403 | Cu % | 0.40 | 0.39 | 3% |
| | 403 | Zn % | 1.64 | 1.73 | -5% |
| | 403 | Pb % | 0.10 | 0.11 | -10% |
| | 403 | Ag g/t | 19.05 | 20.06 | -5% |
| | 403 | As g/t | 514.18 | 544.58 | -6% |
| | 403 | Au g/t | 0.62 | 0.69 | -11% |
| | 500 | Cu % | 1.01 | 0.93 | 8% |
| | 500 | Zn % | 15.52 | 15.98 | -3% |
| | 500 | Pb % | 0.66 | 0.69 | -5% |
| | 500 | Ag g/t | 74.51 | 76.21 | -2% |
| | 500 | As g/t | 1142.51 | 1177.62 | -3% |
| | 500 | Au g/t | 0.76 | 0.76 | 0% |
| | 600 | Cu % | 0.34 | 0.34 | 0% |
| | 600 | Zn % | 0.35 | 0.34 | 3% |
| | 600 | Pb % | 0.02 | 0.01 | 50% |
| | 600 | Ag g/t | 7.55 | 7.90 | -5% |
| | 600 | As g/t | 77.57 | 75.46 | 3% |
| | 600 | Au g/t | 0.19 | 0.19 | 0% |
| | 700 | Cu % | 1.00 | 1.04 | -4% |
| | 700 | Zn % | 0.03 | 0.03 | 0% |
| | 700 | Pb % | 0.00 | 0.00 | 0% |
| | 700 | Ag g/t | 0.92 | 0.84 | 9% |
| | 700 | As g/t | 193.65 | 203.99 | -5% |
| | 700 | Au g/t | 0.01 | 0.01 | 0% |
For Supergene copper, the reconciliation between the Resource Model and the Mill Production shows the Resource Model predicts 9% fewer tonnes at a 3% lower grade than Mill Production plus stockpiles. For Primary zinc, the Resource Model predicts 9% more tonnes at 14% lower grade than the Mill Production plus stockpiles for 5% less metal (Table 13.35; Table 13.36).
| PJ/ABE/ADD/CCS/AAN/NMW/CAE | Bisha_2016R&R-Update_TechRep_2CN010-024_20170808_aan_cae | August 2017 |
| SRK Consulting |
| NI 43-101 Technical Report Bisha Mine 2016, Eritrea | Page 133 |
Table 13.35: Copper reconciliation 01 July 2013 to 31 December 2016
| | Source | Quantity
(t) | Grade
(% Cu) | Contained Metal
(t Cu) |
| | 40 m x 40 m Resource Model | 5,252,360 | 4.19 | 220,074 |
| | Mined | 5,868,801 | 3.94 | 231,094 |
| | Mill Production | 5,722,706 | 4.32 | 247,168 |
| | 31 December 2016 Stockpiles | 36,076 | 2.33 | 841 |
| | Mill Production+Stockpiles | 5,758,782 | 4.31 | 248,009 |
Table 13.36: Zinc reconciliation 01 July 2016 to 31 December 2016
| | Source | Quantity
(t) | Grade
(% Cu) | Contained Metal
(t Cu) |
| | 40 m x 40 m Resource Model | 4,045,620 | 4.05 | 163,848 |
| | Mined | 3,689,062 | 4.79 | 176,864 |
| | Mill Production | 1,222,829 | 5.68 | 69,469 |
| | 31 December 2016 Stockpiles | 2,485,812 | 4.16 | 103,354 |
| | Mill Production+Stockpiles | 3,708,641 | 4.66 | 172,879 |
| 13.1.9 | Mineral Resource Classification |
The Bisha Main mineralisation has been sufficiently drilled and sampled to allow classification as a Measured, Indicated and Inferred Mineral Resource in accordance with the current CIM Definition Standards for Mineral Resources and Mineral Reserves (CIM, 2014).
The Mineral Resource is a global estimate representing a reliable estimate of the total contained metal, but the local block estimates and the grade-tonnage relationships are likely to vary significantly with what is achievable in production, due to the very wide-spaced data and the poorly defined variograms.
In assigning classifications, the following factors were considered:
| | - Data quality
- Data spacing
- Geological continuity
- Confidence of interpretation
- Geostatistical properties of the estimate
- Potential mining methods and required selectivity.
|
Parts of the resource with a drill spacing of 50 m by 50 m or less (generally under the current open pit) were classified as Indicated Mineral Resource. All remaining resources were classified as Inferred. Caution should be used when applying any selective mining cut-off to the current model, as the grade-tonnage relationship in the model has a low confidence. All reported underground resources are classified as Inferred.
| PJ/ABE/ADD/CCS/AAN/NMW/CAE | Bisha_2016R&R-Update_TechRep_2CN010-024_20170808_aan_cae | August 2017 |
| SRK Consulting |
| NI 43-101 Technical Report Bisha Mine 2016, Eritrea | Page 134 |
All blocks added from the grade control model were classified as Measured. The small number of blocks that were assigned a grade were classified as Inferred.
To upgrade the classification of the Inferred Mineral Resource, a programme of infill drilling would be required to achieve a drill spacing of 50 m by 50 m or less, with an area of dense drilling or sampling to define the short-range variability of the mineralisation.
| 13.1.10 | Reasonable Prospects for Economic Extraction |
Reasonable prospects for economic extraction were assessed by applying net smelter return (NSR) cut-offs to blocks within a constraining optimised pit shell and to blocks below the optimised pit shell for underground extraction evaluation.
The NSR calculation and pit optimisation used long-term commodity prices (Table 13.37) and parameters such as 2016 budget costs for production and processing, process recoveries, concentrate grade, selling costs, and other ore-based costs derived from the current Bisha operation cost. The overall pit slopes for the optimisation ranged from 38° to 44°.
Blocks within the pit shell and below the mined pit floor, as at 1 January 2017, are reported as Mineral Resources above NSR cut-offs of $37.50/t for oxide material, $37.00/t for supergene and $35.00/t for primary.
Mineralisation below the pit shell was also analysed for potential underground mining. The Massive Sulphide blocks with contiguous blocks above a NSR cut off $100 are reported as a Mineral Resource.
Table 13.37: Metal prices used for NSR calculation and optimisation
| | Element | Unit | Price used |
| | Cu | lb | $3.00 |
| | Zn | lb | $1.20 |
| | Au | troy oz | $1,265 |
| | Ag | troy oz | $21.00 |
| 13.1.11 | Mineral Resource Estimates |
Mineral Resources are classified and reported in accordance with the CIM Definition Standards for Mineral Resources and Mineral Reserves (May, 2014). The Mineral Resources reported for the Bisha Main deposit are inclusive of Mineral Reserves. The Mineral Resource estimates have an effective date of 31 December 2016.
| PJ/ABE/ADD/CCS/AAN/NMW/CAE | Bisha_2016R&R-Update_TechRep_2CN010-024_20170808_aan_cae | August 2017 |
| SRK Consulting |
| NI 43-101 Technical Report Bisha Mine 2016, Eritrea | Page 135 |
Table 13.38: Mineral Resource statement for Bisha Main deposit, Eritrea, as of 31 December 2016
| | Domain | Quantity
(000’s t) | Grades |
| | (% Zn) | (% Cu) | (g/t Au) | (g/t Ag) |
| | Measured Open Pit |
| | Oxide | 10 | | | 8.4 | 40 |
| | Supergene | 30 | | 2.97 | 0.6 | 30 |
| | Boundary | 10 | 1.24 | 5.57 | 0.6 | 54 |
| | Primary | 1,250 | 6.62 | 1.02 | 0.8 | 42 |
| | Total Measured | 1,300 | 6.37 | 1.09 | 0.9 | 42 |
| | Indicated Open Pit |
| | Supergene | 110 | | 1.33 | 0.4 | 10 |
| | Boundary | 60 | 1.85 | 1.34 | 0.5 | 24 |
| | Primary | 19,140 | 5.74 | 0.97 | 0.7 | 45 |
| | Total Indicated | 19,310 | 5.70 | 0.97 | 0.7 | 45 |
| | Total M+I | 20,610 | 5.74 | 0.98 | 0.7 | 45 |
| | Inferred Open Pit |
| | Oxide | 10 | | | 1.6 | 25 |
| | Supergene | 780 | 1.85 | 1.23 | 0.1 | 1 |
| | Inferred Underground |
| | Primary | 1,460 | 7.44 | 0.73 | 0.9 | 43 |
| | Stockpiles Inferred |
| | Oxide-Au | 210 | | | 1.2 | 70 |
| | Oxide-Cu | 300 | | 1.45 | 0.2 | 6 |
| | Oxide | 320 | | | 5.1 | 172 |
| | Supergene | 40 | | 2.33 | 0.7 | 38 |
| | Boundary | 2,290 | 4.13 | 1.56 | 0.8 | 39 |
| | Primary | 200 | 4.50 | 0.74 | 0.7 | 36 |
| | Notes to be read in conjunction with the Mineral Resource table: |
| | (1) | Open Pit Mineral Resources are defined within an optimal Lerch-Grossman (LG) Pit Shell, generated using commodity prices for copper, zinc, gold and silver of $3.00/lb, $1.20/lb, $1,265/oz and $21/oz respectively using blocks of all Resource categories. The mining cost and total ore based cost (process, G&A and stockpile rehandle) applied was approximately 10-15% below the long term view on costs. Overall pit slopes varied from 38° to 44°. NSR cut-off used were: $37.50/t for Oxide Phase, $37.00/t for Supergene and $35.00/t for Primary Phase. |
| | (2) | Tonnage is rounded to the nearest 10,000 tonnes and grades are rounded to two decimal places for copper and zinc, one decimal place for gold, and zero decimal places for silver. Contained metal for copper and zinc are rounded to the nearest million pounds. Contained metal for silver is rounded to the nearest 10,000 ounces and gold is rounded to the nearest 1,000 ounces. |
| | (3) | Rounding as required by reporting guidelines may result in apparent summation differences between tonnes, grade and contained metal content. |
| | (4) | Tonnage and grade measurements are in metrics units. Contained gold and silver ounces are reported as troy ounces, contained copper and zinc as avoirdupois pounds. |
| | (5) | The Underground resource was derived by defining a shape around contiguous blocks with an NSR > $100/t outside the optimised resource pit shell. The $100 NSR cut-off represents the processing cost plus approximately $60/t mining cost. |
| PJ/ABE/ADD/CCS/AAN/NMW/CAE | Bisha_2016R&R-Update_TechRep_2CN010-024_20170808_aan_cae | August 2017 |
| SRK Consulting |
| NI 43-101 Technical Report Bisha Mine 2016, Eritrea | Page 136 |
The Harena deposit data (Figure 13.1) was extracted from the master BMSC site database on 25 August 2016, and includes assays of all resource drillholes up to and including BX-059. The data was loaded into an MS Access database; a summary of records is presented in Table 13.39.
Table 13.39: Harena database summary
| | Table | Number of Records |
| | Collar | 713 |
| | Survey | 5,097 |
| | Assay | 51,967 |
| | Geology | 10,703 |

Source: Nevsun, 2017
Figure 13.1: Harena drillhole layout
| 13.2.2 | Solid Body Modelling |
All intervals logged as either Massive Sulphide (MSUL) or Semi-massive Sulphide (SMSX) were interpreted on cross sections into steeply north-west dipping units. Internal waste less than 2 m downhole was included in the interpretation. After the initial interpretation, the strings were expanded up- and down-hole into any lithologies other than STSX (Stringer Sulphides) to include all adjacent samples with a Cu-equivalent grade greater than 1%. Sectional interpretations were extended half-way to the next drillhole, or 50 m past the last drillhole.
| PJ/ABE/ADD/CCS/AAN/NMW/CAE | Bisha_2016R&R-Update_TechRep_2CN010-024_20170808_aan_cae | August 2017 |
| SRK Consulting |
| NI 43-101 Technical Report Bisha Mine 2016, Eritrea | Page 137 |
On the same sections, the STSX intervals on the footwall of the MSUL+SMSX were interpreted; these were extended to the same distances past the last drillhole, or to the bottom of the MSUL+SMSX intercept in the next drillhole if the STSX was absent.
The sectional interpretations were wireframed to form six mineralisation wireframes, four MSUL+SMSX (numbered 101,102,103 and 104) and two STSX (201 and 202) that are in the immediate footwall of 101 and 102 respectively. The wireframes were projected 50 m past the last section.
The intersections inside the MSUL+SMSX wireframes were then interrogated for total Cu grade and Cu/Zn ratio. The internal footwall zones with a nominal Cu >1% and Cu/Zn >2 were interpreted into High Cu Massive Sulphide.
The lithologies outside the mineralisation interpretations were interpreted on cross sections. The Footwall felsic sequence was defined as the base of the last interval downhole logged as a mafic lithology; in some cases this is coincident with or above the massive sulphide. The hanging wall Sediment sequence was defined as above the base of the last downhole interval logged as a sedimentary lithology; the resulting interpretation contains both sedimentary and mafic lithologies. In between these two sequences, a distinct unit of Felsic Breccia was also interpreted. The remaining volume between the felsic and sedimentary sequence was not explicitly interpreted, but assumed to be predominantly mafic, although it also contained intermediate lithologies. The interpreted lithological sections were wireframed to create three solid lithology models.
Weathering surfaces, based upon lithology logs, core photos, and mineral assemblages, were constructed on 50 m spaced cross-sections to define the main weathering and oxidation domains.
The Harena database drillholes were intersected with mineralisation wireframes, and the intersections flagged with the Zone number. Assay grades were composited to 2.0 m lengths downhole, using a best fit approach, which resulted in composites of variable but equal length within each coded intersection, ensuring that the composite length was as near as possible to the nominal length. For each Zone, a single composite file was created with the grades in the order Cu, Zn, Pb, Ag, As, and Au.
The 2 m downhole composites within each individual zone were interrogated for mean grades, and compared with the means of other zones. This comparison (Table 13.40) shows that the High Zinc Massive Sulphide zones all have relatively low Cu, high Zn and low Au whereas the High Cu Massive Sulphide zones have high Cu and low Zn and high As. Stringer zones have low Cu and Zn but high Au. Given the grade similarities between the zones with the same lithologies, the zones were aggregated into four groups: High Cu MS, High Zn MS, Stringer Zone, and Oxide. The final uncut composite statistics are tabulated in Table 13.40.
| PJ/ABE/ADD/CCS/AAN/NMW/CAE | Bisha_2016R&R-Update_TechRep_2CN010-024_20170808_aan_cae | August 2017 |
| SRK Consulting |
| NI 43-101 Technical Report Bisha Mine 2016, Eritrea | Page 138 |
| Table | 13.40: Harena composite mean grades |
| | | High Zinc MS | Stringer | High Cu MS | Oxide |
| | Zone | 101 | 102 | 103 | 104 | 201 | 202 | 301 | 302 | 10 |
| | Count | 380 | 529 | 19 | 13 | 100 | 149 | 67 | 82 | 567 |
| | % Cu | 0.80 | 0.59 | 0.23 | 1.33 | 0.46 | 0.68 | 1.64 | 3.10 | 0.10 |
| | % Zn | 3.46 | 4.68 | 2.42 | 3.28 | 0.21 | 0.15 | 1.31 | 1.34 | 0.26 |
| | % Pb | 0.13 | 0.12 | 0.11 | 0.15 | 0.09 | 0.40 | 0.15 | 0.08 | 0.17 |
| | g/t Ag | 30.20 | 25.35 | 17.32 | 38.19 | 20.60 | 70.36 | 42.47 | 49.10 | 21.27 |
| | g/t As | 344.00 | 295.00 | 40.00 | 96.00 | 71.00 | 209.00 | 390.00 | 640.00 | 353.00 |
| | g/t Au | 0.52 | 0.62 | 0.27 | 0.55 | 0.66 | 2.30 | 1.18 | 0.92 | 1.38 |
| 13.2.4 | Evaluation of Outliers |
Histograms of the distribution of composites were examined for each element in each zone. Special attention was paid to elements with a high coefficient of variation (above 1.5) and obvious outliers or mixed populations.
From this inspection, a set of top cut values were determined, which were intended to reduce the variability of the composite population and reduce the influence of outliers (Table 13.41).
Table 13.41: Top cuts applied
| | Domain | Element | Raw Mean | Raw CV | Top Cut | g/t Ag | Cut Mean | Cut CV |
| | High Cu | Pb | 0.11 | 3.55 | 1.5 | 0.09 | 2.88 | 0.11 |
| | High Cu | Ag | 46.14 | 0.71 | 150.0 | 44.88 | 0.59 | 46.14 |
| | High Cu | Au | 1.04 | 2.57 | 20.0 | 0.96 | 1.83 | 1.04 |
| | High Zn | Ag | 27.32 | 2.14 | 200.0 | 25.04 | 1.31 | 27.32 |
| | High Zn | Au | 0.57 | 3.66 | 20.0 | 0.54 | 3.23 | 0.57 |
| | Stringer | Pb | 0.28 | 2.94 | 1.5 | 0.19 | 1.86 | 0.28 |
| | Stringer | Ag | 50.37 | 2.57 | 200.0 | 37.51 | 1.38 | 50.37 |
| | Stringer | Au | 1.64 | 2.23 | 20.0 | 1.58 | 2.06 | 1.64 |
| | Oxide | Ag | 21.27 | 8.72 | 150.0 | 10.16 | 2.30 | 21.27 |
| | Oxide | Au | 1.38 | 2.80 | 10.0 | 1.11 | 1.87 | 1.38 |
| 13.2.5 | Statistical analysis and variography |
To investigate the spatial continuity of the composites, the composites of the four domains (High Cu Massive Sulphide, High Zinc Massive Sulphide, Stringer Zone and Oxide Zone) were loaded into Snowden Supervisor 8.3. Initial directional experimental variograms provided poorly structured results; omnidirectional normal-scores variograms showed better structure. Consequently, all elements in all domains were modelled by a single omnidirectional normal-scores variogram, with either a single or nested spherical structures. The variogram models were back transformed from Gaussian to composite data space using Hermite polynomials.
| PJ/ABE/ADD/CCS/AAN/NMW/CAE | Bisha_2016R&R-Update_TechRep_2CN010-024_20170808_aan_cae | August 2017 |
| SRK Consulting |
| NI 43-101 Technical Report Bisha Mine 2016, Eritrea | Page 139 |
In general, the Gaussian experimental variograms have a poor to moderate structure, with manipulation of the lags required to produce a clear progression from the nugget to the sill. The variogram parameters are presented in Table 13.42 to Table 13.45.
Table 13.42: High copper massive sulphide variogram parameters
| | Element | Nugget | Sill 1 | Range 1 | Sill 2 | Range 2 |
| | Cu | 0.22 | 0.31 | 6 | 0.48 | 15 |
| | Zn | 0.23 | 0.53 | 4 | 0.24 | 25 |
| | Pb | 0.34 | 0.44 | 11 | 0.21 | 25 |
| | Ag | 0.12 | 0.74 | 7 | 0.14 | 22 |
| | As | 0.22 | 0.58 | 50 | 0.20 | 95 |
| | Au | 0.54 | 0.44 | 11 | 0.03 | 25 |
Table 13.43: High zinc massive sulphide variogram parameters
| | Element | Nugget | Sill 1 | Range 1 | Sill 2 | Range 2 |
| | Cu | 0.49 | 0.35 | 15 | 0.16 | 75 |
| | Zn | 0.29 | 0.53 | 29 | 0.17 | 190 |
| | Pb | 0.51 | 0.38 | 22 | 0.12 | 50 |
| | Ag | 0.67 | 0.26 | 15 | 0.08 | 95 |
| | As | 0.23 | 0.28 | 26 | 0.49 | 105 |
| | Au | 0.61 | 0.29 | 10 | 0.10 | 140 |
Table 13.44: Stringer variogram parameters
| | Element | Nugget | Sill 1 | Range 1 | Sill 2 | Range 2 |
| | Cu | 0.27 | 0.62 | 25 | 0.11 | 40 |
| | Zn | 0.30 | 0.60 | 10 | 0.09 | 40 |
| | Pb | 0.38 | 0.34 | 10 | 0.28 | 100 |
| | Ag | 0.55 | 0.20 | 10 | 0.25 | 75 |
| | As | 0.31 | 0.46 | 27 | 0.23 | 140 |
| | Au | 0.48 | 0.21 | 7 | 0.30 | 53 |
Table 13.45: Oxide variogram parameters
| | Element | Nugget | Sill 1 | Range 1 | Sill 2 | Range 2 |
| | Cu | 0.27 | 0.62 | 25 | 0.11 | 40 |
| | Zn | 0.28 | 0.44 | 20 | 0.28 | 40 |
| | Pb | 0.23 | 0.50 | 20 | 0.27 | 80 |
| | Ag | 0.68 | 0.28 | 20 | 0.05 | 80 |
| | As | 0.33 | 0.21 | 10 | 0.46 | 50 |
| | Au | 0.69 | 0.18 | 10 | 0.13 | 50 |
| PJ/ABE/ADD/CCS/AAN/NMW/CAE | Bisha_2016R&R-Update_TechRep_2CN010-024_20170808_aan_cae | August 2017 |
| SRK Consulting |
| NI 43-101 Technical Report Bisha Mine 2016, Eritrea | Page 140 |
| 13.2.6 | Block Model and Grade Estimation |
A Surpac block model was created to cover the physical extents of the interpreted mineralisation, the current open pit and the maximum extents of a possible open pit. The entire model is rotated to 45° grid to match the strike of the mineralisation. The block size was chosen to match half the minimum drill spacing, and the sub-blocking chosen to allow an adequate filling of the thinner parts of the interpreted wireframes (Table 13.46).
Table 13.46: Block model Harena_20161112.mdl extents and block sizes
| | | X | Y | Z |
| | Minimum | 1 707 000 | 333 500 | -400 |
| | Maximum | 1 709 500 | 334 500 | 650 |
| | Parent Cell | 10 | 20 | 5 |
| | Subcell | 2.5 | 2.5 | 2.5 |
| | Rotation | 45 | 0 | 0 |
To choose an optimal set of kriging parameters, a Quantitative Kriging Neighbourhood Analysis (QKNA) (Vann et al., 2003) was completed. For a QKNA, the entire set of blocks flagged as mineralisation for each zone was kriged for the most economically significant element; the average slope of regression of the estimate, the number of composites used for each block and negative kriging weights reported after each run. The optimal kriging plan was judged to be the one that gave a significantly better slope of regression than any more restrictive one, but that did not introduce the need for excessive negative kriging weights.
For both the QKNA and the final estimate, an octant based search ellipse was chosen parallel to the strike and dip of the mineralisation, with a maximum distance chosen to ensure all blocks were estimated in a single pass. The kriging parameters are presented in Table 13.47.
Table 13.47: Harena kriging estimation parameters
| | Parameter | High Cu MS | High Zn MS | Stringer | Oxide |
| | Minimum Composites | 8 | 8 | 8 | 8 |
| | Maximum Composites | 48 | 48 | 64 | 32 |
| | Search Distance | 300 | 300 | 300 | 250 |
| | Strike | 130 | 130 | 130 | 130 |
| | Dip | 60 | 60 | 60 | 60 |
| | Major:Semi-major ratio | 1 | 1 | 1 | 1 |
| | Major:Minor ratio | 3 | 3 | 3 | 3 |
| | Discretisation (YXZ) | 4:2:2 | 4:2:2 | 4:2:2 | 4:2:2 |
| | Maximum empty octants | 7 | 7 | 7 | 7 |
For the primary mineralisation region, bulk density sample data consists of 10 cm core samples taken approximately every 5 m, measured using the water immersion method. These results were classified according to the interpreted lithology from which they were taken to create a dataset for each. Obvious outliers were removed (for example, minor massive sulphide in an interpreted waste zone) and the mean densities (Table 13.48) assigned to the primary blocks.
| PJ/ABE/ADD/CCS/AAN/NMW/CAE | Bisha_2016R&R-Update_TechRep_2CN010-024_20170808_aan_cae | August 2017 |
| SRK Consulting |
| NI 43-101 Technical Report Bisha Mine 2016, Eritrea | Page 141 |
For the oxide zone, no bulk density samples were taken from drill core; a blanket density of 2.1 t/m3 for both ore and waste was assumed, based on grab samples taken from the Harena pit.
Table 13.48: Harena assigned densities
| | Zone | Oxide (t/m3) | Supergene (t/m3) | Primary (t/m3) |
| | Transported | 1.80 | | |
| | Sediments | 2.10 | 2.45 | 2.77 |
| | Mafic | 2.10 | 2.44 | 2.93 |
| | Felsic Breccia | 2.10 | 2.74 | 2.74 |
| | Footwall Felsic | 2.10 | 2.42 | 2.77 |
| | Massive Sulphide | 2.10 | 2.80 | 4.29 |
| | Stringer Zone | 2.10 | 2.80 | 3.01 |
To validate the results of the kriging estimate, the mean cut grades of the input composites were compared to the block estimated grade by domain (Table 13.49). Swath plots by 50 m northing slices were constructed. These show that the trends of the composites and the blocks are broadly similar, with a moderate amount of smoothing. There are in some cases divergences between composite and block grades at the extreme ends of the model, where a small number of projected composites are having a disproportionate effect on the mean grade of the model.
| PJ/ABE/ADD/CCS/AAN/NMW/CAE | Bisha_2016R&R-Update_TechRep_2CN010-024_20170808_aan_cae | August 2017 |
| SRK Consulting |
| NI 43-101 Technical Report Bisha Mine 2016, Eritrea | Page 142 |
Table 13.49: Comparison between composite and estimate grades
| | Domain | Element | Composites | Estimate | Variance |
| | High Cu | % Cu | 2.44 | 2.68 | 9.5% |
| | High Cu | % Zn | 1.32 | 1.31 | -1.2% |
| | High Cu | % Pb | 0.09 | 0.08 | 9.6% |
| | High Cu | g/t Ag | 44.88 | 46.77 | 4.2% |
| | High Cu | g/t As | 527.46 | 554.19 | 5.1% |
| | High Cu | g/t Au | 0.96 | 0.97 | 0.9% |
| | High Zn | % Cu | 0.68 | 0.65 | -4.8% |
| | High Zn | % Zn | 4.13 | 4.46 | 8.1% |
| | High Zn | % Pb | 0.13 | 0.15 | 21.4% |
| | High Zn | g/t Ag | 25.04 | 26.16 | 4.5% |
| | High Zn | g/t As | 306.94 | 337.36 | 9.9% |
| | High Zn | g/t Au | 0.54 | 0.59 | 9.0% |
| | Stringer | % Cu | 0.59 | 0.69 | 16.5% |
| | Stringer | % Zn | 0.18 | 0.17 | -4.5% |
| | Stringer | % Pb | 0.19 | 0.23 | 18.4% |
| | Stringer | g/t Ag | 37.51 | 42.42 | -13.1% |
| | Stringer | g/t As | 153.62 | 172.81 | 12.5% |
| | Stringer | g/t Au | 1.58 | 1.79 | 13.5% |
| | Oxide | % Cu | 0.10 | 0.11 | 3.0% |
| | Oxide | % Zn | 0.26 | 0.28 | 10.9% |
| | Oxide | % Pb | 0.17 | 0.17 | 0.3% |
| | Oxide | g/t Ag | 10.16 | 10.48 | 3.1% |
| | Oxide | g/t As | 352.78 | 368.51 | 4.5% |
| | Oxide | g/t Au | 1.11 | 1.06 | -4.8% |
| 13.2.9 | Mineral Resource Classification |
The Harena mineralisation has been sufficiently drilled and sampled to allow classification as an Indicated and Inferred Mineral Resource in accordance with the current CIM Definition Standards for Mineral Resources and Mineral Reserves (May, 2014).
The Mineral Resource is a global estimate representing a reliable estimate of the total contained metal, but the local block estimates and the grade-tonnage relationships are likely to vary significantly with what is achievable in production, due to the very wide-spaced data and the poorly defined variograms.
In assigning classifications, the following factors were considered:
| | - Data quality
- Data spacing
- Geological continuity
|
| PJ/ABE/ADD/CCS/AAN/NMW/CAE | Bisha_2016R&R-Update_TechRep_2CN010-024_20170808_aan_cae | August 2017 |
| SRK Consulting |
| NI 43-101 Technical Report Bisha Mine 2016, Eritrea | Page 143 |
| | - Confidence of interpretation
- Geostatistical properties of the estimate
- Potential mining methods and required selectivity.
|
Parts of the resource with a drill spacing of 50 m by 50 m or less (generally under the current open pit) were classified Indicated. All remaining resources were classified Inferred. Caution should be used when applying any selective mining cut-off to the current model, as the grade-tonnage relationship in the model has a low confidence. All reported underground resources are classified Inferred; approximately 190 kt of this in Domain 301 has a drill spacing of 50 m by 50 m.
To upgrade the classification of the Inferred, a programme of infill drilling would be required to achieve a drill spacing of 50 m by 50 m or less, with an area of dense drilling or sampling to define the short-range variability of the mineralisation.
| 13.2.10 | Reasonable Prospects for Economic Extraction |
Reasonable prospects for economic extraction were assessed by applying a net smelter return (NSR) cut-off to blocks within a constraining optimised pit shell and to blocks below the optimised pit shell for underground extraction evaluation. The optimisation of the pit shell was completed using Gemcom Whittle software.
The NSR calculation was performed using Surpac macros, using long-term commodity prices (Table 13.50) and parameters such as 2017 budget costs for production and processing, process recoveries, concentrate grade, selling costs, and other ore-based cost; these are derived from the current Bisha operation cost. The overall pit slopes for the optimisation varied from 29° to 35.5°.
No pit design has been completed. Blocks within the pit shell and below the mined pit floor, as of 31 December 2016, are reported as Mineral Resources above NSR cut-offs of $40.00/t for oxide material and $41.00/t for supergene and primary material.
Mineralisation below the pit shell was also analysed for potential underground mining. The entire High Copper Massive Sulphide is reported as a Mineral Resource; in addition, areas of contiguous blocks with a NSR above $100 were used for the underground High Zn Massive sulphide resource.
Table 13.50: Metal prices used for Harena NSR calculation and optimisation
| | Element | Unit | Price used |
| | Cu | lb | $3.00 |
| | Zn | lb | $1.20 |
| | Au | troy oz | $1,265 |
| | Ag | troy oz | $21 |
| PJ/ABE/ADD/CCS/AAN/NMW/CAE | Bisha_2016R&R-Update_TechRep_2CN010-024_20170808_aan_cae | August 2017 |
| SRK Consulting |
| NI 43-101 Technical Report Bisha Mine 2016, Eritrea | Page 144 |
| 13.2.11 | Mineral Resource Estimate |
Mineral Resources are classified and reported in accordance with the CIM Definition Standards for Mineral Resources and Mineral Reserves (May, 2014). The Mineral Resources reported for the Harena deposit are inclusive of Mineral Reserves.
The Mineral Resource estimates described here have an effective date of 31 December 2016, and are summarised in Table 13.51.
Table 13.51: Mineral Resource statement for Harena deposit, Eritrea as of 31 December 2016
| | Category | Quantity
(000's t) | Grade |
| | (% Zn) | (% Cu) | (g/t Au) | (g/t Ag) |
| | Open Pit Indicated |
| | Primary | 3,950 | 3.16 | 0.87 | 0.6 | 28 |
| | Open Pit Inferred |
| | Oxide | 120 | | | 2.0 | 20 |
| | Primary | 1,920 | 2.19 | 0.87 | 0.6 | 28 |
| | Underground Inferred |
| | Primary | 23,020 | 4.96 | 0.93 | 0.8 | 30 |
| | Notes to be read in conjunction with the Resource table above: |
| | (1) | Open Pit Mineral Resources are defined within an optimal Lerchs-Grossman (LG) pit shell, generated using commodity prices for copper, zinc, gold and silver of $3.00/lb, $1.20/lb, $1,265/oz and $21/oz respectively using blocks of all Resource categories. The mining cost and total ore based cost (process, G&A and stockpile re-handle) applied was approximately 10% below the long term view on costs with appropriate ore haulage costs for each satellite deposit. Overall pit slopes varied from 29° to 35.5° NSR cut-offs used were $40.00/t for Oxide and $41.00/t for Primary. |
| | (2) | Net Smelter Return values were calculated for each block using all resource categories, commodity prices, recoveries, appropriate smelter terms and downstream costs. Metallurgical recoveries, supported by metallurgical testwork, were applied as follows: Oxide zone: a recovery of 75% and 22% were applied for gold and silver respectively; and Primary zone; recoveries to copper concentrate of 85%, 36% and 29% were applied for copper, gold and silver respectively. A zinc recovery to zinc concentrate of 85% was applied. |
| | (3) | Mineral Resources are reported within the pit shell generated using the specified commodity prices, using NSR block grade cut-off derived as above. Tonnage is rounded to the nearest 10,000 tonnes and grades are rounded to two decimal places for copper and zinc, one decimal place for gold, and zero decimal places for silver. Contained metal for copper and zinc are rounded to the nearest million pounds. Contained metal for silver is rounded to the nearest 10,000 ounces and gold is rounded to the nearest 1,000 ounces. |
| | (4) | Rounding may result in apparent summation differences between tonnes, grade and contained metal content. |
| | (5) | Tonnage and grade measurements are in metrics units. Contained gold and silver ounces are reported as troy ounces, contained copper and zinc pounds as imperial pounds. |
| | (6) | Underground Inferred Resources were derived by selecting contiguous blocks outside the optimised resource pit shell, with an NSR cut-off of $100, which represents the processing cost plus approximately $60/t mining cost. |
| | (7) | Mineral Resources that are not Mineral Reserves do not have demonstrated economic viability. |
The Asheli deposit data was extracted from the master BMSC site database on 16th July 2016, and includes assays of all resource drillholes up to and including MX-087 (Figure 13.2). The data was loaded into an MS Access database; a summary of records is presented in Table 13.52.
| PJ/ABE/ADD/CCS/AAN/NMW/CAE | Bisha_2016R&R-Update_TechRep_2CN010-024_20170808_aan_cae | August 2017 |
| SRK Consulting |
| NI 43-101 Technical Report Bisha Mine 2016, Eritrea | Page 145 |
Table 13.52: Database bisha201600825.mdb summary
| | Table | Number of Records |
| | Collar | 51 |
| | Survey | 1490 |
| | Assay | 6898 |
| | Alteration | 1755 |
| | Lithology | 882 |
| | Mineralisation | 867 |
| 13.3.2 | Solid Body Modelling |
Mineralisation wireframes were constructed by first modelling the massive sulphide (MSUL) intersections in the resource database. The resultant wireframe was then subdivided into a high grade domain in the hanging wall (Domain 100) and a Low-grade domain in the footwall (Domain 101) using a nominal 10% Zn cut-off.
In addition, waste lithology wireframes were constructed for Felsic, Gabbro, Graphite Shale, Chert, Mudstone and Mafic; and surfaces for the Top of Fresh, Base of Oxidation and the Base of Overburden.
All diamond drillholes were intersected with the interpreted wireframes. 1.0 m downhole composites with a minimum length of 0.25 m were extracted with fields for Cu, Zn, Pb, Ag, As and Au. The composites were broken on the contact between the Low Grade and High Grade Zones. The composite statistics are presented in Table 13.53 and Table 13.54.
| PJ/ABE/ADD/CCS/AAN/NMW/CAE | Bisha_2016R&R-Update_TechRep_2CN010-024_20170808_aan_cae | August 2017 |
| SRK Consulting |
| NI 43-101 Technical Report Bisha Mine 2016, Eritrea | Page 146 |
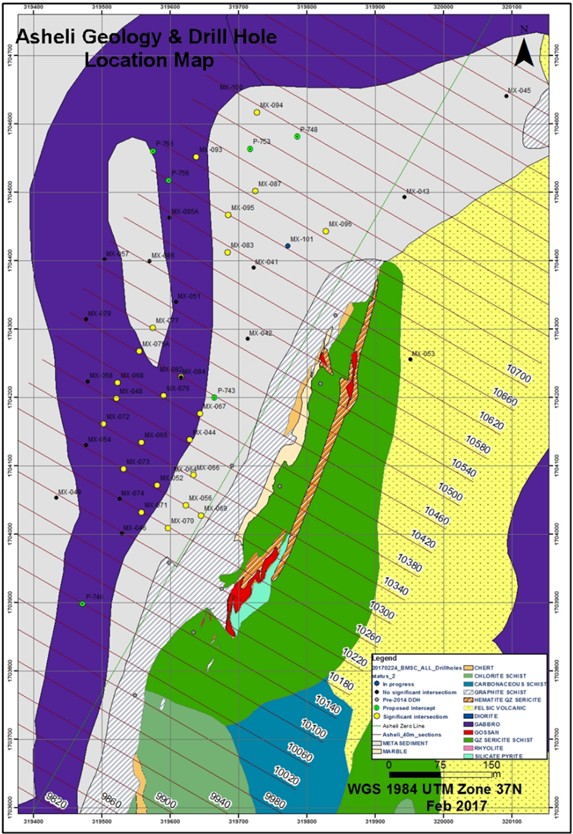
Source: Nevsun, 2017
Figure 13.2: Asheli deposit drillhole location plan
| PJ/ABE/ADD/CCS/AAN/NMW/CAE | Bisha_2016R&R-Update_TechRep_2CN010-024_20170808_aan_cae | August 2017 |
| SRK Consulting |
| NI 43-101 Technical Report Bisha Mine 2016, Eritrea | Page 147 |
Table 13.53: Asheli low grade zone composite statistics
| | Variable | (% Cu) | (% Zn) | (% Pb) | (g/t Ag) | (g/t As) | (g/t Au) |
| | Count | 147 | 147 | 147 | 147 | 147 | 147 |
| | Minimum | 0.05 | 0.23 | 0.00 | 2.50 | 47.60 | 0.07 |
| | Maximum | 8.06 | 30.81 | 0.94 | 104.30 | 2722.30 | 2.03 |
| | Mean | 1.90 | 4.89 | 0.06 | 28.91 | 785.09 | 0.37 |
| | Median | 1.57 | 3.74 | 0.02 | 22.70 | 784.40 | 0.34 |
| | SD | 1.38 | 3.94 | 0.15 | 19.28 | 379.20 | 0.22 |
| | CV | 0.73 | 0.81 | 2.68 | 0.67 | 0.48 | 0.58 |
Table 13.54: Asheli high grade zone composite statistics
| | Variable | (% Cu) | (% Zn) | (% Pb) | (g/t Ag) | (g/t As) | (g/t Au) |
| | Count | 67 | 67 | 67 | 67 | 67 | 67 |
| | Minimum | 0.195 | 0.0542 | 0.0062 | 7 | 192.1 | 0.1116 |
| | Maximum | 10.20 | 39.74 | 1.40 | 132 | 3198.8 | 1.56 |
| | Mean | 1.90 | 15.99 | 0.15 | 33.11 | 747.88 | 0.39 |
| | Median | 1.51 | 15.72 | 0.02 | 27.00 | 626.00 | 0.34 |
| | SD | 1.63 | 10.19 | 0.27 | 20.98 | 481.00 | 0.23 |
| | CV | 0.86 | 0.64 | 1.86 | 0.63 | 0.64 | 0.60 |
| 13.3.4 | Statistical Analysis and Variography |
Due to the low number of composites and the wide spacing of the drillholes, only very poor experimental variograms could be produced. Directional variograms (down dip and along strike) were unusable; omnidirectional normal scores variograms were modelled and back-transformed to produce a set of variograms for grade estimation. These back-transformed variograms are characterised by relatively high nugget and very short structures.
| 13.3.5 | Block Model and Grade Estimation |
A Surpac block model was created (Table 13.55) to cover the extents of the interpreted mineralisation.
Grades were estimated using Ordinary Kriging for all elements. Each element was estimated in each domain with the same search parameters; the variograms from the Low-Grade domain were used for the High Grade Domain as well (Table 13.56). A small number of non-estimated blocks were assigned the mean domain grade.
| PJ/ABE/ADD/CCS/AAN/NMW/CAE | Bisha_2016R&R-Update_TechRep_2CN010-024_20170808_aan_cae | August 2017 |
| SRK Consulting |
| NI 43-101 Technical Report Bisha Mine 2016, Eritrea | Page 148 |
Table 13.55: Asheli block model parameters
| | | X | Y | Z |
| | Minimum | 170 4000 | 319 400 | 200 |
| | Maximum | 170 4800 | 319 800 | 900 |
| | Parent Cell | 20 | 5 | 5 |
| | Subcell | 5 | 1.25 | 1.25 |
| | Rotation | 30 | 0 | 0 |
Table 13.56: Asheli grade estimation parameters
| | Element | Search Distance | Maximum Composites | Minimum Composites | Nugget | Sill | Range |
| | Cu | 250 | 32 | 8 | 0.43 | 0.57 | 11 |
| | Zn | 250 | 32 | 8 | 0.42 | 0.58 | 8 |
| | Pb | 250 | 32 | 8 | 0.55 | 0.45 | 9 |
| | Ag | 250 | 32 | 8 | 0.32 | 0.68 | 10 |
| | As | 250 | 32 | 8 | 0.27 | 0.73 | 11 |
| | Au | 250 | 32 | 8 | 0.33 | 0.67 | 13 |
Densities were assigned to the model, based on an analysis of the available 1025 density measurements (Table 13.57).
Table 13.57: Asheli assigned densities
| | Lithology | Oxide (t/m3) | Transition (t/m3) | Fresh (t/m3) |
| | Overburden | 2.0 | 2.0 | |
| | Default | 2.3 | 2.6 | 2.8 |
| | Felsic | 2.3 | 2.6 | 2.8 |
| | Chert | 2.3 | 2.6 | 2.8 |
| | Shale | 2.3 | 2.6 | 2.8 |
| | Mafic | 2.3 | 2.6 | 2.8 |
| | Gabbro | 2.3 | 2.6 | 2.8 |
| | Massive Sulphide | | | 4.5 |
| 13.3.7 | Mineral Resource Classification |
All blocks were classified as Inferred, due to:
| | - Low data density
- Poor quality of the local grade estimate
- Lack of any metallurgical data.
|
| PJ/ABE/ADD/CCS/AAN/NMW/CAE | Bisha_2016R&R-Update_TechRep_2CN010-024_20170808_aan_cae | August 2017 |
| SRK Consulting |
| NI 43-101 Technical Report Bisha Mine 2016, Eritrea | Page 149 |
| 13.3.8 | Reasonable Prospects for Economic Extraction |
Reasonable prospects for economic extraction were assessed by applying net smelter return (NSR) cut-offs to blocks within a constraining optimised pit shell and to blocks below the optimised pit shell for underground extraction evaluation.
The NSR calculation and pit optimisation used long-term commodity prices (Table 13.58) and parameters such as 2016 budget costs for production and processing, process recoveries, concentrate grade, selling costs, and other ore-based costs derived from the current Bisha operation cost. As there has been no metallurgical testing, metallurgical recoveries for Cu and Zn were assumed at 85%.
An initial open pit optimisation failed to produce an economic pit. The average NSR for the entire mineralisation is $199/t; this is in excess of the currently used underground cut-off of $105/t; the entire mineralisation has been reported as an Inferred underground resource.
Table 13.58: Metal prices used for Asheli NSR calculation and optimisation
| | Element | Unit | Price used |
| | Cu | lb | $3.00 |
| | Zn | lb | $1.20 |
| | Au | troy oz | $1,265.00 |
| | Ag | troy oz | $21.00 |
| 13.3.9 | Mineral Resource Estimate |
Mineral Resources are classified and reported in accordance with the CIM Definition Standards for Mineral Resources and Mineral Reserves (May, 2014). The Mineral Resource estimates have an effective date of 31 December 2016.
The resource estimate is tabulated in Table 13.59. The resource is reported as the entire mineralisation within the massive sulphide wireframe; the quality of the local estimate is low, therefore any attempt at selective reporting above a cut-off has a very low confidence.
Table 13.59: : Inferred Mineral Resource statement for Asheli deposit, Eritrea, as of 31 December 2016
| | Zone | Quantity
(t) | Grade |
| | (% Zn) | (% Cu) | (% Pb) | (g/t Au) | (g/t As) | (g/t Ag) |
| | Low Grade | 1,677,000 | 5.2 | 1.9 | 0.05 | 0.36 | 772 | 28 |
| | High Grade | 723,000 | 16.6 | 1.9 | 0.14 | 0.39 | 734 | 33 |
| | Total | 2,400,000 | 8.6 | 1.9 | 0.08 | 0.37 | 760 | 30 |
| PJ/ABE/ADD/CCS/AAN/NMW/CAE | Bisha_2016R&R-Update_TechRep_2CN010-024_20170808_aan_cae | August 2017 |
| SRK Consulting |
| NI 43-101 Technical Report Bisha Mine 2016, Eritrea | Page 150 |
| 13.4.1 | Project Sample Database |
The drilling database forms the basis of the estimate containing all the available and reliable assay data as of 18 October 2013.
A total of 43,807 m of diamond drilling has been completed in a series of programs completed by BMSC since 2003, and the majority of this data are available for the Northwest estimate as detailed below in Table 13.60.
Table 13.60: Northwest drillholes and sample metres as of 18 October 2013
| | Data Type | Hole
Prefix | No. of
Holes | Total
Drilled
(m) | Total
Sampled
(m) | Average Sample Length (m) | Date Drilled |
| | From | To |
| | Diamond (DD) | B | 14 | 2,033.5 | 1,393.5 | 1.6 | Oct ‘03 | Oct ‘03 |
| | NW | 26 | 4,567.9 | 3,636.0 | 1.5 | Feb ‘05 | Mar ‘06 |
| | NW | 73 | 13,619.6 | 13,177.9 | 1.1 | Nov ‘11 | Oct ‘12 |
| | NWDD | 106 | 21,546.8 | 20,479.0 | 1.0 | Nov ‘12 | Aug ‘13 |
| | Geotechnical | NWGT | 8 | 1,568.1 | 310.4 | 1.3 | Nov ‘12 | Dec ‘12 |
| | Metallurgical | NWMT | 2 | 471.0 | 463.5 | 1.2 | Oct ‘12 | Nov ‘12 |
| | | | 229 | 43,807.0 | 39,460.2 | 1.1 | | |
| | Trench* | NWTR | 16 | 1,118.0 | 976.2 | 2.0 | Nov ‘12 | Jan ‘13 |
| | RC* | NWA | 47 | 872.5 | 827.5 | 1.9 | ? | ? |
| | Note: *The assay results and mapping from the trenches excavated in 2012 to 2013 were used to help define structural and mineralisation trends at the surface. The trench and shallow RC assay data were used for the estimation of the oxide gold mineralisation only. |
| 13.4.2 | Local Grid Transformation |
Geology and mineralisation strike at approximately 45° to the UTM true grid. The majority of the drilling to date has been drilled perpendicular to the mineralisation on UTM grid azimuths of 135° and 315°. A local grid was established parallel to the drilling sections to facilitate the sectional drill interpretation and simplify resource estimation and block modelling.
Two common points were established to enable rotation of all the drilling data into the local grid as detailed below in Table 13.61.
Table 13.61: UTM to local grid transformation – common points
| | UTM
Northing | UTM Easting | Local Northing | Local Easting | Comment |
| | 1717700 | 338100 | 20000.000 | 10000.000 | Origin Point |
| | 1717900 | 338900 | 20707.107 | 10424.264 | Point3 |
| PJ/ABE/ADD/CCS/AAN/NMW/CAE | Bisha_2016R&R-Update_TechRep_2CN010-024_20170808_aan_cae | August 2017 |
| SRK Consulting |
| NI 43-101 Technical Report Bisha Mine 2016, Eritrea | Page 151 |
Introduction
The mineralised components of the Northwest deposit are divided into three major zones, namely oxide, supergene, and primary zones, with the latter dominant. A separate, narrower, massive sulphide zone lies to the east, running parallel to the main sulphide bodies.
The massive sulphide mineralised bodies of the primary zones are divided into a southern, a central (the Main Zone), and a northern zone. These zones are disrupted by fault or shear zones whose displacement is not defined, but the central zone is thought to represent the downthrown graben zone. The massive sulphides have associated semi-massive and stringer sulphide zones, with the latter best developed in the footwall. The massive sulphide zones strike at approximately 045°, dipping steeply to the northwest, with overall strike and dip lengths of some 800 m and 230 m, respectively. The eastern zone has similar dimensions, but lacks associated stringer sulphide development. This zone is not as well defined as the main zones. The mineralised zones are shown in Figure 13.3.
| PJ/ABE/ADD/CCS/AAN/NMW/CAE | Bisha_2016R&R-Update_TechRep_2CN010-024_20170808_aan_cae | August 2017 |
| SRK Consulting |
| NI 43-101 Technical Report Bisha Mine 2016, Eritrea | Page 152 |
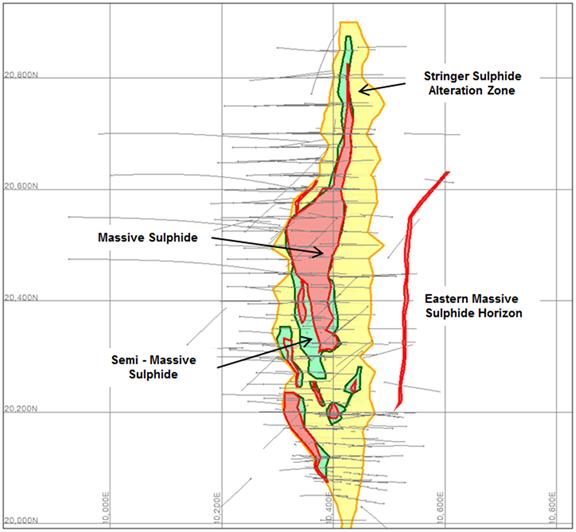
Source: AGP, 2014
Note: Sliced at 480 m amsl, approximately 80 m vertical depth; plan view.
Figure 13.3: Modelled sulphide domains – sliced at 480 m amsl, approximately 80 m vertical depth, plan view
Methodology
The key geological components of the VMS mineralisation at Northwest have been progressively modelled since the infill and extensional diamond drilling program commenced in November 2012. The interpretation has been continually updated as more drilling data has become available.
Initial interpretation was on 25 m spaced hard copy E-W sections, and was accompanied by systematic re-logging of diamond core to resolve areas of geological uncertainty and complexity. The sections were digitised and 3D wireframes were created in Surpac. The resultant solid 3D models represent the main geological components controlling the mineralisation, and are the basis for establishing grade continuity and the estimation of the Mineral Resource.
| PJ/ABE/ADD/CCS/AAN/NMW/CAE | Bisha_2016R&R-Update_TechRep_2CN010-024_20170808_aan_cae | August 2017 |
| SRK Consulting |
| NI 43-101 Technical Report Bisha Mine 2016, Eritrea | Page 153 |
Models
Sulphide mineralisation as defined by logged visual pyrite percentage is the fundamental control on the base metal distribution and forms the basis for the geological framework. Additional geochemical indicators (such as arsenic, barium, zinc, iron, the Ishikawa alteration index, and density) were also used as secondary criteria to help define the orientations of best continuity for robust and geometrically simple geology solids.
The geochemical indicators were used to support and increase the confidence of the geological interpretation, particularly across mineralisation and alteration boundaries. Each of the geochemical indicators has a distinct range of values that characterises the three sulphide mineralisation domains, and is particularly useful where the contacts are diffuse or the logging is inconclusive. The criteria developed and used for geological modelling are summarised in Table 13.62.
Table 13.62: Sulphide mineralisation interpretation criteria
| | Geological Domain | Lith Code | Logged Py | % Fe | g/t As | Ba
ppm | Density
(g/cm3) | Ishikawa Alteration Index |
| | Massive Sulphide | MSUL | > 50% | > 35% | > 200 | NA | > 3.7 | NA |
| | Semi-Massive Sulphide | SMSX | 25% to 50% | 20% to 35% | 50 to 200 | NA | 2.9 to 3.7 | NA |
| | Stringer | STSX | 5% to 25% | 10% to 20% | < 50 | <500 | 2.5 to 2.9 | >90 |
Three main types of dykes have been logged and interpreted:
| | - North-south-trending mafic to intermediate dykes, with thicknesses ranging from 1 m to 5 m
- Moderately west-dipping intermediate dykes within the footwall alteration zone, with average widths of 1 m to 5 m
- Cross-cutting, sub-vertical, felsic quartz-feldspar dykes (QFP) trending W-NW, up to 10 m in true thickness, and offsetting mineralised zones.
|
The dykes indicate zones of faulting and structural discontinuity. The dominant mafic hanging wall dyke swarm marks the stratigraphic top of the mineralizing system and has developed within a shear zone. This sub-vertical, 5 m to 10 m wide structural zone is continuous along the western edge of the massive sulphide body for most of the strike length of the Northwest mineralisation. The dykes are shown in Figure 13.4.
| PJ/ABE/ADD/CCS/AAN/NMW/CAE | Bisha_2016R&R-Update_TechRep_2CN010-024_20170808_aan_cae | August 2017 |
| SRK Consulting |
| NI 43-101 Technical Report Bisha Mine 2016, Eritrea | Page 154 |

Source: AGP, 2014
Note: Mafic (blue), intermediate (green), QFT (magenta)
Figure 13.4: Interpreted dykes, plan view
A number of structural zones were interpreted from the trends established from surface mapping and trenching, with targeted core re-logging and core photo examination used to confirm the structural interpretation. These zones are highlighted by offsets, rapid changes in orientation, and terminations of the massive sulphide body, particularly to the south where the South and Main Zones are separated by an area of discontinuous and irregular sulphide pods.
The identified faulting has preferred orientations of NW-SE to NNW-SSW, with a dominant dextral strike slip movement inferred.
Two main fault zones have been interpreted that significantly disrupt and displace the massive sulphide body, being the Zbei and Hbei Fault Zones. The latter is also interpreted as continuing southwards joining with a large boundary shear lying to the west of the Bisha Main deposit.
| PJ/ABE/ADD/CCS/AAN/NMW/CAE | Bisha_2016R&R-Update_TechRep_2CN010-024_20170808_aan_cae | August 2017 |
| SRK Consulting |
| NI 43-101 Technical Report Bisha Mine 2016, Eritrea | Page 155 |
Other faults have also been interpreted, and all structures are shown in Figure 13.5.
Where possible, lithologies have also been modelled. Although this was hampered by strong alteration and inconsistencies in logging, two rhyolite plugs have been interpreted in the hanging wall to the north and the south. A laminated mudstone has also been identified in the hanging wall adjacent to the Main massive sulphide domain.

Source: AGP, 2014
Figure 13.5: Interpreted structural features and massive sulphide domains, plan view
| 13.4.4 | Alteration and Weathering |
Weathering surfaces, based upon lithology logs, core photos, and mineral assemblages, were constructed on 25 m spaced cross-sections to define the main weathering and oxidation domains:
| PJ/ABE/ADD/CCS/AAN/NMW/CAE | Bisha_2016R&R-Update_TechRep_2CN010-024_20170808_aan_cae | August 2017 |
| SRK Consulting |
| NI 43-101 Technical Report Bisha Mine 2016, Eritrea | Page 156 |
| | - Oxide: above the Base of Complete Oxidation (BOCO) surface the rock has been weathered to the extent that all sulphides are oxidised with no primary or secondary sulphides present, and the original colour of the fresh rock is unrecognisable.
- Acid Leach Zone (Soap): a zone of intense acid leaching, predominantly above and adjacent to the massive sulphide bodies, which destroys the primary texture of the original rock leaving a clay-silica residue which, when wet, has a greasy to ‘soapy’ nature. The zone is below the BOCO surface and decomposed sulphides can be present towards the base of this unit, as disseminated chalcocite and covellite.
- Transitional (Supergene): all material lying above the Top of Fresh Rock (TOFR) surface and below the base of the acid leach zone. Within this zone the colour and texture of the fresh rock is recognisable, but partial weathering and discolouration of the rock substance has occurred. The zone is the transition between oxide and sulphide minerals, and contains both primary (chalcopyrite) and secondary (chalcocite/covellite) copper minerals.
- Fresh: all material below the TOFR, where the rock is unaffected by weathering, with no evidence of discolouration, and all sulphide minerals are primary (i.e., chalcopyrite, arsenopyrite, etc.).
|
| 13.4.5 | Mineralisation Domains |
Copper and Zinc
The estimation domains for copper and zinc were interpreted independently using the underlying geology models to establish the mineralisation orientation and continuity from section to section. As the copper and zinc mineralisation is known to be gradational in places across the massive sulphide boundaries, the resultant estimation domains can comprise a mixture of sulphide mineralisation types. For the purposes of grade estimation and ensuring that the grade population distribution is preserved, this was not considered to affect the integrity of estimation.
Copper domains were modelled at a nominal 0.3% cut-off; domains for the stringer sulphides were also created in which values were estimated separately from the massive sulphide domains.
In a similar manner, zinc domains were modelled at a nominal 0.5% cut-off, again with a separate halo of surrounding stringer mineralisation.
The copper and zinc domains are shown in Figure 13.6.
Arsenic, Iron, and Lead
The domains for arsenic and iron were interpreted to be the same as the massive sulphide models created in the geological modelling process. Lead was estimated using the zinc domains.
| PJ/ABE/ADD/CCS/AAN/NMW/CAE | Bisha_2016R&R-Update_TechRep_2CN010-024_20170808_aan_cae | August 2017 |
| SRK Consulting |
| NI 43-101 Technical Report Bisha Mine 2016, Eritrea | Page 157 |
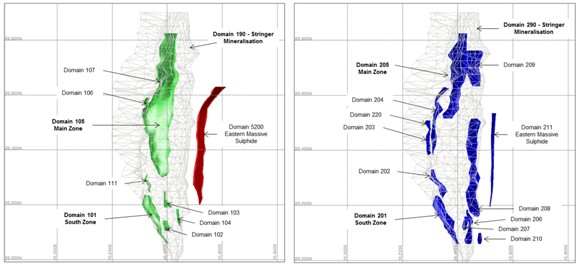
Source: AGP, 2014
Figure 13.6: Mineralisation domains for copper (left) and zinc (right), plan view
Gold and Silver
Domains for gold mineralisation were interpreted separately above and below the ‘soap’ interface, as the distribution of and control on gold mineralisation are distinctly different between the oxide/supergene and primary material. Silver mineralisation has a strong spatial correlation with gold, and has used the same domains for compositing.
The Supergene gold domain lies directly above the massive sulphide, mainly within and straddling the acid leach interface (‘soap’ surface) and appears to be unrelated to faulting. The higher gold grades are developed over the thickest portions of the central massive sulphide within ’soap’ material.
An upper low-grade (0.5 g/t Au to 1.5 g/t Au) saprolite (oxide) gold zone occurs above the supergene gold zone, and is developed as a sub-horizontal, near-surface band (5 m to 10 m thick) within 20 m of the surface. This zone is typically highly weathered and ferruginous and lies above the BOCO surface.
Gold wireframes were interpreted using a nominal 0.2 g/t cut-off within the oxide and soap material. Some mineralisation could not be included due to lack of continuity.
The semi-massive sulphide domains were utilised for the estimation of the broad low-grade gold and silver mineralisation below the soap weathering domain. Several distinct and continuous higher-grade gold-silver zones were interpreted sub-parallel to the massive sulphide hanging wall and footwall contacts, and were modelled and estimated separately.
The gold and silver domains are shown in Figure 13.7.
| PJ/ABE/ADD/CCS/AAN/NMW/CAE | Bisha_2016R&R-Update_TechRep_2CN010-024_20170808_aan_cae | August 2017 |
| SRK Consulting |
| NI 43-101 Technical Report Bisha Mine 2016, Eritrea | Page 158 |
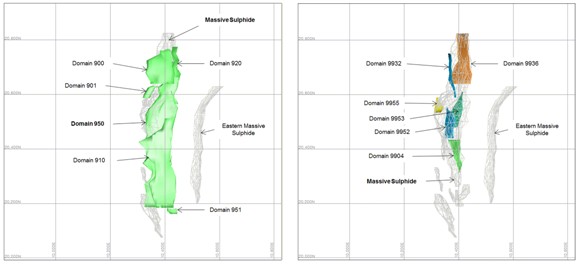
Source: AGP, 2014
Note : Oxide and supergene gold (left), high grade primary gold (right), plan view
Figure 13.7: Mineralisation domains
Drilling intervals within the mineralised domains described above in Section 13.4.5 were flagged with a unique database code.
Only diamond holes were used for the estimate, excluding those holes that were abandoned. The exception was the oxide/supergene gold estimate, where the shallow RC grade control holes and the trench assay data were also used.
Copper, zinc, gold, silver, arsenic, lead, and iron samples were composited at 2.5 m lengths downhole, extracted from the uniquely coded intercepts stored from the various zone code database tables. The downhole compositing process utilised a best fit approach, which resulted in composites of variable but equal length within each contiguous drillhole-coded interval, ensuring that the composite length was as near as possible to the nominated length. Composites of less than 1 m were rejected. Use of 2.5 m downhole composites significantly increases the composite data support relative to model block size. All domains were further split by the soap and other weathering surfaces, with population distributions demonstrably distinct across the soap surface.
A total of 11,674 bulk density measurements were completed by BMSC using the water immersion method (Archimedes principle). The density samples were 10 cm to 20 cm segments of full core samples selected from the core trays at 4 m intervals down the drillhole. Density measurements taken represent more than 95% of the total metres drilled and sampled at Northwest, giving very good coverage.
| PJ/ABE/ADD/CCS/AAN/NMW/CAE | Bisha_2016R&R-Update_TechRep_2CN010-024_20170808_aan_cae | August 2017 |
| SRK Consulting |
| NI 43-101 Technical Report Bisha Mine 2016, Eritrea | Page 159 |
The density sample data extracted from the supplied database was analysed statistically and graphically with respect to lithology, weathering, and mineralisation.
Estimating the bulk density below the soap weathering domain into the various sulphide domains was considered to be the most appropriate strategy. This estimation allowed for local variations in bulk density including less dense material in the transitional weathering domains which show a diffuse and irregular contact with the fresh material. The gradational nature of the TOFR surface does not warrant a hard boundary domain approach. Where unestimated, bulk density values were assigned. The density sample data statistics and assigned bulk densities are shown in Table 13.63 and Table 13.64, respectively.
Analysis of diamond core recovery for the massive sulphide zones shows that there is no correlation between sample grade and core recovery. This is illustrated for copper in Figure 13.8; the distribution for zinc is similar.

Source: AGP, 2014
Figure 13.8: Northwest massive sulphide zones – diamond core recovery vs. copper grade
Within the oxide and supergene zones core recovery has been unsatisfactory. The average core recovery within the supergene zone is 35%, with discontinuous and restricted zones of high grade gold. There appears to be a bias where the highest gold-grade zones are related to the low core recovery areas, indicating that there is an upgrading of the gold grade caused by washing out of the fine sand/silt, and the retention of the more competent (silicified?) cored zones with a higher tenor of gold mineralisation. For this reason, the confidence level when estimating these gold domains is low, and is reflected in the classification of these zones in the Inferred category. An RC drill program is planned to improve sample recovery and establish better spatial continuity, with the prospect of upgrading the Resource category once this work is completed.
| PJ/ABE/ADD/CCS/AAN/NMW/CAE | Bisha_2016R&R-Update_TechRep_2CN010-024_20170808_aan_cae | August 2017 |
| SRK Consulting |
| NI 43-101 Technical Report Bisha Mine 2016, Eritrea | Page 160 |
Table 13.63: Bulk density sample data statistics by estimation domain
| | Estimation Domain | No. of Samples | Min. | Max. | Mean | Median | CV |
| | Massive Sulphide | 1,155 | 1.27 | 5.11 | 4.05 | 4.25 | 0.15 |
| | Semi-Massive Sulphide | 767 | 1.44 | 4.70 | 2.91 | 2.85 | 0.15 |
| | Stringer Sulphide | 3,624 | 1.26 | 5.48 | 2.66 | 2.62 | 0.12 |
| | Outside Stringer (fresh) | 3,010 | 1.41 | 5.32 | 2.49 | 2.50 | 0.08 |
| | Outside Stringer (transitional) | 736 | 1.22 | 3.38 | 2.27 | 2.29 | 0.11 |
Table 13.64: Assigned bulk density values
| | Bulk Density Domain | Assigned Value |
| | Massive Sulphide (unestimated sub-domain 5200) | 4.00 |
| | Stringer Sulphide (unestimated) | 2.66 |
| | Outside Stringer (fresh) | 2.50 |
| | Outside Stringer (transitional) | 2.30 |
| | Soap | 1.90 |
| | Oxide | 1.60 |
| | Pyritic Sands (below Soap & inside mz_nw_au_supg20130409.dtm) | 2.80 |
| | Air (above topography) | 0.00 |
| | Dykes (transitional) | 2.20 |
| | Dykes (fresh) | 2.60 |
| 13.4.10 | Exploratory Data Analysis |
Sample distribution and population characteristics for the oxide, supergene, and primary zones were examined for the major domains via histograms, probability plots, and Parrish analysis, to validate the overall domain controls on mineralisation, and to determine whether further domaining was required for treatment of obvious statistical outliers. These methods identified multiple populations as well as the need to consider high grade capping. The high grade capping strategy is summarised in Table 13.65 to Table 13.71. The domain numbers refer to the numerical system applied to each of the mineralised domains, by element.
| PJ/ABE/ADD/CCS/AAN/NMW/CAE | Bisha_2016R&R-Update_TechRep_2CN010-024_20170808_aan_cae | August 2017 |
| SRK Consulting |
| NI 43-101 Technical Report Bisha Mine 2016, Eritrea | Page 161 |
Table 13.65: Copper high grade assay cuts by estimation domain
| | Domain | No. of Composites | Uncut Mean (% Cu) | Applied High Cut (% Cu) | Number
Cut | Percentile
Cut | Cut Mean
(% Cu) | Cut
CV |
| | 101 | 184 | 1.29 | 10.0 | 3 | ≈98th | 1.10 | 1.4 |
| | 105 | 1,453 | 0.82 | 5.0 | 2 | 99th + | 0.82 | 0.8 |
| | 190 | 585 | 0.06 | 2.0 | 4 | 99th + | 0.06 | 2.3 |
| | 999 Soap | 1,277 | 0.05 | 1.0 | 8 | 99th + | 0.04 | 2.8 |
| | 999 Oxide | 2,990 | 0.02 | 0.2 | 5 | 99th + | 0.02 | 1.0 |
Table 13.66: Zinc high grade assay cuts by estimation domain
| | Domain | No. of Composites | Uncut Mean
(% Zn) | Applied High Cut
(% Zn) | Number Cut | Percentile Cut | Cut Mean
(% Zn) | Cut
CV |
| | 201 | 268 | 2.87 | 12.0 | 5 | ≈98th | 2.81 | 1.0 |
| | 202 | 28 | 1.39 | 3.0 | 1 | 98th | 1.32 | 0.5 |
| | 220 | 3 | 4.20 | 3.0 | 1 | 90th | 1.94 | 0.1 |
| | 290 | 6,903 | 0.07 | 3.0 | 3 | 99th + | 0.07 | 2.1 |
| | 999 Soap | 1,277 | 0.03 | 0.5 | 7 | 99th + | 0.03 | 2.1 |
| | 999 Oxide | 2,990 | 0.02 | 0.3 | 6 | 99th + | 0.02 | 1.5 |
Table 13.67: Lead high grade assay cuts by estimation domain
| | Domain | No. of Composites | Uncut Mean
(% Pb) | Applied High Cut
(% Pb) | Number Cut | Percentile Cut | Cut Mean
(% Pb) | Cut CV |
| | 211 | 16 | 0.23 | 0.5 | 1 | 98th | 0.21 | 0.6 |
| | 290 | 6,852 | 0.01 | 0.3 | 9 | 99th + | 0.01 | 3.5 |
| | 999 Soap | 802 | 0.02 | 0.2 | 11 | 99th + | 0.02 | 1.4 |
| | 999 Oxide | 2,596 | 0.02 | 0.4 | 4 | 99th + | 0.02 | 1.7 |
| PJ/ABE/ADD/CCS/AAN/NMW/CAE | Bisha_2016R&R-Update_TechRep_2CN010-024_20170808_aan_cae | August 2017 |
| SRK Consulting |
| NI 43-101 Technical Report Bisha Mine 2016, Eritrea | Page 162 |
Table 13.68: Gold high grade assay cuts by estimation domain
| | Domain | No. of Composites | Uncut Mean
(g/t Au) | Applied High Cut
(g/t Au) | Number Cut | Percentile Cut | Cut Mean
(g/t Au) | Cut CV |
| | 900 | 80 | 0.71 | 3 | 3 | 97th | 0.63 | 1.2 |
| | 910 | 191 | 0.70 | 7 | 3 | ≈98th | 0.61 | 2.0 |
| | 950 | 336 | 3.00 | 25 | 8 | ≈98th | 2.06 | 2.3 |
| | 999 | 3,990 | 0.05 | 1 | 11 | 99th + | 0.05 | 1.9 |
| | 9100 | 401 | 0.37 | 5 | 2 | 99th + | 0.33 | 1.7 |
| | 9110 | 119 | 0.21 | 1 | 5 | ≈96th | 0.19 | 1.3 |
| | 9400 | 62 | 0.27 | 1 | 6 | 90th | 0.25 | 1.2 |
| | 9500 | 2,023 | 0.31 | 10 | 6 | 99th + | 0.22 | 0.1 |
| | 9600 | 4,623 | 0.09 | 2 | 23 | 99th + | 0.08 | 0.1 |
| | 9904 | 30 | 5.14 | 25 | 2 | 96th | 3.97 | 1.5 |
| | 9932 | 27 | 8.16 | 25 | 3 | 96th | 6.54 | 1.2 |
| | 9936 | 27 | 3.54 | 25 | 1 | 99th + | 2.11 | 2.0 |
Table 13.69: Silver high grade assay cuts by estimation domain
| | Domain | No. of Composites | Uncut Mean
(g/t Ag) | Applied High Cut
(g/t Ag) | Number Cut | Percentile Cut | Cut Mean
(g/t Ag) | Cut CV |
| | 900 | 80 | 2.60 | 10 | 5 | ≈95th | 2.2 | 1.2 |
| | 910 | 161 | 57.30 | 20 | 4 | 98th | 2.9 | 1.2 |
| | 920 | 16 | 8.50 | 20 | 2 | 90th | 5.5 | 1.3 |
| | 950 | 187 | 22.10 | 200 | 5 | 99th | 18.5 | 1.4 |
| | 999 | 3,711 | 2.30 | 100 | 4 | 99th + | 2.0 | 2.6 |
| | 9500 | 4,100 | 3.09 | 50 | 5 | 99th + | 2.9 | 1.9 |
| | 9904 | 34 | 20.60 | 50 | 1 | 99th + | 17.3 | 0.7 |
| | 9932 | 56 | 15.40 | 50 | 1 | 99th + | 12.4 | 1.5 |
| | 9936 | 54 | 13.90 | 50 | 1 | 99th + | 8.5 | 1.8 |
| | 9952 | 26 | 12.90 | 50 | 1 | 99th + | 11.5 | 1.8 |
Table 13.70: Arsenic high grade assay cuts by estimation domain
| | Domain | No. of Composites | Uncut Mean (g/t As) | Applied High Cut
(g/t As) | Number Cut | Percentile Cut | Cut Mean
(g/t As) | Cut CV |
| | 1000 | 205 | 557 | 3,000 | 1 | 99th + | 550 | 1.0 |
| | 6000 | 5,785 | 51 | 400 | 4 | 99th + | 51 | 0.9 |
| | 999 Soap | 2,596 | 107 | 700 | 2 | 99th + | 106 | 1.0 |
| | 999 Oxide | 2,596 | 172 | 1,500 | 1 | 99th + | 172 | 1.0 |
| PJ/ABE/ADD/CCS/AAN/NMW/CAE | Bisha_2016R&R-Update_TechRep_2CN010-024_20170808_aan_cae | August 2017 |
| SRK Consulting |
| NI 43-101 Technical Report Bisha Mine 2016, Eritrea | Page 163 |
Table 13.71: Iron high grade assay cuts by estimation domain
| | Domain | No. of Composites | Uncut Mean
(% Fe) | Applied High Cut
(% Fe) | Number Cut | Percentile Cut | Cut Mean
(% Fe) | Cut CV |
| | 999 Soap | 1,256 | 7.6 | 30 | 21 | 98th | 7.5 | 0.9 |
Variography was undertaken using Isatis software on the cut 2.5 m composites for copper, zinc, lead, gold, silver, arsenic, and iron. Variography for bulk density was undertaken on the sample data. The most informed domains were used for variography as shown in Table 13.72.
Table 13.72: Domain groupings
| | Group | Cu Domains | Zn-Pb Domains | Massive Sulphide Domain | Semi-Massive Sulphide Domain | Au-Ag Domains | |
| | North Zone | 105, 107, 5200 | 201, 202–220
(all) | 5000, 1200, 3000, 4000, 5100, 5200 | 9500, 9300, 9400, 5200 | 950, 900, 910, 920, 999 (Oxide/Supg.)
All Primary Gold
9904, 9932, 9936, 9952, 9953, 9955 | |
| | Central Zone | 105, 103,104, | |
| | 106, 111 | |
| | South Zone | 101,102 | 1000, 1100, 2000 | 9100, 9110, 9200 | |
| | |
| | Stringer Mineralization | 190 | 290 | 6000 | 9600 | 9600 | |
| | Note: bold indicates a domain on which variography was completed. |
The best spatial continuity is generally orientated parallel to the strike of the mineralised zones, with the Central Zone domains showing a distinct plunge to the north. Minor modifications were made to the variogram orientations and anisotropy parameters used in the estimates to better suit the orientation of sub-regions within the mineralisation domains. The resulting estimation parameters are shown in Table 13.73 to Table 13.77, inclusive.
| PJ/ABE/ADD/CCS/AAN/NMW/CAE | Bisha_2016R&R-Update_TechRep_2CN010-024_20170808_aan_cae | August 2017 |
| SRK Consulting |
| NI 43-101 Technical Report Bisha Mine 2016, Eritrea | Page 164 |
Table 13.73: Copper variogram parameters
| | Zone Code | Nugget | Spherical 1 | Major/ Semi- Major | Plunge | Dip |
| | Relative Sill | Relative Sill | Major Axis Range
(m) | Major/ Semi- Major | Major/ Minor | Relative Sill | Major Axis Range (m) | Major/Semi-Major | Major/ Minor |
| | 101 fresh | 0.11 | 0.16 | 45 | 1 | 4 | 0.73 | 70 | 1 | 4 | 0 | 85 |
| | 101 trans | 0.11 | 0.16 | 45 | 1 | 4 | 0.73 | 70 | 1 | 4 | 0 | 85 |
| | 102 | 0.11 | 0.16 | 45 | 1 | 4 | 0.73 | 70 | 1 | 4 | 0 | 80 |
| | 103 | 0.16 | 0.19 | 15 | 2 | 4 | 0.65 | 100 | 2 | 4 | 0 | 75 |
| | 104 | 0.16 | 0.19 | 15 | 2 | 4 | 0.65 | 100 | 2 | 4 | 0 | 85 |
| | 105 north fresh | 0.17 | 0.32 | 15 | 1 | 4 | 0.51 | 65 | 1 | 4 | 0 | 70 |
| | 105 north trans | 0.17 | 0.32 | 15 | 1 | 4 | 0.51 | 65 | 1 | 4 | 0 | 70 |
| | 105 central fresh | 0.16 | 0.19 | 15 | 2 | 4 | 0.65 | 100 | 2 | 4 | -25 | 80 |
| | 105 central trans | 0.16 | 0.19 | 15 | 2 | 4 | 0.65 | 100 | 2 | 4 | -25 | 80 |
| | 106 | 0.16 | 0.19 | 15 | 2 | 4 | 0.65 | 100 | 2 | 4 | 0 | 85 |
| | 107 fresh | 0.17 | 0.32 | 15 | 1 | 4 | 0.51 | 65 | 1 | 4 | 0 | 80 |
| | 107 trans | 0.17 | 0.32 | 15 | 1 | 4 | 0.51 | 65 | 1 | 4 | 0 | 80 |
| | 111 | 0.16 | 0.19 | 15 | 2 | 4 | 0.65 | 100 | 2 | 4 | 0 | 90 |
| | 5200 (EMS) | 0.17 | 0.32 | 15 | 1 | 4 | 0.51 | 65 | 1 | 4 | 0 | 85 |
| | 190 below soap fresh | 0.26 | 0.26 | 6 | 1 | 4 | 0.48 | 75 | 1 | 4 | 0 | 75 |
| | 190 below soap trans | 0.26 | 0.26 | 6 | 1 | 4 | 0.48 | 75 | 1 | 4 | 0 | 75 |
| | 999 soap | 0.41 | 0.59 | 90 | 1 | 1 | - | - | - | - | 0 | 0 |
| | 999 oxide | 0.23 | 0.43 | 8 | 1 | 1 | 0.34 | 80 | 1 | 1 | 0 | 0 |
| PJ/ABE/ADD/CCS/AAN/NMW/CAE | Bisha_2016R&R-Update_TechRep_2CN010-024_20170808_aan_cae | August 2017 |
| SRK Consulting |
| NI 43-101 Technical Report Bisha Mine 2016, Eritrea | Page 165 |
Table 13.74: Zinc variogram parameters
| | Zone Code | Nugget | Spherical 1 | Major/ Semi- Major | Plunge | Dip |
| | Relative Sill | Relative Sill | Major Axis Range
(m) | Major/ Semi- Major | Major/ Minor | Relative Sill | Major Axis Range (m) | Major/Semi-Major | Major/ Minor |
| | 201 | 0.21 | 0.36 | 6 | 1 | 4 | 0.42 | 45 | 1 | 4 | 0 | 85 |
| | 202 | 0.21 | 0.36 | 6 | 1 | 4 | 0.42 | 45 | 1 | 4 | 0 | 85 |
| | 203 | 0.21 | 0.36 | 6 | 1 | 4 | 0.42 | 45 | 1 | 4 | 0 | 90 |
| | 204 | 0.21 | 0.36 | 6 | 1 | 4 | 0.42 | 45 | 1 | 4 | 0 | 90 |
| | 205 | 0.21 | 0.36 | 6 | 1 | 4 | 0.42 | 45 | 1 | 4 | 0 | 75 |
| | 206 | 0.21 | 0.36 | 6 | 1 | 4 | 0.42 | 45 | 1 | 4 | 0 | 85 |
| | 207 | 0.21 | 0.36 | 6 | 1 | 4 | 0.42 | 45 | 1 | 4 | 0 | 75 |
| | 208 | 0.21 | 0.36 | 6 | 1 | 4 | 0.42 | 45 | 1 | 4 | 0 | 75 |
| | 209 | 0.21 | 0.36 | 6 | 1 | 4 | 0.42 | 45 | 1 | 4 | 0 | 75 |
| | 210 | 0.21 | 0.36 | 6 | 1 | 4 | 0.42 | 45 | 1 | 4 | 0 | 75 |
| | 211 (EMS) | 0.21 | 0.36 | 0 | 1 | 4 | 0.42 | 45 | 1 | 4 | 0 | 85 |
| | 220 | 0.21 | 0.36 | 6 | 1 | 4 | 0.42 | 45 | 1 | 4 | 0 | 85 |
| | 290 below soap | 0.16 | 0.43 | 9 | 1 | 4 | 0.41 | 28 | 1 | 4 | 0 | 75 |
| | 999 soap | 0.21 | 0.25 | 20 | 1 | 1 | 0.54 | 60 | 1 | 1 | 0 | 0 |
| | 999 oxide | 0.21 | 0.25 | 20 | 1 | 1 | 0.54 | 60 | 1 | 1 | 0 | 0 |
| PJ/ABE/ADD/CCS/AAN/NMW/CAE | Bisha_2016R&R-Update_TechRep_2CN010-024_20170808_aan_cae | August 2017 |
| SRK Consulting |
| NI 43-101 Technical Report Bisha Mine 2016, Eritrea | Page 166 |
Table 13.75: Gold variogram parameters
| | Zone Code | Nugget | Spherical 1 | Major/ Semi- Major | Plunge | Dip |
| | Relative Sill | Relative Sill | Major Axis Range
(m) | Major/ Semi- Major | Major/ Minor | Relative Sill | Major Axis Range (m) | Major/Semi-Major | Major/ Minor |
| | 9904 | 0.20 | 0.55 | 4 | 1 | 2 | 0.25 | 25 | 1 | 2 | 0 | 70 |
| | 9932 | 0.20 | 0.55 | 4 | 1 | 2 | 0.25 | 25 | 1 | 2 | 0 | 85 |
| | 9936 | 0.20 | 0.55 | 4 | 1 | 2 | 0.25 | 25 | 1 | 2 | 0 | 75 |
| | 9952 | 0.20 | 0.55 | 4 | 1 | 2 | 0.25 | 25 | 1 | 2 | 0 | 65 |
| | 9953 | 0.20 | 0.55 | 4 | 1 | 2 | 0.25 | 25 | 1 | 2 | 0 | 70 |
| | 9955 | 0.20 | 0.55 | 4 | 1 | 2 | 0.25 | 25 | 1 | 2 | 0 | 75 |
| | 9100 | 0.15 | 0.52 | 8 | 1 | 2 | 0.33 | 50 | 1 | 2 | 0 | 80 |
| | 9110 | 0.15 | 0.52 | 8 | 1 | 2 | 0.33 | 50 | 1 | 2 | 0 | 85 |
| | 9200 | 0.15 | 0.52 | 8 | 1 | 2 | 0.33 | 50 | 1 | 2 | 0 | 85 |
| | 9300 | 0.15 | 0.52 | 8 | 1 | 2 | 0.33 | 50 | 1 | 2 | 0 | 70 |
| | 9400 | 0.15 | 0.52 | 8 | 1 | 2 | 0.33 | 50 | 1 | 2 | 0 | 65 |
| | 9500 | 0.15 | 0.52 | 8 | 1 | 2 | 0.33 | 50 | 1 | 2 | 0 | 75 |
| | 9600 (below soap) | 0.15 | 0.52 | 8 | 1 | 2 | 0.33 | 50 | 1 | 2 | 0 | 75 |
| | 5200 | 0.15 | 0.52 | 8 | 1 | 2 | 0.33 | 50 | 1 | 2 | 0 | 85 |
| | 900 (oxide) | 0.19 | 0.41 | 15 | 1 | 1 | 0.40 | 50 | 1 | 1 | 0 | 0 |
| | 910 (oxide) | 0.19 | 0.41 | 15 | 1 | 1 | 0.40 | 50 | 1 | 1 | 0 | 0 |
| | 920 (oxide) | 0.19 | 0.41 | 15 | 1 | 1 | 0.40 | 50 | 1 | 1 | 0 | 0 |
| | 950 (supergene) | 0.19 | 0.41 | 15 | 1 | 1 | 0.40 | 50 | 1 | 1 | 0 | 0 |
| | 999 (above soap) | 0.19 | 0.41 | 15 | 1 | 1 | 0.40 | 50 | 1 | 1 | 0 | 0 |
| PJ/ABE/ADD/CCS/AAN/NMW/CAE | Bisha_2016R&R-Update_TechRep_2CN010-024_20170808_aan_cae | August 2017 |
| SRK Consulting |
| NI 43-101 Technical Report Bisha Mine 2016, Eritrea | Page 167 |
Table 13.76: Silver variogram parameters
| | Zone Code | Nugget | Spherical 1 | Major/ Semi- Major | Plunge | Dip |
| | Relative Sill | Relative Sill | Major Axis Range
(m) | Major/ Semi- Major | Major/ Minor | Relative Sill | Major Axis Range (m) | Major/Semi-Major | Major/ Minor |
| | 9904 | 0.27 | 0.31 | 4 | 1 | 1 | 0.42 | 30 | 1 | 1 | 0 | 70 |
| | 9932 | 0.27 | 0.31 | 4 | 1 | 1 | 0.42 | 30 | 1 | 1 | 0 | 85 |
| | 9936 | 0.27 | 0.31 | 4 | 1 | 1 | 0.42 | 30 | 1 | 1 | 0 | 75 |
| | 9952 | 0.27 | 0.31 | 4 | 1 | 1 | 0.42 | 30 | 1 | 1 | 0 | 65 |
| | 9953 | 0.27 | 0.31 | 4 | 1 | 1 | 0.42 | 30 | 1 | 1 | 0 | 70 |
| | 9955 | 0.27 | 0.31 | 4 | 1 | 1 | 0.42 | 30 | 1 | 1 | 0 | 75 |
| | 9100 | 0.27 | 0.35 | 7 | 1 | 2 | 0.38 | 60 | 1 | 2 | 0 | 80 |
| | 9110 | 0.27 | 0.35 | 7 | 1 | 2 | 0.38 | 60 | 1 | 2 | 0 | 85 |
| | 9200 | 0.27 | 0.35 | 7 | 1 | 2 | 0.38 | 60 | 1 | 2 | 0 | 85 |
| | 9300 | 0.29 | 0.25 | 10 | 1 | 2 | 0.46 | 130 | 1 | 2 | 0 | 70 |
| | 9400 | 0.29 | 0.25 | 10 | 1 | 2 | 0.46 | 130 | 1 | 2 | 0 | 65 |
| | 9500 | 0.29 | 0.25 | 10 | 1 | 2 | 0.46 | 130 | 1 | 2 | 0 | 80 |
| | 9600 (below soap) | 0.29 | 0.25 | 10 | 1 | 2 | 0.46 | 130 | 1 | 2 | 0 | 75 |
| | 5200 | 0.29 | 0.25 | 10 | 1 | 2 | 0.46 | 130 | 1 | 2 | 0 | 80 |
| | 900 (oxide) | 0.19 | 0.41 | 15 | 1 | 1 | 0.40 | 50 | 1 | 1 | 0 | 0 |
| | 910 (oxide) | 0.19 | 0.41 | 15 | 1 | 1 | 0.40 | 50 | 1 | 1 | 0 | 0 |
| | 920 (oxide) | 0.19 | 0.41 | 15 | 1 | 1 | 0.40 | 50 | 1 | 1 | 0 | 0 |
| | 950 (supergene) | 0.19 | 0.41 | 15 | 1 | 1 | 0.40 | 50 | 1 | 1 | 0 | 0 |
| | 999 (above soap) | 0.19 | 0.41 | 15 | 1 | 1 | 0.40 | 50 | 1 | 1 | 0 | 0 |
| PJ/ABE/ADD/CCS/AAN/NMW/CAE | Bisha_2016R&R-Update_TechRep_2CN010-024_20170808_aan_cae | August 2017 |
| SRK Consulting |
| NI 43-101 Technical Report Bisha Mine 2016, Eritrea | Page 168 |
Table 13.77: Arsenic variogram parameters
| | Zone Code | Nugget | Spherical 1 | Major/ Semi- Major | Plunge | Dip |
| | Relative Sill | Relative Sill | Major Axis Range
(m) | Major/ Semi- Major | Major/ Minor | Relative Sill | Major Axis Range (m) | Major/Semi-Major | Major/ Minor |
| | 1000 | 0.33 | 0.37 | 10 | 1 | 4 | 0.30 | 50 | 1 | 4 | 0 | 85 |
| | 1100 | 0.33 | 0.37 | 10 | 1 | 4 | 0.30 | 50 | 1 | 4 | 0 | 85 |
| | 1200 | 0.09 | 0.35 | 35 | 2 | 4 | 0.56 | 130 | 2 | 4 | 0 | 90 |
| | 2000 | 0.33 | 0.37 | 10 | 1 | 4 | 0.30 | 50 | 1 | 4 | 0 | 85 |
| | 3000 | 0.09 | 0.35 | 35 | 2 | 4 | 0.56 | 130 | 2 | 4 | 0 | 70 |
| | 4000 | 0.09 | 0.35 | 35 | 2 | 4 | 0.56 | 130 | 2 | 4 | 0 | 65 |
| | 5000 | 0.09 | 0.35 | 35 | 2 | 4 | 0.56 | 130 | 2 | 4 | -25 | 75 |
| | 5100 | 0.09 | 0.35 | 35 | 1 | 1 | 0.56 | 130 | 1 | 1 | 0 | 85 |
| | 5200 | 0.09 | 0.35 | 35 | 2 | 4 | 0.56 | 130 | 2 | 4 | 0 | 85 |
| | 999 (oxide) | 0.24 | 0.42 | 12 | 1 | 1 | 0.34 | 75 | 1 | 1 | 0 | 0 |
| | 999 (soap) | 0.24 | 0.42 | 12 | 1 | 1 | 0.34 | 75 | 1 | 1 | 0 | 0 |
| | 6000 (below soap) | 0.24 | 0.42 | 12 | 1 | 3 | 0.34 | 75 | 1 | 3 | 0 | 75 |
| 13.4.12 | Search Neighbourhood Analysis |
Search neighbourhood analysis was undertaken as generally described in Section 14.1.2.
Based on the selected optimal search neighbourhoods, the number of composites required for interpolation at Northwest was determined. Global figures of a minimum of four composites, and a maximum of 15 composites were applied. There were no restrictions in the interpolation for the maximum number of composites in a particular drillhole.
| 13.4.13 | Block Model Parameters |
The block model set-up took into account various factors including the geometry of the mineralised zones and the spacing of the informing data. For the Northwest deposit, an un-rotated (local grid) model was created parallel to the general strike of the mineralisation. The block model is defined as given in Table 13.78.
Table 13.78: Block model definitions
| | | Minimum | Maximum | Model Extent |
| | Easting | 10,000 | 10800 | 800 |
| | Northing | 19,870 | 21010 | 1,140 |
| | RL | 200 | 660 | 460 |
| | Parent Cell X m | 5 | Min. Sub-Cell X m | 1.25 |
| | Parent Cell Y m | 10 | Min. Sub-Cell Y m | 2.5 |
| | Parent Cell Z m | 10 | Min. Sub-Cell Z m | 2.5 |
| PJ/ABE/ADD/CCS/AAN/NMW/CAE | Bisha_2016R&R-Update_TechRep_2CN010-024_20170808_aan_cae | August 2017 |
| SRK Consulting |
| NI 43-101 Technical Report Bisha Mine 2016, Eritrea | Page 169 |
Ordinary Kriging (OK) was used for estimation of all elements in all mineralised domains. Each domain was separately estimated using the unique set of composite samples associated with that domain.
The majority of the blocks within the domains were estimated in a first pass, based on the criteria given in the descriptions above. A second pass of estimation was required for a number of domains to estimate grade in peripheral areas. This pass used more relaxed search criteria, typically an increase in the search range and a reduction in the minimum number of informing samples.
In a few areas, the second pass search failed to estimate a small number of blocks. Such blocks within the interpolated mineralised domain, and in the surrounding ‘waste’ domains outside of the mineralised domains, were assigned background values of 0.0001 ppm for gold and silver, and 0.0001% for copper, zinc, and lead. Unestimated blocks for arsenic and iron were assigned small background values of 10 ppm and 25 ppm, respectively. Background base metal and density values were assigned to all blocks within the modelled “barren” dyke models. Gold and silver were estimated as part of the primary high grade gold interpolation across and within the dykes as a separate mineralisation event.
| 13.4.15 | Block Model Validation |
Visual and statistical validation of the copper, zinc, and gold grade estimates for Northwest demonstrated robust model outcomes.
In summary, the validation methods used were:
| | - Swath plots comparing the estimated grade parameters against the mean declustered and raw composite grades
- Visual comparison of estimated against composite data values
- Comparison of estimated grade and mean composite grade by domain.
|
The visual comparison was good, with areas of high (and low) block model grades supported by the presence of high- (and low)-grade composites. All comparisons were satisfactory. Some smoothing of grade was apparent, but this is expected and desirable from the use of OK as the interpolation method.
| 13.4.16 | Classification of Mineral Resources |
The Mineral Resource for Northwest is a global estimate representing a reliable estimate of the total contained metal, but the current block estimates are likely to vary as compared with the actual grade/tonnage distribution that will be achieved during selective mining and over short production periods.
The Northwest mineralisation has been sufficiently drilled and sampled to allow classification as an Indicated and Inferred Mineral Resource in accordance with the current CIM Definition Standards for Mineral Resources and Mineral Reserves. As with any non-rigidly defined classification there will always be some blocks within categories that depart from defined criteria. The classification employed reflects a practical combination of both geological knowledge and estimation quality parameters that may be more numerical in nature. This approach to classification aims to avoid creating a complex numerically-based mosaic distribution of classified blocks.
| PJ/ABE/ADD/CCS/AAN/NMW/CAE | Bisha_2016R&R-Update_TechRep_2CN010-024_20170808_aan_cae | August 2017 |
| SRK Consulting |
| NI 43-101 Technical Report Bisha Mine 2016, Eritrea | Page 170 |
Classification considered a number of factors:
| | - Continuity of geological and mineralisation: a mineralised volume was based firstly on geological interpretation, subsequently modified by application of a cut-off grade. This ensured that the mineralised volume was not extrapolated unreasonable distances beyond data limits. The models created satisfy these criteria.
- Data spacing and sample data quality: data spacing must be sufficiently dense to ensure continuity as defined by such studies; the veracity of the data being used for the estimate must be established. The models created satisfy these criteria.
- Estimation techniques: sufficient statistical and associated studies have been undertaken to ensure that the methodology used for the Northwest estimate is appropriate.
|
Employing the foregoing criteria, the primary zones were largely classified in the Indicated category, representing the majority of the contained metal at this deposit. The oxide, supergene, and primary high grade gold zones have all been classified as Inferred to reflect the low confidence in grade and geological continuity as a result of various identified factors, including poor core recovery, assay precision errors, and erratic, localised high grade gold assays.
| 13.4.17 | Reasonable Prospects of Economic Extraction |
Prospects for economic extraction were made by applying an NSR-based cut-off to blocks within a constraining optimised pit shell. The LG optimisation was achieved using Whittle.
The assumed long-term commodity prices used for the optimisation work as applied to Mineral Resources are shown in Table 13.79. These commodity prices are approximately 15% higher than those used in the estimation of Mineral Reserves, as described in Section 15.
Table 13.79: Mineral Resource commodity prices
| | Commodity | Prices |
| | Copper ($/lb) | 3.35 |
| | Zinc ($/lb) | 1.05 |
| | Gold ($/oz) | 1,350 |
The NSR calculation and pit optimisation process considered many of the parameters used in Mineral Reserve estimation, as these parameters are well established within the working mine. These parameters include commodity price, 2014 budget costs for production and processing, process recoveries, concentrate grade, selling costs, and other ore-based costs. The optimisation process also uses the current geotechnical model for the pit design.
| PJ/ABE/ADD/CCS/AAN/NMW/CAE | Bisha_2016R&R-Update_TechRep_2CN010-024_20170808_aan_cae | August 2017 |
| SRK Consulting |
| NI 43-101 Technical Report Bisha Mine 2016, Eritrea | Page 171 |
An optimised pit shell was generated from Whittle using the parameters described above and the commodity prices given in Table 13.79. No pit design has been completed. Blocks within the pit shell were reported as Mineral Resources above NSR cut-offs of $40.70/t for oxide material, and $39.70/t for supergene and primary material.
Figure 13.9 shows the pit shell constraining the Resource, with copper-mineralised zones in green, and zinc-mineralised zones in blue.
Mineralisation below the constraining pit shell has not been analysed for possible underground mining at this time.
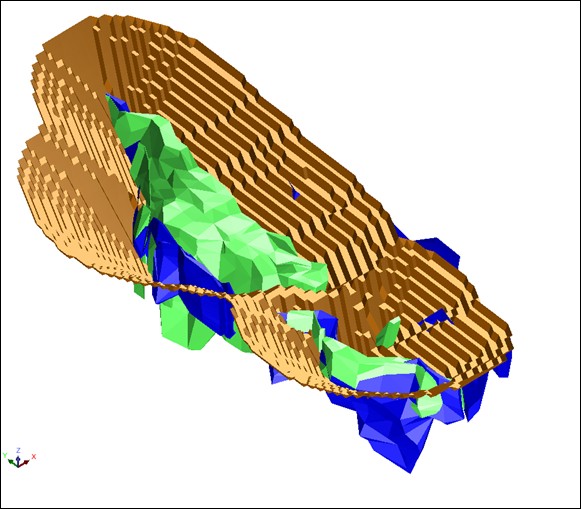
Source: AGP, 2014
Note : Perspective view looking northwest (local grid)
Figure 13.9: Northwest resource-constraining pit shell with copper and zinc mineralised zones
| PJ/ABE/ADD/CCS/AAN/NMW/CAE | Bisha_2016R&R-Update_TechRep_2CN010-024_20170808_aan_cae | August 2017 |
| SRK Consulting |
| NI 43-101 Technical Report Bisha Mine 2016, Eritrea | Page 172 |
| 13.4.18 | Mineral Resource Estimate |
Mineral Resources are classified and reported in accordance with the CIM Definition Standards for Mineral Resources and Mineral Reserves (May, 2014).
The Mineral Resource estimates described here have an effective date of 31 December 2016, and are summarised in Table 13.80.
Table 13.80: Mineral Resource statement for Northwest deposit, Eritrea, as of 31 December 2016
| | Category | Quantity | Grade |
| | (000’s t) | (% Zn) | (% Cu) | (g/t Au) | (g/t Ag) |
| | Indicated | | | | | |
| | Supergene | 1,020 | | 1.47 | 0.2 | 10 |
| | Primary | 2,530 | 1.08 | 1.04 | 0.3 | 13 |
| | Inferred | | | | | |
| | Oxide | 500 | | | 3.7 | 18 |
| | Supergene | 100 | | 0.8 | 3.7 | 19 |
| | Primary | 100 | 0.9 | 0.9 | 2.9 | 15 |
| | Notes to be read in conjunction with Mineral Resource table for Northwest: |
| | (1) | No change has occurred Northwest since 2014 which used commodity prices for copper, zinc, gold and silver of $3.35/lb, $1.05/lb, $1,350/oz and $23/oz, respectively. Open Pit Mineral Resources are defined within an optimal Lerchs-Grossman (LG) Pit Shell. The mining cost and total ore based cost (process, G&A and stockpile re-handle) applied was approximately 10% below the long-term view on costs with appropriate ore haulage costs for each satellite deposit. Overall pit slopes varied from 39˚ to 45˚ for Northwest. NSR cut-off used were: $40.70/t for Oxide Phase, $39.70/t for Supergene and Primary Phase. |
| | (2) | Net Smelter Return values were calculated for each block using all resource categories, commodity prices, recoveries, appropriate smelter terms and downstream costs. Metallurgical recoveries, supported by metallurgical testwork, were applied as follows: |
| | a. | Oxide Phase; recoveries of 88% and 22% were applied to gold and silver respectively. |
| | b. | Supergene Phase; recoveries of 87%, 46% and 50% were applied for copper, gold and silver respectively. Zinc has not been assigned a recovery as the values are isolated on the fringes of the deposit. |
| �� | c. | Primary Phase; recoveries to copper concentrate of 87%, 36% and 29% were applied for copper, gold and silver respectively. Recoveries to zinc concentrate of 81%, 36% and 29% were applied for zinc, gold and silver respectively. |
| | (3) | Open Pit Mineral Resources are reported within the pit shell generated using the specified commodity prices, using NSR block grade cut-off derived as above. Tonnage is rounded to the nearest 10,000 tonnes and grades are rounded to two decimal places for copper and zinc, one decimal place for gold and zero decimal places for silver. Tonnages and grades for the Inferred category are further rounded reflecting the uncertainty that attaches to this category. Contained metal for copper and zinc are rounded to the nearest ten thousand pounds. |
| | (4) | Rounding as required by reporting guidelines may result in apparent summation differences between tonnes, grade and contained metal content. |
| | (5) | Tonnage and grade measurements are in metrics units. Contained gold and silver ounces are reported as troy ounces, contained copper and zinc pounds as imperial pounds. |
| 13.5.1 | Project Sample Database |
The drilling database forms the basis of the estimate, containing all of the available and reliable assay data as of 31 October 2013.
| PJ/ABE/ADD/CCS/AAN/NMW/CAE | Bisha_2016R&R-Update_TechRep_2CN010-024_20170808_aan_cae | August 2017 |
| SRK Consulting |
| NI 43-101 Technical Report Bisha Mine 2016, Eritrea | Page 173 |
A total of 26,790 m of diamond drilling and 2,680 m of RC drilling was completed in a series of programs completed by Sanu and then BMSC since 2006. The majority of this data are available for the Hambok estimate, as detailed below in Table 13.81. Some 4,400 samples represent the mineralised zones of the deposit.
Table 13.81: Hambok deposit drillhole summary table
| | Year | Drilled by | Holes Drilled | No. of DDH | DDH
(m) | No. of RC Holes* | RC
(m) |
| | 2006 | Sanu | HAM-001 to HAM-045 | 44 | 7,282.50 | - | - |
| | 2006 | Sanu | HAM-045 to HAM-055 and
HAM-058 | 12 | 5,105.00 | - | - |
| | 2007 | Sanu | HAM-056, HAM-060,HAM-061 | 3 | 766.00 | - | - |
| | 2010 | Sanu | HAM-10-062 to HAM-10-065 | 4 | 974.00 | - | - |
| | 2011 | Sanu | HAM-11-066 to HAM-11-071, HAM-RC-11-01 to
HAM-RC-11-16 | 6 | 1,877.00 | 16 | 978 |
| | 2012 | Sanu | HAM-12-072 to HAM-12-096, HAM-RC-12-17 to
HAM-RC-12-42 | 25 | 8,072.00 | 26 | 1,698 |
| | 2013 | BMSC | HAM-13-097 to HAM-13-104 | 8 | 2,713.00 | - | - |
| | Total | | | 102 | 26,789.50 | 42 | 2,676 |
| | Note: *Assay results and lithological data were only used for the oxide component of the Resource. |
Introduction
The mineralised components of the Hambok deposit are divided into a primary copper/zinc sulphide zone, representing the majority of the deposit, and a minor oxide gold component.
The primary massive sulphide mineralisation is a single body, with a faulted displacement interpreted at depth in the northeast of the deposit. The massive sulphide zones strike at approximately 15°, dipping steeply to the east, with overall strike and dip lengths of some 975 m and 400 m, respectively. Semi-massive and stringer sulphides are not well developed in this deposit, which is hosted in rhyolitic and basaltic units. The oxide unit, as currently understood, is narrow and poorly developed. The mineralised zones are shown in Figure 13.10.
| PJ/ABE/ADD/CCS/AAN/NMW/CAE | Bisha_2016R&R-Update_TechRep_2CN010-024_20170808_aan_cae | August 2017 |
| SRK Consulting |
| NI 43-101 Technical Report Bisha Mine 2016, Eritrea | Page 174 |
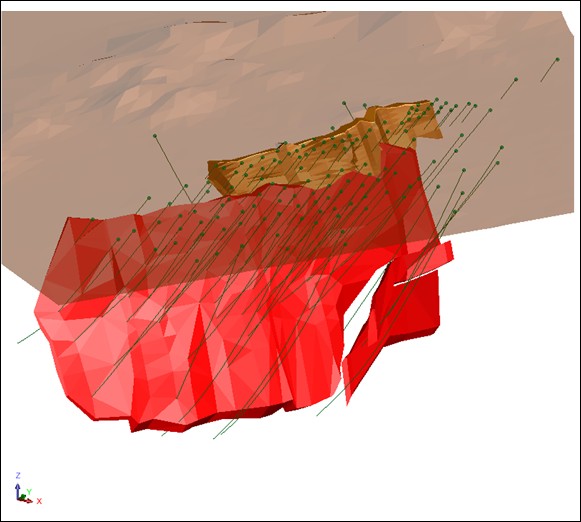
Source: AGP, 2014
Note : Perspective view looking northeast
Figure 13.10: Hambok massive sulphide body and oxide zone
Methodology
Initial interpretation was on 25 m to 50 m spaced E-W sections, and was accompanied by re-logging of diamond core to understand the nature of the mineralisation and to resolve areas of geological uncertainty and complexity. The sections were digitised and 3D wireframes were created in Surpac. The resultant solid 3D models represent the main geological components controlling the mineralisation, and are the basis for establishing grade continuity and the estimation of the Mineral Resource.
The large majority of sulphide mineralisation data derives from diamond core. The body is dominated by massive sulphides, frequently with a sharp and clear-cut boundary against the host rock. Developments of semi-massive and stringer sulphides are very limited and discontinuous, and models of these zones were not developed.
| PJ/ABE/ADD/CCS/AAN/NMW/CAE | Bisha_2016R&R-Update_TechRep_2CN010-024_20170808_aan_cae | August 2017 |
| SRK Consulting |
| NI 43-101 Technical Report Bisha Mine 2016, Eritrea | Page 175 |
The small oxide zone is largely defined by RC drilling confined to a zone in the northern half of the deposit area. Detailed interpretation in this zone is limited due to data quality, and further work is required to better define this zone. Nevertheless, a coherent zone was developed based on records of gossan and associated oxide lithologies. At present, a supergene zone is not thought to be present.
Displacement of the massive sulphide zone was clearly shown during the 2013 drilling program. Investigation of drill core and records showed that a flat-lying shear or fault was present causing this displacement.
| 13.5.3 | Alteration and Weathering |
A weathering surface, based on lithology logs (predominantly from RC drilling) was constructed on 50 m spaced cross-sections to define a simple oxidation domain. More modern drilling data would better define this and other surfaces. This surface was used to divide the oxide and sulphide parts of the deposit.
| 13.5.4 | Mineralisation Domains |
Within the massive sulphide unit there is clear and persistent higher and lower grade zonation of copper and zinc mineralisation. Observation shows a clear correlation of coincident copper and zinc values, and these zones can be readily interpreted on cross-section. Three zones are defined: on the hanging wall, footwall, and a central zone. The zones are best developed in the upper and thicker parts of the deposit, diminishing down-dip, and tapering toward the strike extents. The deepest massive sulphide intersections are often only represented by pyrite. The domains are illustrated in Figure 13.11.
| PJ/ABE/ADD/CCS/AAN/NMW/CAE | Bisha_2016R&R-Update_TechRep_2CN010-024_20170808_aan_cae | August 2017 |
| SRK Consulting |
| NI 43-101 Technical Report Bisha Mine 2016, Eritrea | Page 176 |

Source: AGP, 2014
Note : Section at approximately 1705100N
Figure 13.11: Vertical section of Hambok massive sulphides showing internal copper-zinc zonation
Drilling intervals within mineralised domains were flagged with a unique database code.
| PJ/ABE/ADD/CCS/AAN/NMW/CAE | Bisha_2016R&R-Update_TechRep_2CN010-024_20170808_aan_cae | August 2017 |
| SRK Consulting |
| NI 43-101 Technical Report Bisha Mine 2016, Eritrea | Page 177 |
Copper, zinc, gold, and silver samples were composited to 1.0 m lengths down hole, extracted from the uniquely coded intercepts stored from the various zone code database tables. The down hole compositing process utilised a best fit approach, which resulted in composites of variable but equal lengths within each contiguous drillhole-coded interval, ensuring that the composite length was as near as possible to the nominated length.
A total of 1,255 determinations were completed by Sanu and BMSC using the water immersion method. The density samples were 10 cm to 20 cm segments of full core samples selected from the core trays at approximately 10 m intervals, geology-dependent, during the Sanu programs, and at approximately 3 m intervals for the BMSC program.
Bulk density values were estimated within the massive sulphide using Inverse Distance Squared (IDW2), and model averages checked against raw data for accepTable correlation. A value of 3.2 g/cm3 was assigned to the oxide gold zone.
Analysis of diamond core recovery for the massive sulphide shows that there is no correlation between sample grade and core recovery. This is illustrated for zinc in Figure 13.12; the distribution for copper is similar.

Source: AGP, 2014
Figure 13.12: Hambok massive sulphide zone – diamond core recovery vs. zinc grade
| PJ/ABE/ADD/CCS/AAN/NMW/CAE | Bisha_2016R&R-Update_TechRep_2CN010-024_20170808_aan_cae | August 2017 |
| SRK Consulting |
| NI 43-101 Technical Report Bisha Mine 2016, Eritrea | Page 178 |
| 13.5.9 | Exploratory Data Analysis |
Sample distribution and population characteristics for the oxide and primary zones were examined for the major domains via histograms, probability plots, and Parrish analysis, to validate the overall domain controls on mineralisation, and to determine whether further domaining was required for treatment of obvious statistical outliers. These methods identified multiple populations as well as the need to consider high grade capping. This is consistent with the creation of separate grade zone domains within the primary mineralisation as described above. Further analysis showed that, by the defining of internal zones within the massive sulphide zone, the need for high grade capping was removed.
Variogram models all made use of the 1 m composites derived from the mineralised domains described in Section 13.5.4. The best spatial continuity for each of the sub-zones is generally orientated parallel to the strike and dip of the massive sulphide zone. Differing plunges were noted for each zone, being steeply south, shallowly south, and shallowly to the north for the footwall, central, and hanging wall zones, respectively. The resulting estimation parameters are shown in Table 13.82.
Table 13.82: Variogram parameters for Hambok estimation
| | Zone | Element | Nugget | Sill | Range (m) | Azimuth (°) | Plunge (°) | Dip
(°) | Ratio |
| | 1 | 2 | 1 | 2 | Semi- Major | Minor |
| | Central Zone | Cu | 0.36 | 0.20 | 0.44 | 114 | 267 | 184 | -27 | 52 | 2.1 | 17.8 |
| | Zn | 0.35 | 0.26 | 0.39 | 75 | 217 | 194 | -9 | 63 | 3.0 | 31.0 |
| | Footwall Zone | Cu | 0.25 | 0.24 | 0.51 | 164 | 295 | 180 | -68 | 90 | 1.8 | 29.5 |
| | Zn | 0.10 | 0.62 | 0.28 | 37 | 218 | 161 | -76 | 90 | 3.6 | 36.3 |
| | Hanging Wall Zone | Cu | 0.20 | 0.22 | 0.58 | 92 | 250 | 161 | -52 | 27 | 2.0 | 19.2 |
| | Zn | 0.15 | 0.30 | 0.55 | 71 | 225 | 205 | 18 | 75 | 3.4 | 28.1 |
| | Oxide Zone | Au | 0.17 | 0.83 | - | 38 | - | 200 | 24 | 60 | 2.4 | 4.8 |
| | Au | 0.17 | 0.25 | 0.58 | 127 | 60 | 185 | -21 | 62 | 1.9 | 14.1 |
| 13.5.11 | Search Neighbourhood Analysis |
Based on the selected optimal search neighbourhoods, the number of composites required for interpolation at Hambok was determined. Global figures of a minimum of 20 composites and a maximum of 55 composites were applied.
| 13.5.12 | Block Model Parameters |
The block model was orientated in the primary strike direction of 017°. The model parameters are given in Table 13.83. Sub-blocking to 2.5 m was used in all directions. Sub-cells received the parent cell grade during estimation, and were not estimated separately.
| PJ/ABE/ADD/CCS/AAN/NMW/CAE | Bisha_2016R&R-Update_TechRep_2CN010-024_20170808_aan_cae | August 2017 |
| SRK Consulting |
| NI 43-101 Technical Report Bisha Mine 2016, Eritrea | Page 179 |
Table 13.83: Block model extents, massive sulphide-hosted mineralisation
| | Parameter | X | Y | Z |
| | Minimum Coordinate | 328520 | 1704640 | 0 |
| | Block size (m) | 10 | 10 | 10 |
| | Extent (m) | 800 | 1,400 | 1,000 |
Massive Sulphide Hosted Mineralisation
Four zones or domains were separately estimated within the massive sulphide mineralisation, namely hanging wall, central, footwall, and remaining low-grade sulphide mineralisation. Copper and zinc values were estimated for all Zones using OK, with ellipsoid searches determined by the analysis described in Section 14.5.10 onwards. Other elements (arsenic, iron, etc.) were estimated using the parameters derived for the copper estimation. Each domain was separately estimated using the unique set of composite samples associated with that domain. The number of informing samples per sampling location was controlled to prevent individual holes or samples having too large an influence on the estimate. A single pass strategy was used for estimation of each domain or sub-section thereof. A second pass with the same parameters was used to ensure all blocks were estimated.
Gold Mineralisation
Gold values were estimated for the oxide zone above the oxidation surface using OK, with an ellipsoidal model determined by the variogram analysis and models described in Section 14.4.10 onwards. The zone was separately estimated using the unique set of composite samples associated with that zone. The interpolation pass strategy was as described for the massive sulphide zone. Gold values exist in the sulphide mineralisation below the oxidation surface, but are generally low.
| 13.5.14 | Block Model Validation |
Validation of the model was by visual inspection of estimated block grades against informing samples, and by comparison of estimated values against informing samples. In addition, QKNA was carried out post-estimation to test the performance of the estimation and the suitability of selected parameters, such as block size, numbers of informing samples, and search ranges. Swath plots were also produced to test for bias between samples and block grades. BMSC concludes that the block model satisfactorily models the distribution and variability of the informing sample grades without undue bias or smoothing for the level of study.
Figure 13.13 shows the distribution of the kriging slope of regression (Sr) parameter for the Hambok estimate for copper. The inset in the figure shows peripheral blocks, on the edges of the zones where values are lower, that mask the quality of the estimate in the core of the deposit. The main figure shows the high proportion of the model having slope of regression efficiencies in excess of 60%, demonstrating a robust estimate.
| PJ/ABE/ADD/CCS/AAN/NMW/CAE | Bisha_2016R&R-Update_TechRep_2CN010-024_20170808_aan_cae | August 2017 |
| SRK Consulting |
| NI 43-101 Technical Report Bisha Mine 2016, Eritrea | Page 180 |

Source: AGP, 2014
Note: Main picture, blocks with Sr ≥0.5 within massive sulphides, inset all blocks
Figure 13.13: Hambok massive sulphide: slope of regression distribution
| 13.5.15 | Classification of Mineral Resources |
The Mineral Resource for Hambok is a global estimate representing a reliable estimate of the total contained metal, but the current block estimates are likely to vary as compared with the actual grade/tonnage distribution that will be achieved during selective mining and over short production periods.
The Hambok mineralisation has been sufficiently drilled and sampled to allow classification as an Indicated and Inferred Mineral Resource in accordance with the current CIM Definition Standards for Mineral Resources and Mineral Reserves (CIM, 2014). As with any non-rigidly defined classification there will always be some blocks within categories that depart from defined criteria. The classification employed reflects a practical combination of both geological knowledge and estimation quality parameters that may be more numerical in nature. This approach to classification aims to avoid creating a complex numerically-based mosaic distribution of classified blocks.
| PJ/ABE/ADD/CCS/AAN/NMW/CAE | Bisha_2016R&R-Update_TechRep_2CN010-024_20170808_aan_cae | August 2017 |
| SRK Consulting |
| NI 43-101 Technical Report Bisha Mine 2016, Eritrea | Page 181 |
Classification considered a number of factors:
| | - Continuity of geology and mineralisation: a mineralised volume is firstly based on geological interpretation, subsequently modified by application of a cut-off grade from which internal domaining was completed. This ensures that the mineralised volume is not extrapolated unreasonable distances beyond data limits. The model created satisfies these criteria
- Data spacing and sample data quality: data spacing must be sufficiently dense to ensure continuity as defined by such studies; the veracity of the data being used for the estimate must be established. The models created satisfy these criteria; and
- Estimation techniques: sufficient statistical and associated studies have been undertaken to ensure that the methodology used for the Hambok estimate is appropriate.
|
Employing the foregoing criteria, the primary zones were largely classified in the Indicated category. The factors described above were combined into simplified shapes by resource category that was then applied to the block model, avoiding a patchy distribution of blocks of differing category. For the primary zone where data diminishes down-dip, estimation parameters such as slope of regression and kriging efficiency guided the limit of material in the Indicated category. The oxide gold zone was largely classified as Inferred to reflect the lower confidence in grade and geological continuity in this zone.
| 13.5.16 | Reasonable Prospects of Economic Extraction |
Prospects for economic extraction were made by applying an NSR-based cut-off to blocks within a constraining optimised pit shell. The LG optimisation was achieved using Whittle.
The assumed long-term commodity prices used for the optimisation work as applied to Mineral Resources are shown in Table 13.84.
Table 13.84: Mineral Resource commodity prices
| | Commodity | Unit | Price ($) |
| | Zinc | $/lb | 1.05 |
| | Copper | $/lb | 3.35 |
| | Gold | $/oz | 1,350 |
| | Silver | $/oz | 23 |
The NSR calculation and pit optimisation process considers many of the parameters used in Mineral Reserve estimation, as these parameters are well established within the working mine. These parameters include commodity price, 2014 budget costs for production and processing, process recoveries, concentrate grade, selling costs, and other ore-based costs. The optimisation process also uses the current geotechnical model for the pit design.
No pit design has been completed. Blocks within the pit shell are reported as Mineral Resources above NSR cut-offs of $44.45/t for oxide material, and $43.45/t for supergene and primary material.
| PJ/ABE/ADD/CCS/AAN/NMW/CAE | Bisha_2016R&R-Update_TechRep_2CN010-024_20170808_aan_cae | August 2017 |
| SRK Consulting |
| NI 43-101 Technical Report Bisha Mine 2016, Eritrea | Page 182 |
Mineralisation below the pit shell has not been analysed for possible underground mining at this time. The constraining pit shell and mineralisation are shown in Figure 13.4.
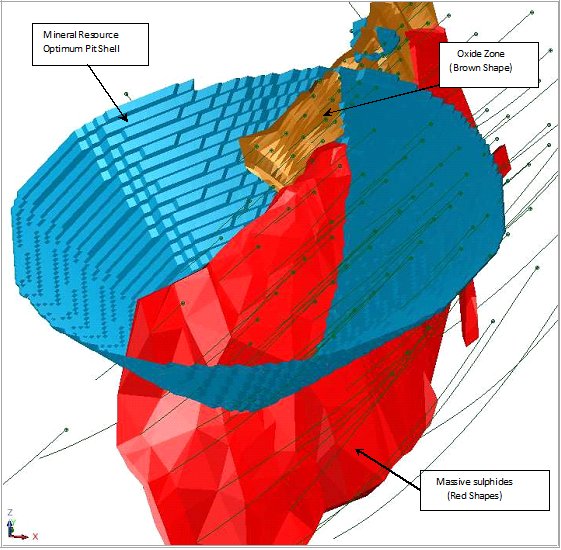
Source: AGP, 2014
Note : Looking North
Figure 13.14: Perspective view of Hambok mineralisation with constraining pit shell
| 13.5.17 | Mineral Resource Estimate |
Mineral Resources are classified and reported in accordance with the CIM Definition Standards for Mineral Resources and Mineral Reserves (May, 2014).
The Mineral Resource estimates described here have an effective date of 31 December 2016, and are summarised in Table 13.85.
| PJ/ABE/ADD/CCS/AAN/NMW/CAE | Bisha_2016R&R-Update_TechRep_2CN010-024_20170808_aan_cae | August 2017 |
| SRK Consulting |
| NI 43-101 Technical Report Bisha Mine 2016, Eritrea | Page 183 |
Table 13.85: Mineral Resource statement for Hambok deposit, Eritrea, as of 31 December 2016
| | Category | Quantity | Grade |
| | (000’s t) | (% Zn) | (% Cu) | (g/t Au) | (g/t Ag) |
| | Indicated | | | | | |
| | Primary | 6,860 | 1.86 | 1.14 | 0.2 | 10 |
| | Inferred | | | | | |
| | Oxide | 20 | | | 1.5 | 17 |
| | Notes to be read in conjunction with Mineral Resource tables for Hambok: |
| | (1) | No change has occurred to Hambok since 2014 which used commodity prices for copper, zinc, gold and silver of $3.35/lb, $1.05/lb, $1,350/oz and $23/oz, respectively. Mineral Resources are defined within an optimal Lerchs-Grossman (LG) Pit Shell. The mining cost and total ore based cost (process, G&A and stockpile rehandle) applied was approximately 10% below the long term view on costs with appropriate ore haulage costs for each satellite deposit. Overall pit slopes was 40 overall for Hambok (preliminary assessment). NSR cut-off used were: $44.45/t for Oxide Phase and $43.45/t for Primary Phase. |
| | (2) | Net Smelter Return values were calculated for each block using all resource categories, commodity prices, recoveries, appropriate smelter terms and downstream costs. Metallurgical recoveries, supported by metallurgical testwork, were applied as follows: |
| | a. | Oxide Phase; recoveries of 88% and 22% were applied to gold and silver respectively. |
| | b. | Primary Phase; recoveries to copper concentrate of 88%, 87%, 36% and 29% were applied for copper, zinc, gold and silver respectively. Preliminary metallurgical characterisation studies, but not full testing, have been completed for Hambok. |
| | (3) | Mineral Resources are reported within the pit shell generated using the specified commodity prices, using NSR block grade cut-off derived as above. Tonnage is rounded to the nearest 10,000 tonnes and grades are rounded to two decimal places for copper and zinc, one decimal place for gold and zero decimal places for silver. Contained metal for copper and zinc are rounded to the nearest ten thousand pounds. |
| | (4) | Rounding as required by reporting guidelines may result in apparent summation differences between tonnes, grade and contained metal content. |
| | (5) | Tonnage and grade measurements are in metrics units. Contained gold and silver ounces are reported as troy ounces, contained copper and zinc pounds as imperial pounds. |
| PJ/ABE/ADD/CCS/AAN/NMW/CAE | Bisha_2016R&R-Update_TechRep_2CN010-024_20170808_aan_cae | August 2017 |
| SRK Consulting |
| NI 43-101 Technical Report Bisha Mine 2016, Eritrea | Page 184 |
| 14 | Mineral Reserve Estimates |
The Mineral Reserve statement is a collaborative effort between SRK, BMSC and Nevsun. The resource model, topography, metallurgical information, geotechnical data, selling costs and commodity prices were provided by BMSC and Nevsun. SRK reviewed the resource model, metallurgical parameters and geotechnical recommendations and is satisfied that it is sufficient to support the Mineral Reserve estimate.
The Mineral Reserve estimate is based on information collected by the mineral reserves QP, Dr. Anoush Ebrahimi, P.Eng, during a site visit conducted between 24 February 2017 and 4 March 2017 and additional information provided by Nevsun and BMSC throughout the course of this study. Other information was obtained from the public domain. SRK has no reason to doubt the reliability of the information provided by BMSC and Nevsun.
This report is based on the following sources of information:
| | - Discussions with Bisha Mine personnel
- Inspection of the Bisha project area including Harena
- Review of the resource model, metallurgical and geotechnical report provided by BMSC
- Additional information from public domain sources.
|
| 14.2 | Mine Design Input Parameters |
The Mineral Reserves are an estimate of the quantities mined and processed from the design pit. This section describes the input parameters used for pit optimisation and mine design. The main inputs to mine design are commodity prices, resource model, geotechnical information, operating costs, mineral processing recoveries, and off site costs and charges. The parameters have been derived or reviewed by QPs in each technical area.
The results of mine design are presented at the end of this section. It includes the Mineral Reserve estimate.
| 14.2.1 | Commodity Price Inputs |
Commodity prices for the Mineral Reserve estimate are presented in Table 14.1. The three-year trailing average prices are included in the table for comparative purposes.
Zinc has the greatest contribution to revenue for the Bisha project and therefore has the greatest impact on the pit design. On average, revenue from the Bisha Main ultimate pit consists of 65% zinc, 30% copper and 2% gold and 3% silver.
| PJ/ABE/ADD/CCS/AAN/NMW/CAE | Bisha_2016R&R-Update_TechRep_2CN010-024_20170808_aan_cae | August 2017 |
| SRK Consulting |
| NI 43-101 Technical Report Bisha Mine 2016, Eritrea | Page 185 |
Table 14.1: Commodity prices used for Mineral Reserve estimate
| | Commodity | Unit | Reserve
Price | 3-Yr Trailing Average
Price |
| | Zinc | $/lb | 1.00 | 0.94 |
| | Copper | $/lb | 2.70 | 2.62 |
| | Gold | $/oz | 1,200 | 1,221 |
| | Silver | $/oz | 18.00 | 17.21 |
SRK was provided with resource block models in SURPAC format in February 2017 for the Bisha Main and Harena deposits. The models were developed by the Bisha Mine site and verified by SRK. The model included information on grades, density, and geologic classification. The following validation tasks were completed:
| | - Check of estimated block model grades against composited assay data
- Comparison of local “well-informed” block grades with composites contained within those blocks
- Comparison of average assay grades with average block estimates along different directions (i.e., swath plots).
|
SRK concluded that the resource estimation methodology used by Bisha was reasonable and based on industry-accepted methods. Globally, assay data compared well with the current resource model and no issues with the grade estimations were detected.
SRK noted that the bulk density estimate for the massive sulphide has been updated for the 2016 resource estimate. Instead of an average of 4.5 t/m3 used in 2015, the new model incorporates a sliding scale density proportional with depth ranging from 4.0 t/m3 near surface to 4.5 t/m3 for blocks at depth. In SRK’s opinion, additional density data should be collected from the core and from the massive sulphides in the pit. Density measurements should be recorded and the samples assayed for copper, lead, zinc and iron so that a relationship between density and total metal content can be established. This will potentially reduce the effort required to determine the in-situ density.
The Harena deposit is located about 9 km southeast of the Bisha Main pit. The Harena block model is rotated 45° to the east whereas the Bisha block model is aligned to the north. Figure 14.1 shows a general view of the Bisha Main block model overlaid on the topography on the left and its relationship with Harena on the right. This is discussed in more detail in the Mineral Resource sections of this report.
| PJ/ABE/ADD/CCS/AAN/NMW/CAE | Bisha_2016R&R-Update_TechRep_2CN010-024_20170808_aan_cae | August 2017 |
| SRK Consulting |
| NI 43-101 Technical Report Bisha Mine 2016, Eritrea | Page 186 |

Source: SRK, 2017
Figure 14.1: Bisha Main and Harena resource models
| 14.2.3 | Topography and General Site Layout |
Bisha Main and Harena deposits are located in relatively flat topography with small hills scattered around the pits. Both deposits were subject to some historic mining resulting in some changes to the original topography. The Bisha Main deposit is an active open pit operation whereas mining activity in Harena ceased in June 2013 after a short period of mining oxide ore.
As of the end of December 2016, the Bisha Main deposit was mined to 465 m amsl (560 m amsl for Harena).
The exit point of the Bisha Main ramp is at an elevation of ~560 m amsl and ~600 m amsl for Harena.
Figure 14.2 shows a general view of Bisha Main pit and surface infrastructure.
| PJ/ABE/ADD/CCS/AAN/NMW/CAE | Bisha_2016R&R-Update_TechRep_2CN010-024_20170808_aan_cae | August 2017 |
| SRK Consulting |
| NI 43-101 Technical Report Bisha Mine 2016, Eritrea | Page 187 |
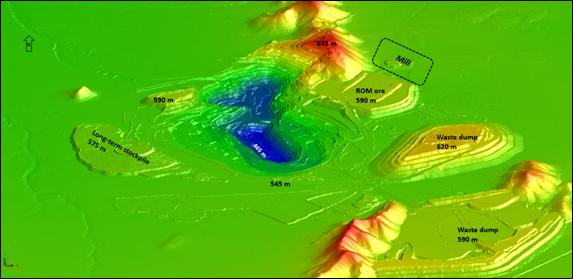
Source: SRK, 2017
Figure 14.2: General view of Bisha Main open pit
| 14.2.4 | Processing Recovery |
In the summer of 2016, Bisha commissioned a new zinc plant designed to process primary ore. It is understood that the Bisha primary ore is complex and sensitive to operating conditions. The plant currently produces, copper, zinc and bulk (mixed) concentrates. SRK understands that Bisha is currently optimising the mill performance.
SRK has reviewed the processing data, testwork results, and mill performance reports and has used the following recoveries for the pit optimisation:
| | - Bisha Main supergene zone: Bisha Main supergene ore produces only copper concentrate. Recoveries of 85% Cu, 54% Au and 74% Ag were applied. Zinc has not been assigned a recovery in supergene. An arsenic recovery of 60% was applied for smelter penalty inclusion in the NSR calculation and cash flow analysis. The majority of the supergene zone has been depleted, and therefore only a small amount is included in the Mineral Reserve estimate.
- Bisha Main primary zone: Two concentrates are produced from primary ore: copper and zinc. For copper concentrate recoveries of 70% Cu, 15% Au and 27% Ag were applied. For zinc concentrate,e a 77% Zn recovery was applied.
– Copper concentrate grade is 20%. – Zinc concentrate grade is 50%. - Harena primary zone: recoveries to copper concentrate of 85% Cu, 36% Au and 29% Ag were applied. For zinc concentrate, a, 85% Zn recovery was applied.
– Copper concentrate grade is 26%. – Zinc concentrate grade is 52%. |
| PJ/ABE/ADD/CCS/AAN/NMW/CAE | Bisha_2016R&R-Update_TechRep_2CN010-024_20170808_aan_cae | August 2017 |
| SRK Consulting |
| NI 43-101 Technical Report Bisha Mine 2016, Eritrea | Page 188 |
Pit slope design criteria was provided by BGC Engineering Inc. (BGC, 2016). The inter-ramp slope angles vary from 39° to 46°. BGC recommends a 16 m wide geotechnical berm where the slope height exceeds 140 m.
Figure 14.3 shows the geotechnical sectors for the Bisha Main pit. For pit optimisation, considering the depth of pit and to allow enough room for haulage roads and berms, the overall pit slope was four degrees shallower than the inter-ramp angle.

Source: BGC, 2016
Figure 14.3: Geotechnical domains for Bisha Main pit
Based on the shape of the primary ore and due to relatively irregular grade distribution a variable dilution is expected throughout the Bisha Main deposit. The Primary ore is relatively narrow in the upper levels but widens with depth. In general, dilution will therefore reduce as the depth of the pit increases. For the Bisha Main reserve calculation, a methodology developed to estimate the dilution is explained in Table 14.2.
Dilution is a function of the number of neighboring blocks that have a grade higher than the cut-off grade and is applied as a skin of 0.5 m thickness. The cut-off is a calculated $37.22/t net smelter return (NSR) for primary ore. Single, isolated blocks have the maximum possible dilution. For a 5 m block, this is measured to be 44% and for a 10 m block this is 21%. A mining block surrounded on all sides by other ore blocks (i.e. above cut-off) has no dilution. Dilution is calculated only for measured and indicated blocks.
| PJ/ABE/ADD/CCS/AAN/NMW/CAE | Bisha_2016R&R-Update_TechRep_2CN010-024_20170808_aan_cae | August 2017 |
| SRK Consulting |
| NI 43-101 Technical Report Bisha Mine 2016, Eritrea | Page 189 |
The average in-pit dilution for Bisha Main is calculated at 3.4%. For Harena this is assumed to be 5.0%.
Table 14.2: Methodology for estimating dilution
| | Step | Description |
| | 1 | Calculate NSR values. |
| | 2 | Create grade shell to capture all blocks above the cut-off grade. |
| | 3 | For each block, determine the numbering of neighbouring blocks below the cut-off grade. |
| | 4 | Assign dilution to each 5.0 m block.
- Side blocks = 10% (i.e. equivalent to a 0.5 m skin)
- Corner blocks = 1% |
| | 5 | Create a shell to capture the dilution blocks. This will encapsulate the shell created in Step 2.
Determine the average grade of the dilution. |
| | 6 | Update the model with the average diluted grades. |
A new NSR value is then calculated using diluted grades. This diluted model was used for pit optimisation. For reporting tonnages, the cut-off values are applied to the diluted NSR model. Figure 14.4 shows a typical isometric view of the orebody at the 450 m bench. As expected, blocks at the edge of orebody incur more dilution compared with blocks that are entirely inside the orebody.
| PJ/ABE/ADD/CCS/AAN/NMW/CAE | Bisha_2016R&R-Update_TechRep_2CN010-024_20170808_aan_cae | August 2017 |
| SRK Consulting |
| NI 43-101 Technical Report Bisha Mine 2016, Eritrea | Page 190 |
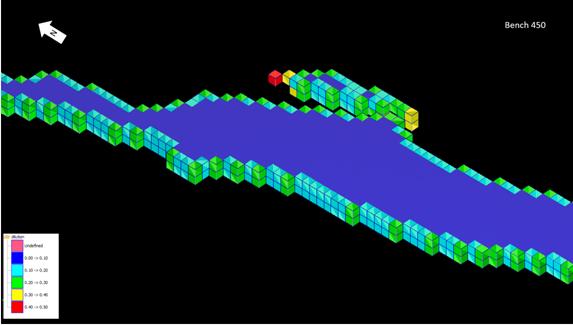
Source: SRK, 2017
Figure 14.4: Dilution figures for bench 450 m amsl
Variations in orebody geometry and grade distribution result in a different dilution estimate for each pit bench. Figure 14.5 demonstrates the variations in dilution for the Bisha Main pit. The higher dilution occurs at the higher elevations where the ore geometry is narrower and more complex. Most of the benches at the bottom of the pit are mined entirely inside the orebody, so the dilution reduces as the pit depth increases. The weighted average in-pit dilution is calculated to be 3.4%.
| PJ/ABE/ADD/CCS/AAN/NMW/CAE | Bisha_2016R&R-Update_TechRep_2CN010-024_20170808_aan_cae | August 2017 |
| SRK Consulting |
| NI 43-101 Technical Report Bisha Mine 2016, Eritrea | Page 191 |

Source: SRK, 2017
Figure 14.5: Dilution by benches at Bisha Main pit
It is important to note that dilution parameters can change if the design parameters change. This includes any change in the price of metals, selling costs or recovery. Therefore, if a new set of input parameters are introduced for mine design it is highly recommended to recalculate the dilution.
Some of the ore planned for mining and processing will be lost due to several factors, such as loading, and mixing with waste after blasting. A mining recovery of 98% has been applied to account for this type of ore loss, based on experience and engineering judgment.
| 14.2.8 | Mining and Processing Operating Cost Inputs |
The mining costs applied for pit optimisation and mine planning were based on 2017 budget costs developed by Bisha. The reference mining cost (inclusive of loading, hauling and support including maintenance) is estimated to be $2.27/t plus an appropriate incremental haulage cost per bench. The average mining cost for the life of mine is calculated to be $2.43/t.
The total ore-based costs for Bisha Main (ore control, geology, lab services, processing including fixed-plant maintenance, G&A and stockpile re-handle) are $37.22/t-milled for primary ore. This includes general and administration costs estimated to be $25M per year for the life of mine.
More detailed description of operating cost estimates is provided in Section 20.3 of this Technical Report.
For Harena, the ore-based costs include an additional $2.56/t for 10 km overland ore haulage from the pit rim to the crusher.
| PJ/ABE/ADD/CCS/AAN/NMW/CAE | Bisha_2016R&R-Update_TechRep_2CN010-024_20170808_aan_cae | August 2017 |
| SRK Consulting |
| NI 43-101 Technical Report Bisha Mine 2016, Eritrea | Page 192 |
| 14.2.9 | Cut-off Grade Calculation |
Cut-off grade is a grade where two different actions can be taken if the reserve grade is below or above that grade. Processing cut-off grade is the minimum grade that pays for all the processing costs and related general and administration costs. The total operating cost of processing primary ore is calculated at $37.22/t-milled.
It is estimated that the sustaining capital for the operation is $9.40/t of milled ore for the life of mine. This amount varies by year. Sustaining capital is to maintain the mill, mining equipment, and other incurred capital expenses. This is not included in cut-off grade calculation; however, it has been included in the financial analysis.
The off-site costs include the costs incurred beyond the mine gate. These are items such as the concentrate’s land and sea transportation costs, marketing costs, insurance, treatment and smelter costs, and all the payables. The overall zinc off-site cost is estimated to be $0.404/lb. For copper, the offsite costs are $0.835/lb.
| 14.3 | Pit Optimisation Results |
The open pit was optimised using Geovia’s Whittle™ software utilising Lerchs-Grossmann (LG) optimisation algorithms, using the resource block model issued by Bisha in February 2017, along with technical and economic data recommended by the QPs.
A total of 46 optimisation scenarios were evaluated for commodity prices ranging from $0.30/lb Zn up to $1.20/lb Zn with $0.02/lb Zn increments ($0.81/lb Cu up to $3.24/lb of Cu with $0.05/lb Cu increments). Table 14.3 presents the results of pit optimisation up to the base case price that is $1.00/lb Zn. As expected, it demonstrates that the quantities of mineable ore are directly proportional to the commodity price. Each row shows an optimum pit result at the given price. At very low commodity prices ($0.30/lb Zn and $0.81/lb Cu) there is only 579 kt of mineable ore. At the base case prices ($1.00/lb Zn and $2.70/lb Cu), there is about 13.673 Mt of mineable ore at a strip ratio of 9.52 waste to ore. The reserves case is discussed further in Section 14.4.2.
Note that the mineable ore reported in Table 14.3 is based on pairs of Zn and Cu prices. The mineable ore will increase not only as the pit size increases with increasing price, but also with the conversion of above cut-off grade material within each pit shell. Figure 14.6 shows the quantities of ore for the optimum pit shells listed in Table 14.3. The blue line shows the mineable ore for a range of prices from $0.30/lb Zn to $1.00/lb Zn. The red line shows the quantities of ore when only the base case prices are applied as cut-off grade for all the pits. As can be seen, if the base case prices are applied to the pit shells less than Pit 36 (base case pit) the tonnages of ore will be more than what is reported in Table 14.3.
| PJ/ABE/ADD/CCS/AAN/NMW/CAE | Bisha_2016R&R-Update_TechRep_2CN010-024_20170808_aan_cae | August 2017 |
| SRK Consulting |
| NI 43-101 Technical Report Bisha Mine 2016, Eritrea | Page 193 |

Source: SRK, 2017
Figure 14.6: Quantities of mineable ore by pit shell for Bisha Main deposit by cut-off grade
| PJ/ABE/ADD/CCS/AAN/NMW/CAE | Bisha_2016R&R-Update_TechRep_2CN010-024_20170808_aan_cae | August 2017 |
| SRK Consulting |
| NI 43-101 Technical Report Bisha Mine 2016, Eritrea | Page 194 |
Table 14.3: Results of pit optimisation
| | Pit Optimisation summary for Bisha Main deposit: 3 March 2017 |
| | Pit# | Metal Prices | Total Mined
(tonnes) | Ore
(tonnes) | Waste
(tonnes) | SR
(W:O) | Metals Mined |
| | Zn ($/lb) | Cu ($/lb) | (g/t Au) | (g/t Ag) | (% Cu) | (% Zn) |
| | 1 | 0.30 | 0.81 | 2,852,016 | 579,467 | 2,272,549 | 3.92 | 0.72 | 74.85 | 1.32 | 14.69 |
| | 2 | 0.32 | 0.86 | 3,776,900 | 709,465 | 3,067,435 | 4.32 | 0.73 | 74.79 | 1.30 | 14.44 |
| | 3 | 0.34 | 0.92 | 4,881,607 | 885,599 | 3,996,008 | 4.51 | 0.74 | 73.69 | 1.29 | 13.86 |
| | 4 | 0.36 | 0.97 | 6,375,358 | 1,119,146 | 5,256,212 | 4.70 | 0.75 | 72.45 | 1.29 | 13.21 |
| | 5 | 0.38 | 1.03 | 7,307,180 | 1,298,875 | 6,008,305 | 4.63 | 0.76 | 71.03 | 1.28 | 12.65 |
| | 6 | 0.40 | 1.08 | 8,359,998 | 1,533,833 | 6,826,165 | 4.45 | 0.77 | 69.70 | 1.30 | 11.89 |
| | 7 | 0.42 | 1.13 | 9,991,209 | 1,794,055 | 8,197,154 | 4.57 | 0.78 | 68.79 | 1.30 | 11.37 |
| | 8 | 0.44 | 1.19 | 11,763,447 | 2,056,012 | 9,707,435 | 4.72 | 0.77 | 67.32 | 1.29 | 10.99 |
| | 9 | 0.46 | 1.24 | 13,949,165 | 2,332,741 | 11,616,424 | 4.98 | 0.78 | 67.07 | 1.29 | 10.65 |
| | 10 | 0.48 | 1.30 | 19,835,244 | 2,992,620 | 16,842,624 | 5.63 | 0.80 | 65.79 | 1.28 | 10.13 |
| | 11 | 0.50 | 1.35 | 23,902,642 | 3,459,275 | 20,443,367 | 5.91 | 0.81 | 64.70 | 1.26 | 9.85 |
| | 12 | 0.52 | 1.40 | 30,156,708 | 4,099,727 | 26,056,981 | 6.36 | 0.80 | 63.48 | 1.25 | 9.58 |
| | 13 | 0.54 | 1.46 | 33,722,773 | 4,528,568 | 29,194,205 | 6.45 | 0.80 | 62.25 | 1.24 | 9.35 |
| | 14 | 0.56 | 1.51 | 37,519,340 | 4,975,815 | 32,543,525 | 6.54 | 0.79 | 61.27 | 1.23 | 9.11 |
| | 15 | 0.58 | 1.57 | 41,580,899 | 5,431,323 | 36,149,576 | 6.66 | 0.79 | 60.48 | 1.22 | 8.91 |
| | 16 | 0.60 | 1.62 | 48,613,419 | 6,109,022 | 42,504,397 | 6.96 | 0.79 | 59.60 | 1.21 | 8.69 |
| | 17 | 0.62 | 1.67 | 53,496,009 | 6,589,155 | 46,906,854 | 7.12 | 0.78 | 58.95 | 1.20 | 8.55 |
| | 18 | 0.64 | 1.73 | 61,188,651 | 7,245,139 | 53,943,512 | 7.45 | 0.78 | 58.38 | 1.19 | 8.40 |
| | 19 | 0.66 | 1.78 | 68,868,217 | 7,809,617 | 61,058,600 | 7.82 | 0.77 | 58.20 | 1.18 | 8.34 |
| | 20 | 0.68 | 1.84 | 75,228,430 | 8,279,753 | 66,948,677 | 8.09 | 0.77 | 57.81 | 1.17 | 8.28 |
| | 21 | 0.70 | 1.89 | 80,548,982 | 8,682,215 | 71,866,767 | 8.28 | 0.77 | 57.42 | 1.16 | 8.21 |
| | 22 | 0.72 | 1.94 | 83,697,283 | 8,999,229 | 74,698,054 | 8.30 | 0.76 | 56.99 | 1.15 | 8.12 |
| | 23 | 0.74 | 2.00 | 85,149,020 | 9,218,567 | 75,930,453 | 8.24 | 0.76 | 56.48 | 1.15 | 8.02 |
| | 24 | 0.76 | 2.05 | 95,093,835 | 9,824,883 | 85,268,952 | 8.68 | 0.75 | 56.06 | 1.14 | 7.97 |
| | 25 | 0.78 | 2.11 | 103,367,215 | 10,301,724 | 93,065,491 | 9.03 | 0.75 | 55.74 | 1.13 | 7.94 |
| | 26 | 0.80 | 2.16 | 108,783,098 | 10,685,205 | 98,097,893 | 9.18 | 0.75 | 55.30 | 1.12 | 7.87 |
| | 27 | 0.82 | 2.21 | 109,737,044 | 10,880,732 | 98,856,312 | 9.09 | 0.75 | 54.91 | 1.12 | 7.78 |
| | 28 | 0.84 | 2.27 | 115,953,398 | 11,268,129 | 104,685,269 | 9.29 | 0.74 | 54.57 | 1.11 | 7.73 |
| | 29 | 0.86 | 2.32 | 119,883,351 | 11,590,501 | 108,292,850 | 9.34 | 0.74 | 54.19 | 1.11 | 7.65 |
| | 30 | 0.88 | 2.38 | 128,519,847 | 12,126,730 | 116,393,117 | 9.60 | 0.74 | 53.70 | 1.10 | 7.57 |
| | 31 | 0.90 | 2.43 | 134,149,098 | 12,539,223 | 121,609,875 | 9.70 | 0.73 | 53.31 | 1.10 | 7.48 |
| | 32 | 0.92 | 2.48 | 135,526,580 | 12,743,524 | 122,783,056 | 9.63 | 0.73 | 52.97 | 1.09 | 7.42 |
| | 33 | 0.94 | 2.54 | 136,706,112 | 12,949,160 | 123,756,952 | 9.56 | 0.73 | 52.61 | 1.09 | 7.34 |
| | 34 | 0.96 | 2.59 | 138,686,933 | 13,178,879 | 125,508,054 | 9.52 | 0.73 | 52.28 | 1.08 | 7.28 |
| | 35 | 0.98 | 2.65 | 143,014,207 | 13,498,358 | 129,515,849 | 9.59 | 0.73 | 51.93 | 1.08 | 7.21 |
| | 36 | 1.00 | 2.70 | 143,852,243 | 13,672,991 | 130,179,252 | 9.52 | 0.72 | 51.62 | 1.08 | 7.15 |
| PJ/ABE/ADD/CCS/AAN/NMW/CAE | Bisha_2016R&R-Update_TechRep_2CN010-024_20170808_aan_cae | August 2017 |
| SRK Consulting |
| NI 43-101 Technical Report Bisha Mine 2016, Eritrea | Page 195 |
Similar methodology and steps were undertaken for pit optimisation of the Harena deposit. The bulk of the Harena deposit is relatively deep and not suitable for open pit mining operation. However, a small portion of the deposit is close to the surface and can be mined using surface mining methods. Pit optimisation was carried out for a range of prices from $0.50/lb Zn to $1.20/lb Zn with increments of $0.02/lb Zn ($0.81/lb Cu up to $3.24/lb of Cu with $0.05/lb Cu increments). Figure 14.7 shows the results of pit optimisation. The base case price for Harena occurs at pit shell #26. Mineable ore at the base case price is about 2.4 Mt at a strip ratio of 6.4 waste to ore. The average grade of zinc and copper after 5% dilution is 3.25% and 0.72% respectively, indicating that the average grade of ore at Harena is substantially lower than at Bisha Main.

Source: SRK, 2017
Figure 14.7: Quantities of mineable ore at Harena deposit by cut-off grade
| PJ/ABE/ADD/CCS/AAN/NMW/CAE | Bisha_2016R&R-Update_TechRep_2CN010-024_20170808_aan_cae | August 2017 |
| SRK Consulting |
| NI 43-101 Technical Report Bisha Mine 2016, Eritrea | Page 196 |
| 14.4 | Mineral Reserves Estimate |
| 14.4.1 | Strategic Mine Planning |
For Bisha Main, a series of strategic mine planning scenarios were evaluated in several stages to assess the viability and sensitivity to the size of ultimate pit.
| 14.4.2 | Ultimate Pit Selection |
SRK evaluated a range of production scenarios for each of the optimum pit shells listed in Table 14.3. The resulting preliminary production schedules were then compared in a technical economic model to assess the sensitivity of the pit shells to a range of production conditions.
The strip ratio typically increases with the size of the pit; therefore, the unit mining cost per tonne of ore milled in larger pits will be greater than for the smaller pits. In addition, the value of the ore in deeper parts of the pits will be realised later in the mine life, thus reducing the value of larger pits when a discount rate is applied. An economic analysis can readily demonstrate the impact of operating costs and discount rate on overall value of optimum pits.
Figure 14.8 shows the discounted (at 8%) values of each pit shell for different operational scenarios (best, worst and average) using the base case commodity prices. Figure 14.8 demonstrates that Pit #1 to Pit #20 show a steady growth in discounted values, beyond which, there is minimal increase in value.
The red circles show the maximum values achieved for each of best, worst and average scenarios. The worst-case scenario reaches a maximum of $439M at Pit #27 and gradually decreases for larger pits. For the best-case scenario, the pit values reach to a maximum value of $491M at Pit #36 and then reduce slightly for larger pits. The average pit values reach a maximum value of $462M at Pit #31 and then reduce thereafter.
For this study, Pit #17 (revenue factor 0.62) has been selected for the ultimate pit design. The basis for selection was driven by available capital allocation, availability of the existing mining fleet, interpretation of execution risk.
This is the optimum pit for a commodity price of $0.62/lb Zn. The approximate discounted pit value for this pit can vary between $398M to $405M. This is shown with a dashed line. Note that no sustaining capital has been considered in this analysis. The values are before tax and deduction of royalties and closure costs.
| PJ/ABE/ADD/CCS/AAN/NMW/CAE | Bisha_2016R&R-Update_TechRep_2CN010-024_20170808_aan_cae | August 2017 |
| SRK Consulting |
| NI 43-101 Technical Report Bisha Mine 2016, Eritrea | Page 198 |
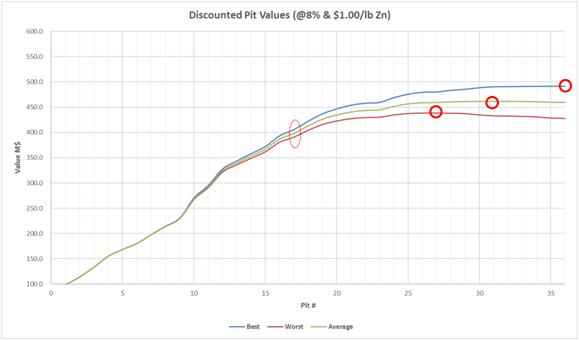
Source: SRK, 2017
Figure 14.8: Pit value analysis for Bisha Main optimum pit shells
Pit #17 for Bisha Main pit, provides about four years of mine life with a relatively low strip ratio. This pit is similar to the second pushback of the current design.
Detailed designs were completed for Pit #17 using BGC’s geotechnical criteria (BGC, 2016).
| 14.4.3 | Factors Impacting Mineral Reserve Estimates |
Factors that affect the Mineral Reserve estimates include, but are not limited to: dilution; commodity prices; off-site costs; metallurgical recoveries, pit slope designs; capital and operating cost estimates; and the effectiveness of managing environmental impacts. In SRK’s opinion, these potential modifying factors have been adequately accounted for using the assumptions in this report. The main factors that influence the reserve estimate are:
| | - Commodity prices, particularly zinc price.
- Processing recoveries.
- Ability to execute the mine plan (i.e. material movement) based on the reserve estimate, this includes operational efficiency.
|
| PJ/ABE/ADD/CCS/AAN/NMW/CAE | Bisha_2016R&R-Update_TechRep_2CN010-024_20170808_aan_cae | August 2017 |
| SRK Consulting |
| NI 43-101 Technical Report Bisha Mine 2016, Eritrea | Page 198 |
| 14.4.4 | Mineral Reserves Summary |
Combined and reported individually by deposits, the Mineral Reserves are shown in Table 14.4, Table 14.5 and Table 14.6.
Table 14.4: Mineral Reserve statement for Bisha Main and Harena deposits, Eritrea, as of 31 December 2016
| | Category | Quantity
(000’s t) | Grade | Contained Metal |
| �� | (% Zn) | (% Cu) | (g/t Au) | (g/t Ag) | Zn
('000 lbs) | Cu
('000 lbs) | Au
('000 Ozs) | Ag
('000 Ozs) |
| | Proven | | | | | | | | | |
| | Supergene | 12 | | 2.57 | 0.71 | 17 | | 675 | | 7 |
| | Primary | 1,047 | 7.43 | 1.05 | 0.76 | 46 | 171,583 | 24,248 | 26 | 1,535 |
| | Total Proven | 1,059 | | | | | 171,583 | 24,923 | 26 | 1,541 |
| | Probable | | | | | | | | | |
| | Supergene | | | | | | | | | |
| | Primary | 8,532 | 6.00 | 1.05 | 0.68 | 45 | 1,128,788 | 196,688 | 186 | 12,293 |
| | Total Probable | 8,532 | | | | | 1,128,788 | 196,688 | 186 | 12,293 |
| | Total Reserve (P&P) |
| | Supergene | 12 | | 2.57 | 0.71 | 17 | | 675 | | 7 |
| | Primary | 9,579 | 6.16 | 1.05 | 0.69 | 45 | 1,300,371 | 220,936 | 212 | 13,827 |
| | Total | 9,591 | | | | | 1,300,371 | 221,611 | 212 | 13,834 |
Table 14.5: Mineral Reserve statement for Bisha Main deposit, Eritrea, as of 31 December 2016
| | Category | Quantity
(000's t) | Grade | Contained Metal |
| | (% Zn) | (% Cu) | (g/t Au) | (g/t Ag) | Zn
('000 lbs) | Cu
('000 lbs) | Au
('000 Ozs) | Ag
('000 Ozs) |
| | Proven |
| | Supergene | 12 | | 2.57 | 0.71 | 17 | | 675 | | 7 |
| | Primary | 1,047 | 7.43 | 1.05 | 0.76 | 46 | 171,583 | 24,248 | 26 | 1,535 |
| | Total Proven | 1,059 | | | | | 171,583 | 24,923 | 26 | 1,541 |
| | Probable |
| | Supergene | | | | | | | | | |
| | Primary | 6,304 | 6.91 | 1.15 | 0.74 | 50 | 1,058,963 | 195,149 | 150 | 10,539 |
| | Total Probable | 6,304 | | | | | 1,058,963 | 197,204 | 150 | 10,539 |
| | Total Reserve (P&P) |
| | Supergene | 12 | | 2.57 | 0.71 | 17 | | 2,730 | | 7 |
| | Primary | 7,351 | 6.98 | 1.14 | 0.74 | 50 | 1,230,546 | 219,397 | 176 | 12,074 |
| | Total | 7,363 | | | | | 1,230,546 | 222,127 | 176 | 12,081 |
| PJ/ABE/ADD/CCS/AAN/NMW/CAE | Bisha_2016R&R-Update_TechRep_2CN010-024_20170808_aan_cae | August 2017 |
| SRK Consulting |
| NI 43-101 Technical Report Bisha Mine 2016, Eritrea | Page 199 |
Table 14.6: Mineral Reserve statement for Harena deposit, Eritrea, as of 31 December 2016
| | Category | Quantity
(000’s t) | Grade | Contained Metal |
| | (% Zn) | (% Cu) | (g/t Au) | (g/t Ag) | Zn
('000 lbs) | Cu
('000 lbs) | Au
('000 Ozs) | Ag
('000 Ozs) |
| | Probable |
| | Primary | 2,228 | 3.43 | 0.75 | 0.50 | 24 | 168,450 | 36,863 | 36 | 1,754 |
| | Subtotal | 2,228 | 3.43 | 0.75 | 0.50 | 24 | 168,450 | 36,863 | 36 | 1,754 |
| | Notes to be read in conjunction with all Reserve tables above: |
| | (1) | NSR cut-off ($US/t): Supergene ore $39.12 and Primary ore, $37.22 at Bisha Main, and $39.78 at Harena. Mineral Reserves are defined within a mine plan, with phase designs guided by Lerch-Grossman (LG) Pit Shells, generated using commodity prices for copper, zinc, gold and silver of $2.70/lb, $1.00/lb, $1,200/oz, $18.00/oz respectively. The reference mining cost was $2.27/t, plus $0.015/t/5 m bench for ore and waste below reference elevations of 540 m amsl for Bisha Main. The total ore-based cost (process, G&A, stockpile and rehandle) is $39.12/t for supergene and $37.22/t primary ores. Harena ore-based costs include an additional $2.56/t overland ore haulage cost. Overall pit slopes varied from 38˚ to 44˚ for Bisha Main and from 29˚ to 36˚ for Harena. |
| | (2) | Economic values for multi-metal, multi zones were modelled using Net Smelter Return values. Each block NSR value was calculated using diluted grades, commodity prices, recoveries and appropriate smelter terms and downstream costs. Metallurgical recoveries, supported by metallurgical testwork, were applied as follows: |
| | a. | Bisha Supergene zone: Recoveries of 85%, 54% and 74% were applied for copper, gold and silver respectively. Zinc has not been assigned a recovery. An arsenic recovery of 60% was applied for smelter penalty inclusion in the NSR calculation and cash flow analysis. |
| | b. | Bisha Main Primary zone: Two concentrates are produced from primary ore, copper and zinc concentrates. For copper concentre recoveries of 70%, 15% and 27% were applied for copper, gold and silver respectively. For zinc concentrate a 77% recovery has been applied to zinc. |
| | c. | Copper concentrate grade is 20%. |
| | d. | Zinc concentrate grade is 50%. |
| | e. | Harena primary zone: recoveries to copper concentrate of 85%, 36% and 29% were applied for copper, gold and silver respectively. A zinc recovery to zinc concentrate of 85% was applied. |
| | (3) | Mineral Reserves are reported within Bisha Main and Harena ultimate pit designs, using NSR block grade, where the marginal cut- off is the total ore based cost stated above. Tonnages are rounded to the nearest 1,000 tonnes. Grades for contained metals are rounded to two decimal places. |
| | (4) | Rounding as required by reporting guidelines may result in apparent summation differences between tonnes, grade and contained metal content. |
| | (5) | Tonnage and grade measurements are in metrics units. Contained gold and silver ounces are reported as troy ounces, contained copper and zinc pounds as imperial pounds. |
| | (6) | The life of mine strip ratios (by weight) for Bisha Main and Harena are 7.1:1 and 7.2:1 respectively. |
| | (7) | 0.5 m "skin" of dilution is applied at ore/waste contacts. |
| | (8) | 2% mining losses adjustments are made. |
| | (9) | 31 December 2016 topography was used for this calculation. |
The Bisha Main Mineral Reserve estimate, contained herein and effective 31 December 2016, is based on information collected by SRK throughout the course of the project, which in turn reflects various technical and economic conditions at the time of reporting. These conditions can change significantly over relatively short periods of time. Consequently, actual results may be variable. This condition includes the amount of capital requirements that requires to satisfy the production rate required at mine.
This report includes technical information that requires calculations to derive sub-totals, totals and weighted averages. Such calculations inherently involve a degree of rounding and consequently introduce a margin of error. Where these occur, SRK does not consider them to be material.
| PJ/ABE/ADD/CCS/AAN/NMW/CAE | Bisha_2016R&R-Update_TechRep_2CN010-024_20170808_aan_cae | August 2017 |
| SRK Consulting |
| NI 43-101 Technical Report Bisha Mine 2016, Eritrea | Page 200 |
Neither SRK nor the mineral reserves QP is an insider, associate or an affiliate of Nevsun, and neither SRK nor the mineral reserves QP nor any affiliate has acted as advisor to Nevsun, its subsidiaries or its affiliates in connection with this project. The results of the technical work by SRK are not dependent on any prior agreements concerning the conclusions to be reached, nor are there any undisclosed understandings concerning any future business dealings.
| PJ/ABE/ADD/CCS/AAN/NMW/CAE | Bisha_2016R&R-Update_TechRep_2CN010-024_20170808_aan_cae | August 2017 |
| SRK Consulting |
| NI 43-101 Technical Report Bisha Mine 2016, Eritrea | Page 201 |
The Bisha Main and Harena deposits are mined as a conventional open pit operation. At Bisha Main, most of the in-pit haulage for waste will be carried out using 65-tonne haulage trucks and 10 m3 excavators, in 5 m benches. To control mining dilution and to increase selectivity smaller excavators will be utilised for ore mining. Harena pit will be mined using the same mining fleet and also in 5 m benches.
Waste rock will be moved and hauled to multiple rock storage facilities based on their geochemical characteristics and period of operation. Some of the mineralised waste will be stockpiled near the pit so that it can be recovered if commodity prices increase from current levels.
The mining operation will be conducted by the owner.
The open pit and waste storage facilities are designed using the criteria listed in Table 15.1. The pit slope angles were recommended by BGC Engineering, BC, Canada (BGC, 2016). Ore and waste are mined in 5 m benches at Bisha Main and Harena. To form the final wall, 10 m benches are formed by joining two 5 m working benches.
Current haulage roads are 20 m in width. SRK recommends that the road width be increased to a minimum of 25 m to reduce tire wear and provide safer operating conditions. Haulage roads in designs are 25 m wide, which is sufficient for two-way traffic of 65-tonne trucks, plus a ditch and a berm. The maximum road gradient is 10%.
Inter-ramp angles vary based on different geotechnical zone. For each 140 m of slope height, either a 16 m geotechnical berm or a haulage road will be added to the slope.
Table 15.1: Mine design criteria
| | Criteria | Value | Remarks |
| | Bench height (final wall) | 10 m | Ore and waste will be mined in 5.0 m working benches |
| | Bench face angle | 63°, 67°, 70° | Mainly 70° |
| | Catch bench width | 6 m to 8.3 m | Varies based on the geotechnical zone, on final walls |
| | Geotechnical berm | 16 m | At 140 m vertical intervals |
| | Inter-Ramp angle | 39° to 46° | Varies by zone |
| | Haulage road width | 32.5 m | Two way roads, includes berm and ditch |
| | Maximum road slope | 10% | |
| | Rock dump face angle | 34° | 25 m lifts and overall slope of 26° |
| PJ/ABE/ADD/CCS/AAN/NMW/CAE | Bisha_2016R&R-Update_TechRep_2CN010-024_20170808_aan_cae | August 2017 |
| SRK Consulting |
| NI 43-101 Technical Report Bisha Mine 2016, Eritrea | Page 202 |
Figure 15.1 shows a section of road profile for two-way traffic that will be used for 65-tonne off-highway trucks in the Bisha Main pit. SRK noticed that Bisha uses less than normal haulage width in some sections. It is recommended to widen the roads whenever it is possible up to 27.5 m.

Source: SRK, 2017
Figure 15.1: Haulage road profile for two-way traffic of common 65-tonne trucks
The Bisha Main ultimate pit is oriented in south-north direction. It broadly consists of two adjoining sections, a smaller pit in the north and the main pit to the south. Mining in the north pit is expected to be completed by mid-2017. BMSC plans to backfill the north pit with waste rock. Figure 15.2 shows a perspective view of the Bisha Main open pit. The pit is ~1,400 m long (south to north) and ~700 m wide (east to west). The lowest bench in this pit is at 325 m amsl. The main haulage road reaches to the surface at 460 m amsl. The highest wall of the main pit is on the north-east side and is 240 m high. This high wall is broken into five sections by four passes of haulage ramp.
The in-pit haul road is mainly an anticlockwise spiral ramp beginning at the bottom of the pit and reaching to the natural topography at 460 m bench. The road is designed at 25 m width and 10% gradient. The road for the deepest 12 benches (60 m) at the bottom of the pit is reduced to 15 m wide and is considered to be a single lane road for 65 tonne trucks. The last 40 m of the pit has very little waste to be moved and will therefore accommodate less traffic. The pit has a second access road on the west side of the pit for safety and also to help reduce waste mining cycle time.
At the bottom of the pit, a haulage road is built on top of the ore. It is possible to retrieve some of this ore in the last stage of the mine life.
| PJ/ABE/ADD/CCS/AAN/NMW/CAE | Bisha_2016R&R-Update_TechRep_2CN010-024_20170808_aan_cae | August 2017 |
| SRK Consulting |
| NI 43-101 Technical Report Bisha Mine 2016, Eritrea | Page 203 |
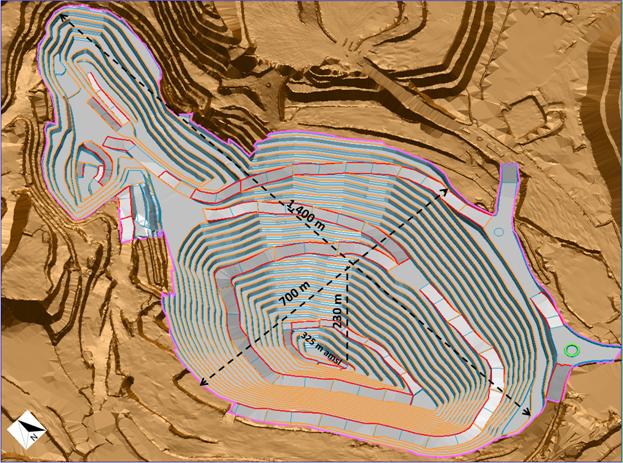
Source: SRK, 2017
Figure 15.2: A perspective view of Bisha Main ultimate pit
Harena pit is located to the southwest of the Bisha Main pit, about 10 km from the crusher. The pit is approximately 530 m by 450 m with the long axis of the pit oriented in a north-easterly direction. To minimise the strip ratio and to avoid mining the northeast high wall, the ramp is designed to be only on the northwest wall. The Harena pit extends to 475 m amsl, for a total depth of ~155 m.
The highest wall at Harena is about 155 m. Part of this wall was mined while mining the oxide ore in the past. Figure 15.3 shows Harena pit and its waste dump.
| PJ/ABE/ADD/CCS/AAN/NMW/CAE | Bisha_2016R&R-Update_TechRep_2CN010-024_20170808_aan_cae | August 2017 |
| SRK Consulting |
| NI 43-101 Technical Report Bisha Mine 2016, Eritrea | Page 204 |
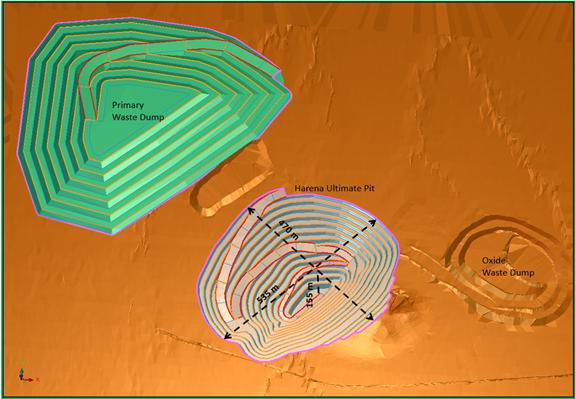
Source: SRK, 2017
Figure 15.3: Harena pit and the waste dump
To enhance the economics of the mine, the pit is designed to be mined in sequences. Figure 15.4 depicts an east-west section of the Bisha Main pit with two main stages of mining sequences shown in different colors.
Harena pit is a small pit and will also be mined in two phases. Phase 1 of Harena will be focused on pre-strip and preparation. Its development is scheduled to be synchronised with the Bisha Main pit when it approaches its final stages of life.
| PJ/ABE/ADD/CCS/AAN/NMW/CAE | Bisha_2016R&R-Update_TechRep_2CN010-024_20170808_aan_cae | August 2017 |
| SRK Consulting |
| NI 43-101 Technical Report Bisha Mine 2016, Eritrea | Page 205 |

Source: SRK, 2017
Figure 15.4: A section of the Bisha Main pit, showing pit phases
Table 15.2 summarises the contained ore and waste in each phase. The strip ratio is significantly smaller for Phase 1 compared to Phase 2.
Table 15.2: Bisha Main pit Mineral Reserves by phases
| | Phases | Ore Quantity
(000’s t) | Grade | Waste Quantity
(000’s t) | Total Quantity
(000’s t) | Strip Ratio
W:O |
| | (% Zn) | (% Cu) | (g/t Ag) | (g/t Au) |
| | Phase 1 | 3,710 | 7.34 | 1.17 | 52 | 0.8 | 18,904 | 22,614 | 5.10 |
| | Phase 2 | 3,653 | 6.60 | 1.11 | 50 | 0.7 | 33,132 | 36,785 | 9.07 |
| | Total | 7,363 | 6.97 | 1.14 | 51 | 0.7 | 52,035 | 59,399 | 7.07 |
Ore from Phase 1 provides mill feed up to 2018 Q2. Mining of some waste from Phase 2 starts in 2017 Q4 and will be completed in 2020 Q1. Ore mining in the Bisha main pit will be completed in 2020 Q3. Although it is desirable to mine phases in order of their priority, due to operational constraints more than one phase will be mined in each period. Figure 15.5 shows the progress of mining by phases in different periods.
Harena pit commences in 2019 Q4 when waste mining in Bisha Main is substantially completed. In 2020, some ore will be mined in Bisha Main, however the majority of mining activity will be focused in Harena. Ore mining in Harena will be completed in 2021 Q3.
| PJ/ABE/ADD/CCS/AAN/NMW/CAE | Bisha_2016R&R-Update_TechRep_2CN010-024_20170808_aan_cae | August 2017 |
| SRK Consulting |
| NI 43-101 Technical Report Bisha Mine 2016, Eritrea | Page 206 |

Source: SRK, 2017
Figure 15.5: Quantity of total material mined per year
| 15.3 | Production Scheduling |
The total project life is less than five years including about one year of ore being mined from Harena. The mining activities will conclude in Year 5 (2021 Q3). Using the phase designs, a detailed production schedule was developed. The goals of scheduling were to achieve the following:
| | - Delivering constant feed to the mill, this is set between 2.2 Mt to 2.4 Mt per year
- Maximising the grade in early years
- Delaying mining waste as much as possible to allow the new equipment to arrive at site and to reduce the investment in the early stages.
|
Production planning was carried out on a quarterly basis for the life of mine. Figure 15.6 demonstrates the life of mine production plan, starting in January 2017 with a rate of less than 4.0 Mt per quarter and gradually increase to about 6 Mt in the third quarter of 2019. Mine production will peak for one and a half years starting in the third quarter of 2018. By the end of 2019, there will be extra capacity in the mining fleet at Bisha Main, this will allow to begin pre-stripping at Harena. Both Bisha Main pit and Harena pits will be active in 2019 and 2020. Harena will continue to provide ore for the rest of the life of mine – to 2021 Q3.
| PJ/ABE/ADD/CCS/AAN/NMW/CAE | Bisha_2016R&R-Update_TechRep_2CN010-024_20170808_aan_cae | August 2017 |
| SRK Consulting |
| NI 43-101 Technical Report Bisha Mine 2016, Eritrea | Page 207 |
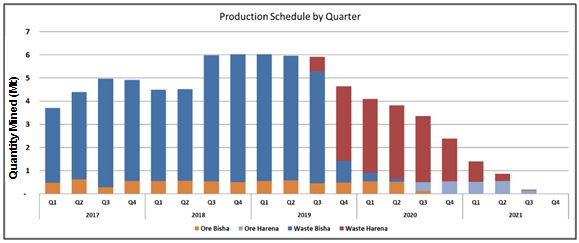
Source: SRK, 2017
Figure 15.6: Life of mine quarterly production schedule
| 15.3.1 | Results of Production Schedule |
The mining operation will take four and a half years to complete including mining the Harena pit. Figure 15.7 presents the annual production schedule.

Source: SRK, 2017
Figure 15.7: Bisha project annual production schedule
Table 15.3 shows the detailed annual production schedule for the life of mine for Bisha Main pit and the Harena Pit. In the Bisha Main pit, the remaining Supergene ore will be mined in 2017.
| PJ/ABE/ADD/CCS/AAN/NMW/CAE | Bisha_2016R&R-Update_TechRep_2CN010-024_20170808_aan_cae | August 2017 |
| SRK Consulting |
| NI 43-101 Technical Report Bisha Mine 2016, Eritrea | 208 |
Although no stockpiling is planned, SRK recommends that marginal grade mineralised resources be kept separately from the waste. The low-grade material could be stockpiled on the west side of the pit. This material could be processed if the commodity prices improve.
Figure 15.8 shows the mine sequencing at Bisha Main pit.
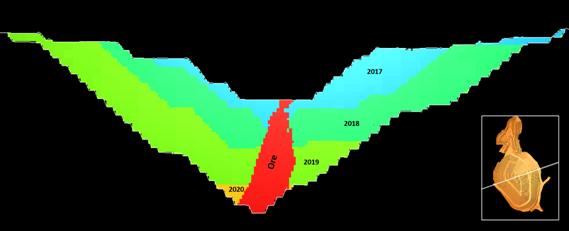
Figure 15.8: Mine sequencing at Bisha Main pit by year
| PJ/ABE/ADD/CCS/AAN/NMW/CAE | Bisha_2016R&R-Update_TechRep_2CN010-024_20170808_aan_cae | August 2017 |
| SRK Consulting |
| NI 43-101 Technical Report Bisha Mine 2016, Eritrea | Page 209 |
Table 15.3: Production schedule for Bisha project
| | Effective 31 December 2016 | Total | 2017 | 2018 | 2019 | 2020 | 2021 |
| | Production Schedule, Bisha Project | 1 | 2 | 3 | 4 | 5 |
| | Ore Supergene | Quantity (tonne) | 11,798 | 11,798 | | | | |
| | (% Zn) | 0.11 | 0.11 | | | | |
| | (% Cu) | 2.56 | 2.56 | | | | |
| | (g/t Ag) | 17 | 17 | | | | |
| | (g/t Au) | 0.71 | 0.71 | | | | |
| | Ore Primary | Quantity (tonne) | 7,351,440 | 1,930,182 | 2,167,677 | 2,077,182 | 1,176,399 | |
| | (% Zn) | 6.98 | 7.35 | 7.3 | 6.34 | 6.93 | |
| | (% Cu) | 1.14 | 1.12 | 1.17 | 1.11 | 1.14 | |
| | (g/t Ag) | 51 | 50 | 54 | 49 | 53 | |
| | (g/t Au) | 0.74 | 0.74 | 0.74 | 0.73 | 0.74 | |
| | Total Ore Mined and Milled from Bisha Main pit | Quantity (tonne) | 7,363,238 | 1,941,980 | 2,167,677 | 2,077,182 | 1,176,399 | |
| | (% Zn) | 6.97 | 7.31 | 7.3 | 6.34 | 6.93 | |
| | (% Cu) | 1.14 | 1.13 | 1.17 | 1.11 | 1.14 | |
| | (g/t Ag) | 51 | 50 | 54 | 49 | 53 | |
| | (g/t Au) | 0.74 | 0.74 | 0.74 | 0.73 | 0.74 | |
| | Total Ore Mined and Milled from Harena Pit | Quantity (tonne) | 2,227,947 | | | | 977,930 | 1,250,017 |
| | (% Zn) | 3.44 | | | | 3.33 | 3.53 |
| | (% Cu) | 0.76 | | | | 0.84 | 0.7 |
| | (g/t Ag) | 24.55 | | | | 24.55 | 24.55 |
| | (g/t Au) | 0.5 | | | | 0.5 | 0.5 |
| | Total ore milled | Quantity (tonne) | 9,591,185 | 1,941,980 | 2,167,677 | 2,077,182 | 2,154,329 | 1,250,017 |
| | (% Zn) | 5.99 | 6.97 | 6.99 | 6.11 | 5.21 | 3.85 |
| | (% Cu) | 1.1 | 1.11 | 1.21 | 1.15 | 1.07 | 0.83 |
| | (g/t Ag) | 45 | 48 | 52 | 48 | 40 | 28 |
| | (g/t Au) | 0.7 | 0.74 | 0.75 | 0.74 | 0.67 | 0.55 |
| | Ore Mined from Bisha | Quantity (tonne) | 7,363,238 | 1,941,980 | 2,167,677 | 2,077,182 | 1,176,399 | - |
| | Ore Mined from Harena | Quantity (tonne) | 2,227,947 | | | | 977,930 | 1,250,017 |
| | Total ore mined
(Bisha & Harena) | Quantity (tonne) | 9,591,185 | 1,941,980 | 2,167,677 | 2,077,182 | 2,138,673 | 1,265,673 |
| | Waste (Bisha) | Quantity (tonne) | 52,035,362 | 16,053,650 | 18,858,517 | 16,615,727 | 507,468 | 0 |
| | Waste (Harena) | Quantity (tonne) | 16,158,759 | 0 | 0 | 3,863,999 | 11,065,546 | 1,229,214 |
| | Total waste mined
(Bisha & Harena) | Quantity (tonne) | 68,194,121 | 16,053,650 | 18,858,517 | 20,479,726 | 11,573,014 | 1,229,214 |
| | Total rock mined (Bisha) | Quantity (tonne) | 59,398,600 | 17,995,630 | 21,026,194 | 18,692,909 | 1,683,867 | |
| | Total rock mined (Harena) | Quantity (tonne) | 18,386,706 | | | 3,863,999 | 12,027,820 | 2,494,887 |
| | Strip Ratio
(Bisha & Harena) | Waste:Ore | 7.11 | 8.27 | 8.70 | 9.86 | 5.37 | 0.98 |
| PJ/ABE/ADD/CCS/AAN/NMW/CAE | Bisha_2016R&R-Update_TechRep_2CN010-024_20170808_aan_cae | August 2017 |
| SRK Consulting |
| NI 43-101 Technical Report Bisha Mine 2016, Eritrea | Page 210 |
Total waste mined in the Bisha Main pit is ~52 Mt. This will be stored in three separate dumps, one in the north and two in the south. The north pit will be mined out by the second quarter of 2017 and will be used to store ~18 Mt of waste. The waste dumps to the south will accommodate the balance of the waste. Figure 15.9 shows a perspective view of the Bisha Main pit and its two waste dumps.

Source: SRK, 2017
Figure 15.9: Waste dumps of Bisha Main pit
| PJ/ABE/ADD/CCS/AAN/NMW/CAE | Bisha_2016R&R-Update_TechRep_2CN010-024_20170808_aan_cae | August 2017 |
| SRK Consulting |
| NI 43-101 Technical Report Bisha Mine 2016, Eritrea | Page 211 |
The majority of the waste mined has the potential to leach metals and therefore should be separated from the neutral waste material. Based on geochemical characteristics, waste is classified into two groups of Potentially Acid Generating (PAG) and Non-Acid Generating (NAG). The majority of NAG material has been mined out with about 1.5 Mt remaining to be mined. The ultimate pit design has ~51 Mt of PAG waste that will be stored in a permitted waste dump. This storage has sufficient capacity to accommodate all the PAG material mined in final pit.
NAG waste is stored in a separate dump to be used in mine closure.
| 15.5 | Mining Equipment and Personnel |
The mine budget assumes 355 operating days per year with two 12 hour shifts per day. At maximum capacity, the mine can move 60 kt of material per day. The amount of mining equipment required for the operation varies by tonnages of rocks moved in each period.
Bisha currently utilises 27 65-tonne trucks with matching shovels and excavators. Ongoing maintenance, rebuilds and replacement is required. Based on a study of equipment selection and in order to be able to increase the mining capacity, BMSC plans to purchase a series of new 65-tonne trucks and matching excavators to replace the older equipment by 2018.
There are three crews of mining operators working in two 12-hour shifts. Local personnel work in four weeks on and one week off rotation while expatriates work in seven weeks on and three weeks off rotation. In the peak of operation (2019) the mine employs a total of 353 personnel. The number of mining employees will reduce to 307 in 2020 and to 275 in 2021 when the operation is planned to be terminated.
Table 15.4 lists major equipment and personnel requirements for the life of mine.
| PJ/ABE/ADD/CCS/AAN/NMW/CAE | Bisha_2016R&R-Update_TechRep_2CN010-024_20170808_aan_cae | August 2017 |
| SRK Consulting |
| NI 43-101 Technical Report Bisha Mine 2016, Eritrea | Page 212 |
Table 15.4: List of major mining equipment and their requirements by period
| | Major Mining Equipment | 2017 | 2018 | 2019 | 2020 | 2021 |
| | Drill - D65 (150 mm) | 5 | 2 | 1 | 0 | 0 |
| | Drill - DML (229 mm) | 0 | 2 | 2 | 2 | 2 |
| | Wheel loader – 990 H | 2 | 2 | 2 | 1 | 1 |
| | Wheel loader – 966 H | 1 | 1 | 1 | 1 | 1 |
| | Primary Excavator - CAT6015 | 4 | 1 | 1 | 0 | 0 |
| | Primary Excavator - CAT6018 | 1 | 4 | 4 | 4 | 2 |
| | Haul truck; 65-tonne class | 27 | 28 | 23 | 19 | 14 |
| | Dozer; D9 | 3 | 3 | 3 | 2 | 2 |
| | Dozer; D10 | 0 | 2 | 2 | 2 | 2 |
| | Wheel dozer; 834H-class 4633 mm blade | 1 | 1 | 1 | 1 | 1 |
| | Grader; 16M-class 4677 mm blade | 0 | 1 | 1 | 2 | 2 |
| | Grader; 14M-class 4267 mm blade | 3 | 2 | 1 | 0 | 0 |
| | Water truck; 65-tonne class 56 781 litres | 1 | 1 | 1 | 1 | 1 |
| | Water truck; 35-tonne class, 30 283 litres | 2 | 2 | 2 | 0 | 0 |
| | Small Excavator - CAT320 | 5 | 2 | 3 | 2 | 2 |
| | MMU (Explosive Trucks) | 2 | 2 | 2 | 2 | 2 |
| | Fuel Truck; 35-tonne class 30 283 litres | 2 | 2 | 2 | 2 | 2 |
| | Mining Personnel | | | | | |
| | Operations | 303 | 298 | 267 | 211 | 175 |
| | Maintenance | 117 | 115 | 103 | 81 | 67 |
| | Management/technical | 21 | 23 | 23 | 23 | 23 |
| | Total mining personnel | 441 | 436 | 393 | 315 | 265 |
| 15.6 | General Mine Site Layout |
Figure 15.10 shows the general site layout of Bisha Main pit and processing facilities. This is an optimised layout that minimises the operating costs while considering safety for all kind of activities at site. However, the site layout can further be optimised to minimise the haulage costs for waste dumps. A new waste dump could be developed south of the Bisha Main pit that could potentially reduce the haulage cost.
| PJ/ABE/ADD/CCS/AAN/NMW/CAE | Bisha_2016R&R-Update_TechRep_2CN010-024_20170808_aan_cae | August 2017 |
| SRK Consulting |
| NI 43-101 Technical Report Bisha Mine 2016, Eritrea | Page 213 |
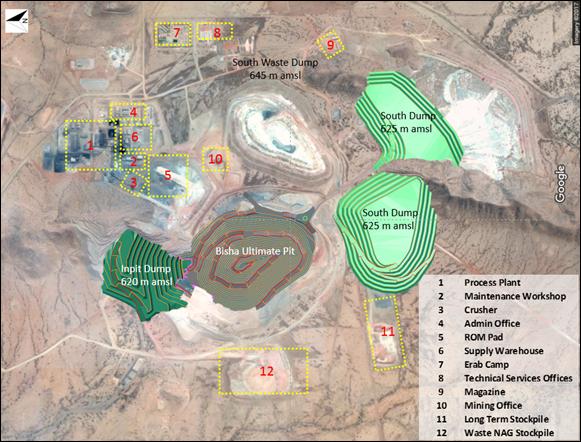
Source: SRK, 2017
Figure 15.10: Bisha Main general mine site layout
SRK has reached the following conclusions in relation to the mine engineering aspects of the Bisha property.
| | - Bisha project provides 9.6 Mt of mineable ore at 6.15% Zn; 1.05% Cu; 0.69 g/t Au and 44.86 g/t Ag. This amount of ore will be mined from Bisha Main and Harena pits.
- Bisha project has enough mineable ore that can run the mill up to the third quarter of 2021.
- Both Bisha Main and Harena deposits technically and economically can be mined using open pit mining method and traditional truck and shovel operation.
- Bisha Main deposit provides a variety of options for ultimate pit sizes that are all viable. The size of the ultimate pit and required mining equipment are directly related. The amount of mineable ore reported in this document are based on the fleet listed for the project in Table 15.4.
|
| PJ/ABE/ADD/CCS/AAN/NMW/CAE | Bisha_2016R&R-Update_TechRep_2CN010-024_20170808_aan_cae | August 2017 |
| SRK Consulting |
| NI 43-101 Technical Report Bisha Mine 2016, Eritrea | Page 214 |
SRK makes the following recommendation in relation to the mine engineering aspects of the Bisha property.
| | - Obtain the necessary permits to establish a waste dump to the west of the Bisha Main pit. A waste dump in this area will reduce cycle times, and therefore costs, particularly for the waste stripped in the west zone.
- Review the geotechnical assessment for the south-east sector of the Bisha Main pit based on recent exposures in that area. The current geotechnical recommendations are complex and vary considerably with only a small variation in pit wall orientation. In SRK's opinion, there is opportunity to reduce the stripping ratio.
- Review the current procedures for grade control and short-term mine planning (GC&STMP) with a view to establishing a methodology that values the ore according to NSR and can respond relatively quickly to change in commodity process and processing performance.
- Currently, the ore is sorted on run-of-mine (ROM) pads, based on its quality/grade, prior to crushing. SRK recommends utilising the improved GC&STMP procedures (refer to earlier recommendation) to provide the confidence required for direct tipping to the crusher. This reduction in rehandle will reduce the operating costs.
- Increase the width of the two-way haulage roads to at least 25 m. This will increase tire life (due to less frequent scrubbing of tire walls on bunds) and generally provide safer operating conditions.
- Consider increasing the width of the two-way haulage roads to at least 25 m (preferred 27 m). This will increase tire life (due to less frequent scrubbing of tire walls on bunds) and generally provide safer operating conditions.
- The cost estimate for these recommendations is about $0.3M.
|
| 15.9 | Risks and Opportunities |
SRK makes the following comments for risks and opportunities related to the mine engineering aspects of the Bisha property.
| | - Achieving the mining rate calculated in production schedule is an important and vital element for success in Bisha’s project. Failure in reaching to the production rate causes the operating cost to increase and poses the risk of losing the mineable reserve.
- Mineral Reserve calculated in this reported is based on input parameters introduced in Section 14. These parameters included commodity prices and processing recoveries. Failure to achieve processing recoveries used in this report will cause the project to lose the income that eventually affect the amount of Mineral Reserve.
- During of this work, a large pit option was evaluated and showed promising results. This option should be re-visited if the conditions (i.e. commodity prices, available capital, and interpretation of execution risk) improve.
- Harena deposit contains some near surface inferred resources. More exploration drilling to confirm Mineral Resource Estimate at Harena may help to increase the Mineral Reserve Estimate for this deposit.
|
| PJ/ABE/ADD/CCS/AAN/NMW/CAE | Bisha_2016R&R-Update_TechRep_2CN010-024_20170808_aan_cae | August 2017 |
| SRK Consulting |
| NI 43-101 Technical Report Bisha Mine 2016, Eritrea | Page 215 |
| | - A substantial quantity of stockpiled material is available, however the current processing regime does not make this material economic to process. Ongoing testwork may identify opportunity to improve the recovery and make this material economic.
|
| PJ/ABE/ADD/CCS/AAN/NMW/CAE | Bisha_2016R&R-Update_TechRep_2CN010-024_20170808_aan_cae | August 2017 |
| SRK Consulting |
| NI 43-101 Technical Report Bisha Mine 2016, Eritrea | Page 216 |
The 2.4 Mtpa BMSC process plant Phase III expansion was commissioned in mid-2016 to process Primary material from the Bisha Main and Harena pits. The Phase III expansion now includes separate copper and zinc flotation circuits, concentrate dewatering/handling and tailings thickening prior to pumping and disposal in the tailings management facility.
Flowsheet modifications have been recently introduced, including the redirection of the concentrate from the first two copper and zinc rougher flotation cells to final concentrate. Recent production results show the production of a saleable copper concentrate, displacing the bulk concentrate generated in 2016 as well as steadily improving recoveries.
The estimated metallurgical recoveries provided by SRK in Section 12 are assuming campaign processing of specific metallurgical domains and not blending across domains. In addition, the performance of stockpiled Primary material needs to be confirmed with dedicated sampling and testing; at present, the performance of stockpiled material is highly variable and uncertain.
The current mine plan shows that the Bisha Main Primary material will feed the mill until 2020 when Harena Primary material comes on-line, resulting in a slight reduction in grades that year.
No further plant expansions or modifications are considered in the Economic Analysis section of this technical report.
| 16.2 | Process Plant Flowsheet |
The BMSC process plant has undergone a number of modifications/expansions as the feed has changed from Oxide to Supergene and now, Primary material for both the Bisha Main and Harena pits.
Figure 16.1 and Figure 16.2 show the current Phase III Primary material flowsheet including separate copper and zinc flotation circuits, concentrate dewatering/handling and tailings thickening prior to pumping and disposal in the tailings management facility.
| PJ/ABE/ADD/CCS/AAN/NMW/CAE | Bisha_2016R&R-Update_TechRep_2CN010-024_20170808_aan_cae | August 2017 |
| SRK Consulting |
| NI 43-101 Technical Report Bisha Mine 2016, Eritrea | Page 217 |

Source: Nevsun, 2017
Figure 16.1: Bisha Main primary material process flowsheet – grinding & flotation
| PJ/ABE/ADD/CCS/AAN/NMW/CAE | Bisha_2016R&R-Update_TechRep_2CN010-024_20170808_aan_cae | August 2017 |
| SRK Consulting |
| NI 43-101 Technical Report Bisha Mine 2016, Eritrea | Page 218 |

Source: Nevsun, 2017
Figure 16.2: Bisha Main primary material process flowsheet – concentrate handling
| PJ/ABE/ADD/CCS/AAN/NMW/CAE | Bisha_2016R&R-Update_TechRep_2CN010-024_20170808_aan_cae | August 2017 |
| SRK Consulting |
| NI 43-101 Technical Report Bisha Mine 2016, Eritrea | Page 219 |
Table 16.1 lists the major plant equipment of the current Phase III flowsheet, with a capacity of 2.4 Mtpa.
Table 16.1: Summary of major plant equipment (following Phase III expansion)
| | Item | Details | Manufacturer | Installed Power (kW) |
| | ROM Bin | 100 m3 capacity | COSIRA | |
| | Jaw Crusher | C140 | Metso | 200 |
| | Crushed Ore Stockpile | 10,000t live | | |
| | SAG Mill | 6.1 m Ø x 3.0 m EGL | Polysius | 2,000 |
| | Ball Mill | 5.5 m Ø x 8.3 m EGL | Polysius | 4,500 |
| | Primary Cyclones | 5, HC600 | Multotec | |
| | Copper Rougher Cells | 9, RCS 100 m3 | Metso | |
| | Copper 1st Cleaner Cells | 4, RCS 100 m3 | Metso | |
| | Copper 2nd Cleaner Cells | 5, RCS 30 m3 | Metso | |
| | Copper 3rd Cleaner Cells | 4, RCS 20 m3 | Metso | |
| | Copper Final Cleaner | 4, RCS 30 m3 | Metso | |
| | Regrind Cyclones | 9, D10 | Multotec | |
| | Copper Regrind Mill | M5000 IsaMill | Xstrata | 1,500 |
| | Zinc Regrind Mill | M5000 IsaMill | Xstrata | 1,500 |
| | Zinc Rougher Cells | 8, TC100 100 m3 | Outotec | |
| | Zinc 1st Cleaner Cells | 5, TC50 50 m3 | Outotec | |
| | Zinc 2nd Cleaner Cells | 4, TC50 50 m3 | Outotec | |
| | Zinc 3rd Cleaner Cells | 4, TC50 50 m3 | Outotec | |
| | Copper Conc Thickener | 15 m Ø | Delkor | |
| | Zinc Conc Thickener | 15 m Ø | Delkor | |
| | Tailings Thickener | 45 mØ x 4 m H | Delkor | |
| | Copper Conc Filter | VPA 15-30 | Metso | |
| | Zinc Conc Filter | VPA 15-30 | Metso | |
Following two-stage grinding and classification to an 80% passing (P80) size of 75 µm, copper flotation is completed nine, 100 m3 rougher cells followed by three stages of copper cleaning in a range of 100 m3, 30 m3 and 20 m3 cells. Regrinding is done with an M5000 IsaMill.
Zinc flotation is done in eight, 100 m3 rougher cells followed by three stages of zinc cleaning in 50 m3 cells. Regrinding is also done with an M5000 IsaMill. Concentrate filtering to 8% to 10% moisture is done using vertical plate pressure filters.
Recent modifications to the flowsheet shown in Figure 16.1 include:
| | - Redirection of the first two copper rougher cell concentrates to final concentrate
- Redirection of the first two zinc rougher cell concentrates to final concentrate
- Elimination of the copper first cleaner cells
- Pumping of the copper cleaner tails to the copper rougher tails pump.
|
| PJ/ABE/ADD/CCS/AAN/NMW/CAE | Bisha_2016R&R-Update_TechRep_2CN010-024_20170808_aan_cae | August 2017 |
| SRK Consulting |
| NI 43-101 Technical Report Bisha Mine 2016, Eritrea | Page 220 |
| 16.3 | Recent Production Results |
The following figures summarise the BMSC plant performance since commissioning of the Phase III expansion on Primary material in June 2016.
Figure 16.3 shows the monthly head grades with copper stable around 1% and zinc ranging from 5% to 7%. (BMSC are blending their feed to maintain a Zn/Cu ratio of around 6:1.) Monthly tonnes processed are equivalent to between 6,500 tpd and 7,000 tpd or around 300 tph.
Figure 16.4 shows the monthly copper circuit performance.

Source: SRK, 2017
Figure 16.3: Primary material head grade & milled tonnes (Aug 2016 to Dec 2016)
| PJ/ABE/ADD/CCS/AAN/NMW/CAE | Bisha_2016R&R-Update_TechRep_2CN010-024_20170808_aan_cae | August 2017 |
| SRK Consulting |
| NI 43-101 Technical Report Bisha Mine 2016, Eritrea | Page 221 |

Source: SRK, 2017
Figure 16.4: Primary material copper concentrate production (Aug 2016 to Dec 2016)
Since commissioning, BMSC have produced a bulk Cu-Zn concentrate that has recently been supplemented with a saleable copper concentrate. In Figure 16.4, a copper concentrate grade of around 20% Cu has been produced while the bulk concentrate varied from 5% Cu to 15% Cu. Overall copper recovery has steadily increased since start-up to the current 50% to 60%.
A recent operational change was to focus on copper concentrate quality instead of recovery and has resulted in a saleable concentrate being produced. With a Zn/Cu ratio of around 6:1, it is reasonable that copper recovery to final concentrate is the one operating variable allowed to float depending on feed material.
Zinc circuit performance is shown on a monthly basis since start-up in Figure 16.5. Final concentrate zinc grade has been only 42% to 49% to the end of 2016 with both zinc concentrate grade and recovery have been steadily improving since start-up of the Phase III expansion.. Zinc losses to the copper circuit have been steadily decreasing with zinc recovery currently about 70%.
| PJ/ABE/ADD/CCS/AAN/NMW/CAE | Bisha_2016R&R-Update_TechRep_2CN010-024_20170808_aan_cae | August 2017 |
| SRK Consulting |
| NI 43-101 Technical Report Bisha Mine 2016, Eritrea | Page 222 |
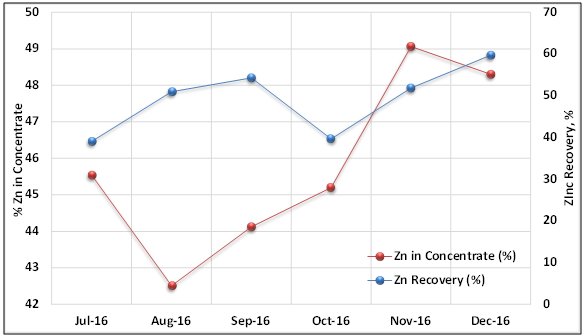
Source: SRK, 2017
Figure 16.5: Primary material zinc concentrate production (Aug 2016 to Dec 2016)
Figure 16.6 shows the expected mill feed tonnes by source based on the current mine production plan. Bisha Primary material will make-up all of the plant feed until mid-2020 when Harena Primary material will be supplied to the mill for the remainder of mine life.
It should be noted that the estimated Primary material performance provided by SRK in Section 12.6 is based on the assumption that metallurgical domains will be campaigned without blending across domains. This is to allow the plant operating conditions (e.g. grind size and reagent additions) to be adjusted to the specific requirements of each domain. It is recognised that the material contained in the stockpiles could be highly weathered/oxidised and therefore of uncertain metallurgical performance.
To date, the BMSC plant has operated only on blended feed with a Zn/Cu ratio of around 6:1. Recent performance is similar to that estimated by SRK in Section 12 of this report and showing steady improvement due to operational changes.
| PJ/ABE/ADD/CCS/AAN/NMW/CAE | Bisha_2016R&R-Update_TechRep_2CN010-024_20170808_aan_cae | August 2017 |
| SRK Consulting |
| NI 43-101 Technical Report Bisha Mine 2016, Eritrea | Page 223 |

Source: SRK, 2017
Figure 16.6: Mine production plan mill feed tonnes
Figure 16.7 shows the expected mill feed grades from the mine plan with the Zn/Cu ratio of 6:1 being maintained for Bisha Main and then the zinc and copper grades both falling when Harena comes online in late 2020. Gold head grades will remain steady at 0.7 g/t Au for Bisha Main material.

Source: SRK, 2017
Figure 16.7: Mine production plan mill feed grades
| PJ/ABE/ADD/CCS/AAN/NMW/CAE | Bisha_2016R&R-Update_TechRep_2CN010-024_20170808_aan_cae | August 2017 |
| SRK Consulting |
| NI 43-101 Technical Report Bisha Mine 2016, Eritrea | Page 224 |
A summary of average plant consumption for the first three months of 2017 is shown in Table 16.2 BMSC have recently changed from a cyanide-based to a sulphite-based zinc depressant scheme that involves lower pH conditions in the copper rougher cells. This has lowered the lime consumption. Sodium metabisulphite is also being trialed as a sphalerite depressant.
Table 16.2: Summary of plant consumables (2017 YTD)
| | Consumable Item | Unit | Value |
| | Primary Grinding Specific Energy | kWh/t | 12.50 |
| | 100 mm Grinding Media | kg/t | 0.28 |
| | 40 mm Grinding Media | kg/t | 1.36 |
| | 3.5 mm Regrinding Media | kg/t | 0.05 |
| | Betacol 201 | kg/t | 0.05 |
| | PAX Collector | kg/t | 0.14 |
| | MIBC Frother | kg/t | 0.08 |
| | Sodium Sulphite | kg/t | 0.27 |
| | Lime | kg/t | 5.40 |
| | Antiscalant | kg/t | 0.03 |
| | Copper Sulphate | kg/t | 0.01 |
| | SMBS | kg/t | 0.18 |
| 16.6 | Commissioning Opportunities |
Work is ongoing at Bisha to improve plant performance, with particular emphasis on copper-zinc selectivity. Methods to anticipate poor selectivity are being investigated including sequential copper tests to estimate the secondary copper content and non-sulphide metal ions that may be resulting in sphalerite activation.
In SRK’s opinion, well-defined, metallurgical domains need to be established, each with specific operating conditions needed to achieve reasonable selectivity and produce both a copper and zinc concentrate. This might be Zn/Cu feed grade ratios (discussed in Section 12) or it might be another feed characteristic or proxy value. Due to the high variability in metallurgical response observed in the plant results to date and historical testwork, it seems reasonable to assume that campaigning of specific metallurgical domains without blending across domains, offers the greatest opportunity for consistent plant performance.
| 16.7 | Expansion Plans / Circuit Modifications |
At this time, BMSC do not have any plans for further plant modifications or expansions. It is being considered that the CIL circuit might be started up in 2021 to process stockpiled Oxide material. This needs to be evaluated and is not included in the Economic Analysis section of this technical report.
| PJ/ABE/ADD/CCS/AAN/NMW/CAE | Bisha_2016R&R-Update_TechRep_2CN010-024_20170808_aan_cae | August 2017 |
| SRK Consulting |
| NI 43-101 Technical Report Bisha Mine 2016, Eritrea | Page 225 |
| 16.8 | Conclusions and Recommendations |
The BMSC Phase III plant expansion was commissioned in mid-2016 with an extended period of steady improvement occurring over the past nine months. Recently, a saleable copper concentrate has been produced with the tonnes of bulk Cu-Zn concentrate diminishing steadily. Final concentrate zinc grade has been below 50% to the end of 2016; however, due to current market conditions and low impurity levels, the zinc concentrate is readily saleable. Zinc recovery to the zinc concentrate has been steadily improving.
The current mine production plan shows Bisha Main Primary material as the sole source of plant feed, until Harena Primary material comes on-line in late 2020 after the depletion of Bisha Main material. Mill head grades for Bisha Main Primary material will remain steady (at a Zn/Cu ratio of around 6:1) while Harena head grades will be lower.
| PJ/ABE/ADD/CCS/AAN/NMW/CAE | Bisha_2016R&R-Update_TechRep_2CN010-024_20170808_aan_cae | August 2017 |
| SRK Consulting |
| NI 43-101 Technical Report Bisha Mine 2016, Eritrea | Page 226 |
The on-site and off-site infrastructure required to operate the Project is in place.
In general, the Tailings Management Facility (TMF) is operating satisfactorily although, for reasons related to dam safety, Knight Piésold (KP) has indicated the rate at which TMF water is reclaimed needs to be increased to the maximum possible extent. Provided the KP recommendations arising from their bi-annual audits are appropriately addressed, it will be possible for the TMF to be safely raised to levels required by the revised mine plan. However, current plan outlined in this document calls for a smaller quantity of tailings then was proposed for the original TMF design.
Groundwater pumped from water bores is the principal source of water for the Project and its processing needs.The groundwater resource significantly exceeds the required abstraction rate, suggesting the current abstraction is sustainable in the long term assuming current average conditions of recharge and groundwater flow. Due to the high rate of evaporation, the Project water balance is net negative; no water has been discharged to the environment in the past, nor is it expected to in the future.
Waste rock from the open pit falls into one of two geochemical categories controlled by lithological makeup: non-potentially acid generating (NAG) or potentially acid generating (PAG). Most of the waste rock is classified as PAG material. Identification of NAG material can only be done by testing. There is currently one NAG dump and one PAG dump on site. NAG material is being used for embankment construction at the TMF.
On-site infrastructure
A site layout plan covering site facilities is shown in Figure 17.1 power and communication descriptions are included in Section 4.4 of this report. Constructed on-site infrastructure includes:
| | - A road network connecting the open pit to the main processing area, waste dumps and to the maintenance complex, tailings facility, and camp.
- Administration building. Offices and cubicles are provided for the mine management and supervisory staff as well as for human resources, accounting, procurement, information technology, and safety staff.
- Maintenance workshop, warehouse and laboratory complex. The complex is located at the south end of the plant area adjacent to mine access road.
- The permanent camp complex is located approximately 5 km to the northwest of the plant site. The camp has a capacity to accommodate up to 900 people and includes accommodation, kitchen and dining facilities, recreation facilities, laundry, water treatment, sewage treatment, incinerators and emergency power facilities.
- The explosive magazine and ANFO mixing plant are located 1,000 m southeast of the process plant site and 450 m east of the ultimate footprint of the waste dump.
|
| PJ/ABE/ADD/CCS/AAN/NMW/CAE | Bisha_2016R&R-Update_TechRep_2CN010-024_20170808_aan_cae | August 2017 |
| SRK Consulting |
| NI 43-101 Technical Report Bisha Mine 2016, Eritrea | Page 227 |
| | - Fuel is stored in a bermed tank farm with two 1,500 m3 storage tanks. Current average daily use can range from 75,000 L to 90,000 L. At this consumption rate, the storage capacity is approximately 27 days to 35 days. Ongoing mine planning will determine whether additional capacity will be required in the future.
- Power plant, consisting of twenty-four 0.8 MW generators, currently serving an average demand of 8.5 MW.
- Process control system.
- Communications system.
- Water supply (potable and process).
|
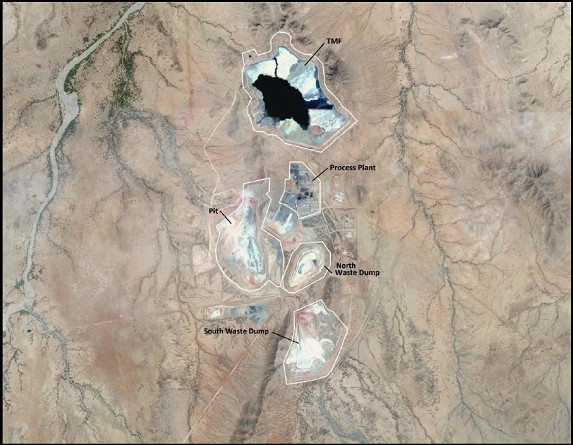
Source: Knight Piésold, 2016b
Figure 17.1: Site layout
Tailings Management Facility
Tailings discharged from the process plant are stored in an HDPE lined tailings management facility (TMF) situated approximately 500 m north of the process plant. The facility has been formed by the sequential development of a series of earthfill/rockfill retention embankments (walls) aligned between natural hills (Figure 17.2). These embankments are raised in stages and, over time, a series of small saddle dams are constructed at low points around the TMF.
| PJ/ABE/ADD/CCS/AAN/NMW/CAE | Bisha_2016R&R-Update_TechRep_2CN010-024_20170808_aan_cae | August 2017 |
| SRK Consulting |
| NI 43-101 Technical Report Bisha Mine 2016, Eritrea | Page 228 |
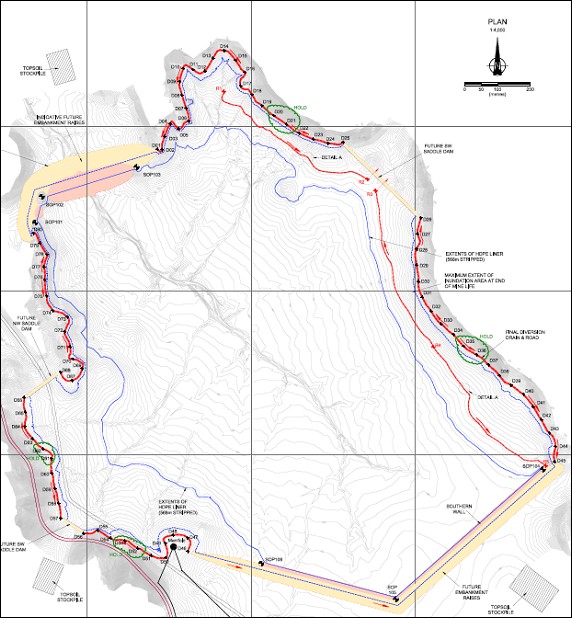
Source: AMEC, 2009
Figure 17.2: TMF layout
| 17.3.1 | Design and Construction |
The design of the TMF was developed by AMEC Earth and Environmental (AMEC, 2009) and accounted for a range of site specific inputs, including but not limited to the site foundation conditions, local hydrology and hydrogeology, regional seismicity, the geotechnical and geochemical properties of the tailings and variability in these properties over time as a result of changes in the ore geology and processing methodology, the geotechnical properties of the embankment materials and the related design criteria.
| PJ/ABE/ADD/CCS/AAN/NMW/CAE | Bisha_2016R&R-Update_TechRep_2CN010-024_20170808_aan_cae | August 2017 |
| SRK Consulting |
| NI 43-101 Technical Report Bisha Mine 2016, Eritrea | Page 229 |
The need for a geomembrane beneath the TMF was the result of a regulatory requirement by the Eritrean Ministry of Energy and Mines.
The height and staged construction of the TMF embankments was based on the need for a starter facility which would store up to 4 Mt of tailings produced over the first two year of production and approximately 18 Mt of tailings over the life of mine. This led to a Stage 1 (starter dam) elevation of 567.5 m and a final crest elevation of 577 m. The starter dam facilities were constructed in 2010. The operation of the TMC commenced with the start-up of the process plant in December 2010.
A typical section through the north embankment shows the construction materials and the various construction stages, all of which are based on the downstream construction method (Figure 17.3). The same construction method is applied to the other embankments and saddle dams. At elevation 577 m, the north embankment would have a maximum height of approximately 24 m.
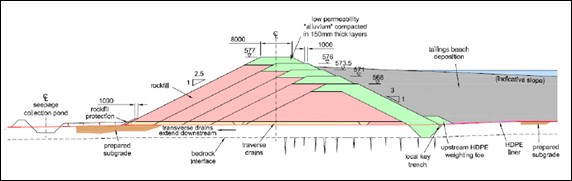
Source: AMEC, 2009 (not to scale)
Figure 17.3: Typical section through north embankment
A revised capacity analysis completed by Knight and Piésold Consulting (Pty) Ltd. (KP, 2012) for the Stage 2 design indicated a significant increase in capacity, to 29.4 Mt, based on the same final embankment elevation (577 m). Construction of the Stage 2 raise was completed by March 2014.
Table 17.1 shows the construction stages as they were envisioned in conjunction with Stage 2 and the subsequent construction staging plans. The timing of the stages depends on variety of factors but the main parameter is the in-situ density of the tailings. A survey of the tailings surface and the bathymetry of the submerged tailings is planned in 2017, which will provide a more accurate estimate of the tailings volume and, therefore, a better understanding of the TMF storage characteristics.
| PJ/ABE/ADD/CCS/AAN/NMW/CAE | Bisha_2016R&R-Update_TechRep_2CN010-024_20170808_aan_cae | August 2017 |
| SRK Consulting |
| NI 43-101 Technical Report Bisha Mine 2016, Eritrea | Page 230 |
Table 17.1: Dam crest elevation versus TMF storage capacity per stage
| | Stage | Crest Level
(m amsl) | Beach Level
(m amsl) | Storage Capacity
(Mt) | Storage Capacity Cumulative
(Mt) | Duration of Stage Deposition
(years) | Cumulative Periods of Deposition
(years) | Rate of Rise
(m/yr) |
| | 1 | 567.5 | 567.0 | 3.7 | 4.1 | 2.07 | 2.07 | 3.91 |
| | 2 | 571.0 | 570.5 | 9.5 | 13.2 | 5.58 | 7.65 | 0.63 |
| | 3 | 573.5 | 573.0 | 7.0 | 20.2 | 4.11 | 11.76 | 0.61 |
| | 4 | 576.0 | 575.5 | 7.7 | 27.9 | 4.51 | 16.27 | 0.55 |
| | 5 | 577.0 | 576.0 | 1.5 | 29.4 | 0.88 | 17.15 | 0.57 |
| | Source: Knight Piésold, 2012 |
KP has also designed, and is overseeing, the Stage 3 raise to elevation 574 m. Construction of this raise commenced in Q1 of 2017 and is expected to be finished in late 2017 or early 2018.
As noted above, revisions to Table 17.1 will be developed based on the Stage 3 raise and survey and bathymetric data collected in 2017. This data will provide an updated understanding of the storage characteristics of the TMF. Regardless, the stability calculations and performance data indicate it will be possible for the TMF to be raised to levels consistent with its design (AMEC, 2009) in order to safely store the tailings produced in accordance with the revised mine plan.
Tailings produced as part of ore processing are pumped from the process plant to the TMF and either sub-aerially spigotted from the crest of the embankments to form a beach or, discharged through a pipe to infill and control the location of the supernatant pond. The deposition plan in 2017 will focus on depositing tailings around the perimeter to ensure the pond is located centrally on the west side of the facility, away from the embankments.
The return water system has a pump at the end of a causeway on the west side of the TMF that is capable of pumping in excess of 100 litres per second. Reclaimed water has high metal levels and a low pH (~2.4) which must be adjusted prior to its use in the process plant.
Due to the water chemistry, substantial scaling occurs in the tailings discharge pipeline as well as the return water pipeline. It is understood that both these pipelines will be replaced in 2017.
In September 2016, the pond area was estimated to be about 61 ha, compared to a TMF area of approximately 141 ha (KP, 2016b). Concerns were expressed by KP about the growth in the pond area and its potential negative impacts on dam safety. However, modelling studies completed by WSP Parsons Brinkerhoff (WSP) indicate evaporation is likely to limit pond growth to a volume of 0.8 Mm3 and there is, therefore, a low risk of overtopping (WSP, 2016).
There is an operation, monitoring, surveillance (OMS) manual for the TMF. In addition, KP effectively fulfills the role of the Engineer of Record and, amongst other tasks, completes audits of the TMF twice a year. Notwithstanding the fact that some recommendations need to be carried over to the next audit, these elements form part of current best practice for tailings storage facilities.
| PJ/ABE/ADD/CCS/AAN/NMW/CAE | Bisha_2016R&R-Update_TechRep_2CN010-024_20170808_aan_cae | August 2017 |
| SRK Consulting |
| NI 43-101 Technical Report Bisha Mine 2016, Eritrea | Page 231 |
The water management strategy (BMSC, 2017) divides water sources within the Project area into one of the following four categories:
| | - Raw water: Groundwater pumped from water bores, groundwater recharge, rainfall or surface water runoff collected from catchments undisturbed, relatively undisturbed, rehabilitated or inactive mining areas
- Mine water: Groundwater or surface runoff from disturbed catchments such as the active mining area, waste rock storage facilities, ROM, TMF and process plant areas
- Reclaimed water: Water recycled from the TMF for reuse within the process plant
- Sewerage water: Treated sewerage effluent that is created by one of the three sewerage treatment plants on site. All effluent is currently sent to the TMF.
|
Raw water pumped from 19 water bores is the main water source. Ten water bores in the Mogoraib aquifer provide the majority of the raw water supply. A significantly lesser amount is provided by nine water bores in the Freketetet aquifer. BMSC is proposing to install pumps in an additional 12 water bores in 2017.
Pumping records between July and December 2016 indicate the water pumped from water bores ranged from approximately 135,000 m3 to 182,000 m3 per month, with an average of 164,100 m3 per month.
Water which is pumped from the pit and sewerage systems reports to the TMF.
Water usage is largely driven by the process plant requirements. Between July and December 2016, water usage at the process plant averaged approximately 113,100 m3 per month and most of this is raw water.
Water is also required for wash-down of mobile equipment and dust suppression on haul roads and on the ROM as well as firefighting, land services (irrigation), and potable usage. Other usage includes the explosive yard and Dustex water supplies.
Detailed records of flow rate recording have been collected since June 2016, and a probabilistic site-wide water balance has been developed for the Project using the GoldSim software platform (WSP, 2016a and 2016b). Refinements to the model are a work in progress as data collection continues with the goal of addressing data gaps and or model prediction uncertainties. In addition, the Project is developing a water management plan (BMSC, 2017). The broad objectives of the water management plan are to ensure that the water supply is sufficient to meet the Project’s requirements within the constraints of permit requirements and to develop a plan that optimises water use and has contingencies to address periods when there are potential shortages of clean water.
| PJ/ABE/ADD/CCS/AAN/NMW/CAE | Bisha_2016R&R-Update_TechRep_2CN010-024_20170808_aan_cae | August 2017 |
| SRK Consulting |
| NI 43-101 Technical Report Bisha Mine 2016, Eritrea | Page 232 |
Key conclusions arising from the water balance and current draft of the water management plan are as follows:
| | - Based on the TMF pond levels and comments related to dam safety from the TMF Audit report (KP, 2016b), the rate at which TMF water is reclaimed needs to be increased to the maximum possible extent.
- The supply of groundwater at the Mogoraib well fields currently exceeds the required abstraction rate by a factor of three, suggesting that the current abstraction is sustainable in the long term given current average conditions of recharge and groundwater flow. Efforts to reduce uncertainties related to prolonged drought conditions are still underway.
- The Project has not discharged water to the environment in the past, nor does it expect to in the future.
|
Waste Rock Facilities
Waste rock from the open pit falls into one of two geochemical categories controlled by lithological makeup: non-potentially acid generating (NAG) and potentially acid generating (PAG). NAG waste rock is considered benign in regard to reactivity and metals. It requires no special attention. It can be used for the construction of embankments at the TMF and, potentially, as a cover material on the PAG waste rock dumps. PAG waste rock, however, requires special storage measures and cannot typically be used at the TMF or other locations as construction material.
The units in the top 10 m to 20 m of the weathering profile of the Bisha Main pit (mostly above elevation 545 m to 550 m) are classified as NAG. This includes alluvium, overburden, regolith recemented breccia, quartz breccia, fault breccia and ferromagnesian altered rocks. Below this level, the units are classified as PAG due to the presence of pyrite or sulphate minerals such as jarosites/alunites.
Identification of NAG material can only be done by testing. Based on test results, NAG waste rock typically reports to the NAG waste rock facility (WRF) and PAG material reports to the PAG WRF. However, since selective mining of localised pockets of NAG material is not possible, some NAG material reports to the PAG WRF. This segregation is linked to the closure plan which requires the placement of a 10 m lift of NAG material over the PAG waste rock.
The remaining mine life at Bisha is based on the Phase 8 current mine plan. The coupling of the closure plan with the PAG and NAG storage volumes is summarised in Table 17.2.
| PJ/ABE/ADD/CCS/AAN/NMW/CAE | Bisha_2016R&R-Update_TechRep_2CN010-024_20170808_aan_cae | August 2017 |
| SRK Consulting |
| NI 43-101 Technical Report Bisha Mine 2016, Eritrea | Page 233 |
Table 17.2: PAG/NAG waste rock quantity summary
| | Item | 10 m NAG Encapsulation |
| | PAG Waste Dump Capacity (lcm) | 27,603,187 |
| | PAG Waste Mined Expit (lcm) | 24,766,463 |
| | PAG Remaining Waste Dump Capacity (lcm) | 2,836,725 |
| | | |
| | NAG Encapsulation Requirement (lcm) | 6,602,297 |
| | | |
| | NAG Sources |
| | Bisha Main pit (Phase 8) (lcm) | 703,125 |
| | West Waste Dump (lcm) | 2,260,000 |
| | North Dump (lcm) | 10,545,375 |
| | Total NAG Sources (lcm) | 13,508,500 |
| | NAG Remaining (lcm) | 6,906,203 |
| | Source: Bisha Technical Services email dated 23 June 2017. |
As shown on Figure 17.1, there were two WRFs in 2016 (North and South). The North waste rock dump contains NAG material. Much of the waste rock in that dump will be used for the construction of the next raise at the TMF. The South waste rock dump contains PAG material. The West waste rock dump was subsequently added.
The legal permits for the current and planned waste dumps in south of Bisha Main pit are current and in place. The capacity of these waste dumps is enough for the life of mine. To be further costs effective the mine may decide to choose a new location for waste dump in west side of the pit. In this case the mine needs to pass the legal steps for permitting.
| PJ/ABE/ADD/CCS/AAN/NMW/CAE | Bisha_2016R&R-Update_TechRep_2CN010-024_20170808_aan_cae | August 2017 |
| SRK Consulting |
| NI 43-101 Technical Report Bisha Mine 2016, Eritrea | Page 234 |
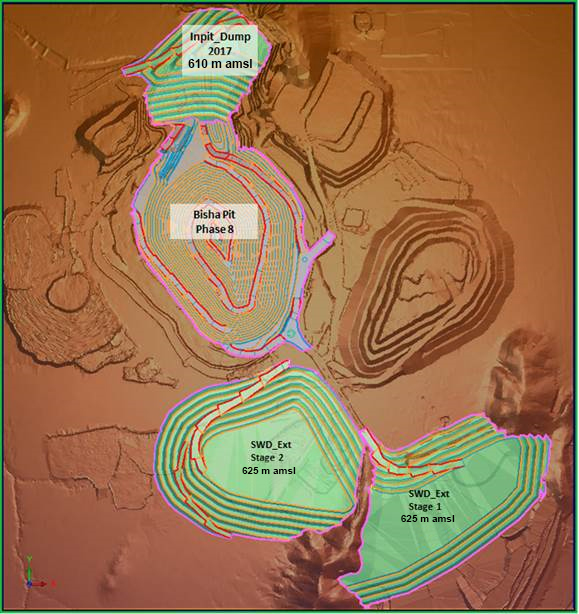
Source: BMSC, 2017
Figure 17.4: Layout of Bisha Main waste rock dumps
At the Harena Pit, there is presently an oxide waste dump immediately east of the pit and a small additional dump northwest of the pit. The pit will be expanded and the waste rock associated with that expansion will be placed in the Primary waste dump, as shown in Figure 17.5.
| PJ/ABE/ADD/CCS/AAN/NMW/CAE | Bisha_2016R&R-Update_TechRep_2CN010-024_20170808_aan_cae | August 2017 |
| SRK Consulting |
| NI 43-101 Technical Report Bisha Mine 2016, Eritrea | Page 235 |
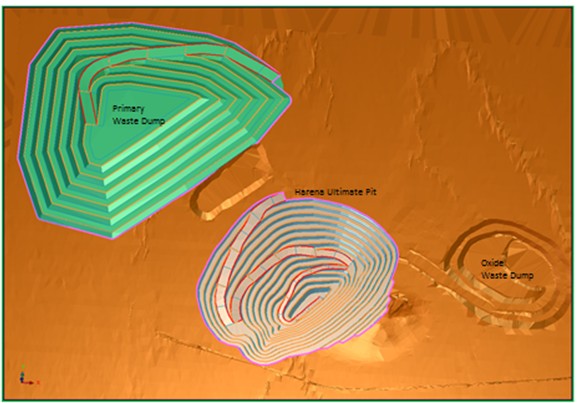
Source: BMSC, 2017
Figure 17.5: Layout of Harena waste rock dumps
Off-site Infrastructure
Off-site infrastructure has been established at the port of Massawa to support the export of copper and zinc concentrates. Rather than using a conventional bulk storage approach, requiring bulk concentrate storage, reclaim systems, travelling hopper, transfer tower, and shiploader, BMSC’s concentrate transport and storage approach uses the Rotainer® system. Concentrate is trucked in specially built, reusable intermodal containers from the Bisha Mine site to the port of Massawa, and stacked at the existing container facility. Container trucking is contracted and no specialised prime mover (truck) or trailer equipment is required. The copper concentrate containers are discharged into the bulk carriers using a crane equipped with Rotainer’s Lid-Lift equipment, which rotates the container a full 360° after lifting the lid. This system minimises material rehandle, allows blending on a container–by-container basis, and is reported to provide industry leading dust control.
Delivery to the mine operation of required operating consumables and fuel as well as delivery to the various smelters of mine produced concentrates is most often subject to third party contractors, be it land transport in country or sea freight to and from the ocean port. Largely there are many factors outside the control of Bisha, which can adversely affect the delivery of these key consumables or the export of these concentrates and cause delays or temporary stoppage in product movement.
| PJ/ABE/ADD/CCS/AAN/NMW/CAE | Bisha_2016R&R-Update_TechRep_2CN010-024_20170808_aan_cae | August 2017 |
| SRK Consulting |
| NI 43-101 Technical Report Bisha Mine 2016, Eritrea | Page 236 |
| 18 | Market Studies and Contracts |
The principal metals sold by the Bisha Mine are zinc, copper, gold and silver contained in zinc and copper concentrates, respectively.
For mine design and Mineral Reserve estimation, Bisha used the following commodity prices:
| | - Zinc at $1.00/lb
- Copper at $2.70/lb
- Silver at $18 per ounce
- Gold at $1,200 per ounce.
|
SRK reviewed long-term price forecasts and considers the selected prices to be reasonable.
Figure 18.1 shows copper prices from 2014 to 2016 for resource and reserves estimates reported in NI 43-101 compliant studies similar to the Bisha project.
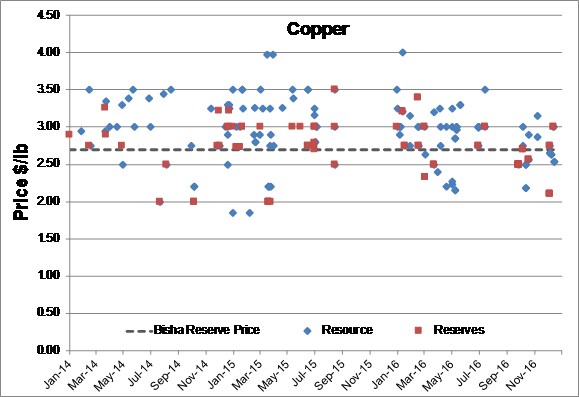
Source: SEDAR, Public Company Documents Search (2016)
Figure 18.1: Copper prices from NI 43-101 reports
| PJ/ABE/ADD/CCS/AAN/NMW/CAE | Bisha_2016R&R-Update_TechRep_2CN010-024_20170808_aan_cae | August 2017 |
| SRK Consulting |
| NI 43-101 Technical Report Bisha Mine 2016, Eritrea | Page 237 |

Figure 18.2: Zinc prices from NI 43-101 reports
The Bisha Mine project is strategically located in Eritrea (in northeastern Africa) which borders the Red Sea. BMSC has sold concentrates primarily to Chinese, Indian and European customers (both smelters and traders). BMSC has been selling copper concentrate since the second half of 2013 and zinc concentrate since the second half of 2016.
BMSC has negotiated separate off-take agreements with two smelters (in India and Europe) which cover the sale of estimated future copper concentrate production. The contract terms are typical of industry standard terms. To the extent these two smelters are unable or unwilling to accept the quality of copper concentrates being produced in the primary phase at the Bisha Mine, BMSC markets these off-spec copper concentrates to traders in the spot market at terms reflective of the qualities of these concentrates.
BMSC has not yet entered into any long term off-take commitments for its zinc concentrate production as it aims to take advantage of favourable conditions in the current market for zinc concentrates. These favourable conditions resulted from zinc concentrate shortages caused by publicised zinc mine closures and production cutbacks in 2016, and have continued into 2017 based on spot and benchmark treatment charges for zinc concentrates. BMSC has sold all of its zinc concentrates on the spot market at typical industry standard terms.
| PJ/ABE/ADD/CCS/AAN/NMW/CAE | Bisha_2016R&R-Update_TechRep_2CN010-024_20170808_aan_cae | August 2017 |
| SRK Consulting |
| NI 43-101 Technical Report Bisha Mine 2016, Eritrea | Page 238 |
BMSC has no other material contracts.
| PJ/ABE/ADD/CCS/AAN/NMW/CAE | Bisha_2016R&R-Update_TechRep_2CN010-024_20170808_aan_cae | August 2017 |
| SRK Consulting |
| NI 43-101 Technical Report Bisha Mine 2016, Eritrea | Page 239 |
| 19 | Environmental Studies, Permitting, and Social or Community Impact |
Summary
At this time, the Project has all necessary permits and authorisations to operate the mine.
Environmental issues identified in conjunction with the initial permitting process and ongoing regulatory oversight are being addressed by BMSC. Detailed monitoring plans are in place as part of the impact assessment process and to develop inputs to the final reclamation and closure of the site.
A conceptual closure and reclamation plan has been developed. The total reclamation cost is estimated at $40.0M, including administrative costs and a 15% contingency. BMSC has arranged an annually renewable environmental bond of $40M and, in accordance with International Financial Reporting Standards, has accrued $38.3M in its financial records as a provision for reclamation, remediation, and post-closure monitoring.
| 19.2 | Environmental Regulatory Framework |
The Eritrean Government’s mining legislation outlines two key provisions for EIAs on projects. A “Proclamation to Promote the Development of Mineral Resources”, No. 68/1995, Article 43 and the Regulations on Mining Operations, Legal Notice No. 19/1995, Article 5, both state that an EIA must be completed and submitted before a mining licence is granted. The “National Environmental Assessment Procedures and Guidelines, March 1999” (NEAPG) outlines the procedure for undertaking environmental assessments and clearance of projects. Approvals are the responsibility of the Department of Environment of the Ministry of Land, Water, and Environment.
The SEIA was conducted to comply with Eritrean requirements and with the International Finance Corporation Performance Standards on Social and Environmental Sustainability (IFC Performance Standards, April 2006) where the latter are more stringent or comprehensive than national requirements. As noted in Section 4.6, the SEIA report was submitted in December 2006 and following review by the appropriate Eritrean Government agencies, a Mining Licence was issued in May 2008, signifying that environmental approval had been granted. Subsequently, BMSC indicated that various environmental studies were proceeding in order to provide more information for the operational management of the Project, and an SEIA update was issued in early 2009. The update included more detail on the implementation of the social and environmental management plans that will manage the impact of the project and ensure employment of the proposed mitigation/enhancement measures.
Environmental baseline studies were performed as part of the SEIA process during 2006. Baseline studies were conducted for both Bisha and Harena projects and included the following:
| | - Atmospheric environment
- Noise
|
| PJ/ABE/ADD/CCS/AAN/NMW/CAE | Bisha_2016R&R-Update_TechRep_2CN010-024_20170808_aan_cae | August 2017 |
| SRK Consulting |
| NI 43-101 Technical Report Bisha Mine 2016, Eritrea | Page 240 |
| | - Terrain, soils, geology, soil chemistry and seismicity
- Vegetation
- Wildlife
- Hydrology
- Geohydrology
- Socioeconomic conditions
- Land use
- Archeology and cultural resources.
|
The key environmental issues assessed by the SEIA studies and addressed in Project associated risk assessments and the environmental management plan is as follows:
| | - Direct footprint disturbance of 442 ha (Bisha) and 200 ha (Harena) with associated potential for loss of land use, habitat, soils loss and drainage disturbance;
- Groundwater impacts from both extraction of Project supply water from new wells and excavation of an open pit;
- Water quality impacts arising from potential for ARD, including the need to ensure that there is no post-closure problems with water quality;
- Soil and water quality impacts arising from the storage and use on site of hazardous chemicals, including cyanide;
- Changes to local surface drainage patterns due to construction of a site surface water management system, including flood control and diversion works; and
- Air quality impacts, most significantly from surface haulage on unsealed roads.
|
The two main regulatory bodies related to environmental issues are the Mines department and the Impact Review Committee (IRC) which is made up of related ministries and departments (e.g. Health, Environment, Land, Agriculture). The IRC is responsible for reviewing the SEIA and making recommendations. In addition, they make regular site visits and review the quarterly reports prepared by BMSC. It is understood that the IRC is comforTable with the progress BMSC is making in relation to the SEIA, but have concerns over the following:
| | - Dust (in terms of both occupational health and the environment – still a concern despite significant improvements in 2016;
- Water – drawdown of the Mogoraib aquifer and efforts to manage this, plus water quality concerns related to surface and groundwater;
- Spills at the process plant – lack of tertiary containment to prevent runoff from escaping the site;
|
| PJ/ABE/ADD/CCS/AAN/NMW/CAE | Bisha_2016R&R-Update_TechRep_2CN010-024_20170808_aan_cae | August 2017 |
| SRK Consulting |
| NI 43-101 Technical Report Bisha Mine 2016, Eritrea | Page 241 |
| | - Management of industrial wastes – mainly related to hazardous waste such as waste oil, batteries, etc. but also on the disposal of non-hazardous wastes;
- Monitoring program – there are two major issues that are still not fully addressed, although significant progress has been made over the past two years;
- Rehabilitation and closure – concerns over the absence of a detailed rehabilitation plan, as well as progressive rehabilitation.
|
The Project has detailed monitoring plans for surface water, groundwater, ambient air quality (i.e. dust, SOx/NOx, GHG), soil/vegetation (potential dust contamination) and biodiversity. There are no points of compliance per se, but the mine licence boundary has generally been used for evaluating compliance.
The latest update to the conceptual closure and reclamation plan was recently completed (KP, 2016a). A summary of that plan is provided below.
Closure considered:
| | - TMF: a NAG cover will be placed to prevent erosion from wind and surface water run-off; tailings delivery pipelines, power lines, and associated infrastructure will be decommissioned, cleaned of potentially hazardous materials and removed from site; roads required to access the TMF will be decommissioned unless required to provide access for post-closure inspection, maintenance, and monitoring.
- WRFs: at closure the final slopes will be no steeper than 3:1; a NAG cover will be placed to prevent erosion from wind and surface water run-off; the cover will be revegetated; drainage from both of the WRFs will be directed towards the open pit through lined channels.
- Open pit: a pit lake will develop upon cessation of operations, and a preliminary estimate of water quality was developed to support the closure plan; it is still under review but the current closure option for the Bisha Main pit is to berm the pit and monitor the water quality during filling to identify any potential risk to avian life during this time; man-made equipment and materials (e.g., mining equipment, dewatering apparatus, cables) with salvage value will be removed from the open pit; materials and equipment with no salvage value will be cleaned of any potentially hazardous substances and disposed of in the open pit or in the non-hazardous landfill; access into the open pit will be blocked by installation of a rock boulder barrier across the access ramp/s into the pit. At closure, a security fence or an earthwork berm, or a combination of both, will be constructed.
- Process plant: demolition and removal of equipment and structures to leave the property in an environmentally sound condition that will sustain accepted post-closure land uses; as part of demolition of the process plant infrastructure, allowance is made for the handling and disposal of potentially hazardous materials (e.g., hydraulic oil, gasoline, etc.) encountered during the dismantling process. Non-hazardous debris will be disposed of within the open pit or in the non-hazardous landfill. Potentially hazardous materials will be properly containerised and shipped offsite for recycling or disposal at an approved facility.
|
| PJ/ABE/ADD/CCS/AAN/NMW/CAE | Bisha_2016R&R-Update_TechRep_2CN010-024_20170808_aan_cae | August 2017 |
| SRK Consulting |
| NI 43-101 Technical Report Bisha Mine 2016, Eritrea | Page 242 |
| | - Power station: since the power generating plant is owned by Aggreko with offtake contractual agreements with BMSC, pre-closure negotiations will be undertaken to determine whether local communities or the District Administrator is interested in assuming operational control post-closure; if not, the plant will be decommissioned and removed, contaminated soils will identified and disposed of as hazardous materials.
- Ancillary facilities: will be decommissioned, cleaned, and removed from site following similar procedures to those envisaged for the plant; equipment and building systems will be inspected and cleaned of potentially hazardous materials; if practicable, materials will be salvaged, otherwise the facilities will be demolished and the debris will be disposed of in the open pit or in the non-hazardous land fill.
- Roads: The main access road to the mine site and any other onsite access roads will be left in place for a minimum period of five years post-closure, to allow access to the site for post- closure maintenance and monitoring activities; roads that are no longer required will be permanently decommissioned.
- Watercourses: the Freketetet River diversion will be maintained to divert seasonal surface water away from the pit lake.
- Port infrastructure: the port belongs to the Government of Eritrea and is therefore exempt from activities related to the closure plan.
|
Closure and post-closure monitoring will document the progress of the closure and reclamation effort. The elements of these monitoring programs will include:
| | - Inspection of the physical conditions (e.g., for evidence of erosion and landslides) at the end of the initial rainy season post-closure
- Inspection of the plantings after the first year post-closure
- After two years, evaluation of the effectiveness of the reclamation effort (e.g., number and type of plant species, plant heights, productivity)
- Demonstration that water quality objectives are met
- Assessment of the adequacy and performance of drainage structures and sediment control systems
|
Closure and post-closure monitoring and control programs will be conducted twice per year (dry and wet seasons) for a period of five years after closure has been completed. In the event that deficiencies in vegetation establishment are identified, appropriate mitigation measures will be taken to correct these deficiencies.
Final reclamation of the pit, waste rock facilities, yards, ROM pad and roads is estimated to cost approximately $7.5M. Reclamation of the TMF, which includes the costs for the placement of a 40 cm cover and the closure spillway, is estimated to be approximately $5.3M. Revegetation is estimated to be approximately $1.3M.
No salvage credits have been assumed for the closure costing.
| PJ/ABE/ADD/CCS/AAN/NMW/CAE | Bisha_2016R&R-Update_TechRep_2CN010-024_20170808_aan_cae | August 2017 |
| SRK Consulting |
| NI 43-101 Technical Report Bisha Mine 2016, Eritrea | Page 243 |
Demolition and reclamation of the plant and other infrastructure is estimated to be approximately $4.6M. Closure and post closure monitoring costs for a period of ten years (five years of TMF drain-down and five years of post-closure monitoring) is estimated at $0.5M.
The total reclamation cost is estimated at $40.0M including administrative costs and a 15% contingency. A review of that plan suggests that several important closure steps are missing, specifically a cover and final landform study for the waste dumps, a cover study for the TSF and the development of a social closure plan for the nearby communities. The cost of these studies amounts to approximately $0.3M.
Consistent with this closure cost estimate, Nevsun (2017) confirmed that BMSC has arranged an annually renewable environmental bond of $40.0M at a cost of 1% per annum. BMSC, in accordance with International Financial Reporting Standards, has accrued $38.3M in its financial records as of 31 March 2017, as a provision for reclamation, remediation, and post-closure monitoring.
The Bisha Project SEIA and Harena Project SEIA Addendum were conducted to comply with Eritrean requirements and with the International Finance Corporation Performance Standards on Social and Environmental Sustainability (IFC Performance Standards, April 2006) where the latter are more stringent or comprehensive than national requirements. As noted in Section 3.6, the Bisha SEIA report was submitted in December 2006 and following review by the appropriate Eritrean Government agencies, a Mining Licence was issued in May 2008, signifying that environmental approval had been granted. Subsequently, BMSC indicated that various environmental studies were proceeding in order to provide more information for the operational management of the Project, and an SEIA update was issued in early 2009. Subsequent to this, the Social and Environmental Management Plans have been developed and accepted by the Ministry of Environment. This document is considered “live” and undergoes regular review and updates, the latest having been during 2013.
The Harena SEIA Addendum was submitted December 2011 with the mining licence granted in July 2012.
At this time, the Project has all necessary permits and authorisations to operate the mine.
| 19.6 | Considerations of Social and Community Impacts |
Since exploration and environmental baseline data collection began, considerable effort was spent developing support for the Project by fostering local relationships, developing a strong local workforce, educating stakeholders about the Project and mining in general and providing stakeholders with regular Project updates and, where appropriate, site visits. BMSC has been successful in these efforts.
The key socio-economic issues assessed by the SEIA study and addressed in the proposed social management and related plans are as follows:
| PJ/ABE/ADD/CCS/AAN/NMW/CAE | Bisha_2016R&R-Update_TechRep_2CN010-024_20170808_aan_cae | August 2017 |
| SRK Consulting |
| NI 43-101 Technical Report Bisha Mine 2016, Eritrea | Page 244 |
| | - Direct footprint disturbance of 737.4 ha with associated potential for displacement of people and their customary use of the land (although it is noted that the affected area is sparsely populated and only lightly used)
- Influx of people seeking employment with associated potential issues, including pressure on existing social infrastructure
- Inward investment and creation of direct and indirect employment opportunity
- To 31 December 2016, the total land rehabilitated was 73.6 ha, including initial rehabilitation (14.5ha) and offset biodiversity planting (59.1 ha)
|
| PJ/ABE/ADD/CCS/AAN/NMW/CAE | Bisha_2016R&R-Update_TechRep_2CN010-024_20170808_aan_cae | August 2017 |
| SRK Consulting |
| NI 43-101 Technical Report Bisha Mine 2016, Eritrea | Page 245 |
| 20 | Capital and Operating Costs |
All cost estimates are shown in “real” 2017 US dollars and, no escalation has been applied to either operating or capital costs. The operating and capital costs are based on BMSC’s 2017 budget.
It is assumed that Harena mine would operate under similar conditions as Bisha Main, using the same mining equipment and no processing plant modifications would be required for Harena ore.
Labour rates reflect current staffing and labour rates at the mine site, as used in the BMSC 2017 budget. The diesel price used for 2017 budget cost estimation is $0.55/L, delivered to site, and the cost of electricity is $0.24 per kW/hr. A summary of operating cost estimates for the Bisha project is shown in Table 20.1.
Table 20.1: Bisha LOM site operating cost summary
| | Description | LOM Total
($M) | 2017
($M) | 2018
($M) | 2019
($M) | 2020
($M) | 2021
($M) |
| | Open Pit Mining | 196 | 43 | 52 | 56 | 35 | 9 |
| | Processing | 167 | 34 | 38 | 36 | 37 | 22 |
| | Power Cost | 98 | 20 | 22 | 21 | 22 | 13 |
| | General and Administrative | 119 | 25 | 25 | 25 | 25 | 19 |
| | Total Operating Cost | 579 | 122 | 137 | 139 | 119 | 63 |
All units of production for copper and zinc circuits are built and functioning as of December 2016. However, to maintain the production rate at 2.4 Mt per year, Bisha needs to spend additional capital, particularly in 2017, decreasing gradually to the end of mine life. Due to higher mining rates in the new production plans the mining fleet will be expanded. The mill is in relatively good condition, hence the requirement for low sustaining capital.
Table 20.2 lists the total sustaining capital requirements for the Bisha operation. Closure costs are estimated at $40M.
Table 20.2: LOM sustaining capital cost estimate
| | Category | Cost
($M) |
| | Mining equipment | 35 |
| | Processing plant | 4 |
| | Tailing dam | 14 |
| | Technical and engineering | 9 |
| | Total | 62 |
| PJ/ABE/ADD/CCS/AAN/NMW/CAE | Bisha_2016R&R-Update_TechRep_2CN010-024_20170808_aan_cae | August 2017 |
| SRK Consulting |
| NI 43-101 Technical Report Bisha Mine 2016, Eritrea | Page 246 |
| 20.2.1 | Open Pit Capital Costs |
The Bisha Mine currently has a fleet of 27 65-tonne trucks, five shovels and excavators and eight drills (including two grade control and one horizontal drill rigs). Over the last few years, an average annual rate of total material moved at Bisha was approximately 15 Mt, which is equivalent to approximately 3.75 Mt per quarter. The forecast for 2017 requires total material movement of 18 Mt. Based on the new production schedule, starting from 2018 Q3, the mine will need to move up to 6 Mt per quarter. A thorough analysis has been done to estimate the remaining equipment life and calculate the capital requirements for purchasing or refurbishing the equipment. Table 20.3 shows the capital cost estimate for technical services and the engineering department. Major purchase of prime excavators and dump trucks scheduled in 2017 is estimated at $29M. Note that some items listed in the equipment purchase schedule are for major maintenance and refurbishment rather than new purchases.
This includes, cost of studies, light vehicles, computers, communications and other materials.
Table 20.3: Mining equipment purchase schedule ($M)
| | Type of Equipment | Total | 2017 | 2018 | 2019 | 2020 | 2021 |
| | D&B Rig DML | 3.3 | 3.3 | | | | |
| | DT 775 | 8.3 | 8.3 | | | | |
| | Tracked Dozer D10 | 2.7 | 2.7 | | | | |
| | Front-end Loader 990 | 1.9 | 1.9 | | | | |
| | 966 Loader | 0.5 | | | 0.5 | | |
| | Grader CAT 16M | 1.8 | 0.9 | | | 0.9 | |
| | Prime Excavators | 10.0 | 6.2 | 3.8 | | | |
| | Dewatering Pumps | 0.3 | 0.0 | 0.0 | 0.3 | | |
| | 320 Excavators | 0.4 | 0.2 | | 0.2 | | |
| | MMU Truck | 0.7 | 0.7 | | | | |
| | Water Cart Heavy Duty | 0.5 | 0.0 | 0.5 | | | |
| | Lighting Plants | 0.2 | 0.2 | | | | |
| | Tow truck/Low-bed | 1.0 | 1.0 | | | | |
| | Service Trucks | 0.5 | 0.5 | | | | |
| | Light vehicles | 0.5 | 0.3 | 0.2 | | | |
| | Other | 2.3 | 2.3 | | | | |
| | Total mining equipment | 35.0 | 28.6 | 4.4 | 1.1 | 0.9 | |
| | Technical services | 8.3 | 4.2 | 0.9 | 0.2 | 2.1 | 1.0 |
| 20.2.2 | Processing Capital Costs |
With the BMSC Phase III expansion completed in 2016, plans for capital cost expenditures are relatively minor in the near term. For 2017, $1.8M is budgeted for minor modifications and capital maintenance, including:
| PJ/ABE/ADD/CCS/AAN/NMW/CAE | Bisha_2016R&R-Update_TechRep_2CN010-024_20170808_aan_cae | August 2017 |
| SRK Consulting |
| NI 43-101 Technical Report Bisha Mine 2016, Eritrea | Page 247 |
| | - Replacement/rehabilitation of the water distribution system
- Upgrade of water treatment facility for TMF water recycle
- Repair/replacement of tanks, hoppers, mix tanks, etc.
- Repair/replacement of dust suppression systems in crushing area
- Phase III redesign of pumps, piping changes and new reagent dosing points.
|
Table 20.4 shows the budgeted sustaining capital for the next four years for the TMF dam raise as well as the process plant. A total of $8.3M is planned for the plant including $6.5M in 2021 to recommission the CIL circuit for processing of Oxide stockpiles.
Table 20.4: Processing plant sustaining capital
| | Item | Total
($M) | 2017
($M) | 2018
($M) | 2019
($M) | 2020
($M) |
| | TMF Dam Raise Costs | 14.3 | 10.1 | - | 1.0 | 3.2 |
| | Mill Sustaining Capex | 4.2 | 1.8 | 1.2 | 0.5 | 0.6 |
| 20.2.3 | Tailings Management Facility and Closure Costs |
The tailings dam is nearing its current limit. It is planned to raise the tailing dam in 2017 which is estimated at $10.1M. A new study has been done for the closure plan in 2016 (Knight Piésold, 2015), in which closure costs were estimated at $40.0M.
| 20.3.1 | Open Pit Operating Costs |
The reference mining operating cost is set at $2.27 per tonne of ore and waste mined. This is for bench 540 m amsl where the main haul road reaches the surface. Any additional cost for mining ore such as re handle cost and sampling has been applied to the milling cost. For every 5 m bench an additional $0.15 is added to the reference mining cost. The average mining cost for the life of mine is estimated at $2.49/t material moved.
Maintenance that includes parts and labour is the biggest item in mining operating cost. In the past three years, Bisha has shown that it is working toward reducing its costs. Maintenance is one of the areas with potential to save on operating costs.
There is a potential for opening a new waste dump in the west of the pit (closer to the pit rim) which would result in reduction of the haulage cost.
Unit mine operating cost by function is shown in Table 20.5.
| PJ/ABE/ADD/CCS/AAN/NMW/CAE | Bisha_2016R&R-Update_TechRep_2CN010-024_20170808_aan_cae | August 2017 |
| SRK Consulting |
| NI 43-101 Technical Report Bisha Mine 2016, Eritrea | Page 248 |
Table 20.5: Mine operating costs
| | Item | LOM Average
($/t mined) | Proportion |
| | Drilling and blasting | $0.47 | 20.6% |
| | Loading and haulage | $0.57 | 25.0% |
| | Maintenance | $1.03 | 45.2% |
| | Engineering and supervisory | $0.09 | 3.8% |
| | Mine geology | $0.12 | 5.4% |
| | Total mining cost | $2.27 | 100% |
| 20.3.2 | Processing Operating Costs |
For 2017 and onwards, it is assumed that the process operating costs will be maintained at a similar level to what has been achieved since the Phase III expansion commissioning in June 2016, at approximately $26/t.
A significant portion of the allocated process costs is from power generation. The budgeted process operating cost for the remainder of 2017 is shown in Figure 20.1, with power steady at $10/t and consumable, maintenance and labour adding up to around $17/t by the end of the year. The total process operating cost for 2017 is expected to average $28/t.
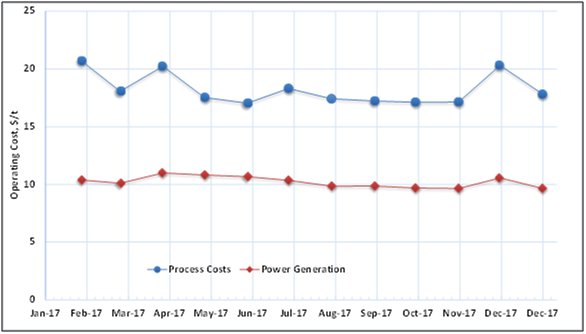
Source: SRK, 2017
Figure 20.1: Budgeted process plant operating costs for 2017
| PJ/ABE/ADD/CCS/AAN/NMW/CAE | Bisha_2016R&R-Update_TechRep_2CN010-024_20170808_aan_cae | August 2017 |
| SRK Consulting |
| NI 43-101 Technical Report Bisha Mine 2016, Eritrea | Page 249 |
21 Economic Analysis
The economic analysis of the Bisha Mine was undertaken using a Discounted Cash Flow (DCF) model in Microsoft Excel®. The model used real (constant) 2017 US dollars ($) as the primary currency. The model used mid-period annual discounting at a base-case discount rate of 10% and a valuation date of 31 December 2016.
The model provided key project values for pre-tax and post-tax NPV on a go forward basis. Capital costs prior to 1 January, 2017 and debt financing are excluded from the analysis. Sunk costs and interest payments are not considered.
The sensitivity analysis included overall operating and capital expenditures and base metal commodity prices.
The analysis demonstrated the Bisha Mine was economically viable from a post-tax discounted cash flow perspective.
| 21.2 | Financial Model Inputs |
| 21.2.1 | Production Schedule |
An open pit production schedule was developed on a quarterly basis with an aim to meet a mill production rate of about 2,400 ktpa and is described in detail in Section 18. Table 21.1 shows an annual summary production schedule by ore type and grade.
As described in Section 16, the mine produces copper and zinc concentrates. Terms and conditions of concentrate sales are summarised in Section 18. Table 21.2 shows summary LOM (payable) copper and zinc production, treatment and refining charges, royalty expense and revenue.
Base commodity prices are as follows:
| | - Zinc at $1.00 per pound
- Copper at $2.70 per pound
- Silver at $18.00 per troy ounce
- Gold at $1,200 per troy ounce.
|
| PJ/ABE/ADD/CCS/AAN/NMW/CAE | Bisha_2016R&R-Update_TechRep_2CN010-024_20170808_aan_cae | August 2017 |
| SRK Consulting |
| NI 43-101 Technical Report Bisha Mine 2016, Eritrea | Page 250 |
Table 21.1: Summary LOM production schedule
| | Parameter | Units | Total | 2017 | 2018 | 2019 | 2020 | 2021 |
| | OPEN PIT | | | | | | | |
| | Open Pit Material Moved | ktonnes | 77,785 | 17,996 | 21,026 | 22,557 | 13,712 | 2,495 |
| | Open Pit Waste | ktonnes | 68,194 | 16,054 | 18,859 | 20,480 | 11,573 | 1,229 |
| | | | | | | | | |
| | Supergene Ore Mined | ktonnes | 12 | 12 | 0 | 0 | 0 | 0 |
| | Run-of-mine Zinc Grade | % | 0.11% | 0.11% | 0.00% | 0.00% | 0.00% | 0.00% |
| | Run-of-mine Copper Grade | % | 2.56% | 2.56% | 0.00% | 0.00% | 0.00% | 0.00% |
| | Run-of-mine Silver Grade | g/t | 17.28 | 17.28 | 0.00 | 0.00 | 0.00 | 0.00 |
| | Run-of-mine Gold Grade | g/t | 0.71 | 0.71 | 0.00 | 0.00 | 0.00 | 0.00 |
| | | | | | | | | |
| | Primary Ore Mined | ktonnes | 9,579 | 1,930 | 2,168 | 2,077 | 2,139 | 1,266 |
| | Run-of-mine Zinc Grade | % | 6.16% | 7.35% | 7.30% | 6.34% | 5.31% | 3.53% |
| | Run-of-mine Copper Grade | % | 1.05% | 1.12% | 1.17% | 1.11% | 1.01% | 0.70% |
| | Run-of-mine Silver Grade | g/t | 44.91 | 49.68 | 53.54 | 48.82 | 40.13 | 24.55 |
| | Run-of-mine Gold Grade | g/t | 0.68 | 0.74 | 0.74 | 0.73 | 0.63 | 0.50 |
| | | | | | | | | |
| | Total Mill Feed | ktonnes | 9,591 | 1,942 | 2,168 | 2,077 | 2,139 | 1,266 |
| PJ/ABE/ADD/CCS/AAN/NMW/CAE | Bisha_2016R&R-Update_TechRep_2CN010-024_20170808_aan_cae | August 2017 |
| SRK Consulting |
| NI 43-101 Technical Report Bisha Mine 2016, Eritrea | Page 251 |
Table 21.2: Summary LOM revenue
| | Item | Units | Total | 2017 | 2018 | 2019 | 2020 | 2021 |
| | Copper Concentrate | | | | | | | |
| | Quantity Produced | ktonnes | 346 | 77 | 89 | 77 | 74 | 30 |
| | Payable Metals Contained | | | | | | | |
| | Copper | ktonnes | 69 | 15 | 17 | 15 | 16 | 7 |
| | Silver | kounces | 3,315 | 753 | 906 | 713 | 683 | 260 |
| | Gold | kounces | 35 | 6 | 7 | 6 | 9 | 7 |
| | | | | | | | | |
| | Revenue from Payable Metal | $M | 511 | 108 | 125 | 107 | 115 | 56 |
| | | | | | | | | |
| | Zinc Concentrate | | | | | | | |
| | Quantity Produced | ktonnes | 921 | 219 | 244 | 203 | 180 | 76 |
| | Payable Metals Contained | | | | | | | |
| | Zinc | ktonnes | 391 | 93 | 103 | 86 | 76 | 32 |
| | Silver | kounces | 656 | 156 | 174 | 145 | 128 | 54 |
| | | | | | | | | |
| | Revenue from Payable Metal | $M | 874 | 207 | 231 | 192 | 171 | 72 |
| | | | | | | | | |
| | Revenue from Payable Metal | $M | 1,385 | 316 | 356 | 299 | 286 | 128 |
| | Note: no payables are assumed for gold in zinc concentrate. Details on treatment and refining charges are outlined in Section 18 of this report. |
| PJ/ABE/ADD/CCS/AAN/NMW/CAE | Bisha_2016R&R-Update_TechRep_2CN010-024_20170808_aan_cae | August 2017 |
| SRK Consulting |
| NI 43-101 Technical Report Bisha Mine 2016, Eritrea | Page 252 |
| 21.1 | Cost Estimates Summary |
Capital cost estimates for open pit expansion and processing facilities are discussed in Section 20.2 while operating cost estimates are discussed in Section 20.3.
Open pit expansion and processing plant improvement capital cost estimates as of 1 January, 2017, including closure costs, total $102M as shown in Table 21.3.
Closure costs are estimated at $40M.
Table 21.3: Total project capital expenditures including mine closure
| | Category | Cost
($M) |
| | Mining equipment | 35 |
| | Mill improvement and sustaining | 4 |
| | TMF dam raise costs | 14 |
| | Technical and engineering | 9 |
| | Total Capital Costs | 62 |
Total project operating cost estimates are $1,195M as summarised in Table 21.4. LOM costs per tonne of ore processed are presented in Table 21.5.
Table 21.4: Total project operating expenditures
| | Description | Total
($M) | 2017
($M) | 2018
($M) | 2019
($M) | 2020
($M) | 2021
($M) |
| | Open Pit Mining | 196 | 43 | 52 | 56 | 35 | 9 |
| | Processing | 167 | 34 | 38 | 36 | 37 | 22 |
| | Power | 98 | 20 | 22 | 21 | 22 | 13 |
| | General & Administrative | 119 | 25 | 25 | 25 | 25 | 19 |
| | Total Operating Cost | 579 | 122 | 137 | 139 | 119 | 63 |
Table 21.5: LOM average cost per tonne of ore
| | Description | LOM Average | 2017 | 2018 | 2019 | 2020 | 2021 |
| | ($/tmilled) | ($/tmilled) | ($/tmilled) | ($/tmilled) | ($/tmilled) | ($/tmilled) |
| | Open Pit Mining | 20.38 | 22.31 | 23.99 | 27.11 | 16.17 | 7.34 |
| | Processing | 17.44 | 17.44 | 17.44 | 17.44 | 17.44 | 17.44 |
| | Power Cost | 10.21 | 10.21 | 10.21 | 10.21 | 10.21 | 10.21 |
| | General and Administrative | 12.38 | 12.87 | 11.53 | 12.04 | 11.69 | 14.81 |
| | Total Unit Operating Cost | 60.41 | 62.83 | 63.17 | 66.80 | 55.51 | 49.80 |
| PJ/ABE/ADD/CCS/AAN/NMW/CAE | Bisha_2016R&R-Update_TechRep_2CN010-024_20170808_aan_cae | August 2017 |
| SRK Consulting |
| NI 43-101 Technical Report Bisha Mine 2016, Eritrea | Page 253 |
| 21.2 | Taxation and Royalties |
The applicable royalty rate and the estimated LOM royalty expense is shown in Table 21.6.
Table 21.6: LOM royalty estimate
| | Commodity | % rate | LOM Royalty
($M) |
| | Zinc | 3.5% | 36 |
| | Copper | 3.5% | 15 |
| | Silver | 5.0% | 7 |
| | Gold | 5.0% | 7 |
| | Total Royalty Estimate | | 64 |
The corporate income tax rate for mining companies in Eritrea is 38%.
| 21.3 | Summary of Base Case Input Parameters and Results |
The primary economic evaluation measures used were total LOM cash flow, NPV of this cash flow at a 10% discount rate, the internal rate of return of the project cash flows, and the payback period on a non-discounted basis. Table 21.7 summarises the high level economic outputs from the modelling.
Table 21.7: Project key performance indicators
| | Item | Units | Value |
| | Production | | |
| | Total Ore Milled | ktonnes | 9,591 |
| | Payable Metals Produced | | |
| | Zinc | ktonnes | 391 |
| | Copper | ktonnes | 69 |
| | Silver | kounces | 3,971 |
| | Gold | kounces | 35 |
| | Revenue | | |
| | Revenue from Payable Metal | $M | 1,385 |
| | Costs | | |
| | Operating Cost | $M | 579 |
| | Capital Cost | $M | 62 |
| | Mine Closure Cost | $M | 40 |
Sensitivity analyses have been conducted to determine the effect on post-tax NPV10% of changes to base metal commodity prices and overall operating and capital costs. A summary of these sensitivity analyses expressed in percentage terms versus central estimate is shown in Table 21.9.
| PJ/ABE/ADD/CCS/AAN/NMW/CAE | Bisha_2016R&R-Update_TechRep_2CN010-024_20170808_aan_cae | August 2017 |
| SRK Consulting |
| NI 43-101 Technical Report Bisha Mine 2016, Eritrea | Page 254 |
Table 21.8: NPV sensitivity to changing base commodity prices (Zn, Cu) and cost estimates
| | | | | Base Metal Prices ($/lb) |
| | | | Zn | $0.70 | $0.80 | $0.90 | $1.00 | $1.10 | $1.20 | $1.30 |
| | | | Cu | $1.89 | $2.16 | $2.43 | $2.70 | $2.97 | $3.24 | $3.51 |
| | | | | -30% | -20% | -10% | 0% | 10% | 20% | 30% |
| | Operating and Capital Costs ($M) | $375 | -45% | 85% | 127% | 169% | 211% | 253% | 295% | 337% |
| | $477 | -30% | 48% | 90% | 132% | 174% | 216% | 258% | 300% |
| | $579 | -15% | 11% | 53% | 95% | 137% | 179% | 221% | 263% |
| | $682 | 0% | -35% | 16% | 58% | 100% | 142% | 184% | 226% |
| | $784 | 15% | -93% | -26% | 21% | 63% | 105% | 147% | 189% |
| | $886 | 30% | -151% | -82% | -18% | 26% | 68% | 110% | 152% |
| | $988 | 45% | -209% | -140% | -72% | -12% | 31% | 73% | 115% |
| | $1,090 | 60% | -267% | -198% | -130% | -61% | -7% | 36% | 78% |
| | $1,159 | 70% | -305% | -237% | -168% | -100% | -36% | 11% | 53% |
This shows the project is more sensitive to changes in base commodity prices, particularly zinc price, than it is to changes in capital and operating costs.
| PJ/ABE/ADD/CCS/AAN/NMW/CAE | Bisha_2016R&R-Update_TechRep_2CN010-024_20170808_aan_cae | August 2017 |
| SRK Consulting |
| NI 43-101 Technical Report Bisha Mine 2016, Eritrea | Page 255 |
Andiamo Exploration Limited, a private UK company has been exploring the Haykota licence area to the southwest of Bisha since 2009. The Andiamo deposits ae shown in Figure 22.1.
Haykota is along strike of the Asheli deposit, and Andiamo’s licence covers an area of 351 km2 that is prospective for precious metal and VMS mineralisation. Over 30 geophysical targets have been identified to date. Exploration work completed to date includes mapping, sampling, trenching and diamond drilling.
At the Yacob Dewar project, an oxide gold deposit overlies an oxide copper deposit. Diamond drilling has defined a JORC compliant gold resource of Indicated 880,000t @ 2.82 g/t Au and Inferred 60,000 t @ 2.37 g/t Au; additionally, there is an oxide copper resource of Indicated 1,400,000 t @ 0.37% Cu and Inferred 3,850,000 t @ 0.43% Cu. Metallurgical tests of cyanide leaching returned greater than 90% recovery. Andiamo intends to complete technical and economic work and to apply for a mining licence.
At the Hoba project, a VMS lens about 30 m thick was discovered in 2015 with copper and gold mineralisation overlying a sulphide stringer zone. Limited drilling has returned a best result of 28 m downhole at 0.8% Cu.
At the Shambotai project, extensive artisanal gold workings cover two soil anomalies 1.5 km by 0.5 km and 0.8 km by 0.5 km in area coincident geophysical anomalies. Limited drilling has returned a best result of 36 m downhole at 0.5 g/t Au.
| PJ/ABE/ADD/CCS/AAN/NMW/CAE | Bisha_2016R&R-Update_TechRep_2CN010-024_20170808_aan_cae | August 2017 |
| SRK Consulting |
| NI 43-101 Technical Report Bisha Mine 2016, Eritrea | Page 256 |
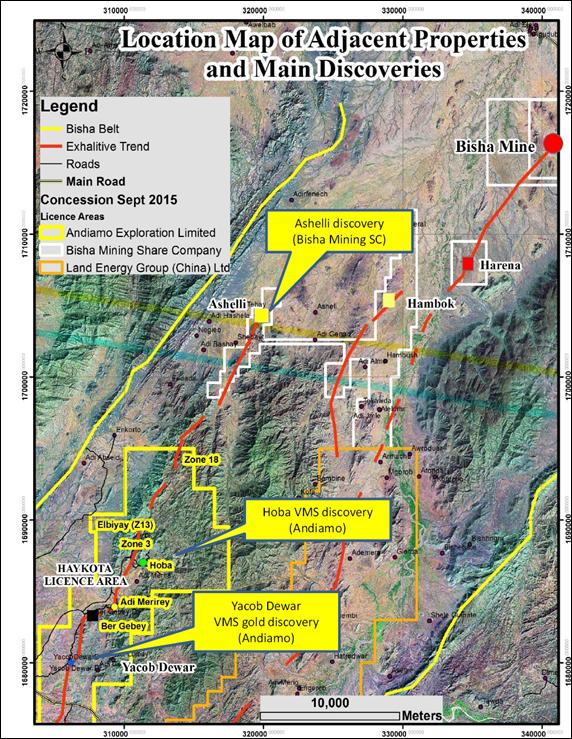
Source: AGP, 2014
Figure 22.1: Andiamo Exploration Limited Haykota project with main discoveries
| PJ/ABE/ADD/CCS/AAN/NMW/CAE | Bisha_2016R&R-Update_TechRep_2CN010-024_20170808_aan_cae | August 2017 |
| SRK Consulting |
| NI 43-101 Technical Report Bisha Mine 2016, Eritrea | Page 257 |
| 23 | Other Relevant Data and Information |
In addition to the mineral reserves defined at Bisha Main pit and Harena pit, SRK investigated the opportunity to exploit the resources located below the ultimate (reserve) pits using underground mining techniques.
The mine plans for Bisha and Harena underground are based on the same resource models as those used for the Bisha Main and Harena open pits, but do not include any mineralisation already included in the mineral reserve estimates.
Although this Preliminary Economic Assessment (PEA) exploits the mineral resource that has not be captured by the open pit reserves, the mineralised material and contained metal reported in this PEA must not be added to the open pit reserves nor used to infer an overall mine strategy.
The proposed underground PEA is based on an eight year LOM mine plan at Bisha and about eleven years at Harena, with an overlapping production of seven years. The combined estimated capital requirement for development of the two underground projects is approximately $265M including sustaining capital for the processing plant and TMF expansion.
The proposed underground operations would generate approximately three billion dollars in revenue, combined, before treatment/refining charges and royalty payments, and result in the post-tax NPV10% of approximately $84M.
This preliminary economic assessment is preliminary in nature, and includes inferred mineral resources that are considered too geologically speculative to have the economic considerations applied to them that would enable them to be categorised as mineral reserves, and there is no certainty that the preliminary economic assessment will be realised.
It is important to note that the mineralised quantities presented in schedules in this PEA must not be added to the Reserves that are disclosed in the rest of the report.
The geology applicable to the underground PEA is discussed in Sections 6 and 7 of this technical report.
| 23.1.2 | Geotechnical Engineering and Mining Method Selection |
The geotechnical assessment for the underground mining evaluation of Bisha Main UG and Harena UG is based on geotechnical mapping in the Bisha Main pit recently completed by SRK (SRK, 2017) and data collected during open pit mining operations by BMSC and other consultants.
| PJ/ABE/ADD/CCS/AAN/NMW/CAE | Bisha_2016R&R-Update_TechRep_2CN010-024_20170808_aan_cae | August 2017 |
| SRK Consulting |
| NI 43-101 Technical Report Bisha Mine 2016, Eritrea | Page 258 |
| 23.2 | Bisha Main Underground |
The Bisha deposit is a continuous series of massive sulphide lenses that trend north-south and generally dip 60º to 80º to the west over a strike length of about 550 m. The lenses vary in thickness from 2.5 m to 70 m. Mineralisation extended to a depth of ~ 500 m below surface (~ 300 m below the open pit) and has been closed off.
The ore is a primary massive sulphide, with zinc grade dominating. A zone of stringer sulphides with low-grade copper is present in the footwall of the primary massive sulphides. Metal grades within the higher-grade sulphide zone are consistent along dip and strike.
The mineralised envelopes for Bisha are presented in Figure 23.1 and Figure 23.2, at a cut-off grade of NSR = $70/t.

Note: Blocks are shown with a filter of NSR>$70/t. Looking west.
Figure 23.1: Bisha Main orebody long section
| PJ/ABE/ADD/CCS/AAN/NMW/CAE | Bisha_2016R&R-Update_TechRep_2CN010-024_20170808_aan_cae | August 2017 |
| SRK Consulting |
| NI 43-101 Technical Report Bisha Mine 2016, Eritrea | Page 259 |

Note: Blocks are shown with a filter of NSR>$70/t. Looking north at 1715500N and 1715300N)
Figure 23.2: Bisha Main orebody – cross sections
There is no evidence to indicate that groundwater inflows would cause difficulty.
An analysis on wedge formation from discontinuities was conducted using RocScience’s UNWEDGE software (RocScience, 2011). Four prominent joint sets in Bisha Main and Harena were considered in the assessment.
A larger wedge (~100 m3) may develop in the stope backs at Bisha. However, as a general finding, wedges in the hanging wall, footwall and vertical ends are not material to the excavation design and are not considered to significantly impact stability or dilution. Stope back and development support recommendations are based on engineering judgement and the empirical support design approaches after Grimstead and Barton (1993). The Excavation Support Ratio (ESR) is set to 3.0 for stope backs and 1.6 for man-entry development. Support recommendations by geotechnical domain are presented in Table 23.1. Intersections up to 8 m in diameter may be managed with basic pattern support. Intersections should be avoided in fault and FW/HW distal domains.
| PJ/ABE/ADD/CCS/AAN/NMW/CAE | Bisha_2016R&R-Update_TechRep_2CN010-024_20170808_aan_cae | August 2017 |
| SRK Consulting |
| NI 43-101 Technical Report Bisha Mine 2016, Eritrea | Page 260 |
Table 23.1: Bisha Main UG and Harena UG - ground support recommendations
| | Domain (span) | Ground Support Recommendations |
| | Bisha Main Underground | Harena Underground |
| | HW/FW Proximal
(5.5 mW x 5.0 mH) | Back/sidewalls:
• 4.1 mm wire mesh, 100 mm aperture
• If required: unreinforced shotcrete up to 4 cm |
| | HW Distal
(5.5 mW x 5.0 mH) | Back/sidewalls:
• 2.0 m long bolts on 1.0 m x 1.0 m spacing
• 4.1 mm wire mesh, 100 mm aperture
• If required: unreinforced shotcrete 4 to 10 cm |
| | FW Distal
(5.5 mW x 5.0 mH) | Back/sidewalls:
• 2.0 m long bolts on 1.0 m x 1.0 m spacing
• 4.1 mm wire mesh, 100 mm aperture
• If required: unreinforced shotcrete 4 to 10 cm | Back/sidewalls:
• 2.0 m long bolts on 1.3 m x 1.3 m spacing
• 4.1 mm wire mesh, 100 mm aperture
• If required: unreinforced shotcrete 4 to 5 cm |
| | FRK
(5.5 mW x 6.0 mH) | Back/sidewalls:
• 2.0 m long bolts on 1.3 m x 1.3 m spacing
• 4.1 mm wire mesh, 100 mm aperture
• If required: unreinforced shotcrete up to 5 cm | Back/sidewalls:
• 2.0 m long bolts on 1.5 m x 1.5 m spacing
• 4.1 mm wire mesh, 100 mm aperture
• If required: unreinforced shotcrete up to 5 cm |
| | Faults | Back/sidewalls:
• 2.0 m long bolts on 1.0 m x 1.0 m spacing
• 4.1 mm wire mesh, 100 mm aperture
• Fibre reinforced shotcrete 5 to 9 cm |
| 23.2.3 | Mining Method Context |
The context of the Bisha Main orebody indicates sublevel caving (SLC) as the most appropriate mining method on the basis of the following:
| | - Strong and competent rock with few major structures: Competent rock mass allows for more drilling and blasting within each stope. This provides good fragmentation and leaves the caving above very coarse. This results in blasted material finer than the cave, making distinction between ore and waste easier.
- Steeply dipping orebody: Keeps the low-grade waste further away from the current draw points, thus reducing dilution. Bisha has an average dip of 65°.
- Massive deposit: SLC requires a large footprint to minimize dilution levels as most dilution comes from the boundary between ore and waste. A massive deposit minimises the dilution as a smaller proportion of material is being mined from these boundary areas. The Bisha orebody is continuous along strike and dip. The different average widths between the north and south ends of the deposit lend themselves to different direction of SLC mining methods: longitudinal caving at the south and transverse caving at the north.
|
| PJ/ABE/ADD/CCS/AAN/NMW/CAE | Bisha_2016R&R-Update_TechRep_2CN010-024_20170808_aan_cae | August 2017 |
| SRK Consulting |
| NI 43-101 Technical Report Bisha Mine 2016, Eritrea | Page 261 |
| | - Preferably have mineralised waste: Reduces the impacts of dilution and allows for overdrawing at draw points. If the waste rock is mineralized, more ore can be removed without increasing the dilution factor. The immediate hanging wall and footwall of the Bisha underground area will be primarily comprised of massive sulphides.
|
NSR Calculation
The NSR calculation used for the underground evaluation of Bisha Main underground was derived from the NSR calculation used for the open pit resource estimate.
Commodity Prices
The commodity price deck used for the underground PEA is presented in Table 23.2. Note that the commodity prices used for the mineral Resource estimate were used for the underground PEA and are higher than the prices used for the open pit reserve estimate. The commodity prices used for the open pit mineral reserve estimate are shown for comparison.
Table 23.2: Commodity price deck
| | Commodity | Units | Resource Prices
(used in this Underground PEA) | Open Pit Reserve Prices |
| | Zinc | $/lb | $1.20 | $1.00 |
| | Copper | $/lb | $3.00 | $2.70 |
| | Gold | $/oz | $1,275 | $1,200 |
| | Silver | $/oz | $22.00 | $18.00 |
Processing Recovery
The processing recoveries for the Primary material being mined at Bisha Main UG are presented in Table 23.3.
Table 23.3: Bisha Main UG – Processing recoveries
| | Underground Mine | Zinc | Copper | Gold | Silver |
| | Copper Concentrate | N/A | 70% | 15% | 27% |
| | Zinc Concentrate | 77% | N/A | N/A | 23% |
Cut-off Grade
For Bisha Main UG, the preliminary total mine site operating cost inputs were estimated to be between $86.70/t of mill feed and $91.70/t of mill feed depending on the direction of mining (transverse SLC or longitudinal SLC).
| PJ/ABE/ADD/CCS/AAN/NMW/CAE | Bisha_2016R&R-Update_TechRep_2CN010-024_20170808_aan_cae | August 2017 |
| SRK Consulting |
| NI 43-101 Technical Report Bisha Mine 2016, Eritrea | Page 262 |
These inputs were estimated using data from the previous 2015 scoping study (SRK, 2015), BMSC site inputs, benchmarking, external inputs derived from contractor costs and SRK’s experience on similar projects and operating mines. The preliminary operating cost summary is detailed in Table 23.4.
Table 23.4: Bisha Main UG – Underground preliminary costs inputs for design parameters
| | Operating Cost Inputs | SLC
Transverse
($/t) | SLC
Longitudinal
($/t) |
| | Underground Mining | 35.00 | 30.00 |
| | Processing Primary Cu & Zn | 26.62 | 26.62 |
| | Environmental & Community | 0.80 | 0.80 |
| | General and Administration | 10.05 | 10.05 |
| | Surface Haulage | 2.00 | 2.00 |
| | Underground Sustaining Capital | 17.20 | 17.20 |
| | Total | 91.70 | 86.70 |
The Bisha Main UG mine design was based on an average NSR cut-off value of $108/t, compared to the average $90/t estimated in Table 23.4, to account for dilution in the cave.
The level interval assumed for the Bisha Main UG SLC design is 25 m.
The average SLC geometries are presented in Table 23.5.
Table 23.5: Bisha Main UG – SLC stope geometries
| | Mining Method | Width
(m) | Length
(m) | Level Interval
(m) |
| | Longitudinal SLC | 11 | 5 | 25 |
| | Transverse SLC | 40 | 15 | 25 |
| | Note: Width = perpendicular to strike. Length = Parallel to strike. |
| 23.2.6 | Mining Dilution and Recovery |
All mining shapes were modified to include planned external dilution. Mining recovery losses expected during mining operations as well as internal stope dilution were included in the economic evaluation of each shape.
The SLC ROM diluted material grade at Bisha Main UG was estimated to be 80% of the in-situ grades. An extraction ratio of 120% was assumed (i.e., the diluted ROM quantity is 120% of the in-situ quantity). The overall recovery of the SLC geometry was set to 83%.
| 23.2.7 | Backfill Requirements |
There are no backfill requirements for Bisha Main UG as the sublevel caving mining method does not require the support of mined out voids.
| PJ/ABE/ADD/CCS/AAN/NMW/CAE | Bisha_2016R&R-Update_TechRep_2CN010-024_20170808_aan_cae | August 2017 |
| SRK Consulting |
| NI 43-101 Technical Report Bisha Mine 2016, Eritrea | Page 263 |
Due to the relatively shallow depth of the deposit, the mine will utilise decline access and conventional trackless diesel equipment.
The Bisha deposit will be mined with a combination of transverse and longitudinal SLC. Transverse SLC is applied where the orebody width is greater than 30 m, and longitudinal SLC where is the orebody is less 30 m width. The decline portal will be in the Bisha Main pit on the 420 bench. The decline will be excavated at 5.5 mW by 6.0 mH, at a gradient of 1:7 and located on the footwall side of the orebody in the most favourable ground conditions.
Other infrastructure development will be 5.5 mW x 5.5 mH. Production development will be 5.0 mW by 5.5 mH.
Ground conditions are expected to range from Fair to Good, thus requiring some additional ground support in large open spans, such as intersection on the footwall contact. Typical ground support in these circumstances would be shotcrete and/or cable bolts.
| 23.2.9 | Production Layout and Mineralised Material Handling |
The main decline will connect to the typical production levels via a single access cross-cut with a footwall access drive connecting to the drawpoints for the transverse SLC. At the south end, where the orebody narrows, the last drawpoint will also provide the connection to a single longitudinal drawpoint (for the longitudinal SLC).
A typical production level is presented in Figure 23.3.
| PJ/ABE/ADD/CCS/AAN/NMW/CAE | Bisha_2016R&R-Update_TechRep_2CN010-024_20170808_aan_cae | August 2017 |
| SRK Consulting |
| NI 43-101 Technical Report Bisha Mine 2016, Eritrea | Page 264 |
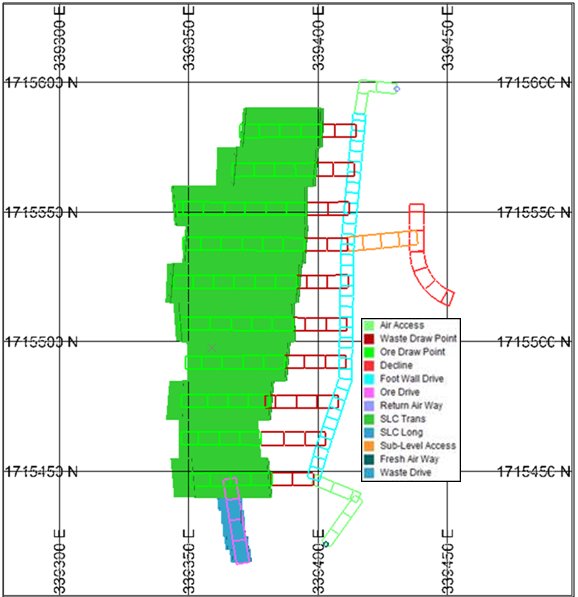
Note: Plan view 250 m level
Figure 23.3: Bisha Main UG – typical production level (plan view)
The level interval assumed for the Bisha Main UG SLC design is 25 m.
The average SLC geometries are presented in Table 23.6.
| PJ/ABE/ADD/CCS/AAN/NMW/CAE | Bisha_2016R&R-Update_TechRep_2CN010-024_20170808_aan_cae | August 2017 |
| SRK Consulting |
| NI 43-101 Technical Report Bisha Mine 2016, Eritrea | Page 265 |
Table 23.6: Bisha Main UG – SLC stope geometries
| | Mining Method | Width
(m) | Length
(m) | Level Interval
(m) |
| | Longitudinal SLC | 11 | 5 | 25 |
| | Transverse SLC | 40 | 15 | 25 |
| | Note: Width = perpendicular to strike. Length = Parallel to strike. |
Ore will be mucked by 17-tonne loaders from drawpoints into stockpiles on the footwall access drive. Haul trucks will be loaded on the production level and will dump onto the surface ROM pad. Oversize rocks will be stockpiled separately, to be popped at the end of shift.
| 23.2.10 | Development and Production Schedule |
In terms of interaction with the Bisha Main open pit, the Bisha Modified Phase 8 Pit stops at the 325 bench where the cave mine commences.
The Bisha Main UG pre-production period is minimal as production commences almost immediately, due to the top-down mining method. The ramp-up to full production takes approximately two years, to a rate of 800 ktpa.
The Bisha Main UG mine development schedule assumes two jumbos for the first year and then one jumbo for the remainder of the LOM.
The production rate selected for Bisha Main UG was determined by the orebody geometry and continuity, ground conditions, number of stopes available, anticipated productivity and scheduling to balance the resources to achieve a practical production output.
The Bisha Main UG LOM development and production schedule is presented in Table 23.17.
| PJ/ABE/ADD/CCS/AAN/NMW/CAE | Bisha_2016R&R-Update_TechRep_2CN010-024_20170808_aan_cae | August 2017 |
| SRK Consulting |
| NI 43-101 Technical Report Bisha Mine 2016, Eritrea | Page 266 |
Table 23.7: Bisha Main UG – LOM development and production schedule
| | Item | Units | Total | 1 | 2 | 3 | 4 | 5 | 6 | 7 | 8 |
| | Capital Development - Lateral | | | | | | | | | | |
| | Decline Capital Development | m | 2,380 | 1,065 | 275 | 162 | 167 | 184 | 177 | 175 | 175 |
| | Ventilation Access Development | m | 837 | 263 | 87 | 114 | 58 | 56 | 88 | 91 | 80 |
| | Level Access Development | m | 713 | 254 | 71 | 65 | 75 | 61 | 54 | 65 | 68 |
| | Other Capital Development | m | 405 | 158 | 43 | 32 | 26 | 27 | 31 | 45 | 42 |
| | Total Capital Development | m | 4,335 | 1,740 | 476 | 373 | 326 | 328 | 350 | 376 | 365 |
| | Capital Development - Vertical | | | | | | | | | | |
| | Vertical Capital - Raisebore | m | 205 | 205 | 0 | 0 | 0 | 0 | 0 | 0 | 0 |
| | Vertical Capital - Drop Raise | m | 554 | 140 | 49 | 101 | 51 | 51 | 51 | 51 | 60 |
| | Total Vertical Capital Development | m | 759 | 345 | 49 | 101 | 51 | 51 | 51 | 51 | 60 |
| | Operating Development | | | | | | | | | | |
| | Development Waste | m | 2,798 | 234 | 162 | 311 | 425 | 432 | 522 | 384 | 328 |
| | Development Ore | m | 3,508 | 413 | 449 | 411 | 550 | 456 | 456 | 465 | 309 |
| | Development Zn Grade | % | 8.09 | 7.72 | 7.59 | 7.71 | 7.98 | 8.13 | 8.97 | 7.59 | 10.15 |
| | Development Cu Grade | % | 0.81 | 0.65 | 0.83 | 0.89 | 0.82 | 0.80 | 0.83 | 0.79 | 0.56 |
| | Development Au Grade | g/t | 0.60 | 0.61 | 0.60 | 0.61 | 0.59 | 0.59 | 0.63 | 0.61 | 0.58 |
| | Development Ag Grade | g/t | 50.38 | 47.18 | 50.78 | 49.73 | 50.82 | 50.73 | 49.78 | 49.57 | 60.54 |
| | Total Operating Development | m | 6,306 | 646 | 611 | 723 | 975 | 888 | 978 | 849 | 636 |
| | Ore Production Summary | | | | | | | | | | |
| | Longitudinal SLC Production | kt | 810 | 161 | 273 | 229 | 33 | 0 | 0 | 76 | 38 |
| | Transverse SLC Production | kt | 3,794 | 3 | 263 | 526 | 707 | 750 | 750 | 673 | 122 |
| | Total Ore Production | kt | 4,604 | 164 | 536 | 755 | 740 | 750 | 750 | 749 | 160 |
| | Production Zn Grade | % | 8.09 | 7.72 | 7.59 | 7.71 | 7.98 | 8.13 | 8.97 | 7.59 | 10.15 |
| | Production Cu Grade | % | 0.81 | 0.65 | 0.83 | 0.89 | 0.82 | 0.80 | 0.83 | 0.79 | 0.56 |
| | Production Au Grade | g/t | 0.60 | 0.61 | 0.60 | 0.61 | 0.59 | 0.59 | 0.63 | 0.61 | 0.58 |
| | Production Ag Grade | g/t | 50.38 | 47.18 | 50.78 | 49.73 | 50.82 | 50.73 | 49.78 | 49.57 | 60.54 |
| | Mined Quantities Summary | | | | | | | | | | |
| | Total Mined Ore | kt | 4,988 | 209 | 585 | 800 | 800 | 800 | 800 | 800 | 194 |
| | Total Mined Zn Grade | % | 8.09 | 7.72 | 7.59 | 7.71 | 7.98 | 8.13 | 8.97 | 7.59 | 10.15 |
| | Total Mined Cu Grade | % | 0.81 | 0.65 | 0.83 | 0.89 | 0.82 | 0.80 | 0.83 | 0.79 | 0.56 |
| | Total Mined Au Grade | g/t | 0.61 | 0.61 | 0.60 | 0.61 | 0.59 | 0.59 | 0.63 | 0.61 | 0.58 |
| | Total Mined Ag Grade | g/t | 50.49 | 47.18 | 50.78 | 49.73 | 50.82 | 50.73 | 49.78 | 49.57 | 60.54 |
| PJ/ABE/ADD/CCS/AAN/NMW/CAE | Bisha_2016R&R-Update_TechRep_2CN010-024_20170808_aan_cae | August 2017 |
| SRK Consulting |
| NI 43-101 Technical Report Bisha Mine 2016, Eritrea | Page 267 |
| 23.2.11 | Labour Requirements |
Labour requirements for the underground mine project were estimated from first principles and are summarised in Table 23.8. It is assumed that the first three years of mine development and production will be conducted by the contractor.
The underground mine is scheduled to operate 360 days per year. An allowance of five days per year has been allocated for weather delays where no mining activities will occur. The labour estimate assumes two 12-hour shifts per day, seven days per week operation. Technical services personnel will work a 7-weeks on/3-weeks off (or equivalent) roster and underground operational personnel will work a 6-weeks on/3-weeks off or 2:1 equivalent roster. During the first three years of mine development, the estimate includes a heavy reliance on expatriate technical staff, supervision and underground operators.
There is no precedent for modern underground mechanised mining in Eritrea and the lack of locally sourced underground mining experience will require a comprehensive training effort, which is recommended to commence during the pre-production period. As the Eritrean personnel are trained, a reduction of expatriate personnel is proposed.
Table 23.8: Bisha Main UG – Labour requirements
| | Labour per Shift | Years 1 to 3 | Years 4 to 8 (average) |
| | Mining Contractor - Expatriate | 19 | |
| | Mining Contractor - Local | 78 | |
| | Mining Contactor Total | 97 | 0 |
| | BMSC Technical – Expatriate | | 2 |
| | BMSC Technical – Local | | 94 |
| | BMSC Total | 0 | 94 |
| | Labour Total | 97 | 94 |
Capital Costs
The capital cost estimate comprises all major and support equipment, material, labour and consumables associated with all of the pre-production and sustaining capital activities. To arrive at the capital cost, quotations from manufacturers and suppliers were obtained for the majority of the main mining equipment. For the materials, costs from operations with similar mining methods were applied. A range of labour costs and on-site costs was provided by BMSC and interpolated by SRK for the various categories of employees.
Vertical development was estimated to cost $4,440/m (includes setup, pilot hole, ream and rig down) and lateral development cost estimates for Bisha and Harena range between $4,200/m and $8,300/m, depending on the profile. The lateral capital cost estimates for Bisha Main UG are presented in Table 23.9.
| PJ/ABE/ADD/CCS/AAN/NMW/CAE | Bisha_2016R&R-Update_TechRep_2CN010-024_20170808_aan_cae | August 2017 |
| SRK Consulting |
| NI 43-101 Technical Report Bisha Mine 2016, Eritrea | Page 268 |
Table 23.9: Bisha Main UG – Lateral development capital cost estimate
| | Development Type | LOM Cost ($000s) | Development (m) | Unit Cost
($/m) |
| | Decline development | 18,966 | 2,380 | 7,969 |
| | Air access | 6,197 | 837 | 7,404 |
| | Capital infrastructure | 5,907 | 713 | 8,285 |
| | Other capital development | 3,297 | 405 | 8,140 |
| | Total | 34,367 | 4,335 | |
Underground capital cost estimates for Bisha Main UG are presented in Table 23.10 and include $20M spent in year one and year two on initial decline construction.
Additional $10M of owner’s costs is allocated for expenditure in year one and year two for the purposes of feasibility studies, and reported in Table 23.35.
Incremental case of closure is accounted for in the overall project closure. The site closure costs are unaffected is altered.
| PJ/ABE/ADD/CCS/AAN/NMW/CAE | Bisha_2016R&R-Update_TechRep_2CN010-024_20170808_aan_cae | August 2017 |
| SRK Consulting |
| NI 43-101 Technical Report Bisha Mine 2016, Eritrea | Page 269 |
Table 23.10: Bisha Main UG – Annual capital cost estimates
| | Capital Item | Total | YEAR 1 | YEAR 2 | YEAR 3 | YEAR 4 | YEAR 5 | YEAR 6 | YEAR 7 | YEAR 8 |
| | Pit portal | 0.50 | 0.50 | - | - | - | - | - | - | - |
| | Portal pad for underground facilities | 0.50 | 0.50 | - | - | - | - | - | - | - |
| | Contractor mob and demob | 5.00 | 2.50 | - | 2.50 | - | - | - | - | - |
| | Capitalised lateral development | 34.37 | 10.60 | 4.81 | 3.73 | 2.65 | 2.99 | 2.95 | 3.18 | 3.46 |
| | Capitalised vertical development | 3.37 | 1.53 | 0.22 | 0.45 | 0.23 | 0.23 | 0.23 | 0.23 | 0.27 |
| | Underground mobile fleet | 14.55 | - | - | 13.60 | - | 0.95 | - | - | - |
| | Underground mobile fleet rebuild | 0.73 | - | - | - | - | - | 0.58 | - | 0.15 |
| | Underground mobile fleet replacement | 0.57 | - | - | - | 0.57 | - | - | - | - |
| | Underground explosives magazine | - | - | - | - | - | - | - | - | - |
| | Escape way ladder way | 0.13 | 0.13 | - | - | - | - | - | - | - |
| | Air compressors | 0.68 | 0.68 | - | - | - | - | - | - | - |
| | Back fill plant (CRF) | - | - | - | - | - | - | - | - | - |
| | Ventilation - primary surface fans | 1.00 | 0.50 | 0.50 | - | - | - | - | - | - |
| | Ventilation - secondary fans | 0.90 | 0.30 | 0.30 | - | 0.30 | - | - | - | - |
| | Ventilation - bulk air cooling plant | - | - | - | - | - | - | - | - | - |
| | Mobile equipment maintenance facility | 0.50 | - | - | 0.50 | - | - | - | - | - |
| | Lunchroom and latrine | 0.40 | - | - | 0.40 | - | - | - | - | - |
| | Underground dewatering | 1.25 | 0.25 | 0.50 | 0.25 | 0.25 | - | - | - | - |
| | Communications | 0.40 | 0.05 | 0.05 | 0.05 | 0.05 | 0.05 | 0.05 | 0.05 | 0.05 |
| | Technical services - software and instrumentation | 0.40 | 0.05 | 0.05 | 0.05 | 0.05 | 0.05 | 0.05 | 0.05 | 0.05 |
| | Underground mains firing - PED Version | 0.35 | - | 0.35 | - | - | - | - | - | - |
| | Safety - refuge chambers | 0.70 | 0.20 | 0.25 | 0.25 | - | - | - | - | - |
| | Safety - mine rescue equipment | 0.40 | 0.20 | 0.20 | - | - | - | - | - | - |
| | Electrical distribution | 2.53 | 1.20 | 0.19 | 0.19 | 0.19 | 0.19 | 0.19 | 0.19 | 0.19 |
| | Sub-total | 69.23 | 19.19 | 7.42 | 21.97 | 4.28 | 4.45 | 4.05 | 3.70 | 4.16 |
| | Contingency @ 15% | 10.38 | 2.88 | 1.11 | 3.30 | 0.64 | 0.67 | 0.61 | 0.55 | 0.62 |
| | Total capital cost | 79.61 | 22.07 | 8.53 | 25.26 | 4.92 | 5.12 | 4.66 | 4.25 | 4.79 |
| PJ/ABE/ADD/CCS/AAN/NMW/CAE | Bisha_2016R&R-Update_TechRep_2CN010-024_20170808_aan_cae | August 2017 |
| SRK Consulting |
| NI 43-101 Technical Report Bisha Mine 2016, Eritrea | Page 270 |
Operating Costs
The estimate includes labour, power consumption, major consumables and maintenance cost associated with the major mine operation activities. The Bisha Main UG underground operating cost estimates are presented in Table 23.11, respectively.
The underground operating cost estimate has been prepared from first principles using supplier quotations, contractor unit mining costs, inputs and assumptions obtained from recent project and mining operations, and BMSC supplied inputs.
Table 23.11: Bisha Main UG – Operating cost estimate
| | Cost Item | LOM Cost
($000s) | Unit Cost |
| | ($/t mill feed) |
| | Operating Development | | |
| | 5mH x 5.5mW heading | 50,350 | 10.09 |
| | Ore Production | | |
| | LH drilling | 3,419 | 0.69 |
| | ITH drilling | 1,572 | 0.32 |
| | Blasting | 4,116 | 0.83 |
| | Bogging | 6,285 | 1.26 |
| | Hauling | 9,124 | 1.83 |
| | Surface hauling | 0 | 0.00 |
| | Backfill | 0 | 0.00 |
| | Subtotal | 24,515 | 4.91 |
| | Utilities and Labour | | |
| | Auxiliary equipment | 6,362 | 1.28 |
| | Power | 15,116 | 3.03 |
| | Labour | 71,629 | 14.36 |
| | Dewatering | 288 | 0.06 |
| | Ventilation | 2,435 | 0.49 |
| | Subtotal | 95,829 | 19.21 |
| | Contractor Equipment and O/H | | |
| | Equipment allocation cost | 9,140 | 1.83 |
| | Local staff training | 12,277 | 2.46 |
| | Administration and margin (15%) | 18,857 | 3.78 |
| | Subtotal | 40,273 | 8.07 |
| | Total | 210,967 | 42.29 |
The life of mine total operating cost for the Bisha Main UG operation is before any capitalisation of pre-commercial operating expenditure.
The contractor’s mobile equipment fleet costs have been allocated to the operating cost estimate based on an annual equipment charge as summarised in Table 23.12
| PJ/ABE/ADD/CCS/AAN/NMW/CAE | Bisha_2016R&R-Update_TechRep_2CN010-024_20170808_aan_cae | August 2017 |
| SRK Consulting |
| NI 43-101 Technical Report Bisha Mine 2016, Eritrea | Page 271 |
Table 23.12: Bisha Main UG – Contractor annual mobile equipment costs
| | Equipment Type | Model | Cost
($ p.a.) |
| | Jumbo | Sandvik DD421 | 242,000 |
| | Bolter | Sandvik DS311 | 151,250 |
| | UG loader | Sandvik LH517 | 236,500 |
| | UG truck | CAT AD55B | 455,485 |
| | LH drill | Sandvik DL431 | 248,050 |
| | ITH drill | ITH Drill | 382,103 |
| | Development charge | Normet Charmec MC605 DA | 136,002 |
| | Production charge | Normet Charmec LC605 VE | 204,149 |
| | Services | Normet Utilift MF 540 | 113,980 |
| | Grader | Veekmas FG 15 C | 175,835 |
| | Light vehicle | Toyota Hurth | 23,700 |
| | Water truck | Normet Multimec MF 100 (water) | 97,628 |
| | Fuel truck | Normet Multimec MF 100 (fuel) | 98,173 |
| | Service truck | Normet Multimec MF 100 (service) | 99,004 |
The Harena deposit is a continuous, tabular massive sulphide structure that dips from 45º to 80º to the northwest. The orebody width varies from 0.5 m to 65 m over a strike length of ~ 800 m and is generally continuous over a down dip extent of about 560 m. The deposit remains open to the southeast and at depth.
Refer to Section 23.2.2 for discussion of ground support requirements at Harena underground. The ground conditions at Harena UG are sufficiently similar to Bisha Main UG for this analogy to be drawn.
| 23.3.3 | Mining Method Context |
The context of the Harena UG orebody indicates long hole open stoping (LHOS) as the most appropriate mining method. This can be either unsupported LHOS, such as open stoping with pillars (partial extraction) or LHOS with cemented backfill (CAF).
Harena has the following characteristics:
| | - Steeply dipping orebody: This will help mitigate bridging in the stope and the steep dip will help facilitate drilling, blasting and mucking activities. Harena has an average dip of 80°.
- Thick width for transverse and narrow to medium width for longitudinal: Transverse longhole stoping requires a relatively wide mining width in order to minimize development costs and to maximise stope productivity. The mineralised envelopes for Harena vary from very narrow (2.5 m, minimum mining width) to wide (up to 65 m).
|
| PJ/ABE/ADD/CCS/AAN/NMW/CAE | Bisha_2016R&R-Update_TechRep_2CN010-024_20170808_aan_cae | August 2017 |
| SRK Consulting |
| NI 43-101 Technical Report Bisha Mine 2016, Eritrea | Page 272 |
| | - Poor to very good rock mass qualities: the success of LHOS relies on establishing a large open stope that will not collapse as the ore is being mined.
|
On this basis, the supported transverse and longitudinal LHOS mining method was chosen as it is better suited to an orebody up to 65 m wide. In addition, the use of backfill in the mining method will increase the orebody extraction.
Backfill for Harena is discussed further in the backfill section this report.
The mineralised envelopes vary from very narrow (0.5 m) to wide (65 m), as illustrated Figure 23.4, Figure 23.5, and Figure 23.6, at a cut-off grade of NSR = $50/t.
| PJ/ABE/ADD/CCS/AAN/NMW/CAE | Bisha_2016R&R-Update_TechRep_2CN010-024_20170808_aan_cae | August 2017 |
| SRK Consulting |
| NI 43-101 Technical Report Bisha Mine 2016, Eritrea | Page 273 |
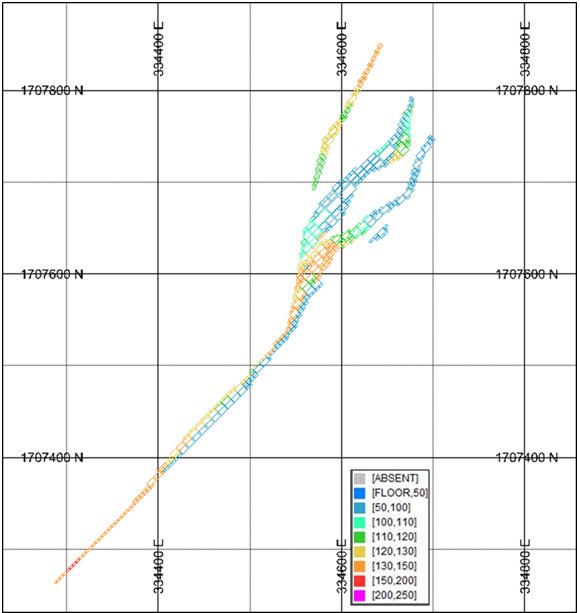
Note: Blocks are shown with a filter of NSR>$50/t.
Figure 23.4: Harena UG deposit – plan view (380 mRL)
| PJ/ABE/ADD/CCS/AAN/NMW/CAE | Bisha_2016R&R-Update_TechRep_2CN010-024_20170808_aan_cae | August 2017 |
| SRK Consulting |
| NI 43-101 Technical Report Bisha Mine 2016, Eritrea | Page 274 |

Note: Blocks are shown with a filter of NSR>$50/t.
Figure 23.5: Harena UG deposit – plan view (20 mRL)
| PJ/ABE/ADD/CCS/AAN/NMW/CAE | Bisha_2016R&R-Update_TechRep_2CN010-024_20170808_aan_cae | August 2017 |
| SRK Consulting |
| NI 43-101 Technical Report Bisha Mine 2016, Eritrea | Page 275 |
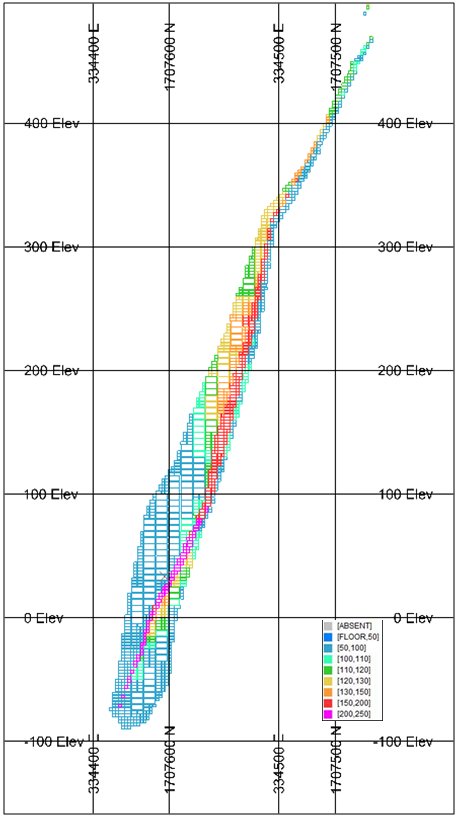
Note: Blocks are shown with a filter of NSR>$50/t; Harena OP is not shown because it is off-section.
Figure 23.6: Harena UG deposit – section view (looking northeast)
| PJ/ABE/ADD/CCS/AAN/NMW/CAE | Bisha_2016R&R-Update_TechRep_2CN010-024_20170808_aan_cae | August 2017 |
| SRK Consulting |
| NI 43-101 Technical Report Bisha Mine 2016, Eritrea | Page 276 |
NSR Calculation
The NSR calculation used for the underground evaluation of Harena underground was derived from the NSR calculation used for the open pit resource estimate.
Commodity Prices
The commodity price deck used for the underground PEA is presented in Table 23.13. Note that the commodity prices used for the mineral Resource estimate were used for the underground PEA and are higher than the prices used for the open pit reserve estimate. The commodity prices used for the open pit mineral reserve estimate are shown for comparison.
Table 23.13: Commodity price deck
| | Commodity | Units | Resource Prices
(used in this Underground PEA) | Open Pit Reserve Prices |
| | Zinc | $/lb | $1.20 | $1.00 |
| | Copper | $/lb | $3.00 | $2.70 |
| | Gold | $/oz | $1,275 | $1,200 |
| | Silver | $/oz | $22.00 | $18.00 |
Processing Recovery
The processing recoveries for the Primary material being mined at Harena UG are presented in Table 23.14.
Table 23.14: Harena UG – Processing recoveries
| | Underground Mine | Zinc | Copper | Gold | Silver |
| | Copper Concentrate | N/A | 85% | 36% | 29% |
| | Zinc Concentrate | 85% | N/A | N/A | 23% |
Cut-off Grade
For Harena UG, the preliminary operating cost inputs were estimated to be $108.05/t. Additional haulage costs of $0.93/t were included to account for its further distance (10 km) from the crusher & ROM stockpile.
These inputs were estimated using data from the previous 2015 scoping study (SRK, 2015), BMSC site inputs, benchmarking, external inputs derived from contractor costs and SRK’s experience on similar projects and operating mines. The preliminary operating cost summary is detailed in Table 23.15.
| PJ/ABE/ADD/CCS/AAN/NMW/CAE | Bisha_2016R&R-Update_TechRep_2CN010-024_20170808_aan_cae | August 2017 |
| SRK Consulting |
| NI 43-101 Technical Report Bisha Mine 2016, Eritrea | Page 277 |
Table 23.15: Harena UG – Underground preliminary costs inputs for design parameters
| | Operating Cost Inputs | LHOS
($/t) |
| | Underground Mining | 50.00 |
| | Processing Primary Cu & Zn | 26.62 |
| | Environmental & Community | 0.80 |
| | General and Administration | 10.50 |
| | Surface Haulage | 2.93 |
| | Underground Sustaining Capital | 17.20 |
| | Total | 108.05 |
The Harena UG mine design was based on an NSR cut-off value of $105/t, compared to the $108.50/t in Table 23.4, to include a relatively large quantity of near-cut-off material.
The decision to bring slightly higher grade zinc material into the Harena UG design, a slightly lower NSR cut-off value of $105/t was selected for design purposes.
Consideration for dilution in the Harena UG design was included in the stope design process for the LHOS stopes.
The level interval assumed for Harena UG LHOS is 20 m.
The LHOS design parameters for Harena UG are presented in Table 23.16.
Table 23.16: Harena UG – LHOS stope geometries
| | Mining Method | Width
(m) | Length
(m) | Level Interval
(m) |
| | Longitudinal LHOS | | | |
| | Minimum | 2.5 | 30 | 20 |
| | Average | 7.0 | 30 | 20 |
| | Transverse LHOS | | | |
| | Minimum | 17.0 | 15 | 20 |
| | Average | 18.0 | 15 | 20 |
| | Note: Width = perpendicular to strike. Length = Parallel to strike. |
In the design process, priority has been given to the transverse stopes shapes because of their ability to achieve a higher production rate and because they offer more mining flexibility than the longitudinal stope shapes. The higher tonnage of the transverse stopes also yields more tonnages, resulting in a lower operating cost per tonne.
| 23.3.6 | Mining Dilution and Recovery |
Harena UG dilution was estimated at less than 1.5 linear metres (<1.0 m for hanging wall (HW) and <0.5 m for footwall (FW)). The design assumed that the distal hanging wall and footwall will not be exposed.
| PJ/ABE/ADD/CCS/AAN/NMW/CAE | Bisha_2016R&R-Update_TechRep_2CN010-024_20170808_aan_cae | August 2017 |
| SRK Consulting |
| NI 43-101 Technical Report Bisha Mine 2016, Eritrea | Page 278 |
The stope design process included the unplanned dilution on the stope boundaries and the resultant quantities and grades were applied to the recovered material. The stope dilution grades were directly estimated from the block model grades for the unplanned hanging wall and footwall dilution, resulting in different for each stope. This allowed for the geometries of the stope shapes to be optimised in the narrower parts of ore body.
Where a stope is exposed to a backfill surface, it was assumed 0.3 m of dilution on each surface exposed to the open stope (i.e. walls and floors). This equates to 2% of dilution from backfill, added to the FW & HW dilution. The dilution grades were set as zero for wall and floor dilution.
The dilution and ore recovery factors that have been applied to the Harena underground design, as presented in Table 23.17, were calculated from a combination of methods, which included empirical methods, benchmarking and back-calculation from the diluted stopes against the undiluted stopes.
Table 23.17: Harena UG - dilution and recovery factors
| | Mining Method | Hanging Wall
(m) | Foot Wall
(m) | Mining Dilution
(%) | Mining Recovery
(%) |
| | Longitudinal LHOS | 1.0 | 0.5 | 24 | 92% |
| | Transverse LHOS | 10 | 87% |
| | Sill Longitudinal LHOS | | | 24 | 50% |
| | Sill Transverse LHOS | | | 10 | 28% |
| | Note: Dilution estimate is LOM tonnes weighted and is calculated as % dilution = waste + ore / ore |
| 23.3.7 | Backfill Requirements |
The LHOS mining method at Harena UG will require that some of the stopes be backfilled in order to safely increase the proportion of mineralised material able to be extracted from the resource.
Cemented Rock Fill (CRF) has been selected for Harena LHOS to meet the stope sequencing and geometry requirements in all of the transverse primary stopes.
SRK has assumed suitable material (strong and not prone to degradation and clay minerals) can be accessed on site (e.g. fresh rock from development and the open pit), screened of oversize (if required), and then batch-mixed on surface and transported underground by an ejector truck. Stope delivery would be via loaders or direct ejected from the truck. A cement content of 4% has been assumed. In the absence of any testwork, a cement content of ~4% has been assumed.
Uncemented Rock Fill (URF) will be used in all transverse secondary stopes and approximately 75% of the longitudinal stopes.
The underground mine will be accessed via a decline, from a portal located in the Harena pit on the 490 bench. The decline will be 5.5 m wide by 6.0 m high, at a gradient of 1:7 and located on the footwall side of the orebody, suitable for trackless diesel equipment.
| PJ/ABE/ADD/CCS/AAN/NMW/CAE | Bisha_2016R&R-Update_TechRep_2CN010-024_20170808_aan_cae | August 2017 |
| SRK Consulting |
| NI 43-101 Technical Report Bisha Mine 2016, Eritrea | Page 279 |
Refer to the Bisha Main discussion for additional details on Harena access as Bisha Main UG and Harena UG share common design criteria.
| 23.3.9 | Production Layout and Mineralised Material Handling |
The main decline will connect to the typical production levels via a single access cross-cut with a footwall access drive connecting to the drawpoints for the transverse LHOS. Where the orebody narrows, the last drawpoint will also provide the connection to a single longitudinal drawpoint (for the longitudinal LHOS).
Ore will be mucked by 17-tonne loaders from drawpoints into stockpiles on the footwall access drive. Conventional (manually operated) loaders will be used, however tele-remote loaders will be utilised when the loader enters the open stope. Haul trucks will be loaded on the production level and will dump onto the surface ROM pad. Oversize rocks will be stockpiled separately, to be popped at the end of shift.
The level interval assumed for Harena LHOS is 20 m.
The LHOS design parameters for Harena are presented in Table 23.18.
Table 23.18: Harena UG – LHOS stope geometries
| | Mining Method | Width
(m) | Length
(m) | Level Interval
(m) |
| | Longitudinal LHOS | | | |
| | Minimum | 2.5 | 30 | 20 |
| | Average | 7.0 | 30 | 20 |
| | Transverse LHOS | | | |
| | Minimum | 17.0 | 15 | 20 |
| | Average | 18.0 | 15 | 20 |
| | Note: Width = perpendicular to strike. Length = Parallel to strike. |
In the design process, priority has been given to the transverse shapes because their sequencing to achieve a higher production rate is more flexible than the longitudinal shapes and because they include more tonnages, leading to lower operating cost per tonne.
A typical production level is presented in Figure 23.7.
| PJ/ABE/ADD/CCS/AAN/NMW/CAE | Bisha_2016R&R-Update_TechRep_2CN010-024_20170808_aan_cae | August 2017 |
| SRK Consulting |
| NI 43-101 Technical Report Bisha Mine 2016, Eritrea | Page 280 |

Note: Plan View 120 m level
Figure 23.7: Harena UG – typical production level (plan view)
| 23.3.10 | Development and Production Schedule |
In terms of interaction with the Harena open pit, the existing Harena open pit has previously exploited the oxide gold zone. It is proposed to mine the Primary sulphide ore below the current pit and following completion of this pit phase, up to the cross-over pit with a bottom elevation of 475 mRL. The portal and supporting infrastructure will be located in the pit (on the 490 bench).
The Harena UG development schedule assumed a nominal vertical development rate of 150 m/month and a nominal horizontal development rate of 4 m/d per jumbo (120 m/month/jumbo). The exceptions are the Harena UG decline and sub-level accesses where the nominal horizontal development rate was 3.5 m/d (105 m/month).
| PJ/ABE/ADD/CCS/AAN/NMW/CAE | Bisha_2016R&R-Update_TechRep_2CN010-024_20170808_aan_cae | August 2017 |
| SRK Consulting |
| NI 43-101 Technical Report Bisha Mine 2016, Eritrea | Page 281 |
The development schedule has a further constraint of 400 m/month of horizontal development to translate the availability of two jumbos. For comparison purposes, a mining contractor in West Africa developing a decline with a single jumbo in fair rock conditions can achieve 160 m/month to 180 m/month on a sustained basis. The development rates assumed for this study are considered conservative.
The Harena UG mine pre-production period is ten months, comprising 1,600 m of lateral development and 250 m of vertical development at an approximate total cost of $9.0M.
The Harena UG LOM development and production schedule is presented in Table 23.18.
| PJ/ABE/ADD/CCS/AAN/NMW/CAE | Bisha_2016R&R-Update_TechRep_2CN010-024_20170808_aan_cae | August 2017 |
| SRK Consulting |
| NI 43-101 Technical Report Bisha Mine 2016, Eritrea | Page 282 |
Table 23.19: Harena UG – LOM development and production schedule
| | Item | Units | Total | 1 | 2 | 3 | 4 | 5 | 6 | 7 | 8 | 9 | 10 | 11 | 12 |
| | Capital Development - Lateral | | | | | | | | | | | | | | |
| | Decline Capital Development | m | 4,293 | 1,015 | 714 | 504 | 510 | 596 | 387 | 352 | 215 | 0 | 0 | 0 | 0 |
| | Ventilation Access Development | m | 2,153 | 610 | 529 | 261 | 106 | 166 | 198 | 124 | 145 | 0 | 14 | 0 | 0 |
| | Level Access Development | m | 2,707 | 218 | 1,398 | 512 | 82 | 154 | 61 | 122 | 160 | 0 | 0 | 0 | 0 |
| | Other Capital Development | m | 915 | 184 | 264 | 128 | 70 | 92 | 65 | 60 | 52 | 0 | 1 | 0 | 0 |
| | Total Capital Development | m | 10,068 | 2,027 | 2,905 | 1,405 | 769 | 1,008 | 711 | 658 | 572 | 0 | 15 | 0 | 0 |
| | Capital Development - Vertical | | | | | | | | | | | | | | |
| | Vertical Capital - Raisebore | m | 130 | 130 | 0 | 0 | 0 | 0 | 0 | 0 | 0 | 0 | 0 | 0 | 0 |
| | Vertical Capital - Drop Raise | m | 1,076 | 120 | 200 | 160 | 101 | 180 | 100 | 140 | 74 | 0 | 0 | 0 | 0 |
| | Total Vertical Capital Development | m | 1,206 | 250 | 200 | 160 | 101 | 180 | 100 | 140 | 74 | 0 | 0 | 0 | 0 |
| | Operating Development | | | | | | | | | | | | | | |
| | Development Waste | m | 20,927 | 654 | 1,130 | 1,763 | 2,540 | 2,224 | 2,398 | 2,681 | 2,840 | 3,552 | 1,145 | 0 | 0 |
| | Development Ore | m | 15,352 | 385 | 846 | 1,770 | 1,557 | 1,656 | 1,752 | 1,530 | 1,437 | 1,245 | 1,434 | 1,499 | 241 |
| | Development Zn Grade | % | 4.39 | 2.73 | 3.18 | 3.79 | 4.61 | 4.54 | 5.44 | 4.46 | 4.28 | 4.73 | 4.86 | 3.96 | 4.11 |
| | Development Cu Grade | % | 1.03 | 1.13 | 1.07 | 0.88 | 0.70 | 1.04 | 0.96 | 1.20 | 1.14 | 1.05 | 1.07 | 1.26 | 0.76 |
| | Development Au Grade | g/t | 0.91 | 1.09 | 1.42 | 1.67 | 1.19 | 0.99 | 0.71 | 0.74 | 0.73 | 0.51 | 0.44 | 0.57 | 1.41 |
| | Development Ag Grade | g/t | 32.85 | 43.67 | 42.39 | 41.38 | 37.11 | 34.38 | 27.74 | 31.12 | 32.62 | 27.71 | 24.05 | 28.37 | 38.01 |
| | Total Operating Development | m | 36,279 | 1,040 | 1,976 | 3,533 | 4,098 | 3,880 | 4,150 | 4,211 | 4,277 | 4,796 | 2,579 | 1,499 | 241 |
| | Ore Production Summary | | | | | | | | | | | | | | |
| | Longitudinal LHOS Production | kt | 1,882 | 61 | 252 | 337 | 273 | 250 | 361 | 191 | 0 | 21 | 41 | 95 | 0 |
| | Transverse LHOS Production | kt | 9,277 | 52 | 481 | 456 | 838 | 867 | 795 | 1,020 | 1,218 | 1,212 | 1,173 | 1,119 | 46 |
| | Total Ore Production | kt | 11,160 | 113 | 733 | 793 | 1,111 | 1,117 | 1,156 | 1,211 | 1,218 | 1,234 | 1,215 | 1,214 | 46 |
| | Production Zn Grade | % | 4.35 | 2.74 | 2.94 | 3.64 | 4.47 | 4.25 | 5.53 | 4.59 | 4.51 | 4.73 | 4.50 | 3.98 | 1.70 |
| | Production Cu Grade | % | 1.06 | 1.02 | 1.10 | 0.87 | 0.74 | 0.91 | 0.93 | 1.14 | 1.10 | 1.04 | 1.17 | 1.32 | 1.80 |
| | Production Au Grade | g/t | 0.84 | 1.35 | 1.13 | 1.74 | 1.32 | 1.18 | 0.67 | 0.67 | 0.71 | 0.58 | 0.48 | 0.53 | 1.12 |
| | Production Ag Grade | g/t | 32.12 | 45.93 | 41.20 | 42.63 | 38.81 | 35.75 | 27.62 | 29.41 | 31.35 | 30.06 | 25.34 | 27.83 | 45.65 |
| | Mined Quantities Summary | | | | | | | | | | | | | | |
| | Total Mined Ore | kt | 12,739 | 154 | 821 | 975 | 1,267 | 1,288 | 1,336 | 1,368 | 1,364 | 1,364 | 1,364 | 1,368 | 70 |
| | Total Mined Zn Grade | % | 4.37 | 2.74 | 2.97 | 3.67 | 4.49 | 4.29 | 5.52 | 4.58 | 4.49 | 4.73 | 4.54 | 3.98 | 2.54 |
| | Total Mined Cu Grade | % | 1.04 | 1.05 | 1.10 | 0.87 | 0.74 | 0.93 | 0.93 | 1.15 | 1.10 | 1.04 | 1.16 | 1.31 | 1.44 |
| | Total Mined Au Grade | g/t | 0.87 | 1.28 | 1.16 | 1.73 | 1.30 | 1.15 | 0.68 | 0.68 | 0.71 | 0.57 | 0.48 | 0.53 | 1.22 |
| | Total Mined Ag Grade | g/t | 32.46 | 45.33 | 41.33 | 42.40 | 38.60 | 35.57 | 27.64 | 29.61 | 31.49 | 29.84 | 25.20 | 27.89 | 42.97 |
| | Backfill | | | | | | | | | | | | | | |
| | Waste Backfill | kt | 572 | 20 | 78 | 111 | 88 | 87 | 107 | 40 | 0 | 8 | 13 | 21 | 0 |
| | Cemented Backfill | kt | 3,992 | 29 | 234 | 234 | 396 | 386 | 379 | 458 | 509 | 493 | 474 | 393 | 8 |
| PJ/ABE/ADD/CCS/AAN/NMW/CAE | Bisha_2016R&R-Update_TechRep_2CN010-024_20170808_aan_cae | August 2017 |
| SRK Consulting |
| NI 43-101 Technical Report Bisha Mine 2016, Eritrea | Page 283 |
| 23.3.11 | Labour Requirements |
Labour requirements for the underground mine projects were estimated from first principles and are summarised in Table 23.20. Personnel requirements for Harena UG on a per-shift basis are almost identical to Bisha Main UG, however, the smaller longitudinal stopes at Harena UG incur a higher unit operating cost as a result of their smaller size. It is assumed that the first three years of mine development and production will be conducted by the contractor.
The underground mines are scheduled to operate 360 days per year. An allowance of five days per year has been allocated for weather delays where no mining activities will occur. The labour estimate assumes two 12-hour shifts per day, seven days per week operation. Technical services personnel will work a 7-weeks on/3-weeks off (or equivalent) roster and underground operational personnel will work a 6-weeks on/3-weeks off or 2:1 equivalent roster. During the first three years of mine development, the estimate includes a heavy reliance on expatriate technical staff, supervision and underground operators.
There is no precedent for modern underground mechanised mining in Eritrea and the lack of locally sourced underground mining experience will require a comprehensive training effort, which is recommended to commence during the pre-production period. As the Eritrean personnel are trained, a reduction of expatriate personnel is proposed.
Table 23.20: Harena UG – Labour requirements
| | Labour per Shift | Years 1 to 3 | Years 4 to 12 (average) |
| | Mining Contractor - Expatriate | 20 | |
| | Mining Contractor - Local | 81 | |
| | Mining Contactor Total | 101 | 0 |
| | BMSC Technical - Expatriate | | 2 |
| | BMSC Technical - Local | | 97 |
| | BMSC Total | 0 | 97 |
| | Labour Total | 101 | 99 |
Capital Costs
The capital cost estimate comprises all major and support equipment, material, labour and consumables associated with all of the pre-production and sustaining capital activities. To arrive at the capital cost, quotations from manufacturers and suppliers were obtained for the majority of the main mining equipment. For the materials, costs from operations with similar mining methods were applied. A range of labour costs and on-site costs was provided by BMSC and interpolated by SRK for the various categories of employees.
Vertical development was estimated to cost $4,440/m (includes setup, pilot hole, ream and rig down) and lateral development cost estimates for Bisha and Harena range between $4,200/m and $8,300/m, depending on the profile. The lateral capital cost estimates for Harena UG are presented in Table 23.21.
| PJ/ABE/ADD/CCS/AAN/NMW/CAE | Bisha_2016R&R-Update_TechRep_2CN010-024_20170808_aan_cae | August 2017 |
| SRK Consulting |
| NI 43-101 Technical Report Bisha Mine 2016, Eritrea | Page 284 |
Table 23.21: Harena UG – Development capital cost estimate
| | Development Type | LOM Cost ($000s) | Development (m) | Unit Cost
($/m) |
| | Decline development | 22,237 | 4,293 | 5,180 |
| | Air access | 9,066 | 2,153 | 4,211 |
| | Capital infrastructure | 13,789 | 2,707 | 5,094 |
| | Other capital development | 4,713 | 915 | 5,149 |
| | Total | 49,805 | 10,068 | |
The total underground capital cost estimates for Harena UG are presented in Table 23.22, and include $20M spent in year one and year two on initial decline construction.
Additional $10M of owner’s costs is allocated for expenditure in year one and year two for the purposes of feasibility studies, and reported in Table 23.35.
Incremental case of closure is accounted for in the overall project closure. The site closure costs are unaffected is altered.
| PJ/ABE/ADD/CCS/AAN/NMW/CAE | Bisha_2016R&R-Update_TechRep_2CN010-024_20170808_aan_cae | August 2017 |
| SRK Consulting |
| NI 43-101 Technical Report Bisha Mine 2016, Eritrea | Page 285 |
Table 23.22: Harena UG – Annual capital cost estimates
| | Capital Item | Total | YEAR 1 | YEAR 2 | YEAR 3 | YEAR 4 | YEAR 5 | YEAR 6 | YEAR 7 | YEAR 8 | YEAR 9 | YEAR 10 | YEAR 11 | YEAR 12 |
| | Pit portal | 0.50 | 0.50 | - | - | - | - | - | - | - | - | - | - | - |
| | Portal pad for underground facilities | 0.50 | 0.50 | - | - | - | - | - | - | - | - | - | - | - |
| | Contractor mob and demob | 5.00 | 2.50 | - | 2.50 | - | - | - | - | - | - | - | - | - |
| | Capitalised lateral development | 49.80 | 11.58 | 13.96 | 6.84 | 3.62 | 4.77 | 3.25 | 3.08 | 2.65 | - | 0.06 | - | - |
| | Capitalised vertical development | 5.35 | 1.11 | 0.89 | 0.71 | 0.45 | 0.80 | 0.44 | 0.62 | 0.33 | - | - | - | - |
| | Underground mobile fleet | 21.67 | - | - | 18.13 | 1.72 | - | 1.82 | - | - | - | - | - | - |
| | Underground mobile fleet rebuild | 8.54 | - | - | - | - | - | 0.92 | 2.27 | 0.86 | 4.49 | - | - | - |
| | Underground mobile fleet replacement | 14.42 | - | - | - | 1.97 | 0.97 | 5.82 | 2.88 | 0.09 | 2.13 | 0.55 | - | - |
| | Underground explosives magazine | - | - | - | - | - | - | - | - | - | - | - | - | - |
| | Escape way ladder way | 0.08 | 0.08 | - | - | - | - | - | - | - | - | - | - | - |
| | Air compressors | 0.68 | 0.68 | - | - | - | - | - | - | - | - | - | - | - |
| | Back fill plant (CRF) | 1.50 | - | 1.50 | - | - | - | - | - | - | - | - | - | - |
| | Ventilation - primary surface fans | 1.00 | 0.50 | 0.50 | - | - | - | - | - | - | - | - | - | - |
| | Ventilation - secondary fans | 1.50 | 0.30 | 0.30 | - | 0.30 | - | 0.30 | - | 0.30 | - | - | - | - |
| | Ventilation - bulk air cooling plant | - | - | - | - | - | - | - | - | - | - | - | - | - |
| | Mobile equipment maintenance facility | 1.00 | - | - | 0.50 | - | - | 0.50 | - | - | - | - | - | - |
| | Lunchroom and latrine | 0.40 | - | - | 0.40 | - | - | - | - | - | - | - | - | - |
| | Underground dewatering | 1.50 | 0.25 | 0.50 | 0.25 | 0.25 | - | - | - | 0.25 | - | - | - | - |
| | Communications | 0.45 | 0.05 | 0.05 | 0.05 | 0.05 | 0.05 | 0.05 | 0.05 | 0.05 | - | 0.05 | - | - |
| | Technical services - software and instrumentation | 0.45 | 0.05 | 0.05 | 0.05 | 0.05 | 0.05 | 0.05 | 0.05 | 0.05 | - | 0.05 | - | - |
| | Underground mains firing - PED version | 0.70 | - | 0.35 | - | - | - | - | - | 0.35 | - | - | - | - |
| | Safety - refuge chambers | 1.20 | 0.20 | 0.25 | 0.25 | 0.25 | - | - | - | 0.25 | - | - | - | - |
| | Safety - mine rescue equipment | 0.60 | 0.20 | 0.20 | - | - | - | - | - | 0.20 | - | - | - | - |
| | Electrical distribution | 3.32 | 1.80 | 0.19 | 0.19 | 0.19 | 0.19 | 0.19 | 0.19 | 0.19 | - | 0.19 | - | - |
| | Sub-total | 120.17 | 20.31 | 18.74 | 29.87 | 8.84 | 6.82 | 13.34 | 9.15 | 5.58 | 6.63 | 0.90 | - | - |
| | Contingency @ 15% | 18.03 | 3.05 | 2.81 | 4.48 | 1.33 | 1.02 | 2.00 | 1.37 | 0.84 | 0.99 | 0.13 | - | - |
| | Total capital cost | 138.20 | 23.35 | 21.55 | 34.35 | 10.17 | 7.85 | 15.34 | 10.52 | 6.41 | 7.62 | 1.03 | - | - |
| PJ/ABE/ADD/CCS/AAN/NMW/CAE | Bisha_2016R&R-Update_TechRep_2CN010-024_20170808_aan_cae | August 2017 |
| SRK Consulting |
| NI 43-101 Technical Report Bisha Mine 2016, Eritrea | Page 286 |
Operating Costs
The estimate includes labour, power consumption, major consumables and maintenance cost associated with the major mine operation activities. The Harena UG underground operating cost estimates are presented in Table 23.23.
The underground operating cost estimate has been prepared from first principles using supplier quotations, contractor unit mining costs, inputs and assumptions obtained from recent project and mining operations, and BMSC supplied inputs.
Table 23.23: Harena UG – Operating cost estimate
| | Cost Item | LOM Cost
($000s) | Unit Cost
($/t mill feed) |
| | Operating Development | | |
| | 5mH x 5.5mW heading | 148,059 | 11.62 |
| | Ore Production | | |
| | LH drilling | 8,288 | 0.65 |
| | ITH drilling | 3,809 | 0.30 |
| | Blasting | 9,976 | 0.78 |
| | Bogging | 15,233 | 1.20 |
| | Hauling | 32,881 | 2.58 |
| | Surface Hauling | 32,611 | 2.56 |
| | Backfill | 57,853 | 4.54 |
| | Subtotal | 160,653 | 12.61 |
| | Utilities and Labour | | |
| | Auxiliary equipment | 13,153 | 1.03 |
| | Power | 52,821 | 4.15 |
| | Labour | 99,816 | 7.84 |
| | Dewatering | 521 | 0.04 |
| | Ventilation | 3,434 | 0.27 |
| | Subtotal | 169,745 | 13.33 |
| | Contractor Equipment and O/H | | |
| | Equipment Allocation Cost | 10,882 | 0.85 |
| | Local Staff training | 16,642 | 1.31 |
| | Administration and Margin (15%) | 26,284 | 2.06 |
| | Subtotal | 53,808 | 4.22 |
| | Operating Costs Total | 532,265 | 41.78 |
The life of mine total operating cost for the Harena UG operation is before any capitalisation of pre-commercial operating expenditure.
The contractor’s mobile equipment fleet costs have been allocated to the operating cost estimate based on an annual equipment charge as summarized in Table 23.24.
| PJ/ABE/ADD/CCS/AAN/NMW/CAE | Bisha_2016R&R-Update_TechRep_2CN010-024_20170808_aan_cae | August 2017 |
| SRK Consulting |
| NI 43-101 Technical Report Bisha Mine 2016, Eritrea | Page 287 |
Table 23.24: Harena UG – Contractor annual mobile equipment costs
| | Equipment Type | Model | Cost
($ p.a.) |
| | Jumbo | Sandvik DD421 | 242,000 |
| | Bolter | Sandvik DS311 | 151,250 |
| | UG loader | Sandvik LH517 | 236,500 |
| | UG truck | CAT AD55B | 455,485 |
| | LH drill | Sandvik DL431 | 248,050 |
| | ITH drill | ITH Drill | 382,103 |
| | Development charge | Normet Charmec MC605 DA | 136,002 |
| | Production charge | Normet Charmec LC605 VE | 204,149 |
| | Services | Normet Utilift MF 540 | 113,980 |
| | Grader | Veekmas FG 15 C | 175,835 |
| | Light vehicle | Toyota Hurth | 23,700 |
| | Water truck | Normet Multimec MF 100 (water) | 97,628 |
| | Fuel truck | Normet Multimec MF 100 (fuel) | 98,173 |
| | Service truck | Normet Multimec MF 100 (service) | 99,004 |
| 23.4.1 | Underground Infrastructure |
Dewatering
For the proposed mining layouts at Bisha Main UG and Harena UG, the mine dewatering infrastructure required for normal operation will have the following components:
| | - Main pumping system - capable of pumping the required volume of water from the mine
- Development pumping system - to collect water from the decline development and pump to the main pumping system
- Local pumping - to collect water from the development face and pump to the main pumping system
|
The arrangement of the pumping system will be dependent upon the location of the lowest main pump station in relation to the decline development. It is possible that additional submersible pumps will be required to assist with pumping to the lowest main pump chamber should the water produced in the decline be excessive.
The pump selection criteria were based on required flow rate, operating pressure and water quality. The current understanding at Bisha Main and Harena is that ground water inflow is not expected to cause any operational issues.
Water Supply
Service water for the underground operation is used primarily for drilling, dust control, workshops, washing and fire suppression of class “A” fires. The water will be supplied from the service water tank located near the decline portal and gravity fed into the decline pipeline. From there it will be distributed to the sublevels via a pipeline network.
| PJ/ABE/ADD/CCS/AAN/NMW/CAE | Bisha_2016R&R-Update_TechRep_2CN010-024_20170808_aan_cae | August 2017 |
| SRK Consulting |
| NI 43-101 Technical Report Bisha Mine 2016, Eritrea | Page 288 |
Pressure reduction valves will be installed as needed. Spray nozzles operated by the mobile equipment drivers will be installed at any material loading points for dust control.
Potable water will not be supplied to the underground mine by a separate piping system. Instead, potable water will be delivered to each refuge station and lunchroom. Mine operators will carry personal water bottles.
Electrical Power
Electrical power for Bisha Main UG and Harena UG will be supplied from the Bisha power generation plant located adjacent to the processing plant.
Design of the electrical infrastructure considered the mine equipment, ventilation, air cooling and dewatering loads. Electrical loads have been estimated for cost estimation, however, actual fixed plant electrical loads will vary on an annual basis according to dewatering and ventilation demand.
Table 23.25 and Table 23.26 summarise the estimated average electrical loads for the Bisha Main and Harena underground mines.
Table 23.25: Bisha Main UG – Estimate of underground electrical loads
| | Electrical Load | Average Load
(MW) | Average Usage
(MWh) |
| | Mobile Equipment | 0.15 | 1,333 |
| | Ventilation Fans | 1.71 | 14,804 |
| | Bulk Air Cooling Plant | 0.98 | 8,500 |
| | Dewatering Pumps | 1.22 | 10,512 |
| | Air Compressors | 0.27 | 2,286 |
| | Total | 4.33 | 37,436 |
Table 23.26: Harena UG – Estimate of underground electrical loads
| | Electrical Load | Average Load
(MW) | Average Usage
(MWh) |
| | Mobile Equipment | 0.13 | 1,126 |
| | Ventilation Fans | 1.71 | 14,804 |
| | Bulk Air Cooling Plant | 0.49 | 4,250 |
| | Dewatering Pumps | 1.22 | 10,512 |
| | Air Compressors | 0.27 | 2,286 |
| | Total | 3.82 | 32,978 |
Electrical power for the underground mines will be supplied by a feeder sourced from a main 33 kV substation located on surface. Construction of an overland powerline will be required for the Harena underground mine.
| PJ/ABE/ADD/CCS/AAN/NMW/CAE | Bisha_2016R&R-Update_TechRep_2CN010-024_20170808_aan_cae | August 2017 |
| SRK Consulting |
| NI 43-101 Technical Report Bisha Mine 2016, Eritrea | Page 289 |
The return air raises will contain the primary electrical feeders for both mines. Ties and switchgear will be situated at strategic levels to provide a level of redundancy as well as switching capability for maintenance and construction.
Initial decline and lateral development will be provided with electrical power from a temporary feeder until the return air raises are developed to a point where cables can be installed in the raises. The temporary feeder can then be de-commissioned.
Ventilation
The ventilation design criteria were based on internationally recognised standards. Total airflow requirements for mobile diesel fleet are developed from a ventilation rate of 0.06 m3/s/kW for the dilution and removal of common diesel engine emissions (gaseous and particulate).
In addition to the heat from the ambient surface environment and the rock exposed during mine development, the diesel equipment fleet also represents a significant source of heat. In accordance with recommended procedures for determining the airflow requirements based on the heat produced by diesel equipment, a second airflow determination was made based on the engine packages for the two most significant pieces of equipment expected to operate at Bisha Main and Harena - the AD55 haul truck and the LH517 loader. This analysis showed that a minimum airflow required to mitigate the hat produced by the diesel equipment is 0.075 m3/s/kW. This was used for subsequent ventilation design at Bisha Main and Harena.
The ventilation systems for Bisha Main UG and Harena UG each consist of two separate air streams or splits. The haulage/transport split receives fresh air from the main decline portal. Air travels down the ramp, ventilating all ramp traffic and is eventually exhausted through the Return Air Raise (RAR). Having fresh air downcast the main decline provides antitropal flow over loaded haul trucks (increasing the relative velocity of the air stream and assisting evaporative cooling). In parallel to the main ramp, an additional supply of intake air enters the mine through the Fresh Air Raise (FAR) and is transported directly to the active development/production levels at or near the bottom of the mine. In this manner, fresh air is delivered directly to the working areas where it is needed, and without passing over any equipment operating in the ramp. Air is picked up at each FAR on the active levels and delivered to the working face via an auxiliary ventilation system (blowing fan and duct). The mine ventilation system provides two fresh air streams for the mine, aiding emergency egress or refuge scenarios.
The airflow requirements (based on heat load) for Harena are presented in Table 23.28. This was used for the ventilation modelling.
It was assumed that the airflow distribution for the mine will be based upon the largest combination of diesel equipment that will be utilised during the mining cycle (drilling, blasting, mucking, bolting). For Harena UG, the greatest ventilation demand will be during the mucking cycle, when an AD55 haul truck (579 kW engine), and a 17 t LHD (298 kW engine) will both be in operation on an active level. It was assumed that the truck will wait to be loaded at the intersection of the level access and the first ore drive, so that the LHD and the truck will operate in separate ventilation splits (one auxiliary fan and duct for each side of the level). A total of 30 m3/s will be required for each active auxiliary system or heading/level based on the expected diesel emissions and heat load.
| PJ/ABE/ADD/CCS/AAN/NMW/CAE | Bisha_2016R&R-Update_TechRep_2CN010-024_20170808_aan_cae | August 2017 |
| SRK Consulting |
| NI 43-101 Technical Report Bisha Mine 2016, Eritrea | Page 290 |
For climate modeling, the maximum allowable wet bulb (WB) temperatures in the mine were limited to 28°C.
The following standards for maximum velocity were followed to for the ventilation design:
| | - dedicated ventilation shafts: 20 m/s
- dedicated ventilation entries: 10 m/s
- main haulage routes: 6 m/s
|
Refrigeration of the primary ventilation circuit was evaluated for Bisha Main and Harena. It was concluded that refrigeration would not be necessary on the basis that the flow rates adopted to address the heat load from the diesel equipment would provide sufficient cooling capacity, along with the use of air-conditioned cabins on mobile equipment.
The minimum velocity for active areas of the mine was limited to 1 m/s in areas where diesel equipment was expected to operate and 0.3 m/s in areas where diesel equipment was not expected to operate.
Auxiliary ventilation will be provided whenever the excavation extends beyond 20 m from the ventilation circuit, and will consist of an auxiliary fan installed on the fresh air side of the main ventilation circuit and duct advanced to within 10 m of the face. The production levels at Harena UG will be ventilated with auxiliary fans/ducts that extend from the FAR to the ore drives. Twin duct systems, one for each half of the level consisting of a 100 kW fan mounted in the FAR Access bulkhead connected to a 1.22 m-diameter flexible duct, will provide ventilation to each active heading. If T-intersections fitted with butterfly valves are utilised at each ore drive/heading, then a single fan and duct system will be sufficient to supply fresh air to the active headings on each side of the level.
Table 23.27: Bisha Main UG – Airflow requirements (based on heat load)
| | Equipment Type | Model | Max Units Required | Utilisation | Installed Engine Power | Fresh Air Required |
| | (kW) | (m3/s) |
| | Jumbo | Sandvik DD421 | 1 | 15% | 110 | 1.2 |
| | Bolter | Sandvik DS311 | 1 | 15% | 110 | 1.2 |
| | UG Loader | Sandvik LH517 | 3 | 52% | 298 | 34.9 |
| | UG Truck | CAT AD55B | 3 | 67% | 579 | 87.3 |
| | LH Drill | Sandvik DL431 | 1 | 10% | 110 | 0.8 |
| | ITH Drill | ITH Drill | 2 | 10% | 130 | 2.0 |
| | Development Charge | Normet Charmec MC605 DA | 1 | 33% | 110 | 2.7 |
| | Production Charge | Normet Charmec LC605 VE | 1 | 33% | 110 | 2.7 |
| | Services | Normet Charmec MF540 | 1 | 25% | 54 | 1.0 |
| | Grader | Veekmas FG15C | 1 | 60% | 129 | 5.8 |
| | Light Vehicle | Toyota Hurth | 8 | 20% | 151 | 18.1 |
| | Water Truck | Normet Multimec MF100 (water) | 1 | 25% | 110 | 2.1 |
| | Fuel Truck | Normet Multimec MF100 (fuel) | 1 | 25% | 110 | 2.1 |
| | Service Truck | Normet Multimec MF100 (service) | 1 | 25% | 110 | 2.1 |
| | TOTAL @ 0.075 m3/s/kW | | | | 164.0 |
| PJ/ABE/ADD/CCS/AAN/NMW/CAE | Bisha_2016R&R-Update_TechRep_2CN010-024_20170808_aan_cae | August 2017 |
| SRK Consulting |
| NI 43-101 Technical Report Bisha Mine 2016, Eritrea | Page 291 |
Table 23.28: Harena UG – Airflow requirements (based on heat load)
| | Equipment Type | Model | Max Units Required | Utilisation | Installed Engine Power | Fresh Air Required |
| | (kW) | (m3/s) |
| | Jumbo | Sandvik DD421 | 2 | 15% | 110 | 2.5 |
| | Bolter | Sandvik DS311 | 1 | 15% | 110 | 1.2 |
| | UG Loader | Sandvik LH517 | 2 | 52% | 298 | 23.2 |
| | UG Truck | CAT AD55B | 3 | 67% | 579 | 87.3 |
| | LH Drill | Sandvik DL431 | 1 | 10% | 110 | 0.8 |
| | ITH Drill | ITH Drill | 1 | 10% | 130 | 1.0 |
| | Development Charge | Normet Charmec MC605 DA | 1 | 33% | 110 | 2.7 |
| | Production Charge | Normet Charmec LC605 VE | 1 | 33% | 110 | 2.7 |
| | Services | Normet Charmec MF540 | 2 | 25% | 54 | 2.0 |
| | Grader | Veekmas FG15C | 1 | 60% | 129 | 5.8 |
| | Light Vehicle | Toyota Hurth | 7 | 20% | 151 | 15.9 |
| | Water Truck | Normet Multimec MF100 (water) | 1 | 25% | 110 | 2.1 |
| | Fuel Truck | Normet Multimec MF100 (fuel) | 1 | 25% | 110 | 2.1 |
| | Service Truck | Normet Multimec MF100 (service) | 1 | 25% | 110 | 2.1 |
| | TOTAL @ 0.075 m3/s/kW | | | | 151.4 |
Compressed Air
Compressed air for the underground mining operations will be provided by air compressors located near each portal and reticulated via a pipeline network.
Communications
Communications in the underground mines will be facilitated by a leaker feeder network and hard wired telephone system.
Explosives Storage & Blast Initiation
The underground mines will utilise the main surface magazine for storage of bulk explosives. Both mines will have an underground magazine for storage of small quantities of explosives.
Centralised blasting will be utilised in the underground mine to initiate development and production blasts.
Equipment Maintenance & Service Bay
Each mine will have workshops with two service bays and wash-down bay, located near each portal to provide routine service and minor maintenance/repair work on the loaders and drills. The workshops will be ventilated directly to the return air raise.
Major maintenance will be carried out at the existing surface workshop (located near the processing plant), along with the haulage trucks and other mobile equipment.
| PJ/ABE/ADD/CCS/AAN/NMW/CAE | Bisha_2016R&R-Update_TechRep_2CN010-024_20170808_aan_cae | August 2017 |
| SRK Consulting |
| NI 43-101 Technical Report Bisha Mine 2016, Eritrea | Page 292 |
Fuel Storage & Distribution
Diesel fuel, oil and lubricants will be delivered by a fuel and service truck to mobile equipment underground. Trucks, light vehicles and support equipment will refuel on surface.
Mines Rescue
Bisha will establish a mines rescue team based on a cross-section of members selected from the project site. At least two full teams will be available on rotation for rescue efforts. Surface and underground training facilities will be necessary for ongoing employee training and refresher training programs.
Mines rescue equipment will include a fire tender, ambulance and all supporting testing and maintenance equipment for mine rescue purposes will be available.
Emergency Egress
At each mine, a ladderway will be installed in the fresh air raise to provide a second means of egress from the underground workings.
Refuge Station
PorTable refuge chambers capable of accommodating 12 to 16 people will be positioned at each active sublevel. The units will be equipped with CO and CO2 scrubbers, medical oxygen cylinders, oxygen candle, air conditioning, first aid kit, radio and a toilet. They would provide protection for at least 36 hours as a self-contained unit.
Dust Control
A dedicated water truck will be used for dust suppression of the decline and active sublevels. Spray nozzles operated by the mobile equipment drivers will be installed at any material loading points for dust control.
Fire Protection
Fire extinguishing equipment will be provided in each refuge station, on all mobile equipment, substations, pump stations, the workshop, explosives magazine and other strategic locations.
| 23.4.3 | Equipment selection |
The mobile equipment selected for Bisha is consistent with mechanised metalliferous operations worldwide. Factors considered in the selection of equipment type include:
| | - Past experience and local competency with selected equipment
- Price competitiveness
|
| PJ/ABE/ADD/CCS/AAN/NMW/CAE | Bisha_2016R&R-Update_TechRep_2CN010-024_20170808_aan_cae | August 2017 |
| SRK Consulting |
| NI 43-101 Technical Report Bisha Mine 2016, Eritrea | Page 293 |
The mining contract will be structured such that the preferred contractor and BMSC will work together in the final selection of the optimal mining fleet to suit the mine and ensure a productive and cost effective operation.
The availability and utilisation of availability modifying factors for the primary fleet are presented in Table 23.29.
Table 23.29: Primary underground mobile equipment availability and utilisation
| | Equipment Type | Availability | Utilization of Availability |
| | Jumbos | 75% | 56% |
| | LH drills | 75% | 45% |
| | ITH drill | 80% | 57% |
| | Loaders | 70% | 53% |
| | Trucks | 80% | 67% |
The Bisha Main UG primary mobile equipment fleet is summarised in Table 23.30. Fleet productivities have been based on first principal calculations, benchmarking and practical experience. Drills, bolters, loaders, trucks, charge machine and support equipment requirements were based on the estimated required operating hours in each period and the number of units of each piece of equipment needed to meet those hours.
The Harena UG primary mobile equipment fleet is summarised in Table 23.31. Fleet productivities have been based on first principal calculations, benchmarking and practical experience. Drills, bolters, loaders, trucks, charge machine and support equipment requirements were based on the estimated required operating hours in each period and the number of units of each piece of equipment needed to meet those hours.
| PJ/ABE/ADD/CCS/AAN/NMW/CAE | Bisha_2016R&R-Update_TechRep_2CN010-024_20170808_aan_cae | August 2017 |
| SRK Consulting |
| NI 43-101 Technical Report Bisha Mine 2016, Eritrea | Page 294 |
Table 23.30: Bisha Main UG – Primary mobile equipment requirements
| | Equipment Type | Model | Year 1 | Year 2 | Year 3 | Year 4 | Year 5 | Year 6 | Year 7 | Year 8 |
| | Jumbo | Sandvik DD421 | 1 | 1 | 1 | 1 | 1 | 1 | 1 | 1 |
| | Bolter | Sandvik DS311 | 1 | 1 | 1 | 1 | 1 | 1 | 1 | 1 |
| | UG Loader | Sandvik LH517 | 1 | 1 | 1 | 1 | 2 | 2 | 1 | 1 |
| | UG Truck | CAT AD55B | 1 | 2 | 2 | 2 | 2 | 2 | 2 | 1 |
| | LH Drill | Sandvik DL431 | 1 | 1 | 1 | 1 | 1 | 1 | 1 | 1 |
| | ITH Drill | ITH Drill | 1 | 1 | 1 | 1 | 1 | 1 | 1 | 1 |
| | Development Charge | Normet Charmec MC605 DA | 1 | 1 | 1 | 1 | 1 | 1 | 1 | 1 |
| | Production Charge | Normet Charmec LC605 VE | 1 | 1 | 1 | 1 | 1 | 1 | 1 | 1 |
| | Services | Normet Charmec MF540 | 1 | 1 | 1 | 1 | 1 | 1 | 1 | 1 |
| | Grader | Veekmas FG15C | 1 | 1 | 1 | 1 | 1 | 1 | 1 | 1 |
| | Light Vehicle | Toyota Hurth | 3 | 4 | 6 | 6 | 6 | 6 | 6 | 2 |
| | Water Truck | Normet Multimec MF100 (water) | 1 | 1 | 1 | 1 | 1 | 1 | 1 | 1 |
| | Fuel Truck | Normet Multimec MF100 (fuel) | 1 | 1 | 1 | 1 | 1 | 1 | 1 | 1 |
| | Service Truck | Normet Multimec MF100 (service) | 1 | 1 | 1 | 1 | 1 | 1 | 1 | 1 |
| | Total | 16 | 18 | 20 | 20 | 21 | 21 | 20 | 15 |
Table 23.31: Harena UG – Primary mobile equipment requirements
| | Equipment Type | Model | Year 1 | Year 2 | Year 3 | Year 4 | Year 5 | Year 6 | Year 7 | Year 8 | Year 9 | Year 10 | Year 11 | Year 12 |
| | Jumbo | Sandvik DD421 | 1 | 1 | 2 | 2 | 2 | 2 | 2 | 2 | 2 | 1 | 1 | 1 |
| | Bolter | Sandvik DS311 | 2 | 2 | 2 | 2 | 2 | 2 | 2 | 2 | 2 | 1 | 1 | 1 |
| | UG Loader | Sandvik LH517 | 1 | 2 | 2 | 2 | 2 | 2 | 2 | 2 | 2 | 2 | 2 | 1 |
| | UG Truck | CAT AD55B | 1 | 2 | 3 | 3 | 3 | 4 | 4 | 4 | 4 | 3 | 3 | 1 |
| | LH Drill | Sandvik DL431 | 1 | 1 | 1 | 1 | 1 | 1 | 1 | 1 | 1 | 1 | 1 | 1 |
| | ITH Drill | ITH Drill | 1 | 1 | 1 | 2 | 2 | 2 | 2 | 2 | 2 | 2 | 2 | 1 |
| | Development Charge | Normet Charmec MC605 DA | 1 | 1 | 1 | 1 | 1 | 1 | 1 | 1 | 1 | 1 | 1 | 1 |
| | Production Charge | Normet Charmec LC605 VE | 1 | 1 | 1 | 1 | 1 | 1 | 1 | 1 | 1 | 1 | 1 | 1 |
| | Services | Normet Charmec MF540 | 1 | 1 | 1 | 1 | 1 | 1 | 1 | 1 | 1 | 1 | 1 | 1 |
| | Grader | Veekmas FG15C | 1 | 1 | 1 | 1 | 1 | 1 | 1 | 1 | 1 | 1 | 1 | 1 |
| | Light Vehicle | Toyota Hurth | 3 | 7 | 8 | 10 | 10 | 10 | 10 | 10 | 10 | 9 | 9 | 1 |
| | Water Truck | Normet Multimec MF100 (water) | 1 | 1 | 1 | 1 | 1 | 1 | 1 | 1 | 1 | 1 | 1 | 1 |
| | Fuel Truck | Normet Multimec MF100 (fuel) | 1 | 1 | 1 | 1 | 1 | 1 | 1 | 1 | 1 | 1 | 1 | 1 |
| | Service Truck | Normet Multimec MF100 (service) | 1 | 1 | 1 | 1 | 1 | 1 | 1 | 1 | 1 | 1 | 1 | 1 |
| | Total | 17 | 23 | 26 | 29 | 29 | 30 | 30 | 30 | 30 | 26 | 26 | 14 |
| PJ/ABE/ADD/CCS/AAN/NMW/CAE | Bisha_2016R&R-Update_TechRep_2CN010-024_20170808_aan_cae | August 2017 |
| SRK Consulting |
| NI 43-101 Technical Report Bisha Mine 2016, Eritrea | Page 295 |
| 23.4.4 | Metallurgy and Processing |
Metallurgical characteristics of the mineralisation at Bisha Main UG and Harena UG are the same for the underground mineralisation as is for the open pit mine. Additional information on metallurgical testwork, recoveries and mineralisation types can be found in Section 12 and Section 16 of this report. Simple recovery percentages were applied to each commodity and ore type, by deposit. The recovery percentages are shown in Table 23.32.
Table 23.32: Processing recovery assumptions
| | Supergene Ore Recoveries to Cu Concentrate | Bisha Main UG | Harena UG |
| | Gold Recovery | 20% | N/A |
| | Silver Recovery | 35% | N/A |
| | Copper Recovery | 80% | N/A |
| | | | |
| | Primary Ore Recoveries to Cu Concentrate | | |
| | Gold Recovery | 15% | 36% |
| | Silver Recovery | 27% | 29% |
| | Copper Recovery | 70% | 85% |
| | | | |
| | Primary Ore Recoveries to Zn Concentrate | | |
| | Zinc Recovery | 77% | 85% |
| | Silver Recovery | 23% | 23% |
The mine plan for underground mining at Bisha Main UG and Harena UG assumes the existing processing plant will be utilised.
| 23.4.5 | Surface Infrastructure |
No additional surface infrastructure was considered necessary for the underground mining operations.
In general, the TMF is operating satisfactorily although, for reasons related to dam safety, KP has indicated the rate at which TMF water is reclaimed needs to be increased to the maximum possible extent. Provided the KP recommendations arising from their bi-annual audits are appropriately addressed, it will be possible for the TMF to be safely raised to levels required by the revised mine plan.
Waste rock from the underground operations will fall into one of two geochemical categories controlled by lithological makeup: non-potentially acid generating (NAG) or potentially acid generating (PAG). Most of the waste rock is classified as PAG material. Identification of NAG material can only be done by testing. There is currently one NAG dump and one PAG dump on site. NAG material is being used for embankment construction at the TMF.
| PJ/ABE/ADD/CCS/AAN/NMW/CAE | Bisha_2016R&R-Update_TechRep_2CN010-024_20170808_aan_cae | August 2017 |
| SRK Consulting |
| NI 43-101 Technical Report Bisha Mine 2016, Eritrea | Page 296 |
A cost allocation of $0.96/t-mined from the underground operation has been added to the operating costs to account for the additional tailings and waste rock management.
Additional waste rock characterisation and tailing facilities are discussed in further details in Section 17 of the technical report.
The economic analysis of the options was undertaken using standard yearly discounted cashflow modelling in Excel®. Modelling periods were calendar years. The currency of the evaluation was “real” 2017 US Dollars. A base discount rate of 10% was used.
No cashflows prior to 2016 were considered. Cashflows were discounted to 1st January 2017 using mid-year assumptions for cashflow timing.
Mill throughput rates were constrained to 2.4 Mtpa for all cases.
Mine Design and Evaluation
The mine designs used for both Harena UG and Bisha Main UG were developed using semi-automated processes for the delineation of economic stopes and shapes. Bisha Main UG is assumed to be mined by Sublevel Caving (SLC), and Harena UG by Long Hole Open Stoping (LHOS) with cemented rock fill.
A set of assumptions based on estimated operating costs was used to define the economic limits of the stopes in the context of the Resource Price NSR in the block model. An allowance was made for the cost of operating development as well as direct production costs.
Development designs were added and a schedule of development estimated based on realistic advance rates and overall logistics constraints were developed.
Revenue Calculation
For design and for evaluation, the PEA used the “Resource” price deck as shown in Table 23.33.
Table 23.33: Price assumptions for design and evaluation for Bisha Main UG and Harena UG
| | Modelled Pricing Scenarios | Units | Resource Prices | Reserve Prices |
| | Zinc | $/lb | 1.20 | 1.00 |
| | Copper | $/lb | 3.00 | 2.70 |
| | Silver | $/oz | 22.00 | 18.00 |
| | Gold | $/oz | 1,275 | 1,200 |
Offsite costs were estimated using BMSC-supplied assumptions. It was assumed that conventionally saleable concentrates would be produced from the underground feed material.
| PJ/ABE/ADD/CCS/AAN/NMW/CAE | Bisha_2016R&R-Update_TechRep_2CN010-024_20170808_aan_cae | August 2017 |
| SRK Consulting |
| NI 43-101 Technical Report Bisha Mine 2016, Eritrea | Page 297 |
Evaluation Costing
First principles cost model for both Bisha Main UG and Harena UG were used to estimate the costing for the purposes of evaluation. It was assumed that the mines were operated by contractor for the first three years then transition to owner-operated. At this point in the model, equipment lease costs are stopped and a capital charge for purchase of equipment is applied. The contractor overhead and profit allowance is also stopped.
Underground Unit Costs
Unit costs for the underground mines are summarised in Table 23.34. The Harena UG mine has higher variable costs due to a higher cost mining method and additional haulage costs. However, the higher tonnage reduces the per-tonne cost of the fixed components of the costs such as ventilation and mine management.
Table 23.34: Unit cost summary for underground mines
| | Cash Operating Cost | Bisha Main UG
($/t mill feed) | Harena UG
($/t mill feed) |
| | UG mining | 42.29 | 41.78 |
| | Concentrator services | 17.44 | 17.44 |
| | Power | 10.21 | 10.21 |
| | General and administrative | 10.38 | 10.38 |
| | Total unit operating costs | 80.32 | 79.81 |
Capital Costs
Capital costs for the underground are summarised in Table 23.35. An additional $10M was allowed for PFS and FS study costs for the purposes of economic evaluation for each of the mines. A period of two years of preliminary decline development, exploration and study was assumed prior to the commitment of construction.
| PJ/ABE/ADD/CCS/AAN/NMW/CAE | Bisha_2016R&R-Update_TechRep_2CN010-024_20170808_aan_cae | August 2017 |
| SRK Consulting |
| NI 43-101 Technical Report Bisha Mine 2016, Eritrea | Page 298 |
Table 23.35: Capital cost summary
| | Underground Mine | LOM
($M) |
| | Bisha UG | |
| | Bisha Development Capital | 34.4 |
| | Bisha Plant and Equipment Capital | 45.3 |
| | Bisha UG Mine Capex | 79.6 |
| | PFS and FS Study Costs (excl. decline) | 10.0 |
| | Total Capital Cost Estimate | 89.6 |
| | Harena UG | |
| | Harena Development Capital | 49.8 |
| | Harena Plant and Equipment Capital | 88.4 |
| | Harena UG Mine Capex | 138.2 |
| | PFS and FS Study Costs (excl. decline) | 10.0 |
| | Total Standalone Capital | 148.2 |
Economic Analysis
The underground mines were primarily assessed in the context of the open pit strategies. Evaluation was undertaken by determining the incremental cashflows assuming the two open pit mines are operated as well as the underground. The incremental valuations are based on the change to cashflows due to the addition of the underground mines to the open pit-only strategy.
| PJ/ABE/ADD/CCS/AAN/NMW/CAE | Bisha_2016R&R-Update_TechRep_2CN010-024_20170808_aan_cae | August 2017 |
| SRK Consulting |
| NI 43-101 Technical Report Bisha Mine 2016, Eritrea | Page 299 |
Table 23.36: Underground incremental cashflow summary
| | Item | Bisha Main UG
($M) | Harena UG
($M) |
| | Revenue by Payable Metal | | |
| | Zinc | 697.5 | 1,062.4 |
| | Copper | 177.4 | 707.2 |
| | Silver | 53.1 | 73.0 |
| | Gold | 16.7 | 146.2 |
| | Total | 944.8 | 1,988.9 |
| | | | |
| | Total TCRC and Freight | 208.7 | 402.1 |
| | Total Royalty | 41.4 | 84.8 |
| | Net Revenue | 694.7 | 1,502.0 |
| | | | |
| | Operating Costs | | |
| | UG Mining Cost | 211.0 | 532.3 |
| | Overland Ore Haulage | - | 32.6 |
| | Concentrator Plant | 87.0 | 222.1 |
| | Power | 50.9 | 130.1 |
| | G&A | 51.8 | 132.3 |
| | Total Operating Costs | 400.7 | 1,049.4 |
| | | | |
| | Operating Cash Flow | 294.0 | 452.6 |
| | | | |
| | Capital Costs | | |
| | Bisha UG PFS and FS Capital | 30.0 | - |
| | Bisha Underground Capital | 59.6 | - |
| | Harena UG PFS and FS Capital | - | 30.0 |
| | Harena Underground Capital | - | 118.2 |
| | Mill and TSF Capital for UG (Included in OP capital) | 4.8 | 12.2 |
| | Total Capital Costs | 94.4 | 160.4 |
| | | | |
| | Working Capital | 6.3 | 15.4 |
| | | | |
| | Pre-tax Cash Flow | 193.3 | 276.8 |
| | | | |
| | Income Tax | 75.9 | 114.7 |
| | | | |
| | After-tax Net Cash Flow | 117.5 | 162.1 |
| PJ/ABE/ADD/CCS/AAN/NMW/CAE | Bisha_2016R&R-Update_TechRep_2CN010-024_20170808_aan_cae | August 2017 |
| SRK Consulting |
| NI 43-101 Technical Report Bisha Mine 2016, Eritrea | Page 300 |
Conclusions
It is assumed that the Harena UG mine development commences one year after Bisha Main UG mine development commences; Bisha Main UG LOM is eight years and Harena UG LOM is 12 years. The incremental net present value of the each of the underground mines is shown in Table 23.37.
Table 23.37: Underground incremental Net Present Values
| | Modelled Pricing Scenarios | Units | Resource Prices | Reserve Prices |
| | Zinc | $/lb | 1.20 | 1.00 |
| | Copper | $/lb | 3.00 | 2.70 |
| | Silver | $/oz | 22.00 | 18.00 |
| | Gold | $/oz | 1,275 | 1,200 |
| | Incremental NPV @ 10% | | At Resource
Prices | At Reserve
Prices |
| | Bisha Main UG | $M | 51.0 | 6.7 |
| | Harena UG | $M | 33.4 | -30.2 |
The mine presents a modest value proposition at resource pricing. The reduction to reserve prices (approximately 20% reduction) renders Harena underground sub-economic and Bisha Main underground marginal.
In the case of Harena UG, a redesign of the mine using higher cut-off grades may result in a more focussed schedule that offsets part of the value “loss” and demonstrates positive economics. In the case of Bisha, a significantly altered mine plan using higher grades may not retain enough volume to amortise the capital costs of the mine.
| 23.5 | Risks and Opportunities |
| | - Underground mining inherently carries more risk than open pit mining due additional complexity and the greater exposure to geotechnical and hydrogeological conditions.
- Underground mining may be inherently more difficult to execute than open pit mining. This issue is exacerbated as there is no site-specific experience (although some of the current management team have significant underground experience at other sites). There is also extremely limited experience within the country as a whole. Recruitment and training of an underground workforce and management team may prove difficult. Underground construction and operations at the site would have to be effectively self-contained with limited support from OEMs and other relevant engineering and support firms assumed to be available in-country.
- Some of the material in the mine plan for the Bisha underground PEA would be mined by a larger open pit that would be an extension of the current Reserves plan. The expansion of the open pit plan would impact the mine plan for the underground and materially affect the economics of the mine.
- Relatively little specific geotechnical data is available for the underground mines. Additional information gathered during a PFS may render the mining methods proposed (in this PEA) for Bisha Main UG and Harena UG sub-optimal; and may materially affect the economics of the underground mines.
- Structural mapping has recently carried out in the Bisha Main open pit. This work has shown that the structural complexity is greater than initially envisaged. On this basis, it is reasonable to conclude that the resource below the open pit will be significantly more complex than currently interpreted and therefore increase the complexity of the underground mine. This has the potential to materially affect the underground mine.
|
| PJ/ABE/ADD/CCS/AAN/NMW/CAE | Bisha_2016R&R-Update_TechRep_2CN010-024_20170808_aan_cae | August 2017 |
| SRK Consulting |
| NI 43-101 Technical Report Bisha Mine 2016, Eritrea | Page 301 |
| | - Additional material from satellite deposits such as Asheli may amortise the risk of executing underground mining at Bisha and Harena, as well as assist in defraying fixed site costs in the period following open-pit depletion.
|
| 23.6 | Conclusions and Recommendations |
SRK makes the following conclusions and recommendations based on the study of underground mining at Bisha Main and Harena.
| | - Compare the execution risk of underground mining with the execution risk associated with an expansion of the Bisha open pit to better understand the trade-off between open pit and underground mining in these conditions.
- Ensure that planning for the mine continues to take account of the lack of site and in-country capability and is realistic in terms of the likely cost of an effective execution strategy, including the use of significant contractor and expatriate expertise.
- Develop the Bisha Main and Harena underground projects each as two phases, where Phase 1 would consist of initial decline excavation and diamond drilling to further delineate the orebody and obtain additional data in the areas of geotechnical and hydrogeological characterisation, and resource delineation on which to proceed with a pre-feasibility study that would ultimately inform the decision to proceed with Phase 2 Feasibility and construction.
|
| PJ/ABE/ADD/CCS/AAN/NMW/CAE | Bisha_2016R&R-Update_TechRep_2CN010-024_20170808_aan_cae | August 2017 |
| SRK Consulting |
| NI 43-101 Technical Report Bisha Mine 2016, Eritrea | Page 302 |
| 24 | Interpretations and Conclusions |
| | - The Mineral Resources for Bisha Main, Harena, Asheli, Northwest and Hambok deposits are classified and reported in accordance with the CIM Definition Standards for Mineral Resources and Mineral Reserves (CIM, 2014).
- The Resource classifications reflect the density of data, confidence of the geological interpretation and the grade-tonnage predictions, and the level of knowledge of metallurgical properties.
- The accuracy of the grade-tonnage predictions is such that a highly selective mining method at an elevated cut-off cannot be confidently chosen predicated on the current Indicated and Inferred resources.
|
SRK has reached the following conclusions in relation to the mine engineering aspects of the Bisha property.
| | - The Bisha project provides 9.6 Mt of mineable ore at 6.15% Zn, 1.05% Cu, 44.86 g/t Ag and 0.69 g/t Au. This amount of ore will be mined from Bisha Main and Harena pits and can supply the mill up to the 2021 Q3.
- The Bisha Main and Harena deposits are mined as a conventional open pit operation. At Bisha Main, most of the in-pit haulage for waste will be carried out using 65-tonne haulage trucks in 5 m benches. To control mining dilution and to increase selectivity, smaller excavators will be utilised for ore mining. Harena pit will be mined using the same mining fleet and also in 5 m benches.
- Waste rock will be moved and hauled to multiple rock storage facilities based on their geochemical characteristics and period of operation. Some of the mineralised waste will be stockpiled near the pit so that it can be recovered if commodity prices increase from current levels.
- The mining operation is conducted by the owner.
|
The BMSC Phase III plant expansion was commissioned in mid-2016 with an extended period of steady improvement occurring over the past nine months. Recently, a saleable copper concentrate has been produced with the tonnes of bulk Cu-Zn concentrate diminishing steadily. Final concentrate zinc grade has been below 50% to the end of 2016; however, due to current market conditions and low impurity levels, the zinc concentrate is readily saleable. Zinc recovery to the zinc concentrate has been steadily improving.
The current mine production plan shows Bisha Main Primary material as the sole source of plant feed. Harena Primary material will come on-line in 2020 after the depletion of Bisha Main material. Mill head grades for Bisha Main Primary material will remain steady (at a Zn/Cu ratio of around 6:1) while Harena head grades will be lower in 2020.
| PJ/ABE/ADD/CCS/AAN/NMW/CAE | Bisha_2016R&R-Update_TechRep_2CN010-024_20170808_aan_cae | August 2017 |
| SRK Consulting |
| NI 43-101 Technical Report Bisha Mine 2016, Eritrea | Page 303 |
For both the Bisha Main and Harena deposits, the majority of mineralised material remaining is considered Primary zone, with both copper and zinc grade. The remaining Oxide material is being stockpiled for future consideration; minimal copper-only Supergene remains to be processed.
Issues with sphalerite activation were experienced by BMSC for most of 2016, resulting in a bulk concentrate being produced instead of a copper concentrate. Recent changes made by BMSC in the copper circuit operation have shown improvements in the copper concentrate quality.
As of December 2016, the geometallurgical database results showed little/no correlation between CNCu estimates and the copper-zinc selectivity. However, BMSC is using the relative proportion of CNCu and ASCu as a guideline for mill feed blending. They are also actively seeking a modified method for sequential copper analysis that offers a more accurate estimate of copper-zinc selectivity. The same is true for non-sulphide metal ion content as measured by EDTA wash assays.
SRK and TS Technical Services reviewed the Primary material testwork results and made suggestions of estimated metallurgical performance, assuming separate campaign processing of material by Zn/Cu feed ratio or domains. This is because each metallurgical domain will require a particular set of copper rougher flotation conditions to generate both saleable copper and zinc concentrates.
In SRK’s opinion, almost all of the Primary material can generate a saleable copper concentrate, but with varying recovery. The same is true for the zinc concentrate, depending on the Zn/Cu feed ratio.
Issues remain with how BMSC can separately process campaigns of different Zn/Cu domains, including stockpiling material for extended periods. Limited information is available on the effect of sample weathering/oxidation but preliminary indications are it could be significant and at least, require a major change in reagent scheme to process such oxidised material.
| 24.1.4 | Environmental and Social |
At this time, the Project has all necessary permits and authorisations to operate the mine.
Environmental issues identified in conjunction with the initial permitting process and ongoing regulatory oversight are being addressed by BMSC.
Detailed monitoring plans are in place as part of the impact assessment process and to develop inputs to the final reclamation and closure of the site.
A conceptual closure and reclamation plan has been developed. Final reclamation of the pit, waste rock facilities, yards, ROM pad and roads is estimated to cost approximately $7.5M. Reclamation of the TMF, which includes the costs for the placement of a 40 cm cover and the closure spillway, is estimated to be approximately $5.3M. Revegetation is estimated to be approximately $1.3M.
| PJ/ABE/ADD/CCS/AAN/NMW/CAE | Bisha_2016R&R-Update_TechRep_2CN010-024_20170808_aan_cae | August 2017 |
| SRK Consulting |
| NI 43-101 Technical Report Bisha Mine 2016, Eritrea | Page 304 |
No salvage credits have been assumed for the closure costing.
Demolition and reclamation of the plant and other infrastructure is estimated to be approximately $8.6M. Closure and post closure monitoring costs for a period of 10 years (five years of TMF drain-down and five years of post-closure monitoring) is estimated at $0.5M.
The total reclamation cost is estimated at $40.0M including administrative costs and a 15% contingency. A review of that plan suggests that several important closure steps are missing, specifically a cover and final landform study for the waste dumps, a cover study for the TSF and the development of a social closure plan for the nearby communities. The cost of these studies amounts to approximately $0.3M.
Consistent with this closure cost estimate, Nevsun (2017) confirmed that BMSC has arranged an annually renewable environmental bond of $40M at a cost of 1% per annum. BMSC, in accordance with International Financial Reporting Standards, has accrued $38.3M in its financial records as of 31 March 2017, as a provision for reclamation, remediation, and post-closure monitoring.
The economic analysis of the Bisha Mine was undertaken in a Discounted Cash Flow (DCF) model in Microsoft Excel®. The model used real (constant) 2017 US dollars as the primary currency. The model used mid-period annual discounting at a base case discount rate of 10% and a valuation date of 31 December 2016. Capital costs prior to 1 January, 2017 and debt financing were excluded from the analysis, as are sunk costs and interest payments.
Base commodity prices used in the analysis were as follows:
| | - Zinc at $1.00 per pound
- Copper at $2.70 per pound
- Silver at $18.00 per troy ounce
- Gold at $1,200 per troy ounce
|
The analysis demonstrated the Bisha Mine was economically viable from a post-tax discounted cash flow perspective.
| 24.2 | Risks and Opportunities |
Mining
| | - Achieving the mining rate calculated in production schedule is an important and vital element for success of Bisha project. Failure in reaching to the production rate causes the operating cost to increase and poses the risk of losing the mineable reserve.
|
| PJ/ABE/ADD/CCS/AAN/NMW/CAE | Bisha_2016R&R-Update_TechRep_2CN010-024_20170808_aan_cae | August 2017 |
| SRK Consulting |
| NI 43-101 Technical Report Bisha Mine 2016, Eritrea | Page 305 |
| | - Mineral Reserve calculated in this report is based on input parameters outlined in Section 14. These parameters included commodity prices and processing recoveries. Failure to achieve processing recoveries used in this report will cause the project to lose the income that eventually would affect the amount of Mineral Reserve.
|
Processing
Mineral Reserve calculated in this report is based on input parameters outlined in Section 14, including commodity prices and processing recoveries. Failure to achieve the processing recoveries used in this report will jeopardize the project economics, which in turn will eventually affect the amount of Mineral Reserve.
Political
Albeit unlikely, there is a residual risk of unexpected governmental intervention that can lead to potentially significant impacts on a mining operation. An important action to mitigate this risk is to continue to maintain positive relationships with the regulatory agencies and local communities. Additional risk mitigation is available through the 40% interest in the Bisha mine that the Government of Eritrea holds via the ENAMCO.
Economics
As experienced during the Global Financial Crisis in 2008/2009 and during the economic downturn from 2014 to 2016, commodity prices are subject to overall global economic health. Any significant event that shakes consumer confidence in capital markets could lead to depressed commodity prices, resulting in lower than predicted project revenues.
Mining
Higher commodity prices will generate additional income that consequently can justify mining a larger pit in Bisha Main deposit.
Harena deposit contains some near surface Inferred resources. More exploration drilling to confirm the Mineral Resource Estimate at Harena may help to increase the Mineral Reserve Estimate for this deposit.
Processing
Work is ongoing at site to improve plant performance, with particular emphasis on copper-zinc selectivity. Methods to anticipate poor selectivity are being investigated including sequential copper tests to estimate the secondary copper content as well as non-sulphide metal ions that may be resulting in sphalerite activation.
In SRK’s opinion, well-defined, metallurgical domains need to be established, each with specific operating conditions needed to achieve reasonable selectivity and produce both a copper and zinc concentrate. This might be Zn/Cu feed grade ratios discussed in Section 12 or it might be another feed characteristic or proxy value. Due to the high variability in metallurgical response observed in the plant results to date and historical testwork, it seems reasonable to assume that campaigning of specific metallurgical domains without blending across domains, offers the greatest opportunity for consistent plant performance.
| PJ/ABE/ADD/CCS/AAN/NMW/CAE | Bisha_2016R&R-Update_TechRep_2CN010-024_20170808_aan_cae | August 2017 |
| SRK Consulting |
| NI 43-101 Technical Report Bisha Mine 2016, Eritrea | Page 306 |
Economics
Any significant improvements in commodity prices, concentrate grades or metal recovery rates will lead to substantial increases in project NPV. An increase in production rate will also increase project value, albeit to a lesser extent. If any major project assumptions change due to ongoing work, the economic model should be reviewed and updated to determine the overall impact to project NPV.
| PJ/ABE/ADD/CCS/AAN/NMW/CAE | Bisha_2016R&R-Update_TechRep_2CN010-024_20170808_aan_cae | August 2017 |
| SRK Consulting |
| NI 43-101 Technical Report Bisha Mine 2016, Eritrea | Page 307 |
| | - To upgrade the Inferred resource to Indicated at all five deposits, infill drilling to a nominal 50 m by 50 m spacing is required.
- To upgrade Indicated resources to Measured, close-spaced drilling (such as grade control drilling) is required. For the Harena, Asheli, Northwest and Hambok deposits, further metallurgical testwork is justified as well.
- Upgrade the Inferred stockpile resource category with additional metallurgical testwork.
- Harena deposit remains open down-plunge and further extension drilling is highly likely to add Mineral Resources to this deposit.
- The cost estimate for these recommendations is approximately $25.5M.
|
| | - Obtain the necessary permits to establish a waste dump to the west of the Bisha Main pit. A waste dump in this area will reduce cycle times, and therefore costs, particularly for the waste stripped in the west zone.
- Review the geotechnical assessment for the south-east sector of the Bisha Main pit based on recent exposures in that area. The current geotechnical recommendations are complex and vary considerably with only a small variation in pit wall orientation. In SRK's opinion, there is opportunity to reduce the stripping ratio.
- Review the current procedures for grade control and short-term mine planning (GC&STMP) with a view to establishing a methodology that values the ore according to NSR and can respond relatively quickly to changes in commodity prices and processing performance.
- Currently, the ore is sorted on run-of-mine (ROM) pads, based on its quality/grade prior to crushing. SRK recommends utilising the improved GC&STMP procedures (see previous recommendation) to provide the confidence required for direct tipping to the crusher. This reduction in re-handle will reduce the operating costs.
- Consider increasing the width of the two-way haulage roads to at least 25 m. This will increase tire life (due to less frequent scrubbing of tire walls on bunds) and generally provide safer operating conditions.
- The cost estimate for these recommendations is about $0.3M.
|
SRK includes the following recommendations for future metallurgical testwork, based on a well-established set of metallurgical domains:
| | - Review of current sequential copper methods being used to estimate the secondary copper content
|
| PJ/ABE/ADD/CCS/AAN/NMW/CAE | Bisha_2016R&R-Update_TechRep_2CN010-024_20170808_aan_cae | August 2017 |
| SRK Consulting |
| NI 43-101 Technical Report Bisha Mine 2016, Eritrea | Page 308 |
| | - Investigate the effect of weathering/oxidation and methods to reduce the impact of medium to long-term stockpiling of Primary material
- Sample and evaluate the performance of currently stockpiled Primary material
- Investigate the effect of primary grind size on copper-zinc selectivity
- Determine the optimal pH and reagent conditions for each metallurgical domain
- Establish the sensitivity of results within each domain and whether campaign processing is required, optional or unnecessary
|
For the BMSC plant operation, SRK also recommends:
| | - A review of all plant measurements to confirm feed conditions are stable and process performance is somewhat predictable
- Conduct a series of plant trials on a single metallurgical domain where prior lab testwork conditions are applied to the plant while processing the material, to compare lab versus plant performance
- Minor upgrades to processing plant for water reticulation, pumps, etc.
- The cost estimate for these recommendations is about $0.3M to $0.5M, depending on the number of samples required to provide sufficient confidence in the outcome
|
| PJ/ABE/ADD/CCS/AAN/NMW/CAE | Bisha_2016R&R-Update_TechRep_2CN010-024_20170808_aan_cae | August 2017 |
| SRK Consulting |
| NI 43-101 Technical Report Bisha Mine 2016, Eritrea | Page 309 |
AGP Mining Consultants (2014), Inc. Peter Munro, BAppSc., Mineralurgy Pty. Ltd. Effective Date: 31 December 2013, published 24 March 2014.
ALS Metallurgy (2014), Metallurgical Assessment of the Bisha Primary Zone, Bisha Mining Share Company, Eritrea, KM3960 11 July, 2014.
ALS Metallurgy (2016), Metallurgical Assessment of the Bisha Primary Zone, Bisha Mining Share Company, Eritrea, KM4877 4 March, 2016.
AGP (2012). Bisha Polymetallic Operation, Eritrea, Africa, NI 43-101 Technical Report for Nevsun Resources Ltd., as of 31 August 2012.
AMEC (2004). Technical Report on the Bisha Property and Resource Estimate of the Bisha Deposit, Gash-Barka District, Eritrea, 1 October 2004: unpublished technical report to Nevsun Resources Ltd., effective date 18 November 2004.
AMEC (2005). Nevsun Resources (Eritrea) Ltd. Bisha Property, Gash-Barka District, Eritrea, NI 43-101 Technical Report and Preliminary Assessment, 30 December 2005: unpublished technical report to Nevsun Resources Ltd., effective date 30 December 2005.
AMEC (2006). Nevsun Resources (Eritrea) Ltd, NI 43-101 Technical Report on the Feasibility Assessment, Bisha Property, Gash-Barka District, Eritrea: unpublished technical report to Nevsun Resources Ltd., effective date 5 October 2006.
AMEC (2009). Tailings Management Facility Design Report, Bisha Gold, Copper and Zinc Project, Eritrea, March 2009.
AMEC (2011). Nevsun Resources Limited, Bisha Polymetallic Operation Eritrea, Africa, NI 43-101 Technical Report to Nevsun Resources Ltd., effective date 1 January 2011, and revised 29 March 2011.
Ashley, P.M. (2013). Petrographic Report on thirty-six drill core samples from the Bisha Mine, Eritrea. Unpublished Technical Report (#846) for Bisha Mining Share Company by Paul Ashely Petrographic and Geological Services, 2013.
Barrie, C.T. (2004). Report on the Geology and Geochemistry of the Bisha VMS Deposit and Property, Western Eritrea. Internal Report, Nevsun Resources, August 2004.
Barrie, C.T. (2005). Lead isotope systematics and Neoproterozoic ages for VMS mineralisation in the Nakfa Terrane, Eritrea: internal company report, Nevsun Resources, 15 p.
Barrie, C.T.; Nielsen, F.W.; and Aussant, C.H. (2007). The Bisha Volcanic-Associated Massive sulfide Deposit, Western Nafka Terrane, Eritrea. Economic Geology, v. 102, pp. 717–738.
| PJ/ABE/ADD/CCS/AAN/NMW/CAE | Bisha_2016R&R-Update_TechRep_2CN010-024_20170808_aan_cae | August 2017 |
| SRK Consulting |
| NI 43-101 Technical Report Bisha Mine 2016, Eritrea | Page 310 |
Barrie, C.T., and Giroux, G.H. (2009). Hambok Deposit, Mogoraib Exploration License, Gash-Barka District, Western Eritrea 43-101 Technical Report and Preliminary Resource Assessment Prepared for Sanu Resources Ltd.
Barrie, C.T., Abdalla, M.A.F. and Hamer, R.D., (2016). Volcanogenic Massive Sulphide–Oxide Gold Deposits of the Nubian Shield in Northeast Africa. In Mineral Deposits of North Africa (pp. 417-435). Springer International Publishing.
BGC Engineering Inc. (2012), Bisha Mining Share Company, Bisha Mine, Main Zone Open Pit Slope Design Update, 24 August 2012
Bisha Mining Share Company (2017). Bisha Mining Water Management Plan, Draft Report, February 2017.
Canadian Institute of Mining, Metallurgy and Petroleum (CIM) (2003). Estimation of Mineral Resources and Mineral Reserves, Best Practice Guidelines: Canadian Institute of Mining, Metallurgy and Petroleum. Available at http://web.cim.org/standards/ ; accessed 2013/2014.
Canadian Institute of Mining, Metallurgy and Petroleum (CIM) (2014). CIM Standards for Mineral Resources and Mineral Reserves, Definitions and Guidelines: Canadian Institute of Mining, Metallurgy and Petroleum. Available at http://web.cim.org/standards/ ; accessed 2013/2014.
Canadian Securities Administrators (CSA) (2011). National Instrument 43-101, Standards of Disclosure for Mineral Projects, Canadian Securities Administrators.
Chisholm, R., Delisle, P.C., Nielsen, F.W., Daoud, D., Ansell, S., Davis, G. (2003). Exploration and Drilling Program on the Bisha Property for Nevsun Resources (Eritrea) Ltd., Bisha Exploration Permit 2003, Work Program: internal company report, Nevsun Resources, August 2003.
DeSouza Filho, C. R., Drury S. A. (1998). A Neoproterozoic Supre-Subduction Terrane in Northern Eritrea, NE Africa, Journal of the Geological Society, London, V.155, pp.551-566.
Eritrean State (2002). Eritrea A Country Handbook, Ministry of Information, State of Eritrea Asmara, edited by Dan Connell, Oman, Printed by Vision Africa, 132 pages.
Franklin, J. M., Hannington, M. D., Jonasson, I. R. and Barrie, C. T. (1998). Arc-Related Volcanogenic Massive Sulphide Deposits; in Metallogeny of Volcanic Arcs, B. C. Geological Survey, Short Course Notes, Open File 1998-8, Section N.
Gebreab, W 1996. An outline of major Pan-African lithologic assemblages and shear zones in Eritrea: implications for mineral Exploration. Africa Geoscience Review 3, 355-366.
Johnson, P.R., Andresen, A., Collins, A.S., Fowler, A.R., Fritz, H., Ghebreab, W., Kusky, T., Stern, R.J. (2011). Late Cryogenian-Ediacaran history of the Arabian-Nubian Shield: a review of depositional, plutonic, structural, and tectonic events in the closing stages of the northern East African Orogen. Journal of African Earth Sciences, 61, 167–232
| PJ/ABE/ADD/CCS/AAN/NMW/CAE | Bisha_2016R&R-Update_TechRep_2CN010-024_20170808_aan_cae | August 2017 |
| SRK Consulting |
| NI 43-101 Technical Report Bisha Mine 2016, Eritrea | Page 311 |
Johnson et al. (2011). Johnson, P.R., Andresen, A., Collins, A.S., Fowler, A.R., Fritz, H., Ghebreab, W., Kusky, T., and Stern, R.J., 2011. Late Cryogenian–Ediacaran history of the Arabian–Nubian Shield: A review of depositional, plutonic, structural, and tectonic events in the closing stages of the northern East African Orogen. Journal of African Earth Sciences, Volume 61, Issue 3,167-232.
Johnston, H. and Sloan, R. (2013). Metallurgical Testing of Bisha Northwest Ores. ALS Kamloops Report No. KM3656 for BMSC, August 2013, 265 p.
Johnston, H. and C. Chan (2014). Mineralogical assessment of Bisha ore samples, Bisha Mine, Eritrea. ALS Metallurgy, Kamloops: Report No. KM3532 for BMSC, 55 p.
Klohn Crippen (2004). Bisha Project Gash Barka Zone-Preliminary Hydrological Study: internal company report, Nevsun Resources, October 2004.
Knight Piésold (Pty) Limited. 2012. Bisha Gold Mine, Hydrogeological Numerical Model, Bisha Main pit Dewatering – DRAFT Report; 5 April 2012.
Knight Piésold Consulting (Pty) Ltd. (2016a). Bisha Gold, Copper and Zinc Project, Conceptual Closure Plan 2015, Report: 402/00010/26, January 2016.
Knight Piésold Limited (2016b). Bisha Copper and Zinc Project, Tailings Management Facility, Bi-Annual Audit Report, September 2016, Rev 0, 07 October 2016.
Large, R.R., (1992). Australian volcanic-hosted massive sulfide deposits; features, styles, and genetic models. Economic Geology, 87(3), pp.471-510.
Lydon, J.W., (1984). Ore Deposit Models-8. Volcanogenic Massive Sulphide Deposits Part I: A Descriptive Model. Geoscience Canada, 11(4).
McPhie, J. (2013). Volcanic Facies of the Bisha and Hambok Licence Areas, Eritrea. Internal Report, Bisha Mining Share Company, October 2013, 49 p.
Nevsun (2004). Exploration Program on the Bisha Property, Gash-Barka District, Eritrea 2004, internal company report, Nevsun Resources (Eritrea) Ltd., September 2004.
Nevsun (2017), Letter to SRK Consulting Canada Inc. addressing Mineral Tenure and Agreements, Surface Rights, Water Rights, Royalties, Environmental Liabilities and Social and Community Impacts. 29 June 2017.
SRK (2015), Underground Scoping Study, Bisha Mine, Eritrea, November 2015.
SRK (2017), Structural Study and Geotechnical Review of Bisha Mine, Eritrea, March 2017.
| PJ/ABE/ADD/CCS/AAN/NMW/CAE | Bisha_2016R&R-Update_TechRep_2CN010-024_20170808_aan_cae | August 2017 |
| SRK Consulting |
| NI 43-101 Technical Report Bisha Mine 2016, Eritrea | Page 312 |
Thomas, D.G., Melnyk, J., Kozak, A. and Khera, V. (2011). Nevsun Resources Limited, Bisha Polymetallic Operation, Eritrea, Africa, NI 43 101 Technical Report, Amec Americas Limited, 01 January (revised 29 March).
Vann, J., Jackson, S., Bertoli, O. (2003). Quantitative Kriging Neighbourhood Analysis for the Mining Geologist; 5th International Mining Geology Conference, Bendigo, Victoria, Australia.
Waller, S., D. Reddy, L. Melnyk (2006). Nevsun Resources Ltd, 43-101 Technical Report on the Feasibility Assessment Bisha Property, Gash-Barka District, Eritrea, AMEC Americas Limited, 15 November.
WSP Parsons Brinkerhoff (2016a). Data Revue and Preliminary Regional Groundwater Flow Model Development, Bisha Gold Mine, Eritrea, November 2016.
WSP Parsons Brinkerhoff (2016b). Groundwater Impact Assessment for the Bisha Mine Area, Eritrea, Draft: 55381R4v1, 23 December 2016.
| PJ/ABE/ADD/CCS/AAN/NMW/CAE | Bisha_2016R&R-Update_TechRep_2CN010-024_20170808_aan_cae | August 2017 |
| SRK Consulting |
| NI 43-101 Technical Report Bisha Mine 2016, Eritrea | Page 313 |
| 27 | Date and Signature Page |
This technical report was written by the following “Qualified Persons” and contributing authors. The effective date of this technical report is 31 December, 2016.
Reviewed by
Dr. Gilles Arseneau, P.Geo.
Project Reviewer
All data used as source material plus the text, tables, figures, and attachments of this document have been reviewed and prepared in accordance with generally accepted professional engineering and environmental practices.