| SRK Consulting | |
| Timok PEA NI 43-101 | Page ii |
| 
Technical Report for a Preliminary Economic Assessment Update for the Timok Project, Republic of Serbia | |
| Prepared for Nevsun Resources Ltd. |
| 
|
| Prepared by 
SRK Consulting (Canada) Inc. 2CR021.006 November 2017 |
| Various/RJM/PJD | Timok_PEA_NI43-101_Report_2CR021.006_20171130.docx | November 2017 |
| SRK Consulting | |
| Timok PEA NI 43-101 | Page iii |
| | Technical Report for a Preliminary Economic Assessment Update for the Timok Project, Republic of Serbia |
| | Prepared for | Prepared by |
| | Nevsun Resources Ltd.
1750 - 1066 West Hastings Street
Vancouver, BC, V6E 3X1
Canada | SRK Consulting (Canada) Inc.
2200–1066 West Hastings Street
Vancouver, BC, V6E 3X2
Canada |
| | Tel: +1 604 623 4700
Web: www.nevsun.com | Tel: +1 604 681 4196
Web: www.srk.com |
| | Effective Date: 01 September 2017
Signature Date: 27 November 2017 |
| | Authored By | | | |
| | Andrew Jennings, PEng | David McKay, MAIG | Daniel Stinnette, PEng | Dylan MacGregor, PEng |
| | Conveyor Dynamics | Phreatic Zone Ltd. | SRK Consulting (Canada) Inc. | SRK Consulting (Canada) Inc. |
| | | | | |
| | Jarek Jakubec, CEng | Lucas Hekma, PE | Martin Pittuck, CEng | Mihajlo Samoukovic, PEng |
| | SRK Consulting (Canada) Inc. | Interface LLC | SRK Consulting (UK) Ltd. | Knight Piésold Ltd. |
| | | | | |
| | Neil Winkelmann, FAusIMM | Peter Manojlovic, PGeo | Ray Walton, PEng | Riley Devlin, PEng |
| | SRK Consulting (Canada) Inc. | Nevsun Resources Ltd. | Rakita Exploration d.o.o. | Struthers Technical Solutions |
| | | | | |
| | Robert Raponi, PEng | | | |
| | Ausenco Canada | | | |
| | | | | |
Copyright © SRK Consulting (Canada) Inc., 2017
| Various/RJM/PJD | Timok_PEA_NI43-101_Report_2CR021.006_20171130.docx | November 2017 |
| SRK Consulting | |
| Timok PEA NI 43-101 | Page iv |
Important Notice
This report was prepared as a National Instrument 43-101 Technical Report for Nevsun Resources Ltd. (“Nevsun”) by SRK Consulting (Canada) Inc. (“SRK”). The quality of information, conclusions, and estimates contained herein is consistent with the level of effort involved in SRK’s services, based on: i) information available at the time of preparation, ii) data supplied by outside sources, and iii) the assumptions, conditions, and qualifications set forth in this report. This report is intended for use by Nevsun subject to the terms and conditions of its contract with SRK and relevant securities legislation. The contract permits Nevsun to file this report as a Technical Report with Canadian securities regulatory authorities pursuant to National Instrument 43-101, Standards of Disclosure for Mineral Projects. Except for the purposes legislated under provincial securities law, any other uses of this report by any third party is at that party’s sole risk. The responsibility for this disclosure remains with Nevsun. The user of this document should ensure that this is the most recent Technical Report for the property as it is not valid if a new Technical Report has been issued.
Copyright
This report is protected by copyright vested in SRK Consulting (Canada) Inc. It may not be reproduced or transmitted in any form or by any means whatsoever to any person without the written permission of the copyright holder, other than in accordance with stock exchange and other regulatory authority requirements.
| Various/RJM/PJD | Timok_PEA_NI43-101_Report_2CR021.006_20171130.docx | November 2017 |
| SRK Consulting | |
| Timok PEA NI 43-101 | Page v |
Executive Summary
Introduction
This report was prepared by SRK Consulting (Canada) Inc for Nevsun Resources Ltd. to summarize the results of an updated preliminary economic assessment (PEA) of the Timok copper-gold project (“Project”), located in Serbia. The Project presently considers a single large deposit (the Timok deposit), which includes both an Upper Zone (UZ, – also known as Timok UZ or Čukaru Peki) and a Lower Zone (LZ – also known as the Timok LZ).
This PEA and accompanying mineral resource statement focuses on only the Upper Zone portion of the Timok deposit. Unless otherwise stated, when the Timok project or Project is referenced in this report, this refers to the development of the Upper Zone portion of the deposit.
Property Description and Ownership
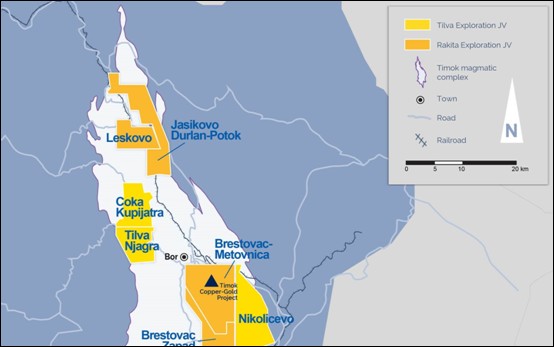
The Timok copper-gold project is located in Serbia within the central zone of the Timok Magmatic Complex (Figure ES1).
The project exploration site in the Brestovać-Metovnica exploration license is located some five kilometres south of the Bor mining complex operated by state-owned Rudarsko-topioničarski basen Bor (RTB Bor). This license is one of four exploration licenses held by Rakita Exploration d.o.o., a Serbian joint venture between Nevsun and Freeport-McMoRan Exploration Corporation (“Freeport”). Rakita is conducting the exploration on both Čukaru Peki and the Lower Zone .
Čukaru Peki and the Lower Zone are part of the Timok copper-gold project. In a joint venture with Freeport, Nevsun owns 100% of Čukaru Peki (Upper Zone) and 60.4% of the Lower Zone. Upon completion of a feasibility study on either the Upper Zone or Lower Zone, Nevsun’s share of the Lower Zone will decrease to 46% and Freeport’s share of the Lower Zone will increase to 54%.
Accessibility, Climate, Local Resources, Infrastructure and Physiography
The Project is situated in a developed area of eastern Serbia. The nearby municipality of Bor is connected to the capital, Belgrade, by the A1 motorway (part of the European E75 and Pan-European Corridor X route) and the international E-road E761, from Paraćin to Zaječar. Travel time from Belgrade to Bor and the Project by road is about three and a half hours. Locally, the Project is situated five kilometres south of the municipality of Bor, on the south side of state road IB n° 37.
The regional climate for the project area is moderate-continental with local variations. Based on nearby weather station records, the project area temperature range is expected to be in the range of 36 to -23°C, which is consistent with regional norms. The majority of Serbia has a continental precipitation regime, with precipitation occurring consistently throughout the year, with the greatest rainfall typically occurring during May and June. The rainfall values for nearby Brestovać Banja indicate a mean annual precipitation of approximately 685 mm.
Bor is an active mining town and regional administrative centre possessing the facilities, services, and experienced work force required for advanced mineral exploration projects. Reliable power is available, with power lines passing through the Brestovać-Metovnica permit area.
| Various/RJM/PJD | Timok_PEA_NI43-101_Report_2CR021.006_20171130.docx | November 2017 |
| SRK Consulting | |
| Timok PEA NI 43-101 | Page vi |
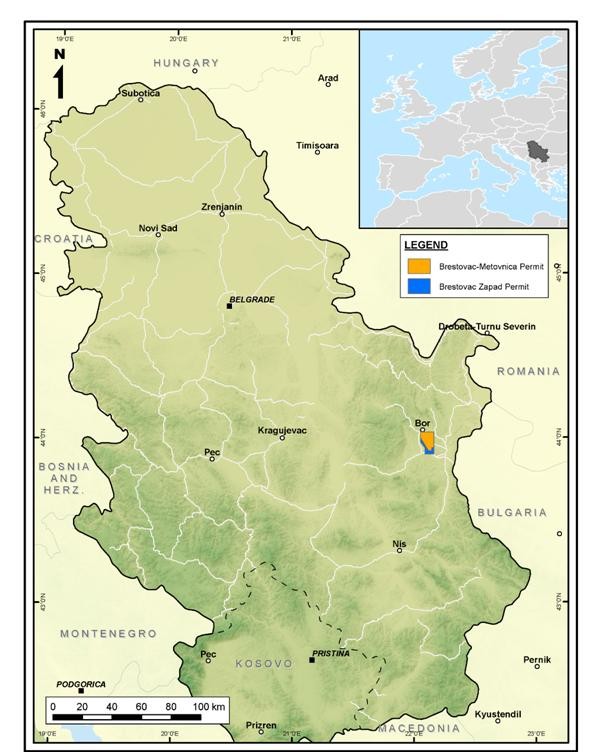
Source: SRK (UK), 2017
Figure ES1: Project location map
The relief of the project area is marked by a gently rolling plateau with elevations ranging from 300 to 400 m amsl. The Crni Vrh hills to the west of the exploration permit rise to over 1000 m amsl. The deposit itself is at an elevation of approximately 375 m amsl with plentiful accessible flat or gently undulating land to accommodate surface processing facilities and waste storage as necessary. There are a few river valleys that are of sufficient depth to provide the necessary volume of tailings storage.
| Various/RJM/PJD | Timok_PEA_NI43-101_Report_2CR021.006_20171130.docx | November 2017 |
| SRK Consulting | |
| Timok PEA NI 43-101 | Page vii |
Logistics and transportation studies demonstrate that, for the transport of copper concentrate from the Project to smelters worldwide, it is most commercially viable to use a truck/rail/barge route from the Project to the ocean port of Constanta, Romania and a truck/rail route to the port of Burgas, Bulgaria.
The Bor 2 transmission substation is located five kilometres northwest of the project, and a 110‑kV transmission line is within 1.5 km of the Project, though it is due for replacement.
During pre-production, start-up water will be sourced from run-off in the tailings storage facility (TSF) catchment and mine water pumped from underground. If necessary, water from the Brestovačka River will also be used. During production, make-up water will continue to be sourced from the TSF catchment and from mine water. In addition, water will be reclaimed from the TSF. The Brestovačka River will remain as a standby source. Potable water will be sourced from the local Bor Municipality via a new 12-km pipeline, to be constructed.
Geology and Mineral Resource
Čukaru Peki (Upper Zone) is a copper-gold deposit located within the central zone (or Bor District) of the Timok Magmatic Complex, which represents one of the most highly endowed copper and gold districts in the world. The Timok Magmatic Complex is located within the central segment of the Late Cretaceous Apuseni-Banat-Timok-Srednogorie magmatic belt in the Carpatho-Balkan region of southern-eastern Europe. The Apuseni-Banat-Timok-Srednogorie belt forms part of the western segment of the Tethyan Magmatic and Metallogenic Belt, which lies along the southern Eurasian continental margin and extends over 1,000 km from Hungary, through the Apuseni Mountains of Romania, to Serbia and Bulgaria to the Black Sea.
The deposit comprises two different styles of copper-gold mineralization - the Upper Zone (subject of this study) and the Lower Zone. Upper Zone HS epithermal mineralization occurs at depths from 450 to 850 m below surface. Lower Zone porphyry style mineralization is found from 700 to 2,200 m below surface. To date, the deepest drill hole intercepting Lower Zone mineralization terminated at 2,268 m below surface.
Upper Zone
The Upper Zone is a high-grade high sulphidation (HS) epithermal deposit typically associated with an advanced argillic alteration system with a discrete footprint.
The top-third of the HS epithermal mineralization of the Upper Zone is characterized by a massive sulphide lens located on the top of a volcanic to volcaniclastic sequence. This lens has a variable but overall similar dip to the overlying stratigraphy. With increasing depth from the top of the Upper Zone, the proportion of massive sulphide mineralization intruding or replacing the host rock reduces, as does the sulphide content and presence of fragmental volcanic units. With depth, the mineralization becomes more characterized by veins and stockworks hosted by more coherent andesite.
The massive sulphide comprises mainly pyrite and covellite and hosts the highest grades of copper and gold; multiple pyrite replacement phases are observed, which in some places comprise up to 95 wt% of the deposit. Locally, different pyrite phases can be recognized by cross-cutting relationships; however, in general they are difficult to distinguish. Covellite is interpreted to be later than pyrite and is observed transgressively cutting and brecciating massive pyrite; however, pyrite can also locally be observed cross cutting covellite stringers or massive aggregates of covellite flakes intergrowing with alunite.
| Various/RJM/PJD | Timok_PEA_NI43-101_Report_2CR021.006_20171130.docx | November 2017 |
| SRK Consulting | |
| Timok PEA NI 43-101 | Page viii |
Pyrite with enargite is also present; enargite is commonly observed rimmed and sometimes replaced by covellite and is therefore interpreted to represent an earlier phase of mineralization.
Mineralized hydrothermal breccias have also been locally observed in the Upper Zone and at least two events have been recognized: an early syn-mineralization phase and an inter-mineral phase, hosting fragments of massive sulphide.
Gold mineralization is present in a number of forms, including tellurides such as calaverite (Au), sylvanite (Au-Ag) and kostovite (Au-Cu), altaite (Pb) and is mostly hosted in pyrite but also locally found encapsulated in bornite (Cornejo, 2017). Native gold is not common; however, where observed it is very fine, approximately 2 to 6 μm in diameter.
Low temperature galena and sphalerite as disseminations and in veins are noted in the peripheral zones of the Upper Zone mineralization, mostly related to kaolinite-pyrite alteration fronts.
Lower Zone
The Lower Zone consists of lower grade porphyry copper-gold style mineralization comprising quartz-sulphide veins and disseminated sulphides and larger alteration footprint. The Lower Zone is situated approximately 200 m beneath the Upper Zone and extends from this point to the north of the Upper Zone, and most likely represents the source of fluids for the Upper Zone epithermal mineralization.
The Lower Zone constitutes a telescoped porphyry system related to multi-stage diorite intrusion, whereby the Lower Zone potassic zone with well-developed A-type vein stockwork is overprinted by quartz-sericite alteration (with classic D-type veinlets) and Upper Zone HS alteration and mineralization assemblages including alunite-dickite, covellite-pyrite and vuggy silica replacement.
Mineral Processing and Metallurgical Testing
As part of the PEA published in 2016 (SRK (UK), 2016), preliminary testing on samples from the Timok deposit (both the Upper Zone and the Lower Zone), was conducted between November 2015 and March 2016 by SGS Canada Inc. (SGS, 2016). The scope of this test work consisted of sample preparation, head sample characterization, mineralogical examination, grindability, flotation and cyanidation testing. The main objectives were to assess the mineralogical characteristics and to evaluate the flotation response of seven composite samples. The scoping level program was considered successful in obtaining reasonable copper recoveries and concentrate grades and in splitting the mineable resource into its four main components, covellite, enargite, pyrite and gangue.
During the course of the current PEA study, further testing was completed on samples from the Timok deposit between September 2016 and September 2017 (SGS, 2017a). The emphasis of the test work was first to optimize the flotation conditions established in the 2016 PEA and to provide samples to evaluate processing options (as opportunities in the study) for the high arsenic copper concentrate option, referred to as the complex copper concentrate, and the pyrite concentrate. Later, the overall scope of this program was increased to include: further flotation optimization and variability testing, solid-liquid separation testing and environmental characterization.
| Various/RJM/PJD | Timok_PEA_NI43-101_Report_2CR021.006_20171130.docx | November 2017 |
| SRK Consulting | |
| Timok PEA NI 43-101 | Page ix |
The overall goal of this third program was to develop and optimize the flowsheet selected in the 2016 PEA, which produced two copper concentrates: a low arsenic concentrate and a complex concentrate. However, during the variability testing program of this study, it was realized that a proportion of the deposit was not likely to respond well to this two-concentrate production scenario. Testing and analysis of a flowsheet producing a single bulk concentrate was then carried out, and in conjunction with Nevsun’s marketing consultants, a decision was made to change to this simpler, more robust single concentrate approach.
The optimized flowsheet, developed during the current study uses conventional reagents, applicable to all process feed types and achieves good separation of the copper minerals from pyrite and gangue into a bulk copper concentrate and a pyrite concentrate. The pyrite concentrate is stored at site in a tailings facility for possible later treatment.
This was achieved with a moderate primary grind P80 of 108 µm. The flotation process is as follows:
| | 1. | A bulk copper concentrate is produced using lime and a collector, lime is added in the roughers to depress pyrite and allow a high recovery of copper minerals. |
| | 2. | A pyrite concentrate is then floated using potassium amyl xanthate (PAX) in the pyrite rougher flotation circuit and is stored separately for possible later treatment. |
| | 3. | Following a regrind of the rougher copper concentrate to P80 of between 15 and 28 µm and further lime addition, one or two stages of cleaning are used. |
Once this optimization work and the comminution test work were completed, the data was passed to Orway Mineral Consultants, in Mississauga, Ontario to complete a process plant-sizing study. Their report and the SGS flotation and other results were passed to Ausenco Engineering in Toronto to produce design criteria, flowsheets, layouts and capital and operating cost estimates for a grinding and flotation plant to treat plant feed from the Upper Zone of the Timok deposit .
Four trade-off studies (ToS’s, #1, 2, 3 and 4) were completed to define options regarding:
| | 1. | Concentrate sale, bulk vs. separate high and low arsenic concentrates |
| | 2. | Process options for gold recovery from pyrite |
| | 3. | Process options for reduction of arsenic in the complex concentrate |
| | 4. | Definition of concentrate transportation considerations |
As part of ToS #2, samples of the pyrite concentrate were tested to determine the applicability of certain gold recovery processes, i.e. pyrite roasting (Outotec) and atmospheric oxidation following fine grinding (Albion). As part of ToS #3, samples of the complex copper concentrate were tested for various arsenic removal processes, i.e. partial reductive roasting (Outotec), ferric oxidation (FLSmidth ROL®) and caustic leaching (Toowong). Each process supplier compiled a preliminary report summarizing its potential application.
Mineral Resource
The mineral resource has been reported using a resource net smelter return (RscNSR) cut off value based on copper, gold and arsenic, using a copper price of $3.49/lb and gold price of $1,565/oz, derived from long-term consensus forecasts with a 20% uplift as appropriate for assessing eventual economic potential of mineral resources. Assumed technical and economic parameters were based on the results of the PEA study.
| Various/RJM/PJD | Timok_PEA_NI43-101_Report_2CR021.006_20171130.docx | November 2017 |
| SRK Consulting | |
| Timok PEA NI 43-101 | Page x |
SRK (UK) considers that the blocks with a RscNSR value greater than an operating cost of $35/t (as described in Section 14.1) have “reasonable prospects for eventual economic extraction” and can be reported as a mineral resource. SRK (UK) has determined a level in the block model (‑445 mRL), based on a five-metre vertical block increment review, below which the RscNSR falls short of covering this cost. The reported mineral resource comprises all material inside the geological model above this elevation, thus excluding isolated blocks with >$35/t RscNSR below -445 mRL.
The mineral resource statement for the Upper Zone of the Timok deposit is shown in Table ES1.
Table ES1: SRK mineral resource statement as at 24 April 2017 for the Upper Zone of the Timok deposit
Category | Resource Domain | Tonnes Mt | Grade | Metal | |
% Cu | g/t Au | % As | Cu Mt | Au Moz | | |
Measured | UHG | 0.44 | 18.7 | 11.70 | 0.29 | 0.082 | 0.17 | | |
Massive Sulphide | 1.70 | 6.0 | 4.10 | 0.29 | 0.10 | 0.23 | | |
Indicated | UHG | 0.95 | 17.1 | 11.80 | 0.24 | 0.16 | 0.36 | | |
Massive Sulphide | 6.70 | 5.2 | 3.40 | 0.25 | 0.35 | 0.73 | | |
Low grade covellite | 19.00 | 1.9 | 1.10 | 0.17 | 0.36 | 0.70 | | |
Measured and Indicated | UHG | 1.40 | 17.6 | 11.80 | 0.26 | 0.24 | 0.52 | | |
Massive Sulphide | 8.40 | 5.4 | 3.60 | 0.26 | 0.45 | 0.96 | | |
Low grade covellite | 19.00 | 1.9 | 1.10 | 0.17 | 0.36 | 0.70 | | |
Inferred | UHG | 0.45 | 15.0 | 10.80 | 0.16 | 0.07 | 0.16 | | |
Massive Sulphide | 0.80 | 4.9 | 3.40 | 0.11 | 0.04 | 0.09 | | |
Low grade covellite | 12.70 | 1.0 | 0.44 | 0.05 | 0.12 | 0.18 | | |
Total-Measured | 2.20 | 8.6 | 5.70 | 0.29 | 0.190 | 0.40 | | |
Total-Indicated | 26.60 | 3.3 | 2.10 | 0.20 | 0.870 | 1.80 | | |
Total-Measured and Indicated | 28.70 | 3.7 | 2.40 | 0.20 | 1.050 | 2.20 | | |
Total-Inferred | 13.90 | 1.6 | 0.90 | 0.06 | 0.230 | 0.42 | | |
| | 1. | The RscNSR value used to report the estimate is $35/t. |
| | 2. | All figures are rounded to reflect the relative accuracy of the estimate. |
| | 3. | Mineral resources are not mineral reserves and do not have demonstrated economic viability. |
| | 4. | The Mineral Resource is reported on 100% basis, attributable to Rakita Exploration d.o.o. |
Mine Development and Operations
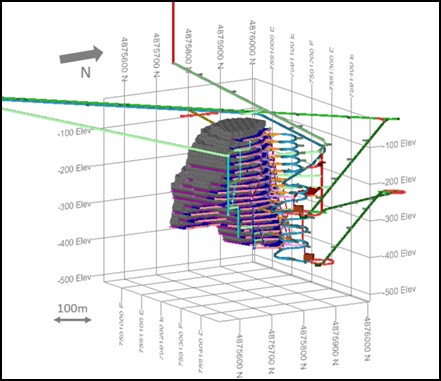
The sub-level caving (SLC) mining method has been selected for the Project as it has better consideration of geotechnical conditions and offers higher value for the Project as compared to other mining methods. Early access to significantly higher grades of mineralization made it preferable compared to other caving methods.
A dual decline access with conveyor was selected as the preferred access and haulage method for the Upper Zone project. The conveyor and main access declines will be developed simultaneously from the portals at -14% gradient. The access decline will be used as the main entry to the mine and will provide access for personnel, equipment, materials, and will be utilized as a fresh air intake airway. Process plant feed and waste will be hauled from the mine via conveyor in a conveyor decline. The conveyor decline will also act as a major exhaust airway and provide an auxiliary exit from the mine. Dual decline portal location, decline size and layout were selected during the exploration decline design (SRK NA, 2017d).
| Various/RJM/PJD | Timok_PEA_NI43-101_Report_2CR021.006_20171130.docx | November 2017 |
| SRK Consulting | |
| Timok PEA NI 43-101 | Page xi |
Two five-metre diameter raise-bored ventilation raises connected to surface will provide additional intake and return air to the underground operation. Ventilation access drifts will connect the level development to the ventilation raises. Internal ventilation raises will connect each sublevel to provide flow-through ventilation.
The underground maintenance facilities will be located near the upper crusher station to service and maintain the underground mobile equipment. Major equipment rebuilds will be done on surface.
The project mine plan was developed using Geovia’s PCSLC software. The average planned material mining rate during the life of mine is approximately 8,800 t/d. The Timok production schedule includes all the process plant feed produced via SLC and is presented in Table ES2.
Inferred resources were used in the life of mine plan. Of the material planned for processing, 42% is classified as inferred, including both original inferred mineral resource and diluting waste material that results from the SLC mining method. Put another way, 13% of the contained copper in the process feed comes from inferred material.
Mineral resources that are not mineral reserves do not have demonstrated economic viability. There is no certainty that all or any part of the mineral resources would be converted into mineral reserves. Mineral reserves can only be estimated as a result of an economic evaluation as part of a pre-feasibility study or a feasibility study of a mineral project. This PEA is preliminary in nature. It includes inferred mineral resources that are considered too speculative geologically to have the economic considerations applied to them that would enable them to be categorized as mineral reserves, and there is no certainty that the PEA will be realized. Accordingly, at the present level of development, there are no mineral reserves at the Timok project.
Processing Operations
In alignment with the life-of-mine (LOM) plan, the process plant is designed to treat nominally 8,900 tonnes per day (equivalent to 3.25 million tonnes per year) and produce concentrates.
The copper mineralogy consists primarily of covellite with lesser enargite. The flowsheet was initially designed with the ability to generate two concentrates: one with a low (<0.5% As) arsenic content and one with an elevated (>0.5% As) arsenic content. This same general flowsheet, utilized in a more simplified manner, has the capacity to produce a single bulk concentrate. Single bulk concentrate production is the basis of this study.
In addition, a pyrite concentrate slurry stream is generated that contains significant gold. The current plan calls for impoundment of the pyrite concentrate for possible future treatment for gold recovery. Current studies into the processing of the pyrite concentrate for gold recovery and possible manufacture of sulphuric acid were completed in parallel to this study, but are considered opportunities and do not form a basis of this PEA.
Project Infrastructure
The process plant complex is to be located at the south end of an old existing airstrip, which is owned by the Municipality of Bor. A new assay laboratory will be located at the northeast corner of the process plant.
| Various/RJM/PJD | Timok_PEA_NI43-101_Report_2CR021.006_20171130.docx | November 2017 |
| SRK Consulting | |
| Timok PEA NI 43-101 | Page xii |
During the production phase, permanent facilities will be established to meet the needs of the steady state operational workforce. Permanent mine dry facilities for the underground workforce during production will be placed in the administration complex, which will be in the vicinity of the process plant.
| Various/RJM/PJD | Timok_PEA_NI43-101_Report_2CR021.006_20171130.docx | November 2017 |
| SRK Consulting | |
| Timok PEA NI 43-101 | Page xiii |
Table ES2: Life of mine production schedule
Reporting Period | Units | Total | 2018 | 2019 | 2020 | 2021 | 2022 | 2023 | 2024 | 2025 | 2026 | 2027 | 2028 | 2029 | 2030 | 2031 | 2032 | 2033 | 2034 | 2035 | 2036 |
Development Eligible Process Feed | kt | 2,567 | - | - | 15 | 452 | 360 | 313 | 211 | 178 | 190 | 176 | 168 | 157 | 158 | 163 | 26 | - | - | - | - |
Run-of-mine Copper Grade | % | 3.14% | | | 6.39% | 6.83% | 4.63% | 3.65% | 2.17% | 1.69% | 1.48% | 1.45% | 1.23% | 1.18% | 1.04% | 1.23% | 1.04% | | | | |
Run-of-mine Gold Grade | gpt | 1.83 | | | 4.95 | 4.34 | 2.72 | 2.29 | 1.37 | 0.98 | 0.68 | 0.60 | 0.46 | 0.41 | 0.38 | 0.41 | 0.34 | | | | |
Run-of-mine Arsenic Grade | % | 0.17% | | | 0.14% | 0.25% | 0.24% | 0.21% | 0.16% | 0.14% | 0.12% | 0.13% | 0.10% | 0.12% | 0.10% | 0.10% | 0.07% | | | | |
Run-of-mine Iron Grade | % | 12.89% | | | 20.74% | 19.53% | 15.72% | 14.63% | 11.76% | 10.53% | 9.22% | 9.38% | 8.42% | 8.51% | 8.57% | 9.88% | 9.63% | | | | |
| | | | | | | | | | | | | | | | | | | | | |
Production Eligible Process Feed | kt | 39,557 | - | - | - | 389 | 1,983 | 2,924 | 3,061 | 2,993 | 3,036 | 2,954 | 3,035 | 2,997 | 2,987 | 3,018 | 3,021 | 2,867 | 2,072 | 1,844 | 375 |
Run-of-mine Copper Grade | % | 2.56% | | | | 5.13% | 5.59% | 4.72% | 4.40% | 3.77% | 3.09% | 2.44% | 2.16% | 1.79% | 1.56% | 1.41% | 1.29% | 1.23% | 1.14% | 1.09% | 0.99% |
Run-of-mine Gold Grade | gpt | 1.6312 | | | | 3.85 | 3.87 | 3.06 | 3.03 | 2.40 | 1.84 | 1.60 | 1.53 | 1.19 | 0.97 | 0.82 | 0.69 | 0.61 | 0.56 | 0.48 | 0.39 |
Run-of-mine Arsenic Grade | % | 0.13% | | | | 0.08% | 0.15% | 0.16% | 0.16% | 0.16% | 0.17% | 0.15% | 0.13% | 0.12% | 0.10% | 0.10% | 0.10% | 0.11% | 0.10% | 0.11% | 0.12% |
Run-of-mine Iron Grade | % | 10.03% | | | | 12.96% | 14.79% | 14.58% | 13.09% | 12.07% | 11.60% | 10.15% | 9.49% | 8.94% | 8.10% | 7.73% | 7.65% | 7.41% | 6.90% | 7.37% | 7.68% |
| | | | | | | | | | | | | | | | | | | | | |
Total Eligible Process Feed Tonnes | kt | 42,124 | - | - | 15 | 841 | 2,343 | 3,237 | 3,272 | 3,171 | 3,226 | 3,130 | 3,204 | 3,155 | 3,145 | 3,181 | 3,048 | 2,867 | 2,072 | 1,844 | 375 |
Run-of-mine Copper Grade | % | 2.59% | 0.00% | 0.00% | 6.39% | 6.05% | 5.44% | 4.61% | 4.25% | 3.65% | 2.99% | 2.39% | 2.11% | 1.76% | 1.54% | 1.40% | 1.29% | 1.23% | 1.14% | 1.09% | 0.99% |
Run-of-mine Gold Grade | gpt | 1.64 | 0.00 | 0.00 | 4.95 | 4.11 | 3.69 | 2.99 | 2.93 | 2.32 | 1.77 | 1.54 | 1.47 | 1.15 | 0.94 | 0.80 | 0.69 | 0.61 | 0.56 | 0.48 | 0.39 |
Run-of-mine Arsenic Grade | % | 0.13% | 0.00% | 0.00% | 0.14% | 0.17% | 0.17% | 0.17% | 0.16% | 0.16% | 0.17% | 0.15% | 0.13% | 0.12% | 0.10% | 0.10% | 0.10% | 0.11% | 0.10% | 0.11% | 0.12% |
Run-of-mine Iron Grade | % | 10.20% | 0.00% | 0.00% | 10.35% | 17.77% | 14.86% | 14.58% | 13.00% | 11.99% | 11.47% | 10.10% | 9.44% | 8.92% | 8.13% | 7.84% | 7.66% | 7.40% | 6.91% | 7.36% | 1.92% |
| | | | | | | | | | | | | | | | | | | | | |
Contained Copper Metal | kt | 1,093 | - | - | 1 | 51 | 128 | 149 | 139 | 116 | 97 | 75 | 68 | 55 | 48 | 44 | 39 | 35 | 24 | 20 | 4 |
Contained Gold Metal | koz | 2,226 | - | - | 2 | 111 | 278 | 311 | 308 | 237 | 184 | 155 | 152 | 116 | 95 | 82 | 68 | 56 | 38 | 28 | 5 |
| | | | | | | | | | | | | | | | | | | | | |
Waste | kt | 2,031 | 195 | 260 | 577 | 201 | 56 | 102 | 338 | 93 | 36 | 24 | 40 | 34 | 37 | 38 | 1 | - | - | - | - |
Total Material from UG | kt | 44,156 | 195 | 260 | 591 | 1,042 | 2,399 | 3,339 | 3,610 | 3,264 | 3,262 | 3,155 | 3,244 | 3,188 | 3,181 | 3,219 | 3,049 | 2,867 | 2,072 | 1,844 | 375 |
Note: the first three years are pre-production years and do not have any ring production.
| Various/RJM/PJD | Timok_PEA_NI43-101_Report_2CR021.006_20171130.docx | November 2017 |
| SRK Consulting | |
| Timok PEA NI 43-101 | Page xiv |
Concentrate storage in the process plant provides roughly 18 days of storage during peak production grades. Concentrate will be loaded into trucks with front end loaders. The layout will accommodate loading concentrate into transport containers such as the Rotainer system if required. Concentrate will be trucked off site and transported to the nearest port for overseas shipment or by road/rail/barge to European smelters.
Fuel storage tanks, water and fire water protection tanks will be located north of the portal.
The main access road to site will enter the site from the north, in direction of Bor. A new access road will connect from the existing road to the portal area. Internal roads are provided to allow access to all major site facilities and infrastructure areas such as the process plant, mine portal, administration complex and service buildings, and the waste management area.
Waste and Water Management
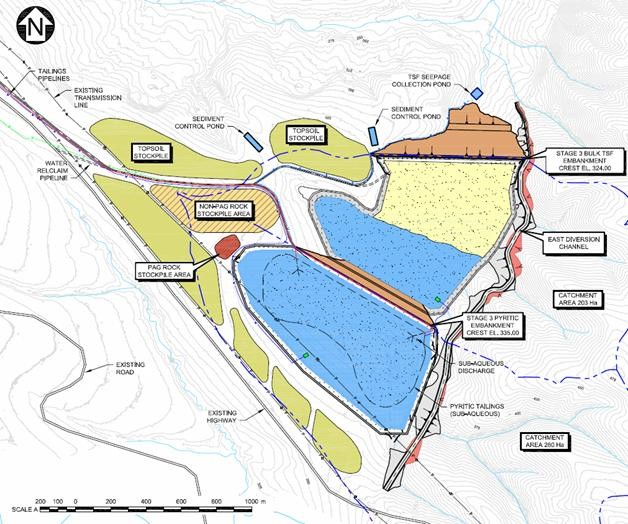
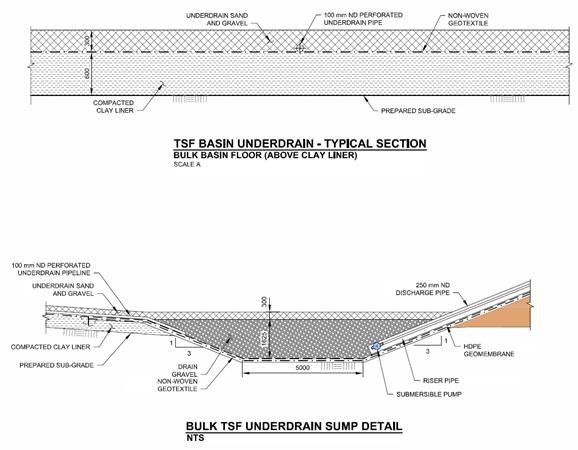
Mineral processing will generate two tailing streams: bulk and pyritic, with each stream deposited in a separate TSF. Non-Potentially Acid Generating waste rock will be co-disposed within the bulk TSF impoundment. Potentially acid generating waste rock will be stockpiled in a designated storage area located within the pyritic TSF impoundment.
The TSF is designed to store a total of 7.4 Mm3 of pyritic tailings (at an average dry density of 2.0 t/m3), 16.5 Mm3 of bulk tailings (at an average dry density of 1.4 t/m3), and 0.7 Mm³ of waste rock (at an average density of 2.8 t/m³) for a total storage volume of 24.6 Mm3.
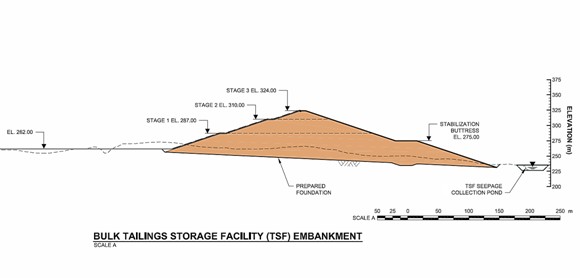
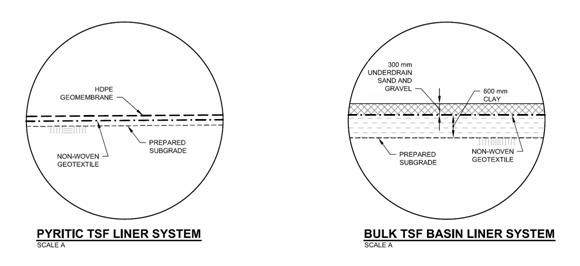
The TSF cells are designed with a freeboard allowance of three metres, an allowance for an operational pond volume of approximately 0.5 Mm3 in the bulk TSF cell and 1.4 Mm3 in the pyritic TSF cell, and additional capacity for the inflow design flood in the TSF catchment. Storage within the TSF cells is provided by earthfill embankments constructed using material generated from basin excavation within the TSF footprint. The embankments are designed to remain physically stable under static and seismic loading as per Canadian Dam Association guidelines. The facilities will be lined (HDPE geomembrane for the pyritic TSF; clay for the bulk TSF) and will have underdrainage and foundation drainage systems incorporated to intercept seepage and promote tailings consolidation.
The reclaim water system will consist of two separate but complementary mechanical systems: the bulk TSF water transfer system and the pyritic TSF return water system. The bulk TSF water transfer system will convey water released from the bulk tailings slurry to the pyritic TSF via a HDPE pipeline. The pyritic TSF return water system will convey water from the pyritic TSF back to the plant site via a HDPE pipeline.
A site-wide water balance was developed for the mine site that includes the TSF, portal area and plant site. The water balance indicates that the Project will operate in a water surplus and treatment of surplus water may be required. Water within the project area (contact water) will be recycled and used to the maximum practical extent by collecting and managing site runoff from undisturbed and disturbed areas. Non-contact water will be diverted away from the TSF where possible. Excess water will be stored in the supernatant ponds within the bulk and pyritic TSFs and recycled to the plant for use in processing.
TSF closure will be completed in a manner that will satisfy physical and chemical stability. The primary objective of closure and reclamation will be to return the TSF site to a self-sustaining condition that will be consistent with the local landscape. Each TSF will be capped with a membrane and low permeability soil layers, and contoured to become a landform. The surfaces will be revegetated with native plants.
| Various/RJM/PJD | Timok_PEA_NI43-101_Report_2CR021.006_20171130.docx | November 2017 |
| SRK Consulting | |
| Timok PEA NI 43-101 | Page xv |
Marketing
For this PEA, the preferred flowsheet for the Project will result in the production of a single copper concentrate with annual grades predicted to range from 20 to 29% for copper, 2.4 to 7.3 g/t for gold, and 0.8 to 2.3% for arsenic. Copper and gold grades are at their highest and arsenic grades at their lowest in the early years as head grades for copper and gold, and the ratio of copper-to-arsenic decline over the LOM profile.
Marketing of the concentrates produced by the Project will be a key economic driver and requires a more sophisticated marketing strategy than some other copper projects. Final terms for the concentrates will be dependent on the relative supply and demand of the overall copper concentrate market and average arsenic grade of world-wide supply; increased supply relative to demand will increase discounts (treatment charges/refining charges/penalties) while decreased supply relative to demand will decrease discounts. It is not expected that marketing of the concentrate will present undue challenges in achieving final sales.
Copper concentrate produced by the Project is expected (on current projections) to have elevated levels of arsenic relative to average copper smelter feed grades – so-called ‘complex’ copper concentrate. However, smelters are increasingly sophisticated in sourcing supplies of low arsenic containing concentrates with which to blend complex copper concentrate, and benefit from the higher overall penalties gained in processing such materials. Given sufficient lead-time, smelters are increasingly sourcing penalty bearing complex concentrates as part of their overall supply chain management portfolios.
Preliminary review of the quality of the copper concentrates based on the metallurgical test work so far has not identified deleterious elements other than arsenic that may attract smelter penalties and impact the overall sales strategy, depending on the ability to adequately blend it with low arsenic-containing concentrates or the effectiveness of arsenic treatment options. Other than arsenic, the material has low deleterious element composition.
Early pre-production engagement with potential buyers is planned to secure a diversity of direct to smelter and trader sales. Nevsun anticipates leveraging its network of smelter and trader relationships, gained in the marketing of copper concentrates from its Bisha mine, when marketing the Project’s concentrate production.
The Project site is favourably situated for export logistics and early investigations by Nevsun with regional rail operators, road authorities and port facilities, demonstrate diverse, viable road and rail options to transport concentrates to inland smelters and Black Sea port terminals (i.e. Constanta port in Romania and Burgas port in Bulgaria) for overseas shipments. Serbia does not currently impose any law requiring concentrate to be treated in-country. No sales to the nearby RTB Bor smelter (trucking distance of seven kilometers from the Project site) have been contemplated in the economic analysis due to uncertainty regarding the smelter’s ability to process complex concentrates. However, in the event of such a sale, substantial freight savings and increased cash flows might be realized.
| Various/RJM/PJD | Timok_PEA_NI43-101_Report_2CR021.006_20171130.docx | November 2017 |
| SRK Consulting | |
| Timok PEA NI 43-101 | Page xvi |
Environmental Studies, Permitting, Social Impact and Closure
Environmental Studies
The Project is subject to Serbian environmental legislation covering environmental protection, environmental impact assessment (EIA), water, air quality, noise, waste management, biodiversity and cultural heritage. Serbia is an accession state to the European Union (EU), and as such, it is working to harmonise its environmental legislation with that of the EU. The Project will adhere to Serbian, EU, and the International Finance Corporation environmental and social standards. The Serbian EIA regulation differs from the international standards mainly in its requirements for stakeholder engagement, which in Serbia are significantly more lenient. The Project will follow the more stringent international stakeholder engagement standard.
The basic engineering design now underway includes alternatives analyses to determine the optimum project configuration and design. The selection of preferred design alternatives should be made on the basis of environmental, technical and economic criteria, and documented in the EIA project description.
The recent Ministry of Environment ruling that the exploration decline development can proceed without an EIA was accompanied by a series of environmental management requirements as conditions of approval. Prior to starting construction activities at the exploration decline portal site, the Project should have environmental management plans in place with specific procedures established, and the resources to implement them, in order to comply with these permit conditions.
As is often the case with mining projects, water supply and quality are the most significant environmental issues. Other issues with potentially significant environmental management implications include noise emissions during portal construction and the deterioration or destruction of habitat of listed species.
Permitting
The Project is among the first of the major new mining projects to be permitted in Serbia since the Yugoslav breakup, and as such, the Serbian regulators have no recent relevant experience. Until late last year, the regulatory process had been untested. The permitting process, while understood, is not fully within the Project’s control. Some of the factors and conditions affecting the permitting process include the timely review of applications, availability of technical studies and design information, land acquisition, community relations and politics. There is no certainty that all conditions and requirements will be satisfied for the granting of permits and that permits will be granted on a timely basis or at all, which could affect target dtaes and the conclusions in this PEA. Target dates for obtaining permits are estimates based on information available as of this study’s effective date and are subject to change.
The Project permitting process is on two separate and parallel tracks. The first permitting track involves obtaining approval to start developing the exploration decline and the associated surface-based supporting infrastructure at the portal site. The other permitting effort focuses on those permits required to develop, construct and operate the balance of the Project facilities, including the portion of the underground mine extending into the deposit, the mineral processing facilities, and related supporting infrastructure.
| Various/RJM/PJD | Timok_PEA_NI43-101_Report_2CR021.006_20171130.docx | November 2017 |
| SRK Consulting | |
| Timok PEA NI 43-101 | Page xvii |
Social Impact
The social baseline for impact assessment purposes has been established from studies conducted in Bor Municipality, including five settlements surrounding the Project site. The social baseline covers the following specific topics: demographics; gender equality; education; health; economy; employment; working conditions; land ownership; ecosystem services; traffic; and transportation infrastructure.
The Project has conducted a preliminary social impact assessment. The significance of potential project effects has been evaluated for a range of social impacts, and recommended management measures have been identified to mitigate negative impacts and enhance positive ones.
Closure
The purpose of a closure plan is to transition the project site from an industrial mining operation to a post-closure state that is acceptable to local property owners and communities for the long term. For PEA level closure planning purposes, closure design requirements are categorized in three main categories: physical stability, chemical stability and social acceptance. The PEA closure design focuses on physical and chemical stability with considerations made to design elements that would bolster social acceptance at future stages of design.
These three categories cover aspects of safety, environmental performance and matters of interest to local communities. The following provides a general sense of how these categories are applied to the PEA closure design.
• Physical Stability: Includes closure designs that focus on the geotechnical stability of facilities and surfaces prone to wind and water erosion or surfaces that would cause adverse effects if they were to erode or be transported by the wind (e.g. tailings and contaminated wastes). Physical stability also refers to removal or repurposing of infrastructure remaining after the mine closes (e.g. buildings, roads, tailings storage facilities and dams).
• Chemical Stability: Includes closure designs that focus on limiting risks to environmental and human health and safety by addressing long-term containment of mine wastes (e.g. tailings, waste rock, by-products from concentration and water treatment plant sludge) and limiting leaching from these wastes to surface and ground waters.
• Social Acceptance: addresses matters of interest or concern for local communities (e.g. the expected post closure land use; long-term socio-economic benefits (e.g. employment, transfer of ownership of assets or infrastructure that can be of benefit to the community).
Economic Analysis
The Timok Project PEA clearly indicates the potential for the Project to have very strong economic viability. The after-tax net present value (NPV) of the Project as evaluated is estimated at $1,473M using an 8% discount rate, with an initial required capital outlay of $630M. The after-tax internal rate of return of the Project is estimated to be 49.8% in real terms.
| Various/RJM/PJD | Timok_PEA_NI43-101_Report_2CR021.006_20171130.docx | November 2017 |
| SRK Consulting | |
| Timok PEA NI 43-101 | Page xviii |
Fully allocated pre-tax cost (including site costs, off-site costs, depreciation, royalty and after gold by-product credits) is projected to be $1.05 per pound of payable copper average for the first 5 years of the Project and $1.59 per pound of payable copper average for the LOM.
The project production schedule features high grades, particularly in the first five years of production. The high margins expected to be achieved during this period drive significant value in the analysis. A summary of the economic analysis results is shown in Table ES3.
This PEA is preliminary in nature. It includes inferred mineral resources that are considered too speculative geologically to have the economic considerations applied to them that would enable them to be categorized as mineral reserves. There is no certainty that the PEA will be realized.
Table ES3: PEA valuation summary
Macro Assumptions |
Copper Price | US$3.00 / lb |
Gold Price | US$1,300 / oz |
Capital Cost Estimates |
Development Capital | $630M |
Sustaining Capital | $342M |
Closure Capital | $58M |
Production Summary |
Annual Capacity | 3.3 Mtpa |
Life of Mine production period | 16 years |
Project Economics |
After-Tax NPV (8% discount rate) | $1,473M |
After-Tax IRR | 49.8% |
Payback period | Less than 2 years from production start |
Conclusion and Recommendations
Overall, the Project has the potential for very strong economic returns and SRK recommends that the Project proceed to a pre-feasibility study. Project value is very sensitive to delays and as such, adhering to the current project schedule is key to preserving value. The potential to establish production in three years is considered realistic, if the following occur:
• Project activities continue according to the current project schedule
• Receipt of necessary permits
• Continuation of technical and environmental studies through 2018 and beyond
• Completion of required land acquisition
• Interactions with local and government stakeholders and regulatory authorities are proactively and sensitively managed
Activities associated with the next phase of work and an estimated budget associated with these activities are summarized in Table ES4.
| Various/RJM/PJD | Timok_PEA_NI43-101_Report_2CR021.006_20171130.docx | November 2017 |
| SRK Consulting | |
| Timok PEA NI 43-101 | Page xix |
Table ES4: Estimated Budget for PFS Recommendations
Area | Estimated Budget ($) |
Geology and Mineral Resources | |
Infill drilling | |
Geological modelling | |
Analysis of variability in arsenic concentrations | |
Assaying additional CRMs at top-end of grade range for both copper and gold | |
Additional copper and arsenic assays of UHG sample pulps | |
Sub-total – Geology and Mineral Resources | $500,000 |
Exploration | |
Condemnation drilling | |
Sub-total – Exploration | $3,500,000 |
Mining | |
In-situ stress measurements and instrumentation | |
Geotechnical drilling | |
Hydrogeological study | |
Mudrush assessment | |
Material strength testing | |
Numerical modelling | |
Underground crusher trade-off studies | |
Sub-total – Mining | $900,000 |
Mineral Processing | |
Complete variability sample testing | |
Single concentrate flowsheet rationalization | |
Complete concentrate sedimentation and filtration tests | |
Complete overall site water balance | |
Complete concentrate regrind tests | |
Process plant layout optimization | |
Sub-total – Mineral Processing | $600,000 |
Waste and Water Management | |
Additional investigations to constrain material parameters used in TSF stability analysis | |
Optimize TSF embankment design | |
Conduct stability analyses | |
Develop detailed site-wide water balance | |
Prepare site-specific hydrometeorology report | |
Additional sensitivity/uncertainty analysis on groundwater inflow | |
Sub-total – Waste and Water Management | $600,000 |
Environment, Permitting, Social, Closure | |
Develop and implement environmental management system | |
Complete environmental baseline characterization work | |
Complete draft EIA Scoping report | |
Conduct stakeholder engagement | |
Ongoing project permitting | |
Demolition waste placement trade-off studies | |
Sub-total – Environment, Permitting, Social and Closure | $2,000,000 |
Market Studies and Economic Analysis | |
Study to understand economic benefits of two concentrates | |
Modelling cash flows on quarterly basis to align with budget forecasts | |
Sub-total – Market Studies and Economic Analysis | $50,000 |
| |
Technical Report | $250,000 |
| |
TOTAL ESTIMATED COST – NEXT PHASE OF STUDY | $8,400,000 |
| Various/RJM/PJD | Timok_PEA_NI43-101_Report_2CR021.006_20171130.docx | November 2017 |
| SRK Consulting | |
| Timok PEA NI 43-101 | Page xx |
Table of Contents
| SRK Consulting | |
| Timok PEA NI 43-101 | Page xxi |
| SRK Consulting | |
| Timok PEA NI 43-101 | Page xxii |
| SRK Consulting | |
| Timok PEA NI 43-101 | Page xxiii |
| SRK Consulting | |
| Timok PEA NI 43-101 | Page xxiv |
| SRK Consulting | |
| Timok PEA NI 43-101 | Page xxv |
| SRK Consulting | |
| Timok PEA NI 43-101 | Page xxvi |
| SRK Consulting | |
| Timok PEA NI 43-101 | Page xxvii |
| SRK Consulting | |
| Timok PEA NI 43-101 | Page xxviii |
List of Tables
| SRK Consulting | |
| Timok PEA NI 43-101 | Page xxix |
| SRK Consulting | |
| Timok PEA NI 43-101 | Page xxx |
List of Figures
| SRK Consulting | |
| Timok PEA NI 43-101 | Page xxxi |
| SRK Consulting | |
| Timok PEA NI 43-101 | Page xxxii |
| Various/RJM/PJD | Timok_PEA_NI43-101_Report_2CR021.006_20171130.docx | November 2017 |
| SRK Consulting | |
| Timok PEA NI 43-101 | Page 1 |
1 Introduction and Terms of Reference
1.1 Introduction
This report was prepared by SRK Consulting (Canada) Inc for Nevsun Resources Ltd. to summarize the results of an updated preliminary economic assessment (PEA) of the Timok copper-gold project (“Project”), located in Serbia. The Project presently considers a single large deposit (the Timok deposit), which includes both an Upper Zone (UZ – also known as Timok UZ or Čukaru Peki) and a Lower Zone (LZ – also known as the Timok LZ).
This PEA and accompanying mineral resource statement focuses on only the Upper Zone portion of the deposit. Unless otherwise stated, when the Timok project or Project is referenced in this report, this refers to the development of the Upper Zone portion of the Timok deposit.
1.2 Responsibility
SRK Canada was joined by multiple parties in undertaking the PEA and preparing this report. A summary of responsibilities by author is shown in Table 1.1.
Table 1.1: Areas of responsibilities
Name | Company | Responsibility |
Andrew Jennings | Conveyor Dynamics | Sections 15.5.4, 17.1.6 |
Daniel Stinnette | SRK Consulting (Canada) | Section 15.5.2 |
David McKay | Rakita Exploration d.o.o. Bor Phreatic Zone | Sections 4.5.2 (water) 17.2.3, 20.2.7, 20.3.4 |
Dylan MacGregor | SRK Consulting (Canada) | Section 19.4.1, 19.4.2, 19.4.3, 19.4.4, 19.4.5, 20.2.8 |
Jarek Jakubec | SRK Consulting (Canada) | Sections 4.1, 4.2, 14, 15.1, 15.2, 15.3, 15.4, 15.5, 15.5.1, 15.5.5, 15.5.6, 15.6 |
Lucas Hekma | Interface LLC | Sections 19.1, 19.2, 19.3 |
Martin Pittuck | SRK Consulting (UK) | Sections 4.3, 4.4, 5, 6, 7, 8, 9, 10, 13, 22 |
Mihajlo Samoukovic | Knight Piésold | Sections 17.2.1, 17.2.2, 19.4.6, 20.2.6 |
Neil Winkelmann | SRK Consulting (Canada) | Sections 1, 2, 4.5.1, 18, 20.1, 20.1.1, 20.1.2, 20.1.3, 20.2.1, 20.2.2, 20.2.3, 20.2.4, 20.2.9, 20.2.10, 20.2.11, 20.3.1, 20.3.2, 20.3.5, 21 |
Peter Manojlovic | Nevsun Resources Ltd. | Section 3 |
Ray Walton | Rakita Exploration d.o.o. Bor | Sections 12 |
Riley Devlin | Struthers Technical Solutions | Section 4.5.2 (power), 17.1.2 |
Robert Raponi | Ausenco Canada | Sections 15.5.3, 16, 17.1.1, 17.1.3, 17.1.4, 17.1.5, 17.1.7, 20.2.5, 20.3.3 |
The whole project team has reporting responsibility for the Executive Summary and Sections 24 and 25 (Interpretation and Conclusions, Recommendations ).
1.3 Basis of Technical Report
This report is an update of the March 2016 Reservoir Minerals PEA prepared by SRK Consulting (UK) Limited in accordance with the National Instrument 43-101 Standards of Disclosure for Mineral Projects of the Canadian Securities Administrators. This report incorporates an updated mineral resource estimate, an alternate mining method with updated schedule and costs, and a current economic analysis.
| Various/RJM/PJD | Timok_PEA_NI43-101_Report_2CR021.006_20171130.docx | November 2017 |
| SRK Consulting | |
| Timok PEA NI 43-101 | Page 2 |
1.4 Site Visit
In accordance with NI 43-101 guidelines, project qualified persons visited the Timok copper-gold project to inspect the site and review geology and exploration protocols. The most recent site visits conducted by the qualified persons are provided in Table 1.2.
Table 1.2: Qualified Persons site visits
Qualified Person | Company | Visit Date |
Martin Pittuck | SRK Consulting (UK) | March 2017 |
Jarek Jakubec | SRK Consulting (Canada) | June 2017 |
Mihajlo Samoukovic | Knight Piésold | February 2017 |
1.5 Declaration
The opinions of SRK and other contributing authors contained herein, and effective 01 September 2017, is based on information collected throughout the course of the project team’s investigations, which in turn reflect various technical and economic conditions at the time of writing. Given the nature of the mining business, these conditions can change significantly over relatively short periods of time. Consequently, actual results may be significantly more or less favourable.
This report may include technical information that requires subsequent calculations to derive sub-totals, totals and weighted averages. Such calculations inherently involve a degree of rounding and consequently introduce a margin of error. Where these occur, SRK does not consider them to be material.
SRK is not an insider, associate or an affiliate of Nevsun. The results of the technical review by SRK are not dependent on any prior agreements concerning the conclusions to be reached, nor are there any undisclosed understandings concerning any future business dealings.
| Various/RJM/PJD | Timok_PEA_NI43-101_Report_2CR021.006_20171130.docx | November 2017 |
| SRK Consulting | |
| Timok PEA NI 43-101 | Page 3 |
2 Reliance on Other Experts
The qualified persons have not reviewed the mineral tenure, nor independently verified the legal status or ownership of the project area or underlying property agreements. The qualified persons have relied upon information obtained from a due diligence report prepared by NKO Partners Law Office (2016), pertaining to this and other subject matter. This information is used in Sections 3.2 and 3.5 of this report.
Nevsun contracted the services of Bluequest Resources AG to prepare a marketing study for the concentrates likely to be produced by the Project (Bluequest, 2017). Their investigations are presented in Section 18. SRK has relied upon Nevsun’s own views, experience and knowledge, supplemented by the Bluequest report. The economic analysis has reflected a conservative interpretation of both the Bluequest report and Nevsun’s outlook for the life-of-mine (LOM) output of concentrates.
| Various/RJM/PJD | Timok_PEA_NI43-101_Report_2CR021.006_20171130.docx | November 2017 |
| SRK Consulting | |
| Timok PEA NI 43-101 | Page 4 |
3 Property Description and Location
3.1 Property Location
The Project is located in eastern Serbia, five kilometers from the Bor mining complex and approximately 250 km southeast of Belgrade. It lies within the central zone of the Timok Magmatic Complex (TMC), in the Serbian section of the East European Carpathian-Balkan Arc.
Figure 3.1 shows the location of the Brestovać-Metovnica exploration license in which the Project is located. The Brestovać-Metovnica exploration license is one of four exploration licenses held by the Rakita Exploration d.o.o., as shown on Figure 3.2.
3.2 Property Permits and Licences
The Brestovać-Metovnica license, on which the project is located, currently covers 8,662 hectares.
The initial Brestovać-Metovnica license was issued on 28 February 2012, under the old Serbian Mining Act, and covered a total of 11,550 hectares. This initial license expired in February 2015 and the renewal process imposed a 25% reduction of the original area, bringing the license to its current size. Following enactment of the new Serbian Mining Act in December 2015, the expiry date of all licenses that were in good standing was reset. The Brestovać-Metovnica license was officially renewed in April 2017, setting the new expiry date to April 2020.
The relinquished Brestovać-Metovnica former area was immediately re-applied for, and became a new separate license called Brestovać-Zapad with an area of 2,887 hectares and an expiry date of April 2018. There are two other exploration licenses held by Rakita in the region called Leskovo-Jasikovo and Jasikovo Durlan-Potok.
3.3 Property Ownership
Rakita Exploration d.o.o. is a Serbian entity, indirectly owned by Timok JVSA (BVI) Ltd. Timok JVSA is owned 45% by Global Reservoir Minerals (BVI) Inc. (“Global Reservoir”, a 100% owned indirect subsidiary of Nevsun Resources Ltd. and 55% by Freeport International Holdings (BVI) Ltd.(FIH)). FIH has two classes of shares, Class A shares representing FIH’s interest in the Upper Zone and Class B shares representing FIH’s interest in the lower zone and lower caving zone required for development of the lower zone (collectively referred to as the “Lower Zone”).
Global Reservoir owns 100% of the Class A shares of FIH and 28% of the Class B shares of FIH. Freeport-McMoRan Exploration Corp. (FMEC) owns 72% of the Class B shares.
Thus, Nevsun effectively owns 100% of the Upper Zone and 60.4% of the Lower Zone through its 100% indirect ownership of Global Reservoir and its indirect ownership interests in both Timok JVSA and FIH. Nevsun’s ownership interest in the Lower Zone will decline to 46% and FMEC’s ownership interest in the Lower Zone will increase to 54% once a feasibility study has been prepared for either the Upper Zone or the Lower Zone and FIH increases its ownership interest in Timok to 75%.
| Various/RJM/PJD | Timok_PEA_NI43-101_Report_2CR021.006_20171130.docx | November 2017 |
| SRK Consulting | |
| Timok PEA NI 43-101 | Page 5 |
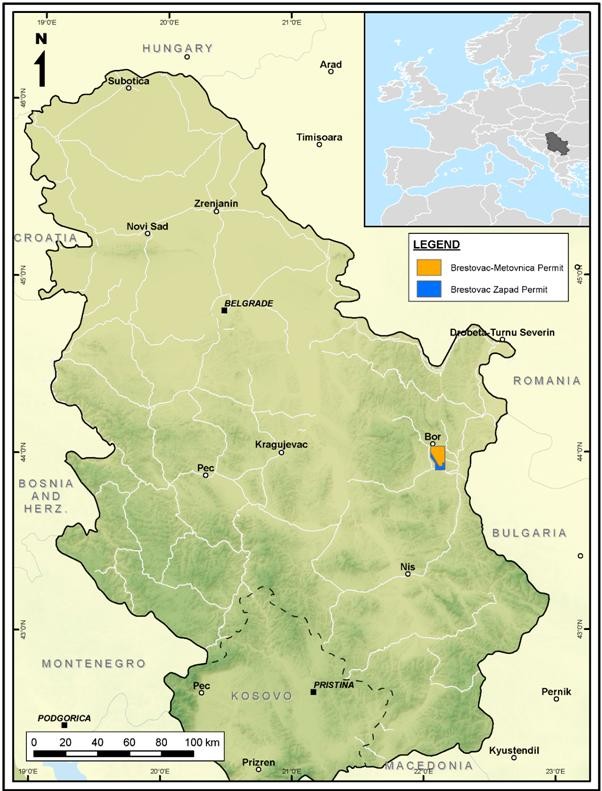
Source: SRK (UK), 2016
Figure 3.1: Project location map
| Various/RJM/PJD | Timok_PEA_NI43-101_Report_2CR021.006_20171130.docx | November 2017 |
| SRK Consulting | |
| Timok PEA NI 43-101 | Page 6 |
Source: Nevsun website
Figure 3.2: Project exploration license location map
3.4 Project Footprint and Land Requirements
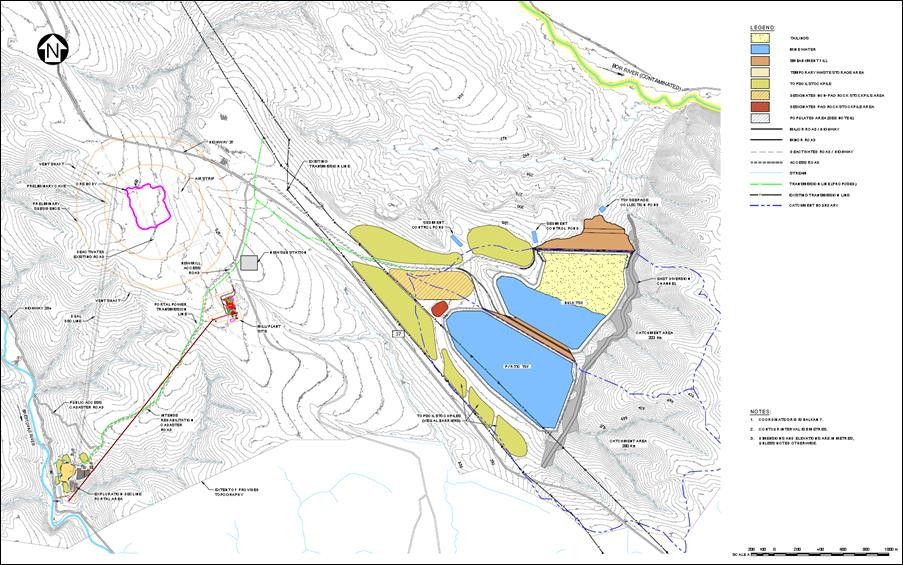
The site layout for the Timok project is provided in Figure 3.3. The Upper Zone deposit is outlined in purple, with concentric cave and subsidence zones outlined around it. The deposit is accessed by a dual decline from the south. At the decline portal, a conveyor transports mineralized material to the process plant to a site to the southwest of the deposit. Tailings from the process plant are pumped to tailings storage facilities (TSF) to the east.
Nevsun reports that there are no formal environmental constraints at the project area. In all exploration activities, Nevsun and their partners follow industry good practice. The “Environmental conditions for exploration” issued by the Institute for Nature Conservation of Serbia, Belgrade , is a condition for the Brestovać-Metovnica exploration permit and provides additional regulations pertaining to environmental considerations for exploration work in the project area. Drill sites are rehabilitated, and drill waste removed from the site and disposed at a registered waste facility as required by municipal regulations. An agreement is reached with the property owner of each drill site, which includes a compensation for disturbance and the requirement for full rehabilitation of the site. Drill sites are photographed before commencement of the drilling, and after completion of the rehabilitation.
For project development, property rights must be resolved in the areas of the exploration decline, process plant, TSF, transport/utilities corridor, and potentially a rail load-out facility if required. Based on the proposed mining method, for safety and security issues, the mine subsidence impact area is also planned to be acquired by Rakita. The total land expected to be acquired is 856 ha, of which about 115 ha is anticipated to be state-owned land.
The Project also requires properties to be purchased from private property owners and the local municipality. Specific parcels of land are required to locate key infrastructure and to secure the projected mine subsidence impact area. Rakita is in the process of acquiring these properties through a fair and transparent process which involves purchasing private properties through a willing buyer/willing seller basis.
| Various/RJM/PJD | Timok_PEA_NI43-101_Report_2CR021.006_20171130.docx | November 2017 |
| SRK Consulting | |
| Timok PEA NI 43-101 | Page 7 |
3.5 State Royalty and Other Royalty Agreements
The Serbian government collects a royalty of 5% net smelter return (NSR) for metallic raw materials (status as of 2011, Guide for Investors, Ministry of Natural Resources, Mining and Spatial Planning). There are additional royalties which may be due; these are individually negotiated for each mineral licence.
The Brestovac portion of the Brestovac-Metovnica property to the west of Čukaru Peki (Figure 3.3)is subject to a 2% NSR royalty on gold and silver and a 1% NSR royalty on other minerals pursuant to a royalty agreement (“Eurasian Agreement”).
The Metovnica portion of the Brestovac-Metovnica property which contains the Čukaru Peki deposit is subject to a 0.5% NSR sliding royalty pursuant to a royalty agreement (“Euromax Agreement”). The Euromax royalty is currently calculated using 0.5% x Reservoir ownership percentage.
As the Metovnica property was previously owned by FMEC, who conducted geophysics and limited drilling, the NSR royalty will not apply to any portion of the property eventually owned by FMEC and will also not apply to the portion of the property that has been purchased by Reservoir through the exercise of the ROFO. The configuration of the original Brestovac and Metovnica remains relevant for royalty considerations as shown in Figure 3.3.
| Various/RJM/PJD | Timok_PEA_NI43-101_Report_2CR021.006_20171130.docx | November 2017 |
| SRK Consulting | |
| Timok PEA NI 43-101 | Page 8 |
Source: Knight Piésold, 2017a
Figure 3.3: Timok project general site layout
| Various/RJM/PJD | Timok_PEA_NI43-101_Report_2CR021.006_20171130.docx | November 2017 |
| SRK Consulting | |
| Timok PEA NI 43-101 | Page 9 |
4 Accessibility, Climate, Local Resources, Infrastructure and Physiography
4.1 Site Access
The nearby municipality of Bor is connected to the capital, Belgrade, by the A1 motorway (part of the European E75 and Pan-European Corridor X route) and the international E-road E761, from Paraćin to Zaječar. Travel time from Belgrade to Bor and the Project by road is about three and a half hours.
Locally, the Project is situated five kilometres south of Bor, on the south side of state road IB n° 37. There are numerous small agricultural and forestry tracks within the permit area that are suitable for four-wheel drive vehicles.
A regional bus service connects Bor with Belgrade and other cities and towns. Bor is integrated into the Serbian railway system and connects to Belgrade and the main lines. The line from Bor is primarily for freight, but there are regular passenger services to Belgrade. The site is also favourably situated for export freight logistics.
4.2 Climate
The regional climate for the project area is moderate-continental with local variations. Average annual air temperature for areas between the altitudes of 300 and 500 metres above mean sea level (amsl) is 10.0°C. The absolute maximum air temperatures are recorded in July and are in the range of 37 to 42°C for lower lying areas. The absolute minimum air temperatures are recorded in January, and range from -20 to -36°C for mountainous areas. The majority of Serbia has a continental precipitation regime, with precipitation occurring fairly consistently throughout the year and the greatest rainfall typically occurring during May and June. (Republic Hydrometeorological Service of Serbia)
Regional climatic datasets have been summarized and values applicable to the Project and suitable for preliminary design have been selected. All data presented here are either from the Serbian Government, or from a study of climatic and hydrologic parameters produced by the University of Belgrade in 2016. This study presented climatic data collected at a weather station in Crni Vrh (20 km to the northwest of the Project), and two precipitation gauges at Metovnica and Brestovać Banja (6 km to the southwest of the Project at elevation 195 m amsl and 5 km to the northwest of the Project at elevation 350 m amsl, respectively).
The temperature data from the weather station at Crni Vrh, as provided in the University of Belgrade report, are for an elevation of 1037 m amsl, and were adjusted to project representative values at an elevation of 350 m amsl by using a typical lapse rate of 6.5°C per 1,000 m. The extreme daily temperatures recorded at the Crni Vrh station are 36.5°C on 24 July 2007 and -23.2°C on 24 January 2006, and temperature extremes in the project area are expected to be similar.
Mean monthly lake evaporation values for the site were obtained from the Serbian government for the station at Kragujevic (elevation: 185 m amsl) and were calculated using the Penman-Monteith equation. These values are considered to be reasonably representative of evaporation conditions in the project area and sum to a mean annual evaporation total of 786 mm.
| Various/RJM/PJD | Timok_PEA_NI43-101_Report_2CR021.006_20171130.docx | November 2017 |
| SRK Consulting | |
| Timok PEA NI 43-101 | Page 10 |
Brestovać Banja is located at an elevation of 350 m amsl, which is essentially the same elevation as the project facilities. The rainfall values for Brestovać Banja indicate a mean annual precipitation of approximately 685 mm.
The anticipated snowpack depths for the Project were determined based on the most relevant regional snowpack data, which is from the Serbian government’s weather station at the town of Nis (approximately 85 km southwest of the Project). Nis has a similar elevation (201 m amsl compared to 350 m amsl) and a similar annual precipitation to the site (580 mm compared to 685 mm). The maximum recorded snow depth at Nis over a 44-year period is 541 mm of snow water equivalent. The Nis record was used to calculate the one in 100-year snowpack depth of 660 mm for the project site, as well as the one in two-year snowpack depth of 220 mm (similar to the expected annual average).
4.3 Local Resources
Nearby Bor is an active mining town and regional administrative centre possessing the facilities, services, and experienced work force required for advanced mineral exploration projects. Reliable power is available, with power lines (110 kV and 400 kV) passing through the Brestovać-Metovnica permit area (NTI, 2017). Rakita maintains an office in the town as a technical base for exploration activities on the Brestovać-Metovnica and other exploration permits in the Timok region . The project office is located close to the centre of drilling on site.
In January 2011, Outotec signed a contract with SNC Lavalin International to design, supply and install a new copper flash smelting furnace and related services for Rudarsko-topioničarski basen Bor (RTB Bor) in central Serbia. The smelter was constructed by SNC Lavalin and commissioned in late 2015 to improve operational efficiency and reduce the environmental impact of the existing facility. The new flash smelter has a design capacity of 400 ktpa of concentrates at a design concentrate feed grade of 22% Cu. The flash smelter utilizes some of the existing infrastructure, with a newly constructed acid plant.
The smelter is currently treating a mixture of concentrates from the existing RTB Bor mining operations, alongside imported concentrates from overseas (some 200,000 wmt per year). Though there is no requirement under Serbian law to treat concentrates within country, it is envisaged that there could be spare capacity at the facility which the Project may utilize, should the opportunity arise. This is an attractive option due to significantly reduced concentrate transport costs as the smelter facility is only nine kilometres from the Project.
4.4 Physiography
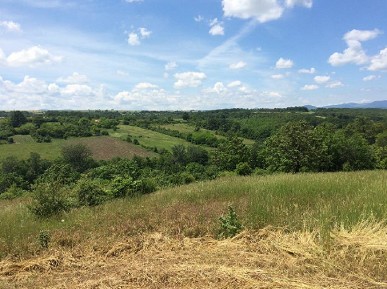
The relief of the project area is marked by a gently rolling plateau with elevations ranging from 300 to 400 m amsl. The deposit itself is at an elevation of approximately 375 m amsl. The Crni Vrh hills to the west of the exploration permit rise to over 1000 m amsl.
In the immediate project area, there is plenty of accessible flat or gently undulating land to accommodate surface processing facilities and waste storage as necessary. There are a few river valleys which are of sufficient depth to provide the necessary volume of tailings storage.
Vegetation in the area comprises mostly arable crops, some grassland and deciduous woodland.
| Various/RJM/PJD | Timok_PEA_NI43-101_Report_2CR021.006_20171130.docx | November 2017 |
| SRK Consulting | |
| Timok PEA NI 43-101 | Page 11 |
The Timok River is the major drainage system in the project area, with multiple tributaries such as the Brestovać, Bor and Borska. It originates in the north of the Svrljig Mountains in the Carpathian-Balkan region in eastern Serbia running 203 km before discharging into the Danube River. Topographic elevation within the Timok catchment ranges from 142 m amsl at the Timok-Danube confluence, to 1049 m amsl in the upper reaches of the catchment.
The Crni Vrh plateau is incised by the southeast-flowing drainage of the Brestovać River and its tributaries, and by the Bor River in the northeast of the Brestovać-Metovnica exploration permit area. The Brestovać River descends from about 280 m in the northwest corner of the property perimeter to about 160 m, where it flows across the south boundary of the exploration permit. The highest elevation is recorded as 464 m on the eastern margin of the property.
Anthropogenic features related to the mining activity, including waste dumps, dominate the physiography to the north of the exploration permit. The Bor open pit, approximately two kilometres north of the northern perimeter of the Brestovać-Metovnica exploration permit, is approximately 300 m deep and 1000 m long.
4.5 Infrastructure
4.5.1 Logistics and Transportation
The Bor region of eastern Serbia, much like the rest of Serbia, has not had any recent significant investment in infrastructure due to the adverse economic situation in the country. Nevertheless, there remain many possible logistic options and solutions for the transport of materials from the proposed Timok project. The location of the Project is well-situated relative to existing rail/road/waterways networks (see Figure 4.1). The logistics network is currently used by the RTB Bor mine complex and other industrial entities in the region (Elixir Prahovo, Aurubis Pirdop, etc.). The municipality of Bor has well developed infrastructure due to its strong industrial activity.
The Project is directly connected via state road 37 class 1B to the RTB Bor smelter (~9 km) and to the railroad cargo loading station at Bor Teretna (~7 km). The rail loading station would allow for transport via the state rail network to a smelter in Pirdop, Bulgaria and ocean ports in the region. There are also road and rail connections to the Danube river port of Prahovo (~88 km), allowing for low cost material transport to the ocean port of Constanta, Romania.
Studies of various transport routes conducted by Rakita’s logistics and transport team demonstrate that, for the transport of copper concentrate from the Project to smelters worldwide, it is most commercially viable to use a truck/rail/barge route from the Project to the ocean port of Constanta, Romania and a truck/rail route to the port of Burgas, Bulgaria.
4.5.2 Power and Water Supply
Serbia’s power infrastructure is well-developed and Bor is situated in a favorable location with access to a reliable power supply. Bor is one of the transfer points for the long-range 400-kV power line that transmits electrical power from the Đjerdap 1 hydroelectric plant, located on the Danube River, approximately 90 km northeast of Bor. The Bor 2 transmission substation is located five kilometres northwest of the project, and a 110-kV transmission line passes within one and a half kilometres of the Project.
| Various/RJM/PJD | Timok_PEA_NI43-101_Report_2CR021.006_20171130.docx | November 2017 |
| SRK Consulting | |
| Timok PEA NI 43-101 | Page 12 |
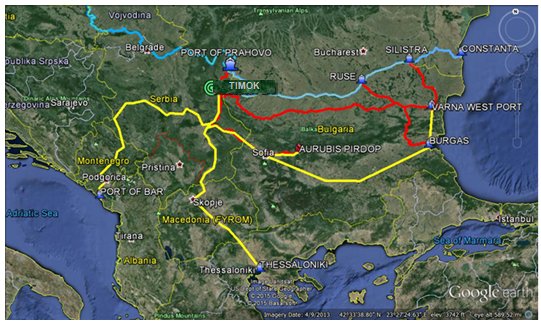
Source: Google Earth
Figure 4.1: Logistics network (blue-river route; yellow-rail routes; red- road transport routes)
The electricity market in Serbia is dominated by the national power utility EPS (Elektro Privreda Srbije), which manages 99% of the country’s electricity generation, producing a total of 8,350 MW. EPS produced 35.7 TWh of electricity in 2015 and approximately 35.6 TWh in 2016. Power transfer is ensured by EMS (Elektromreža Srbije), the state-owned transmission system operator, which owns and operates the electrical network at the 110-kV, 220-kV and 400-kV voltage levels.
During pre-production, start-up water will be sourced from run-off in the TSF catchment and mine water pumped from underground. If necessary, water from the Brestovačka River will also be used. During production, make-up water will continue to be sourced from the TSF catchment and from mine water. In addition, water will be reclaimed from the TSF. The Brestovačka River will remain as a standby source. Potable water will be sourced from the local Bor Municipality via a new 12-km pipeline, to be constructed.
| Various/RJM/PJD | Timok_PEA_NI43-101_Report_2CR021.006_20171130.docx | November 2017 |
| SRK Consulting | |
| Timok PEA NI 43-101 | Page 13 |
5 History
5.1 Historical Exploration and Mining to 2004
The history of exploration and mining in the Timok Bor district is described by Jankovic et al. (2002) as provided below.
The earliest known historic exploitation in the Region focused mainly on copper (and smelting) as early as 5500 BC (Vinca culture age). The next known historic exploitation of surface outcrops in the district was for gold in the massive sulphide mineralization at the Bor Coka Dulkan and Tilva Ros and Majdanpek gold (and iron) occurrences. This likely commenced during the Bronze Age and was continued by the Romans, who were active throughout the region and who also extracted alluvial gold from the Pek and Timok Rivers.
Serbian investors (including Georg Weifert) financed prospecting and exploration in the Bor district from 1897 to 1902, which led to the discovery by Franjo Sistek of the copper and gold-rich Coka Dulkan and Tilva Ros deposits in 1902. Mine development began during 1903 and 1905 and mining commenced in 1907. The Serbian investors sold their interests to a French group (Society of the Bor Mines) who then controlled the mines until 1941. The mines and smelter were rehabilitated after the Second World War and were operated from then to the 1990s by the Yugoslav State, and then later by the state-owned RTB Bor.
During the Yugoslav State period, exploration focused on outcropping alteration and mineralization and drilling to maximum depth of approximately 700 m. During this time, the following porphyry deposits were discovered - Majdanpek, Bor River, Valja Strz, Veliki Krivelj, Cerovo/Cementation, Dimitri Potok and the high-sulphidation (HS) epithermal deposits - Lipa, Choka Marin, Choka Kuruga, Kraku Bugaresku. Most of these deposits were subsequently explored further and mined (Jankovic et al. 2002).
The earliest known exploitation in the Timok project area of Brestovać-Metovnica, was trial mining of copper and zinc mineralization south of Brestovać village, which was undertaken from an adit and blind shaft south of Brestovać by a French group in the 1930’s; however, there are only incomplete records and no meaningful production was recorded.
During the Yugoslav State period, exploration along the Bor trend continued and there are records of approximately 41 RTB Bor drillholes at various locations in and near the project area from 1975 to 1988. Most drilling was relatively shallow, with depths less than 500 m, and took place in small clusters mainly targeting gravity and other geophysical anomalies. The records are not complete, and no drill core was retained. The Timok deposit mineralization was not intersected in any drillholes from this time. No other significant mineralization was found apart from a hole south of Brestovać village (near the old workings), which showed elevated gold grades in altered andesite, for which the sampling and analytical records are also incomplete. This hole was followed up by a Eurasian Minerals Inc. exploration program in 2006 (see below).
During the period 1990 to 2002 and the political uncertainty and conflict in the former Yugoslavia and Serbia, no mineral exploration of any significance was undertaken. The Serbian government issued exploration permits and concessions in 2002 and mineral exploration activities in the Timok area began in 2004 with the arrival of companies including Phelps Dodge, Eurasian, Euromax and Dundee.
| Various/RJM/PJD | Timok_PEA_NI43-101_Report_2CR021.006_20171130.docx | November 2017 |
| SRK Consulting | |
| Timok PEA NI 43-101 | Page 14 |
5.2 Exploration 2004 to 2016
In 2004, the first Brestovać exploration permit was awarded to Southeast Europe Exploration d.o.o., a 100% owned subsidiary of Eurasian Minerals. Southeast Europe followed up on reports of the gold mineralization encountered in a historical drillhole from the 1970s, and in 2006, they confirmed this with shallow drilling. Drillhole BN-01 (terminated at 296.80 m) intersected gold and copper mineralization in the upper 60 m (including 22.4 m at 4.51 g/t gold) and zinc mineralization from 286 to 294 m. Follow-up ground magnetometry, induced polarization, and resistivity geophysical surveys defined a target area with high chargeability and conductivity characteristics in the “Corridor Zone” which extended through drill site BN-01.
In 2007, Southeast Europe became a 100% owned subsidiary of Reservoir Capital Corp and during 2007 to 2008, Reservoir undertook further geophysics and soil geochemical surveys in the Brestovać area and outlined a high-grade epithermal copper-gold system in the Corridor Zone along a strike length of 550 m, defined by 14 drillholes (total 1,937 m). Drillhole BN-19, at the eastern end of the Corridor Zone, close to the interpreted extension of Bor Fault, intercepted a massive sulphide zone with 24.8 m at 0.33% copper and 0.16 g/t gold, which supported the concept that the epithermal gold mineralization of the Corridor Zone grades into a copper-rich zone.
Phelps Dodge Exploration Corp obtained exploration permits at Timok and Serbia in 2004, including the Metovnica exploration permit which was adjacent to the Brestovać exploration permit. In 2007, Phelps Dodge was acquired by Freeport McMoran and exploration continued. During 2006 to 2009, Phelps Dodge/Freeport undertook geological and large-scale induced polarization geophysical surveys on the Metovnica permit. Freeport also completed 14 drillholes (including three holes drilled during a joint venture with Euromax Resources) in the west and south of the Metovnica exploration permit. None of these holes intersected significant mineralization.
In 2010, Reservoir Capital and Freeport formed a joint venture (the Rakita Earn-in Agreement) with combining the Brestovać-Metovnica, Jasikovo, and Leskovo permits. Joint venture exploration continued with geophysical surveys and drilling over all permits. In 2011, drilling in the Brestovać-Metovnica permit discovered further intermediate sulphidation gold mineralization in the Ogasu Kucajna Prospect north of the Corridor Zone and then moved to exploration beneath the Miocene Basin area in the Slatina-Miocene project. In 2012, the third hole on this program, FMTC1210, intersected Upper Zone style HS mineralization with 266 m grading an average of 1.23% copper equivalent from 598 to 864 m and also porphyry style Lower Zone mineralization at depth. This became the Project Discovery hole.
From 2010 to 2016, joint venture exploration continued with exploration drilling on both the Upper Zone (59,333 m) and Lower Zone (42,380 m) deposits. Field work also included geological mapping, geochemical surveys and large-scale controlled source audio magneto-telluric (CSAMT) (Figure 5.1) and additional induced polarization surveys. These surveys covered certain target areas where Miocene sediments overlie the Upper Cretaceous volcanic rocks. Orientation surveys over known deposits in the Bor district were also carried out.
| Various/RJM/PJD | Timok_PEA_NI43-101_Report_2CR021.006_20171130.docx | November 2017 |
| SRK Consulting | |
| Timok PEA NI 43-101 | Page 15 |
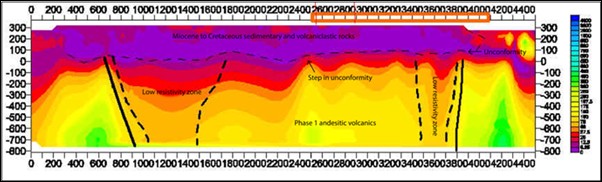
Source: Nikova, L., 2014
Figure 5.1: Line 60 CSAMT geophysical survey, looking north-northwest
The CSAMT survey highlighted the position of the base of the Miocene and the location of high / low resistivity zones and potential structural zones overlying the Upper Zone. The CSAMT data was used for exploration targeting and contributed significantly to the initial drill intersection of the Upper Zone, as documented by Reservoir in a press release on 16 July 2012. Drillhole to surface induced polarization resistivity measurements were conducted around drillhole FTMC1210, but the results were not sufficiently encouraging to justify further downhole induced polarization surveys.
After acquiring 55% equity interest under the Rakita agreement, Freeport gave notice to Reservoir in July 2012 that it had elected to sole fund expenditures on or for the benefit of the Project, until the completion and delivery of a feasibility study to bankable standards.
5.3 Ownership 2016 to 2017
On 24 April 2016, Reservoir Minerals and Nevsun announced that they had entered into a definitive agreement to combine their respective companies. Concurrently, the two companies also entered into a funding transaction to provide financing for Reservoir Minerals to exercise its right of first offer (ROFO) in respect of its joint venture with Freeport. Upon closing of the ROFO, Reservoir would have a 100% interest in the Upper Zone and a 60.4% interest in the Lower Zone under two joint venture agreements with Freeport and will become the operator of the Project. Upon completion of a feasibility study, Reservoir’s interest in the Lower Zone would reduce to 46% and Freeport’s interest in the Lower Zone will increase to 54%.
On 02 May 2016, Reservoir announced it had exercised its ROFO with Freeport to acquire Freeport’s 55% interest in the Upper Zone and increase its interest in the Lower Zone by payment of US$135 million to Freeport.
On 17 June 2016, Reservoir announced its approval of the Plan of Arrangement with Nevsun.
Such actions resulted in Nevsun acquiring 100% of the Upper Zone and 60.4% of the Lower Zone.
5.4 Historical Estimates
SRK and Reservoir Minerals produced a mineral resource estimate for Čukaru Peki (Upper Zone) with an effective date of 27 November 2013, reporting an Inferred mineral resource, above a 1% copper equivalent cut-off grade, of 65.3 Mt grading 2.6% Cu, 1.5 g/t Au and 0.1% As (SRK (UK), 2014).
| Various/RJM/PJD | Timok_PEA_NI43-101_Report_2CR021.006_20171130.docx | November 2017 |
| SRK Consulting | |
| Timok PEA NI 43-101 | Page 16 |
In 2016, SRK and Reservoir Minerals produced a PEA report, with an updated mineral resource estimate for Čukaru Peki, with effective date of 31 March 2016. The mineral resource included an Indicated mineral resource of some 1.7 Mt above a cut-off grade of 0.75% copper, with average grades of 13.5% copper, 10.4 g/t gold and 0.23% arsenic and an Inferred mineral resource of some 35.0 Mt above a cut-off grade of 0.75% copper, with average grades of 2.9% copper, 1.7 g/t gold and 0.17% arsenic (SRK (UK), 2016).
Both historical mineral resources are relevant and reliable. They use mineral resource categories as defined in CIM Definition Standards (and by extension NI 43-101) and can be relied upon. The historical mineral resources demonstrate that the current mineral resource estimates are robust. The historical estimates are superseded by the estimates presented in this technical report.
5.5 Historical Production
Trial mining of copper and zinc mineralization was undertaken from an adit and blind shaft south of Brestovać; however, no meaningful production was recorded. There has been no significant production registered from the Brestovać-Metovnica exploration permit.
| Various/RJM/PJD | Timok_PEA_NI43-101_Report_2CR021.006_20171130.docx | November 2017 |
| SRK Consulting | |
| Timok PEA NI 43-101 | Page 17 |
6 Geological Setting and Mineralization
6.1 Regional Geology
The Čukaru Peki HS copper-gold deposit is located within the central zone (or Bor District) of the TMC, which represents one of the most highly endowed copper and gold districts in the world. The TMC is located within the central segment of the Late Cretaceous Apuseni-Banat-Timok-Srednogorie (ABTS) magmatic belt in the Carpatho-Balkan region of southern-eastern Europe. The ABTS belt forms part of the western segment of the Tethyan Magmatic and Metallogenic Belt (TMMB) which lies along the southern Eurasian continental margin (Figure 6.1) and extends over 1,000 km from Hungary, through the Apuseni Mountains of Romania, to Serbia and Bulgaria to the Black Sea.
The TMMB, which is one of the longest magmatic arc systems in the world (Jankovic, 1997; Perelló et al., 2008; Richards et al., 2012; Richards, 2015), formed during Mesozoic to Tertiary evolution (and closure) of the Neotethys ocean and involved multiple subduction events and collision (orogenic) tectonism within the Eurasian segment. The TMC occurs within the Alpine-Balkan-Carpathian-Dinaride geo-tectonic province that also forms the westernmost part of the Tethyan Alpine-Himalayan orogenic system. TMMB magmatism and orogenic events occurred during closure of the Neotethys Ocean, which resulted in multiple subduction events and subsequent collision between the Indian, Arabian, and African plates with the Eurasian craton. Tectonic-magmatic events were initiated in the Middle Jurassic and continued through the Cretaceous to the present time.
In the Carpatho-Balkan sector, magmatism terminated at the time of the collision and was subsequently overprinted by major collision-related deformation (Dewey et al., 1973; Schmid et al., 2008). The collisional overprinting makes arc magmatic reconstruction and interpretation of the associated geo-tectonic setting very difficult (Sosson et al., 2010; Bouihol et al., 2013).
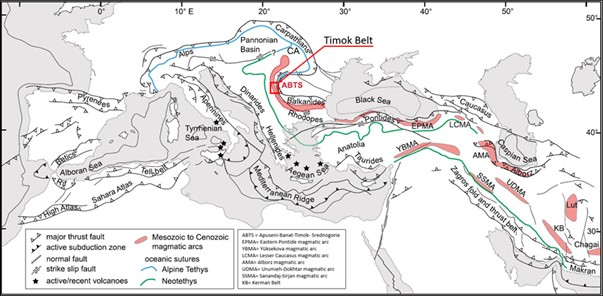
Source: Modified from Morelli and Barrier 2004, in Gallhofer et al., 2015
Figure 6.1: Tectonic map of the western Eurasia continental margin
| Various/RJM/PJD | Timok_PEA_NI43-101_Report_2CR021.006_20171130.docx | November 2017 |
| SRK Consulting | |
| Timok PEA NI 43-101 | Page 18 |
In southeast Europe (Carpathian-Balkans) the Late Cretaceous ABTS belt has been separated into five different segments showing distinctive magmatic and mineralization trends along the arc (Figure 6.2), defined by geographic regions and also by major crustal fault zones. The timing and the evolution of the magmatism and its associated deposits are relatively well studied in the central and eastern segments at Timok in central-east Serbia and Panagyurishte and Srednogorie in Bulgaria (Gallhofer et al., 2015).
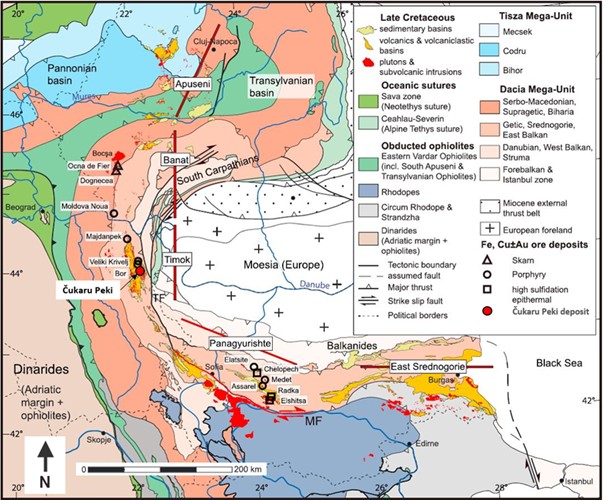
Source: Schmid et al., 2008, 2001
Figure 6.2: Geological map of the Carpathian-Balkan Orogen showing the five segments of ABTS belt and Timok deposit
The ABTS magmatic arcs and associated metallogenic belts occur within the Balkan, Northern Rhodopes, South Carpathian and the Apuseni mountain ranges, which generally rise to an altitude less than 2,000 m amsl, and are partially covered by Miocene to recent sediments of the Pannonian Basin. The Late Cretaceous subduction-related intrusive rocks were intruded into pre-alpine basement of metamorphosed Palaeozoic and Proterozoic meta-sediments and granitoids, and Mesozoic clastics and limestone that had already undergone multiple Mesozoic orogenic episodes including accretion and major nappe formation (Figure 6.2).
The ABTS arc was subsequently intensively deformed during the Alpine Orogeny (Late Cretaceous to Neogene), bending around the Moesian platform (micro craton) to create the present “L” shape form of the arc. This deformation was not pervasive but was confined to brittle fault structures and ductile shear zones at the current level of exposures. The TMC underwent both compressional and extensional tectonics which partly predated and partly overprinted the Late Cretaceous magmatic arc, resulting in the distinctive segments of ABTS belt (Gallhofer et al., 2015).
| Various/RJM/PJD | Timok_PEA_NI43-101_Report_2CR021.006_20171130.docx | November 2017 |
| SRK Consulting | |
| Timok PEA NI 43-101 | Page 19 |
The Timok Region occurs within the Getic sector of the Dacia terrane at the western margin of the Moesian craton (Figure 6.2). The Dacia terrane is a major nappe unit, which comprises slices of Proterozoic to Mesozoic aged continental, continental margin and ocean crust that were accreted during Cretaceous subduction and collision. Transition from compressional to extensional tectonics occurred during slab break-off which generated fertile but relatively short-lived Late Cretaceous regional multiphase magmatic and mineralizing events (over ~30 million years ago (Ma)) from ~90 Ma to 60 Ma.
The Timok segment of the ABTS belt, has one of the highest concentrations of copper and gold metal in the Tethyan Belt, and its metallogenic endowment is a significant contributor to that of the entire Tethyan Eurasian Metallogenic Province. The metal endowment is contained mainly in porphyry copper-gold and associated massive sulphide HS epithermal copper-gold systems, as well as occurrences of low to intermediate sulphidation epithermal and skarn mineralization. In the TMC, the world-class Bor HS epithermal system and Majdanpek porphyry system have contributed to an estimated historical production of approximately 11.5 Mt of copper and 1.2 Moz of gold (Armstrong et al. 2005; Jelenkovic et al., 2016).
6.2 Property Geology
The Timok deposit is located within the central part of TMC, in the Bor District of northeastern Serbia (Figure 6.3). The project area is approximately five kilometres south of the mining municipality of Bor. The TMC is a north-south elongated lens-shaped graben feature with dimensions of approximately 85 km long and up to 25 km wide. The TMC comprises a series of andesitic to dacite-andesitic subvolcanic, volcanic and volcano-sedimentary sequences and plutonic intrusions (mainly monzonite to diorite and granodiorite compositions). The TMC is generally erosionally well-preserved when compared with both the Banat and Panagyurishte segment belts to the north in Romania and to the east in Bulgaria respectively. The largest porphyry and porphyry-epithermal deposits in the Timok segment are represented by the Majdanpek and Bor copper and gold deposits (Figure 6.2) which are hosted within in Upper Cretaceous andesitic volcanic units.
The exposed geology in the project area is dominated by Upper Cretaceous andesitic volcano-sedimentary sequences partially covered by a north-south to northwest elongated belt of poorly consolidated Tertiary clastic sedimentary rocks. Basement Mesozoic stratigraphy exposed around the TMC consists of Jurassic to Lower Cretaceous limestones and clastic sedimentary rocks (Figure 6.4).
Within the Jurassic succession, it is possible to recognize Lower and Middle Jurassic clastic units and sandy limestones up to 320 m thick. These units are overlain by Upper Jurassic reef limestone (Djordjević & Banješević, 1997) which are unconformably overlain by Lower cretaceous (Albian) sandstone (Djordjević & Banješević, 1997; Toljić, 2015). A transgressive Aptian-Albian carbonate sequence (up to 150 m thick) is conformably overlain by lower Later Cretaceous (Cenomanian) sandstone.
| Various/RJM/PJD | Timok_PEA_NI43-101_Report_2CR021.006_20171130.docx | November 2017 |
| SRK Consulting | |
| Timok PEA NI 43-101 | Page 20 |
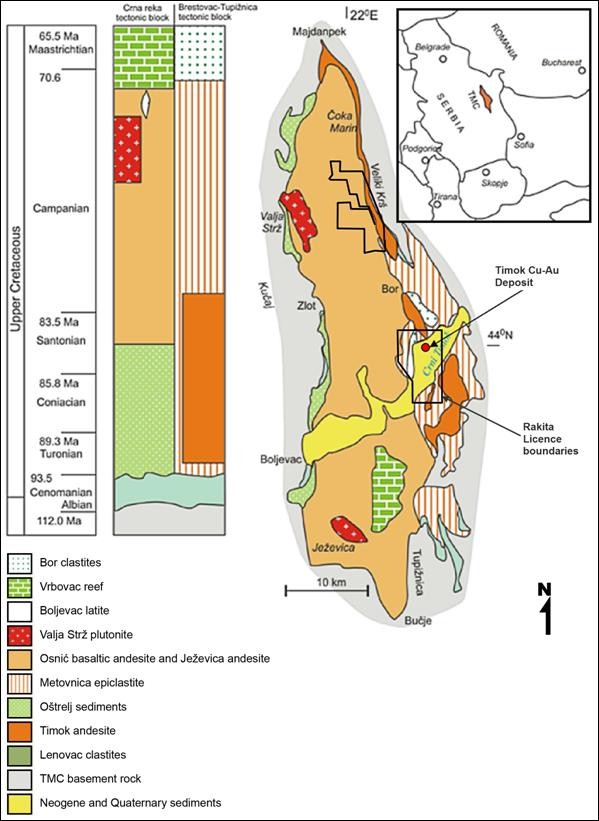
Source: Jelenkovic et al., 2016
Figure 6.3: A simplified geological map of the Timok magmatic complex, showing the position of the Timok deposit and the Rakita licenses
| Various/RJM/PJD | Timok_PEA_NI43-101_Report_2CR021.006_20171130.docx | November 2017 |
| SRK Consulting | |
| Timok PEA NI 43-101 | Page 21 |
The Cenomanian sedimentary rocks are conformably overlain by volcanic, volcaniclastics and sedimentary units of the Upper Cretaceous TMC. The TMC complex is dominated by Late Cretaceous (Turonian to Campanian) andesitic lavas, lava domes and shallow intrusions, volcaniclastic and epiclastic units and basaltic andesites, volcaniclastics and clastic sedimentary rocks that formed in an extensional rift basin.
The TMC andesite volcanic rocks are typically calc-alkaline in composition. Kolb et al. (2013) describe a geochemical signature similar to adakites, which are commonly associated with porphyry and epithermal copper and copper-gold deposits elsewhere in the world. The western and eastern borders of the TMC complex are structurally controlled by major faults (Figure 6.4). In the centre and southeast of the TMC, Miocene clastic sedimentary rocks unconformably overlie the Late Cretaceous units (Figure 6.5).
Three different phases of volcanic andesitic and minor dacitic sequences are recognized. The intrusive units are composite complexes from gabbro, diorite, monzonite and granodiorite. Volcanic activity was initially predominantly sub-terrestrial and subaerial which changed to submarine in later phases (Banješević, 2010).
Banješević (2010) describes in detail the volcanic stratigraphy, lithologies and age-dating in the central TMC and notes that the TMC is divided into an eastern ‘Phase 1’ Bor-Lenovac volcanic facies (or ‘Timok andesite’) and a western ‘Phase 2’ Crna Reka volcanic facies (or ‘Osnić basaltic and Jezevica andesite’), possibly related to separate tectonic blocks (Figure 6.3). Phase 1 units comprise andesitic hornblende-andesite volcanics (dated ~ 89.0 to 84.3 Ma), subvolcanic intrusions with intercalated volcaniclastics, epiclastics, marls and fine-grained clastics that are restricted to the eastern Brestovać-Tupižnica tectonic block. Phase 2 (dated ~82.3 to 81.8 Ma) consists of basaltic (pyroxene-bearing) andesite volcanics and volcaniclastics which are restricted to the western Crna Reka tectonic block.
The boundary between the Phase 1 - eastern and Phase 2 - western volcanic sequences has not been observed to date. The contact between facies may be transitional and / or tectonic and may occur along a suture through the Brestovać river valley, which trends north-northwest to south-southeast through the western part the Brestovać-Metovnica exploration permit.
A third phase of younger more felsic intrusive rocks, though rare, does occur in the permit area and is generally the youngest phase in the TMC. In the eastern block, a quartz-bearing dacitic intrusive is mapped south of Brestovać village, where it is associated with an east-west fault and trachy-andesite dykes (81.5 Ma) outcropping at the Brestovać cross roads. In the western block, the Valja Strž monzonite to granodiorite suite (78.6 Ma) was intruded during the final phases of magmatism.
Following this final period of volcanism and magmatism, there was a period of sedimentation and uplift (including deposition of reef carbonates in the central TMC and formation of coarse clastics (Bor Conglomerate)) in the eastern TMC. After deformation (which included compression and nappe formation) and uplift (Alpine Orogeny) in the early Cenozoic, Miocene lacustrine clastic sediments (siltstones, sandstones and conglomerates up to 400 m thick in the TMC) were unconformably deposited on the underlying Late Cretaceous volcanic and volcaniclastic rocks.
| Various/RJM/PJD | Timok_PEA_NI43-101_Report_2CR021.006_20171130.docx | November 2017 |
| SRK Consulting | |
| Timok PEA NI 43-101 | Page 22 |
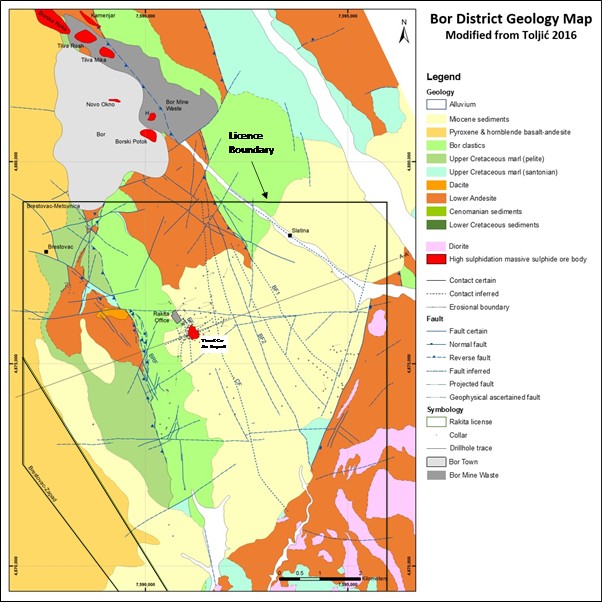
Source: Rakita, 2017
Figure 6.4: Geology map of Bor district showing the location of the known HS epithermal and porphyry deposits
In summary, the geology of the Brestovać-Metovnica licence area is dominated by the Phase 1 Upper Cretaceous Timok andesite volcanic unit, which comprises volcanic flows, locally subvolcanic intrusions, volcaniclastic rocks, and clastic sedimentary rocks typical of the eastern tectonic block. A small area of Phase 2 pyroxene-bearing basaltic andesite typical of the western Crna Reka Tectonic Block occur in the northwest part of the permit. Miocene clastic sedimentary rocks (locally with fault-bound basin margins) unconformably overly the Late Cretaceous in the centre of the permit area (Figure 6.4).
| Various/RJM/PJD | Timok_PEA_NI43-101_Report_2CR021.006_20171130.docx | November 2017 |
| SRK Consulting | |
| Timok PEA NI 43-101 | Page 23 |

Source: Rakita, 2017 (modified from Toljić, 2016)
Figure 6.5: Cross-section through the Čukaru Peki and underlying Timok Lower Zone deposit
6.3 Mineralized Zones
The Upper Zone (Čukaru Peki) and the Lower Zone are both part of the Timok copper-gold project.
6.3.1 Timok Upper Zone
Timok Upper Zone is a high-grade HS epithermal deposit typically associated with an advanced argillic alteration system with a discrete footprint.
The top-third of the HS epithermal mineralization of the UZ is characterized by a massive sulphide lens located on the top of a volcanic to volcaniclastic sequence (Figure 6.6). This lens has a variable but overall similar dip to the overlying stratigraphy. With increasing depth from the top of the UZ, the proportion of massive sulphide mineralization intruding or replacing the host rock reduces, as does the sulphide content and presence of fragmental volcanic units. With depth, the mineralization becomes more characterized by veins and stockworks hosted by more coherent andesite (Figure 6.7).
The massive sulphide comprises mainly pyrite and covellite and hosts the highest grades of copper and gold; multiple pyrite replacement phases are observed, which in some places comprise up to 95 wt% of the deposit. Locally, different pyrite phases can be recognized by cross-cutting relationships; however, in general they are difficult to distinguish. Covellite is interpreted to be later than pyrite and is observed transgressively cutting and brecciating massive pyrite; however, pyrite can also locally be observed cross-cutting covellite stringers or massive aggregates of covellite flakes intergrowing with alunite.
Pyrite with enargite is also present. Enargite is commonly observed rimmed and sometimes replaced by covellite and is therefore interpreted to represent an earlier phase of mineralization.
| Various/RJM/PJD | Timok_PEA_NI43-101_Report_2CR021.006_20171130.docx | November 2017 |
| SRK Consulting | |
| Timok PEA NI 43-101 | Page 24 |

Figure 6.6: High grade covellite breccia in massive pyrite. Hole FTMC1223 480.9 to 484.4 m
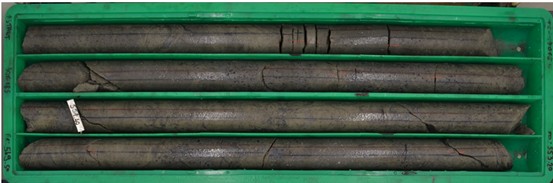
Figure 6.7: Massive sulphide, veins and stockwork in more coherent andesitic rock. Hole TC170150 at 549.5 to 5536.208 m
Mineralized hydrothermal breccias have also been locally observed in the UZ and at least two events have been recognized: an early syn-mineralization phase and an inter-mineral phase, hosting fragments of massive sulphide (Figure 6.8).
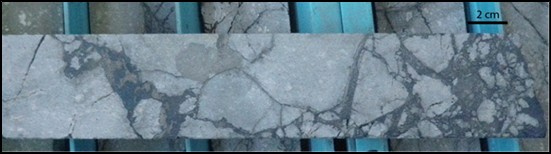
Figure 6.8: Probably early hydrothermal breccia matrix filled by covellite-pyrite mineralization in advanced argillic altered andesite. Hole FTMC1223 at 698 m
Gold mineralization is present in a number of forms, including tellurides such as calaverite (Au), sylvanite (Au-Ag) and kostovite (Au-Cu), altaite (Pb) and is mostly hosted in pyrite but also locally found encapsulated in bornite (Cornejo, 2017). Native gold is not common; however, where observed it is very fine, approximately 2 to 6 μm in diameter.
Low temperature galena and sphalerite as disseminations and in veins are noted in the peripheral zones of the UZ mineralization, mostly related to kaolinite-pyrite alteration fronts.
| Various/RJM/PJD | Timok_PEA_NI43-101_Report_2CR021.006_20171130.docx | November 2017 |
| SRK Consulting | |
| Timok PEA NI 43-101 | Page 25 |
6.3.2 Timok Lower Zone
The Timok Lower Zone consists of lower grade porphyry copper-gold style mineralization comprising quartz-sulphide veins and disseminated sulphides and larger alteration footprint. The Lower Zone is situated approximately 200 m beneath the Upper Zone and extends from this point to the north of the Upper Zone, and most likely represents the source of fluids for the Upper Zone epithermal mineralization.
The Lower Zones constitutes a telescoped porphyry system related to multi-stage diorite intrusion, whereby the Lower Zone potassic zone with well-developed A-type vein stockwork is overprinted by quartz-sericite alteration (with classic D-type veinlets) and Upper Zone HS alteration and mineralization assemblages including alunite-dickite, covellite-pyrite and vuggy silica replacement.
Upper Zone HS epithermal mineralization at the Project occurs at depths from 450 to 850 m below surface. Lower Zone porphyry style mineralization is found from 700 to 2,200 m. To date, the deepest drillhole intercepting Lower Zone mineralization is hole TC170131A which terminated in porphyry style mineralization at 2,268.1 m.
6.4 Upper Zone Alteration
The footprint of Čukaru Peki mineralization is directly associated with the advanced argillic alteration and has a narrow alteration front or halo of kaolinite-pyrite, which typically varies from 1–3 to 10 m wide and is noted to have a distinctive gold, lead and zinc geochemical signature.
The advanced argillic alteration assemblages observed in the UZ are typical of HS epithermal systems. Spectrometer analysis and core logging confirm the presence of quartz-alunite, quartz-alunite-dickite and locally pyrophyllite and diaspore typically associated with massive and vein/stockwork sulphide mineralization. This extends downwards forming a transition zone overprinting the LZ porphyry alteration and mineralization.
The kaolinite-pyrite (to kaolinite-smectite) envelope represents the alteration front of the mineralized body and is characterized by high gold values without copper, particularly at the margins of the high-grade copper and gold zones. Average gold grades of 1 g/t in small drillhole intervals are common, and locally higher gold values up to 10 g/t can be found. Discontinuous but anomalous values of lead and zinc (occurring as fine dissemination or veinlets of sphalerite and galena) are observed with up to 1,000 ppm zinc and lead. Crystals of native sulphur (occurring in vein-fractures and disseminations) are also commonly observed within this zone.
A more distal argillic alteration halo (outside of the kaolinite-pyrite envelope), comprising mainly smectite and montmorillonite in fractures, is noted to extend laterally for approximately 100 m around the margins of the deposit. A weak, poorly developed argillic footprint is also observed above the deposit although this is terminated at the overlying unconformity. The main argillic alteration halo occurs at the margins and beneath the UZ mineralization and is observed as a more intense clay altered zone, which may also relate to faulting.
A summary of the main alteration minerals used to model each of the UZ alteration zones is provided in Table 6.1 and a schematic illustration of the distribution of the alteration in context of the main mineralized zones is illustrated in Figure 6.9.
| Various/RJM/PJD | Timok_PEA_NI43-101_Report_2CR021.006_20171130.docx | November 2017 |
| SRK Consulting | |
| Timok PEA NI 43-101 | Page 26 |
Table 6.1: Indicator minerals for alteration assemblages
Assemblage | Unique Indicator minerals |
Advanced Argillic | Alunite, dickite or pyrophyllite. Quartz is present in this and other assemblages. |
Kaolinite | Kaolinite without alunite, dickite or pyrophyllite. Commonly occurs with pyrite. |
Argillic | Montmorillonite, smectite or related complex clays. |
Sericite-illite (Phyllic) | Sericite, illite or related complex clays. |
At depth, circa -500 m amsl, the UZ alteration footprint is interpreted to be more structurally controlled comprising a mixture of advanced argillic alteration, kaolinite, sericite-illite to sericitic assemblages and covellite-pyrite mineralization overprinting early chalcopyrite-sericite and remnant potassic alteration. This is considered to represent the transition into the LZ porphyry style mineralization and alteration.
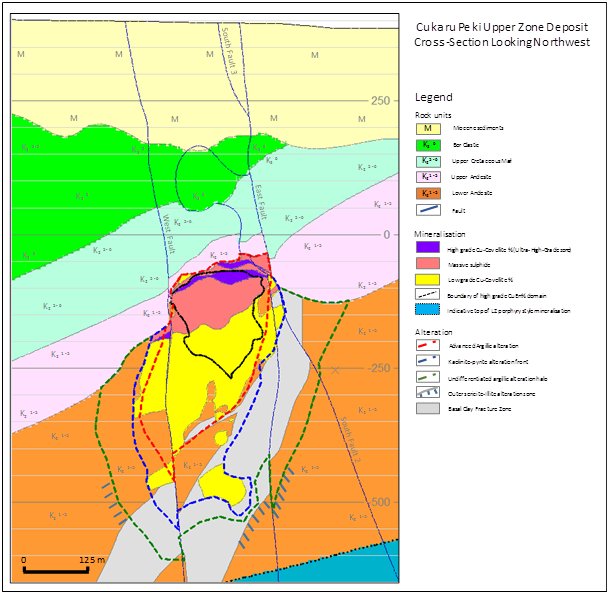
Figure 6.9: Typical alteration zonation section through Čukaru Peki looking northwest, showing the geology, alteration and mineralized units
| Various/RJM/PJD | Timok_PEA_NI43-101_Report_2CR021.006_20171130.docx | November 2017 |
| SRK Consulting | |
| Timok PEA NI 43-101 | Page 27 |
6.5 Lithology
The Timok deposit is located within the Bor metallogenic zone of the TMC. The deposit is hosted within Upper Cretaceous (Phase 1) andesitic volcanic rocks. The volcanic rocks are overlain conformably by an Upper Cretaceous clastic sequence (up to 250 m thick) of Senonian marls and calcareous siltstone (Oštrelj Formation) and then overlain conformably by Maastrichtian conglomerate and sandstone of the Bor Clastic Formation (Banješević, 2010, 2015). A poorly consolidated sequence of Miocene clastic sedimentary rocks (sand and gravel to sandstone, conglomerate and mudstone), up to 400 to 500 m in thickness, unconformably overlies the Upper Cretaceous clastic sequence.
The andesitic units that host Čukaru Peki and Timok LZ can be further subdivided into the following facies:
• lava flows (coherent and autoclastic)
• shallow intrusions (lava domes, dykes and sills)
• various volcaniclastic rocks
The andesites comprise medium to fine porphyritic and aphanitic hornblende-plagioclase and hornblende-biotite-plagioclase volcanic as well as various andesitic volcaniclastic and epiclastic rocks, dacitic and dacitic-andesitic sub-volcanic intrusions as stocks, sills and dikes. In the deposit, the coherent volcanic or subvolcanic units are more abundant compared with the fragmental volcanic units.
U/Pb zircon and 40Ar/39Ar age dating on volcanic units (Jelenkovic et al., 2016) in the TMC suggest Late Cretaceous (Upper Turonian to Upper Santonian) ages spanning 89.0 ± 0.6 to 84.26 ± 0.67 Ma.
Recent laser ablation zircon dating by Rakita on samples of different volcanic and sub-volcanic rocks confirm the Late Cretaceous age and show that host volcanic unit ages range from 86.4 ± 1.5 Ma to 83.2 ± 1.4 Ma. Volcanic and volcaniclastic or fragmental andesitic rocks have reported a significant population of zircon ranging 88 to 90+ Ma, which could represent inherited zircons from the older basal part of the Andesite sequence (Valencia, 2017).
6.6 Structural Geology
6.6.1 Regional Scale
The geo-tectonic setting of the Timok region is the result of complex and multiphase subduction, collision/orogeny and large-scale oroclinal bending during post-collision tectonism throughout the Tertiary, which also involved major strike-slip faulting with overall dextral displacements in excess of 100 km. The Timok Region occurs within the Getic sector of the Dacia terrane at the western margin of the Moesian craton (Figure 6.2).
Principal structures in the Getic Nappe are northwest to north-south trending fold axes, thrusts and faults (Figure 6.10). The main structures in the Mesozoic sediments are north-northwest, northwest to north-south trending open fold axes (synclines) around the basement anticlinal dome with gentle dips to northwest, west-northwest and east-northeast. There is also a number of major north-northwest and north-south trending faults and thrusts running along the margin of the TMC. Thrusts are generally westward verging, and on the local scale, there are numerous northwest, northeast and east-west trending normal faults, including the (northwest-trending) Bor Fault which displaces the Bor deposits, as described in Section 6.6.2.
| Various/RJM/PJD | Timok_PEA_NI43-101_Report_2CR021.006_20171130.docx | November 2017 |
| SRK Consulting | |
| Timok PEA NI 43-101 | Page 28 |
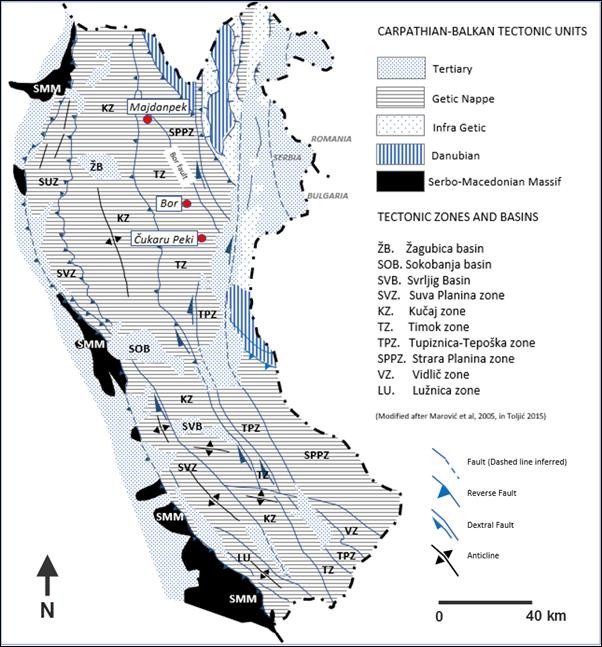
Figure 6.10: Principal tectonic units (and Tertiary cover - basins) and structures of the Carpatho-Balkan Region of eastern Serbia
The extrusive and intrusive units of the TMC formed within a north-northwest to south-southeast trending pull-apart graben (Drew, 2005) produced during transcurrent and strike slip faulting generated by Late Cretaceous orogenic transpression during oblique subduction (Popov, 1974; Drew, 2005). These extensional events were followed by the intrusion of the magmas and associated hydrothermal mineralizing systems which exploited major faults and pre-existing reactivated structures that have a pronounced north-northwest trend. The magmatic and associated mineralization (porphyry and epithermal deposits) follow a pronounced north-northwest to south-southeast to north-south regional structural trend.
| Various/RJM/PJD | Timok_PEA_NI43-101_Report_2CR021.006_20171130.docx | November 2017 |
| SRK Consulting | |
| Timok PEA NI 43-101 | Page 29 |
6.6.2 Local Scale
The Timok area went through complex multiphase tectonic compressional and extensional episodes during the Alpine Orogeny (Late Cretaceous to Tertiary). Associated volcanism and intrusive magmatism may have led to deposit formation.
Three main structural events can be recognized (Canby et al., 2015):
• An early extensional phase in the Upper Cretaceous, which caused the subsidence and formation of the TMC volcanic basin (graben) along marginal normal faults, characterized by volcanism, sedimentation and (after volcanic activity ceased) deposition of calcareous siltstones.
• A phase of compression followed (roughly normal to the current north-northwest orientation of the TMC) and period of rapid uplift led to formation of Bor clastic sediments.
• A later phase of extension, normal faulting and subsidence during the Miocene, which led to formation of sedimentary basins / deposits unconformably overlying the Late Cretaceous sedimentary units.
Major faults and most geologic units within the Timok area strike parallel to the north-northwest elongation of the TMC. In the Bor and Timok area, well-documented major structures include the Bor and Krivel faults. The former is a west-dipping high-angle reverse fault which displaces the Bor deposits upward and eastward by at least several hundred metres into their current position adjacent to or above the younger Bor clastic unit.
Deposit-scale drilling has possibly identified the ‘Bor 2’ fault beneath Miocene sediments, located to the east of the deposit, which has similar strike and dip to the Bor fault and labelled as ‘BF2’ alongside other permit-scale fault interpretations in Figure 6.4 and Figure 6.5. BF2 is considered by Rakita to represent the eastern (faulted) margin of the mineralized andesite within the Timok area.
Other prominent parallel north-northwest and east-west trending faults (lineament features) appear to be concealed beneath Miocene sediments as indicated by geophysical surveys (magnetic, gravity and CSAMT) as illustrated in Figure 6.11.
6.6.3 Deposit Scale
At the deposit scale, the Upper Zone (Čukaru Peki) HS deposit is located at an intersection between north-northwest and east-west structural corridors (Figure 6.12). The main mineralized zone is interpreted to be largely bound within the two major faults referred to as the East and West Faults (Figure 6.12). Mineralization is also observed as largely bound to the north of the ‘South Fault’ (Figure 6.12). However, limited drilling to date has been completed to the south of this structure and therefore the current interpretation may change with additional drilling campaigns.
Significant displacement along the West Fault has been interpreted largely based on drillhole TC150091, where the steep drilling orientation results in repetition downhole of very high grade massive sulphide mineralization and stratigraphy, explained (in context of logged fault rock and visual offset in copper grade and overlying stratigraphy in adjacent holes) by offset along a major structure.
| Various/RJM/PJD | Timok_PEA_NI43-101_Report_2CR021.006_20171130.docx | November 2017 |
| SRK Consulting | |
| Timok PEA NI 43-101 | Page 30 |
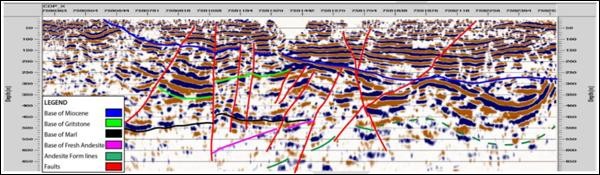
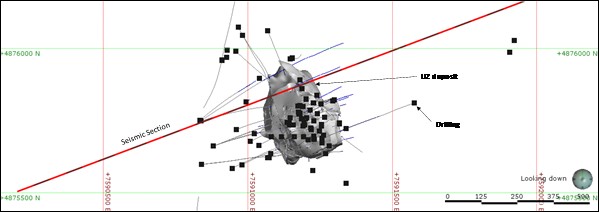
Source: SRK, modified from Curtin university/ GEOING group d.o.o., 2014
Figure 6.11: Preliminary seismic interpretation (top) and section reference (bottom) illustrating numerous faults, looking north-northwest
The faults have been interpreted based on 3D modelling of a combination of the visual sharp contact between the high-grade mineralization and very low-grade host rock, structural and geotechnical core logging, fault orientation data from acoustic borehole imaging (ABI) and also by the apparent displacement of the overlying Upper Cretaceous stratigraphic layers of marl and Bor clastic units.
In addition to the modelled faults shown in Figure 6.12, a relatively narrow, discontinuous zone of clay alteration and geotechnically weaker rock occurs at the upper margin of the lower andesite and UZ mineralized body. This is interpreted to represent the upper limits of the UZ argillic alteration front, rather than a discrete zone of faulting.
Whilst the predominantly vertical orientation of the drilling makes interpretation of the steep faulting at Čukaru Peki relatively difficult, in general the deposit-scale fault interpretations are considered to have a reasonable level of confidence. Internal zones of small-scale faulting, fracturing and zones of weaker clay altered rock within the mineralized zone have been modelled for geotechnical purposes using a combination of geotechnical logging, ABI and drill core structural logging. These do not significantly affect the geometry of the mineralization.
Beneath the mineralized body (and partly along its eastern margin), a broad zone of clay and clay fractures has been modelled (as shown in Figure 6.9) based on drill core observations and geotechnical data, primarily to inform geotechnical assessment. It currently remains unclear whether this zone primarily relates to structure or alteration; however, the most recent interpretation suggests this coincides with the argillic alteration front.
| Various/RJM/PJD | Timok_PEA_NI43-101_Report_2CR021.006_20171130.docx | November 2017 |
| SRK Consulting | |
| Timok PEA NI 43-101 | Page 31 |
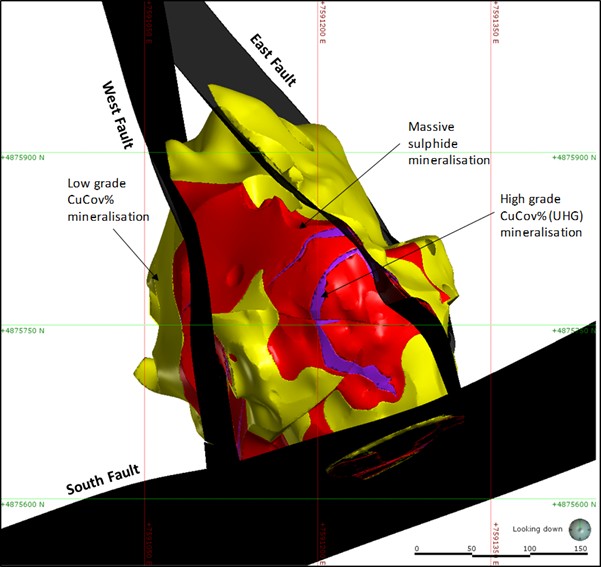
Figure 6.12: 3D (plan) image of major deposit-scale faults interpreted at Čukaru Peki
| Various/RJM/PJD | Timok_PEA_NI43-101_Report_2CR021.006_20171130.docx | November 2017 |
| SRK Consulting | |
| Timok PEA NI 43-101 | Page 32 |
7 Deposit Types
7.1 Mineralization in the Bor District
There are a number of different copper-gold deposits within the TMC, most of which are related to porphyry or epithermal style mineralization. Jelenković et al. (2016) have summarized the most significant styles of mineralization from the Bor district, including:
• porphyry copper-gold quartz-sulphide vein/stockwork and disseminated sulphide mineralization
• epithermal, HS “massive sulphide” mineralization
• skarn and contact / carbonate replacement deposits
• vein/fault-controlled vein
• hydrothermal volcanogenic polymetallic/sulphide-bearing matrix in intrusive hydrothermal breccia mineralization
• mechanical transported sulphide fragments/clasts in sedimentary mineralization
• sediment hosted gold deposits
The Bor copper-gold mining area is located approximately five kilometres north of the Timok project area. Bor contains two porphyry systems (Borska Reka, Borski Potok) as well as various spatially associated bodies of HS epithermal mineralization. The HS mineralization consists of covellite, bornite and locally chalcopyrite and enargite found in masses of fine-grained pyrite and occurs in several deposits including Coka Dulkan, Tilva Mika and Tilva Ros, which were very high grade and were originally mined out from the surface. Coka Dulkan, which was discovered in 1902, contained 5.45% to 19.4% of copper and an average of 1.5 g/t gold (Jankovic et al., 2002). Novo Okno and some of the other smaller “massive sulphide” deposits shown Figure 7.1, are interpreted to have been eroded and re-deposited from the original site of mineralization.
Figure 7.1 illustrates the close spatial relationships between the Bor porphyry and HS mineralization and the proximity to the Bor reverse fault. The principle styles of mineralization recorded at Bor have also been identified in the Timok area.
There are several other important porphyry related copper-gold deposits in the district to the northeast and north-northeast of Bor, including Veliki Krivelj, Mali Krivelj, Cementacija and Cerovo. Mineralization at Bor is invariably hosted by hornblende-andesites of the first volcanic phase (eastern block) and commonly related to north-northwest-striking reverse faults, including the important Bor Fault.
| Various/RJM/PJD | Timok_PEA_NI43-101_Report_2CR021.006_20171130.docx | November 2017 |
| SRK Consulting | |
| Timok PEA NI 43-101 | Page 33 |
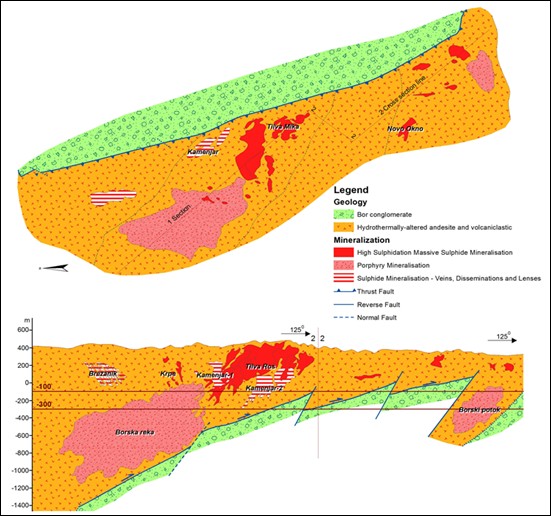
Source: modified from Jankovic et al., 2002.
Note: Horizontal and vertical scales are the same.
Figure 7.1: Plan and cross-section of the mineralization in the Bor mining district
7.2 Other Analogues
The HS epithermal and porphyry deposits of Timok bear many similarities to both the circum-Pacific southeast Asia copper-gold provinces and the neighbouring eastern extension of the Panagyurishte Belt in Bulgaria. Two examples of well-preserved porphyry copper systems with associated epithermal HS mineralization (outside of Timok Belt), are described below and include Panagyurishte, Bulgaria and Lepanto, Philippines.
7.2.1 Panagyurishte, Bulgaria
The Panagyurishte Belt, located east of the Timok Belt, represents a comparable well-preserved porphyry with associated epithermal mineralization, and clear evidence of telescoping (coalescence of the epithermal alteration assemblages of alunite).
The spatial association of the copper-gold epithermal deposits with porphyry copper deposits have been described in Bulgaria at the Panagyurishte Belt (Petrunov et al., 1991; Sillitoe, 1999). The Elshitsa HS epithermal deposits and nearby (1 km) past producing Vlaykov Vruh porphyry copper deposit constitute the best examples for the close spatial association of HS epithermal with porphyry Cu deposits (Kouzmanov, 2001) (Figure 7.2).
| Various/RJM/PJD | Timok_PEA_NI43-101_Report_2CR021.006_20171130.docx | November 2017 |
| SRK Consulting | |
| Timok PEA NI 43-101 | Page 34 |
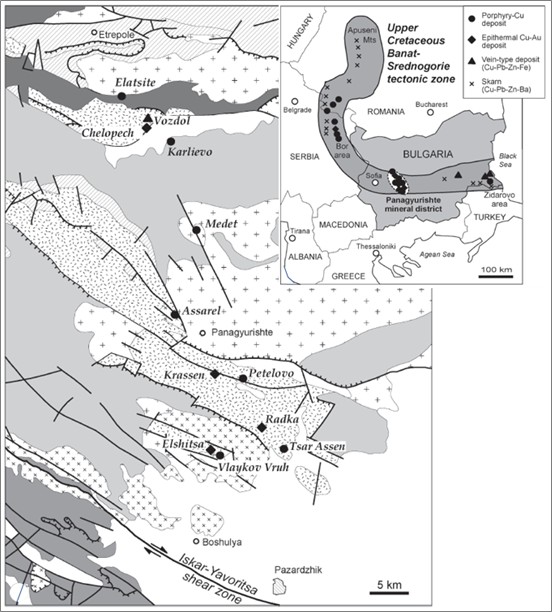
Figure 7.2: Panagyurishte Belt located eastern Timok Belt, showing clusters of copper and gold porphyry and its associated massive sulphide epithermal deposits
Cu–Au epithermal HS occurrences have also been described in the immediate proximity of the Assarel and Petelovo porphyry copper deposits (Petrunov et al., 1991; Sillitoe, 1999). The Chelopech HS massive sulphide deposit (1.28% Cu and 3.4 g/t Au) belongs to a deposit cluster in the northern Panagyurishte district, which also includes the vein-type Vozdol base metal occurrence, the Karlievo porphyry copper occurrence, and the major producing porphyry copper Elatsite deposit (1.13% Cu and 1.5 g/t Au in Popov et al., 2000).
7.2.2 Lepanto, Philippines
At the Lepanto deposit, the orebody mineralogy, alteration assemblages and deposit architecture are broadly comparable to those observed and interpreted at the Timok deposit (Hedenquist et al., 1998; Hedenquist & Taran, 2013). The combination of steeply-dipping structural controls combined with shallow-dipping lithological controls is broadly similar to that at the Timok deposit; however, the shallow dipping mineralization at Lepanto is related to a laterally extensive pre-mineralization unconformity as opposed to the relatively restricted lateral extent of the volcaniclastic breccia units at the Timok deposit (Figure 7.3).
| Various/RJM/PJD | Timok_PEA_NI43-101_Report_2CR021.006_20171130.docx | November 2017 |
| SRK Consulting | |
| Timok PEA NI 43-101 | Page 35 |
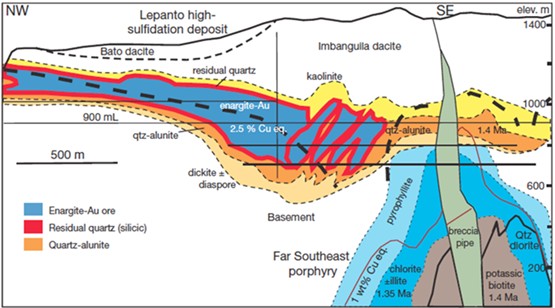
Source: Hedenquist & Taran, 2013
Figure 7.3: Schematic NW-SE long section through the Lepanto enargite-Au deposit
The smaller gold occurrences and prospects near Brestovać village (Corridor Zone and Ogasu Kucajna) are associated with base metals, in particular zinc, and display alteration and mineralogy similar to epithermal intermediate sulphidation mineralization (Sillitoe & Hedenquist, 2003). This style of mineralization is commonly developed in the distal parts of mineralizing systems and can form stand-alone deposits, such as Victoria at Lepanto (Hedenquist et al., 2000).
| Various/RJM/PJD | Timok_PEA_NI43-101_Report_2CR021.006_20171130.docx | November 2017 |
| SRK Consulting | |
| Timok PEA NI 43-101 | Page 36 |
8 Exploration
This section summarizes the work completed by Rakita and its partners within the Brestovać-Metovnica exploration permit since the start of the (2016) joint venture between Nevsun and Freeport-McMoRan Exploration Corporation. The history of mineral exploration in the Brestovać and Metovnica permits prior to 2016 is summarized in Section 5.
During 2016 to 2017, several diamond drilling programs have been completed from surface mainly targeting the Timok UZ deposit, as described and illustrated in Section 9.
Exploration drilling is currently in progress at the margins of Čukaru Peki, based on targets generated from updated interpretation of the geological, geochemical, geophysical, downhole electromagnetic, spectral and assay information. The lines of the 2017 geophysical survey, illustrated against previous geophysical lines, all drilling completed to date and exploration target areas are shown in Figure 8.1. The current exploration drilling is targeting possible extensions to the current mineral resource to the east and west of Čukaru Peki, as illustrated in Figure 8.2.
A regional exploration drilling program is also currently underway in the Brestovać Permit. This program incorporates downhole electromagnetic geophysical surveys to help search for the presence of nearby off-hole conductive mineralized bodies, similar to the massive sulphide (pyrite-covellite) mineralization at Čukaru Peki.
In addition to the current exploration drilling, given the proximity of the planned project infrastructure to the UZ mineral resource model, Rakita plans to implement a condemnation drill program, as illustrated in Figure 8.3. The condemnation drilling campaign will consist of approximately 21 vertical holes with depths between 800 and 1000 m, partly on a grid spacing of 500 m, near the deposit and under the process plant area, and partly along the path of the proposed decline. Rakita plans to pre-collar the first 200 to 300 m with reverse circulation drilling, then continue with diamond drilling at HQ and NQ diameter.
| Various/RJM/PJD | Timok_PEA_NI43-101_Report_2CR021.006_20171130.docx | November 2017 |
| SRK Consulting | |
| Timok PEA NI 43-101 | Page 37 |
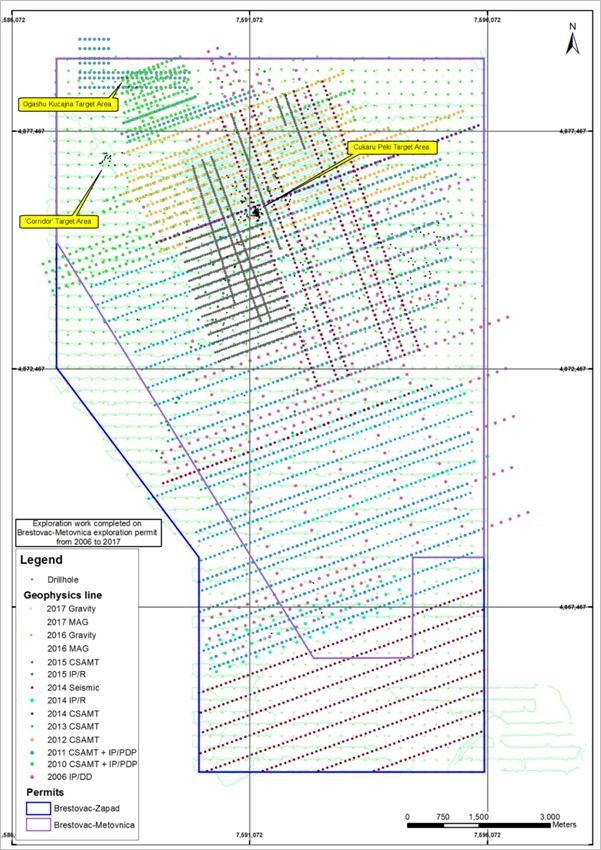
Source: Rakita, 2017
Figure 8.1: Exploration work completed on the Brestovać-Metovnica exploration permit from 2006 to 2017
| Various/RJM/PJD | Timok_PEA_NI43-101_Report_2CR021.006_20171130.docx | November 2017 |
| SRK Consulting | |
| Timok PEA NI 43-101 | Page 38 |
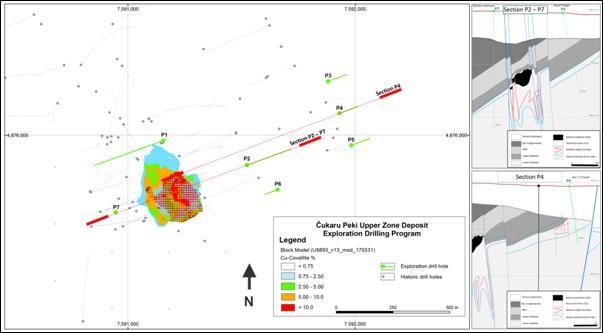
Source: Rakita, 2017
Figure 8.2: Rakita’s exploration drilling at the margins of current Čukaru Peki mineral resource
| Various/RJM/PJD | Timok_PEA_NI43-101_Report_2CR021.006_20171130.docx | November 2017 |
| SRK Consulting | |
| Timok PEA NI 43-101 | Page 39 |
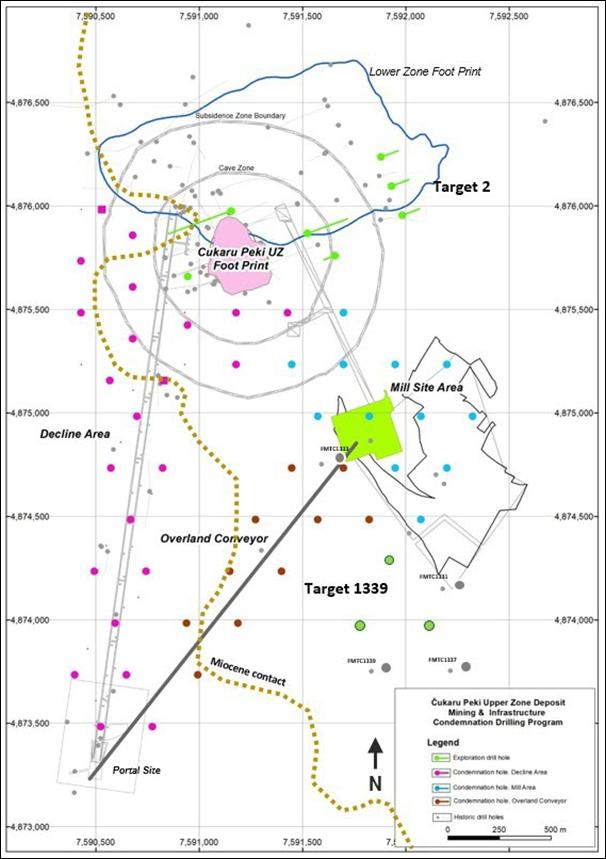
Source: Rakita, 2017
Figure 8.3: Rakita’s proposed exploration and condemnation drilling program
| Various/RJM/PJD | Timok_PEA_NI43-101_Report_2CR021.006_20171130.docx | November 2017 |
| SRK Consulting | |
| Timok PEA NI 43-101 | Page 40 |
9 Drilling
9.1 Historical Drilling Programs
Historic drilling completed on both the Brestovać and Metovnica sectors of the Brestovać-Metovnica exploration permit is summarized in Section 5, with the location of the historic drill collars (shown against those completed by Rakita and its partners) shown on Figure 8.1.
SRK has relied on summary documents provided by Rakita in relation to historic drilling outside of the Timok deposit area and has not completed a detailed review of collar, assay, survey and geology as part of the current phase of work. SRK is not aware of any historic drilling programs completed within the Timok deposit area, prior to the exploration completed by Rakita.
9.2 Current Drilling Programs
This section focusses on the Rakita drilling completed into the Upper Zone, including the discovery drillhole.
9.2.1 Summary of Data Quantity
All drilling data available for the Upper Zone as of 24 April 2017 was made available to SRK (UK). A summary of the Upper Zone holes completed by the Rakita is provided in Table 9.1. In comparison to the previous March 2016 NI 43-101 mineral resource estimate, the database includes an additional 52 exploration and resource drillholes (36,639.1 m). The positions of new drillhole collars for the 2017 mineral resource estimate and those available for the previous estimate are illustrated in Figure 9.1.
Table 9.1: Summary of Upper Zone drilling as at 24 April 2017*
Purpose | Drilling Type | Count | Total length (m) |
Condemnation | Diamond Drilling | 1 | 405.00 |
Exploration | 65 | 53,245.40 |
Geotechnical | 26 | 5,542.80 |
Metallurgical | 3 | 2,492.30 |
Monitoring well | 32 | 3,647.20 |
Resource | 48 | 32,126.70 |
Vibrating Wire Piezometer | 5 | 2,878.50 |
Total | 180 | 100,337.90 |
*Database statistics includes non-sampled hydrogeological, condemnation and geotechnical holes and excludes LZ and historic collars located away from the UZ deposit.
9.2.2 Collar Surveys
Since hole FMTC1210, all Upper Zone collars were surveyed using high precision GPS based on total station measurements, which give a high degree of confidence in terms of the XY and Z location. Data for some of the older holes (outside of the Čukaru Peki area), was obtained by hand-held GPS. This data was provided to SRK (UK) in digital format using Gauss-Krüger coordinate system grid coordinates.
| Various/RJM/PJD | Timok_PEA_NI43-101_Report_2CR021.006_20171130.docx | November 2017 |
| SRK Consulting | |
| Timok PEA NI 43-101 | Page 41 |
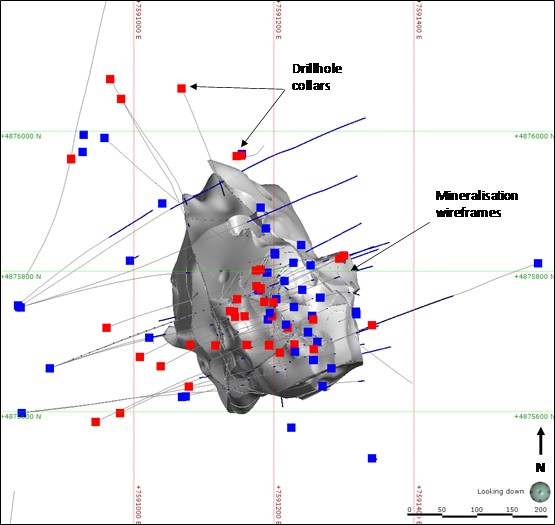
*In some cases, two or three drillholes have been completed from a single drill site.
Figure 9.1: Location of new collars (red) completed since March 2016 NI 43-101
9.2.3 Downhole Surveys
SRK was supplied with downhole survey information for the start and the end of each hole, with intermediate readings taken at intervals of up to 50 m. A range of tools was used, including a Reflex Gyro and Reflex EZ-Trac, Camteq Proshot Camera probe (CTPS200), north-seeking gyro and DeviTool Standard survey measurement. All azimuth readings are corrected to grid north in the database. In general, the data collected are considered to be of high precision and accuracy suitable for use in this resource estimation.
In order to compare the accuracy of the various systems, several holes, including TC150061, TC150067 and TC150064, were surveyed using both the DeviTool and Reflex Gyro or Camteq and north-seeking gyro tools. The results show that different tools in the same drillhole can provide pierce-point horizontal location errors at the top of the UZ deposit (some 450 m below surface) of 2 to 8 m.
| Various/RJM/PJD | Timok_PEA_NI43-101_Report_2CR021.006_20171130.docx | November 2017 |
| SRK Consulting | |
| Timok PEA NI 43-101 | Page 42 |
9.2.4 Hole Orientation
All drilling undertaken on the Upper Zone has been completed from surface intersecting the mineralized zone from the northeast, southwest and above. Drillholes are typically plotted on sections oriented north 65° east providing intersections spaced 25 to 100 m apart.
The dips for inclined holes range from -50 to -85º, with hole lengths typically ranging from 300 to 1000 m. In places, wedged daughter holes have been completed to maximise the information made available from a single drill site. It is SRK’s view that the drilling orientations are reasonable to model most of the geology and mineralization based on the current geological interpretation. An example of drilling coverage and orientation is shown in Figure 9.2, which also shows mineralization wireframes.
9.2.5 Diamond Drilling Procedure
The drilling was performed by contractors and managed by Rakita’s geological team and has been reviewed by SRK (UK) during several site visits. The drilling program to date has been completed by four drilling contractors: Drillex International, Geops Balkan Drilling Services Ltd, S&V Drilling Mine Services d.o.o and Geomag d.o.o.
All drilling was completed using diamond core, excluding one drillhole (FMTC1224), which had a reverse circulation pre-collar through the Miocene and Upper Cretaceous sedimentary rocks.
Diamond core drilling was performed with the use of a double tube with casing reducing from PQ to HQ and NQ rods at the appropriate depths.
Core was produced in three-metre core runs and then placed by hand into an open V-rail for measurement of recovered core length, before being transported to the drill site geologist who inspected the core and transferred it into numbered plastic core boxes. Cut plastic blocks were used to record core depths.
| Various/RJM/PJD | Timok_PEA_NI43-101_Report_2CR021.006_20171130.docx | November 2017 |
| SRK Consulting | |
| Timok PEA NI 43-101 | Page 43 |
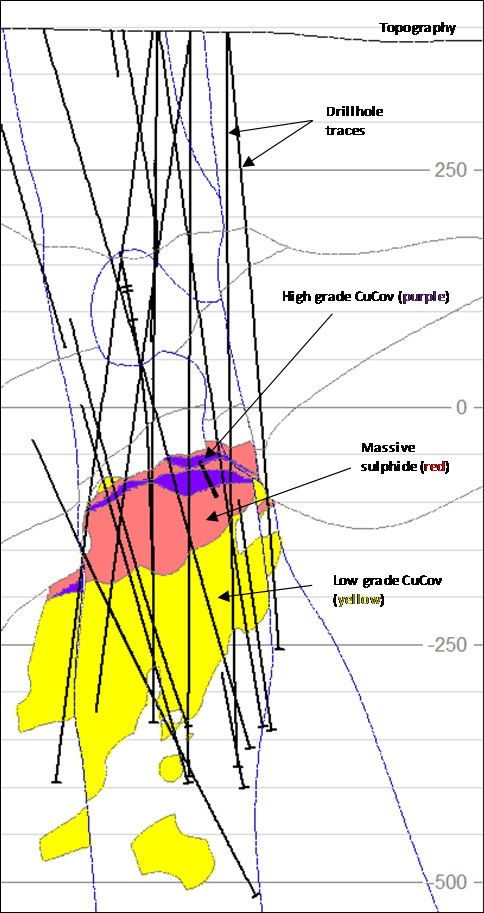
Figure 9.2: Example cross-section through the Timok deposit (25 m clipping width)
| Various/RJM/PJD | Timok_PEA_NI43-101_Report_2CR021.006_20171130.docx | November 2017 |
| SRK Consulting | |
| Timok PEA NI 43-101 | Page 44 |
9.2.6 Core Recovery
SRK (UK) reviewed the drill core recovery results and found that in general the recovery is good with an average recovery of 98.0% for the entire Upper Zone (Figure 9.3).
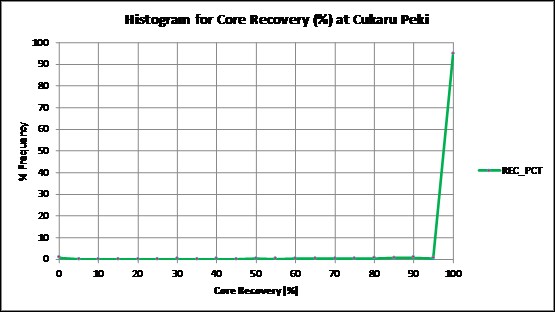
Figure 9.3: Core recovery for the Upper Zone
9.3 Core Storage
The core shed is located adjacent to the deposit. SRK (UK) visited the storage facility several times and found the facility to be organized and clean.
SRK (UK) notes the potential for oxidation of the massive sulphide mineralization and recommends that Rakita consider vacuum packing or nitrogen purging the relevant core in plastic covers and/or storage in a freezing container. Preservation of core quality may be required for future detailed re-logging and physio-chemical metallurgical tests.
9.4 SRK Comments
In the opinion of SRK, the sampling procedures used by Rakita conform to industry best practices and the resultant drilling pattern is sufficiently dense to interpret the geometry, boundaries and different styles of the copper and gold mineralization in the Upper Zone with a relatively high level of confidence within well-drilled areas. Confidence in the geological interpretation decreases in areas of reduced sample coverage.
| Various/RJM/PJD | Timok_PEA_NI43-101_Report_2CR021.006_20171130.docx | November 2017 |
| SRK Consulting | |
| Timok PEA NI 43-101 | Page 45 |
10 Sample Preparation, Analyses and Security
The following section relates to the methods and protocols used by Rakita during its exploration campaigns to date.
10.1 Diamond Drilling Sample Preparation and Chain of Custody
All drilling completed prior to 2016 was transported by truck to the core storage facility for logging procedures, including photography and geological and geotechnical logging. Since then, prior to transport to the storage facility, all core has been logged for recovery and Rock Quality Designation at the drill site. A Terraspec spectrometer was used to assist with mineral identification. Sampling intervals were marked using typically 1.0 to 1.5 m lengths and the core was subsequently split using a diamond core cutter.
Core is cut parallel to the core axis and the left half of core (when looking downhole) is selected for sampling, with the right half kept in storage for future reference. Sample numbers are subsequently assigned to sample intervals; this process is recorded using Microsoft Excel and then uploaded to Rakita’s AcQuire database. Allocated sample numbers are marked on the core tray.
All samples are placed in a calico bag labelled with the sample number. A sample ticket is also placed inside the bag. Samples are stored in a dry, dust free room until they are shipped to the sample preparation laboratory. The typical average weight of a core sample is approximately five kilograms.
10.2 Sample Preparation and Analysis
10.2.1 2011 to 2013 Drill Program
Prior to April 2012, sample preparation was carried out at the Balkan Exploration and Mining (BEM) laboratory in Belgrade. After this date, samples were sent for sample preparation to the Eurotest Control EAD Laboratory in Bulgaria (ETC Bulgaria). ETC was previously the laboratory of the Geological Survey of Bulgaria and then was privatised in 2000. Since September 2011, Rakita has new purpose-built premises that house in one building the entire laboratory and processing procedures as well as management and quality control. ETC Bulgaria has accreditation ISO 17025 for commercial analytical laboratories valid until 31 May 2016 and also ISO 9001 certification for their quality management system.
Sample preparation involved crushing to >95% passing -10 mesh (2 mm) using a jaw crusher prior to a 400-g split being taken and pulverized to better than 90% passing 140 mesh (140 µm) with an LM2 pulverising ring mill.
ETC Bulgaria analyzed the samples for gold by aqua regia digestion with atomic absorption spectrometry (AAS) finish until April 2013. After this date, samples were assayed for gold by fire assay with AAS finish (which showed improved accuracy), with high grade samples re-assayed using gravimetric finish. Copper, arsenic and multi-element analysis for 35 elements were assayed by aqua regia with inductively coupled plasma atomic emission spectroscopy (ICP-AES), with high grade copper (1 to 11%) re-assayed by AAS and very high-grade copper (>11%) re-assayed by ICP-AES using a 0.1 g aliquot.
| Various/RJM/PJD | Timok_PEA_NI43-101_Report_2CR021.006_20171130.docx | November 2017 |
| SRK Consulting | |
| Timok PEA NI 43-101 | Page 46 |
10.2.2 2014 to 2017 Drill Program
For drilling completed subsequent to 2013, samples were sent for sample preparation to the ALS laboratory located at Bor (ALS Bor) in Serbia. Sample preparation involved crushing to >80% passing -10 mesh (2 mm) prior to a 400-g split being taken and pulverized to >80% passing -200 mesh (-75 µm).
Samples were sent for analysis to the ALS Laboratories in Loughrea, Ireland (ALS Loughrea) and (for gold only, based on a 100-g split) in Rosia Montana, Romania (ALS Rosia Montana). After March 2015, all samples were sent to ALS Loughrea.
Gold was assayed for by fire assay with AAS or ICP-AES; high grade samples >3 g/t gold were re-assayed using gravimetric finish. Copper, arsenic and multi-element analysis for 35 elements were assayed for using aqua regia with ICP-AES or inductively coupled plasma mass spectrometry (ICP-MS). Samples with copper >1% were re-assayed by ICP-AES using a 0.5 g aliquot. After September 2015, the assay digest methodology for copper, arsenic and multi-element analysis was changed from aqua regia to four-acid digest with ICP-MS.
During the 2015 to 2017 sampling programs, multi-element analysis also included total sulphur and sulphur in sulphate. Total sulphur was assayed using a Leco Analyzer, whilst sulphur in sulphate used potassium hydroxide leach. Drillhole samples completed prior to 2015 were sent as pulp rejects to ALS Loughrea to achieve sulphur analysis for these earlier holes.
Both ALS Loughrea and ALS Rosia Montana are ISO 17025 accredited.
10.3 Bulk Density Data
A density determination was made generally on every three-metre run of drill core. This was completed by weighing a piece of core in air and then determining the core volume by displacement of water.
Core samples selected for density analysis had an average length of 15 cm. The weight of the dry sample was initially determined using bench mounted electronic scales, before being submerged in water and to measure the submerged weight. The following equation was then applied by Rakita to determine the dry density:
Density = weight (in air) / [ weight (in air) – weight (in water) ]
With the exception of the density sampling completed prior to drillhole TC150071, which has been excluded from the database (as described in Section 11.2.2), a total of 19,022 measurements were supplied by Rakita. The density samples were coded with the modelled geological and mineralization wireframes; the descriptive statistics for the mineralized domains are provided in Table 10.1.
| Various/RJM/PJD | Timok_PEA_NI43-101_Report_2CR021.006_20171130.docx | November 2017 |
| SRK Consulting | |
| Timok PEA NI 43-101 | Page 47 |
Table 10.1: Summary of density per mineralization domain
CZONE | No. Samples | Type | Mean | Min | Max |
101 | 292 | High grade (UHG) | 3.95 | 2.78 | 4.56 |
102 | 64 | High grade (UHG) | 3.63 | 2.40 | 4.49 |
103 | 1483 | Massive sulphide | 3.43 | 1.41 | 4.84 |
104 | 2585 | Low grade CuCov | 3.01 | 1.43 | 4.83 |
202 | 9 | High grade | 3.82 | 3.12 | 4.25 |
203 | 37 | Massive sulphide | 3.13 | 2.52 | 4.07 |
204 | 365 | Low grade CuCov | 2.83 | 2.01 | 3.44 |
303 | 36 | Massive sulphide | 3.17 | 2.36 | 4.20 |
304 | 126 | Low grade CuCov | 2.84 | 2.24 | 4.21 |
Figure 10.1 shows the relationship between total sulphur (sulphur %) and density for samples within each of the major modelled mineralization domains – ultra high grade (UHG), massive sulphide and low grade covellite. The graphs show that density and sulphur grade show a reasonable correlation. Based on the relationship between sulphur grade and density, the regression formula shown on each graph was used to calculate the dry density for each block in the block model based on its sulphur grades.
SRK notes that Rakita has not modified this approach for porous, weathered or vuggy samples.
In SRK’s opinion, best practice for such samples would be to coat with wax or wrap with PVC film prior to immersion in water. While such samples are uncommon for the Project, SRK is satisfied that the method used is appropriate for the majority of samples.
10.3.1 SRK Comments
In SRK’s opinion, the sampling preparation, security and analytical procedures used by Rakita are consistent with generally accepted industry standard practices and are therefore adequate for the purpose of this resource estimate.
| Various/RJM/PJD | Timok_PEA_NI43-101_Report_2CR021.006_20171130.docx | November 2017 |
| SRK Consulting | |
| Timok PEA NI 43-101 | Page 48 |
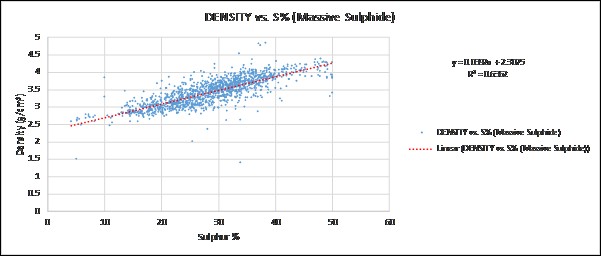
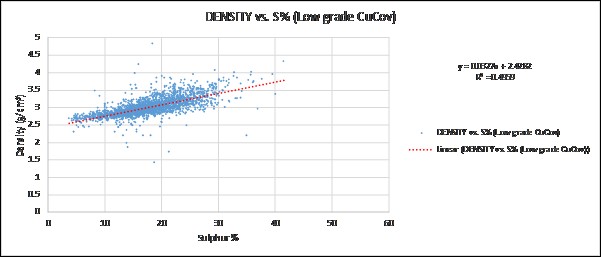
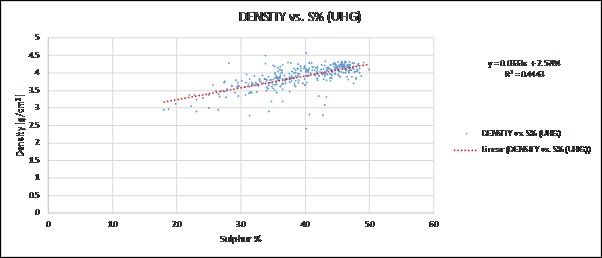
Source: SRK (UK), 2017
Figure 10.1: Density regression plots for UHG (top), massive sulphide (middle) and low grade CuCov (bottom) domains
| Various/RJM/PJD | Timok_PEA_NI43-101_Report_2CR021.006_20171130.docx | November 2017 |
| SRK Consulting | |
| Timok PEA NI 43-101 | Page 49 |
11 Data Verification
11.1 Verifications by Rakita
Rakita completed routine data verification as part of the on-going exploration program. Checks included validation for all tabulated data, including collar and down-hole survey, sampling information, assay and lithology interval data, with validation of sample results from the latest phase of drilling using standards, blanks and duplicate samples inserted routinely into each batch submitted to the laboratory and check assays completed at an umpire laboratory.
11.1.1 QAQC for Copper, Gold and Arsenic 2011 to 2017
A routine quality assurance / quality control (QAQC) program was implemented by Rakita to monitor the ongoing quality of the analytical database. The QAQC system included the submission of blank, standard and duplicate samples in every batch of samples, QAQC samples account for approximately 15% of total laboratory submissions.
During the previous March 2015 model update, SRK (UK) noted a slight bias (on average 5%) towards higher grade in the gold certified reference material (CRM) data from ETC Bulgaria (2011 to 2013 drilling campaigns), representing some 38% of the (March 2015) sample database inside the mineralization wireframes. Despite this, the samples were used in the mineral resource estimate, with visual and statistical support provided by the sampling at ALS Loughrea, which was considered at the time to sufficiently smooth over this anomaly.
Since then, Rakita has re-assayed the gold data from ETC Bulgaria at ALS Loughrea, where CRM performance for gold shows a relatively good level of accuracy (as described below), therefore removing this slight bias from the assay results for gold.
Standards
Since the start of the drilling at Timok, Rakita has introduced 16 different standards into the analysis sample stream. These were sourced from CDN Resource Laboratories Ltd, Canada, Ore Research & Exploration Pty. Ltd., Australia, and Mineral Exploration Geochemistry, Nevada.
Eight of the standards have been developed based on material sourced from Čukaru Peki (namely the FR, FTK and RAK series standards), with certified limits determined based on external round-robin analysis and historical performance at ETC and ALS when results are within reasonable tolerance (typically 2 to 7%) of the initial round-robin results (Jacks, 2015). The certified values per standard for copper, gold and arsenic are shown in Table 11.1.
SRK (UK) has reviewed the standard results for copper, gold and arsenic and is satisfied in general that (with the exception of a limited number of anomalies and the four-acid digest results for arsenic) they demonstrate a reasonable degree of accuracy at the assaying laboratory. The summary results of the CRM submissions used in the QAQC program to date are illustrated in Figure 11.1 to Figure 11.4. With regards to arsenic, the change in assay methodology from aqua regia to four-acid resulted in the slight under-reporting of higher grades. SRK (UK)’s analysis and rectifying of this issue for arsenic is described in Section 11.2.3.
| Various/RJM/PJD | Timok_PEA_NI43-101_Report_2CR021.006_20171130.docx | November 2017 |
| SRK Consulting | |
| Timok PEA NI 43-101 | Page 50 |
Table 11.1: Summary of certified reference material for copper, gold and arsenic submitted by Rakita in sample submissions
Standard Material | Copper Grade results (ppm) |
Certified Value | SD | Company | Certification Type |
FTK13001 | 117,300.00 | 5,000.0 | CDN Mineral Laboratories | Historical average from ALS and ETC Analysis (2013 to 2015), J. Jacks |
RAK-1 | 3,480.00 | 90.0 | CDN Mineral Laboratories | Smee & Associates Consulting Ltd; External certification |
RAK-2 | 8,110.00 | 170.0 | CDN Mineral Laboratories | Smee & Associates Consulting Ltd; External certification |
RAK-3 | 23,900.00 | 500.0 | CDN Mineral Laboratories | Smee & Associates Consulting Ltd; External certification |
RAK-4 | 72,100.00 | 1,850.0 | CDN Mineral Laboratories | Smee & Associates Consulting Ltd; External certification |
RAK-5 | 138,400.00 | 3,100.0 | CDN Mineral Laboratories | Smee & Associates Consulting Ltd; External certification |
OREAS 501 | 2,670.00 | 70.0 | ORE Research & Exploration Pty Ltd | External certification |
OREAS 502 | 7,430.00 | 200.0 | ORE Research & Exploration Pty Ltd | External certification |
OREAS 502b | 7,731.45 | 232.1 | ORE Research & Exploration Pty Ltd | External certification |
OREAS 503 | 5,630.00 | 130.0 | ORE Research & Exploration Pty Ltd | External certification |
OREAS 504 | 11,230.00 | 190.0 | ORE Research & Exploration Pty Ltd | External certification |
OREAS 504b | 11,009.48 | 222.4 | ORE Research & Exploration Pty Ltd | External certification |
FR12001X | 19,100.00 | 1,120.0 | Shea Clark Smith / MEG Labs | Historical average from ALS and ETC Analysis (2013 to 2015), J. Jacks |
FR12002X | 9,105.00 | 932.0 | Shea Clark Smith / MEG Labs | Historical average from ALS and ETC Analysis (2013 to 2015), J. Jacks |
S108004X | 215.00 | 19.0 | Shea Clark Smith / MEG Labs | External certification |
S108005X | 4,139.00 | 340.0 | Shea Clark Smith / MEG Labs | External certification |
Standard Material | Gold Grade results (ppm) |
Certified Value | SD | Company | Certification Type |
FTK13001 | 7.50 | 0.38 | CDN Mineral Laboratories | Historical average from ALS and ETC Analysis (2013 to 2015), J. Jacks |
RAK-1 | 0.25 | 0.01 | CDN Mineral Laboratories | Smee & Associates Consulting Ltd; External Certification |
RAK-2 | 0.42 | 0.01 | CDN Mineral Laboratories | Smee & Associates Consulting Ltd; External Certification |
RAK-3 | 1.32 | 0.04 | CDN Mineral Laboratories | Smee & Associates Consulting Ltd; External Certification |
RAK-4 | 3.29 | 0.06 | CDN Mineral Laboratories | Smee & Associates Consulting Ltd; External Certification |
RAK-5 | 9.60 | 0.21 | CDN Mineral Laboratories | Smee & Associates Consulting Ltd; External Certification |
OREAS 501 | 0.19 | 0.02 | ORE Research & Exploration Pty Ltd | External certification |
OREAS 502 | 0.46 | 0.03 | ORE Research & Exploration Pty Ltd | External certification |
OREAS 502b | 0.49 | 0.02 | ORE Research & Exploration Pty Ltd | External certification |
OREAS 504b | 1.61 | 0.04 | ORE Research & Exploration Pty Ltd | External certification |
FR12001X | 0.52 | 0.04 | Shea Clark Smith / MEG Labs | Historical average from ALS and ETC Analysis (2013 to 2015), J. Jacks |
FR12002X | 0.37 | 0.04 | Shea Clark Smith / MEG Labs | Historical average from ALS and ETC Analysis (2013 to 2015), J. Jacks |
Standard Material | Arsenic Grade results (ppm) |
Certified Value | SD | Company | Certification Type |
RAK-1 | 175.00 | 6.50 | CDN Mineral Laboratories | Smee & Associates Consulting Ltd; External Certification |
RAK-2 | 253.00 | 8.50 | CDN Mineral Laboratories | Smee & Associates Consulting Ltd; External Certification |
RAK-3 | 2,209.00 | 97.00 | CDN Mineral Laboratories | Smee & Associates Consulting Ltd; External Certification |
RAK-4 | 5,444.00 | 451.50 | CDN Mineral Laboratories | Smee & Associates Consulting Ltd; Provisional External Certification |
RAK-5 | 2,440.00 | 199.50 | CDN Mineral Laboratories | Smee & Associates Consulting Ltd; Provisional External Certification |
FTK13001 | 2,065.00 | 140.00 | CDN Mineral Laboratories | Historical average from ALS and ETC Analysis (2013 to 2015), J. Jacks |
OREAS 501 | 17.00 | 1.00 | ORE Research & Exploration Pty Ltd | Indicative |
OREAS 502 | 19.50 | - | ORE Research & Exploration Pty Ltd | Indicative |
OREAS 502b | 19.08 | 3.26 | ORE Research & Exploration Pty Ltd | External certification |
OREAS 503 | 18.00 | 1.00 | ORE Research & Exploration Pty Ltd | Indicative |
OREAS 504 | 5.50 | 1.25 | ORE Research & Exploration Pty Ltd | Indicative |
OREAS 504b | 9.86 | 0.91 | ORE Research & Exploration Pty Ltd | External certification |
S108005X | 352.00 | 4.50 | Shea Clark Smith / MEG Labs | No indicative or certified value (average from sample data) |
FR12001X | 1,469.00 | 70.00 | Shea Clark Smith / MEG Labs | Historical average from ALS and ETC Analysis (2013 to 2015), J. Jacks |
FR12002X | 991.00 | 58.00 | Shea Clark Smith / MEG Labs | Historical average from ALS and ETC Analysis (2013 to 2015), J. Jacks |
| Various/RJM/PJD | Timok_PEA_NI43-101_Report_2CR021.006_20171130.docx | November 2017 |
| SRK Consulting | |
| Timok PEA NI 43-101 | Page 51 |
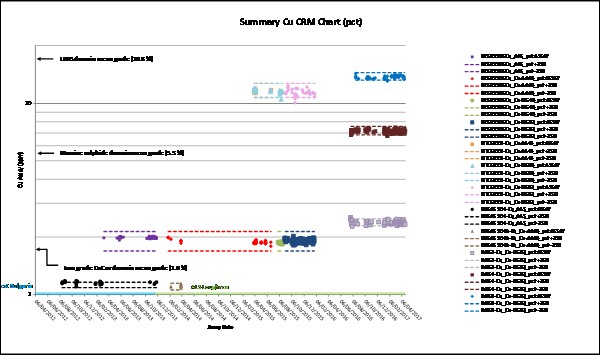
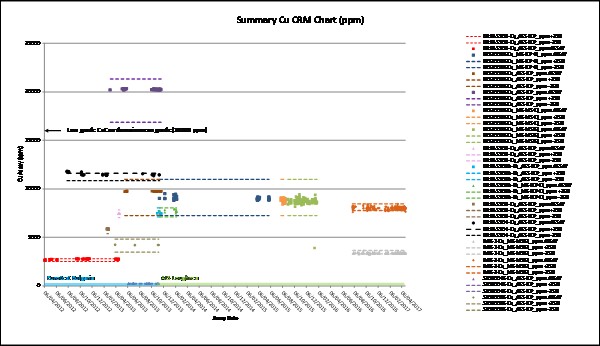
Source: SRK (UK), 2017
Figure 11.1: QAQC standard summary charts for copper from submission of Čukaru Peki samples
| Various/RJM/PJD | Timok_PEA_NI43-101_Report_2CR021.006_20171130.docx | November 2017 |
| SRK Consulting | |
| Timok PEA NI 43-101 | Page 52 |

Source: SRK (UK), 2017
Figure 11.2: QAQC standard summary charts for gold from submission of Čukaru Peki samples
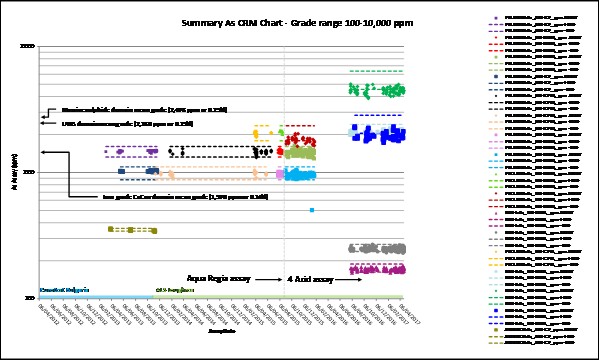
Source: SRK (UK), 2017
Figure 11.3: QAQC standard summary charts for arsenic from submission of Čukaru Peki samples; grade range 100 ppm to 10,000 ppm
| Various/RJM/PJD | Timok_PEA_NI43-101_Report_2CR021.006_20171130.docx | November 2017 |
| SRK Consulting | |
| Timok PEA NI 43-101 | Page 53 |
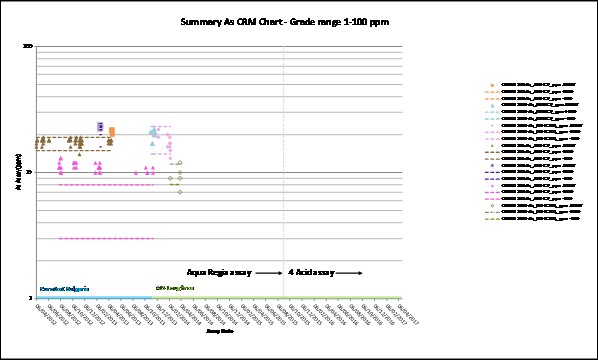
Source: SRK (UK), 2017
Figure 11.4: QAQC standard summary charts for arsenic from submission of Čukaru Peki samples; grade range 1 ppm to 100 ppm*
*Standards OREAS504 and OREAS503 have mean values that are close to the lower analytical detection limit and are not certified for arsenic. Therefore, the observed consistent high-reporting of these standards is not considered a significant issue.
SRK (UK) notes that whilst the initial drilling programs (2011 to 2013) were largely supported by relatively low-grade standard material (with mostly provisional results for arsenic), Rakita introduced a number of higher-grade certified standards (FTK13001, RAK-4 and RAK-5) for the more recent infill drilling (2014 to 2017) which are closer to average deposit grades. Furthermore, QAQC completed during 2016 to 2017 is mostly limited to the RAK series standards, which represent the higher-grade range of the Rakita’s suite of standard material (0.4-13.8 % Cu, 0.3‑9.6 g/t Au and 0.02-0.54 % As).
The results for copper from ETC Bulgaria during early drilling campaigns (2011 to 2013) had a slight bias toward higher grade (on average +3% relative for copper). Results from standard sample submissions to ALS Loughrea have good analytical accuracy for copper and gold with average mean versus assigned grade per certified standard within 1% relative for copper and 0.5% for gold. SRK considers that the more recent samples assayed by ALS Loughrea, which comprise some 85% of the sample database inside mineralization wireframes, sufficiently moderate the 3% bias shown in the copper results from ETC Bulgaria.
For arsenic, with the exception of a small number of anomalous results in the near detection limit (very low grade) standard results from ETC Bulgaria, the results from the certified standards using aqua regia digest and corrected four-acid digest (as described in Section 11.2.3), in general are considered by SRK to have good accuracy.
| Various/RJM/PJD | Timok_PEA_NI43-101_Report_2CR021.006_20171130.docx | November 2017 |
| SRK Consulting | |
| Timok PEA NI 43-101 | Page 54 |
Blanks
Coarse quartz material sourced from a local sandstone quarry (located some 20 km from Bor) was included as a blank in the sample stream prior to sample preparation. Blank samples were inserted at a rate of approximately 3%.
SRK has reviewed the results from the blank sample analysis and has determined that in general there is little evidence for sample contamination at the preparation facility.
Duplicates
Three types of sample duplicate were inserted into the routine sample stream, namely field duplicates (quarter core “sample duplicates”), coarse duplicates (“crush duplicates”) and pulp duplicates. Duplicate samples were inserted at a rate of approximately 8%.
The coarse and pulp duplicate assays for copper, gold and arsenic show a good correlation to the original assays, with a correlation coefficient typically in excess of 0.98, whilst field duplicates display a weaker correlation as typically expected, with a coefficient varying between 0.8 and 1.0. The elevated scatter in the mean grades for the field duplicates is considered to be a reflection of the geological variability and (resultant) inhomogeneous distribution of the mineralization in the drill core.
11.1.2 Verifications by Umpire Laboratory
During March 2017, Rakita sent 728 sample splits from original pulp samples from the 2015 to 2016 drilling programs to the Bureau Veritas Minerals (BVM) Laboratory in Vancouver, Canada for check analysis of the primary copper, gold and arsenic results from ALS Loughrea.
In general, the BVM Vancouver results for copper and gold were closely correlated to the ALS Loughrea assays, with correlation coefficients typically in excess of 0.98, with check assay charts for copper, gold and arsenic presented in Figure 11.5.
Analysis for arsenic however showed a relatively poor correlation, with a correlation coefficient of 0.57. There was a low bias at BVM Vancouver (20 to 40% relative) compared to Rakita’s standards submissions. Whilst the four-acid digest methodology was used at both laboratories, based on discussions with BVM Vancouver, Rakita and its external geochemical consultant consider the poor correlation between sample results to be due to BVM Vancouver taking the digestion to total (rather than ‘near’) dryness which results in increased volatilisation of arsenic from the sample, hence introducing variability to the results.
In summary, the check assay work completed suggests that BVM Vancouver validates the analytical results for copper and gold from ALS Loughrea; however, limited only conclusions can be drawn from the arsenic check assays completed using four-acid (total dryness).
| Various/RJM/PJD | Timok_PEA_NI43-101_Report_2CR021.006_20171130.docx | November 2017 |
| SRK Consulting | |
| Timok PEA NI 43-101 | Page 55 |
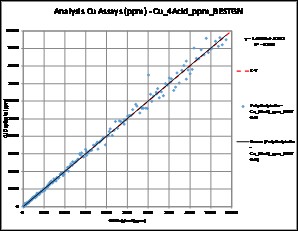

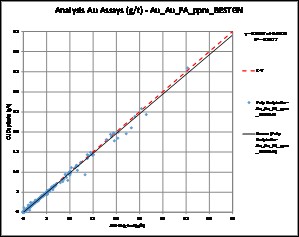
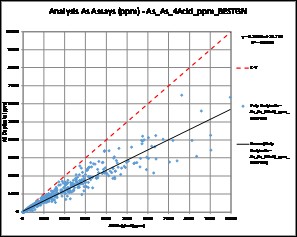
Note: Copper (top), gold (bottom left) and arsenic (bottom right); Original = ALS Loughrea, Duplicate = BVM Vancouver
Figure 11.5: Umpire laboratory results
11.2 Verifications by SRK
In accordance with NI 43-101 guidelines, SRK has completed several visits to the Project, including:
• Martin Pittuck (QP for the Mineral Resource) - 11 and 12 September 2013;
• Paul Stenhouse (Structural Geologist) from SRK - 21 and 23 October 2013;
• Martin Pittuck, Paul Stenhouse, joint venture technical review - 12 and 14 May 2015;
• Paul Stenhouse, confirmatory logging - October 2015 and September 2016; and
• Martin Pittuck, Robert Goddard Mineral Resource data technical review - September 2015, July 2016 and March 2017.
The site visits allowed SRK to review exploration procedures, define geological modelling procedures, examine drill core, inspect the site, interview project personnel and collect relevant information.
Overall, in SRK’s opinion, the data supplied is adequate for the purposes described in this report.
| Various/RJM/PJD | Timok_PEA_NI43-101_Report_2CR021.006_20171130.docx | November 2017 |
| SRK Consulting | |
| Timok PEA NI 43-101 | Page 56 |
11.2.1 Verification of Sample Database
SRK completed a phase of data validation on the digital sample database supplied by Rakita, which included the following:
• Search for sample overlaps, duplicate or absent samples, anomalous assay and survey results. No material issues were noted in the final sample database.
• Search for non-sampled drillhole intervals within the mineralised zones. SRK noted that some 4% of the sample database by length within the mineralised zones was not sampled. However, given that these non-sampled intervals relate mainly to superseded twin holes or metallurgical holes; they were then subsequently ignored during the calculation of composites that were eventually used for the grade estimation process. For the non-sampled metallurgical holes, the geology was used as a guide for geological modelling.
If possible, SRK (UK) recommends taking quarter core samples for resource modelling from metallurgical drillhole TC150101 given its central location within the UZ deposit.
11.2.2 Density Data Validation
During ongoing verification of the earlier drilling campaigns, Rakita noted an error in the recording of the sample weights used to calculate sample density which affected drillholes completed prior to TC150071, which account for some 30% of the density data inside the mineralization wireframes. The error resulted (on average) in a 6% under-reporting of density for the affected samples. Given the uncertainty in the quality of the density determinations prior to drillhole TC150071 and that the affected data is interspersed with correctly sampled density data, SRK (UK) has excluded the density data from drillholes completed prior to TC150071 from the estimation database.
11.2.3 Arsenic Grade Validation
In completing an updated assessment of QAQC CRM results (as presented in Section 11.1.1), SRK (UK) noted an issue with some of the arsenic analyses. Prior to September 2015, when the arsenic assay method used aqua regia sample digestion, CRM results were acceptable but more recent results based on a four-acid digest method (intended to increase accuracy for copper) were under-reporting particularly for higher grades, as illustrated for the FR12 series and (more notably) the high-grade arsenic CRMs FTK13001, RAK3 and RAK5 in Figure 11.6 below; this affected some 70% of the data in the mineralised domains.
| Various/RJM/PJD | Timok_PEA_NI43-101_Report_2CR021.006_20171130.docx | November 2017 |
| SRK Consulting | |
| Timok PEA NI 43-101 | Page 57 |
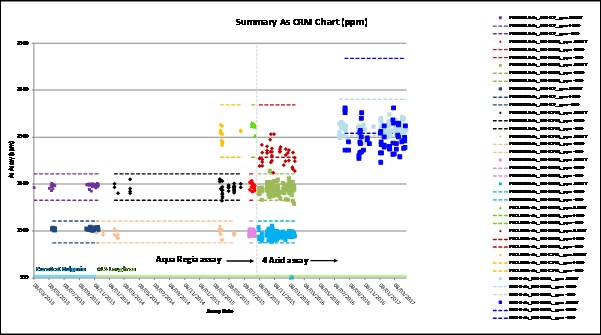
Figure 11.6: Arsenic CRM results illustrating the change from aqua regia to four-acid digest
Based on the CRM results, the difference appeared to range from 2% to 20% (relative). SRK (UK) and Rakita understand that this happens due to volatilisation of arsenic in the stronger acid digest, resulting in a systematic error.
To further review and fix the bias, Rakita undertook a dedicated re-assay program to get a regression formula to describe the relationship between four-acid and aqua regia digest assays. A total of 102 pulp samples with 12 CRM’s that had been assayed using four-acid digest (and a small number of blanks and duplicate samples) were submitted to ALS Loughrea for check assay using aqua regia digest.
The results were plotted on a scatter chart (Figure 11.7) using averaged data in 1000 ppm bins to remove scatter and better assess bias. A trend line was plotted on the chart to cover the range of arsenic grades representative of the sample composites in the UZ, namely 0 to 20,000 ppm. One sample that returned less than analytical detection was excluded from the analysis.
| Various/RJM/PJD | Timok_PEA_NI43-101_Report_2CR021.006_20171130.docx | November 2017 |
| SRK Consulting | |
| Timok PEA NI 43-101 | Page 58 |
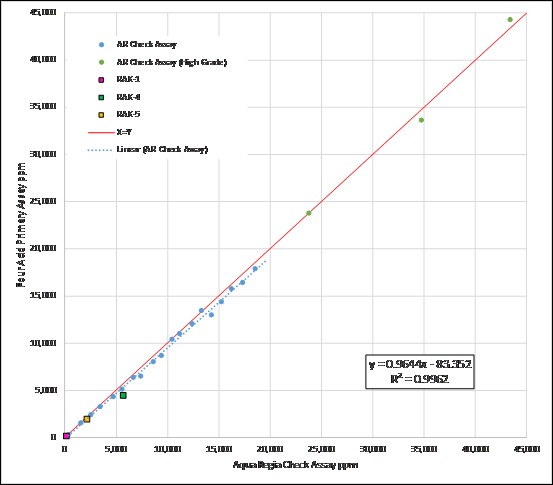
Figure 11.7: Scatter plot for Arsenic ppm samples analyzed by four-acid and aqua regia
The results of the check assay suggest that whist the bias does not appear to be as significant as originally suggested by the CRM results, there is relatively 4% more arsenic when using aqua regia compared with four-acid assays. SRK (UK) therefore applied a regression formula to the four-acid sample data (as outlined below) in the assay database, based on the relationship from the graph shown in Figure 11.7.
As ppm Corrected = [As ppm from four-acid + 83.4] / 0.96
11.3 SRK Comments
SRK has reviewed the data collection methodologies during several site visits and has undertaken an extensive review of the assay and geology database during the mineral resource estimation procedure.
With the exception of arsenic, for which there were issues associated with four-acid digest identified and rectified, assessment of the available QAQC data indicates the assay data for the drilling and sampling to date is appropriately accurate and precise.
With regards to arsenic analysis, given the tendency in the four-acid data for under-reporting particularly for higher grades and the sensitivity of the results to four-acid digest protocol (as illustrated by the check analysis at BVM Vancouver), SRK recommends using aqua regia for analytical digest during all future drilling campaigns. SRK also recommends further investigation into the significant (circa 20%) variance shown for arsenic in CRM RAK4 and RAK5, possibly by additional round-robin analysis and mineralogical study to determine whether arsenic in these Čukaru Peki-derived CRMs are more likely to undergo volatilization compared with more typical material from the deposit.
| Various/RJM/PJD | Timok_PEA_NI43-101_Report_2CR021.006_20171130.docx | November 2017 |
| SRK Consulting | |
| Timok PEA NI 43-101 | Page 59 |
In addition, SRK recommends sourcing an additional certified standard whose copper and gold grade covers the top-end of the higher range (1 g/t Au to 15 g/t Au and 2% Cu to 18% Cu) to further add to the confidence in laboratory accuracy for samples in the high grade (UHG) domain of the UZ deposit.
The QAQC CRMs used between 2011 and 2014 were limited to relatively low-grade values. In the UHG domain, these represent 27% of the samples and they are well supported by and have a similar grade distribution to the 73% of the data in the domain for which QAQC included high grade CRMs (i.e. Cu > 10% and As > 2,000 ppm). Despite this, SRK has a high overall confidence in the block tonnage and grade estimates in the well-drilled parts of the UHG and other domains, sufficient for measured mineral resources; but for completeness, SRK recommends selecting 5% to 10% of the 2011 to 2014 sample pulps from the UHG domain and re-submitting these with the current QAQC standards to provide a retrospective validation of the arsenic and high-grade copper assays reported at that time.
| Various/RJM/PJD | Timok_PEA_NI43-101_Report_2CR021.006_20171130.docx | November 2017 |
| SRK Consulting | |
| Timok PEA NI 43-101 | Page 60 |
12 Mineral Processing and Metallurgical Testing
12.1 Sample Description
Samples for metallurgical test work were obtained from successive rounds of drilling as the project was developed. An overview of the samples is presented in Figure 12.1 which shows a section through the deposit and identifies the metallurgical sample locations.

Source: SRK, 2017
Figure 12.1: Metallurgical sample locations
12.1.1 2016 PEA Samples
For the 2016 PEA, Reservoir Minerals prepared seven composite samples to represent the major sulphide mineralogies and zones within the deposit, as understood at that time.
Five composite samples representing the Upper Zone (Čukaru Peki) massive and semi-massive sulphide copper mineralization were prepared from intercepts selected from five diamond drillholes at depths ranging from 446 to 640 m. Two additional composite samples representing the Lower Zone porphyry mineralization were also prepared.
The samples and test results are described in the SGS report (SGS, 2016).
12.1.2 Flotation Optimization Composite Samples
To build on the 2016 PEA metallurgical program, a flowsheet optimization program was conducted at SGS to improve and characterize mineral responses under varying test conditions. Quantities of concentrates were also required for evaluating potential treatment methods for the copper concentrate for arsenic removal and for gold recovery from the pyrite concentrate.
| Various/RJM/PJD | Timok_PEA_NI43-101_Report_2CR021.006_20171130.docx | November 2017 |
| SRK Consulting | |
| Timok PEA NI 43-101 | Page 61 |
For scheduling reasons, and to ensure sufficient quantity of sample was on hand to support the test programs, the relevant 2016 PEA composites were combined to produce two master composites. The first Master Composite (MC) sample was prepared by blending equal weights (60 kg each) of Composites 2, 3, 4 and 5 from the 2016 PEA program (SGS 2017a).
Subsequently, when additional material was required to produce copper concentrates for further work, a second composite MC1, was produced by blending the balance of the 2016 PEA composites with unused MC samples from the optimization program. Head analyses of these composites are presented in Table 12.1.
Table 12.1: Composites used in optimization tests
Composite Sample | Cu, % | As, % | Au, g/t | Stot, % | Cu/As |
MC – Master Composite | 4.15 | 0.30 | 2.88 | 22.6 | 13.8 |
MC1 – Master Composite 1 | 3.86 | 0.29 | 2.78 | 22.6 | 13.3 |
12.1.3 Comminution and Variability Samples
Two “metallurgical holes”, TC150101 and TC160124, were drilled to provide samples for comminution and flotation variability tests. The holes were located close to the initial holes that provided the 2016 PEA composites. Both holes were shipped to SGS.
Hole TC150101 was divided into test samples by depth through the entire mineralized zone (SGS 2017b).
Hole TC160124 is held in storage at SGS for additional work during the next stage of the project.
12.1.4 Variability Samples - Sub-Level Caving Modelling
To model the latest mine plan, samples from drillhole TC150108 are being used in tests that model the SLC mining method. The mining method is characterized by:
• Dilution by waste derived from above the mining zone (25% dilution in Year 1, 15% in subsequent years)
• Mixing of mineable resource from upper zones into current mine production. For simplicity, this has been approximated by blending 50% “current” mineable resource with 25% mineable resource from each of the two previous production periods, prior to dilution with waste.
Samples Var 21 through Var 33 were prepared by combining crushed one-metre sample intervals over successive 20-m lengths through the mineralized zone, see Table 12.2.
| Various/RJM/PJD | Timok_PEA_NI43-101_Report_2CR021.006_20171130.docx | November 2017 |
| SRK Consulting | |
| Timok PEA NI 43-101 | Page 62 |
Table 12.2: Samples Var 21 to Var 35
Sample No | TC150108 | Mine RL | Length of Intercept | Sample Wt, (kg) | Analysis of Test Samples |
from | to | from | to | Cu, % | Au, g/t | As, % | S=, % |
Var 21 | 434 | 455 | -39 | -60 | 21 | 41 | 11.800 | 9.14 | 0.050 | 27.60 |
Var 22 | 455 | 475 | -60 | -80 | 20 | 37 | 12.500 | 5.79 | 0.160 | 27.00 |
Var 23 | 475 | 495 | -80 | -100 | 20 | 43 | 3.930 | 3.97 | 0.320 | 36.70 |
Var 24 | 495 | 515 | -100 | -120 | 20 | 39 | 3.100 | 2.92 | 0.280 | 30.10 |
Var 25 | 515 | 535 | -120 | -140 | 20 | 40 | 4.220 | 2.67 | 0.350 | 24.50 |
Var 26 | 535 | 555 | -140 | -160 | 20 | 41 | 4.220 | 3.07 | 0.210 | 22.60 |
Var 27 | 555 | 575 | -160 | -180 | 20 | 41 | 1.690 | 1.82 | 0.120 | 17.50 |
Var 28 | 575 | 595 | -180 | -200 | 20 | 39 | 1.840 | 1.40 | 0.120 | 17.90 |
Var 29 | 595 | 615 | -200 | -220 | 20 | 40 | 1.420 | 1.09 | 0.270 | 15.20 |
Var 30 | 615 | 635 | -220 | -240 | 20 | 39 | 2.090 | 1.16 | 0.250 | 17.40 |
Var 31 | 635 | 655 | -240 | -260 | 20 | 38 | 1.950 | 1.02 | 0.180 | 14.60 |
Var 32 | 655 | 675 | -260 | -280 | 20 | 38 | 1.760 | 0.87 | 0.110 | 12.50 |
Var 33 | 675 | 695 | -280 | -300 | 20 | 38 | 1.620 | 0.62 | 0.040 | 11.90 |
Var 34 | 374 | 404 | 21 | -9 | 30 | na | 0.028 | < 0.02 | < 0.001 | 0.37 |
Var 35 | 404 | 434 | -9 | -39 | 30 | na | 0.016 | < 0.02 | < 0.001 | 0.64 |
Waste material extending for 60 m directly above the deposit was combined into two 30-m lengths representing marl (Var 34) and upper andesite (Var 35). The variability samples were then blended, split, and combined into yearly blends representing annual mine production, as shown in Table 12.3.
Table 12.3: Blending procedure for yearly blends
Yearly Blend Sample Preparation (kg) |
Sample | Year 1 | Year 2 | Year 3 | Year 4 | Year 5 | Year 6 | Year 7 | Year 8 |
Var 21 | 8 | 7.0 | - | - | - | - | - | - |
Var 22 | 8 | 5.0 | 6.0 | - | - | - | - | - |
Var 23 | 8 | 5.0 | 6.0 | - | - | - | - | - |
Var 24 | - | 5.0 | 4.0 | 6.0 | - | - | - | - |
Var 25 | - | 5.0 | 4.0 | 6.0 | - | - | - | - |
Var 26 | - | - | 4.0 | 5.0 | - | - | - | - |
Var 27 | - | - | 4.0 | 5.0 | 7.0 | - | - | - |
Var 28 | - | - | - | 5.0 | 7.0 | 7.0 | - | - |
Var 29 | - | - | - | - | 7.0 | 7.0 | 7.0 | 7.0 |
Var 30 | - | - | - | - | 6.0 | 7.0 | 7.0 | 7.0 |
Var 31 | - | - | - | - | - | 6.0 | 7.0 | 4.0 |
Var 32 | - | - | - | - | - | - | 6.0 | 4.0 |
Var 33 | - | - | - | - | - | - | - | 4.0 |
Var 34 | 4 | 2.5 | 2.5 | 2.5 | 2.5 | 2.5 | 2.5 | 2.5 |
Var 35 | 4 | 2.5 | 2.5 | 2.5 | 2.5 | 2.5 | 2.5 | 2.5 |
Total wt | 32.0 | 32.0 | 33.0 | 32.0 | 32.0 | 32.0 | 32.0 | 31.0 |
Head analyses of the Year 1 blend through Year 8 blend are shown in Table 12.4.
| Various/RJM/PJD | Timok_PEA_NI43-101_Report_2CR021.006_20171130.docx | November 2017 |
| SRK Consulting | |
| Timok PEA NI 43-101 | Page 63 |
Table 12.4: Yearly blends
Sample | Analysis of Yearly Blend Samples |
Au, g/t | Cu, % | As, % | S=, % |
Year 1 | 4.70 | 6.98 | 0.130 | 22.40 |
Year 2 | 4.33 | 6.27 | 0.190 | 23.80 |
Year 3 | 3.02 | 4.58 | 0.200 | 22.50 |
Year 4 | 1.97 | 2.54 | 0.180 | 18.40 |
Year 5 | 0.94 | 1.47 | 0.150 | 13.90 |
Year 6 | 0.96 | 1.49 | 0.170 | 13.10 |
Year 7 | 0.80 | 1.57 | 0.170 | 12.00 |
Year 8 | 0.78 | 1.46 | 0.150 | 11.70 |
Year 1 Waste | < 0.02 | < 0.01 | < 0.001 | 0.39 |
Year 2-8 Waste | < 0.02 | 0.01 | < 0.001 | 0.43 |
12.1.5 Other Samples
Freeport McMoRan
Additional metallurgical samples were also available from drilling conducted by Freeport-McMoRan when they were joint venture partners in the Timok project with the previous owners, Reservoir Minerals. The remaining Freeport samples, 2632 kg, were shipped to SGS Lakefield. However, the samples were not considered suitable for optimization test work as they had all been previously crushed to -10 mesh (-1.70 mm) and their storage history was unknown, leading to a risk of partial oxidation. It was considered that the samples could be suitable for generating the large weights of concentrates required for downstream testing.
The Freeport samples were composited into level composites, and a 150-kg sample of TM600 was used to produce samples of complex copper concentrate for pyrometallurgical testing by Outotec.
MMI Program
A second variability test program is currently being conducted by the Institute for Mining and Metallurgy (MMI) in Bor, Serbia. This program involves a total of 50 samples, 10 from each of five diamond drillholes. The selected holes were chosen because they are outside the areas previously sampled for metallurgical work.
Samples were selected in continuous runs to cover the range of copper grades from approximately 1% to 10%. No attempt was made to adjust the levels of gold, arsenic or sulphur in the selected samples.
The initial tests at MMI were aimed at gaining familiarity with the standard flowsheet and conditions developed in the optimization program at SGS Lakefield. For this work, MMI prepared a general composite similar to the MC composite tested by SGS.
12.2 Mineralogy
The following mineralogical studies were completed and are reported in SGS reports (SGS, 2017a and 2017b).
| Various/RJM/PJD | Timok_PEA_NI43-101_Report_2CR021.006_20171130.docx | November 2017 |
| SRK Consulting | |
| Timok PEA NI 43-101 | Page 64 |
• QEMSCAN analysis on the 18 variability samples (Var 3 to 20)
• QEMSCAN analysis on the three copper rougher tails from variability samples Var 7, Var 8 and Var 9
A previous mineralogy study (AMTEL, 2013) had indicated that there are several different pyrite morphologies within the Čukaru Peki mineralization and that the gold content varies widely between the different pyrite occurrences.
The following work is described in a separate mineralogical report (SGS, 2017c).
The SGS mineralogical study involving optical microscopy, QEMSCAN and D-SIMS were conducted on the pyrite rougher concentrate from Test F16, produced from the optimization test series on master composite, MC. For comparison, the copper rougher concentrate and the copper rougher tails collected from the high-grade 2016 PEA sample Composite 1 were also examined to determine the following:
• Whether the pyrite is significantly different in the high-grade sample
• If the gold in pyrite reporting to the copper concentrate differs from the gold content of pyrite depressed into the copper rougher tails
The study identified four different pyrite morphologies described as coarse, porous, fine, and disseminated. The gold content of the coarse pyrite was 4 ppm, while in the other species it was in the range 15 ppm to 20 ppm. All four types were identified in the pyrite concentrate, copper concentrate, and copper rougher tails and the gold contents were consistent. The average gold content of covellite was 9 ppm and 31 ppm for enargite, although the latter was based on only five particles identified in the copper concentrate.
Unfortunately, the analysis did not immediately point to a processing route for improved gold recovery and the work was not pursued.
The following mineralogical work is in progress.
QEMSCAN rapid analysis of the 18 variability samples (Var 3 to 20) was conducted after several tests yielded lower than expected copper recoveries. This was to provide an overview of the sample characteristics and to ensure the mineralogy was consistent with previous samples and that oxidation was not an issue.
Electron microprobe analysis of the copper rougher tails from variability samples Var 7, Var 8 and Var 9 was undertaken when a difference was observed between the QEMSCAN copper estimates and the values obtained by chemical analysis. The analysis revealed that a proportion of the copper exists in the pyrite as solid solution (~0.4-0.7% Cu), which could be one of the reasons for low copper recovery for the variability samples in Group 3 (a group of samples, spanning a length of 42 m from 503 to 545 m down hole TC160124A).
12.3 Comminution Testing
12.3.1 Comminution Test Results
For the current PEA, two “metallurgical holes”, TC150101 and TC160124, were drilled to provide samples for comminution tests. Test work was conducted by SGS. Orway Mineral Consultants were selected to analyze the results, and recommend a comminution circuit suitable for the most recent mine plan, available at the time (OMC 2017). The Orway report is summarized below.
| Various/RJM/PJD | Timok_PEA_NI43-101_Report_2CR021.006_20171130.docx | November 2017 |
| SRK Consulting | |
| Timok PEA NI 43-101 | Page 65 |
The following comminution test work was performed at SGS:
• Integrated JK drop-weight and SMC tests on 5 samples
• SMC test on 15 samples
• Bond low-energy impact test on 5 samples
• Bond ball mill grindability test on 20 samples
• Bond abrasion test on 20 samples
The detailed results are contained in the SGS report (SGS, 2017b). The main points are summarized below.
JK Drop-Weight and SMC
The JK drop-weight test (DWT) was performed on five variability samples (samples Var 3, Var 6, Var 8, Var 12, Var 16) and the standard SMC test was performed on all 20 variability samples. All SMC testing was conducted on a single size fraction of -31.5/+26.5 mm.
The SMC test results are preferably calibrated against reference samples submitted for the standard DWT in order to consider the natural ‘gradient of hardness’ by size, which can widely vary from one process feed type to another. For this project, the SMC results were calibrated against the respective DWT test results in the cases where both tests were performed. The rest of the SMC results were calibrated against the average of the five DWT-SMC results.
The A x b values of the samples submitted to both the DWT and SMC tests were similar, with the difference not exceeding 8% in all cases. The five samples were quite variable and were characterized as very soft to medium with respect to resistance to impact breakage (A x b) and very soft to hard with respect to resistance to abrasion breakage (ta). The A x b of the other 14 samples also fell in the same range of competency with the exception of one sample (Var 1) which had an A x b value of 38.9 and was categorized as moderately hard. Sample Var 6 was the softest out of all the samples submitted for testing with an A x b value of 133.
The measured rock relative densities were also quite variable and ranged from 2.59 to 4.22.
The DWT and SMC test results are detailed in the integrated DWT and SMC JKTech report, which is appended to the SGS report along with the procedure, calibration and test details. Cumulative distributions of A x b parameters from the twenty SMCs in the current program as well as the JKTech database and various other test programs completed at SGS are presented for comparison.
Bond Low-Energy Impact Testing
The Bond low-energy impact test determines the Bond Crusher Work Index (CWi), which can be used with Bond’s Third Theory of comminution to calculate power requirements for crusher sizing. For each of five variability samples tested, between 10 and 15 rocks in the range of two to three inches were shipped to SGS Vancouver for the completion of the Bond low-energy impact test. The CWi values are compared to the SGS database in Figure 12.2. Three samples (Var 3, Var 6, Var 16) fell in the moderately soft range of hardness of the SGS database, and two samples (Var 8, Var 12) were categorized as medium. The relative densities varied from 2.74 to 3.97 g/cm3.
| Various/RJM/PJD | Timok_PEA_NI43-101_Report_2CR021.006_20171130.docx | November 2017 |
| SRK Consulting | |
| Timok PEA NI 43-101 | Page 66 |

Source: SGS, 2017b
Figure 12.2: CWi SGS database histogram comparison
Bond Ball Mill Grindability Test work
The twenty variability samples were submitted for the Bond ball mill grindability test at 150 mesh of grind (106 μm). Cumulative distributions of Bond Work Index (BWi) values from the current program as well as the SGS database and various other test programs completed at SGS are presented in Figure 12.3.
With BWi values ranging from 8.9 to 14.1 kWh/t, the samples fell in the very soft to medium range of hardness of the SGS database. The average BWi was 10.8 kWh/t.
Bond Abrasion Test work
The twenty variability samples were submitted for the Bond abrasion test. Cumulative distributions of Bond Abrasion (Ai) values from the current program as well as the SGS database of various other test programs completed at SGS are presented in Figure 12.4 for comparison.
The samples varied broadly in terms of their degree of abrasivity. With Ai values ranging from 0.0005 to 0.139 g, five samples fell in the very mild to moderately mild range of abrasiveness in the SGS database. With Ai values ranging from 0.174 to 0.336 g, seven samples were classified as medium abrasive. The remaining eight samples had Ai values varying from 0.486 to 0.773 g and covered the abrasive to very abrasive range of abrasiveness in the SGS database.
| Various/RJM/PJD | Timok_PEA_NI43-101_Report_2CR021.006_20171130.docx | November 2017 |
| SRK Consulting | |
| Timok PEA NI 43-101 | Page 67 |
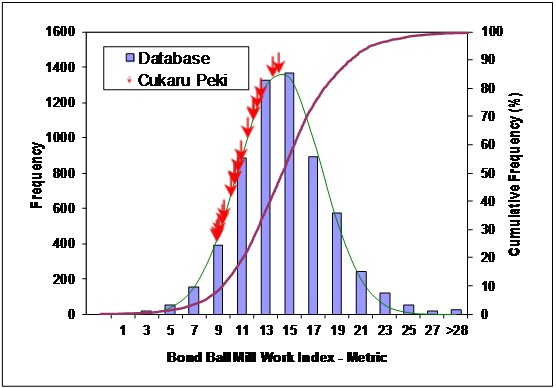
Source: SGS, 2017b
Figure 12.3: BWi SGS database histogram comparison

Source: SGS, 2017b
Figure 12.4: Ai SGS database histogram comparison
| Various/RJM/PJD | Timok_PEA_NI43-101_Report_2CR021.006_20171130.docx | November 2017 |
| SRK Consulting | |
| Timok PEA NI 43-101 | Page 68 |
12.3.2 Orway Comminution Circuit Sizing
The following is summarized from Orway’s mill sizing report (OMC, 2017).
Two circuits were considered, SAB (semi-autogenous grinding (SAG) mill – ball mill) and SABC (SAG mill – ball mill – crusher), the former was selected. Initially, the SAB circuit mill sizing was based on the specific energy requirements calculated from the 85th percentile process feed characteristics of the 2016 PEA test work distribution. The mill sizing did not change following review with the additional 2017 comminution test work. The SAB circuit includes a SAG mill with an inside shell diameter of 7.92 m and an effective grinding length (EGL) of 3.20 m (26’ x 10.5’), with a grate discharge and a 4,400-kW variable speed drive. The ball mill is a 5.50 m inside shell diameter by 8.69 m EGL (18’ x 28.5’) overflow mill, equipped with a 4,400-kW fixed speed drive. The SAG mill drive power is slightly oversized to provide a commonality of motors with the ball mill to reduce the project capital spares cost.
The comminution circuit power is suitable for the entire life of mine; however, this considers a coarsening of the mill product after Year 7. The Project is aware of this but the latest results show that coarsening to 108 μm from 75 μm will not impact copper recovery. This explains why the ball mill power was not increased following the review of the current PEA comminution test work results. This conclusion should be reviewed during the next phase of project development.
The mill sizing provides for operating power contingency of 24% for the SAG mill and 10% for the ball mill. In the case of the SAG mill, the extra contingency could be utilized to reduce the final grind size, but in view of possible coarser product in the latter half of the mine plan, the additional power could be used to further increase throughput. The analysis predicts a forecasted SAG mill throughput of 454 t/h (+14% compared to design) for Years 1 to 7. At this increased tonnage rate, the circuit is limited by the SAG mill therefore coarsening the grind from 75 μm to 108 μm would have no impact on mill throughput. If mill throughput is pushed beyond design in Years 1 to 7 then a review of the mine plan may be required.
12.4 Flotation Optimization
12.4.1 Composite Testing
As part of this PEA, further testing was completed on samples from the Čukaru Peki (UZ) deposit (SGS, 2017a). The emphasis of the test work was to optimize the flotation conditions established in the previous study (SRK (UK), 2016) and to provide samples to evaluate processing options for the high arsenic copper concentrate, referred to as the complex copper concentrate, and the pyrite concentrate.
To complete the current PEA, a third program was initiated (SGS, 2017d). The overall scope of this program included sample preparation, mineralogy, comminution test work, process feed aging test work, bulk flotation test work, further flotation optimization and variability testing, solid-liquid separation testing, and environmental characterization.
| Various/RJM/PJD | Timok_PEA_NI43-101_Report_2CR021.006_20171130.docx | November 2017 |
| SRK Consulting | |
| Timok PEA NI 43-101 | Page 69 |
For much of the current PEA metallurgical program, it was still planned to develop and optimize the flowsheet selected in the 2016 PEA, which produced two copper concentrates, a low arsenic and a complex concentrate. However, during variability testing, it was realized that a significant proportion of the deposit did not respond well to this flowsheet. Testing and analysis of a flowsheet producing a single bulk concentrate was then carried out, and in conjunction with Nevsun’s marketing consultants, a decision was made to change to this simpler, more robust flowsheet.
Copper Rougher Kinetics Flotation Tests
A series of 22 rougher kinetics tests, which examined the effects of primary grind size, pH, collector type, sodium metabisulphite addition, ammonium sulphate addition and extended time / increased collector dosage, was completed.
Grind size did not affect gold metallurgy in either the copper or pyrite circuits. Copper metallurgy improved with finer grinding, with a difference of ~4% in copper recovery at the same mass pull.
When using Aerofloat 211, the pH in the copper rougher circuit did not impact gold metallurgy, and a higher pH resulted in improved copper metallurgy. When using Aerofloat 5100, the highest pH tested produced the best results for both gold and copper. Different types of collectors were explored: Aerofloat 211, Aerofloat 5100 and Aerofloat 7249. There was no significant difference in results among the three tests for either gold or copper metallurgy in the copper rougher circuit.
The use of sodium metabisulphite was explored at two pHs with Aerofloat 211 and with Aerofloat 5100. Ammonium sulphate was also tested with Aerofloat 211. Copper selectivity generally improved. The use of ammonium sulphate did not improve final results, although it did appear to improve copper selectivity in the earlier flotation increments.
There was no improvement in gold metallurgy in the copper rougher circuit at higher collector dosage and extended retention time. Copper metallurgy was improved in the earlier stages of flotation, but gradually converged to approximately the same results as the baseline test at the end of the copper rougher flotation.
Copper Circuit Batch Cleaner Flotation Tests
For the master composite sample, MC, 21 batch copper circuit cleaner flotation tests, including cleaner kinetics tests and two stage cleaner tests, were conducted. The flowsheet is presented in Figure 12.6, in a later section. Variables studied in batch testing included the effect of regrind, the effect of depressants including sodium metabisulphite, SD200 and ammonium sulphate, cleaner pH level, and flowsheet configuration. Different optimization strategies were also explored in the cleaners, including solids loading and flotation times.
Three tests examined the effect of regrind size. It appears that there was no benefit from regrinding finer than a K80 of 28 µm.
The effect of sodium metabisulphite addition was investigated. Copper and gold metallurgy were no better than in the baseline test (without metabisulphite addition).
| Various/RJM/PJD | Timok_PEA_NI43-101_Report_2CR021.006_20171130.docx | November 2017 |
| SRK Consulting | |
| Timok PEA NI 43-101 | Page 70 |
Four tests examined different techniques aimed at improving copper cleaner performance, though varying retention times and manipulation of pulp level, agitation and air flow rate. The best results were arguably achieved in test F28.
Different depressant schemes were tested in the copper cleaners, including the use of ammonium sulphate and the use of an increased pH throughout the cleaners. None of the tests performed better than the baseline test F16.
A single copper cleaner test was conducted at a coarse primary grind size (K80) of ~200 µm. Performance was no better than the baseline test F16.
The optimum conditions for flotation, as per test F16, were determined as follows:
• Primary grind size: K80~108 µm
• Copper rougher: pH 10.0; 5 minutes aeration; 15.5 minutes flotation; 60 g/t Aero 211
• Copper regrind size: K80~28 µm
• Copper first cleaner: pH 11.0; 8 minutes flotation; 20 g/t Aero 211
• Copper first clean scavenger: pH 11.0; 6 minutes flotation; 30 g/t Aero 211
• Copper second cleaner: pH 11.5; 4 minutes flotation; no collector
Copper Cleaner Kinetics Tests
Two copper first cleaner kinetic tests, one copper second cleaner kinetic test, and five copper third cleaner kinetic tests were conducted. Copper recovery increased steadily with increasing retention time in all cases, suggesting that perhaps additional residence time may be warranted in order to reach the inflection point at which the curves plateau in a more pronounced fashion.
Pyrite Flotation
There was little difference in performance (in terms of the gold recovery versus mass pull relationships) among the pyrite rougher flotation tests, with all tests generally lying along a similar grade versus recovery trend.
Initial tests followed conventional pyrite flotation practice with sulphuric acid used to lower the pH to 6.5 and CuSO4 added as an activator. Collector was potassium amyl xanthate (PAX) (200 g/t), and laboratory rougher flotation time was 20 minutes. However, the high lime requirements in copper flotation were matched by a high acid requirement in the pyrite circuit and it was found that both the acid and the copper sulphate could be omitted without significant effect on pyrite recovery. Surprisingly, pyrite flotation kinetics were significantly increased at higher pH, as shown in Figure 12.5.
Four tests with a pyrite first cleaner stage, gave a similar response in terms of upgrading. By rejecting non-sulphide gangue, the first cleaner stage was effective at reducing the concentrate mass at relatively low loss of gold recovery. Further reduction in concentrate mass was achieved by regrinding ahead of the cleaning stage.
| Various/RJM/PJD | Timok_PEA_NI43-101_Report_2CR021.006_20171130.docx | November 2017 |
| SRK Consulting | |
| Timok PEA NI 43-101 | Page 71 |
Due to the intimate mineralogical association of gold with pyrite, regrinding to 50 μm did not significantly change the S/Au ratio and the mineralogical data suggests that very fine grinding would be required to achieve any significant liberation of gold. It therefore appears unlikely that additional flotation stages will increase the gold-to-pyrite ratio, which is the critical factor influencing the economics of oxidation and downstream processing. The optimum gold-pyrite production conditions need to be established considering the economics of downstream processing. Studies are continuing in this area with technology suppliers.
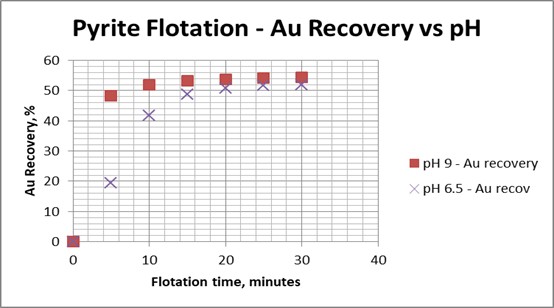
Source: SGS, 2017a
Figure 12.5: Pyrite flotation kinetics
12.4.2 Variability Testing
At the time of preparation of this PEA, test work continued on variability samples from hole TC160124A. To date, the expected high copper recoveries, experienced with the composites, have not been achieved, particularly on the Group 3 samples (spanning a length of 42 m from 503 to 545 m). They are characterized by a combination of high copper grades (4.0 to 10.5%), >60% pyrite content, and/or moderate to high arsenic levels (0.27 to 0.66%). Group 3 also includes a fifth, deeper sample representing a 12-m interval from 615 to 627 m which has a lower grade, but a higher pyrite to covellite ratio (Var 16: 2.5% copper, 0.37% arsenic, 43% pyrite).
The metallurgy of the Group 3 samples is as follows:
• They yield less than 85% copper recovery in the rougher circuit compared to the 94% achieved with the composites.
• They have around 5% of the copper present in the pyrite crystal structure, which is therefore not available for recovery by differential flotation.
• They consistently return arsenic recoveries 15 to 20% lower than the copper recovery
| Various/RJM/PJD | Timok_PEA_NI43-101_Report_2CR021.006_20171130.docx | November 2017 |
| SRK Consulting | |
| Timok PEA NI 43-101 | Page 72 |
Investigations are continuing into the causes of this Group 3 performance, concentrating on two areas:
• Does the high sulphide content cause redox conditions in which the copper minerals are less readily flotable? This would explain why the effect was not observed with master composite, MC, which contained only 38% pyrite (see below).
• Is the low enargite recovery, as indicated by the arsenic results, a source of copper loss and may be due to flotation conditions or poor liberation from pyrite, especially in the high pyrite samples?
A more detailed sampling and variability test work program will be required at the next phase of project development to define a range for acceptable process plant feed. The degree of blending occurring in the underground block cave is being quantified and additional blending, on surface, may be required. Methods of identifying the metallurgically difficult Group 3 zone in the underground mine, and blending it into the process plant feed, are also being analyzed.
12.4.3 Variability Testing at MMI
Variability testing is in progress at MMI. The initial tests at MMI were aimed at gaining familiarity with the standard flowsheet and conditions developed in the optimization program at SGS Lakefield.
12.4.4 Testing of Yearly Blends
Tests have been conducted on yearly blends containing waste to emulate sublevel cave mixing of mineable resource over several levels, as modelled in the mine plan. The response of a significant number of samples to the two-concentrate flowsheet did not meet expectations. The metallurgical response of most samples to the bulk concentrate flowsheet was very promising. This can likely be optimized further by adjusting reagent additions, regrind size and by recirculating certain streams such as first cleaner tails and first cleaner scavenger concentrate process stream.
The results have been used as a basis for the metallurgical predictions in Section 12.9.
12.5 Oxidation Test Work
The detailed results of oxidation test work are contained in the SGS report (SGS 2017d) with the main points summarized below.
The impact of process feed aging on metallurgical performance was evaluated through the artificial aging of four massive sulphide ores from Čukaru Peki resource. Each of the composites from the 2016 PEA, that is Composites 2, 3, 4 and 5, were crushed to 100% passing 6 mesh, sealed in a plastic bag (10 kg per charge), and stored under dry ambient conditions for 10 months before starting the test program. Each composite was further crushed to 100% passing 10 mesh and split into five ~4-kg test charges. The first split 4-kg charge was used directly for process feed aging testing. Each of the remaining four 4-kg test charges was placed in a plastic pail, kept exposed to open-air, and was maintained damp with deionized water at different aged times (2, 4, 9 and 16 weeks) to simulate accelerated aging under humid conditions. For comparison purposes, each of the original four composites that had been crushed to 100% passing 10 mesh were also stored in a freezer for 10 months (2 kg per charge). These samples were also retrieved to perform identical metallurgical test work as the ambient stored samples.
| Various/RJM/PJD | Timok_PEA_NI43-101_Report_2CR021.006_20171130.docx | November 2017 |
| SRK Consulting | |
| Timok PEA NI 43-101 | Page 73 |
The four frozen composites and four ambient-stored composites were submitted for copper speciation, sulphur and iron analysis. The soluble copper and iron increased for each composite, which indicated that the samples had been oxidized to some extent while under dry ambient storage for 10 months. The high sulphide ores seemed to be more easily oxidized.
The process feed aging test work consisted of batch cleaner flotation testing, ethylene diamine tetra acetic acid (EDTA) extraction, modified acid base accounting, and shake-flask extraction testing. The tests were conducted on samples that had been kept in freezer storage as well as those that had been stored under ambient conditions.
Sample aging under ambient conditions had a significant effect on batch cleaner flotation performance for Composites 2, 3 and 4. The copper grade of the final cleaner concentrate decreased with aging, while the arsenic grade increased compared to the frozen sample. This suggests separation of copper sulphides from enargite will become more difficult with aging. The metallurgical performance deteriorated drastically when aging was accelerated. Final cleaner copper grades were >55% for the Composites 2 and 3 samples stored in the freezer, where grades of less than 42% was the best that could be achieved for the same composites after only two weeks of accelerated aging. Composite 4 was even worse with a final copper concentrate grade of <25%. It was also almost impossible to achieve satisfactory separation between the copper and arsenic (enargite) sulphides, even after dry-aging the sample for 10 months. The sample aging effect on the flotation performance was less significant for the Composite 5 sample because of the relatively low head grades and generally poor recovery for both copper and sulphur.
Although the aged samples were tested on the two-concentrate flowsheet, and the separation problems will be less for the single bilk concentrate, this has still been identified as a risk, and will be evaluated further during the PFS. It should be noted that the oxidation conditions experienced during the test are very aggressive and should be compared with actual conditions in the proposed mine.
12.6 Environmental Testing
Freeport had carried out a large number of tests geochemically characterizing the rock types within the deposit. Although a formal report was not received from Freeport, the data was collected and summarized by phase geochemistry for Knight Piésold in a report entitled, Review and Summary of Geochemical Data, Čukaru Peki Project, dated 27 February 2017.
The detailed results are contained in the SGS report, Project 15242-003 – INTERIM Report
July 11, 2017 (interim release of SGS, 2017d). The main points are summarized below.
• Elemental analyses (strong acid digest) determined that the pyrite tailing sample tested was comprised primarily of silicates (~29%) with moderate to minor amounts of aluminum (6.6%) and potassium (<2%). In comparison, the pyrite concentrate was predominantly comprised of iron (23%) with a lesser contribution from silica (15.5%) and minor aluminium (<1.5%). All other parameters reported at trace levels (<1%).
| Various/RJM/PJD | Timok_PEA_NI43-101_Report_2CR021.006_20171130.docx | November 2017 |
| SRK Consulting | |
| Timok PEA NI 43-101 | Page 74 |
• Overall, the leachates from the toxicity characteristic leaching procedure typically reported significant concentrations (>1 mg/L) of calcium, copper, potassium and silica in solution.
• Analysis of the tailings EN 12457-2 extraction leachate reported a strongly alkaline final pH value (8.89), and concentrations of the typically controlled parameters (Hg, As, Cd, Cu, Fe, Ni, Pb, Zn) well within the guidelines designated by the World Bank. In contrast to the tailings, the concentrate EN 12457-2 extraction leachate reported an acidic pH value (4.57) and copper well in excess (two orders of magnitude) of the guideline designated by the World Bank. Zinc was also observed at a concentration marginally greater than the specified guideline. All other parameters controlled by the World Bank were within the designated standards. As expected, elevated levels of most parameters were evident in the concentrate leachate in comparison to the tailings leachate.
• Analysis of the tailings process water reported near neutral pH (7.44), and all World Bank controlled parameters were well within the specified standards. While the concentrate process water also reported near neutral pH (7.28), concentrations of copper and iron, in excess of the World Bank guidelines, were observed. All other parameters reported within World Bank standards. Comparison of the total and dissolved metals indicated that the majority of analytes in the tailings process water were in the dissolved form, while the majority of analytes in the concentrate process water were suspended in the water column (total metals).
• Modified acid base accounting test results clearly identified both the tailings and the concentrate as potentially acid generating with major sulphide concentrations (≥5.54%) and very little neutralization potential.
• The tailings humidity cell leachates have maintained circum-neutral pH values (≥6.72) throughout the initial 10 weeks of the humidity cell test. Decreasing levels of alkalinity and sulphate are currently evident in the weekly leachates. The concentrate humidity cell leachates reported increasingly acidic pH values, well below the lower limit dictated by the World Bank (6.0), throughout the initial five weeks of weathering. Increasing concentrations of free acidity and sulphate are evident in the weekly leachates.
• Results of the particle size distribution analyses indicated that both samples (tailings and concentrate) were comprised primarily of fines with ≥70% of the samples passing the 75 µm sieve and ≤30% of the samples reporting as sand size particles. While the majority of these fines were comprised of silt size particles (67% to 75%), relatively significant clay size fractions (3% to 4%) were also reported.
• Results of the settling tests indicated that both samples (tailings and concentrate) will settle very quickly in a tailings pond setting. Both the settling test samples (standard and drained) generally settled out of solution within 15 to 30 minutes and terminal density was achieved shortly thereafter. The addition of drainage to the settling tests resulted in little difference in the final settled density of the tailings and concentrate samples (68.7% and 73.3% solids for the standard settling tests versus 69.7% and 74.8% solids for the drained settling tests, respectively).
12.7 Concentrate Characterization
12.7.1 Concentrate Description
This section describes testing on concentrates produced using the two-concentrate approach. The single bulk concentrate, which is the basis of this study, will have somewhat different characteristics and therefore the results presented should be considered as preliminary estimates. The “Copper Clean Concentrate”, “Copper Complex Concentrate”, and the “Pyrite Rougher Concentrate” were generated from a total of 12 batch copper cleaner flotation tests (BF23-BF34) which were conducted on the “TM Comp 600” sample by repeating the flowsheet and conditions described under report 15242-002 (SGS, 2017c).
| Various/RJM/PJD | Timok_PEA_NI43-101_Report_2CR021.006_20171130.docx | November 2017 |
| SRK Consulting | |
| Timok PEA NI 43-101 | Page 75 |
Samples of the three concentrates were submitted for bulk density, specific gravity measurement, size fractional analysis, detailed concentrate analysis and whole rock analysis.
12.7.2 Concentrate Characterization Results
The three concentrates have low uranium (less than detection limits) and thorium grade (<1.2 g/t) and thus they have low radiation. The arsenic grade of the Copper Clean Concentrate (0.64% As) is higher than the typical requirements of smelters. All other penalty elements are below the typical requirements.
12.7.3 Self-Heating Test Work
A sample of each of the three concentrates was shipped to NesseTech Consulting Services Inc. for self-heating tests.
The NesseTech draft report (Appendix E of SGS, 2017b) states that like typical pyrite, the Pyrite Rougher Concentrate seems non-reactive. The Copper Complex Concentrate has a high Stage A reactivity but low Stage B reactivity, which seems somewhat unusual. The results suggest that the Copper Complex Concentrate may heat up to below 100°C with low potential to generate sulphur dioxide. The Copper Clean Concentrate has a similar and reactive Stage A (to the other copper concentrate) but higher Stage B values suggest that this is the product with some risk of self-heating if conditions in the field are conducive. This work will be repeated during the PFS to determine the implications on concentrate transportation.
12.8 Tailings Characteristics
In the event that the pyrite concentrate is not immediately treated to recover the contained gold, as will be determined in the next study phases pending results from the opportunity studies for pyrite, it will be stored separately in the tailings management facility. That approach is the basis of the current study. Two samples, a pyrite rougher concentrate (to be stored at pyritic TSF) and a pyrite rougher tails (to be stored at main bulk TSF) from the bulk flotation tests, were subjected to solid-liquid separation and rheology tests to assist in design of waste management facilities.
12.8.1 Sample Characterization
The pyrite rougher concentrate and pyrite rougher tails samples were produced from flotation tests “BF5 to BF18”. The samples were received in the form of a pulp. In addition, a 20 L pail of process water was provided for additional test dilution. The pH was adjusted to pH 9.0 using lime as required. The results of the characterizations are summarized in Table 12.5.
Table 12.5: Sample characterization
Sample I.D. | d80, µm | <1 µm, % vol | Dry SG | Testing pH |
Pyrite Rougher Tails | 74 | 2.3 | 2.74 | 7.8 |
Pyrite Rougher Conc | 118 | 2.8 | 3.60 | 9.0 |
| Various/RJM/PJD | Timok_PEA_NI43-101_Report_2CR021.006_20171130.docx | November 2017 |
| SRK Consulting | |
| Timok PEA NI 43-101 | Page 76 |
12.8.2 Dynamic Thickening
Flocculant selection and preliminary static settling test results indicated that both samples responded well to BASF Magnafloc 333 flocculant, which is a very high molecular weight non-ionic polyacrylamide flocculant.
A thirty-minute period of extended underflow thickening, without feed and raking, resulted in an increase in underflow density. The underflow density of the pyrite concentrate increased to 74.6% w/w solids with a corresponding yield stress of 76 Pa. The underflow density of the pyrite tailings increased to 70.6% w/w solids with a corresponding yield stress of 59 Pa (versus the pre-extended thickening yield stress of 13 Pa).
Underflow Rheology
A very important aspect relating to sample characterization within the context of a rheological study is the relationship between the solids specific gravity (density) and slurry solids density (content). Both samples tested displayed insignificant inter-particle interactions as suggested by “α” values near one, meaning that the dry solids specific gravity was comparable to their density in the slurry phase.
The rheology test measurement data allowed for Bingham modelling and subsequent interpretation, particularly with respect to the solids density rheological profile. The critical solids density of the pyrite rougher concentrate underflow sample was ~74% w/w solids, which corresponded to a yield stress of 18 Pa under unsheared flow condition. Due to the settling nature of the sample at or below 74.9% w/w solids, yield stress under sheared conditions could not be determined for these measurements.
The critical solids density of the pyrite rougher tails underflow sample was ~70% w/w solids, which corresponded to a yield stress of 17 Pa under unsheared flow condition and 8 Pa under sheared condition (i.e. post constant shearing).
12.8.3 Vacuum and Pressure Filtration
Vacuum filtration testing was conducted on the Pyrite Rougher Concentrate using a filter feed at 74.0% w/w solids based on the results of the settling/thickening and underflow rheology test results. The cake thickness ranged from 16 to 35 mm. The resulting solids output (i.e. dry solids capacity) ranged from 1037 to 7909 kg/m2 h. The discharge cake residual moisture content ranged from 8.1% to 15.9% w/w.
Vacuum filtration testing was conducted on the Pyrite Rougher Tails using a filter feed at 70.0% w/w solids based on the results of the settling/thickening and underflow rheology test results. The cake thickness ranged from 15 mm to 35 mm. The resulting solids output (i.e. dry solids capacity) ranged from 601 to 5629 kg/m2 h. The discharge cake residual moisture content ranged from 12.5% to 20.2% w/w. The vacuum filtration was conducted at an average of 25 inches mercury vacuum level.
The pressure filtration was conducted at 5.5 bar and 6.9 bar pressure levels. Pressure filtration testing was also conducted using a filter feed at 74.0% w/w solids. The cake thickness ranged from 15 mm to 30 mm. The resulting solids output (i.e. dry solids capacity) ranged from 3240 kg/m2 h to 4052 kg/m2 h. The discharge cake residual moisture content ranged from 8.8% to 11.1% w/w.
| Various/RJM/PJD | Timok_PEA_NI43-101_Report_2CR021.006_20171130.docx | November 2017 |
| SRK Consulting | |
| Timok PEA NI 43-101 | Page 77 |
12.9 Predicted Metallurgical Results
The two-concentrate metallurgical flowsheet produced good recoveries and grades from almost all composites and a good proportion of the variability samples. However, in conjunction with the study’s marketing consultants, it was decided to base this PEA on the simpler, more robust approach, which produces a single bulk copper concentrate. It should be noted that the simplified single concentrate flowsheet is, for the most part, the same as the two-concentrate flowsheet and if future studies revert back to the two-product concept, it will be a relatively simple adjustment in terms of additional unit processes required at the back end of the flotation circuit.
Although mineralogy and therefore copper and arsenic grades are important, geometallurgical relationships between recovery and process feed type have not been identified so far. It was decided, based on an analysis of the flotation results to identify four “ore grade bins” and assign average recoveries and concentrate grades achieved during testing of the yearly blends. The four feed grade bins and the representative yearly blend samples shown in Table 12.6 are expected.
Table 12.6: Feed grade bins
Process Feed Type | Yearly Blend Samples |
High grade (>6% Cu) | FB-1 and 2 |
Medium high grade (4 to 6% Cu) | FB-3 |
Medium low grade (2 to 4% Cu) | FB-4 |
Low grade (<2% Cu) | FB-5, 6, 7 and 8 |
A schematic representation of the single bulk concentrate production is shown in Figure 12.6.
| Various/RJM/PJD | Timok_PEA_NI43-101_Report_2CR021.006_20171130.docx | November 2017 |
| SRK Consulting | |
| Timok PEA NI 43-101 | Page 78 |
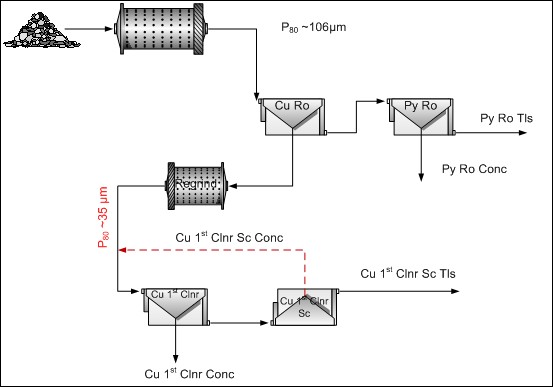
Source: SGS, 2017a
Figure 12.6: Bulk concentrate process
The predicted metallurgical results, using this flowsheet, are shown in Table 12.7.
| Various/RJM/PJD | Timok_PEA_NI43-101_Report_2CR021.006_20171130.docx | November 2017 |
| SRK Consulting | |
| Timok PEA NI 43-101 | Page 79 |
Table 12.7: Predicted metallurgical results
Ore type | Flowsheet and products | Concentrate Grade % Cu | Recovery Au % | Recovery Cu % | Recovery As % |
High grade (>6% Cu) | Single rougher concentrate | 29 | 34 | 94 | 84 |
Medium high grade (4 to 6% Cu) | Single cleaner concentrate | 25 | 35 | 94 | 94 |
Medium low grade (2 to 4% Cu) | Single cleaner concentrate | 20 | 27 | 92 | 93 |
Low grade (<2% Cu) | Single cleaner concentrate | 20 | 27 | 87 | 82 |
12.10 Processing Trade-off Study Summaries
Following the 2016 PEA, it was decided to carry out four trade-off studies (ToS’s #1, 2, 3 and 4) during the current PEA study to define processing options for the project.
12.10.1 ToS #1 Single vs. Two Concentrate Summary
ToS #1 concluded that the metallurgical process for Timok should be designed to produce either high and low arsenic copper concentrates, referred to as “clean” and “complex” respectively, or a single bulk concentrate.
Nevsun’s marketing consultants indicate that at a high level, all concentrates are marketable. Assuming that a buyer can be found to purchase and treat the high arsenic copper concentrate, at currently prevailing treatment charges, the NSR’s for both options are similar, suggesting there is no economic benefit from producing two concentrates. However, the marketing situation is changing as increasing amounts of complex concentrates enter the market.
Selecting a metallurgical process that produces split concentrates would concentrate the arsenic into a lower tonnage concentrate for treatment, should a suitable process route be identified. This would significantly reduce capital and operating costs of such an option.
The Rakita metallurgical team believes that two process technologies to reduce the arsenic content of the high-arsenic copper concentrate should be evaluated, tested and be ready to install. These two processes, listed below and described in ToS#3, are the subject of specialist testing and cost estimating exercises by Outotec in Frankfurt and Core Resources in Australia. Therefore, it is recommended that the metallurgical flowsheet in the concentrator continue to be developed to be able to produce both concentrates.
• The Outotec Reduction Roasting process, as installed at Ministro Hales to treat high-arsenic concentrates from Chuquicamata
• The Toowong process, which is proven at pilot scale and is a variation on a caustic leach process
12.10.2 ToS #2 Pyrite Concentrate Treatment Summary
Initially, a preliminary list of potential treatment options was compiled, and after an initial review, a shorter list was prepared for more detailed review. ToS #2 concluded that an economic gold recovery process from the pyrite concentrate is likely possible by either pyrite roast with acid production and cyanide leaching of the calcine or the Albion process, applied at low sulphide oxidation levels of 15%
| Various/RJM/PJD | Timok_PEA_NI43-101_Report_2CR021.006_20171130.docx | November 2017 |
| SRK Consulting | |
| Timok PEA NI 43-101 | Page 80 |
12.10.3 ToS #3 High Arsenic Treatment Options Summary
Using a similar preliminary list to short list process, ToS #3 concluded that processes capable of an economic reduction of the arsenic content of the complex concentrate is likely possible by either the Outotec reductive roasting or the Toowong caustic leach process.
The reasons for recommending reductive roasting is that it is now proven and working well. Indications are that it is a relatively low cost option, in terms of both capital and operating cost. In testing of the reductive roasting process, arsenic in the Timok high arsenic copper concentrate was reduced from 4.1% to 0.2%.
The reasons for recommending the Toowong process are that, although it is not proven on an industrial scale, the chemistry is relatively simple and it can be applied on both a large or small scale. In testing of the Toowong process, arsenic in the Timok high arsenic copper concentrate was reduced from 4.1% arsenic to 0.1% arsenic after two hours and 0.06% arsenic after 24 hours of leaching.
12.10.4 ToS #4 Arsenic Transportation Summary
As part of preparing ToS #4, a report on concentrate marketing, including general comments on transportation regulations, was delivered by Cliveden Trading AG.
To supplement that report, additional reports were sought from Hugh Hamilton, previously Manager, Raw Materials at Teck’s Trail Smelter Operation, and Laurie Reemeyer, previously Manager Metallurgy at Century Zinc Mine and Director, Process Strategy at Amec Foster Wheeler.
The views expressed in these three external reports have been summarized by the Nevsun-Rakita metallurgical team into several risk categories, where risk is defined as the product of exposure frequency and consequence or impact of an event.
Four scenarios or cases were developed to address options for Rakita to manage the identified risks:
1. Scenario A – Currently Acceptable Practice
2. Scenario B – Best Practice Based on Industry Trends
3. Scenario C – Potential Worst Case Due to Regulatory Changes
4. Scenario D – On-site Removal and Storage of Arsenic By-product
Although it appears that Rakita concentrates can be successfully managed under Scenarios A and B, the large quantity of arsenic involved greatly increases the complexity of the Rakita marketing challenge, particularly regarding the number of smelters that will be required to “share” the arsenic load. This issue could become acute if regulatory changes result in a reduced number of smelters able or willing to accept Rakita’s high arsenic concentrate (Scenario C).
The inevitable conclusion is that the best way to mitigate both the environmental and commercial risks of high arsenic production is to pre-treat the concentrate to remove the arsenic prior to concentrate sales and to store the arsenic in stabilized chemical form in a permanent storage facility (Scenario D). This assumes, of course, that economically viable pre-treatment technologies are available, thus the evaluations in ToS #3 and subsequent engineering studies.
| Various/RJM/PJD | Timok_PEA_NI43-101_Report_2CR021.006_20171130.docx | November 2017 |
| SRK Consulting | |
| Timok PEA NI 43-101 | Page 81 |
12.11 Gold Recovery from Pyrite Concentrate
Following the conclusion of ToS #2, it was decided to further evaluate the two recommended processing options of roasting and Albion oxidation. This evaluation consisted of additional testing and preliminary engineering report by the respective process suppliers – that is:
• Outotec Gmbh & Co., for the roasting process
• Glencore Technology Pty. Ltd. and Core Metallurgy Pty. Ltd. for the Albion Process
These preliminary reports were reviewed by Ausenco, Brisbane who analyzed the engineering requirements, identified gaps and prepared preliminary scoping level, capital and operating cost estimates. The detailed results are contained in the reports:
• Ausenco 102025-RPT-0001, Revision Number B, Rakita Exploration d.o.o. BOR, Čukaru Peki Project, Pyrite Concentrate Processing Report, 12 July 2017
• The Glencore, Core Resources and Outotec reports (appended to the Ausenco report)
Although this evaluation was only scoping level and additional testing and engineering work is required, a simple high-level calculation shows that potential revenues will exceed the combined capital and operating cost for both options. It should be noted that the preliminary economics of the Albion process are better at 15% rather than at 50% oxidation, where they are marginal. This is described in the Ausenco summary report. Additional upside may be achieved by upgrading the pyrite concentrate by cleaner flotation.
| Various/RJM/PJD | Timok_PEA_NI43-101_Report_2CR021.006_20171130.docx | November 2017 |
| SRK Consulting | |
| Timok PEA NI 43-101 | Page 82 |
13 Mineral Resource Estimate
13.1 Introduction
The Čukaru Peki (UZ) mineral resource statement presented herein represents the latest mineral resource evaluation reported for the Project in accordance with the NI 43-101.
The Čukaru Peki resource model prepared by SRK (UK) utilizes some 87,864 m of drilling for a total of 116 exploration, resource and metallurgical drillholes at the Project site. The mineral resource estimate was supervised by Mr. Martin Pittuck, C.Eng, FGS, MIMMM an “independent qualified person” as defined in NI 43-101. The effective date of the mineral resource statement is 24 April 2017.
To the best of SRK’s knowledge, there are no environmental, permitting, legal, title, tax, socio-economic, market, political or other relevant factors that would affect the mineral resource presented in this report.
13.2 Resource Estimation Procedures
The resource estimation methodology involved the following procedures:
• database compilation and verification
• construction of wireframe geological models and definition of Resource domains
• data conditioning (compositing and capping review) for statistical analysis, geostatistical analysis
• variography, block modelling and grade interpolation
• resource classification and validation
• assessment of “reasonable prospects for economic extraction” and selection of appropriate reporting cut-off grades
• preparation of the mineral resource statement
13.3 Resource Database
SRK was supplied with the Čukaru Peki drilling data in a Microsoft Excel database on 24 April 2017. The database was reviewed by SRK and imported into Leapfrog Geo and Datamine to complete the mineral resource estimate. SRK is satisfied with the quality of the database for use in the construction of the geological block model and associated mineral resource estimate.
13.4 Statistical Analysis – Raw Data
Metallurgical and mineralogical test work highlight that copper mineralogy primarily consists of covellite with lesser enargite and trace colusite, bornite and chalcopyrite. To allow for statistical assessment and modelling of the separate distributions of the primary copper minerals, SRK and Rakita derived two additional fields in the raw assay database using the copper and arsenic assays, based on the following formulae:
Copper in enargite (CuEn) % = As % * 2.55
(i.e. the copper to arsenic ratio in enargite, Cu3AsS4)
| Various/RJM/PJD | Timok_PEA_NI43-101_Report_2CR021.006_20171130.docx | November 2017 |
| SRK Consulting | |
| Timok PEA NI 43-101 | Page 83 |
Copper in covellite (CuCov) % = Cu% - CuEn%
(i.e. the remaining copper is assumed to be associated with covellite, CuS)
An initial global statistical analysis was undertaken using the raw drill data. Summary statistics, incremental and log histograms were prepared. The skewed log normal distributions for CuCov, CuEn, gold and arsenic are shown in Figure 13.1, with the separate populations noted in the assays relating to host rock, low and high-grade zones.
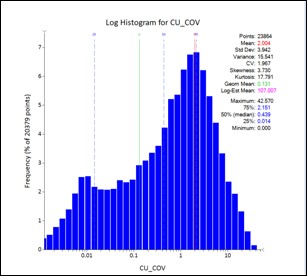
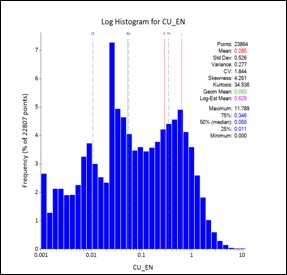
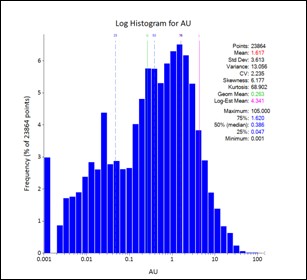
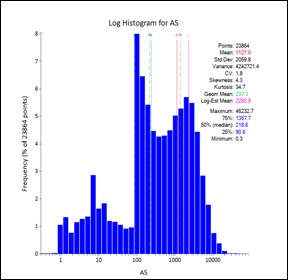
Figure 13.1: Incremental and log histogram of length weighted project CuCov%, CuEn%, gold and arsenic assays
13.5 3D Modeling
The 2017 mineral resource estimate update is based on drilling, site visit, core photo review and modelling of the following geological features for the deposit:
• fault network
• lithology model
• alteration shell framework
| Various/RJM/PJD | Timok_PEA_NI43-101_Report_2CR021.006_20171130.docx | November 2017 |
| SRK Consulting | |
| Timok PEA NI 43-101 | Page 84 |
• mineralization zones based on:
˗ high-grade copper in covellite (UHG)
˗ massive sulphide
˗ low grade copper in covellite
˗ high grade copper in enargite
˗ low grade copper in enargite
13.5.1 Geological Wireframes
Fault Network
SRK (UK) constructed a fault network model using a combination of core photo re-logging, ABI information on the orientation of interpreted primary slip zones, Rakita’s major structure drillhole logs geotechnical logs and visual assessment of offsets in the geology and copper assay grades.
Leapfrog Geo software was used to model the fault network and associated structural domains, with four faults identified as significant with respect to the geometry of the deposit. Zones of geotechnically weaker rock associated with faulting, fracturing and increased clay content were also modelled in 3D during this process, most significantly including the broad (basal) zone of clay alteration and fracturing under the UZ mineralization (referred to as the ‘Basal Clay Fracture Zone’).
Lithology Model
SRK has modelled the un-mineralized stratigraphic cover sequence as a series of surfaces above the lower andesite (LA) which hosts the mineralization, based on geological logging of: upper andesite sill (UA), marl (UCMA), conglomerate (UCCM) and Miocene clastic sediments (MCS). The LA is interpreted to have zones of higher and lower porosity, with the more coherent, less porous rock being at the margins of the UZ deposit (referred to as ‘LPA’ and ‘LAB’ in logging codes) considered to coincide with the contact between mineralization and waste. SRK has modelled the LA using a combination of surfaces and implicit shells, based on geological logging codes, to reflect a relatively uniform contact with the overlying UA sill and more geometrically variable contact at depth between mineralized and un-mineralized parts of the LA.
Prior to constructing the lithology model, the fault network described above was used to generate a series of fault bounded domains, within which lithological surfaces were constructed independently to reflect faulted offsets.
Alteration Shell Framework
SRK has grouped together drillhole intervals based on similar alteration assemblages (which were interpreted using a combination of Terraspec data and core observations) and generated broadly concentric alteration wireframes using Leapfrog Geo. SRK has modelled the following alteration zones within each of the fault bounded domains:
• Advanced argillic halo
• Kaolinite halo
| Various/RJM/PJD | Timok_PEA_NI43-101_Report_2CR021.006_20171130.docx | November 2017 |
| SRK Consulting | |
| Timok PEA NI 43-101 | Page 85 |
• Argillic halo
The advanced argillic halo has been used as a guide for modelling the main mineralization domains.
13.5.2 Mineralization Wireframes
Mineralization domains were modelled for the HS epithermal style mineralization in the Čukaru Peki (UZ) deposit. Mineralization wireframes have been defined based on a combination of the following criteria:
• within the advanced argillic alteration domain
• within the LA unit (rather than overlying UA and sediments)
• differentiated by mineralization style (i.e. massive sulphide vs. andesite breccia)
• differentiated by copper mineralogy (i.e. covellite vs. enargite) and copper grade
Ultra High-Grade Copper in Covellite
The UHG domain has been modelled based on the visually evident top contact with waste rock and the step changes in the grade at around 12% CuCov at the lower contact. SRK created a 3D solid wireframe from selected sample intervals using the vein modelling tool in Leapfrog.
Massive Sulphide
The top third of the deposit comprises massive sulphide mineralization, including the UHG domain at the top, below which can be found medium grade copper in covellite mineralization with mainly stratiform grade distribution. Within the massive sulphide, (below the UHG), CuCov grade typically ranges between 5% and 10%.
Low Grade Copper in Covellite
The lowermost two-thirds of the deposit comprise the low-grade copper in covellite mineralization where the host rock is more recognizably andesitic with sulphide veinlets, CuCov typically ranges from 0.5 to 5.0% CuCov, but the overall copper grade distribution is more influenced by enargite which has relatively steep dipping continuity. The geometry of the low-grade mineralization at depth is based on relatively few drillholes and is interpreted to have an irregular contact with the un-mineralized part of the lower andesite. Consequently, this part of the model is restricted to lower confidence inferred mineral resources.
SRK created 3D solid wireframes from selected sample intervals using a combination of the vein modelling tool and implicit techniques in Leapfrog Geo.
Copper in Enargite Domains
Copper in covellite domains which are used to control the estimation of CuCov and Au overprint copper in enargite domains which are used to control the estimation of CuEn and As. A high-grade copper in enargite domain has been modelled based on a visually evident step change in the CuEn grade at around 0.5% CuEn; this feature is located relatively centrally within the UZ deposit and shows relatively steeply dipping continuity. The advanced argillic altered lower andesite outside of this domain represents the low-grade copper in enargite, where the grade distribution is considered to be relatively isotropic.
| Various/RJM/PJD | Timok_PEA_NI43-101_Report_2CR021.006_20171130.docx | November 2017 |
| SRK Consulting | |
| Timok PEA NI 43-101 | Page 86 |
An example of a cross-section showing the mineralization domains in context of the modelled lithology, alteration and fault network is provided in Figure 13.2.
Statistical Analysis
Modelled domains were checked to ensure they formed appropriate sample populations for grade estimation, with the presence of any bimodal populations or high-grade histogram tails noted to ensure appropriate representation during block grade estimation.
An example of the raw sample grade distribution for CuCov and gold for the massive sulphide domain is illustrated in Figure 13.3 and Figure 13.4. Within this domain, CuCov grades typically reflect a mostly higher-grade middle third (associated with increased presence of massive sulphide) and lower grade top and bottom third, whilst gold grades tend to gradually increase from the west (at depth) towards the upper eastern margin, which is a reflection of the typical gold grade distribution throughout the Upper Zone.
Whilst SRK noted a degree of sample grade zonation in the CuCov, CuEn, gold and arsenic grade data within each of the modelled mineralization domains (as illustrated for CuCov and gold in the figures below), based on visual and statistical assessment SRK considers this to be largely gradational and therefore no further internal statistical grade domaining was deemed necessary.
| Various/RJM/PJD | Timok_PEA_NI43-101_Report_2CR021.006_20171130.docx | November 2017 |
| SRK Consulting | |
| Timok PEA NI 43-101 | Page 87 |
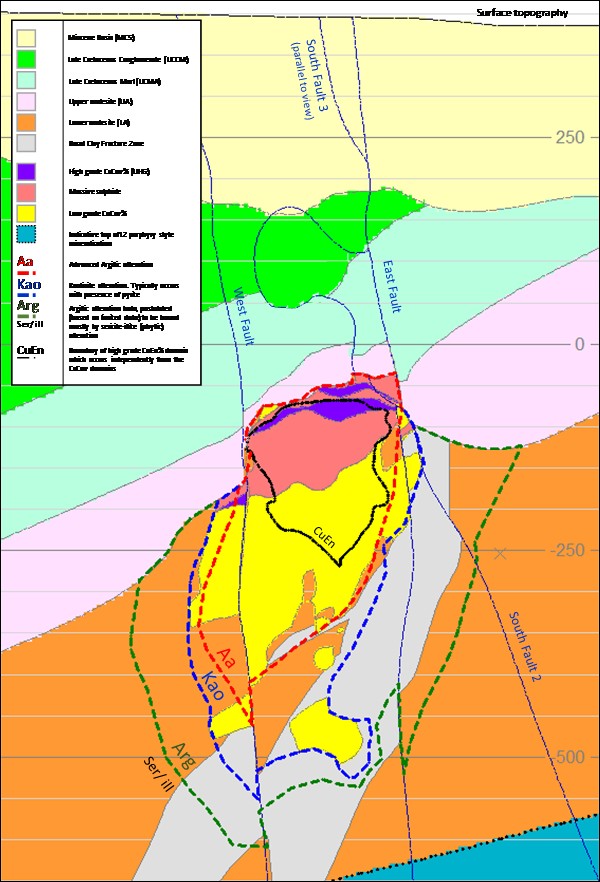
Source: SRK (UK), 2017
Figure 13.2: Schematic section of the Timok deposit looking northwest (azimuth 343º)
| Various/RJM/PJD | Timok_PEA_NI43-101_Report_2CR021.006_20171130.docx | November 2017 |
| SRK Consulting | |
| Timok PEA NI 43-101 | Page 88 |
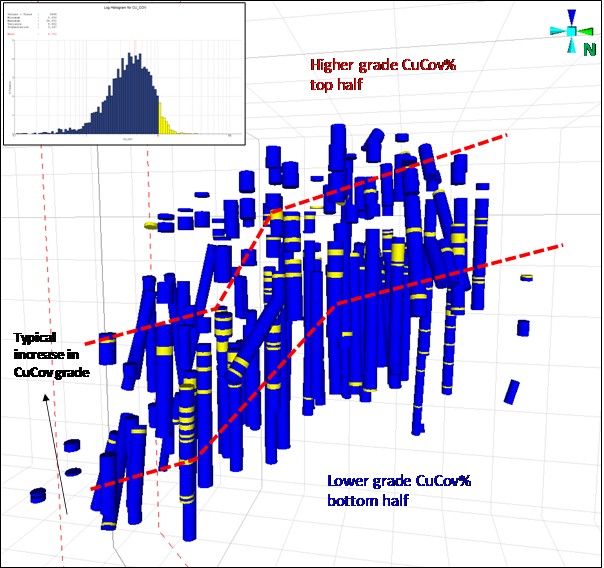
Note: 25 m grid looking east
Figure 13.3: 3D visual review and log histogram plot for CuCov for the massive sulphide domain samples
| Various/RJM/PJD | Timok_PEA_NI43-101_Report_2CR021.006_20171130.docx | November 2017 |
| SRK Consulting | |
| Timok PEA NI 43-101 | Page 89 |
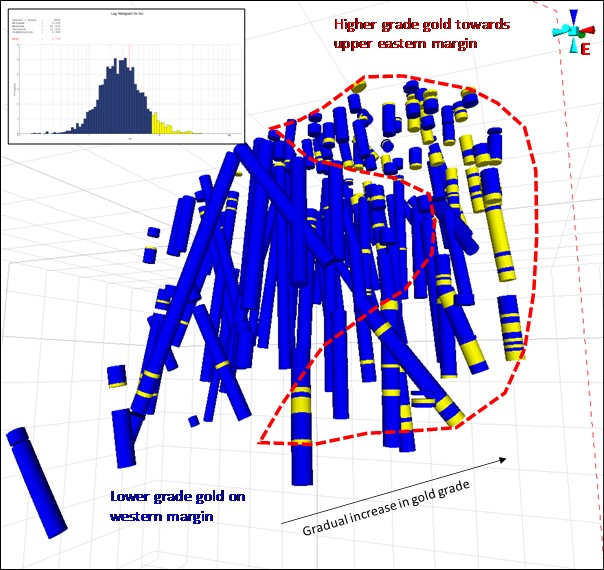
Note: 25-m grid looking northwest
Figure 13.4: 3D visual review and log histogram plot for gold for the massive sulphide domain samples
Mineralization Model Coding
A summary of the mineralization domains, the estimation domain codes and wireframe names for Čukaru Peki is provided in Table 13.1 and Figure 13.5 for the CuCov (CZONE) domains and Table 13.2 and Figure 13.6 for the CuEn (EZONE) domains.
Mineralization modelled for July 2017 shows a horizontal thickness of up to 250 m, with a vertical extent that ranges from 150 m to greater than 300 m.
| Various/RJM/PJD | Timok_PEA_NI43-101_Report_2CR021.006_20171130.docx | November 2017 |
| SRK Consulting | |
| Timok PEA NI 43-101 | Page 90 |
Table 13.1: Resource model CZONE (copper% in covellite mineralization, CuCov) codes
CZONE Domain Code and wireframe name | Mineralization Envelope Criteria/ Guide | Description |
101 - fb3_6_uhg1 | Advanced argillic alteration logging, within the lower andesite host unit | High grade copper in covellite ('UHG') domains |
102 - fb3_6_uhg2 |
103 - fb3_6_ms | Medium grade copper in covellite (massive sulphide) domain |
104 - fb3_6_lg_aa | Low grade copper in covellite domain (main fault block) |
202 - fb2_uhg | UHG domain located outside of the west fault |
203 - fb2_ms | Massive sulphide domain located outside of the west fault |
204 - fb2_lg_aa | Low grade covellite domain located outside of the west fault |
303 - fb7_ms | Massive sulphide domain located outside of the east fault |
304 - fb7_4_lg_aa | Low grade covellite domain located outside of the east fault |
404 - fb1_aa | Low grade covellite domain located outside of the south fault |
999 | Material outside of the advanced argillic alteration domain | Un-mineralized host rock |
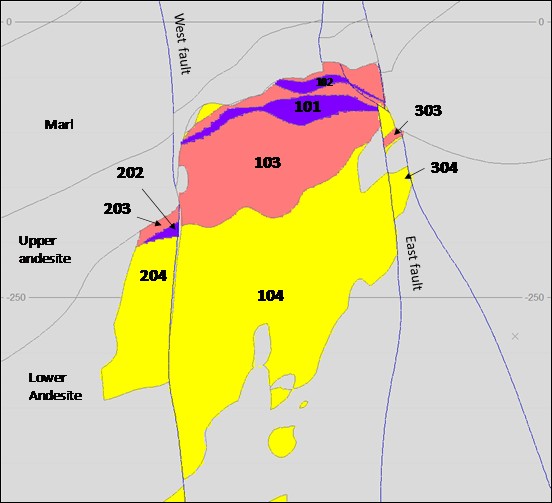
Note: 250 m grid looking northwest (azimuth 343º)
Figure 13.5: Resource model CZONE codes vs the mineralization and geology domains
| Various/RJM/PJD | Timok_PEA_NI43-101_Report_2CR021.006_20171130.docx | November 2017 |
| SRK Consulting | |
| Timok PEA NI 43-101 | Page 91 |
Table 13.2: Resource model EZONE (copper% in enargite mineralization, CuEn) codes
EZONE Domain Code | Mineralization Envelope Criteria/ Guide | Description |
111 - fb3_6_hg_enargite | Advanced argillic alteration logging, within the lower andesite host unit | High grade copper% in enargite (CuEn) domain |
112 – (outside 111) | Low grade CuEn domain (main fault block) |
212 – (outside 111) | Low grade CuEn domain located outside of the west fault |
312 – (outside 111) | Low grade CuEn domain located outside of the east fault |
412 – (outside 111) | Low grade CuEn domain located outside of the south fault |
999 | Material outside of the advanced argillic alteration domain | Un-mineralized host rock. This matches the CZONE 999 domain code. |
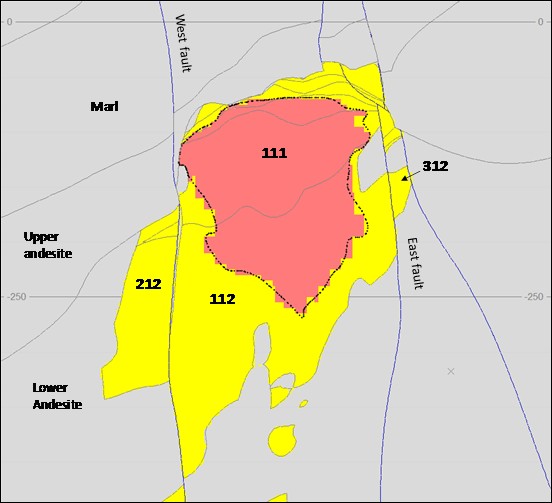
Note: 250 m grid looking northwest (azimuth 343º)
Figure 13.6: Resource model EZONE codes vs the mineralization and geology domains
| Various/RJM/PJD | Timok_PEA_NI43-101_Report_2CR021.006_20171130.docx | November 2017 |
| SRK Consulting | |
| Timok PEA NI 43-101 | Page 92 |
13.6 Compositing
The mean length of the sample data is approximately to 1.2 m. For the UHG domains (CZONE 101, 102 and 202), given the visual observation of grade layering for CuCov and gold, SRK elected to create two-metre composites to ensure that the layering could be reflected during block grade estimation.
In the underlying, lower grade, CuCov domains (CZONE 103 to 104 and 203 to 404), given the broader-scale nature of grade zonation, SRK selected a 10-m composite, which provided a reasonable representation of grade trends, whilst retaining an appropriate number of samples for high confidence local grade estimation.
With regards to CuEn and arsenic, SRK created 10 m composites throughout modelled zones to reflect the grade variability at a visually representative scale.
13.7 Evaluation of Outliers
SRK has completed an analysis based on log probability plots, raw and log histograms to identify any very high-grade samples which might have disproportionate impacts on the local grade estimation.
Based on a review of histogram plots for each mineralization domain and visual assessment of sample support, high-grade capping was applied for gold in CZONEs 102, 103 and 203. SRK notes the following with regard to the applied capping:
• A high-grade cap for gold in domain CZONE 102 was applied at 55 g/t Au to prevent a single isolated high-grade sample composite (74 g/t Au) from overly influencing the domain volume.
• A high-grade cap for gold in domain CZONE 103 was applied at 10 g/t Au only to the isolated high-grade samples located west of X = 7591150; this high-grade cap does not apply to the well supported high-grade gold samples situated along the eastern deposit margin.
• A high-grade cap for gold in domain CZONE 203 was applied at 10 g/t Au to prevent a high grade drillhole intercept (within this poorly drilled fault-block domain) from overly influencing the domain volume.
Log histograms for gold showing selected high-grade capping limits and associated visual reviews are illustrated for domains 102 and 103 in Figure 13.7.
No high-grade capping was applied for CuCov, CuEn or arsenic.
| Various/RJM/PJD | Timok_PEA_NI43-101_Report_2CR021.006_20171130.docx | November 2017 |
| SRK Consulting | |
| Timok PEA NI 43-101 | Page 93 |
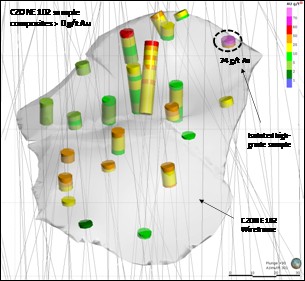
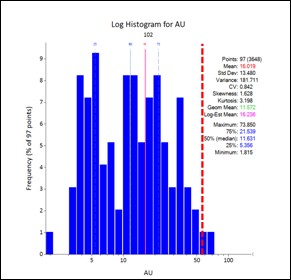
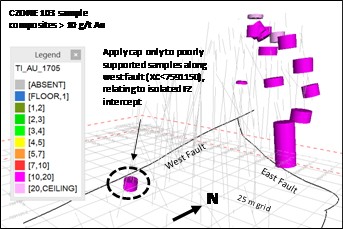
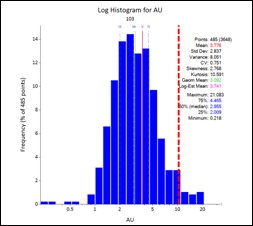
Note: Capping limits in red on histogram plots for CZONE’s 102 (top) and 203 (bottom)
Figure 13.7: High grade outlier review for gold showing selected capping limits
13.8 Statistical Analysis – Estimation Composites
Estimation composites for grade interpolation comprise the 2.0-m capped-composite samples for the UHG domains (CZONE101, 102 and 202) and 10.0-m capped-composite samples for all other estimation domains. A log histogram and log-probability plot is illustrated for CuCov composites in Figure 13.8.
Table 13.3 and Table 13.4 present sample summary statistics for each of the domains and grade variables. The selected capping limit and a comparison of the mean grades within each estimation domain based on the grade capping (where applied) is also presented.
With the exception of the poorly drilled CZONE 203 domain where few high gold grade samples skew the mean of the raw composite samples towards higher grade, the results show that the global reduction in the gold grade in capped zones is in the order of 1%, which SRK deems to be within acceptable margins.
| Various/RJM/PJD | Timok_PEA_NI43-101_Report_2CR021.006_20171130.docx | November 2017 |
| SRK Consulting | |
| Timok PEA NI 43-101 | Page 94 |
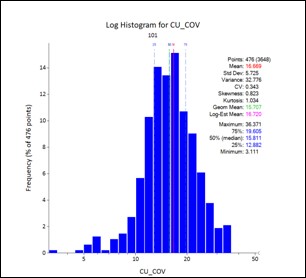
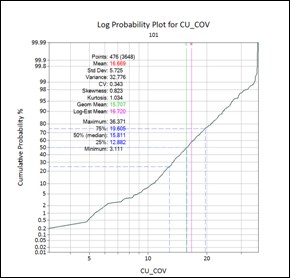
Figure 13.8: Log histogram and log probability plot for CuCov for the UHG CZONE 101 domain at Čukaru Peki
Table 13.3: Comparison of mean composite grades (raw composite versus capped) for CuCov% and gold g/t*
CZONE | Field | No. samples | Min | Max | Mean | Cap | Var | StdDev | COV | %DIFF |
101 | AU | 476 | 0.85 | 37.63 | 11.18 | - | 43.19 | 6.57 | 0.59 | - |
CU_COV | 476 | 3.11 | 36.37 | 16.67 | 32.71 | 5.72 | 0.34 |
102 | AU | 97 | 1.82 | 73.85 | 16.02 | 55.00 | 179.84 | 13.41 | 0.84 | -1.3% |
AUCAP | 97 | 1.82 | 55.00 | 15.82 | 160.38 | 12.66 | 0.80 |
CU_COV | 97 | 3.77 | 31.73 | 15.23 | - | 35.49 | 5.96 | 0.39 | - |
103 | AU | 485 | 0.22 | 21.08 | 3.78 | 10.00* | 8.03 | 2.83 | 0.75 | -0.3% |
AUCAP | 485 | 0.22 | 21.08 | 3.76 | 7.82 | 2.80 | 0.74 |
CU_COV | 485 | 0.29 | 12.95 | 4.68 | - | 5.02 | 2.24 | 0.48 | - |
104 | AU | 1019 | 0.01 | 12.90 | 1.21 | - | 1.75 | 1.32 | 1.09 | - |
CU_COV | 1019 | 0.00 | 6.91 | 1.41 | 1.09 | 1.05 | 0.74 |
202 | AU | 12 | 11.05 | 51.23 | 22.13 | - | 104.07 | 10.20 | 0.46 | - |
CU_COV | 12 | 14.07 | 27.96 | 20.41 | 17.04 | 4.13 | 0.20 |
203 | AU | 11 | 0.85 | 15.46 | 3.93 | 10.00 | 17.24 | 4.15 | 1.06 | -12.6% |
AUCAP | 11 | 0.85 | 10.00 | 3.44 | 8.27 | 2.88 | 0.84 |
CU_COV | 11 | 1.74 | 8.58 | 5.26 | - | 3.70 | 1.92 | 0.37 | - |
204 | AU | 101 | 0.03 | 1.59 | 0.41 | - | 0.09 | 0.29 | 0.71 | - |
CU_COV | 101 | 0.00 | 6.27 | 1.00 | 0.82 | 0.91 | 0.90 |
303 | AU | 15 | 0.33 | 10.11 | 5.20 | - | 10.35 | 3.22 | 0.62 | - |
CU_COV | 15 | 0.53 | 13.87 | 4.34 | 13.07 | 3.62 | 0.83 |
304 | AU | 65 | 0.18 | 12.07 | 1.73 | - | 6.71 | 2.59 | 1.50 | - |
CU_COV | 65 | 0.00 | 3.19 | 0.66 | 0.51 | 0.71 | 1.08 |
404 | AU | 1 | 3.93 | 3.93 | 3.93 | - | - | - | - | - |
CU_COV | 1 | 2.85 | 2.85 | 2.85 | - | - | - |
*The high-grade cap for gold in domain 103 is applied only to the isolated high-grade samples located west of X= 7591150. This high-grade cap does not apply to the well supported high-grade gold samples situated along the eastern deposit margin.
| Various/RJM/PJD | Timok_PEA_NI43-101_Report_2CR021.006_20171130.docx | November 2017 |
| SRK Consulting | |
| Timok PEA NI 43-101 | Page 95 |
Table 13.4: Comparison of mean composite grades (raw composite versus capped) for CuEn% and arsenic%
CZONE | Field | No. samples | Min | Max | Mean | Cap | Var | StdDev | COV | %DIFF |
111 | AS | 635 | 0.02 | 1.43 | 0.35 | - | 336 | 0.18 | 0.13 | - |
CU_EN | 635 | 0.04 | 3.64 | 0.90 | - | 0.2 | 0.47 | 0.13 | - |
112 | AS | 971 | 0.00 | 0.48 | 0.08 | - | 51.1 | 0.07 | 0.15 | - |
CU_EN | 971 | 0.00 | 1.23 | 0.22 | - | 0.03 | 0.18 | 0.15 | - |
212 | AS | 114 | 0.01 | 0.36 | 0.05 | - | 38.8 | 0.06 | 0.17 | - |
CU_EN | 114 | 0.01 | 0.92 | 0.13 | - | 0.03 | 0.16 | 0.17 | - |
312 | AS | 78 | 0.00 | 0.22 | 0.03 | - | 13.2 | 0.04 | 0.16 | - |
CU_EN | 78 | 0.01 | 0.56 | 0.08 | - | 0.01 | 0.09 | 0.16 | - |
412 | AS | 1 | 0.00 | 0.001 | 0.001 | - | - | - | - | - |
CU_EN | 1 | 0.00 | 0.002 | 0.002 | - | - | - | - | - |
13.9 Geostatistical Analysis
Variography is the study of the spatial variability of an attribute, in this case CuCov, CuEn gold and arsenic grade. Snowden’s Supervisor software was used for geostatistical analysis.
In completing the analysis for the mineralization domains, experimental semi-variograms were calculated in the along-strike, down-dip and across-strike orientations, with a short-lag variogram calculated to characterize the nugget effect.
With the exception of EZONE 112 for CuEn and arsenic, directional variograms were modelled for all mineralization domains. All variances were re-scaled for each mineralized zone to match the total variance (Var) for that zone.
As an example, the variogram model and parameters for the mineralization domain CZONE 103 for CuCov are shown in Table 13.5 and Figure 13.9.
Table 13.5: Summary of modelled semi-variogram parameters for the Čukaru Peki mineralization domain CZONE 103
Variogram Parameter | CZONE 103-CU_COV |
Co | 0.83 |
C1 | 2.97 |
A1 – Along Strike (m) | 37 |
A1 – Down Dip (m) | 32 |
A1 – Across Strike (m) | 23 |
C2 | 1.22 |
A2 – Along Strike (m) | 98 |
A2 – Down Dip (m) | 100 |
A2 – Across Strike (m) | 40 |
C3 | 0.00 |
A3 – Along Strike (m) | 0 |
A3 – Down Dip (m) | 0 |
A3 – Across Strike (m) | 0 |
Nugget Effect (%) | 17% |
| Various/RJM/PJD | Timok_PEA_NI43-101_Report_2CR021.006_20171130.docx | November 2017 |
| SRK Consulting | |
| Timok PEA NI 43-101 | Page 96 |
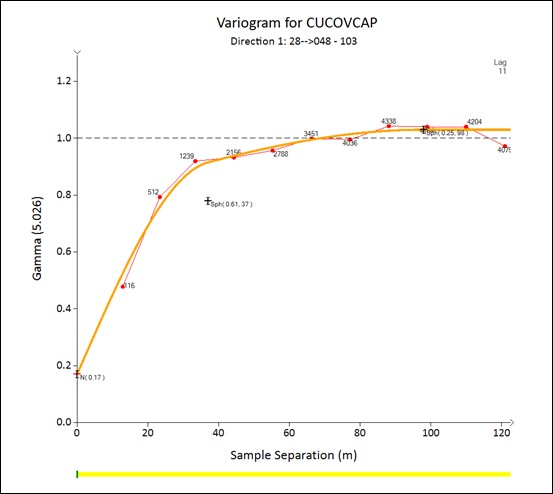
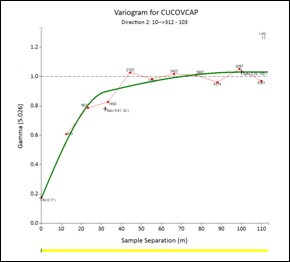
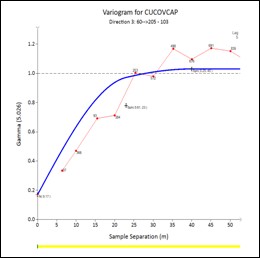
Figure 13.9: Variogram models for CuCov for domain CZONE 103 showing along strike (top), down dip (bottom left) and across strike (bottom right)
13.10 Block Model and Grade Estimation
A block model prototype was created for Čukaru Peki based on the Gauss-Krüger coordinate system. Block model parameters were chosen per domain to reflect the average drillhole spacing (along strike and on section) and to appropriately reflect the grade variability both horizontally and vertically.
| Various/RJM/PJD | Timok_PEA_NI43-101_Report_2CR021.006_20171130.docx | November 2017 |
| SRK Consulting | |
| Timok PEA NI 43-101 | Page 97 |
To improve the geometric representation of the geological model, sub-blocking was allowed along the boundaries to a minimum of 2 x 2 x 1 m (x, y, and z). A summary of the block model parameters for the UHG domains and underlying, lower grade CuCov domains are given in Table 13.6.
Table 13.6: Details of block model dimensions for grade estimation*
Model Domain | Dimension | Origin (UTM) | Block Size | Number of Blocks | Min Sub-blocking (m) |
CZONE 101-102 | X | 7590900 | 10 | 57 | 2 |
Y | 4875500 | 10 | 54 | 2 |
Z | -595 | 5 | 120 | 1 |
CZONE 103-304 | X | 7590900 | 25 | 23 | 2 |
Y | 4875500 | 25 | 22 | 2 |
Z | -595 | 20 | 30 | 1 |
After grade estimation, all model domains were re-blocked to 10 x 10 x 5 m using the block model framework shown for CZONE 101-102. Given the relatively broad scale of the CuEn wireframes, no sub-blocking was used (beyond the 10 x 10 x 5 m block size) to represent the internal boundary between the high and low grade (EZONE) domains.
13.11 Final Estimation Parameters
Ordinary kriging was used for the grade interpolation of CuCov, CuEn, gold and arsenic, with the sum of the CuCov and CuEn block grades used to derive total copper grade (Cu) %. Search ellipses were orientated to follow the trend of each domain with Datamine’s Dynamic Anisotropy used to control search ellipse orientation in the UHG and massive sulphide domain (CZONE 101 to 103). Domain boundaries have been treated as hard boundaries during the estimation process.
Inverse distance weighting was used for the interpolation of grade for the poorly drilled domains located outside of the main fault block (i.e. CZONE 202 to 304 and EZONE 212 to 412, given too few samples to define a variogram of sufficient clarity), the interpolation of total sulphur values (to derive density via regression) and for verification of the ordinary kriging estimates for CuCov, CuEn, gold and arsenic.
The selected estimation parameters have been verified based on the results of a quantitative kriging neighbourhood analysis, and are presented in Table 13.7 and Table 13.8.
| Various/RJM/PJD | Timok_PEA_NI43-101_Report_2CR021.006_20171130.docx | November 2017 |
| SRK Consulting | |
| Timok PEA NI 43-101 | Page 98 |
Table 13.7: Summary of final estimation parameters for Čukaru Peki CZONE domains
Estimation Parameters | Description |
KZONE | 101, 102 | 103 | 104 | 104 | 202 | 203,303,204 | 304*,404 | Kriging zone for estimation |
FIELD | CU_COV, AUCAP | CU_COV | AUCAP | CU_COV, AUCAP | Field for interpolation |
SREFNUM | 1,2 | 3,8 | 4 | 5 | 6 | 7 | 9,10 | Search reference number |
SMETHOD | 2 | 2 | 2 | 2 | 2 | 2 | 2 | Search volume shape (2 = ellipse) |
SDIST1 | 30 | 55 | 65 | 45 | 45 | 45 | 45 | Search distance 1 (dip) |
SDIST2 | 30 | 55 | 40 | 45 | 45 | 45 | 45 | Search distance 2 (strike) |
SDIST3 | 10 | 20 | 40 | 45 | 45 | 45 | 45 | Search distance 3 (across strike) |
SANGLE1 | 0 | 0 | -20 | 0 | 0 | 0 | 0 | Search angle 1 (dip direction) |
SANGLE2 | 0 | 0 | 50 | 0 | 0 | 0 | 0 | Search angle 2 (dip) |
SANGLE3 | 0 | 0 | 90 | 0 | 0 | 0 | 0 | Search angle 3 (plunge) |
SAXIS1 | 3 | 3 | 3 | 3 | 3 | 3 | 3 | Search axis 1 (z) |
SAXIS2 | 1 | 1 | 1 | 1 | 1 | 1 | 1 | Search axis 2 (x) |
SAXIS3 | 3 | 3 | 3 | 3 | 3 | 3 | 3 | Search axis 3 (z) |
MINNUM1 | 9 | 12 | 12 | 12 | 10 | 4 | 4 | Minimum sample number (SVOL1) |
MAXNUM1 | 30 | 40 | 36 | 36 | 30 | 16 | 16 | Maximum sample number (SVOL1) |
SVOLFAC2 | 2 | 2 | 2 | 2 | 2 | 2 | 2 | Search distance expansion (SVOL2) |
MINNUM2 | 9 | 12 | 12 | 12 | 10 | 4 | 4 | Minimum sample number (SVOL2) |
MAXNUM2 | 30 | 40 | 36 | 36 | 30 | 16 | 16 | Maximum sample number (SVOL2) |
SVOLFAC3 | 3 | 3 | 3 | 3 | 3 | 3 | 3 | Search distance expansion (SVOL3) |
MINNUM3 | 3 | 4 | 2 | 2 | 2 | 2 | 1 | Minimum sample number (SVOL3) |
MAXNUM3 | 30 | 40 | 36 | 36 | 30 | 16 | 16 | Maximum sample number (SVOL3) |
MAXKEY | 3 | 4 | 0 | 0 | 0 | 0 | 0 | Maximum no. of samples per drillhole |
SANGL1_F | TRDIPDIR | TRDIPDIR | 0 | 0 | 0 | 0 | 0 | Dynamic Anisotropy ("0" = not used) |
SANGL2_F | TRDIP | TRDIP | 0 | 0 | 0 | 0 | 0 |
Table 13.8: Summary of final estimation parameters for Čukaru Peki EZONE domains
Estimation Parameters | Description |
KZONE | 111 | 112 | 212 | 312 | 412 | Kriging zone for estimation |
FIELD | CU_EN, AS | Field for interpolation |
SREFNUM | 1 | 2 | 3 | 5 | 4 | Search reference number |
SMETHOD | 2 | 2 | 2 | 2 | 2 | Search volume shape (2 = ellipse) |
SDIST1 | 65 | 45 | 45 | 45 | 45 | Search distance 1 (dip) |
SDIST2 | 40 | 45 | 45 | 45 | 45 | Search distance 2 (strike) |
SDIST3 | 40 | 45 | 45 | 45 | 45 | Search distance 3 (across strike) |
SANGLE1 | -155 | 0 | 0 | 0 | 0 | Search angle 1 (dip direction) |
SANGLE2 | 120 | 0 | 0 | 0 | 0 | Search angle 2 (dip) |
SANGLE3 | 100 | 0 | 0 | 0 | 0 | Search angle 3 (plunge) |
SAXIS1 | 3 | 3 | 3 | 3 | 3 | Search axis 1 (z) |
SAXIS2 | 1 | 1 | 1 | 1 | 1 | Search axis 2 (x) |
SAXIS3 | 3 | 3 | 3 | 3 | 3 | Search axis 3 (z) |
MINNUM1 | 12 | 12 | 4 | 4 | 4 | Minimum sample number (SVOL1) |
MAXNUM1 | 36 | 36 | 16 | 16 | 16 | Maximum sample number (SVOL1) |
SVOLFAC2 | 2 | 2 | 2 | 2 | 2 | Search distance expansion (SVOL2) |
MINNUM2 | 12 | 12 | 4 | 4 | 4 | Minimum sample number (SVOL2) |
MAXNUM2 | 36 | 36 | 16 | 16 | 16 | Maximum sample number (SVOL2) |
SVOLFAC3 | 3 | 3 | 3 | 4 | 3 | Search distance expansion (SVOL3) |
MINNUM3 | 2 | 2 | 2 | 2 | 1 | Minimum sample number (SVOL3) |
MAXNUM3 | 36 | 36 | 16 | 16 | 16 | Maximum sample number (SVOL3) |
MAXKEY | 0 | 0 | 0 | 0 | 0 | Maximum number of samples per drillhole |
SANGL1_F | TRDIPDIR | 0 | 0 | 0 | 0 | Dynamic Anisotropy ("0" = not used) |
SANGL2_F | TRDIP | 0 | 0 | 0 | 0 |
13.12 Model Validation and Sensitivity
13.12.1 Sensitivity Analysis
Grade estimation was verified through a quantitative kriging neighbourhood analysis exercise which was based on varying kriging parameters for CuCov (i.e. number of samples and search ellipse size) to test a number of different scenarios. This focused on the UHG (CZONE 101) and massive sulphide (CZONE 103) domains given their significant contributions to copper metal (20% and 35% respectively) in the resource model.
| Various/RJM/PJD | Timok_PEA_NI43-101_Report_2CR021.006_20171130.docx | November 2017 |
| SRK Consulting | |
| Timok PEA NI 43-101 | Page 99 |
In general, these domains are relatively insensitive to changes in the estimation parameters. SRK noted, however, that block grades (visually) better reflected the sample variability by restricting the search ellipse dimension and maximum number of composites per drillhole to within reasonable limits. The final parameters were selected to ensure that the CuCov grade layering and zonation interpreted to exist in the deposit were appropriately reflected in block grade estimates.
13.12.2 Block Model Validation
SRK has validated the block model using the following techniques:
• visual inspection of block grades in comparison with drillhole data
• sectional validation of the mean samples grades in comparison to the mean model grades
• comparison of block model statistics using ordinary kriging and inverse distance weighting grade estimates
Visual Validation
Visual validation provides a comparison of the interpolated block model on a local scale. A thorough visual inspection has been undertaken in section and 3D, comparing the sample grades with the block grades, which demonstrates in general good comparison between local block estimates and nearby samples, without excessive smoothing in the block model. Figure 13.10 to Figure 13.13 show examples of the visual validation checks and highlight the overall block grades corresponding with composite sample grades for CuCov, CuEn, total copper, gold and arsenic.
| Various/RJM/PJD | Timok_PEA_NI43-101_Report_2CR021.006_20171130.docx | November 2017 |
| SRK Consulting | |
| Timok PEA NI 43-101 | Page 100 |
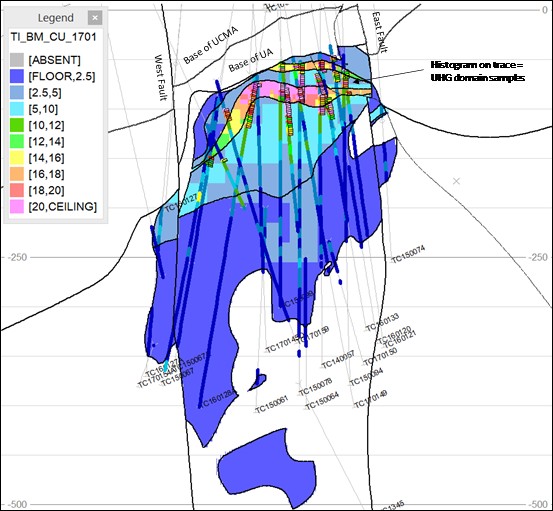
Figure 13.10: Čukaru Peki block model CuCov (%) grade distribution looking northwest
| Various/RJM/PJD | Timok_PEA_NI43-101_Report_2CR021.006_20171130.docx | November 2017 |
| SRK Consulting | |
| Timok PEA NI 43-101 | Page 101 |
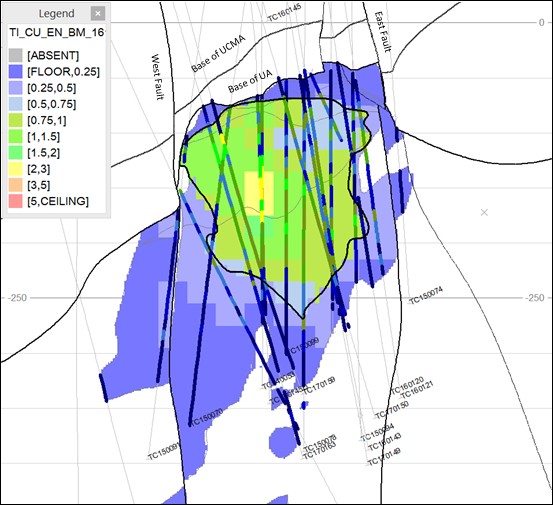
Figure 13.11: Čukaru Peki block model CuEn (%) grade distribution looking northwest
| Various/RJM/PJD | Timok_PEA_NI43-101_Report_2CR021.006_20171130.docx | November 2017 |
| SRK Consulting | |
| Timok PEA NI 43-101 | Page 102 |
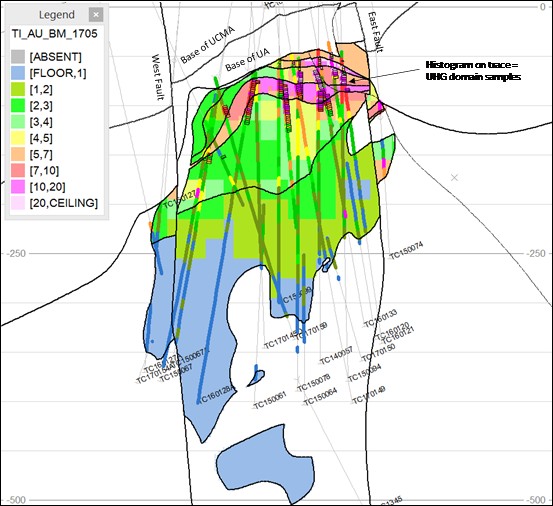
Figure 13.12: Čukaru Peki block model gold (g/t) grade distribution looking northwest
| Various/RJM/PJD | Timok_PEA_NI43-101_Report_2CR021.006_20171130.docx | November 2017 |
| SRK Consulting | |
| Timok PEA NI 43-101 | Page 103 |
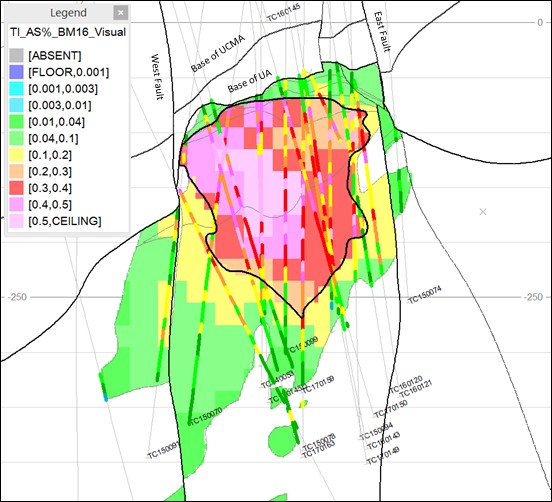
Source:
Figure 13.13: Čukaru Peki block model arsenic (ppm) grade distribution looking northwest
Sectional Validation
As part of the validation process, the input composite samples are compared to the block model grades within a series of coordinates (based on the principle directions). The results of which are then displayed on charts to check for visual discrepancies between grades. Figure 13.14 shows the results for the copper grades for the UHG domain CZONE 101 based on section lines cut along y-coordinates.
The resultant plots show a reasonable correlation between the block model grades and the composite grades, with the block model showing a typically smoothed profile of the composite grades as expected. SRK notes that in less densely sampled areas, minor grade discrepancies do exist on a local scale. Overall, however, SRK is confident that the interpolated grades reflect the available input sample data and the estimate shows no sign of material bias.
| Various/RJM/PJD | Timok_PEA_NI43-101_Report_2CR021.006_20171130.docx | November 2017 |
| SRK Consulting | |
| Timok PEA NI 43-101 | Page 104 |
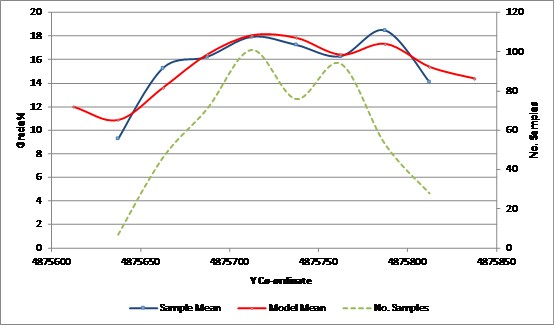
Source: SRK (UK), 2017
Figure 13.14: Validation plot (Northing) showing block model estimates versus sample mean (25 m Intervals) for UHG domain CZONE 101 for CuCov
Statistical Validation
The block estimates have been compared to the mean of the composite samples (Table 13.9 and Table 13.10) which indicate the overall percentage difference in the mean grades typically vary between 1% and 10%, which SRK deems to be within acceptable levels.
SRK notes larger percentage differences in the means for domains CZONE 104, 204 and 303 to 304 and EZONE 312, which are less well drilled and have irregular sample coverage. As a result, the sample mean is skewed by relatively few high / low grade samples.
Based on the visual, sectional and statistical validation results, SRK considers the grades in the block model to be well estimated overall, with variable confidence in some areas.
| Various/RJM/PJD | Timok_PEA_NI43-101_Report_2CR021.006_20171130.docx | November 2017 |
| SRK Consulting | |
| Timok PEA NI 43-101 | Page 105 |
Table 13.9: Summary block statistics for ordinary kriging (OK) and inverse distance weighting (IDW) estimation methods for CuCov% and gold g/t
CZONE | Field | Estimation Method | Block Estimate Mean | Composite Mean | % Difference | Absolute Difference |
101 | AU | OK | 10.75 | 11.18 | -4% | -0.43 |
AU | IDW | 10.77 | 11.18 | -4% | -0.40 |
CUCOV | OK | 16.46 | 16.67 | -1% | -0.21 |
CUCOV | IDW | 16.43 | 16.67 | -1% | -0.24 |
102 | AU | OK | 15.06 | 15.82 | -5% | -0.75 |
AU | IDW | 15.22 | 15.82 | -4% | -0.59 |
CUCOV | OK | 15.02 | 15.23 | -1% | -0.21 |
CUCOV | IDW | 15.12 | 15.23 | -1% | -0.11 |
103 | AU | OK | 3.54 | 3.76 | -6% | -0.22 |
AU | IDW | 3.50 | 3.76 | -7% | -0.26 |
CUCOV | OK | 4.68 | 4.68 | 0% | 0.01 |
CUCOV | IDW | 4.63 | 4.68 | -1% | -0.04 |
104 | AU | OK | 0.90 | 1.21 | -25% | -0.31 |
AU | IDW | 0.91 | 1.21 | -25% | -0.30 |
CUCOV | OK | 1.23 | 1.41 | -12% | -0.17 |
CUCOV | IDW | 1.25 | 1.41 | -11% | -0.15 |
202 | AU | IDW | 22.20 | 22.13 | 0% | 0.08 |
CUCOV | IDW | 20.44 | 20.41 | 0% | 0.03 |
203 | AU | IDW | 3.23 | 3.44 | -6% | -0.21 |
CUCOV | IDW | 5.27 | 5.26 | 0% | 0.01 |
204 | AU | IDW | 0.36 | 0.41 | -12% | -0.05 |
CUCOV | IDW | 0.84 | 1.00 | -16% | -0.16 |
303 | AU | IDW | 5.91 | 5.20 | 14% | 0.71 |
CUCOV | IDW | 4.76 | 4.34 | 9% | 0.41 |
304 | AU | IDW | 0.77 | 1.73 | -55% | -0.96 |
CUCOV | IDW | 0.52 | 0.66 | -22% | -0.14 |
404 | AU | IDW | 3.93 | 3.93 | 0% | 0.00 |
CUCOV | IDW | 2.85 | 2.85 | 0% | 0.00 |
Table 13.10: Summary block statistics for ordinary kriging and inverse distance weighting estimation methods for CuEn% and arsenic%
EZONE | Field | Estimation Method | Block Estimate Mean | Composite Mean | % Difference | Absolute Difference |
111 | AS | OK | 0.36 | 0.35 | 3% | 0.01 |
AS | IDW | 0.39 | 0.35 | 10% | 0.04 |
CUEN | OK | 0.92 | 0.90 | 2% | 0.02 |
CUEN | IDW | 0.99 | 0.90 | 10% | 0.09 |
112 | AS | OK | 0.08 | 0.08 | -1% | 0.00 |
AS | IDW | 0.08 | 0.08 | -8% | -0.01 |
CUEN | OK | 0.21 | 0.22 | -1% | 0.00 |
CUEN | IDW | 0.20 | 0.22 | -8% | -0.02 |
212 | AS | OK | 0.05 | 0.05 | -8% | 0.00 |
CUEN | OK | 0.12 | 0.13 | -8% | -0.01 |
312 | AS | OK | 0.02 | 0.03 | -38% | -0.01 |
CUEN | OK | 0.05 | 0.08 | -38% | -0.03 |
412 | AS | IDW | 0.00 | 0.00 | 0% | 0.00 |
CUEN | IDW | 0.002 | 0.002 | 0% | 0.00 |
| Various/RJM/PJD | Timok_PEA_NI43-101_Report_2CR021.006_20171130.docx | November 2017 |
| SRK Consulting | |
| Timok PEA NI 43-101 | Page 106 |
13.13 Mineral Resource Classification
Block model tonnage and grade estimates for the Čukaru Peki (UZ) deposit were classified according to the CIM Definition Standards.
Mineral resource classification is typically a subjective concept, industry best practice requires that resource classification should consider both the confidence in the geological continuity of the mineralized structures, the quality and quantity of exploration data supporting the estimates and the confidence in the tonnage and grade estimates. Classification should integrate both concepts to delineate regular areas of similar confidence.
Data quality, geological confidence, sample spacing and the interpreted continuity of grades controlled by the deposit have allowed SRK to classify the block model in the measured, indicated and inferred mineral resource categories. The following guidelines apply to SRK’s classification:
Measured
Measured mineral resources are where block grades are estimated from multiple drillhole intercepts on an approximate 25-m spacing and where there is good continuity shown by both assay grades and geological wireframes. For each of these zones SRK has ‘measured’ confidence in the average grade, tonnes and grade distribution in volumes that are relevant for detailed mine planning.
Indicated
Indicated mineral resources are where block grades are estimated from multiple drillhole intercepts spaced typically at less than 50 m and where there is reasonable continuity shown by both assay grades and geological wireframes. In these volumes SRK has reasonable to good confidence in the suitability for long-term mine planning.
Inferred
Inferred mineral resources are where there is reasonable to low confidence in geometry, geological continuity and block grade estimates due to blocks being typically within 100 m of sample data. These areas require infill drilling to improve the quality of the geological interpretation and local block grade estimation before they can be used for long-term mine planning. SRK considers there to be a reasonable expectation that infill drilling in the inferred mineral resource areas will result in indicated mineral resources.
An example of SRK’s mineral resource classification for the Čukaru Peki (UZ) deposit is shown in Figure 13.15.
| Various/RJM/PJD | Timok_PEA_NI43-101_Report_2CR021.006_20171130.docx | November 2017 |
| SRK Consulting | |
| Timok PEA NI 43-101 | Page 107 |
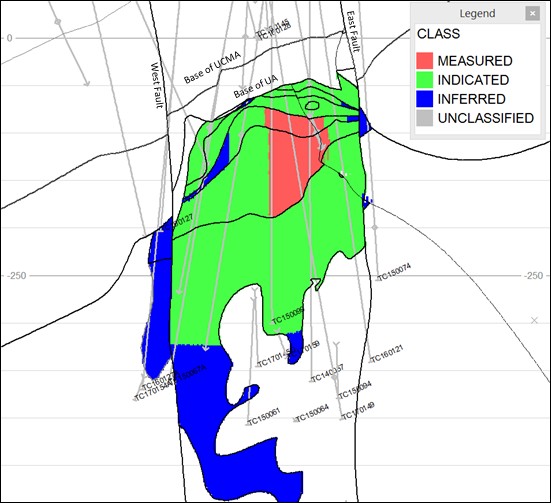
Figure 13.15: Cross-section showing SRK’s wireframe-defined mineral resource classification for the Timok deposit, view north-northwest
13.14 Mineral Resource Statement
CIM Definition Standards for Mineral Resources and Mineral Reserves (May 2014) defines a mineral resource as a:
“concentration or occurrence of solid material of economic interest in or on the Earth’s crust in such form, grade or quality and quantity that there are reasonable prospects for eventual economic extraction. The location, quantity, grade or quality, continuity and other geological characteristics of a mineral resource are known, estimated or interpreted from specific geological evidence and knowledge, including sampling”.
The “reasonable prospects for eventual economic extraction” requirement generally implies that the quantity and grade estimates meet certain economic thresholds and that the Mineral Resources are reported at an appropriate cut-off grade taking into account likely extraction scenarios and processing recoveries.
SRK (UK) has applied basic economic considerations developed for the PEA to restrict the mineral resource to material that has reasonable prospects for economic extraction by underground mining methods.
| Various/RJM/PJD | Timok_PEA_NI43-101_Report_2CR021.006_20171130.docx | November 2017 |
| SRK Consulting | |
| Timok PEA NI 43-101 | Page 108 |
The mineral resource has been reported using a resource net smelter return (RscNSR) cut off value based on copper, gold and arsenic, using a copper price of $3.49/lb and gold price of $1,565/oz, derived from long-term consensus forecasts with a 20% uplift as appropriate for assessing eventual economic potential of mineral resources. Assumed technical and economic parameters selected were based on the results of the PEA study.
SRK (UK) considers that the blocks with a RscNSR value greater than an operating cost of $35/t (as described in Section 14.1) have “reasonable prospects for eventual economic extraction” and can be reported as a mineral resource. SRK (UK) has determined a level in the block model (-445 mRL), based on a five-metre vertical block increment review, below which the RscNSR falls short of covering this cost. The reported mineral resource comprises all material above this elevation within the geological model, thus excluding isolated blocks with >$35/t RscNSR situated below -445 mRL.
The mineral resource statement for the Čukaru Peki (UZ) deposit is shown in Table 13.11; subtotals are given based on geological domains.
Table 13.11: SRK mineral resource statement as at 24 April 2017 for the Upper Zone of the Timok deposit
Category | Resource Domain | Tonnes Mt | Grade | Metal | |
% Cu | g/t Au | % As | Cu Mt | Au Moz | | |
Measured | UHG | 0.44 | 18.7 | 11.70 | 0.29 | 0.082 | 0.17 | | |
Massive Sulphide | 1.70 | 6 | 4.10 | 0.29 | 0.1 | 0.23 | | |
Indicated | UHG | 0.95 | 17.1 | 11.80 | 0.24 | 0.16 | 0.36 | | |
Massive Sulphide | 6.70 | 5.2 | 3.40 | 0.25 | 0.35 | 0.73 | | |
Low grade covellite | 19.00 | 1.9 | 1.10 | 0.17 | 0.36 | 0.70 | | |
Measured and Indicated | UHG | 1.40 | 17.6 | 11.80 | 0.26 | 0.24 | 0.52 | | |
Massive Sulphide | 8.40 | 5.4 | 3.60 | 0.26 | 0.45 | 0.96 | | |
Low grade covellite | 19.00 | 1.9 | 1.10 | 0.17 | 0.36 | 0.70 | | |
Inferred | UHG | 0.45 | 15 | 10.80 | 0.16 | 0.07 | 0.16 | | |
Massive Sulphide | 0.80 | 4.9 | 3.40 | 0.11 | 0.04 | 0.09 | | |
Low grade covellite | 12.70 | 1 | 0.44 | 0.05 | 0.12 | 0.18 | | |
Total-Measured | 2.20 | 8.6 | 5.70 | 0.29 | 0.40 | 0.190 | | |
Total-Indicated | 26.60 | 3.3 | 2.10 | 0.20 | 1.80 | 0.870 | | |
Total-Measured and Indicated | 28.70 | 3.7 | 2.40 | 0.20 | 2.20 | 1.050 | | |
Total-Inferred | 13.90 | 1.6 | 0.90 | 0.06 | 0.42 | 0.230 | | |
1. The RscNSR value used to report the estimate is $35/t.
2. All figures are rounded to reflect the relative accuracy of the estimate.
3. Mineral resources are not mineral reserves and do not have demonstrated economic viability.
4. The Mineral Resource is reported on 100% basis, attributable to Rakita Exploration d.o.o.
13.15 RscNSR Cut-off Sensitivity Analysis
The results of RscNSR cut-off sensitivity analysis completed for Čukaru Peki are shown in Table 13.12 and Table 13.13.
This is to show the continuity of the grade estimates at various cut-off increments and the sensitivity of the mineral resource to changes in RscNSR cut-off. The tonnages and grades in these tables, however, should not be interpreted as mineral resources.
| Various/RJM/PJD | Timok_PEA_NI43-101_Report_2CR021.006_20171130.docx | November 2017 |
| SRK Consulting | |
| Timok PEA NI 43-101 | Page 109 |
Table 13.12: Gradations for measured and indicated material at Čukaru Peki at various RscNSR cut-off grades
Grade - Tonnage Table, Čukaru Peki, Measured and Indicated |
Cut-off RscNSR ($/t) | Reporting Elevation (m RL) | Tonnes Mt | | Grade | Metal |
% Cu | g/t Au | % As | Cu Mt | Au Moz |
105.00 | -235.00 | 18.3 | 4.9 | 3.3 | 0.23 | 0.89 | 1.96 |
95.00 | -255.00 | 20.4 | 4.6 | 3.1 | 0.22 | 0.93 | 2.03 |
85.00 | -275.00 | 22.3 | 4.3 | 2.9 | 0.22 | 0.96 | 2.08 |
75.00 | -295.00 | 23.9 | 4.1 | 2.7 | 0.22 | 0.99 | 2.11 |
65.00 | -315.00 | 25.3 | 4.0 | 2.6 | 0.21 | 1.01 | 2.13 |
55.00 | -415.00 | 28.7 | 3.7 | 2.4 | 0.20 | 1.05 | 2.18 |
45.00 | -435.00 | 28.7 | 3.7 | 2.4 | 0.20 | 1.05 | 2.18 |
35.00 | -455.00 | 28.7 | 3.7 | 2.4 | 0.20 | 1.05 | 2.18 |
25.00 | -475.00 | 28.7 | 3.7 | 2.4 | 0.20 | 1.05 | 2.18 |
15.00 | -520.00 | 28.7 | 3.7 | 2.4 | 0.20 | 1.05 | 2.18 |
| | | | | | | | |
Table 13.13: Gradations for inferred material at Čukaru Peki at various RscNSR cut-off grades
Grade - Tonnage Table, Čukaru Peki, Inferred |
Cut-off RscNSR | Reporting Elevation (m RL) | Tonnes Mt | | Grade | Contained Metal |
% Cu | g/t Au | % As | Cu Mt | Au Moz |
105.00 | -235.00 | 3.4 | 3.9 | 2.8 | 0.09 | 0.13 | 0.31 |
95.00 | -255.00 | 4.3 | 3.3 | 2.3 | 0.08 | 0.14 | 0.32 |
85.00 | -275.00 | 5.2 | 3.0 | 2.0 | 0.08 | 0.15 | 0.34 |
75.00 | -295.00 | 6.1 | 2.7 | 1.8 | 0.08 | 0.16 | 0.35 |
65.00 | -315.00 | 6.9 | 2.5 | 1.6 | 0.07 | 0.17 | 0.36 |
55.00 | -415.00 | 11.5 | 1.8 | 1.1 | 0.06 | 0.21 | 0.41 |
45.00 | -435.00 | 12.7 | 1.7 | 1.0 | 0.06 | 0.22 | 0.42 |
35.00 | -455.00 | 13.9 | 1.6 | 0.9 | 0.06 | 0.23 | 0.42 |
25.00 | -475.00 | 15.2 | 1.5 | 0.9 | 0.06 | 0.24 | 0.43 |
15.00 | -520.00 | 16.1 | 1.5 | 0.8 | 0.06 | 0.24 | 0.43 |
| | | | | | | | |
13.16 Comparison to Previous Mineral Resource Estimates
The updated mineral resource estimate represents a significant increase in metal content within the Indicated category for copper from 0.2 to 0.9 Mt and gold from 0.6 to 1.8 Moz which is primarily due to additional geological confidence provided by infill drilling which has allowed a significant portion of the Inferred resource to be upgraded to Indicated. In addition, SRK has upgraded 2.2 Mt at a grade of 8.6% copper and 5.7 g/t gold to the Measured category.
Within the Inferred category, in comparison to the previous (March 2016) mineral resource, which was reported at a cut-off grade of 0.75% copper, the updated Inferred mineral resource estimate (reported above an RscNSR cut-off of $35/t) represents a decrease in metal content, from 1.0 to 0.2 Mt for copper and from 1.9 to 0.4 Moz for gold. The change in contained metal within the Inferred category is the result of 60% reduction in tonnage and approximately 45% (relative) decrease in copper and gold grade mainly due to the material upgraded to Measured and Indicated and partly due to the change in deposit geometry at the margins and at depth.
| Various/RJM/PJD | Timok_PEA_NI43-101_Report_2CR021.006_20171130.docx | November 2017 |
| SRK Consulting | |
| Timok PEA NI 43-101 | Page 110 |
SRK considers that the key changes in the mineral resource result from a combination of the following factors:
• Metal converted to measured and indicated resources, primarily due to new infill drilling confirming the continuity of the geology and mineralization, typical grade distribution and average grades within better drilled areas of the deposit
• Reduction in geological continuity outside of interpreted fault boundaries; this impacts on the margins of the highest-grade mineralization
• Refinement from infill drilling to the distribution of medium to high grade layering within parts of the massive sulphide domain
• Change in the cut-off approach from using copper grade to RscNSR value (and elevation limit) which has added low grade material at depth
In addition, the Lower Volcano-sedimentary Breccia domain postulated in the previous model has been re-interpreted based on new drilling information. Instead, low grade CuCov mineralization continues to depth, constrained by more competent, un-mineralized andesite.
13.17 Exploration Potential
The full extents of Čukaru Peki mineralization have now been relatively well defined; however, there is good potential for discovery of additional zones of HS (and associated porphyry style) mineralization proximal and along trend from the current deposit. This potential is highlighted by the similarities with the Bor deposit camp (some 10 km to the north), where there are numerous clusters of discrete HS and porphyry-style mineralized bodies clustered within an approximately three-kilometre long area.
The favourable Bor geological and metallogenic trend continues into the Brestovać-Metovnica permit area (86 km2) shown in Figure 6.4 which is dominated by the same prospective Upper Cretaceous Phase 1 (‘Lower’) andesite volcanic unit (exposed and continuing below the Miocene cover) and controlling structures (north-northwest and east-west intersecting cross structures) associated with Timok and the wider Bor district deposits, which have yet to be fully explored. The permit is therefore considered to have good potential for discovery of additional HS bodies and porphyry mineralization.
SRK and Rakita also note the potential upside of the underlying lower grade porphyry style mineralization in the Lower Zone, for which Nevsun has a 60.4% ownership in joint venture with Freeport. Whilst the Lower Zone has been excluded from the mineral resource database to reflect Rakita’s current focus on the Upper Zone, previously reported drilling intervals typically have grades of 0.5% CuEq to 1.0% CuEq over several hundreds of metres, at depths typically greater than 900 m. The lateral and vertical extent of the porphyry remains to be fully defined.
Although the permit area has been covered by geophysical surveys (CSAMT, IP/resistivity and locally one line of seismic), geological mapping and geochemical sampling, there has been limited drilling completed outside of the immediate Čukaru Peki (UZ) deposit area. Further evidence for permit potential is highlighted by the discovery of epithermal gold and base metal intermediate sulphidation mineralization systems found in historic Rakita drilling at Brestovać proximal to the Bor Fault, some two kilometres west of Čukaru Peki.
| Various/RJM/PJD | Timok_PEA_NI43-101_Report_2CR021.006_20171130.docx | November 2017 |
| SRK Consulting | |
| Timok PEA NI 43-101 | Page 111 |
More recently (2013), Rakita has also observed intersections of HS advanced argillic alteration (quartz-alunite-pyrite) with copper (and gold) mineralization, quartz-illite pyrite alteration and locally lead-zinc mineralization in three holes approximately 2.5 km south of Čukaru Peki which may indicate proximity to another hydrothermal system or centre.
| Various/RJM/PJD | Timok_PEA_NI43-101_Report_2CR021.006_20171130.docx | November 2017 |
| SRK Consulting | |
| Timok PEA NI 43-101 | Page 112 |
14 Mineral Reserve Estimates
Mineral resources that are not mineral reserves do not have demonstrated economic viability. There is no certainty that all or any part of the mineral resources would be converted into mineral reserves. Mineral reserves can only be estimated as a result of an economic evaluation as part of a preliminary feasibility study or a feasibility study of a mineral project. Accordingly, at the present level of study (PEA), there are no mineral reserves for the Timok project.
However, herein is provided the methodology for determination of economic limits for the purpose of mine planning.
14.1 Cut-off Analysis
In order to determine whether a tonne of mineral resource is worth extracting, the value of that material (on NSR basis) must be able to pay for the cost of mining and processing that material plus any overhead (i.e. general site and administration [G&A] costs). SRK, together with Nevsun, reviewed potential costs of mining, with caving mining methods in mind. The range of considered costs are provided in Table 14.1.
Table 14.1: Potential project operating costs, $/t
Component | Upside | Base | Downside |
Processing | $10.15 | $10.15 | $10.15 |
G&A | $6.30 | $6.30 | $6.30 |
Mining | $15.00 | $20.00 | $25.00 |
Total | $31.45 | 36.45 | $41.45 |
Rounded Total | $30.00 | $35.00 | $40.00 |
It was decided to proceed with an operating cost (Opex) assumption of $35/t, which became the NSR cut-off value.
14.2 Mineable Resource Definition
Once the sub-level caving mining method was selected (Section 15.2.3), SRK used Geovia’s PCSLC software to define the mineable resource economic limits. SRK modeled potential “rings” (rounds of drilling and blasting for discrete drawpoints) covering all mineralized material in the deposit, as shown in Figure 14.1.
| Various/RJM/PJD | Timok_PEA_NI43-101_Report_2CR021.006_20171130.docx | November 2017 |
| SRK Consulting | |
| Timok PEA NI 43-101 | Page 113 |

Source: SRK, 2017
Figure 14.1: SLC ring superset containing all mineralized material - looking northeast
NSR values, based on a copper price of US$2.95/lb and a gold price of US$1295/oz and assumed offsite costs (Table 14.2) were then calculated for the rings. The cut-off of $35/t, based on the estimated operating cost, was then used to select a continuous set of rings that maximized the net value of each tunnel. Any tunnels with no remaining rings were removed from the design. Any isolated rings or tunnels were manually removed from the design as well as isolate pockets or levels not likely to cover their cost of development.
Table 14.2: Preliminary offsite parameters for NSR
Marketing Parameter Summary | Units | Value |
Payable Cu | % | 96.5% |
Payable Au | % | 96% |
Cu Treatment Charges | US$/dmt | 169.00 |
Cu Refining Charges | US$/lb | 0.107 |
Au Refining Charges | US$/oz | 5.00 |
Total Shipping | US$/wmt | 116.00 |
Other (Umpire, etc.) | US$/wmt | 6.50 |
Insurance | % | .095% |
Royalty | % | 5.23% |
Figure 14.2 shows the resultant rings selection with copper grades. The PEA mine design and scheduling used the outline of these collective rings to define the extent of mining.
| Various/RJM/PJD | Timok_PEA_NI43-101_Report_2CR021.006_20171130.docx | November 2017 |
| SRK Consulting | |
| Timok PEA NI 43-101 | Page 114 |
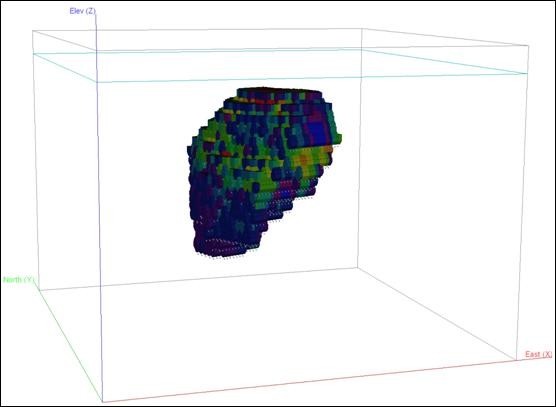
Source: SRK, 2017
Figure 14.2: Ring selection for NSR > US$35/t Opex - looking northeast
| Various/RJM/PJD | Timok_PEA_NI43-101_Report_2CR021.006_20171130.docx | November 2017 |
| SRK Consulting | |
| Timok PEA NI 43-101 | Page 115 |
15 Mining Methods
15.1 Geotechnical Engineering
15.1.1 Data Sources
Several site visits were carried out, from January 2016 through to March 2017, to provide assistance and guidance on the geotechnical data collection and interpretation of the data. The relevant data sources used for this study are presented in Table 15.1.
Table 15.1: Data sources used for study
Data | Description |
Geological Model | Wireframe of the different strata present in the deposit |
Alteration Model | Wireframes of the different alteration types |
Major and Minor Faults | Wireframes of faults modelled as volumes opposed to discrete structures |
Collar and Survey data | Collar and survey data for the 211 drillholes |
Geology Log | Geological logs for 211 drillholes and 163,000 m |
Geotechnical Logs | Detailed geotechnical logs for 166 drillholes and 119,000 m |
Core Photographs | Core photographs for the 158 drillholes |
Geomechanical Testing | A suite of geomechanical testing has been carried out |
Downhole ABI Data | Structure picking from 56 ABI drillholes and 70,000 discontinuities |
The geological, alteration and structure models were used to define the deposit based on a total of 166 drillholes with a total length of 119,000 m of geotechnical logging. The rock strength properties used for this study were based on geomechanical testing and the type and quantity of tests carried out are as follows:
• 175 uniaxial compressive strength (UCS) with Young’s Modulus and Poisson Ratio tests
• 29 slake durability tests
• 42 single-stage triaxial tests, giving 14 results
• 27 direct shear box tests, giving 10 results
• 195 bulk density tests
15.1.2 Geotechnical Assessments
SRK has conducted the following geotechnical assessments for Čukaru Peki:
• Rock mass assessment
• Intact rock strength assessment
• Structural assessment
• Caveability assessment
• Ground support
| Various/RJM/PJD | Timok_PEA_NI43-101_Report_2CR021.006_20171130.docx | November 2017 |
| SRK Consulting | |
| Timok PEA NI 43-101 | Page 116 |
A rock mass assessment has been carried out for the deposit represented by the advanced argillic domain to understand the variability in rock mass quality for all the mining levels from ‑80 m level to -420 m level. Q-logging has been evaluated for the argillic footwall domain to define ground support recommendations for development and major infrastructure excavations. The data shows the following rock mass quality distribution: Good (13%), Fair (16%), Poor (57%) and Very Poor (14%).
The intact rock strength assessment used field-based empirical intact rock strength estimates (hammer tests), point load testing and uniaxial compressive testing.
The structural assessment focussed on defining the small-scale structure for the deposit, hanging wall and footwall. The hanging wall is defined by the structure in the UA; the deposit by the advanced argillic; and the footwall by the argillic.
A caveability assessment was carried out to define how many drawpoints will need to be advanced and retreated before sustaining caving of the hanging wall is achieved. The lower and upper quartile rock mass rating, RMR90 values, for the UA have been used to define the lower and upper bound RMR values and have been multiplied by adjustment percentages to define the mining rock mass rating (“MRMR”), which reflects the mining activities.
For ground support, based on the rock mass assessment, the proportions of “Poor”, “Average” and “Good” rock were estimated for each mining level and a design RMR value was chosen to represent the rock mass quality. The design RMR90 was adjusted to reflect the mining activities to calculate an MRMR value and Laubscher stability chart was used to estimate hydraulic radius for continuous caving of the hanging wall.
15.1.3 Geotechnical Assessment Summary
Geotechnical domains are based on geological units and alteration zones. The overall rock mass quality of the mineralized zone is fair to good (RMRL90 of 40 to 60). However, this zone is transected by several fractured rock and clay zones of poor to very poor-quality rock mass (RMRL90 of <40). The mineralized zone is overlain by Miocene sedimentary units of variable rock mass quality (RMRL90 of 20 to 60) but with some units highly susceptible to weathering. The laboratory results indicate that the mineralization hosted in the advanced argillic domains is classified as very strong with average intact rock strength (IRS) results of 109 MPa. The hangingwall defined by the UA is classified as Strong with average IRS results of 97 MPa and the footwall defined by the Argillic domain is classified as Strong with an average IRS of 75 MPa.
The in-situ stress regime is currently unknown and in-situ stress measurements are planned for the next stage of investigation. Although in-situ stress is currently unknown, a stress adjustment factor of 90% was applied to RMR values, which resulted in a hydraulic radius of 14 to ensure continuous caving.
The selected base case mining method is sub-level caving (SLC; Section 15.2.3). Ground support and development rates have been adjusted to consider the presence of fracture and clay zones. SRK considers the geotechnical data to be suitable for a PEA. The main risks are: i) uncertainty in the extent and location of the in-situ fractured zone in relation to main infrastructure, ii) the unknown stress regime and behaviour of MCS in terms of dilution and mudrush potential, and iii) fragmentation and fines generation in Miocene sediments potentially affecting dilution.
| Various/RJM/PJD | Timok_PEA_NI43-101_Report_2CR021.006_20171130.docx | November 2017 |
| SRK Consulting | |
| Timok PEA NI 43-101 | Page 117 |
15.2 Mining Method and Access Selection
15.2.1 Deposit Context
The choice of a mining method is primarily aimed at achieving the lowest cost to finished metal with manageable risk, while maintaining a safe mining environment and achieving optimum production rates and productivities.
The mining method selection for the Čukaru Peki portion of the Timok project was guided by the following:
• Geology: The exposed geology in the Timok project area is dominated by Upper Cretaceous andesitic volcano-sedimentary sequences partially covered by a north-south to north-west elongated belt of poorly consolidated tertiary clastic sedimentary rocks. Basement Mesozoic stratigraphy exposed around the TMC consists of Jurassic to Lower Cretaceous limestones and clastic sedimentary rocks. Overburden thickness ranges from 0.7 to 16.0 m, and consists predominantly of medium to high plasticity clay.
• Geometry: The Čukaru Peki (UZ) deposit has a large extent both horizontally (200 m x 250 m in plan view) and vertically (about 450 m in section), where a value cut-off of $35/t NSR was used to define the mineable resource.
• Grade Distribution: The grade distribution follows general trends with high grade on the top of the deposit and lower grades at depth.
• Rock Mass: The rock mass at Čukaru Peki is variable within the mineralization. The faults and fracture zone domains contain poorer quality rock than the alteration and geology domains, that are mostly of good quality.
• Geological Structure: Resent structural geology interpretation identifies that the deposit is contained within structural faults with different timings of the faulting: East Fault, West Fault and South Fault.
• Alteration: The footprint of the UZ mineralization is directly associated with the advanced argillic alteration and has a narrow alteration front or halo of kaolinite-pyrite, which envelope represents the alteration front of the mineralized body and is characterized by high gold values without copper, particularly at the margins of the high-grade copper and gold zones.
15.2.2 Mining Method Trade-off Studies
In 2016, Rakita engaged SRK to conduct a trade-off study on potential mining methods for the Timok project (Čukaru Peki) (SRK NA, 2016c). The objective of the study was to determine the mining method that provides the most value accretive approach to deposit exploitation at acceptable risk.
Selective mining, such as underhand drift and fill, was not considered at this stage of the project due to the uncertainty of the grade distribution. Significantly more drilling is required from underground drilling platforms to confirm the ultra high-grade locations to allow selective mining.
Sub-level open stoping (SLOS) was also not considered due to the high variability of the geotechnical conditions within the deposit, that were not detailed enough to determine stope stability requirements.
| Various/RJM/PJD | Timok_PEA_NI43-101_Report_2CR021.006_20171130.docx | November 2017 |
| SRK Consulting | |
| Timok PEA NI 43-101 | Page 118 |
The trade-off was to look at a bulk mining method that did not require the confidence of the grade location nor require stability constraints for semi selective SLOS. A bulk mining method with low operating costs and higher productivity than SLOS and selective mining was reviewed. The caving mining method was considered to be able to meet the ground conditions, grade distribution and desired metal flow, suitable for the unique characteristics of the Čukaru Peki deposit.
After an initial assessment of the deposit, SRK considered three mining scenarios.
• Sub-level Cave Method (SLC): Mining starts at the top of the deposit and progresses downwards. Eligible process feed is mined from sublevels spaced at regular vertical intervals throughout the deposit
• Inclined Cave Method: A variation on the traditional horizontal block caving layout in which the mining configuration is comprised of rows of drawpoints that are offset along an inclined plane
• Hybrid Method: A combination of the two methods. SLC to focus on the high-grade material near the top of the deposit, then transitioning to Inclined Cave to complete extraction of the deposit
SRK designed conceptual mine development layouts for each of the scenarios and prepared development schedules for each of the options. In parallel, SRK prepared production schedules for each of the mining scenarios. Based on the requirements of development and mining, SRK developed capital and operating cost estimates.
Economic analysis of the various schedules and strategies was undertaken using a flexible Technical Economic Model (TEM).
15.2.3 Selected Strategy – Sub-level Cave
The recommended strategy of the trade-off study was to proceed with a sub-level cave and to progress that strategy to the next level of study. Sensitivity analysis showed that the selection of this strategy was robust across a wide range of assumptions
In SLC, mining starts at the top of the orebody and progresses downwards. Mineable resource is extracted from sublevels spaced at regular vertical intervals throughout the deposit. A series of ring patterns are drilled and blasted from the drawpoints on each sublevel; broken mineable resource is mucked from the drawpoints after each ring blast.
SLC is applicable through a wide range of geotechnical conditions, but as with most mining methods it is most efficiently applied in strong rock conditions, making it a relatively easy method to mechanize. This method is normally used in massive, steeply-dipping orebodies with considerable strike length. SLC typically has dilution ranging from 15 to 30% and mining recovery ranging from 80 to 90%, and is dependent on effective management of the SLC operations.
15.2.4 Access and Haulage Trade-off Study
In 2016, SRK conducted a study to assess the access and haulage options from both the north and south areas (SRK NA, 2016b). SRK recommended access from the south be advanced as the preferred option.
| Various/RJM/PJD | Timok_PEA_NI43-101_Report_2CR021.006_20171130.docx | November 2017 |
| SRK Consulting | |
| Timok PEA NI 43-101 | Page 119 |
SRK recommended a dual decline with conveyor as the preferred option to be advanced and this is the option chosen and detailed in this PEA report. Sensitivity analysis showed that the selection of this strategy was robust across a wide range of assumptions.
15.3 Sub-level Cave Design
15.3.1 Mine Development
Total mine development consists of 24 km of lateral development, inclusive of declines, 3 km of vertical development and 51 km of operating development. Capital and operating development are outlined in the life-of-mine schedule (Figure 15.1).
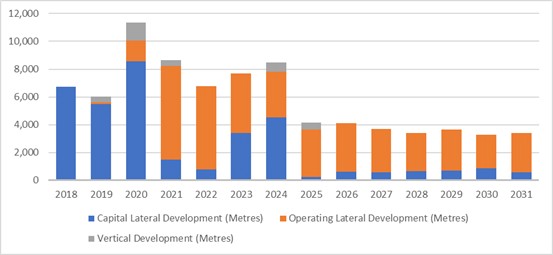
Figure 15.1: LOM capital and operating development physicals
Levels are spaced at 20 m vertical intervals. A 40 m long level access is developed from the decline at each level. The level access connects to the footwall drive. The footwall drive is offset approximately 25 m from the deposit. Cross-cuts are spaced 14 m apart along the footwall drive. Slot drives are developed at the end of each cross-cut and may connect adjacent cross-cuts when they are in alignment. The footwall drive also provides access to the ore and waste passes and to the ventilation system. This layout is shown on Figure 15.2.
| Various/RJM/PJD | Timok_PEA_NI43-101_Report_2CR021.006_20171130.docx | November 2017 |
| SRK Consulting | |
| Timok PEA NI 43-101 | Page 120 |
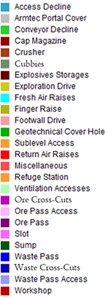


Figure 15.2: Plan view of a typical sublevel layout
15.3.2 Overall Development
The total underground development layout plan for Timok is shown in Figure 15.3.
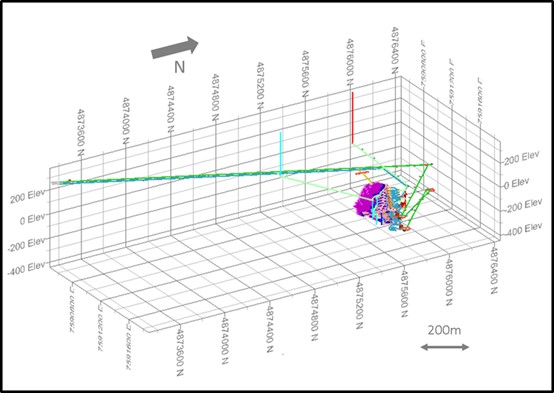
Figure 15.3: 3D view of Timok development layout, looking northwest
| Various/RJM/PJD | Timok_PEA_NI43-101_Report_2CR021.006_20171130.docx | November 2017 |
| SRK Consulting | |
| Timok PEA NI 43-101 | Page 121 |
Figure 15.4 shows the key mine design features of the mine, including the production rings, looking northwest.
Source: SRK, 2017
Figure 15.4: Magnified 3D view of Čukaru Peki overall mine layout, looking northwest
15.3.3 Cave Design
Levels have been designed at 20 m vertical spacing and cross-cuts at 14 m horizontal spacing, along the footwall drive. The following ring design criteria have been used:
• 31.3 m height from floor to apex
• 14 m width
• 60° apex pillar angle
• 2.5 m burden
For simplification and expediency a ring burden of 8 m was used in PCSLC; equal to 3.2 rings at a typical burden of 2.5 m.
15.3.4 Production Cycle
A V-30 blind bore is used to create the slot raises. Each slot activity has 15 m of V-30 drilling and 390 m of additional longhole drilling (26 holes x 15 m each). Each slot activity takes three days to complete, including one day for the V-30 and two days for the longhole drilling, charging and blasting.
| Various/RJM/PJD | Timok_PEA_NI43-101_Report_2CR021.006_20171130.docx | November 2017 |
| SRK Consulting | |
| Timok PEA NI 43-101 | Page 122 |
A drill factor of 0.08 m/t has been considered for all the 8 m long shapes, with a longhole drilling productivity of 235 m/day per drill. Emulsion will be used as the primary explosive.
The two LHD’s per level are assumed to muck an average of 1,500 tpd each, which represents, for each of them, three drawpoints mucked at 500 tpd per drawpoint.
The rings are mucked to the ore passes (two per level) that lead to the crushers, at either the ‑75 m level or the -435 m level.
15.4 Mine Scheduling
15.4.1 Development Schedule
The lateral development rates used depend on the rock type, rock quality and number of concurrently mined headings (drill jumbo drilling single or multiple headings).
Lateral development rates were estimated via benchmarking and contractor quotes. The development at Timok will encounter five rock types of three different rock qualities. The rates used for scheduling by these rock qualities are shown in Table 15.2. All rates are in m/month.
Table 15.2: Estimated vs. scheduled development rates
Rock Quality | Estimated Drill Jumbo Rate (m/month) | Scheduled Drill Jumbo Rates (m/month) |
Good | 174 | 170 |
Fair | 165 | 150 |
Poor | 95 | 95 |
The rate of the drill jumbos working concurrently on multiple headings has been assumed as two times the single heading drill jumbo rate. The advance rate of a heading mined concurrently with others has been set to one quarter of the multiple headings jumbo rate. This is reflected in Table 15.3 where all rates are in m/month.
Table 15.3: Single and multiple headings development rates
Rock Quality | Single Heading Drill Jumbo Rate (m/month) | Multiple Heading Drill Jumbo Rate (m/month) | Multiple Heading Nominal Advance Rate (m/month) |
Good | 170 | 340 | 85.0 |
Fair | 150 | 300 | 75.0 |
Poor | 95 | 190 | 47.5 |
The vertical development rates used for Timok come directly from contractor quotes and vary according to the equipment and diameter of the raise, as shown in Table 15.4.
| Various/RJM/PJD | Timok_PEA_NI43-101_Report_2CR021.006_20171130.docx | November 2017 |
| SRK Consulting | |
| Timok PEA NI 43-101 | Page 123 |
Table 15.4: Vertical development rate
Type - Diameter | Vertical Advance Rate (m/d) | Vertical Advance Rate (m/month) |
Raise-bore - 5.0 m | 3.8 | 115 |
Drop Raise – 3.0 m | 5.0 | 155 |
Drop Raise – 2.4 m | 3.6 | 110 |
A summary of the LOM physicals for pre-production and development of Timok is presented in Table 15.5. There is no development past production Year 12 (2032).
Table 15.5: Mine development schedule
Reporting Period | Units | Total | 2018 | 2019 | 2020 | 2021 | 2022 | 2023 | 2024 |
Capital Lateral Development | m | 23,591 | 3,133 | 4,308 | 8,283 | 1,030 | 17 | 1,230 | 4,708 |
Capital Vertical Development | m | 3,246 | 0 | 104 | 950 | 1,018 | 0 | 0 | 316 |
| | | | | | | | | |
Operating Development | m | 50,698 | 0 | 0 | 438 | 8,035 | 6,858 | 5,719 | 4,100 |
Reporting Period | Units | 2025 | 2026 | 2027 | 2028 | 2029 | 2030 | 2031 | 2032 |
Capital Lateral Development | m | 470 | 0 | 0 | 144 | 94 | 110 | 64 | 0 |
Capital Vertical Development | m | 858 | 0 | 0 | 0 | 0 | 0 | 0 | 0 |
| | | | | | | | | |
Operating Development | m | 3,559 | 4,047 | 3,561 | 3,633 | 3,361 | 3,367 | 3,533 | 487 |
15.4.2 Production Schedule
The production rate is a function of the deposit geometry and continuity, the prevailing ground conditions, the number of available stoping areas, and the expected productivity for each stope. The production resources were scheduled to achieve a practical production output.
The expected drawpoint productivity has been limited to 250 tonnes per drawpoint per day, based on benchmarking comparable mines. The expected daily productivity of 8,000 tonnes per day is based on an average of 30 active drawpoints, resulting in annual targets of 3.00 Mtpa for the SLC operations and an additional 0.25 Mtpa for development, resulting in 3.25 Mtpa of feed to the processing plant.
The extracted tonnes and grades were estimated using Geovia’s PCSLC software. The tonnage drawn from each ring is defined as a percentage of its in-situ tonnage.
The extraction percentage is determined by a ring’s relative position to the top of the orebody. Each set of rings was assigned a percent extraction according to the following progression:
• First set of rings pre-hydraulic radius = 30%
• First set of rings post-hydraulic radius = 50%
• Second set of rings = 80%
• All remaining set of rings (except set of bottom rings) = 133%
• Set of bottom rings = variable
| Various/RJM/PJD | Timok_PEA_NI43-101_Report_2CR021.006_20171130.docx | November 2017 |
| SRK Consulting | |
| Timok PEA NI 43-101 | Page 124 |
The very first rings were extracted at only 30% until the hydraulic radius was reached and caving was induced. Rings within the first two sets of rings and with >5% Cu also had their extraction increased to increase recovery and minimize dilution of this high-grade material.
An iterative process was used to set the final extraction percentages for the bottom rings. At the end of each schedule, the extraction percentage of the bottom rings was increased to mine 75% of any material above cut-off directly overlying the ring. This process was repeated until there was a minor increase in tonnage or in net present value (NPV) (as measured for the production schedule only). The process increased recovery of the resource without having a negative impact on the NPV that would have resulted from mining lower grade tonnes earlier in the schedule.
Figure 15.5 shows the extraction percentages on a representative level. Extraction percentage decrease towards the southwest due to these rings being nearer to the top of the orebody. The average of the final extractions for the whole SLC is 131%.

Figure 15.5: Plan view at the -120 m level of applied drawpoint extractions
The extracted material from each ring was then rescheduled using Datamine’s EPS software to produce a final integrated production and development schedule.
| Various/RJM/PJD | Timok_PEA_NI43-101_Report_2CR021.006_20171130.docx | November 2017 |
| SRK Consulting | |
| Timok PEA NI 43-101 | Page 125 |
The Timok LOM mine production schedule, which includes stockpiling material prior to the processing plant being commissioned, is presented in Table 15.6.
The resulting LOM plant feed schedule for the Timok mine is presented in Table 15.7.
After the initial pre-production period (development starting on April 2018), Čukaru Peki will be mined at an average capacity of approximately 3.2 Mtpa over 12 years of a 16-year (60 quarter) mine life. Full production is achieved in Year 3 of production.
Figure 15.6 shows the Timok plant feed production and grade per year.
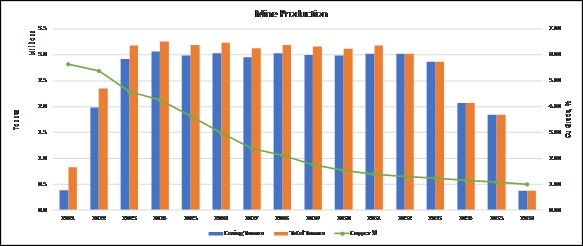
Note: Caving Tonnes are from mine production areas, while Total Tonnes also include mine development
Figure 15.6: Timok plant feed plan
| Various/RJM/PJD | Timok_PEA_NI43-101_Report_2CR021.006_20171130.docx | November 2017 |
| SRK Consulting | |
| Timok PEA NI 43-101 | Page 126 |
Table 15.6: Mine production schedule
Reporting Period | Units | Total | 2018 | 2019 | 2020 | 2021 | 2022 | 2023 | 2024 | 2025 | 2026 | 2027 | 2028 | 2029 | 2030 | 2031 | 2032 | 2033 | 2034 | 2035 | 2036 |
Development Process Feed | kt | 2,567 | - | - | 15 | 452 | 360 | 313 | 211 | 178 | 190 | 176 | 168 | 157 | 158 | 163 | 26 | - | - | - | - |
Run-of-mine Copper Grade | % | 3.14% | | | 6.39% | 6.83% | 4.63% | 3.65% | 2.17% | 1.69% | 1.48% | 1.45% | 1.23% | 1.18% | 1.04% | 1.23% | 1.04% | | | | |
Run-of-mine Gold Grade | gpt | 1.83 | | | 4.95 | 4.34 | 2.72 | 2.29 | 1.37 | 0.98 | 0.68 | 0.60 | 0.46 | 0.41 | 0.38 | 0.41 | 0.34 | | | | |
Run-of-mine Arsenic Grade | % | 0.17% | | | 0.14% | 0.25% | 0.24% | 0.21% | 0.16% | 0.14% | 0.12% | 0.13% | 0.10% | 0.12% | 0.10% | 0.10% | 0.07% | | | | |
Run-of-mine Iron Grade | % | 12.89% | | | 20.74% | 19.53% | 15.72% | 14.63% | 11.76% | 10.53% | 9.22% | 9.38% | 8.42% | 8.51% | 8.57% | 9.88% | 9.63% | | | | |
| | | | | | | | | | | | | | | | | | | | | |
Production Process Feed | kt | 39,557 | - | - | - | 389 | 1,983 | 2,924 | 3,061 | 2,993 | 3,036 | 2,954 | 3,035 | 2,997 | 2,987 | 3,018 | 3,021 | 2,867 | 2,072 | 1,844 | 375 |
Run-of-mine Copper Grade | % | 2.56% | | | | 5.13% | 5.59% | 4.72% | 4.40% | 3.77% | 3.09% | 2.44% | 2.16% | 1.79% | 1.56% | 1.41% | 1.29% | 1.23% | 1.14% | 1.09% | 0.99% |
Run-of-mine Gold Grade | gpt | 1.6312 | | | | 3.85 | 3.87 | 3.06 | 3.03 | 2.40 | 1.84 | 1.60 | 1.53 | 1.19 | 0.97 | 0.82 | 0.69 | 0.61 | 0.56 | 0.48 | 0.39 |
Run-of-mine Arsenic Grade | % | 0.13% | | | | 0.08% | 0.15% | 0.16% | 0.16% | 0.16% | 0.17% | 0.15% | 0.13% | 0.12% | 0.10% | 0.10% | 0.10% | 0.11% | 0.10% | 0.11% | 0.12% |
Run-of-mine Iron Grade | % | 10.03% | | | | 12.96% | 14.79% | 14.58% | 13.09% | 12.07% | 11.60% | 10.15% | 9.49% | 8.94% | 8.10% | 7.73% | 7.65% | 7.41% | 6.90% | 7.37% | 7.68% |
| | | | | | | | | | | | | | | | | | | | | |
Total Process Feed Tonnes | kt | 42,124 | - | - | 15 | 841 | 2,343 | 3,237 | 3,272 | 3,171 | 3,226 | 3,130 | 3,204 | 3,155 | 3,145 | 3,181 | 3,048 | 2,867 | 2,072 | 1,844 | 375 |
Run-of-mine Copper Grade | % | 2.59% | 0.00% | 0.00% | 6.39% | 6.05% | 5.44% | 4.61% | 4.25% | 3.65% | 2.99% | 2.39% | 2.11% | 1.76% | 1.54% | 1.40% | 1.29% | 1.23% | 1.14% | 1.09% | 0.99% |
Run-of-mine Gold Grade | gpt | 1.64 | 0.00 | 0.00 | 4.95 | 4.11 | 3.69 | 2.99 | 2.93 | 2.32 | 1.77 | 1.54 | 1.47 | 1.15 | 0.94 | 0.80 | 0.69 | 0.61 | 0.56 | 0.48 | 0.39 |
Run-of-mine Arsenic Grade | % | 0.13% | 0.00% | 0.00% | 0.14% | 0.17% | 0.17% | 0.17% | 0.16% | 0.16% | 0.17% | 0.15% | 0.13% | 0.12% | 0.10% | 0.10% | 0.10% | 0.11% | 0.10% | 0.11% | 0.12% |
Run-of-mine Iron Grade | % | 10.20% | 0.00% | 0.00% | 10.35% | 17.77% | 14.86% | 14.58% | 13.00% | 11.99% | 11.47% | 10.10% | 9.44% | 8.92% | 8.13% | 7.84% | 7.66% | 7.40% | 6.91% | 7.36% | 1.92% |
| | | | | | | | | | | | | | | | | | | | | |
Contained Copper Metal | kt | 1,093 | - | - | 1 | 51 | 128 | 149 | 139 | 116 | 97 | 75 | 68 | 55 | 48 | 44 | 39 | 35 | 24 | 20 | 4 |
Contained Gold Metal | koz | 2,226 | - | - | 2 | 111 | 278 | 311 | 308 | 237 | 184 | 155 | 152 | 116 | 95 | 82 | 68 | 56 | 38 | 28 | 5 |
| | | | | | | | | | | | | | | | | | | | | |
Waste | kt | 2,031 | 195 | 260 | 577 | 201 | 56 | 102 | 338 | 93 | 36 | 24 | 40 | 34 | 37 | 38 | 1 | - | - | - | - |
Total Material from UG | kt | 44,156 | 195 | 260 | 591 | 1,042 | 2,399 | 3,339 | 3,610 | 3,264 | 3,262 | 3,155 | 3,244 | 3,188 | 3,181 | 3,219 | 3,049 | 2,867 | 2,072 | 1,844 | 375 |
Note: the first three years are pre-production years and do not have any ring production.
Table 15.7: Timok process plant feed schedule
Reporting Period | Units | Total | 2018 | 2019 | 2020 | 2021 | 2022 | 2023 | 2024 | 2025 | 2026 | 2027 | 2028 | 2029 | 2030 | 2031 | 2032 | 2033 | 2034 | 2035 | 2036 |
Process Feed | kt | 42,124 | - | - | - | 488 | 2,711 | 3,193 | 3,250 | 3,229 | 3,216 | 3,148 | 3,197 | 3,142 | 3,165 | 3,181 | 3,048 | 2,867 | 2,072 | 1,844 | 375 |
Head Grades | | | | | | | | | | | | | | | | | | | | | |
Copper | % | 2.59% | | | | 6.19% | 5.50% | 4.62% | 4.26% | 3.66% | 2.99% | 2.39% | 2.11% | 1.76% | 1.54% | 1.40% | 1.29% | 1.23% | 1.14% | 1.09% | 0.99% |
Gold | g/t | 1.65 | | | | 4.29 | 3.80 | 2.99 | 2.93 | 2.33 | 1.77 | 1.54 | 1.47 | 1.15 | 0.94 | 0.80 | 0.69 | 0.61 | 0.57 | 0.48 | 0.10 |
Arsenic | % | 0.13% | | | | 0.18% | 0.16% | 0.17% | 0.16% | 0.16% | 0.17% | 0.15% | 0.13% | 0.12% | 0.10% | 0.10% | 0.10% | 0.11% | 0.10% | 0.11% | 0.03% |
Note: the first three years are pre-production years and do not have any ring production.
| Various/RJM/PJD | Timok_PEA_NI43-101_Report_2CR021.006_20171130.docx | November 2017 |
| SRK Consulting | |
| Timok PEA NI 43-101 | Page 127 |
15.5 Underground Infrastructure
15.5.1 Underground Access
The mine design accesses the Čukaru Peki (UZ) deposit through a dual decline starting at the portal at 259 m amsl, enabling access to the deposit from -55 m level to -400 m level. An exploration drive from the access decline is currently planned to provide diamond drilling platforms, as well as the opportunity, coming out of the access decline at the -95 m level, to intercept the second SLC production level. This will provide the opportunity for early access to the high-grade copper mineralized zone and allow geotechnical design assumptions to be confirmed.
Decline development and sumps have been developed at gradients of 1:7. Re-muck bays have been included at 300-m intervals along the access decline and at 150-m intervals along the conveyor decline (re-muck bays and truck loading bays) to facilitate decline development.
Simultaneous to the decline development, a geotechnical cover hole is drilled to estimate the ground quality prior to decline advancing. The Armtec portal cover is scheduled to be constructed prior to April 2018 so the decline development can start in April 2018.
The portal is collared south of the Upper Zone (Čukaru Peki) deposit. The declines contour the deposit to the north and all the accesses and capital infrastructure are developed from the access decline on the northeast side of the deposit.
15.5.2 Ventilation
The ventilation system design for the Project consists of two separate air streams or splits. The first air stream ventilates the access and egress/conveyor declines, providing fresh air to the access decline that is exhausted from the mine via the conveyor decline. Additionally, production airflow is provided to the active levels via a system of fresh air raises that provide air directly to each level in parallel. A series of return air raises remove air directly from the levels and remove it from the mine without passing it over any other active areas.
Airflow quantities are controlled at the fresh air raise and return air raise regulators to ensure that each level receives sufficient airflow for the equipment/activities required, with any leakage moving from the level to the ramp. Having two separate fresh-air supplies within the mine provides an added layer of security to the mine operations and will greatly assist in emergency egress should it become necessary for any reason.
The total required airflow for the Project was based on the Serbian regulation of 4 m3/min per kilowatt of rated engine power (0.067 m3/s per kW).
In accordance with recommended procedures for determining the airflow requirements based on the heat produced by diesel equipment, a second airflow determination was made based on the engine packages for the two most significant pieces of equipment expected to operate at Timok; the 30‑t haul truck and the 7.0 m3 / 14-t LHD.
| Various/RJM/PJD | Timok_PEA_NI43-101_Report_2CR021.006_20171130.docx | November 2017 |
| SRK Consulting | |
| Timok PEA NI 43-101 | Page 128 |
Based upon these calculations, a second total mine airflow determination was performed using the indicated airflow quantity required for the mitigation of heat produced by the diesel equipment fleet (0.075 m3/s per kW). The greater of the two total airflow requirements calculated (approximately 405 m3/s) was utilized as the basis of the Timok ventilation system design.
The airflow distribution for the mine is based upon the diesel equipment that will be operating during the various mining scenarios (e.g. development, production, etc.). A total of 35 m3/s will be required for each active level based on the expected diesel emissions; however, based on the heat produced by the equipment the ventilation system will need to provide approximately 40 m3/s of fresh air to each heading. As with the total mine airflow requirement, the greater of these two amounts was utilized in developing the auxiliary ventilation system design.
In order to identify the maximum demand for ventilation, a time-phased ventilation model was constructed to represent the development of the mine for each year of mine life. Based upon the combinations of equipment utilisation and physical mine development, three points of the mine life-cycle were identified as critical for ventilation system planning; Year 1 when the dual declines are being developed and before the ventilation raises have been completed, Year 4, when equipment usage is at its maximum, and Year 9 (and afterwards), when the physical extents of the mine development are reached.
The access decline will be utilized as a main intake airway and will be used as access for personnel, equipment, supplies and services. The egress decline will be utilized as a return airway and will provide a secondary egress in case of emergency. The egress decline will be utilized as a conveyor decline during the production stage of the mine. The development of the dual declines in parallel will provide significant benefits for ventilation efficiencies and safety. Haulage can be expedited and safety improved by allowing one-way haul traffic in the declines. A fan installation at the egress/conveyor portal will provide approximately 100 m3/s of fresh air for the circuit, while ventilation at the faces will be provided by a 1.37-m diameter auxiliary duct that delivers 36 m3/s to each face.
Based upon the results of the climate modeling performed, no mechanical refrigeration will be required at Timok. The surface ambient temperature record for Bor also shows that the mean temperature for the area never falls below freezing, and that minimum temperatures do not fall below -4°C at any time. As a result, it is not thought that air heating will be a significant concern at Timok; however, unknown environmental factors may make air heating at the mine necessary, particularly the presence of significant groundwater intrusion in the vicinity of the fresh air raise.
15.5.3 Underground Primary Crusher
The primary crusher can be used to crush mineralized material or waste as required for transport to surface by conveyor.
Primary crusher feed is dumped into a crusher feed pass, which is regulated with a chain feeder discharging into a 1200 mm wide by 5000 mm long apron feeder. Both the chain feeder and apron feeder have variable speed operation to regulate flow into the primary crusher. The primary crusher apron feeder discharges into a vibrating grizzly feeder. Grizzly oversize discharges into the primary crusher. The primary crusher apron feeder fines and the grizzly feeder fines discharge onto the primary crusher discharge conveyor.
| Various/RJM/PJD | Timok_PEA_NI43-101_Report_2CR021.006_20171130.docx | November 2017 |
| SRK Consulting | |
| Timok PEA NI 43-101 | Page 129 |
The primary crusher is a 1300 mm x 1000 mm opening jaw crusher (Metso C130 or equivalent) with a 187-kW motor. The primary crusher discharges onto the primary crusher discharge conveyor. The primary crusher discharge conveyor discharges onto the decline conveyor for transport to the process plant crushed feed storage bins or to a waste stockpile. The transfer point of the primary crusher discharge conveyor has a magnet to remove tramp metal.
Dry dust collection is used in the primary crusher area. Dust is collected in a baghouse with the dust returned to the primary crusher discharge conveyor.
The primary crusher operates seven days per week and has an operating capacity of 500 t/h.
15.5.4 Conveyance
The underground conveyor system requires a series of conveyors to transport the material from the two underground primary crushing stations (Figure 15.7).
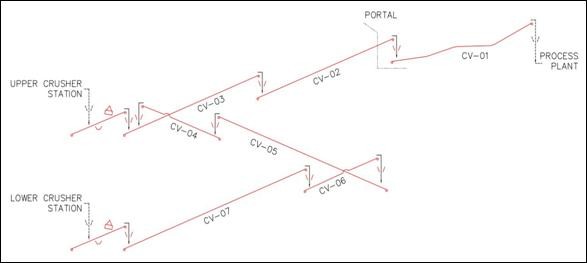
Figure 15.7: Underground conveyor system flow sheet.
The upper crusher station discharges onto the crusher discharge conveyor, which loads onto conveyor CV-03 that rises to load onto the main decline conveyor CV-02, which in turn transports material to the main portal area at the surface. The decline conveyor discharges onto the overland conveyor, CV-01, which travels over the natural terrain to the process plant and discharges into the plant feed bins.
The lower crusher station discharges onto a crusher discharge conveyor, which loads onto a series of switchback conveyors CV-07, CV-06 and CV-05, to the upper crusher station loading onto CV-03, which leads to CV-02, CV-01, and the plant feed bins.
| Various/RJM/PJD | Timok_PEA_NI43-101_Report_2CR021.006_20171130.docx | November 2017 |
| SRK Consulting | |
| Timok PEA NI 43-101 | Page 130 |
The underground conveyor system alignment was constrained by:
• The portal location which had been fixed due to prior mine planning and development approvals
• The alignment of the exploration dual decline
• The upper and lower crusher stations which are defined by the mineral deposit and mine plan
• Maximum tunnel inclination of 14% grade
In conjunction with the SRK mine development team, the underground conveyor system alignment and arrangement was selected to meet the above constraints whilst minimizing the conveyor system length and providing access to the lower crusher station.
Power is required at the head end of each main conveyor with the switch room number corresponding to the corresponding conveyor head end. The underground conveyors require lighting along the full length and are generally mounted directly above the conveyor upon the structural suspension system. The total installed power requirement for all conveyors is 3.9 MW.
15.5.5 Underground Facilities and Services
For the PEA, SRK considered the following in its cost estimation:
• Compressed air supply
• Electrical reticulation
• Communications
• Explosives storage
• Maintenance workshop
• Personnel transport
• Service and potable water supply
• Dust control
• Emergency egress
• Fire prevention
• Mine rescue
• Refuge chambers
15.5.6 Mine Dewatering
All water entering the mine will be pumped out by the mine pumping system. The main sources of water inflow to the underground mine will be groundwater, rainfall, water from drilling operations and service water. The pumping requirements will vary significantly over the life of the mine. To cope with these variations, the mine dewatering system must be capable of functioning effectively over a wide range of operating conditions.
| Various/RJM/PJD | Timok_PEA_NI43-101_Report_2CR021.006_20171130.docx | November 2017 |
| SRK Consulting | |
| Timok PEA NI 43-101 | Page 131 |
Based upon the model predictions, the inflow to the underground from groundwater will be between 23 L/s (83 m3/h) on average over the life of mine (UoB, 2017b). The design capacity for the dewatering facility is recommended to be 60 L/s (216 m3/h). The pumping capacity is based on modelled groundwater inflows plus anticipated process water for drilling, washing equipment and dust suppression activities. The pump selection criteria were based on required flow rate, operating pressure and water quality.
The underground mining subsidence breaks through to surface, therefore, the potential inflows during the wet season are significant. It is estimated that a 10-year storm event would produce approximately 68 mm of rain over a 24-hour period (UoB, 2016), or 37,000 m3 of water given the footprint of the surface catchment area, which is equal to the modelled subsidence area of 54 ha. This type of event will require significant water storage capacity.
Every mining level will have a level sump in close proximity to the mining areas to collect both process water and ground water. The sumps will be connected from level to level by a series of drain holes to allow the water to gravity-flow to the lower levels and to be pumped from there to the closest main dewatering stations.
15.6 Equipment Selection
15.6.1 Equipment and Fleet-Sizing Considerations
The criteria used in the selection of underground mining equipment include:
• Mining method and preliminary development plan
• Mineral deposit geometry and dimensions
• Mine production rate
• Reliability and availability of after-sales support
The size of the equipment fleet was based on the scheduled quantities of work, estimated from first principle cycle times and productivities, benchmarking and practical experience. The selected equipment size satisfies the maximum size of excavations based on geotechnical recommendations.
The following input factors were considered to calculate the required number of operating units:
• Development and production schedule
• Shift efficiency of 83% on 12 hours shift length to account for non-productive time due to shift change, equipment inspection and fueling, lunch and coffee breaks, equipment parking and reporting
| Various/RJM/PJD | Timok_PEA_NI43-101_Report_2CR021.006_20171130.docx | November 2017 |
| SRK Consulting | |
| Timok PEA NI 43-101 | Page 132 |
• An operational hour efficiency of 83%, accounting for 50 minutes of usable time in one operating hour
• Equipment operation efficiency, such as: 75% efficiency for the second boom on the drill jumbo, 85% and 80% fill factors for LHD bucket during pre-production and production respectively, and 90% for the truck box
• Additional time for travel, setup and teardown
The estimated number of operating units was converted to a fleet size by accounting for equipment mechanical availability of 80% to 90% depending on type of equipment.
15.6.2 Mobile Equipment
During the pre-production period, a mining contractor will use its own mobile equipment fleet for mine development, haulage and services. Equipment for conveying, crushing and ore/waste pass systems will be in place when the owner commences operations with its own crews and equipment.
The owner mobile equipment fleet for Timok is completely diesel-powered. The underground mine mobile equipment list and maximum units in the equipment fleet are presented in Table 15.8.
| Various/RJM/PJD | Timok_PEA_NI43-101_Report_2CR021.006_20171130.docx | November 2017 |
| SRK Consulting | |
| Timok PEA NI 43-101 | Page 133 |
Table 15.8: Underground mine mobile equipment list
Description | Max Units in Fleet |
Drilling Equipment |
Jumbo, 2 boom | 3 |
Rockbolter | 5 |
Cablebolter | 1 |
Production Drill | 6 |
Aries ITH Drill with V30 Reamer | 1 |
Development & Production Auxiliary Equipment |
Emulsion Loader, Development | 2 |
Shotcrete Sprayer | 2 |
Transmixer | 2 |
Emulsion Loader, Production | 2 |
Mobile Rockbreaker | 1 |
Blockholer | 1 |
Loading & Hauling Equipment |
LHD, 5.4 m3, 10 t | 3 |
LHD, 7.0 m3, 14 t | 8 |
LHD, 8.6 m3, 17 t | 3 |
LHD, 3.7 m3, 6.7 t | 1 |
Haulage Truck, 30 t | 2 |
Auxiliary Equipment for Mine Maintenance |
Grader | 2 |
Scissor Lift | 2 |
Scissor Lift Attachments | 1 |
Boom Truck | 2 |
Flat Deck Truck | 1 |
Toyota Flat Deck Truck | 2 |
Mechanics Truck | 2 |
Fuel/Lube Truck | 1 |
Water Sprayer | 1 |
Auxiliary Equipment for Mine Services |
Personnel Carrier 22-persons | 1 |
Personnel Carrier 9-persons | 5 |
Supervisor Vehicle | 7 |
Forklift/Telehandler | 2 |
Septic Vacuum Truck | 1 |
Cassettes System Prime Mover | 2 |
Cassettes Attachments | 1 |
| Various/RJM/PJD | Timok_PEA_NI43-101_Report_2CR021.006_20171130.docx | November 2017 |
| SRK Consulting | |
| Timok PEA NI 43-101 | Page 134 |
16 Recovery Methods
16.1 Flowsheet Selection
The process plant design is based on a combination of metallurgical test work, mine production plan and in-house information. Where necessary, benchmarking has been used to support the design.
The Timok process plant includes the following unit processes and associated facilities:
• Primary crushing located underground
• Overland conveying of crushed process feed
• Coarse feed storage bins and reclaim
• SAB grinding circuit
• Copper flotation comprising rougher flotation, concentrate regrind and three stage cleaning
• Copper concentrate thickening and filtration
• Copper concentrate load out and storage for each concentrate
• Pyrite flotation with impoundment of the pyrite concentrate
• Tailings storage and water reclaim
• Effluent treatment
• Reagents storage and distribution (including lime slaking, flotation reagents, water treatment and flocculant)
• Grinding media storage and addition
• Water services (including fresh water, fire water, gland water, cooling water and process water)
• Potable water treatment and distribution
• Air services (including high pressure air and low-pressure process air)
• Plant control rooms
• Possible future equipment for flotation of a separate high arsenic complex copper concentrate
16.2 Process Design Criteria
The following sections outline the basis of process design for the overall plant including key criteria, operating schedule and availability, and throughput.
16.2.1 Design Basis
Key design criteria used in the plant design are summarized in Table 16.1.
| Various/RJM/PJD | Timok_PEA_NI43-101_Report_2CR021.006_20171130.docx | November 2017 |
| SRK Consulting | |
| Timok PEA NI 43-101 | Page 135 |
Table 16.1: Key design criteria
Plant capacity, 2021 to 2023 | tpa | 3,250,000 |
Flotation feed size, P80 | µm | 75 |
Rougher feed density, nominal | % solids (w/w) | 33 |
Cleaner feed density, nominal | % solids (w/w) | 25 |
Concentrate thickeners underflow density | % solids (w/w) | 60 |
Concentrate filter cake moistures | % solids (w/w) | 10 |
16.2.2 Operating Schedule and Availability
The plant operating schedule and availability is based on two 12-hour shifts per day for 365 days per year (i.e. total available hours per year is 8,760). Operating availability criteria (as a percentage of total available hours) used for plant design are summarized in Table 16.2.
Table 16.2: Plant operating availability summary
Crusher operating availability | % | 75.0 |
Grinding and flotation operating availability | % | 92.0 |
Concentrate filter operating availability | % for area | 88.0 |
% overall | 80.5 |
Overall concentrator and tailings systems | % | 92.0 |
The basis of design for major plant equipment and unit processes is summarized in the following sections.
16.3 Feed
The primary crusher is located underground. Process feed is crushed to 80% passing 102 mm in a jaw crusher fed by an apron feeder followed by a vibrating grizzly feeder. The material is then conveyed via decline conveyor to the mine. The primary crusher is described in Section 15.5.3.
The crushed process feed is transferred to the process plant via an overland conveyor. The overland conveyor discharges onto the top of the coarse feed storage bins via a shuttle conveyor. Discharge can be to either of the two coarse feed storage bins or via a chute to a stockpile. Each coarse feed bin has 4,500 t live capacity and the two bins combined provide 24 hours storage capacity for the grinding circuit.
16.4 Primary Grinding Circuit
The grinding line consists of a single variable speed SAG mill, followed by a single ball mill operating in closed circuit with a cyclone cluster. The product from the grinding circuit (cyclone overflow) has a typical size of 80% passing 75 µm. SAG mill pebbles are recycled to the SAG mill feed conveyor.
| Various/RJM/PJD | Timok_PEA_NI43-101_Report_2CR021.006_20171130.docx | November 2017 |
| SRK Consulting | |
| Timok PEA NI 43-101 | Page 136 |
The SAG mill feed conveyor discharges mineralized material, along with pebble recycle and grinding media, into the feed chute of the SAG mill together with mill feed dilution water and lime slurry. The SAG mill is fitted with discharge grates to retain grinding media and larger pebbles while allowing smaller particles to discharge from the mill. SAG mill grinding media is also added to the SAG mill feed chute with a 1-t kibble with a false bottom.
The SAG mill trommel undersize gravitates to the primary cyclone feed hopper where it is combined with the discharge from the ball mill. The slurry is transported to a single cyclone cluster using two variable-speed cyclone feed pumps (duty and stand-by).
Dilution process water is added to the cyclone feed hopper before the slurry is pumped to the cyclone cluster for classification. Lime slurry is added to the hopper in order to increase pH to approximately 10. Coarse particles report to the cyclone underflow and are directed to the ball mill feed chute via a boil box. The cyclone overflow stream gravitates to the vibrating trash screen via a cross-stream sampler.
SAG mill balls are added via a ball addition system and bunker adjacent to the SAG mill feed conveyor. A separate ball storage bunker is provided for the ball mill. The ball mill has a dedicated ball charging system.
A SAG mill feed chute removal system and a ball mill feed chute removal system are used to service the mills. A liner handler is provided for each mill.
There is provision to install a vibrating screen at the SAG mill discharge in case pebble crushing is required in the future if process feed hardness increases sufficiently.
16.5 Copper Flotation and Regrind
The copper flotation circuit consists of a vibrating trash screen, conditioner tank, single train of rougher flotation cells, rougher concentrate regrind and three stages of cleaner flotation.
Cyclone overflow gravitates over a vibrating trash screen with the undersize reporting to the conditioning tank. Slurry pH is adjusted to the required value (pH 10.0) with slaked lime at the conditioner tank with the option for pH adjustment at each rougher cell. MIBC (methyl isobutyl carbinol) frother and copper collector Aerofloat 211 is added to each feed stream.
Flotation feed reports to a single rougher flotation bank consisting of five forced air mechanical flotation tank cells.
The rougher flotation cells produce a low-grade copper concentrate that requires further liberation and upgrading. Copper rougher concentrate is pumped to the regrind mill.
The copper rougher tailings stream is pumped to the pyrite rougher conditioner tank after passing through a cross-cut sampler.
| Various/RJM/PJD | Timok_PEA_NI43-101_Report_2CR021.006_20171130.docx | November 2017 |
| SRK Consulting | |
| Timok PEA NI 43-101 | Page 137 |
Copper rougher concentrate is reground in a vertical ball mill operating in closed circuit with small diameter cyclones. Copper rougher concentrate is reground to 80% passing 25 µm. Regrind cyclone overflow gravitates to the copper cleaner flotation circuit. Regrind cyclone underflow gravitates to the regrind mill.
The copper cleaner circuit consists of three stages of counter-current cleaning and one bank of copper cleaner scavenger flotation cells. There is provision for a bank of copper-arsenic retreatment flotation cells to produce a high arsenic complex copper concentrate and low arsenic clean copper concentrate in the future.
The first copper cleaner stage consists of four tank cells. Cleaner feed is conditioned with slaked lime to adjust pH to 11.0. Collector and frother are added to the first tank cell in the first cleaner stage and only frother and lime are added to the downstream cleaner stages.
Concentrate recovered from the first copper cleaner bank is pumped to the second copper cleaner bank for further upgrading. The tailings are pumped to the copper cleaner scavenger flotation cells.
The copper cleaner scavenger flotation cells recover a low-grade concentrate that is pumped to the copper conditioning tank or in the future to copper-arsenic retreatment flotation cells if installed. The cleaner scavenger tailings stream is pumped to the pyrite rougher flotation cells via pyrite rougher condition tank.
The second copper cleaner concentrate is pumped to the third copper cleaner flotation cells bank for further upgrading. The tailings from the second copper cleaner cells report to first cleaner feed or in the future the copper-arsenic retreatment flotation cells if installed.
The third copper cleaner flotation stage concentrate is pumped and split to two copper concentrate thickener feed tanks for dewatering. The tailings from the third copper cleaner cells are pumped to the head of second copper cleaner flotation cells.
There is provision for copper-arsenic retreatment flotation cells in the future, if a two-concentrate approach is determined to be better in future studies. Complex concentrate would be pumped to one of the copper concentrate thickener feed tanks for dewatering. The tailings from the copper-arsenic retreatment flotation cells would be pumped to the head of copper cleaner scavenger flotation cells.
An on-stream analyzer is used to monitor copper and arsenic levels in the feed, major concentrate and tailings streams to allow operators to optimize reagent additions and flotation performance.
16.6 Pyrite Rougher Flotation
Tails from copper rougher flotation cells and copper cleaner scavenger flotation cells are pumped to the pyrite rougher flotation circuit. The pyrite concentrate is pumped to the pyrite storage pond. The pyrite tails are pumped to the bulk tailings pond.
| Various/RJM/PJD | Timok_PEA_NI43-101_Report_2CR021.006_20171130.docx | November 2017 |
| SRK Consulting | |
| Timok PEA NI 43-101 | Page 138 |
16.7 Copper Concentrate Thickening and Filtration
Copper concentrates are dewatered using two thickeners and filters. Each copper concentrate thickening and filtration circuit consists of a single 14-m diameter high rate thickener and one Outotec Larox PF96M60 pressure filter. Should a separate complex concentrate be produced in the future, one circuit would be dedicated to the complex concentrate and one for the conventional concentrate.
The concentrate from the third copper cleaner flotation cells is pumped and split into two copper concentrate thickeners.
Flocculant is added to the thickener feed streams to enhance settling. The thickener overflows report to the pyrite rougher tailings pumpbox. Copper concentrate solids settle and are collected at the underflow at a density of 60% solids. The thickener underflow streams are pumped to two dedicated agitated storage tanks, one tank per filter, by centrifugal pumps (one operating, one standby per thickener).
The storage tanks provide 24 hours surge capacity allowing filter maintenance to be conducted without affecting process plant throughput. The filter feed is pumped to a pressure filter that produces a filter cake of 10% moisture. The copper filter cake is discharged by gravity to a storage stockpile. Filtrate, cloth wash and flushing water is discharged to the filtration area sump pump which returns it to the copper concentrate thickener.
During the two highest quarters of production in the first two years of operation, the concentrate pressure filters must operate at the design availability for this time. Concentrate filtration tests during future studies will provide better definition of filtration equipment requirements.
16.8 Effluent Treatment
Although submergence of pyritic tails is expected to prevent acidification, water from the pyrite impoundment pond may become acidic over time. Acidic water from this pond along with contaminated contact water will be put through the effluent treatment plant. The primary purpose of the effluent treatment plan will be: a) treatment of mine water for direct discharge, should there be a surplus and/or b) gradual reduction in stored water for subsequent discharge.
The effluent treatment plant includes a high-density sludge process using slaked lime. After four reaction tanks, treated effluent gravitates to a clarifier. Clarifier underflow is recycled to the reaction tanks. Clarifier overflow is passed through a sand filter. If discharge to the environment is required, a reverse osmosis module will be employed to remove residual dissolved salts.
16.9 Reagents and Consumables
Major process reagents are received and stored on site. Dedicated mixing, storage and dosing facilities are provided for each reagent.
| Various/RJM/PJD | Timok_PEA_NI43-101_Report_2CR021.006_20171130.docx | November 2017 |
| SRK Consulting | |
| Timok PEA NI 43-101 | Page 139 |
16.9.1 Lime
Lime is used to increase slurry pH and subsequently depress pyrite in copper flotation. It is also used in the effluent treatment circuit.
The quick lime slaking systems consist of a vendor-supplied proprietary slaking system comprising storage silo, feeders, vertical slaking mill and a storage tank. Quick lime is delivered to site in 30-t bulk road tankers and unloaded pneumatically to a 200-t storage silo at the lime slaking plant.
A lime circulating pump and pressurized ring main is used to deliver lime slurry to plant dosing points. Pinch valves are used to control lime addition at each dosing point.
16.9.2 Copper Collector
The copper collector is a Cytec product, Aerofloat 211, which is an alkyl dithiophosphate. The reagent is delivered as a liquid in 1.0-m3 plastic totes. The totes are transferred to a storage tank. The storage tank is connected to a fixed manifold and collector is pumped to addition points via dedicated dosing pumps.
16.9.3 Potassium Amyl Xanthate
PAX is the pyrite collector. PAX will come in 750-kg bulk bags and will be dissolved in water to a concentrate of 20% w/v. The PAX solution is transferred to a storage tank and then metered to pyrite flotation with a dedicated diaphragm type pump.
16.9.4 Frother
MIBC is used to provide a stable froth in the copper flotation cells. The frother is delivered as a liquid in 1.0-m3 plastic totes. The totes are transferred to a storage tank. The storage tank is connected to a fixed manifold and frother is pumped to addition points via dedicated dosing pumps.
16.9.5 Copper Sulphate
Copper sulphate may be added to activate pyrite to enhance its flotation with PAX. If required, copper sulphate will come in 750-kg bulk bags and will be dissolved in water to a concentrate of 20% w/v. The solution is transferred to a storage tank and then metered to pyrite flotation with a dedicated diaphragm type pump.
16.9.6 Flocculant
Flocculant is used as a settling aid in the two concentrate thickeners and flotation tailings thickener. The flocculant mixing systems consist of a vendor-supplied proprietary mixing system comprising storage bin, screw feeder, blower, auto jet wet mixer, mixing tank, storage tank and dosing pumps.
Flocculant is delivered as a dry powder in 25-kg bags and is transferred to a hopper and blown into the wetting head to produce a 0.25% w/v flocculant solution. Flocculant is mixed for 30 minutes in an agitated tank and transferred to a storage tank. Dedicated dosing pumps deliver flocculant to the respective thickeners.
| Various/RJM/PJD | Timok_PEA_NI43-101_Report_2CR021.006_20171130.docx | November 2017 |
| SRK Consulting | |
| Timok PEA NI 43-101 | Page 140 |
16.10 Water Services
16.10.1 Raw Water
The raw water tank serves as a combined raw water / fire water tank with the lower section dedicated for fire water service and the remainder available for general use.
The fire water system comprises an electric fire water pump and a jockey pump to maintain pressure in the fire water line. A diesel-powered fire water pump provides back-up in the event of power loss. Fire water is reticulated to fire hydrants and hose reels via a dedicated fire water main.
Raw water is also used to supply the following services:
• PAX and copper sulphate preparation
• Gland water
• Make-up water for the plant process water tank
16.10.2 Process Water
Water is aged in the bulk tailings pond to allow thiosalts to decompose. Process water is reclaimed water from the pyrite storage and bulk tailings ponds and treated water from the effluent treatment plant.
Process water is stored in the process water tank. Process water pumps distribute water from the storage tank to the plant.
16.10.3 Potable Water
Potable water is distributed for general use in the plant, the camp and the plant safety shower system from the potable water storage tank.
16.11 Air Services
Low pressure air for the copper flotation circuit is supplied by two blowers in duty/standby arrangement. The same arrangement is provided for pyrite rougher flotation.
Two separate air compressors (one duty and one standby) provide high pressure air for plant instruments and general service points. Compressed air is dried and filtered to instrument air quality prior to storage in the instrument air receiver and subsequent distribution.
| Various/RJM/PJD | Timok_PEA_NI43-101_Report_2CR021.006_20171130.docx | November 2017 |
| SRK Consulting | |
| Timok PEA NI 43-101 | Page 141 |
17 Project Infrastructure
17.1 Proposed Project Infrastructure
17.1.1 Site Roads
The main access road to site will be constructed from the existing highway to the municipality of Bor, connecting to the processing plant area, which includes the administration complex and service buildings. Internal roads are provided to allow access to all major site facilities and infrastructure areas such as the mine portal, overland conveyor and access to the waste management area (TSF facility).
The width and specification of the internal roads vary based on the intended use. In general, they will allow for two-way traffic for light vehicles and heavy machinery when such equipment is required during construction and normal operation of the mine facilities.
17.1.2 Project Power Requirement and Supply
The power supply will be provided through the Serbian national transmission grid, which comes within 1.5 km of the site (NTI, 2017). A 110/35 kV transmission substation will be constructed on site connecting a new 110-kV transmission line to the existing 110-kV line.
The existing line between Transmission Substation 400/110 kV Bor 2 and Transmission Substation 110/35 kV Zaječar 2 (DV 148/2) is old and has a small cross-section (AlFe 150 mm2). EMS plans to rebuild this portion of the line, along the same route, with transmission towers that can carry two sets of AlFe 240 mm2 cross-section wires, but only one set will be equipped. EMS’s construction permits are expected by the end of 2017 with the rebuild starting at the end of 2019 and likely finishing in 2021. Discussions with EMS continue on how to integrate the project power needs with the rebuild of the new line.
17.1.3 Administration and Service Buildings
Administration and technical services offices, workshops, warehouse, mine dry and process plant change house are provided for and form part of the onsite infrastructure that houses operational and management support facilities and services for the mine.
Located in the vicinity of the portal during decline development is the temporary construction office, mine dry and workshop complex. These will be used by the decline construction contractor and the owner’s management team. During the production phase, permanent facilities will be established to meet the needs of the steady state operational workforce. Permanent mine dry facilities for the underground workforce during production will be placed in the administration complex, which will be in the vicinity of the process plant.
Fuel storage tanks, water and fire water protection tanks will be located north of the portal.
| Various/RJM/PJD | Timok_PEA_NI43-101_Report_2CR021.006_20171130.docx | November 2017 |
| SRK Consulting | |
| Timok PEA NI 43-101 | Page 142 |
17.1.4 Processing plant
The process plant complex (Figure 17.1) will be located at the south end of the existing airstrip (requires decommissioning). Process feed will enter the underground jaw crusher and be transported to surface by means of the underground conveyor system, which feeds the overland conveyor. The overland conveyor feeds the plant feed bins, which in turn feed the SAG mill. For the PEA, a bulk concentrate is created, which will be loaded onto trucks at the north end of the building.
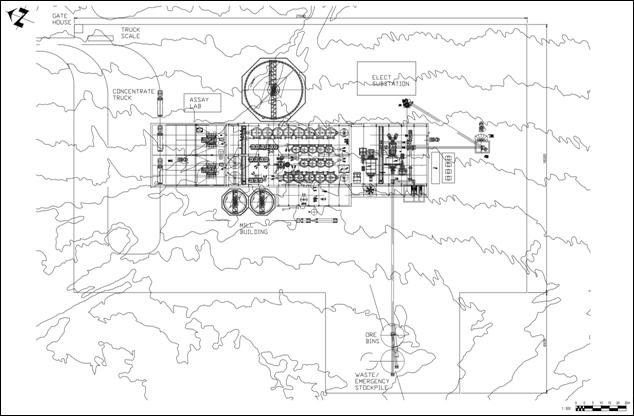
Figure 17.1: Plant site layout
17.1.5 Concentrate Storage and Handling
There is a storage bunker associated with each concentrate pressure filter. Each provides roughly 2800 t of concentrate storage, roughly 18 days of storage during peak production grades. Concentrate will be loaded into trucks with front end loaders. Space has been provided to load concentrate into transport containers such as the Rotainer system. Concentrate will be trucked off site and transported to the nearest port for overseas shipment or by road or rail to European or other international smelters.
| Various/RJM/PJD | Timok_PEA_NI43-101_Report_2CR021.006_20171130.docx | November 2017 |
| SRK Consulting | |
| Timok PEA NI 43-101 | Page 143 |
17.1.6 Overland Conveyor
Description
The discharge from the underground decline conveyor (CV-02) loads onto the overland conveyor (CV-01) located at the surface adjacent to the mine portal area using a rock box style transfer chute.
The overland conveyor alignment is straight with an overall length of 2,000 m and lift of 154 m with a maximum inclination of 14° (25% grade) when rising to the plant feed bins.
Power Requirements
Power is only required at the head drive station of the overland conveyor. A summary of the power requirements for each switch room is shown in Table 17.1.
Table 17.1: Summary power requirements for the overland conveyor
Location | Power (kW) |
Installed | Nominal | Maximum | Minimum |
Switch room SW01 | 734 | 586 | 611 | 128 |
Totals | 734 | 586 | 611 | 128 |
17.1.7 Fuel and Oil Storage
Diesel fuel and oil storage facilities will be provided for the surface and underground mobile equipment. Facilities for storage and preparation of ammonium nitrate/fuel oil, a bulk explosive, will also be provided.
For the cost estimate, it has been assumed a five million litre fuel tank farm, within a bunded area, is to be constructed at the mine site.
17.2 Waste and Water Management
Knight Piésold Ltd. (KP) completed the waste and water management design for the Project.
Mineral processing will generate two tailing streams: bulk and pyritic, with each stream deposited in a separate TSF. Non-potentially acid generating waste rock will be co-disposed within the bulk TSF impoundment. Potentially acid generating rock will be stockpiled in a designated storage area located within the pyritic TSF impoundment.
The bulk tailings will comprise approximately 60% of the total tailings by mass. They will be deposited as a conventional unthickened slurry with a solids content of 21% by mass, with an estimated average settled dry density of 1.4 t/m³. The bulk TSF is designed to accommodate these tailings, a small supernatant pond and the inflow design flood, which has been defined as the portion of the probable maximum flood that is not diverted by the upstream diversion structures.
| Various/RJM/PJD | Timok_PEA_NI43-101_Report_2CR021.006_20171130.docx | November 2017 |
| SRK Consulting | |
| Timok PEA NI 43-101 | Page 144 |
The pyritic tailings will comprise the remaining 40% of the total tailings mass. They will be deposited as a conventional unthickened slurry with a solids content of 24% by mass, with an average estimated settled dry density of 2.0 t/m³. The pyritic tailings will be deposited sub-aqueously beneath a water cover. The pyritic TSF is designed to store these tailings, the water cover, and the inflow design flood (undiverted portion of the probable maximum flood, similar to the bulk TSF).
A site-wide water balance was developed for the mine site that includes the TSF, portal area and plant site (Knight Piésold, 2017c). This assessment indicates that the Project will operate in a water surplus and treatment of surplus water may be required. Contact water within the project area will be recycled and used to the maximum practical extent by collecting and managing site runoff from undisturbed and disturbed areas. Non-contact water will be diverted away from the TSF where possible. Excess water will be stored in the supernatant ponds within the bulk and pyritic TSFs and recycled to the plant for use in processing.
TSF closure will be completed in a manner that will satisfy physical and chemical stability. The primary objective of closure and reclamation will be to return the TSF site to a self-sustaining condition that will be consistent with the local landscape. Each TSF will be capped with a membrane and low permeability soil layers, and contoured to become a landform. The surfaces will be revegetated with native plants.
17.2.1 TSF Design
The principal objective of the waste and water management design is to provide secure and stable storage for mine waste and water that does not adversely affect the regional groundwater and surface water during operations and post closure. The design of the TSF has taken into account the following elements:
• Permanent, secure and total confinement of all solid waste materials within an engineered disposal facility
• Control, collection and removal of free draining liquids from the tailings during operations for recycling as process water to the maximum practical extent
• Management of surface water
• Separate storage areas for the bulk and pyritic tailings streams
• Staged development
• Ongoing monitoring and assessment
• Appropriate closure measures
The general arrangement for the TSF at the end of operations is shown on Figure 17.2.
| Various/RJM/PJD | Timok_PEA_NI43-101_Report_2CR021.006_20171130.docx | November 2017 |
| SRK Consulting | |
| Timok PEA NI 43-101 | Page 145 |
Source: Knight Piésold, 2017b
Figure 17.2: TSF general arrangement
Tailings Storage Facility Alternatives Assessment
A tailings technology and TSF site alternatives assessment was carried out in August 2017 (Knight Piésold, 2017b) utilizing information from previous siting studies, recent project data, and preliminary environmental and socioeconomic baseline data.
The alternatives assessment considered four candidate locations and three different tailings technologies (solids concentrations) for the bulk tailings and pyritic tailings:
• Conventional slurry tailings (low solids content)
• Paste tailings (high solids content)
• Filtered tailings (high solids content, dewatered)
| Various/RJM/PJD | Timok_PEA_NI43-101_Report_2CR021.006_20171130.docx | November 2017 |
| SRK Consulting | |
| Timok PEA NI 43-101 | Page 146 |
Conventional slurry tailings management was identified as the preferred tailings strategy for both the bulk and pyritic tailings. Conventional slurry tailings require less processing and can be easily transported using pipelines and centrifugal pumps, eliminating the need for positive displacement pumps, conveyors, or trucks for transportation to the TSF. Conventional slurry tailings were also considered to provide the best environmental and reclamation strategy for the pyritic tailings stream, as sub-aqueous deposition of pyritic tailings is the most reliable long-term management strategy using the proven method of water cover to reduce the acid generation risk during operations and post-closure.
Four alternative sites were evaluated. A preferred site was chosen based on a Multiple Accounts Assessment approach. The Multiple Accounts Assessment approach considered technical, project economic, environmental and socio-economic categories in the ranking and evaluation process.
Geologic Conditions
Regional Geology
The Project is located in an area of gently sloping grassy hillsides with brush and light forest cover. Geologically, the region is part of the Tethyan Belt, which hosts Mesozoic to Cenozoic subduction-related base metal deposits from Romania and Serbia through to Turkey and Iran. The Bor cluster of deposits is hosted by Upper Cretaceous andesites and volcaniclastics that continue at least five kilometres south to Čukaru Peki, where the Cretaceous unit is overlain by a Miocene basin containing clastic sediments that can be hundreds of metres thick.
Local Geology
Geotechnical and hydrogeological investigations were completed in 2017 to collect data in support of the PEA design of the waste and water management facilities. The results of the site investigation are summarized in Knight Piésold (2017a).
Results of the site investigation program indicate the following:
• Overburden thickness ranged from 0.7 to 16.0 m, and consists predominantly of medium to high plasticity clay
• Bedrock throughout the project areas consists of interbedded layers of clastic sediments (claystone, sandstone, siltstone and conglomerate)
• The average hydraulic conductivity of bedrock within the TSF ranges of 9E-07 to 1E-06 m/s (UoB, 2017b)
• The measured groundwater levels ranged from 1 to 35 m below ground surface in the area of the pyritic and bulk TSF embankments (UoB, 2017b)
• Field estimates of UCS for weathered bedrock units encountered within the TSF area typically ranged from 3 to 9 MPa. Values for rock core from the settling pond area exhibited values up to 70 MPa
| Various/RJM/PJD | Timok_PEA_NI43-101_Report_2CR021.006_20171130.docx | November 2017 |
| SRK Consulting | |
| Timok PEA NI 43-101 | Page 147 |
• The rock mass rating of bedrock throughout the project area ranged from 36 to 57, typically indicating a rock mass designation of Poor to Fair
Design Basis
The mine will operate with a process plant throughput of approximately 8,900 tonnes per day (tpd). The TSF is required to store all tailings generated from processing and approximately 2.0 Mt of waste rock. The design basis for the TSF is summarized in Table 17.2.
Table 17.2: TSF design basis summary
Description | Value |
Bulk TSF | Pyritic TSF |
Mill Throughput | 8,900 tpd |
Tailings Generation | 6,455 tpd |
Mine Life | 16 years |
Tailings Total Tonnes | 37.7 Mt |
Tailings Split | 60% | 40% |
23.03 Mt | 14.7 Mt |
Tailings Storage Capacity | 16.45 Mm3 | 7.35 Mm3 |
Average Tailings Dry Density | 1.4 t/m3 | 2.0 t/m3 |
Waste Rock Storage Capacity | 0.7 Mm3 | 0.02 Mm3 |
Waste Rock Density (bank) | 2.8 t/m3 |
Operating Pond Volume (varies) | 0.05 to 0.5 Mm3 | 0.4 to1.4 Mm3 |
Storm Storage Volume (undiverted portion of PMF) | 1.0 Mm3 | 1.5 Mm3 |
Freeboard Allowance | 3 m |
The TSF embankments will be constructed using earthfill material. The bulk TSF embankment will use a downstream construction method for embankment expansion. The pyritic TSF embankment will use a centreline construction method for embankment expansion including the completion of the full embankment footprint for the starter (Stage 1) dam.
Construction Staging and Filling Schedule
The construction sequence for the facilities includes a starter (Stage 1 embankment) and ongoing expansions. Basin filling schedules were developed for the pyritic TSF and bulk TSF to define storage demand over the life of mine. The filling schedules were based on the depth-area-capacity relationship of each basin, and include storage for tailings, waste rock, operating pond, inflow design flood and freeboard.
The embankment staging for the bulk TSF and pyritic TSF are shown on the filling schedules on Figure 17.3 and Figure 17.4 respectively.
| Various/RJM/PJD | Timok_PEA_NI43-101_Report_2CR021.006_20171130.docx | November 2017 |
| SRK Consulting | |
| Timok PEA NI 43-101 | Page 148 |
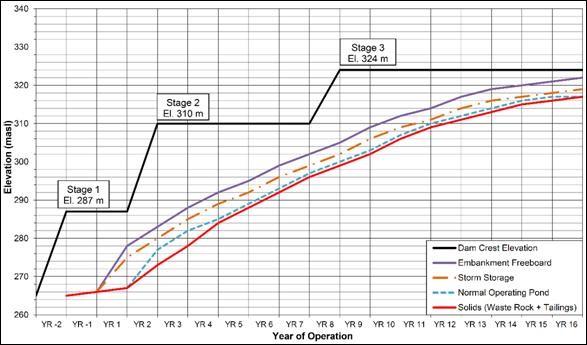
Source: Knight Piésold, 2017b
Figure 17.3: Bulk TSF filling schedule
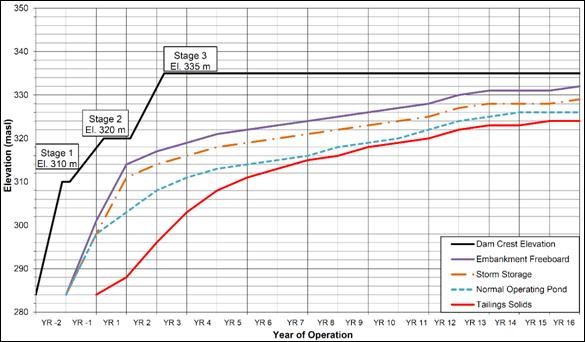
Source: Knight Piésold, 2017b
Figure 17.4: Pyritic TSF filling schedule
| Various/RJM/PJD | Timok_PEA_NI43-101_Report_2CR021.006_20171130.docx | November 2017 |
| SRK Consulting | |
| Timok PEA NI 43-101 | Page 149 |
Embankment Cross-Sections
Both TSF embankments are earthfill structures. Embankment fill material will be placed and compacted in controlled lifts. Both embankments have 3H:1V upstream and downstream slopes, with 8 m wide benches at designated staging elevations. The minimum embankment crest width is 10 m to provide safe work access and space for pipelines. The maximum heights of the bulk TSF and pyritic TSF embankments are approximately 90 m and 80 m, respectively, measured from the crest to the downstream toe of each embankment (in the ultimate Stage 3 configuration).
The bulk TSF embankment incorporates buttresses at the downstream toe. The Stage 1 buttress will form part of the ultimate (Stage 3) embankment. Foundation shear keys will be constructed downstream of the Stage 1 and Stage 3 bulk TSF embankments using compacted earthfill. Overburden in the embankment footprints may be more than 20 m thick. Most overburden will be removed from the embankment footprints.
Cross-sections through the embankments are presented on Figure 17.5 for the bulk TSF and Figure 17.6 for the pyritic TSF.
Source: Knight Piésold, 2017b
Figure 17.5: Bulk TSF embankment cross-section
Foundation Preparation and Basin Shaping
The bulk and pyritic TSF basins will be cleared of trees and stripped of topsoil. The basins will be shaped and graded to provide the required storage capacity and design foundation grades (3H:1V). The material excavated from within the basins will be used as embankment construction material (if it is suitable) or stockpiled for closure cover.
The basins will be graded in preparation for the placement of the high-density polyethylene (HDPE) geomembrane liner and clay liner at the pyritic TSF and bulk TSF, respectively.
| Various/RJM/PJD | Timok_PEA_NI43-101_Report_2CR021.006_20171130.docx | November 2017 |
| SRK Consulting | |
| Timok PEA NI 43-101 | Page 150 |
Source: Knight Piésold, 2017b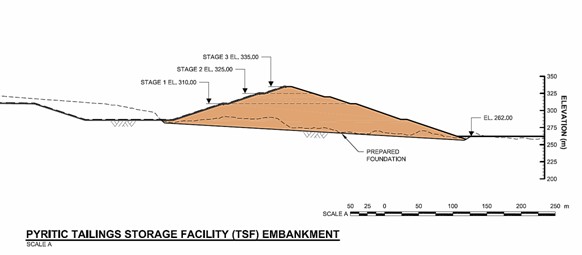
Figure 17.6: Pyritic TSF embankment cross-section
Liner Systems
The pyritic TSF basin, including the upstream embankment face, will be lined with HDPE geomembrane. A non-woven geotextile will be placed below the geomembrane, on top of a prepared subgrade as an additional measure to protect the liner. The bulk TSF basin liner includes low permeability locally sourced compacted clay for the basin liner, with HDPE geomembrane for the embankment upstream face. Details of the liner system are shown on Figure 17.7.
Source: Knight Piésold, 2017b
Figure 17.7: TSF liner systems
| Various/RJM/PJD | Timok_PEA_NI43-101_Report_2CR021.006_20171130.docx | November 2017 |
| SRK Consulting | |
| Timok PEA NI 43-101 | Page 151 |
Foundation Drain
A foundation drain will be installed within the footprint of the bulk TSF and pyritic TSF, below the liners, to collect groundwater flows, potential seepage and infiltration through the TSF embankments. The foundation drain will be installed beneath the HDPE liner in the pyritic TSF and beneath the clay liner in the bulk TSF. The drain consists of perforated drain pipe surrounded by drain gravel, in a drain trench. When the foundation drain passes beneath the TSF embankment, it will transition to a non-perforated pipe, which will discharge to the seepage collection and recycle pond downstream of the bulk TSF embankment. Collected water will be pumped back to the pyritic TSF. The seepage collection and recycle pond will be lined with HDPE geomembrane.
Bulk TSF Basin Underdrain
An underdrain will be installed above the compacted clay liner on the bulk TSF basin floor to promote tailings consolidation. It will discharge to a sump upstream within the basin, at the upstream toe of the embankment. The sump will be lined with HDPE geomembrane and filled with drain gravel. A submersible pump and a riser pipe will be installed to allow collection of water from the underdrain system. Collected water will be recycled to the pyritic TSF supernatant pond. Details of the underdrain are shown on Figure 17.8.
Mechanical Systems
The management of tailings slurry, reclaim water and potential seepage at the TSF requires the use of various pumps and pipelines, as described below.
Tailings Distribution Systems
The bulk and pyritic tailings streams are managed and stored separately. The bulk tailings will be delivered to the bulk TSF as a conventional unthickened slurry with a solids concentration of approximately 21% (by mass). The slurry will be conveyed from the plant site in a single HDPE pipeline. The tailings slurry will be discharged from the embankment using multiple spigot locations, and a small supernatant pond will develop on the south side of the facility adjacent to the pyritic TSF embankment. Water from the supernatant pond will be pumped into the pyritic TSF.
The pyritic tailings will be delivered to the pyritic TSF as a conventional unthickened slurry with a solids concentration of approximately 24% (by mass). The slurry is conveyed from the plant site in a single HDPE pipeline. The tailings slurry will be sub-aqueously discharged from two points (east and west) immediately upstream of the pyritic TSF embankment. The tailings solids be kept a minimum of one metre under a water cover. Pipe floats will support the pipelines to keep them on the surface of the pond, as needed.
Reclaim Water System
The reclaim water system consists of two separate but complementary mechanical systems: the bulk TSF water transfer system and the pyritic TSF return water system.
| Various/RJM/PJD | Timok_PEA_NI43-101_Report_2CR021.006_20171130.docx | November 2017 |
| SRK Consulting | |
| Timok PEA NI 43-101 | Page 152 |
Source: Knight Piésold, 2017b
Figure 17.8: Bulk TSF underdrain
The bulk TSF water transfer system will convey water released from the bulk tailings slurry to the pyritic TSF. The bulk TSF water transfer system consists of two float-mounted pumps (one operational and one standby), located adjacent to the downstream toe of the pyritic TSF embankment. The pumps will transfer water via HDPE pipeline into the pyritic TSF.
The pyritic TSF return water system will convey water from the pyritic TSF back to the plant site. A floating pump barge will be located on the south side of the pyritic TSF. The pump barge will consist of three pumps, two operational and one standby, to provide continuous process water supply to the plant site.
Basin Underdrain Pipeline
The basin underdrain is located at the base of the bulk TSF. The underdrain pipeline includes a submersible pump installed in a perforated HDPE pipe in a sump at the upstream toe of the bulk TSF embankment. The HDPE pipeline extends up the face of the embankment to the crest. Water recovered in the underdrain will be discharged to the pyritic TSF.
| Various/RJM/PJD | Timok_PEA_NI43-101_Report_2CR021.006_20171130.docx | November 2017 |
| SRK Consulting | |
| Timok PEA NI 43-101 | Page 153 |
TSF Seepage Collection System
Seepage from the bulk TSF and pyritic TSF will drain to the seepage collection pond via the foundation drain system. The seepage collection pond is located immediately downstream of the bulk TSF as shown on Figure 17.2. A pump system will return any collected seepage back to the pyritic TSF. The design capacity is based on potential seepage estimates and the seepage collection pond volume. The pump system will be capable of emptying the pond within seven days of a 1 in 10-year 24-hour precipitation event.
Instrumentation and Monitoring
Instrumentation will be installed in the TSF embankments and foundations, and monitored during construction and operations to assess performance and to identify any conditions that differ from those assumed during design and analysis. Amendments to the ongoing designs, operating strategies and/or remediation work can be implemented to respond to changing conditions, should the need arise.
17.2.2 Stability and Seepage Analysis
Stability of the TSF embankments was assessed under static, pseudo-static (seismic) and post-earthquake (residual strength) conditions. The analyses were based on the following:
• Typical design cross-sections
• Material parameters for the tailings, embankment fill zones and foundation materials estimated from existing tailings characterization data, the 2017 site investigation program, laboratory test work, and experience with similar projects
• Accepted standards for stability, as specified by the Canadian Dam Association (CDA)
The criteria, analyses, material parameters, and results of the stability assessment are summarized below. An evaluation of potential seepage from the facility was also completed.
Stability Analysis Summary
The stability analyses were completed for the embankment design configurations. Two-dimensional static slope stability modelling using the limit-equilibrium software Slope/W© (Geo-Slope International Ltd., 2012) was completed. The program computes the Factor of Safety (FoS) for a number of potential slip surfaces. The Morgenstern-Price method was used to estimate the FoS for the loading conditions. The evaluated conditions under static, pseudo-static and post-earthquake loading included:
• End of Stage 1 (Starter) Operations
• Stage 3 (Final) Arrangement
Pseudo-static limit equilibrium analyses were carried out using a horizontal seismic coefficient of 0.16 g, which corresponds to a 1 in 10,000-year event with an amplification factor of 0.5 applied (Melo and Sharma, 2004).
| Various/RJM/PJD | Timok_PEA_NI43-101_Report_2CR021.006_20171130.docx | November 2017 |
| SRK Consulting | |
| Timok PEA NI 43-101 | Page 154 |
Under post-earthquake conditions, a 40% reduction in strength (Makdisi and Seed, 1978) was applied to the tailings and foundation clay materials.
Stability Criteria
The minimum CDA FoS targets for embankment stability are as follows (CDA, 2014):
• Static stability:
˗ Immediately following construction: greater than 1.3 depending on risk assessment during construction
˗ During operations and at closure: 1.5 (assumes steady state seepage, normal reservoir level)
• Pseudo-static stability (seismic): 1.0
• Post-earthquake (residual strength) stability: 1.2
Stability Results
The critical slip surfaces for embankment stability generally develop through the near surface clay soils. The results of the modelling indicate that the Stage 1 and final (Stage 3) arrangements meet the required FoS targets for static and post-earthquake loading conditions with a toe buttress and foundation key.
Analyses indicate that both the pyritic and bulk TSF embankments do not achieve minimum FoS under pseudo-static conditions. Thus, a seismic displacement analysis was conducted using semi-empirical methods. The seismic displacement of the embankment was estimated for various slip surfaces using the Newmark (1965), Makdisi and Seed (1978), Bray and Travasarou (2007) and Swaisgood (2014) methods. Preliminary seismic deformation analyses indicate that displacements due to seismic activity are negligible (i.e. <0.1 m) and are within tolerable levels.
Seepage Analysis Summary
Potential seepage through the bulk TSF and pyritic TSF was estimated with the tailings and supernatant pond at the starter and ultimate filling level. The seepage will be collected in the foundation drain beneath the bulk and pyritic TSFs, routed to the seepage collection pond, and then pumped back to the pyritic TSF.
Estimated seepage rates are expected to be less than 1 L/sec for the pre-production (i.e. water storage prior to commencement of mill operations) phase in the pyritic TSF. No seepage is anticipated in the bulk TSF for pre-production as it is not anticipated to function as a water retaining facility. At full production, the total seepage rate was estimated to be less than 4 L/sec.
17.2.3 Site-Wide Water Management
Considerable investigative and explorative work has been undertaken between 2014 and 2017 to evaluate the surface and groundwater around the Timok project site. Consequently, the quantity and quality of data is beyond what might normally be expected at a PEA level. Hence the level of confidence is also greater than might be expected at this stage of study.
| Various/RJM/PJD | Timok_PEA_NI43-101_Report_2CR021.006_20171130.docx | November 2017 |
| SRK Consulting | |
| Timok PEA NI 43-101 | Page 155 |
The hydrogeology of the project area is determined by four geological formations:
• Clastic Miocene deposits
• Upper Cretaceous Bor conglomerates
• Upper Cretaceous marl
• Upper Cretaceous volcanic and volcanoclastic rocks
These all typically have very low hydraulic conductivity and low storativity. The range of mine water inflow throughout the mine life, as predicted by the model, is 12 m3/h (Year 1) to 122 m3/h (Year 5) with a mean value of 83 m3/h.
The groundwater quality during development is anticipated to be good in the early phases and discharge to the environment (Brestovačka River), with minimal treatment expected. During production, mine water will be collected and stored in the pyritic TSF for later re-use. Subsequent long-term and post-closure water from the TSF will be treated to a level suitable for discharge to the Borska River.
Sources of process makeup water will be mine water, TSF reclaim and TSF catchment runoff. If additional water is required, then water will be abstracted, under permit, from the Brestovačka River. It is not anticipated therefore that the Project will be short of water at any stage. Potable water will be sourced from the local Bor Municipality.
Mine dewatering will affect the local groundwater by lowering groundwater heads and it is predicted by numerical groundwater modelling that this will affect local wells. However, it is likely that many or most of these will be in Rakita ownership at that time. The model also suggests that impacts will also be felt in the Brestovačka and Borska rivers, with an average loss of 2 L/s and 8 L/s, respectively, over the mine life. Neither is a significant amount when compared to natural flows and may not be measurable. It is predicted by the numerical model that groundwater pressures will take up to 60 years to recover.
There remains some uncertainty as to whether the recovery of water level in the mined out underground workings will reach the surface. If it does then there would be potential for water from the mine workings to flow overland to the nearest surface watercourse and eventually into the Brestovačka River. There remains uncertainty also as to the likely quality of this water. However, on closure, any residual sulphide will be at considerable depth and when submerged, there will be no further potential for acid generation. It will then be many decades before the water in the void approaches the surface. By this time there will be opportunity for considerable dilution and buffering (from the overlying marl and other units). It is anticipated that no long-term closure requirements for water will be required. Nonetheless, further work is required (for a Pre-Feasibility Study and beyond) to help predict both the timescale of the water level recovery and the long-term water quality within the mine workings.
| Various/RJM/PJD | Timok_PEA_NI43-101_Report_2CR021.006_20171130.docx | November 2017 |
| SRK Consulting | |
| Timok PEA NI 43-101 | Page 156 |
Future work should also involve: (a) extending the water balance to include all the mine with the inclusion of water quality modelling; (b) hydrogeological testing from the exploration decline as it is constructed; and (c) sampling and testing of potentially buffering material (overlying marl and other units) and geochemical modelling to predict water quality in the final void.
| Various/RJM/PJD | Timok_PEA_NI43-101_Report_2CR021.006_20171130.docx | November 2017 |
| SRK Consulting | |
| Timok PEA NI 43-101 | Page 157 |
18 Market Studies and Contracts
18.1 Copper Concentrate
Copper grades of 20% can be considered atypical and in a weak market may lead to higher smelter charges and/or lower effective payable percentages of the contained copper content. The gold grades are within acceptable ranges with gold payable levels expected to be in line with industry norms.
Arsenic levels can be expected to attract penalties in line with industry norms. Nevsun is of the opinion that all of the Project’s copper concentrates will be marketable and sales can be made at acceptable terms in line with the market for complex concentrates. Any future relaxation of the current arsenic import limits on copper concentrates to China may materially improve commercial terms and represent an upside to the Project.
Table 18.1 summarizes the key assumptions for the sale of the Project’s copper concentrate. The assumptions are based on Nevsun’s current views of future conditions in the copper concentrate market supported in part by the recently commissioned Bluequest marketing study (Bluequest, 2017). The figures shown are preliminary and reflect the cautious approach taken by Nevsun over the LOM; fluctuations year to year based on grade, quality and geographical location have been averaged in the economic model.
Table 18.1: Copper concentrate commercial term assumptions
Copper payable percentage | % | 95.2% |
Gold payable percentage | % | 83.2% |
Copper concentrate treatment charge | US$/dry metric tonne | $157 |
Copper concentrate refining charge | US$/pound Cu | $0.157 |
Arsenic penalty charge | US$/dry metric tonne | $40 |
Gold refining charge | US$/ounce Au | $5 |
Transport and other selling costs | US$/dry metric tonne | $83 |
Treatment charges (TC) are applied per dry metric tonne of copper concentrate and copper refining charges (RC) are calculated per payable pound of copper. Metal payable percentage is normally used to describe the proportion of metal for which payment will be made and in the case of copper payables, usually include a minimum unit deduction of at least 1.0 unit (each unit representing 1% copper) against the contained copper grade. The minimum unit deduction achieved is dependent on the commercial terms negotiated and increases inversely with the copper grade.
Penalty rates used for the economic analysis for arsenic are in line with anticipated market terms, and increase progressively as follows:
• US$ 3.0/dmt for every 0.1% arsenic above 0.2% to 0.5%
• US$ 5.0/dmt for every 0.1% arsenic above 0.5% to 1.5%
| Various/RJM/PJD | Timok_PEA_NI43-101_Report_2CR021.006_20171130.docx | November 2017 |
| SRK Consulting | |
| Timok PEA NI 43-101 | Page 158 |
• US$ 6.0/dmt for every 0.1% arsenic above 1.5% to 3.0%
In line with a cautious approach, an incremental charge has been added to the assumed benchmark TC’s and RC’s (benchmark TC of $92.50 per dmt and benchmark RC of $0.0925 per payable pound used) for the LOM economic assessment. An improvement in overall terms for the complex copper concentrate market represents a significant potential benefit, though much will depend on future supply and demand.
Nevsun has not entered into any concentrate sales contracts for this Project and has not committed any tonnages to or fixed any terms with any potential customers. Nevsun’s preferred sales strategy is to commit the majority of its production under longer-term contracts with smelters directly. Any uncommitted balance will be placed onto the spot market or under contract to traders with blending operations. The tonnage allocation to each customer will be driven in part by product requirements, favourable logistics (proximity to Project), counterparty credit risk and diversification, and commercial terms that can be achieved with individual buyers. For purposes of this PEA, Nevsun has modelled the sales of the Project’s yearly copper concentrate production to a combination of specialized smelters in Europe and Asia, and traders with blending operations.
18.2 Pyrite Concentrate
Pyrite concentrate production containing an appreciable amount of recovered gold is considered a waste product in this PEA and will be separately stored in the tailings management facility. The gold grades in pyrite are not currently economic to market as a separate concentrate at assumed gold prices and commercial terms.
The pyrite concentrate does however provide a future opportunity (i) to recover gold economically, should a viable on-site processing route be found, (ii) to blend with the copper concentrates to improve the overall net smelter return of the Project through higher gold revenues and lower smelter charges associated with reduced arsenic grades in concentrate or (iii) if gold prices appreciate sufficiently. Further examinations of these alternatives will be carried forward to future studies.
| Various/RJM/PJD | Timok_PEA_NI43-101_Report_2CR021.006_20171130.docx | November 2017 |
| SRK Consulting | |
| Timok PEA NI 43-101 | Page 159 |
19 Environmental Studies, Permitting and Social or Community Impact
19.1 Environmental Studies
The Project is subject to Serbian environmental legislation covering environmental protection, environmental impact assessment (EIA), water, air quality, noise, waste management, biodiversity and cultural heritage. Serbia is an accession state to the European Union (EU), and as such, it is working to harmonise its environmental legislation with that of the EU. The Project will adhere to Serbian, EU, and the International Finance Corporation environmental and social standards. The Serbian EIA regulation differs from the international standards mainly in its requirements for stakeholder engagement, which in Serbia are significantly more lenient. The Project will follow the more stringent international stakeholder engagement standard.
The Project has contracted ERM, a UK-based environmental consulting company, to perform EIA activities. ERM has subcontracted part of the work to Envico, a Serbian environmental consulting company based in Belgrade.
Development of the EIA requires a project description that identifies the project activities during construction, operation, and closure/post-closure at a basic engineering design level. Conceptual level Project design information has enabled EIA scoping, tentative definition and implementation of baseline data collection, and preliminary impact assessment. Progress on the EIA will continue through the feasibility study phase.
The basic engineering design now underway includes alternatives analyses to determine the optimum project configuration and design. The selection of preferred design alternatives should be made on the basis of environmental, technical and economic criteria, and documented in the EIA project description.
Based on the current Project definition, most of the baseline data needed for the EIA has been obtained. Any proposed Project facilities that lie outside of the conceptual Project footprint as currently defined, such as any unpermitted quarries, borrow areas, etc., would likely trigger additional baseline data collection requirements.
Based on the EIA scoping activities, a preliminary internal version of an EIA report is being prepared to identify the likely Project impacts and potential management measures. The intent is to provide early feedback to the Project’s engineering team so that design alternatives can be analyzed with consideration of the environmental impacts and associated management alternatives. The objective is to develop a preferred environmental and social management strategy, and prepare and implement the associated environmental management plans.
The recent Ministry of Environment ruling that the exploration decline development can proceed without an EIA was accompanied by a series of environmental management requirements as conditions of approval. While the Company is relying on this ruling, there is no certainty that the decline permit will be granted without an EIA or that such permit will be granted on a timely basis or at all. Prior to starting construction activities at the exploration decline portal site, the Project should have environmental management plans in place with specific procedures established, and the resources to implement them, in order to comply with these permit conditions. The relevant provisions of these management plans should be contractually enforced upon the earthworks and tunnelling contractors, who should be required to submit and implement their own plans accordingly.
| Various/RJM/PJD | Timok_PEA_NI43-101_Report_2CR021.006_20171130.docx | November 2017 |
| SRK Consulting | |
| Timok PEA NI 43-101 | Page 160 |
A range of environmental considerations is presented in this report based on the preliminary environmental impact assessment and identification of applicable management measures. As is often the case with mining projects, water supply and quality are the most significant environmental issues. Other issues with potentially significant environmental management implications include noise emissions during portal construction and the deterioration or destruction of habitat of listed species.
19.2 Permitting
The Project is among the first of the major new mining projects to be permitted in Serbia since the Yugoslav breakup. Serbian regulators have no recent relevant experience. Until late last year, the regulatory process had been untested. The permitting process, while understood, is not fully within a project's control. Some of the factors and conditions affecting the permitting process include the timely review of applications, availability of technical studies and design information, land acquisition, community relations and politics. There is no certainty that all conditions and requirements will be satisfied for the granting of permits and that permits will be granted on a timely basis or at all, which could affect target dates and the conclusions in this PEA. Target dates for obtaining permits are estimates based on information available as of this study's effective date and are subject to change.
The Project permitting process is on two separate and parallel tracks. The first permitting track involves obtaining approval to start developing the exploration decline and the associated surface based supporting infrastructure at the portal site. The other permitting effort focuses on those permits required to develop and operate the balance of the project facilities, including the portion of the underground mine extending into the deposit, the mineral processing facilities and related supporting infrastructure.
The strategy for permitting of the decline development is to seek approval from the Ministry of Mining and Energy under the Project’s existing exploration license. The proposed decline and surface infrastructure around the portal are being permitted as exploration works, not mining (exploitation) facilities. This avoids various lengthy permitting cycles that would be triggered by development of full-fledged mineral exploitation related facilities, and gives the Project an estimated one-year advance start to begin driving the decline towards the deposit. Decline permitting comprises 11 permit steps, seven of which are complete. Approval to start decline development is anticipated by the end of 2017.
The Project has started permitting the planned non-decline facilities as well, including the portion of the underground mine extending into the deposit, the mineral processing facilities and supporting infrastructure. This comprises 22 additional permitting steps, including two that are completed and five more that are in progress.
19.3 Social Impact
The social baseline for impact assessment purposes has been established from studies conducted in Bor Municipality, including five settlements surrounding the project site: Slatina, Brestovać, Metovnića, Ostrelj and Sarbanovać. The studies were undertaken in October 2015 and February 2017. Data were collected through interviews with individuals who had specific interest or knowledge of the study area such as local healthcare professionals and government officials. Focus group discussions were undertaken with groups of men and women separately in all settlements, as well as separate discussions with farmers, fishermen and beekeepers. The social baseline covers the following specific topics: demographics; gender equality; education; health; economy; employment; working conditions; land ownership; ecosystem services; traffic; and transportation infrastructure.
| Various/RJM/PJD | Timok_PEA_NI43-101_Report_2CR021.006_20171130.docx | November 2017 |
| SRK Consulting | |
| Timok PEA NI 43-101 | Page 161 |
A preliminary social impact assessment has been performed. The significance of potential project effects has been evaluated for a range of social impacts and recommended management measures have been identified to mitigate negative impacts and enhance positive ones. The following specific types of potential social impacts have been evaluated:
• Physical and economic displacement from Project land acquisition
• Loss of priority ecosystem services (mainly water, fish and woodland)
• Economic growth
• Local employment and skills enhancement
• Local procurement
• Loss of employment and business opportunities upon construction completion and mine closure
• Population influx and change to demographics
• Working conditions
• Occupational health and safety
• Community grievance over unmet expectations
• Vehicular traffic congestion
• Traffic safety
• Degradation of roads
• Disturbance from dust and noise
• Risk of accidents due to trespassing on site
• Conflict between the community and security providers
19.4 Closure
19.4.1 Closure Objectives and Criteria
This report describes PEA level mine closure activities for the proposed Timok project and related project components. The primary objective of the closure and reclamation activities will be to return the project area to a self-sustaining state, while managing surface water and protecting the downstream environment. This will be accomplished during both active and passive closure phases.
| Various/RJM/PJD | Timok_PEA_NI43-101_Report_2CR021.006_20171130.docx | November 2017 |
| SRK Consulting | |
| Timok PEA NI 43-101 | Page 162 |
To the extent practicable, mine closure efforts will aim to return the site to a condition that generally conforms to the surrounding terrain and does not impose safety concerns to the public. The site will be monitored and maintained during post-closure in order to demonstrate that the designs meet these conditions.
Herein, active closure is defined as the period during which water quality objectives are achieved by active management on site. Passive closure is defined as the period during which the site facilities have been reclaimed, untreated water quality is suitable for release, and the final water regime reaches a steady-state.
In determining the most suitable closure strategy for each infrastructure component, the closure criteria were aligned with international best practices for closure and rehabilitation. During later stages such as a future PFS and more so, FS, closure design practices should be compared and revised to address requirements and standards from EU Mining Waste Directive (EU, Directive 2006/21/EC, 2006). For the purposes of PEA closure design, the following closure criteria were considered:
• Demolish and remove all industrial facilities to a purpose-built landfill and rehabilitate affected footprints
• Cover remaining infrastructure foundations with a minimum of 1.0 m of soil
• Restrict access to subsidence zone
• Reduce infiltration into the TSF and manage runoff from the TSF
• Maintain stored tailings in a physically and chemically stable state
• Minimize contact water by isolating mine development areas with diversion and collection ditches
• Collect and contain mine contact water to the extent practicable, and treat as needed
• Limit the effect of contact water on the chemistry of surface and groundwater
• Establish adequate vegetation to ensure erosion protection of the soil slopes and other final reclaimed surfaces
• Minimize the extent of new land disturbance during active closure
19.4.2 Decline Zone Closure Description and Schedule
The “Decline Zone” is located on the southern edge of the project boundary as illustrated in Figure 3.3. Major infrastructure in this zone, supporting the access to the underground portal, includes: administration buildings, process feed conveyor, workshops, laydowns, topsoil and waste rock stockpiles, and water management ponds and channels.
| Various/RJM/PJD | Timok_PEA_NI43-101_Report_2CR021.006_20171130.docx | November 2017 |
| SRK Consulting | |
| Timok PEA NI 43-101 | Page 163 |
The basis for closure design for major infrastructure located in the Decline Zone is summarized in Table 19.1.
Table 19.1: Decline Zone closure design basis and schedule
Infrastructure subject to Active Closure | Closure Basis | Estimated Major Units | Closure Schedule |
Water Monitoring Treatment Pond | Regrade pond landform to a closure landform. Route existing diversion channels through pond foot print to existing discharge location | 2,000 to 4,000 m2 | Active Closure |
Sediment Control Pond | Regrade pond landform to a closure landform. Route existing diversion channels through pond foot print to existing discharge location. Regrading to be sequenced at the end of active closure such that existing facilities can be utilized during early closure activities. | 1,000 to 2,500 m2 | Active Closure |
Topsoil Stockpiles (5) | Use as cover over concrete foundations and Portal Area Box Cut | 30,000 to 50,000 m2 | Active Closure |
Portal Access Box-Cut | Backfill and regrade Box Cut slopes to blend into existing landform. Topsoil stockpile material to be placed as cover. | 25,000 to 35,000 m3 | Active Closure |
Decline Openings | Construct concrete barriers in Conveyor Decline and Access Decline Opening | $500,000 Lump Sum | Active Closure |
Decommissioning Diversion Channels | Regrade existing surface water diversion ditches at the end of active closure such that existing channel can be utilized during early closure activities. | $100,000 Lump Sum | Active Closure |
Local Landfill for Demolition Wastes | Construct local landfill to consolidate structural materials | $1,500,000 Lump Sum | Active Closure |
Ore Conveyor | Demolition of Conveyor – Assumes no salvage | $2,500,000 Lump Sum | Active Closure |
Buildings and Foundations | Demolition of all building to existing ground surface – Assumes no salvage | $1,000,000 Lump Sum | Active Closure |
Decommission Access Roadways | Allocate decommissioning costs to access roadways that are to be scarified and regraded | $150,000 Lump Sum | Active Closure |
Final Road Network | Allocated closure cost to construct or upgrade a road network within the Decline Zone | $1,000,000 Lump Sum | Active Closure |
Transmission Line | Demolition of Transmission line between sub station and Portal Decline – Assumes no salvage | $1,000,000 Lump Sum | Active Closure |
Revegetation Disturbed Surfaces in Decline Zone | Applies to all disturbed surfaces – general seed and fertilizer assumed | 50,000 to 75,000 m2 Lump Sum | Active Closure |
19.4.3 Processing Facilities Zone Closure Description and Schedule
The “Process Facilities Zone” is located northeast of the Decline Zone and south of the “Subsidence Zone”. Major infrastructure in this zone supports mineral processing. A detailed list of infrastructure is provided in Section 17. Figure 3.3 illustrates the location of the Processing Facilities Zone and Figure 17.1 illustrates the site orientation of the infrastructure within it.
| Various/RJM/PJD | Timok_PEA_NI43-101_Report_2CR021.006_20171130.docx | November 2017 |
| SRK Consulting | |
| Timok PEA NI 43-101 | Page 164 |
The basis for closure design for major infrastructure located in the Processing Facilities Zone is summarized in Table 19.2.
Table 19.2: Processing Facilities zone closure design basis and schedule
Infrastructure for Active Closure | Closure Basis | Estimated Major Units | Closure Schedule |
Process Plant | Demolition of all building to existing ground surface – Assumes no salvage or resale | $17,000,000 Lump Sum | Active Closure |
Local Landfill for Demolition Wastes | Construct local landfill to consolidate structural materials | $3,000,000 Lump Sum | Active Closure |
Topsoil Stockpiles | Regrade over concrete foundations sloped to prevent ponding | 60,000 m2 | Active Closure |
Decommission Access Roadways | Allocate decommissioning costs to access roadways that are to be scarified and regraded | $150,000 Lump Sum | Active Closure |
Fuel and Oil Storage | Allocation to provide additional hydrocarbon remediation of soils | 20,000 m2 | Active Closure |
Revegetation of Disturbed Surfaces in Processing Facilities Site Zone | Applies to all disturbed surfaces – General Seed and Fertilizer | 60,000 m2 | Active Closure |
19.4.4 Subsidence Zone Closure Description and Schedule
The “Subsidence Zone” is located northwest of the Processing Facilities Site Zone. At this stage of project development, only major surface infrastructure associated with this zone have had closure considerations. This infrastructure includes the vent shafts and a perimeter fence around the preliminary subsidence zone. Figure 3.3 illustrates the location of the Subsidence Zone and orientation of the infrastructure proximal to it.
The basis for closure design for major infrastructure located in the Subsidence Zone are summarized in Table 19.3.
Table 19.3: Subsidence Zone closure design basis and schedule
Infrastructure for Active Closure | Closure Basis | Estimated Major Units | Closure Schedule |
Vent Shafts (2) | Demolition of all surface infrastructure existing ground surface and construct a concrete cover over vent shaft opening – Assumes no salvage or resale | $500,000 | Active Closure |
Perimeter Fence | Construct access barrier fence around perimeter of subsidence zone. | 5,000 m | Active Closure |
| Various/RJM/PJD | Timok_PEA_NI43-101_Report_2CR021.006_20171130.docx | November 2017 |
| SRK Consulting | |
| Timok PEA NI 43-101 | Page 165 |
19.4.5 Infrastructure Zone Closure Description and Schedule
The basis for closure design for major infrastructure located in the “Infrastructure Zone” are summarized in Table 19.4.
Table 19.4: Infrastructure Zone closure design basis and schedule
Infrastructure for Active Closure | Closure Basis | Estimated Major Units | Closure Schedule |
Public Access Re-Alignment Road | No Closure – Public road to remain post closure | NA | Passive Closure |
Transmission Sub Station | No Closure – Infrastructure to be repurposed to local Serbian Transmitting System Operator | NA | Passive Closure |
19.4.6 TSF Closure and Reclamation
TSF closure will be completed in a manner that will satisfy physical stability, chemical stability and meet environmental and social targets.
The primary objective of the closure and reclamation activities will be to return the project area to a self-sustaining state, while managing surface water and protecting the downstream environment. This will be accomplished during both active and passive closure phases.
Active closure and passive closure activities will be conducted in accordance with international best practice, and measures will be taken to ensure that:
• TSF embankments remain stable
• Stored tailings remain physically and chemically stable
• Runoff does not affect surface or groundwater
Active Closure
During the decommissioning phase, any deleterious or potentially acid generating materials from the mine site will be deposited into the pyritic TSF. The pyritic TSF will be closed first by pumping out the supernatant water into the bulk TSF. A cover system will be installed following dewatering of the pyritic TSF. The pyritic TSF will be capped with clay and a low-density polyethylene geomembrane liner. The liner will be capped with till and then covered with soil from the construction soil stockpiles to develop a landform, which will be vegetated and graded to drain surface runoff towards the closure channels.
The supernatant water in the bulk TSF will be allowed to dilute with rainwater and runoff until it reaches discharge water quality according to Serbian legislation. If required, the supernatant can be circulated through the water treatment plant in order to achieve compliance more rapidly. The bulk TSF will then be dewatered, with water discharged to the Bor River. Runoff will be directed by the west and east diversion channels. Emission limit values will be defined within the facility’s permit, based on best available technology. The bulk TSF will then be capped with soil sourced from designated stockpiles. Embankment material above the tailings level will be removed and will be used as non-acid generating cover material to develop the final TSF landform.
| Various/RJM/PJD | Timok_PEA_NI43-101_Report_2CR021.006_20171130.docx | November 2017 |
| SRK Consulting | |
| Timok PEA NI 43-101 | Page 166 |
Physical and chemical stability of the TSF landforms will be monitored during the post-closure phase. No long-term maintenance is expected once the landform is established. Any surface water runoff in the TSF landform area is not anticipated to be affected by the chemistry of the tailings and waste contained within the TSF landform. The seepage recovery pond will be decommissioned once the final closure form is completed.
Passive Closure
The objective for passive closure is for the project area to function in a self-sustaining passive state that requires little to no maintenance. Permanent drainage features will be established to collect and direct runoff around the area, and prevent the pooling of water. Long-term monitoring will be required to ensure that the physical and chemical stability of the TSF landform remain in compliance with legislated requirements.
| Various/RJM/PJD | Timok_PEA_NI43-101_Report_2CR021.006_20171130.docx | November 2017 |
| SRK Consulting | |
| Timok PEA NI 43-101 | Page 167 |
20 Capital and Operating Costs
20.1 Assumptions and Exclusions
20.1.1 Currency and Accuracy
The overall capital cost estimate was compiled in United States dollars.
The capital and operating cost estimates were prepared at a level of accuracy of ±35%.
20.1.2 Responsibility
The responsibility for preparation of the capital and operating cost estimates was shared amongst:
• Ausenco – process plant and surface infrastructure
• Knight Piésold – waste management
• SRK Consulting – underground mining
• Conveyor Dynamics – overland and underground conveyors
• Rakita Project Team – surface infrastructure
• Nevsun – corporate costs and contingency
20.1.3 Exclusions from the Capital Cost Estimate
• No external infrastructure such as rail loading, port, public roads or other external infrastructure that is not on-site and directly associated with the Project is included in the estimate.
• The contingent payment from Rakita/Nevsun to Freeport is considered a corporate cost and is not included in the capital estimate.
• VAT is excluded for simplicity on the basis that it is refundable
• Bonding costs for closure, or other environmental bonding costs are not included. Closure is included as a cash cost incurred at the time of project closure.
• Financing costs are not included.
• Any costs incurred prior to the start of 2018 are considered to be “sunk” and are not included.
20.2 Capital Cost Estimate
20.2.1 Capital Cost Summary
The capital cost for the Project was estimated in a number of work packages. The summary of the capital program, including $15.1M of capitalized operating expenditures, is shown in Table 20.1.
The schedule for the capital expenditure (Capex) annual spending profile is provided in Figure 20.1. Capex is concentrated in the years 2019 to 2021. Production is scheduled to commence in 2021.
| Various/RJM/PJD | Timok_PEA_NI43-101_Report_2CR021.006_20171130.docx | November 2017 |
| SRK Consulting | |
| Timok PEA NI 43-101 | Page 168 |
Table 20.1: Capital expenditure summary
Category | Initial Capex ($M) | Sustaining Capex ($M) | LOM ($M) |
Mining | | | |
Development | 129.4 | 26.7 | 156.1 |
Equipment | 28.3 | 93.1 | 121.4 |
Mining Contract Owner's Cost | 7.1 | 0.0 | 7.1 |
Total Mining | 164.8 | 119.8 | 284.6 |
Mine Infrastructure | | | |
Conveyors | 24.9 | 15.3 | 40.2 |
Crusher | 4.7 | 8.5 | 13.2 |
Underground Infrastructure | 40.3 | 14.3 | 54.6 |
Total Mine Infrastructure | 69.9 | 38.1 | 108.0 |
Surface Infrastructure | | | |
Power Infrastructure | 3.5 | 1.4 | 4.9 |
General Site Construction | 20.3 | 13.4 | 33.7 |
Total Surface Infrastructure | 23.8 | 14.8 | 38.6 |
Process Plant | | | |
Process Plant | 87.0 | 46.1 | 133.0 |
Site Infrastructure | 25.5 | 5.1 | 30.6 |
Total Process Plant | 112.5 | 51.2 | 163.7 |
Waste Management | | | |
Water Management Facilities | 6.3 | 0.5 | 6.8 |
Waste Rock Management | 4.5 | 4.5 | 9.0 |
Tailings Storage Facilities | 45.0 | 46.3 | 91.3 |
Soil Stockpiles | 6.5 | 0.5 | 7.0 |
Engineering | 6.2 | 5.2 | 11.4 |
Total Waste Management | 68.5 | 57.0 | 125.5 |
Water Management | | | |
Portal | 0.8 | 0.3 | 1.1 |
Process Plant and Water Treatment Plant | 2.5 | 1.0 | 3.5 |
Total Water Management | 3.3 | 1.3 | 4.5 |
Closure | | | |
Closure | 0.0 | 57.5 | 57.5 |
Total Closure | 0.0 | 57.5 | 57.5 |
Owner’s Costs | | | |
Owner’s Costs | 69.9 | 0.0 | 69.9 |
Total Owners Costs | 69.9 | 0.0 | 69.9 |
Global Contingency | 102.5 | 60.2 | 162.7 |
Grand Total | 615.1 | 399.8 | 1,014.9 |
Total pre-production expenditure is $630.2M, including capitalized Opex of $15.1M.
| Various/RJM/PJD | Timok_PEA_NI43-101_Report_2CR021.006_20171130.docx | November 2017 |
| SRK Consulting | |
| Timok PEA NI 43-101 | Page 169 |
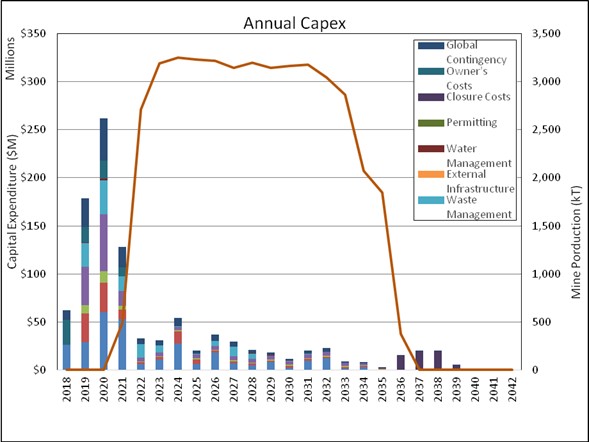
Figure 20.1: Capital expenditure profile
20.2.2 Underground Mine Capital Cost Estimate
Summary of Assumptions for Estimate
It will take approximately three years for initial development of the Timok underground mine and an additional two years for the production ramp-up period (the first of which is a partial year in the pre-production period).
The mining capital cost estimated was based on the following:
• Preliminary project development plan
• Mining equipment list
• Budget quotes for the major equipment obtained from equipment manufacturers
• Contractor equipment lease
• Contractor labour rates
• Budget quotes from the mining contractors for vertical development and geotechnical drilling
| Various/RJM/PJD | Timok_PEA_NI43-101_Report_2CR021.006_20171130.docx | November 2017 |
| SRK Consulting | |
| Timok PEA NI 43-101 | Page 170 |
• SRK in-house database
• Existing on-site and regional costs provided by Rakita, including:
˗ Owner labour rates
˗ Diesel fuel cost
˗ Electrical power cost
˗ Concrete/shotcrete costs
It was assumed that all mine development during mine pre-production stage will be done by a contractor. The contractor will provide all labour, equipment and supplies, which are not provided by the owner.
No allowance for escalation, inflation factors or interest during construction were used in the estimates.
Underground Mine Development
All underground mine development costs were included in the capital cost estimate except waste and ore drawpoints and slot drives (included in operating costs). Underground mine development costs were estimated from first principles and were then compared to SRK’s database for mine development by a contractor.
The following cost items were considered for the development cost estimate:
• Contractor mobilization cost
• Unit cost per metre of development
• Contractor overhead labour cost
• Contractor equipment lease
• Contractor support equipment and facilities
The contractor will supply their own mobile equipment for mine development. The contractor will demobilize from the mine site after completion of their work.
The initial capital cost for mine development is estimated at $129.4M, with sustaining capital thereafter of $26.7M.
Underground Mine Mobile Equipment
The purchase of a permanent mining equipment fleet will be required for the mine production activities performed by the owner.
Mobile equipment costs were developed from estimated fleet requirements and vendor budgetary quotations. Unless provided by each vendor, the following assumptions were made for the additional expenses at initial equipment purchase:
| Various/RJM/PJD | Timok_PEA_NI43-101_Report_2CR021.006_20171130.docx | November 2017 |
| SRK Consulting | |
| Timok PEA NI 43-101 | Page 171 |
• 5% of equipment budgetary price to cover initial parts stock
• 4% of equipment budgetary price to cover freight and on-site assembly
• 2% of equipment budgetary price to cover equipment commissioning and training
Equipment life-cycle operating hours were based on manufacturer recommendations and SRK project experience. The recommended life-cycle operating hours were used to calculate equipment replacement requirements.
The schedule for major equipment rebuilds and replacement was based on equipment operating hours and anticipated equipment life. It was assumed that all equipment will have one major rebuild (60% of initial price) before replacement.
The initial capital cost for mine mobile equipment is estimated at $28.3M, with sustaining capital thereafter of $93.1M.
Capitalized Mining Operating Costs
The mining operation costs during the period prior to production was included in the initial capital costs for mine development. The total capitalized operating cost during this period is $16.34M and includes the following:
• Operating development of $7.49M
• Production drilling of $1.01M
• Material handling of $6.75M
• Mine services of $1.09M
Note that an additional $15.1M of mining operating costs are capitalized in the economic analysis for the period after start of mine production (bringing process feed to surface), but prior to process plant commissioning.
Owner’s Costs for Mining
Owner’s costs for mining include all the owner expenses to support and execute the mining component of the project. They are essentially contract management costs and are additional to the overall project management costs discussed in Section 1.1.1.
It was assumed that the Project will be managed by the owner. All owner’s labour in mine pre‑production period was included in the owner’s capital cost of $7.15M.
20.2.3 Mine Infrastructure
This package covers the underground mine infrastructure such as crushers, conveyors, electrical reticulation, pumping infrastructure and ventilation infrastructure.
| Various/RJM/PJD | Timok_PEA_NI43-101_Report_2CR021.006_20171130.docx | November 2017 |
| SRK Consulting | |
| Timok PEA NI 43-101 | Page 172 |
Conveyors
CDI provided cost estimates for the supply and installation of the mine conveyor system. Two conveyors, CV01 and CV02, plus the initial crusher discharge conveyor are included in the initial capital estimate at a cost of $24.9M.
An additional four shorter conveyors are included in sustaining capital, timed to coincide with the crusher relocation. The total cost for those conveyors, including all sustaining conveyor capital for the LOM, is $15.3M.
Crushers
Ausenco provided an estimate of $4.7M (without contingency) for the initial crusher supply and installation (excluding excavation costs, which are included in the mine development costs) as summarized in Section 15.5.3. For the second crusher procurement and relocation costs, this initial cost was simply applied again, as part of sustaining capital, and timed to be co-incident with the scheduled relocation form a mine schedule perspective. Total sustaining capital for the crusher is $8.5M.
Underground Mine Infrastructure – General
Underground infrastructure costs were based on the preliminary estimated amount of required underground infrastructure, equipment quotes and indicative costs of underground infrastructure taken from contractor quotes for similar projects. The underground mine infrastructure costs include equipment purchase and installation.
Underground mine infrastructure initial capital totals $40.3M. An additional $14.3M is spent on sustaining capital over the life of the Project on these categories.
20.2.4 Surface Infrastructure
Surface infrastructure includes power infrastructure not covered by mining and processing estimates, as well as the offices, bathhouse, warehouse, general roads and site services not covered elsewhere.
The pre-production expenditure totals $23.8M and sustaining capital is $14.8M over the life of the mine. The estimates were undertaken at a high-level, commensurate with a PEA, and will be refined and updated through PFS and FS.
20.2.5 Processing Plant
The base date of all estimates related to the processing plant is the second quarter of calendar year 2017 (Q2 2017). No allowance has been included in the estimates for escalation beyond this date.
New mechanical equipment costs were based on budget quotations for major equipment and Ausenco’s database for minor equipment.
Allowances have been included for engineering design and spares.
| Various/RJM/PJD | Timok_PEA_NI43-101_Report_2CR021.006_20171130.docx | November 2017 |
| SRK Consulting | |
| Timok PEA NI 43-101 | Page 173 |
The capital cost estimates presented in the study are total cost estimates and include growth, as discussed in Section 20.1. The estimates do not include or allow for Owner’s costs, escalation or foreign exchange fluctuations.
The initial capital cost estimate for the process plant is $87.0M ($46.1M sustaining capital) and for site infrastructure is $25.5M ($5.1M sustaining capital).
20.2.6 Waste Management
This works package covers both tailings and waste rock storage.
A cost estimate was prepared for the PEA design of the waste and water management facilities. Costs are separated into initial capital and sustaining capital assuming a life of mine of 16 years. Preliminary estimates of the closure costs for the TSF and adjacent facilities are included. A summary of the costs is included in Table 20.2.
Table 20.2: Waste management cost estimate summary
Waste Management | Initial ($M) | Sustaining ($M) |
Water Management Facilities | $6.3 | $0.5 |
Waste Rock Management | $4.5 | $4.5 |
Tailings Storage Facilities | $45.0 | $46.3 |
Soil Stockpiles | $6.5 | $0.5 |
Engineering | $6.2 | $5.2 |
Total (excl. contingency) | $68.5 | $57.0 |
20.2.7 Water Management
Water management estimates were prepared in accordance with the quantities estimated from hydrogeological studies relating to likely inflows to the mine, as well as climate and hydrological studies estimating precipitation and surface water flows. Capital costs associated with water management for the construction period are estimated at $3.25M, with sustaining capital of $1.29M exclusive of contingency. Initial capital is primarily made up of $0.78M relating to the portal and $2.14M relating to the process plant site.
20.2.8 Closure
Closure costs were estimated at $57.5M for the whole site. Closure costs primarily include the rehabilitation of the mine, plant site and TSF.
20.2.9 Owner’s Costs
Owner’s costs were supplied by Rakita and Nevsun. The total owner’s costs in the capital estimate are $69.9M and are spent over the period prior to process plant commissioning at an average rate of approximately $20M per year. Owners costs cover:
| Various/RJM/PJD | Timok_PEA_NI43-101_Report_2CR021.006_20171130.docx | November 2017 |
| SRK Consulting | |
| Timok PEA NI 43-101 | Page 174 |
• Land acquisition purchase costs, including taxes
• Project legal costs
• Exploration, drilling and assaying, resource modelling and mining studies
• Product marketing
• Feasibility studies and test work
• Environmental studies and permitting
• Business and other regulatory approvals and licences
• Mining and exploration lease payments and other maintenance costs
• Goodwill and local infrastructure contributions
• Owner’s field staffing (e.g. management technical, safety, security, administration and accounting personnel)
• Owner’s general field expenses (e.g. building purchase or rental costs, furniture, protective clothing and safety equipment, communications, office equipment and consumables, medical expenses, computers and software)
• Commissioning, staffing and training programs
• Owner’s miscellaneous consultants and contractors
• Project insurances
• All owner-payable taxes (VAT is not explicitly accounted for as it is assumed to be repaid in the same period)
• Licence fees
• Resettlement or relocation costs
• Maintenance of site roads and facilities, dust suppression and rubbish disposal
• Home office staffing and general expenses
Non-local corporate costs for Nevsun that are not a direct consequence of the ongoing development of the Timok project are not included.
20.2.10 Pre-commercial Operating Expenditure
The only operating expenditure that is capitalized is that associated with mining process feed ahead of the commissioning of the process plant. Some of these costs are included in the initial mining estimate, and a further $15.1M is reallocated in the economic analysis to reflect the timing of the process plant production.
| Various/RJM/PJD | Timok_PEA_NI43-101_Report_2CR021.006_20171130.docx | November 2017 |
| SRK Consulting | |
| Timok PEA NI 43-101 | Page 175 |
20.2.11 Capital Cost Contingency
SRK in consultation with Nevsun has selected a global contingency for the Project of 20%. This contingency is consistent with the level of uncertainty and asymmetry of the cost risks for each of the induvial estimation packages.
Total contingency for the project development and construction phase, at 20% of the underlying cost estimates, is $102.5M.
20.3 Operating Cost Estimate
20.3.1 Operating Cost Summary
The summary operating costs for the Project used for the evaluation are shown in Table 20.3, and the cash cost summary is provided in Table 20.4. A more detailed breakout of the operating costs is provided in Table 20.5.
Figure 20.2 and Figure 20.3 show the variation in Opex over the 16-year production period.
Table 20.3: Site operating cost summary
Operating cost Summary | Life of Mine ($M) | Unit Costs ($/t) |
Opex - Mining | 782.4 | 18.57 |
Opex - Processing | 393.9 | 9.35 |
Opex - Water Management & TSF | 29.8 | 0.71 |
Opex - G&A | 99.8 | 2.37 |
Total Opex (excl. Royalties) | 1,305.7 | 31.00 |
Table 20.4: Cash cost of production summary
Cash Costs of Production | Total Costs Yr 1 to 5 ($M) | Unit Costs Yr 1 to 5 ($/lb Cu) | Total Costs LOM ($M) | Unit Costs LOM ($/lb Cu) |
Total Site Opex | 447.3 | 0.39 | 1,305.7 | 0.62 |
TCs/RCs/Penalties | 565.4 | 0.49 | 1,209.1 | 0.57 |
Freight & Other | 180.0 | 0.16 | 369.0 | 0.18 |
Less Au Credits | -476.5 | -0.41 | -739.3 | -0.35 |
Direct Costs - C1 | 716.2 | 0.62 | 2,144.5 | 1.02 |
Royalty | 159.9 | 0.14 | 273.8 | 0.13 |
Total Cash Cost Incl Royalty | 876.2 | 0.76 | 2,418.4 | 1.15 |
Depreciation | 339.4 | 0.29 | 918.3 | 0.44 |
Fully allocated Pre-tax Cost | 1,215.6 | 1.05 | 3,336.7 | 1.59 |
| Various/RJM/PJD | Timok_PEA_NI43-101_Report_2CR021.006_20171130.docx | November 2017 |
| SRK Consulting | |
| Timok PEA NI 43-101 | Page 176 |
Table 20.5: Site operating costs breakout
Mining | Total LOM Opex ($M) | LOM Unit Costs ($/t) |
Local Labour | 241 | 5.72 |
International Labour | 4 | 0.10 |
Materials | 183 | 4.34 |
Equipment | 305 | 7.24 |
Power | 9 | 0.22 |
Fuel | 55 | 1.30 |
Total Mining | 797 | 18.93 |
Less Capitalized Opex | -15 | -0.36 |
Total Mining after Capitalization | 782 | 18.57 |
Processing | | |
Power | 117 | 2.77 |
Labor | 31 | 0.74 |
Reagents | 112 | 2.67 |
Consumables | 107 | 2.55 |
Maintenance Materials | 20 | 0.48 |
Miscellaneous | 6 | 0.14 |
Total Processing | 394 | 9.35 |
General & Administrative | | |
Management and Accounting | 12 | 0.30 |
Warehouse, Mess, Security & IT | 18 | 0.42 |
Environmental & Social | 6 | 0.15 |
Human Resources | 8 | 0.19 |
Other Costs | 55 | 1.32 |
Total G&A | 100 | 2.37 |
Water Management & Tailings Storage | | |
Total WM and TSF | 30 | 0.71 |
Total Operating Cost | 1,306 | 31.00 |
| Various/RJM/PJD | Timok_PEA_NI43-101_Report_2CR021.006_20171130.docx | November 2017 |
| SRK Consulting | |
| Timok PEA NI 43-101 | Page 177 |

Figure 20.2: Total Opex by year
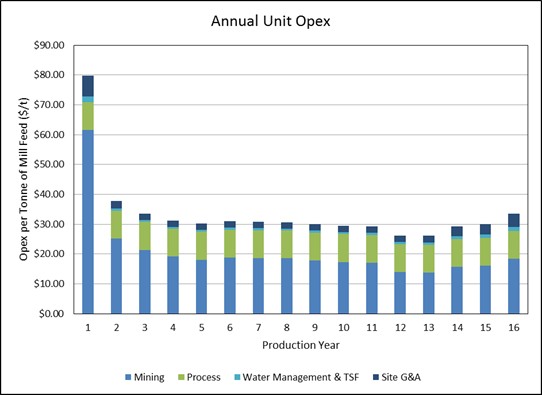
Figure 20.3: Unit Opex by year
| Various/RJM/PJD | Timok_PEA_NI43-101_Report_2CR021.006_20171130.docx | November 2017 |
| SRK Consulting | |
| Timok PEA NI 43-101 | Page 178 |
20.3.2 Underground Mining Operating Costs
Underground mining operating costs were developed based on a quarterly LOM schedule for an owner operating scenario. Productivity, equipment operating hours, labour, supply requirements, and costs were calculated for each cost activity, such as: mine operating development, production drilling and blasting, mucking, secondary breaking, underground crushing and conveying, mine services and maintenance. The cost of mine operating, technical and maintenance staff was estimated as a separate cost item based on staff roster.
The cost was estimated using a combination of first principles calculations, experience and factored costs.
20.3.3 Processing Cost Estimate
The processing operating cost estimate uses prices obtained in, or escalated to, the first quarter of 2017 (Q1 2017).
In broad terms, the estimate includes all operating costs associated with the processing the copper-gold ore to produce a copper concentrate and pyrite concentrate. The operating cost estimate does not include costs associated with mining (including primary crushing), downstream transport, marketing of products or corporate overheads.
The overall cash operating cost to produce a tonne of plant feed is $9.35 (LOM). Figure 20.4 shows a pie chart illustrating the overall LOM operating cost for the processing of the Čukaru Peki mineable resource.
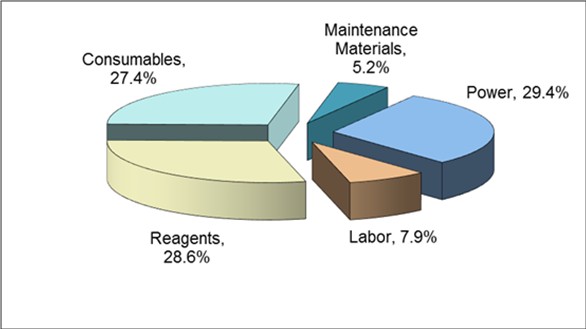
Source: Ausenco, 2017
Figure 20.4: Summary of processing operating costs
| Various/RJM/PJD | Timok_PEA_NI43-101_Report_2CR021.006_20171130.docx | November 2017 |
| SRK Consulting | |
| Timok PEA NI 43-101 | Page 179 |
20.3.4 Water Management and Tailings Storage
Waste Management and Water Treatment
Waste management and water treatment operating costs were estimated to be approximately $0.8M per year during full production, but increasing slightly over the life of the mine as the TSF increases in size and water treatment costs increase. Waste management operating costs include power requirements over the life of the mine. All other associated expansion and maintenance costs were included as sustaining capital costs. Water treatment required for closure was accounted for separately.
Water Management
Water management Opex estimate includes:
• Purchase of 0.63 Mm3/year of fresh water from JKP Vodovod Bor
• Pipeline maintenance
• Pump(s) maintenance and power
• Storage tank maintenance
• Water river intake and discharge structure(s) maintenance
• Local staff costs
• Costs for external Serbian and international contractors and consultants
• All water monitoring costs including costs for local laboratory analysis
The purchase of 0.63 Mm3/year of fresh water from local water provider JKP Vodovod Bor will be reviewed at a further stage in this project as the cost of the water is considered to exceed the cost of treating mineralized water on-site. The unit cost for this water, which will primarily be used as the fresh water feed to the process plant, was set initially at the current (2017) business price namely RSD144.72/m3 ($1.40/m3).
The annual maintenance and operating cost of pipelines and pumps (except power) was estimated at a flat rate of 5% of the purchase and installation cost. An exception was made for the water supply pipeline from JKP Vodovod Bor, where all maintenance and operating costs are assumed to be already covered in the purchase of the water from the supplier.
All water pumps are powered by mains electricity. Pump efficiencies of 75% and electric motor efficiencies of 90% were assumed. An electricity cost in Year 1 of $0.05/kWh was used.
It is recommended that a comparative cost study is undertaken to compare the cost of the purchase of fresh water from local water provider with the treatment of mineralized water on site to provide a fresh water feed.
| Various/RJM/PJD | Timok_PEA_NI43-101_Report_2CR021.006_20171130.docx | November 2017 |
| SRK Consulting | |
| Timok PEA NI 43-101 | Page 180 |
20.3.5 General Site and Administration
The site is not remote and does not require the construction nor management of a mining camp or other remote-site facilities. The G&A costs are therefore low for this project in comparison to others (Table 20.6). The G&A costs were generally assumed to be fixed per unit of time (independent of small variations in production rate) and totalled approximately $6.86M per year for each full year of production.
Table 20.6: G&A expenses
G&A | LOM ($M) | LOM Unit Costs ($/t) |
Management and Accounting | 12 | $0.30 |
Warehouse, Mess, Security & IT | 18 | $0.42 |
Environmental & Social | 6 | $0.15 |
Human Resources | 8 | $0.19 |
Other Costs | 55 | $1.32 |
Total G&A | 100 | $2.37 |
| Various/RJM/PJD | Timok_PEA_NI43-101_Report_2CR021.006_20171130.docx | November 2017 |
| SRK Consulting | |
| Timok PEA NI 43-101 | Page 181 |
21 Economic Analysis
This PEA is preliminary in nature. It includes inferred mineral resources that are considered too speculative geologically to have the economic considerations applied to them that would enable them to be categorized as mineral reserves. There is no certainty that the PEA will be realized.
Project economics and the implementation timeline assumptions are based on a number of factors and conditions, including timely acquisition of land, permits, financing and expected construction durations, all of which are uncertain. Those timeline assumptions might be modified as more experience is gained in Serbia and the project development activities are matured.
21.1 Methodology Used
The Timok Project’s potential economic outlook was evaluated using a discounted cash flow model developed using Excel®. The model is a strict cashflow model that utilizes working capital estimates to adjust cashflow timing, but does not otherwise estimate intermediate stocks and cost-of-goods sold nor attempts to “match” expenditure and revenue for the purposes of deriving accounting measures such as profit or earnings.
The model utilizes annual time periods and real (constant) 2018 USD. All inputs were in USD and no currency conversion is undertaken within the model.
The production and revenue models were based on the designs, mine production and processing schedules and assumptions discussed in Sections 15 and 16.
Capital cost estimates have been prepared for initial development and construction of the Project. The project commences in Q1 2018 and all costs prior to this period are considered “sunk” and not relevant to the project valuation. The project construction period is approximately four years. The physical activity in the first year, 2018, consists primarily of decline driveage. The main construction is scheduled to take place over approximately two-and-a-half years commencing in Q1 2019 and reaching completion in Q3 2021. Metal production is scheduled to commence in late 2021. Sustaining capital is initiated once metal production has commenced. The resulting net annual cash flows are discounted back to the date of valuation at the start of Year -3 (2018). The internal rate of return (IRR) is calculated in real (non-inflated terms). The payback period is calculated as the time needed to recover the initial capital costs.
21.2 Macro Assumptions
Copper and gold price assumptions of US$3.00 / lb and US$1,300 / oz respectively, were selected based on the long-term average price forecast by research brokers as of Q3 2017. All currency is in US dollars (US$) unless otherwise stated. For NPV estimation, all costs and revenues are discounted at 8% to the base date.
21.3 Production Summary
A subset of the mineral resources estimated in Section 13 was used as the basis of the production schedule.
The development and production program for Timok commences in Q1 2018 with the two-year construction of a dual decline from surface to the deposit, followed by underground mine development. Production from the SLC mining method commences in Q2 2021. Mineralized material from the mine, comprising mainly development material is mined and stockpiled for over six quarters before the processing facilities come online in Q3 2021. The process plant ramp-up is scheduled to take place over 12 months, reaching full production in Q3 2022.
| Various/RJM/PJD | Timok_PEA_NI43-101_Report_2CR021.006_20171130.docx | November 2017 |
| SRK Consulting | |
| Timok PEA NI 43-101 | Page 182 |
No strategic stockpiling of material is scheduled during steady-state operations. Mine production and process plant production remain matched.
Production is scheduled to end in 2036 when the mine is no longer cash flow positive as grades decline due to the grade profile of the remaining mineable resource. This results in a LOM of approximately 16 years. However, if higher metal prices are experienced at that time, it could result in the additional resources of approximately 2 Mt being added to the production schedule and the LOM being extended by one to two years.
The summary parameters relating to the production schedule are shown in Table 21.1.
Table 21.1: Production summary
Production Summary | Units | Years 1 to 5 | LOM |
Tonnes Mined/Processed | kt | 12,871 | 42,124 |
Mine Life | yrs | 5 | 15 |
Feed Grade - Cu | % | 4.53% | 2.59% |
Feed Grade - Au | g/t | 3.03 | 1.65 |
Feed Grade - As | ppm | 1,648 | 1,334 |
Cu Process Recovery | % | 93.7% | 91.7% |
Au Process Recovery | % | 33.5% | 30.7% |
As Process Recovery | % | 91.3% | 88.5% |
Concentrate Tonnage | kt dry | 2,171 | 4,450 |
Cu in Concentrate Grade | % | 25.18% | 22.53% |
Au in Concentrate Grade | g/t | 6.02 | 4.78 |
As in Concentrate Grade | % | 0.89% | 1.12% |
Production - Payable Cu | Mlbs | 1,156 | 2,105 |
Production - Payable Au | k ozs | 367 | 569 |
21.4 Treatment and Refining Costs, Payable Metal Assumptions and Freight
The PEA assumes the mine produces a single concentrate of moderate quality (approximately 22% Cu LOM average) with both payable copper and gold. The smelting and refining terms modelled in the PEA were based on information detailed in Section 18 and summarized on a LOM basis in Table 21.2.
All concentrate is assumed to be sold on the seaborne market. Further study in the prefeasibility stage will evaluate if it will be economic to produce multiple concentrate streams of differing qualities to allow for more targeted marketing strategy and potentially treat concentrate at the nearby RTB Bor smelter.
| Various/RJM/PJD | Timok_PEA_NI43-101_Report_2CR021.006_20171130.docx | November 2017 |
| SRK Consulting | |
| Timok PEA NI 43-101 | Page 183 |
Table 21.2: Treatment charges, refining charges, payability penalties and freight
Marketing Parameter Summary | Units | |
Payable Cu | % | 95.2% |
Payable Au | % | 83.2% |
Cu Treatment Charges | US$/dmt | $156.82 |
Cu Refining Charges | US$/lb | $0.16 |
Au Refining Charges | US$/oz | $5.00 |
Average Arsenic Penalty | US$/dmt | $40.04 |
Ocean Freight | US$/wmt | $20.71 |
Land Freight | US$/wmt | $33.72 |
Other Transport/Mktg Costs | US$/wmt | $21.64 |
21.5 Operating Costs
The LOM average site operating cost for the project are summarized in Table 21.3. Additional discussion of site operating costs is contained in Section 20.3.
Table 21.3: Site operating cost summary
Operating and Other Costs | LOM $M | $/t LOM | US$/lb Cu LOM |
Mining | $782.4 | $18.57 | $0.37 |
Process, Water & Tailings | $423.6 | $10.06 | $0.20 |
G&A | $99.8 | $2.37 | $0.05 |
Total Site Opex | $1,305.7 | $31.00 | $0.62 |
Table 21.4 contains a summary of the operating costs and off-site costs expressed in terms of costs per pound of actual payable copper (i.e. not per equivalent pound). Gold credits are deducted to produce costs net of by-product credits. This approach (rather than calculating costs for Cu equivalent production) is valid as gold accounts for only 10% of the revenue of the project.
The figures for the first five years of plant production are also shown. The lower costs for the first five years are a function of the higher grades in material fed to the process plant through this period.
Table 21.4: LOM cash operating costs
Cash Costs of Production | Yr 1 to 5 ($M) | Yr 1 to 5 ($/lb Cu) | LOM ($M) | LOM ($/lb Cu) |
Total Site Opex | 447.3 | 0.39 | 1,305.7 | 0.62 |
TCs/RCs/Penalties | 565.4 | 0.49 | 1,209.1 | 0.57 |
Freight & Other | 180.0 | 0.16 | 369.0 | 0.18 |
Less Au Credits | -476.5 | -0.41 | -739.3 | -0.35 |
Direct Costs - C1 | 716.2 | 0.62 | 2,144.5 | 1.02 |
Royalty | 159.9 | 0.14 | 273.8 | 0.13 |
Total Cash Cost Incl. Royalty | 876.2 | 0.76 | 2,418.4 | 1.15 |
Depreciation | 339.4 | 0.29 | 918.3 | 0.44 |
Fully allocated Pre-tax Cost | 1,215.6 | 1.05 | 3,336.7 | 1.59 |
| Various/RJM/PJD | Timok_PEA_NI43-101_Report_2CR021.006_20171130.docx | November 2017 |
| SRK Consulting | |
| Timok PEA NI 43-101 | Page 184 |
21.6 Capital Costs
The capital costs for the Project are detailed in Section 1.1 and summarized in Table 21.5. Capital expenditure is classified as initial project capital up until the quarter in which material is processed through the plant and revenue is generated. Once this occurs, further capital expenditures are classified as sustaining capital, although process plant ramp up continues for a further 12 months and mine expansion continues for a further two years. Due to the high initial head grades for the first five years of mine production, these ongoing capital expenditures that occur after the plant is operational are forecast to be almost immediately self-funded from cashflow.
Table 21.5: Capital expenditure summary
Capital Cost Summary | Units | Initial | Sustaining |
Underground Mine | US$M | $164.8 | $119.8 |
Mining Infrastructure | US$M | $69.9 | $38.1 |
Surface Infrastructure | US$M | $23.8 | $14.8 |
Process Plant | US$M | $112.5 | $51.2 |
Waste Management/TSF | US$M | $68.5 | $57.0 |
Water Management | US$M | $3.3 | $1.3 |
Owners Costs | US$M | $69.9 | n/a |
Contingency | US$M | $102.5 | $60.2 |
Capitalized Opex | US$M | $15.1 | n/a |
Total | US$M | $630.2 | $342.3 |
Closure Costs | US$M | n/a | $57.5 |
21.6.1 Contingent Payment to Freeport
In addition to the capital expenditure in Table 21.5, Nevsun is contractually required to make two payments to Freeport McMoRan on commencement of the project:
• US$45M to Freeport on the decision to proceed with the project after completion of a FS
• US$50M on first production from the plant
Whilst this is not considered to be a capital cost, the contingent nature of the payment should be taken into account by Nevsun when considering investment in the project. The value proposition for the project is sufficiently robust that SRK considers the contingent payment to not be material to the economic potential of the project.
21.7 Tax and Tax Depreciation
21.7.1 Tax Depreciation
Serbia has a corporate tax rate of 15%. Tax depreciation was estimated on a 15% declining balance basis for all capital. This is a simplified approach but is appropriate for a PEA-level study. Tax depreciation was modelled in real, non-inflated terms.
| Various/RJM/PJD | Timok_PEA_NI43-101_Report_2CR021.006_20171130.docx | November 2017 |
| SRK Consulting | |
| Timok PEA NI 43-101 | Page 185 |
21.7.2 Corporate Tax Exemption
The Company expects to benefit from a 10-year tax exemption incentive provided by the currently applicable Corporate Income Tax Law in Serbia. This incentive results in material reduction of the effective tax rate of the Company. Based on the current business plan/projections with respect to the project, the tax incentive should be applicable for the period of 10 years starting as of 2021, when the first profits are expected to be realized.
Approximately 91% of the taxable income was assumed to be eligible for the incentive, in accordance with the recommendations of EY who were commissioned by Rakita to opine on this matter[1].
21.8 Working Capital
A working capital allocation was included in the cash flow model. It is assumed that all of the working capital can be recovered at Project termination, thus, the sum of all working capital over the life-of-mine is zero. Working capital assumptions are:
• Inventory: not explicitly modelled. First fills and spares included in capital estimate for significant items
• Debtors: 30 Days Payable
• Creditors: 30 Days Payable
21.9 Post Production Closure Costs
Post production closure costs are estimated to be approximately $57.5M. These are scheduled to be spent evenly over the three years immediately following the cessation of production.
21.10 Financing costs
No project financing costs are included in the discounted cash flow model. No costs associated with funding any required closure bonding are modelled.
21.11 Project Valuation Summary
The preliminary economic analysis indicates the potential for the project to generate a post-tax NPV of $1473M at an 8% discount rate, and post-tax IRR of 49.8%. Payback is projected to occur towards the end of the first full year of production.
[1] A similarly commissioned opinion by KPMG indicated that up to 99% of taxable income may be exempt.
| Various/RJM/PJD | Timok_PEA_NI43-101_Report_2CR021.006_20171130.docx | November 2017 |
| SRK Consulting | |
| Timok PEA NI 43-101 | Page 186 |
This PEA is preliminary in nature. It includes inferred mineral resources that are considered too speculative geologically to have the economic considerations applied to them that would enable them to be categorized as mineral reserves. There is no certainty that the PEA will be realized.
21.12 Sensitivity Analysis
A sensitivity analysis has been conducted to the impact on post-tax NPV (at 8% discount rate). The model was flexed across a range of positive and negative change in revenues, operating costs and capital costs. The results of the sensitivity analysis are summarized in Figure 21.1 and Table 21.6.
The results show that the post-tax NPV is robust and remains positive for the range of sensitivities evaluated. Only combinations of significantly higher costs and reduced revenues result in a negative NPV. For example, if revenue is reduced by 40% and either Capex or Opex increases by 20% compared to assumptions, then the project delivers a negative NPV. A combination of a simultaneous 40% increase in both Opex and Capex still results in a positive NPV.
Table 21.6: Sensitivity analysis
NPV @ 8% | Copper Price | | | | |
Gold Price | -40% | -20% | 0% | 20% | 40% |
40% | $363 | $999 | $1,628 | $2,257 | $2,885 |
20% | $285 | $921 | $1,551 | $2,179 | $2,807 |
0% | $207 | $843 | $1,473 | $2,102 | $2,730 |
-20% | $128 | $765 | $1,396 | $2,024 | $2,652 |
-40% | $50 | $687 | $1,318 | $1,947 | $2,575 |
| | | | | |
NPV @ 8% | Capex | | | | |
Opex | -40% | -20% | 0% | 20% | 40% |
40% | $1,521 | $1,377 | $1,234 | $1,090 | $947 |
20% | $1,640 | $1,497 | $1,354 | $1,210 | $1,067 |
0% | $1,760 | $1,617 | $1,473 | $1,330 | $1,187 |
-20% | $1,879 | $1,735 | $1,592 | $1,449 | $1,306 |
-40% | $1,997 | $1,854 | $1,711 | $1,568 | $1,425 |
| | | | | |
NPV @ 8% | Copper and Gold Price (Revenue) |
Discount Rate | -40% | -20% | 0% | 20% | 40% |
4% | $115 | $1,075 | $2,024 | $2,968 | $3,911 |
6% | $82 | $908 | $1,725 | $2,538 | $3,352 |
8% | $50 | $765 | $1,473 | $2,179 | $2,885 |
10% | $20 | $643 | $1,261 | $1,876 | $2,492 |
12% | ($7) | $539 | $1,080 | $1,620 | $2,160 |
| Various/RJM/PJD | Timok_PEA_NI43-101_Report_2CR021.006_20171130.docx | November 2017 |
| SRK Consulting | |
| Timok PEA NI 43-101 | Page 187 |
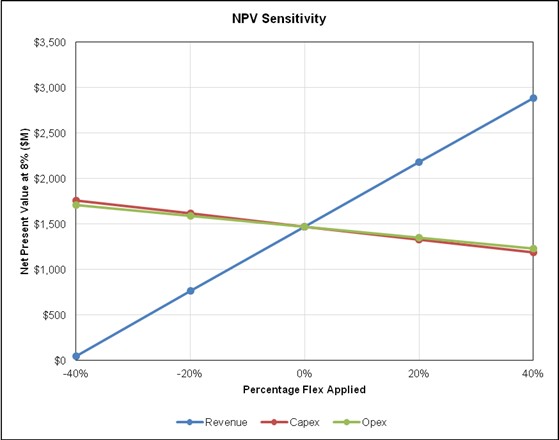
Figure 21.1: Spider Chart of NPV Sensitivity
21.12.1 Breakeven Analysis
The breakeven flexes required for the key value drivers that would result in a zero NPV for the project are:
• Capital Costs: 206% increase
• Operating Costs: 242% increase
• Revenue: 41% decrease
| Various/RJM/PJD | Timok_PEA_NI43-101_Report_2CR021.006_20171130.docx | November 2017 |
| SRK Consulting | |
| Timok PEA NI 43-101 | Page 188 |
22 Adjacent Properties
Regarding Nevsun’s 100%-owned licenses in the TMC (formerly owned by Reservoir Minerals until June 2016), on January 26, 2016, Reservoir Minerals announced that its subsidiaries Tilva (BVI) Inc, and Global Reservoir Minerals (BVI) Inc, had completed all the conditions relating to an earn-in and joint venture agreement signed between Rio Tinto and Reservoir Minerals.
Under the terms of the agreement, Rio Tinto has the option to earn, in stages, up to a 75% interest in Nevsun’s four wholly-owned exploration licenses (the Tilva Project) as shown in Figure 22.1.
• Nikolicevo - 70.32 km2
• Kraljevica - 70.37 km2
• Coka Kupjatra - 40.64 km2
• Tilva Njagra - 36.76 km2
To achieve this, Rio Tinto will need to sole-fund project expenditures of up to USD$75M. Nevsun (after June 2016) is the Manager of the Tilva Project until Rio Tinto exercises its right to assume the role.
In June 2016, four additional areas surrounding the main licenses were granted to Nevsun; these included Nikolicevo East (20.92 km2) and West (2.96 km2); Coka Kupjatra East 4.78 km2) and Tilva Njagra South (2.3 km2).
There are significant exploration assets belonging solely to Nevsun in the adjacent East Timok Nikolicevo and Kraljevica exploration licenses immediately to the east and southeast of the Brestovać-Metovnica license on which exploration is at the exploration and early drilling stage (Figure 22.1). The Nikolicevo, Nikolicevo East and West, and Kraljevica licenses cover a combined area of approximately 164.57 km2 and remain relatively under-explored (with little drilling). Nevsun considers that the licenses are prospective for both Timok deposit and Bor district style porphyry and HS epithermal massive sulphide targets.
The geology in the East Timok licenses contains the same prospective late Cretaceous andesite volcanic sequence and key metallogenic and structural trends associated with the Timok and Bor deposits. In the Nikolicevo license, Nevsun believes that the alteration assemblages and hydrothermal breccia zones, together with copper mineralization in float and outcrop and the presence of fragmental epiclastic and volcaniclastic beds containing clasts of copper and iron sulphide mineralization and altered volcanics (observed in both outcrop and drillholes), indicate proximity to an as-yet undiscovered HS epithermal mineralization in the license area.
| Various/RJM/PJD | Timok_PEA_NI43-101_Report_2CR021.006_20171130.docx | November 2017 |
| SRK Consulting | |
| Timok PEA NI 43-101 | Page 189 |
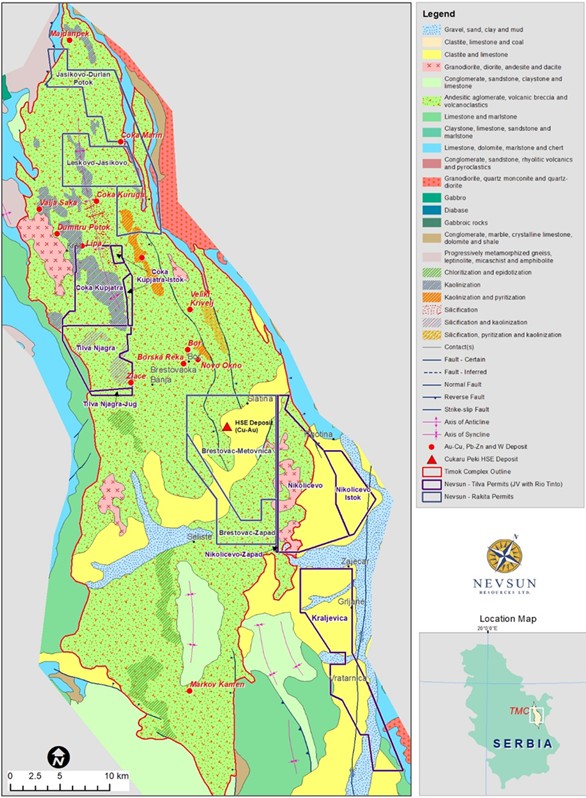
Source: Rakita, 2017
Figure 22.1: Nevsun (former Reservoir Minerals) JV and 100%-owned Properties, Timok Magmatic Complex
| Various/RJM/PJD | Timok_PEA_NI43-101_Report_2CR021.006_20171130.docx | November 2017 |
| SRK Consulting | |
| Timok PEA NI 43-101 | Page 190 |
The Tilva-Njagra and the Coka-Kupjatra exploration licenses cover an area of 85.48 km2 and are located in the western sector of the TMC and Nevsun believes these licenses to be prospective for both epithermal gold and porphyry copper-gold mineralization. Mapping, geochemical (soil and rock chip) sampling and drilling have confirmed the presence of copper and gold mineralization within intense advanced argillic altered basaltic andesitic volcanics and hydrothermal breccias in the Lipa, Coka Kupjatra and Kumstaka prospects. Porphyry style alteration and altered volcanics were observed at the Crni Vrh and Beljevina prospects, respectively. Limited drilling also confirmed the presence of overprinted porphyry style alteration and veining at depth in the Lipa, Coka Kupjatra and Kumstaka prospects. Nevsun believes that there are further porphyry and skarn targets at the Kumstaka-Beljevina and Red River prospects.
| Various/RJM/PJD | Timok_PEA_NI43-101_Report_2CR021.006_20171130.docx | November 2017 |
| SRK Consulting | |
| Timok PEA NI 43-101 | Page 191 |
23 Other Relevant Data and Information
No further information is considered necessary.
| Various/RJM/PJD | Timok_PEA_NI43-101_Report_2CR021.006_20171130.docx | November 2017 |
| SRK Consulting | |
| Timok PEA NI 43-101 | Page 192 |
24 Interpretation and Conclusions
24.1 Geology and Mineral Resource
The Upper Zone of the Timok deposit (Čukaru Peki) is a HS copper-gold deposit with sufficiently high grades to be an underground mining target, which is at a relatively advanced stage of drilling and geological understanding. Significant infill drilling from surface and updated 3D geological modelling has considerably improved geological confidence, local scale geometry of the mineralization and grade distributions in the mineral resource model since the March 2016 statement.
The geological interpretation used to generate the mineral resource presented herein is generally considered to be robust; however, there are areas of lower geological confidence which may be subject to further revision in the future. In addition, SRK notes there is potential to find further HS and porphyry bodies within the surrounding permit area, which, with additional exploration drilling, could increase the tonnage of the reported mineral resource.
SRK considers that the exploration data accumulated by Rakita is generally reliable and suitable for the purpose of the current mineral resource estimate.
24.2 Mining
The following conclusions have been reached for the Timok project.
• SRK considers that SLC is an appropriate mining method to be used at the Čukaru Peki deposit based on the information available.
• The Timok deposit can be successfully mined using the SLC mining method. The currently defined mineral resource has the potential to support a mine with an annual production rate of 3.2 Mt.
• SRK considers the geotechnical and structural data and level of work carried out for the geotechnical characterization to be suitable for a PEA or better level of study.
• A geotechnical risk matrix has been developed. The risks have been assessed to understand the significance that these may pose to the Project, if there are opportunities to improve the Project economics, and if mitigation measures are required to reduce or even eliminate the risk from the Project.
• The opportunities and mitigation measures have been used to provide recommendations to elevate this study to a PFS.
• A dual decline access with conveyor will be the preferred access and haulage method for the Timok project. The underground crushing and conveying will be the preferred option for the material handling system.
| Various/RJM/PJD | Timok_PEA_NI43-101_Report_2CR021.006_20171130.docx | November 2017 |
| SRK Consulting | |
| Timok PEA NI 43-101 | Page 193 |
24.3 Mineral Processing
The process plant has been designed around the criteria generated from the metallurgical test programs to produce a bulk copper concentrate for sale and a pyrite concentrate to be stored for possible treatment to recover the contained gold and possibly generate sulphuric acid from the contained sulphur. The process plant is designed to generate a low arsenic clean copper concentrate and a higher arsenic content complex copper concentrate if required. The process plant was designed for a throughput of 3.25 Mt/y. Overall copper recovery is designed for 92%.
24.4 Project Infrastructure
Site and offsite infrastructure has been sufficiently specified for the Timok project to a PEA level of understanding.
As the Project progresses, the preliminary nature of the surface infrastructure design needs to be reviewed and updated to meet the design standards for the next phase of the project. This includes detailed design of the buildings, energy and services requirements.
24.5 Waste and Water Management
Mine site waste and water management has been studied to a PEA level.
As the Project progresses, the preliminary design of the waste and water management facilities needs to be reviewed and updated to meet the design standards for the next phase of the Project. This includes pre-feasibility level design of the tailings and waste storage facilities and associated water management.
Recommendations to be considered in subsequent design stages are provided in Section 25.4.
24.6 Environmental , Permitting, Social and Closure
24.6.1 Environmental
The Project is subject to Serbian environmental legislation covering environmental protection, environmental impact assessment (EIA), water, air quality, noise, waste management, biodiversity and cultural heritage. Serbia is an accession state to the European Union (EU), and as such, it is working to harmonise its environmental legislation with that of the EU. The Project will adhere to Serbian, EU, and the International Finance Corporation (IFC) environmental and social standards. The Serbian EIA regulation differs from the international standards mainly in its requirements for stakeholder engagement, which in Serbia are significantly more lenient. The Project will follow the more stringent international stakeholder engagement standard.
The basic engineering design now underway includes alternatives analyses to determine the optimum project configuration and design. The selection of preferred design alternatives should be made on the basis of environmental, technical and economic criteria, and documented in the EIA project description.
| Various/RJM/PJD | Timok_PEA_NI43-101_Report_2CR021.006_20171130.docx | November 2017 |
| SRK Consulting | |
| Timok PEA NI 43-101 | Page 194 |
The recent Ministry of Environment ruling that the exploration decline development can proceed without an EIA was accompanied by a series of environmental management requirements as conditions of approval. Prior to starting construction activities at the exploration decline portal site, the Project should have environmental management plans in place with specific procedures established, and the resources to implement them, in order to comply with these permit conditions.
As is often the case with mining projects, water supply and quality are the most significant environmental issues. Other issues with potentially significant environmental management implications include noise emissions during portal construction and the deterioration or destruction of habitat of listed species.
24.6.2 Permitting
The Project is among the first of the major new mining projects to be permitted in Serbia since the Yugoslav breakup, and as such, the Serbian regulators have no recent relevant experience. Until late last year, the regulatory process had been untested. The permitting process, while understood, is not fully within a project’s control. Some of the factors affecting the permitting process include the timely review of applications, availability of technical studies and design information, land acquisition, community relations and politics. Target dates for obtaining permits are estimates based on information available as of the Effective Date and subject to change.
The Project permitting process is on two separate and parallel tracks. The first permitting track involves obtaining approval to start developing the exploration decline and the associated surface-based supporting infrastructure at the portal site. The other permitting effort focuses on those permits required to construct and operate the balance of the Project facilities, including the portion of the underground mine extending into the deposit, the mineral processing facilities and related supporting infrastructure.
24.6.3 Social
The social baseline for impact assessment purposes has been established from studies conducted in Bor Municipality, including five settlements surrounding the Project site. The social baseline covers the following specific topics: demographics; gender equality; education; health; economy; employment; working conditions; land ownership; ecosystem services; traffic; and transportation infrastructure.
The Project has conducted a preliminary social impact assessment. The significance of potential project effects has been evaluated for a range of social impacts, and recommended management measures have been identified to mitigate negative impacts and enhance positive ones.
24.6.4 Closure
PEA level closure design requirements are categorized into three main categories: physical stability, chemical stability and social acceptance. Key conclusions for the PEA closure designs are summarized as the following:
| Various/RJM/PJD | Timok_PEA_NI43-101_Report_2CR021.006_20171130.docx | November 2017 |
| SRK Consulting | |
| Timok PEA NI 43-101 | Page 195 |
• The primary objective of the closure and reclamation activities will be to return the project area to a self-sustaining state, while managing surface water and protecting the downstream environment
• To the extent practicable, mine closure efforts will aim to return the site to a condition that generally conforms to the surrounding terrain and does not impose safety concerns to the public.
• To the extent practicable, mine closure efforts will minimize the extent of new land disturbance during active closure
24.7 Market Studies
Product marketing will be an important driver to optimize potential financial returns realized on this Project. The elevated arsenic content in the copper concentrates will require astute marketing, but is not at this stage expected to prevent the sales of the Project’s copper production. Nevsun will market to copper smelters and traders in Europe and Asia capable of processing or blending higher arsenic copper concentrates. Higher treatment and refining charges along with arsenic penalties may be incurred to compensate buyers for managing this more complex concentrate and these additional costs have been included in the current economic analysis for the Project.
In terms of logistics, the Project site is readily accessible by road and rail, providing links to inland smelters in Europe as well as port access for shipments to overseas customers.
24.8 Economic Analysis
The preliminary economic analysis of the project indicates the potential for a robust economic outcome.
| Various/RJM/PJD | Timok_PEA_NI43-101_Report_2CR021.006_20171130.docx | November 2017 |
| SRK Consulting | |
| Timok PEA NI 43-101 | Page 196 |
25 Recommendations
25.1 Geology and Mineral Resource
SRK considers there to be good potential to further improve confidence in the reported mineral resource at the Upper Zone (Čukaru Peki) deposit with additional drilling and further modelling work. In relation to drilling and sampling, SRK would recommend the following:
• Conduct infill drilling either from surface or from underground, to achieve 25 m coverage to convert the remaining Inferred resources to Indicated and convert more of the Indicated to Measured resources and to further constrain and geotechnically characterize the steep faults that bound the mineralization.
• Utilize samples (where possible) from existing metallurgical drillholes within the UZ deposit to provide infill grade data.
• Perform geological, structural, alteration and mineralization style modelling incorporating the results of LZ drilling, to help to better refine the geological framework and feeder pathways in the relatively poorly sampled depth extents and margins of the UZ.
• Ensure aqua regia digest is used for arsenic analysis in future exploration programs, given the under-reporting of results using the four-acid digest, which has been corrected for in this estimate.
• Investigate further the significant variance in the results shown for arsenic in CRM RAK4 and RAK5, possibly by additional round-robin analysis and mineralogical study.
• Source and use additional CRMs whose copper and gold grade cover the top-end of the higher range (1 g/t Au–15 g/t Au and 2% Cu–18% Cu) to further add to the confidence in laboratory accuracy at this grade range.
• Select 5 to 10% of the 2011 to 2014 sample pulps from the UHG domain and re-submit these with the current QAQC standards to provide a retrospective validation of the arsenic and high-grade copper assays reported at that time.
• Nevsun proposes to complete two infill drillholes to improve classification in targeted parts of the deposit. These will be completed once access is gained from underground development. There is a further proposal to sample a previously completed metallurgical hole that will also provide infill assay information.
25.2 Mining
The following activities relating to geotechnical work are recommended for the next stage of the study:
• Perform stress measurements to provide an indication of the magnitude and direction of the in-situ stress conditions. Breakout assessment of all the ABI data is also recommended to understand if the orientation of the major stresses can be obtained from this source of data.
| Various/RJM/PJD | Timok_PEA_NI43-101_Report_2CR021.006_20171130.docx | November 2017 |
| SRK Consulting | |
| Timok PEA NI 43-101 | Page 197 |
• Conduct targeted geotechnical drilling to:
- Increase confidence in the major structure model and give a better understanding of how the cave will behave through the faults and fracture zones specifically in infrastructure location.
- Define the geotechnical characteristics of the LA at lower sections of the deposit to improve understanding of how the lower portions of the deposit will cave.
- Optimize ground support recommendations for the development in the footwall.
• Conduct a hydrogeological study to define the interaction between the hydrogeology and the geotechnical conditions.
• Undertake a mudrush assessment accompanied by material testing of the rock types that may contribute to mudrush to better understand the impact this may have on the mine.
• Conduct geological modelling of the swelling clays to understand the spatial variability and the impact they may pose to the project.
• Perform additional laboratory testing to improve confidence in the material strength parameters.
• Undertake numerical modelling of the current stress conditions and the mine induced stresses taking into consideration the mine sequencing.
Regarding mine planning, additional trade-off studies are recommended to optimize the size and locations of the underground crushers.
Infill drilling is recommended to better define the mineralization shape and grade distribution, to increase the level of confidence in the estimated mineral resources, and to optimize the mine plan based on the outcome.
25.3 Mineral Processing
Key recommendations during the next phase of the project include:
• Complete variability sample testing to determine if the two copper concentrates can be produced for all samples tested
• Should only a single concentrate be produced, rationalize the flowsheet to have only the required equipment
• Complete concentrate sedimentation and filtration tests to definitively size the copper concentrate thickener and filter
• Complete the overall site water balance to definitively size the effluent treatment plant. Complete testing to generate process design criteria for the effluent treatment plant to meet discharge requirement
• Complete concentrate regrind tests to select the concentrate regrind mill to be fit for purpose
• Review the process plant layout for optimization once equipment selections have been updated for possible capital cost improvements
| Various/RJM/PJD | Timok_PEA_NI43-101_Report_2CR021.006_20171130.docx | November 2017 |
| SRK Consulting | |
| Timok PEA NI 43-101 | Page 198 |
25.4 Waste and Water Management
The following activities are recommended for the next phase of the study. Cost estimates are preliminary in nature and are based on the present understanding of the Project and design team organization. These estimates will be refined as the next phase of study is confirmed.
25.4.1 Geotechnical
• Conduct additional investigations to constrain the material parameters used in the TSF stability analysis to better define the stratigraphy of the clay foundation layer (identified as the critical failure surface in the stability analyses).
• Optimize TSF embankment design to include opportunities to reduce embankment quantities through operational efficiencies and deposition strategies.
• Consider advanced tailings dewatering at the plant site. Additional tailings dewatering would reduce the water management requirements (piping and pumping systems) between the TSF and the process plant.
• Conduct stability analyses to address staged construction geometry as well as elevated pore pressures in the foundation due to initial construction loading.
25.4.2 Hydrotechnical
• Develop a detailed site-wide water balance, including areas such as the crater lake (subsidence area).
• Prepare a site-specific hydrometeorology report to better constrain design parameters (increased confidence in return period rainfall events, PMP, runoff coefficient). To support the report the following hydrological activities are recommended:
o Continue to take manual discharge measurements in Brestovaćka River and establish a continuous flow gauging station at the TSF site location.
• Include variable climate inputs in the water balance model, to quantify the impact of drier or wetter than average conditions.
• As the results of the water balance model indicate that groundwater from the underground works is a significant contributor of process water, conduct further sensitivity and uncertainty analysis on the groundwater inflow as these inflows can be difficult to reliably predict and create uncertainty in the water balance results.
25.5 Environmental, Permitting, Social and Closure
25.5.1 Environmental, Permitting and Social
• Develop and implement an environmental management system in compliance with ISO 14001 covering the construction, operating and closure phases of the project. Assign appropriate Rakita personnel and material resources to operate and maintain the environmental management system. Develop and implement the specific environmental management plans (EMPs) focused on the decline construction works as a first priority. Require contractors to develop and implement their own EMPs incorporating the relevant components of Rakita’s EMPs as minimum performance standards. Make the foregoing contractually binding on contractors.
| Various/RJM/PJD | Timok_PEA_NI43-101_Report_2CR021.006_20171130.docx | November 2017 |
| SRK Consulting | |
| Timok PEA NI 43-101 | Page 199 |
• Complete the environmental baseline characterization work needed for environmental impact assessment (EIA).
• Complete a draft EIA Scoping Report in accordance with Serbian and international requirements. Before submitting the Scoping Report to the Serbian regulator, conduct an internal review of the draft Scoping Report with particular focus on the proposed environmental and social management measures and other company commitments.
• Evaluate environmental and social criteria as part of the engineering alternatives analyses and trade-off studies, and document same in the EIA report.
• Conduct stakeholder engagement according to the IFC Performance Standards.
• Continue updating and implementing the project permitting plan. Develop the technical documentation required for the outstanding permit applications. Integrate the permitting schedule into the overall project execution schedule. Maintain relationships with the relevant national ministries and the municipality.
25.5.2 Closure
To advance the Project’s closure design to a PFS level, a comprehensive reclamation and closure plan should be developed for all disturbances and infrastructure. A summary of key recommendations and considerations needed to advance closure objectives, designs and costs to a PFS level are included below.
• Refine closure objectives and closure designs to align with EU Standards for mine waste management (EU, Directive 2006/21/EC, 2006).
• Develop a detailed site-wide water balance and water quality objectives, for use in determining post closure water management requirements (for example, discharge rates, water treatment requirements, conveyance networks, storage requirements (if any) for all site components (including the Subsidence Zone and the TSF).
• Further develop closure objectives for infrastructure foundations post-demolition. This includes possible fracturing concrete to promote seepage, landform design and cover systems.
• Refine closure demolition and decommissioning costs by acquiring specialized contractors quotes and detail unit costs to meet PFS standards. This includes closure construction costs for features such as fences around the subsidence zone.
• Prepare a trade off study for placing demolition wastes in a local landfill versus hauling wastes away to an approved waste facility.
| Various/RJM/PJD | Timok_PEA_NI43-101_Report_2CR021.006_20171130.docx | November 2017 |
| SRK Consulting | |
| Timok PEA NI 43-101 | Page 200 |
• Refine closure designs of TSF embankments to include landform redesign of embankments and covers to optimize grading plans and cover systems. Closure design may include tailings test work and consolidation modelling to refine strategy for grading, cover and revegetation, including material quantities and costs.
• For the PFS, completeness of infrastructure list needs to be ascertained and major unit estimates need to be developed that reflect material closure designs.
• Refine closure costs that are referenced herein as lump sum by converting to unit costs that have associated material quantities and appropriate unit rates.
• Investigate the need for a water treatment plant at the end of mine life for the purposes of closure and the associated construction and operational costs for closure.
25.6 Market Studies
It is recommended for future studies that the Project examine whether production of two copper concentrates (a low arsenic concentrate and a high arsenic concentrate) could lead to a better financial outcome than continuing with the production of a single copper concentrate. Such a comparison will need to consider all relevant factors such as flowsheet simplicity and marketing risks, among other factors. The concentrator may be designed to allow processing flexibility of producing either two copper concentrates or a single copper concentrate as market and other conditions warrant at the time of production though such flexibility may be limited by sales commitments.
As the Project progresses, Nevsun should continue to advance discussions with potential customers to gain greater clarity on each party’s capacity and appetite for the Project’s copper production and to ask for indicative commercial terms that such parties may be willing to provide at this stage of discussion.
25.7 Economic Analysis
It is recommended that the project proceed to a PFS. A more detailed and precise economic analysis should be undertaken as part of that study. SRK recommends that the project cashflows be modelled on a quarterly basis with a view to tying them more closely to budgeting forecasts and ultimately consideration of financing options at FS.
25.8 Estimated Budget for Recommendations
The estimated budget to complete the main activities recommended above is $8.4M, as outlined in Table 25.1.
| Various/RJM/PJD | Timok_PEA_NI43-101_Report_2CR021.006_20171130.docx | November 2017 |
| SRK Consulting | |
| Timok PEA NI 43-101 | Page 201 |
Table 25.1: Estimated Budget for Recommendations
Area | Estimated Budget ($) |
Geology and Mineral Resources | |
Infill drilling | |
Geological modelling | |
Analysis of variability in arsenic concentrations | |
Assaying additional CRMs at top-end of grade range for both copper and gold | |
Additional copper and arsenic assays of UHG sample pulps | |
Sub-total – Geology and Mineral Resources | $500,000 |
Exploration | |
Condemnation drilling | |
Sub-total – Exploration | $3,500,000 |
Mining | |
In-situ stress measurements and instrumentation | |
Geotechnical drilling | |
Hydrogeological study | |
Mudrush assessment | |
Material strength testing | |
Numerical modelling | |
Underground crusher trade-off studies | |
Sub-total – Mining | $900,000 |
Mineral Processing | |
Complete variability sample testing | |
Single concentrate flowsheet rationalization | |
Complete concentrate sedimentation and filtration tests | |
Complete overall site water balance | |
Complete concentrate regrind tests | |
Process plant layout optimization | |
Sub-total – Mineral Processing | $600,000 |
Waste and Water Management | |
Additional investigations to constrain material parameters used in TSF stability analysis | |
Optimize TSF embankment design | |
Conduct stability analyses | |
Develop detailed site-wide water balance | |
Prepare site-specific hydrometeorology report | |
Additional sensitivity/uncertainty analysis on groundwater inflow | |
Sub-total – Waste and Water Management | $600,000 |
Environment, Permitting, Social, Closure | |
Develop and implement environmental management system | |
Complete environmental baseline characterization work | |
Complete draft EIA Scoping report | |
Conduct stakeholder engagement | |
Ongoing project permitting | |
Demolition waste placement trade-off studies | |
Sub-total – Environment, Permitting, Social and Closure | $2,000,000 |
Market Studies and Economic Analysis | |
Study to understand economic benefits of two concentrates | |
Modelling cash flows on quarterly basis to align with budget forecasts | |
Sub-total – Market Studies and Economic Analysis | $50,000 |
| |
Technical Report | $250,000 |
| |
TOTAL ESTIMATED COST – NEXT PHASE OF STUDY | $8,400,000 |
| Various/RJM/PJD | Timok_PEA_NI43-101_Report_2CR021.006_20171130.docx | November 2017 |
| SRK Consulting | |
| Timok PEA NI 43-101 | Page 202 |
26 Acronyms and Abbreviations
Distance | | Other Units |
µm | micron (micrometre) | | °C | degree Celsius |
mm | millimetre | | °F | degree Fahrenheit |
cm | centimetre | | m amsl | metres elev. above mean sea level |
m | metre | | hr | hour |
km | km | | kW | kilowatt |
” or in | inch | | kWh | kilowatt hour |
’ or ft | foot | | M | million or mega |
Area | | Ma | million years |
m2 | square metre | | MW | megawatt |
km2 | square km | | ppm | parts per million |
ha | hectare | | PMP | probable maximum precipitation |
Volume | | Qmax | maximum monthly flow rate |
L | litre | | Qmin | minimum monthly flow rate |
m3 | cubic metre | | RL | relative level |
Mass | | s | second |
kg | kilogram | | SG | specific gravity |
g | gram | | USD | US dollars |
t | metric tonne | | V | volt |
kt | kilotonne | | W | watt |
lb | pound | | Other Abbreviations |
Mt | megatonne | | AAS | atomic absorption spectrometery |
oz | troy ounce | | ABI | acoustic borehole imaging |
wmt | wet metric tonne | | ABTS | apuseni-banat-timok-srednogorie |
dmt | dry metric tonne | | AEP | annual exceedance probability |
Pressure | | AP | accounts payable |
Pa | pascal | | AR | accounts receivable |
kPa | kilopascal | | ARD | acid rock drainage |
MPa | megapascal | | AUD | Australian dollar |
Elements and Compounds | | BEM | Balkan Exploration and Mining |
Au | gold | | BGL | below ground level |
Ag | silver | | CAD | Canadian dollar |
As | arsenic | | CAPEX | capital expenditure |
Cu | copper | | CDA | Canadian Dam Association |
Fe | iron | | CDI | Conveyor Dynamics Incorporated |
PAX | potassium amyl xanthate | | CIM | Canadian Institute of Mining |
Pb | altaite | | COG | cut-off grade |
S | sulphur | | CORR | certificate of resources and reserves |
CuCov | copper in covellite | | CRM | certified reference materials |
CuEn | copper in enargite | | CSAMT | controlled source audio magneto-telluric |
| Various/RJM/PJD | Timok_PEA_NI43-101_Report_2CR021.006_20171130.docx | November 2017 |
| SRK Consulting | |
| Timok PEA NI 43-101 | Page 203 |
Other Abbreviations | | Other Abbreviations |
DCF | discounted cash flow | | ITH | in-the-hole hammer |
DR | dimension ratio | | JK | Julius Kruttschnitt |
DWT | drop-weight test | | KP | Knight Piésold |
EDGM | earthquake design ground motion | | LA | lower andesite |
EDTA | ethylene diamine tetra acetic acid | | LHD | loads-haul-dump |
EGL | effective grinding length | | LOM | life of mine |
EIA | environmental impact assessment | | LZ | lower zone |
EM | electromagnetic | | MC | master composite |
EMS | Elektromreža Srbije | | MCE | maximum credible earthquake |
EPCM | engineering procurement and construction management | | MCS | miocene clastic sedimentary |
EPS | Elecktro Privreda Srbije | | MDE | maximum design earthquake |
ERM | environmental resource management | | MIBC | methyl isobutyl carbinol |
ESIA | environmental and social impact assessment | | MMI | Institute for Mining and Metallurgy |
ETC Bulgaria | Eurotest Control EAD Laboratory in Bulgaria | | MRMR | mining rock mass rating |
EU | European Union | | MS | massive sulphide |
EUR | European dollar | | Mtpa | million tonnes per annum |
FAR | fresh air raises | | NA | not applicable |
FMEC | Freeport-McMoRan Exploration Corp. | | NBCC | National Building Code of Canada |
FS | feasibility study | | ND | nominal diameter |
G&A | general and administrative | | NI 43-101 | National Instrument 43-101 |
GPS | global positioning system | | NPV | net present value |
GST | goods and services tax | | NSR | net smelter return |
GT | geotechnical | | OHL | overhead lines |
HDPE | high-density polyethylene | | OHSAS | occupational health and safety assessment series |
HPP | hydroelectric plant | | OK | ordinary kriging |
HR | hydraulic radius | | Opex | operating expenses |
HS | high sulphidation | | P&ID | piping and instrumentation diagram |
IAUSP | Institute of Architecture and Urban and Spatial Planning of Serbia | | PAG | potentially acid generating |
ICP-AES | inductively coupled plasma atomic emission spectroscopy | | PEA | preliminary economic assessment |
ICP-MS | inductively coupled plasma mass spectrometry | | PFS | pre-feasibility study |
IDF | inflow design flood | | PLC | programmable logic controller |
IDW | inverse distance weighting | | PLT | point load testing |
IFC | International Finance Corporation | | PMF | probable maximum flood |
IP | induced polarization | | PPE | personal protective equipment |
IPCM | Institute for the Protection of Cultural Monuments | | PR | poison ratio |
IRR | international rate of return | | RAR | return air raises |
IRS | intact rock strength | | RC | refining charges |
ISO | International Organization for Standardization | | QR | raise-bore quality index |
IT | information technology | | RL | relative Level |
| Various/RJM/PJD | Timok_PEA_NI43-101_Report_2CR021.006_20171130.docx | November 2017 |
| SRK Consulting | |
| Timok PEA NI 43-101 | Page 204 |
Other Abbreviations | | Other Abbreviations |
RMR | rock mass rating | | UGH | ultra high grade |
RQD | rock quality designation | | UTM | universal transverse mercator |
RSD | Serbian dinar | | UZ | upper zone |
RscNSR | resource net smelter return | | VAR | total variance |
RTB Bor | Rudarsko Toipioničarski Basen Bor d.o.o. | | VAT | value-added tax |
SAB | SAG mill - ball mill | | VRT | virgin rock temperature |
SABC | SAG mill - ball mill - crusher | | VWP | vibrating wire piezometers |
SAG | semi-autogenous grinding | | WB | wet bulb temperature |
SEA | strategic environmental assessment | | WM | waste management |
SEE | Southeast Europe Exploration d.o.o. | | XPS | express process solutions |
SLC | sub-level caving | | Conversion Factors |
SLOS | sublevel open stoping | | 1 tonne | 2,204.62 lb |
SMS | semi massive sulphide | | 1 troy ounce | 31.1035 g |
SPSP | special purpose spatial plan | | | |
SPT | standard penetration test | | | |
SRF | stress reduction factor | | | |
SRK | SRK Consulting (Canada) Inc. | | | |
SRK NA | SRK Consulting (North America) Inc. | | | |
SRK (UK) | SRK Consulting (United Kingdom) Inc. | | | |
SWQI | serbian water quality index | | | |
TC | treatment charge | | | |
TDS | total dissolved solids | | | |
TEM | technical economic model | | | |
TLV | threshold limit values | | | |
TMC | timor magmatic complex | | | |
TMF | tailings management facility | | | |
TMMB | tethyan magmatic and metallogenic belt | | | |
ToS | trade-off study | | | |
tpd | tonnes per day | | | |
TS | transmission substation | | | |
TSF | tailings storage facility | | | |
TSS | Total Suspended Solids | | | |
THUA | thickener hydraulic unit area | | | |
TUFUA | thickener underflow unit area | | | |
UA | upper andesite | | | |
UCCM | upper cretaceous Bor’ conglomerate | | | |
UCMA | upper cretaceous Bor’ marl | | | |
UCS | uniaxial compressive strength | | | |
UG | underground | | | |
| Various/RJM/PJD | Timok_PEA_NI43-101_Report_2CR021.006_20171130.docx | November 2017 |
| SRK Consulting | |
| Timok PEA NI 43-101 | Page 205 |
27 References
1991 UNECE Convention on Environmental Impact Assessment in a Transboundary Context (Espoo Convention).
2011 Census of Population, Households and Dwellings in the Republic of Serbia: Comparative Overview of the Number of Population in 1948, 1953, 1961, 1971, 1981, 1991, 2002 and 2011, Data by settlements, Statistical Office of Republic Of Serbia, Belgrade. 2014.
AMTEL Ltd, 2013. Gold Deportment Variability in the Čukaru Peki Cu-Au Deposit (Progress Report 2) for Freeport McMoran. Report 13/49 November 5, 2013.
AMTEL Ltd, 2013. Gold Deportment Variability in the Čukaru Peki Cu-Au Deposit (Progress Report 2). p34.
Armstong, R., Kozelj, D. and Herrington, R., 2005 - The Majdanpek Cu-Au Porphyry Deposit of Eastern Serbia: A Review; in Porter, T.M. (Ed.), Super Porphyry Copper & Gold Deposits: A Global Perspective; PGC Publishing, Adelaide, pp 44.
Ausenco, 2017. 102025-RPT-0001, Revision Number B, Rakita Exploration d.o.o. BOR, Čukaru Peki Project, Pyrite Concentrate Processing Report, 12 July 2017.
Australian Institute of Mining and Metallurgy, 2012. Cost Estimation Handbook, Second Edition, Monograph 27.
Banješević, M., 2010. Upper Cretaceous magmatic suites of the Timok Magmatic Complex. Annales Géologique de la Péninsule Balkanique, v. 71, pp. 13-22.
Banješević, M. 2015. Geološka karta Republike Srbije (Kartografska građa) [Geological Map of the Republic Serbia (Cartographic composition, Zaječar 1 – 1:50000)], Zaječar 1 – 1:50000. Geološki zavod Srbije, Beograd.
Bluequest 2017. Bluequest Resources AG, “Report on the Timok Project Prepared for Rakita d.o.o.” August 2017.
Bouilhol, P., O. Jagoutz, J. M. Hanchar, and F. O. Dudas, 2013. Dating the India-Eurasia collision through arc magmatic records, Earth Planet. Sci. Lett., 366, 163–175, doi: 10.1016/j.epsl.2013.01.023.
Brake 2001, AusIMM, “The application of refrigeration in mechanized mines”, May 2001, The AusIMM Proceedings Vol. 306 No 1 2001.
Brake 2015, AusIMM, “Quality assurance standards for mine ventilation models and ventilation planning”, August 2015, Proceedings of the Australian Mine Ventilation Conference.
| Various/RJM/PJD | Timok_PEA_NI43-101_Report_2CR021.006_20171130.docx | November 2017 |
| SRK Consulting | |
| Timok PEA NI 43-101 | Page 206 |
Bray, J.D. and Travarsou, T., 2007. Simplified Procedures for Estimating Earthquake-Induced Deviatoric Slope Displacements. Journal of Geotechnical and Geoenvironmental Engineering, ASCE. Vol 133, No.4. Pages 381-392.
British Columbia Ministry of Energy and Mines, 2016. Part 10 Guidance Document – Health, Safety and Reclamation Code for Mines in British Columbia. Victoria, Canada.
British Columbia Ministry of Energy and Mines, 2017. Health, Safety and Reclamation Code for Mines in British Columbia. Victoria, Canada.
Canadian Dam Association (CDA), 2013. Dam Safety Guidelines 2007 (Revised 2013). Edmonton, Canada.
Canadian Dam Association (CDA), 2014. Technical Bulletin – Application of Dam Safety Guidelines to Mining Dams. Edmonton, Canada.
Canby, V. M., Koželj, D. I., Naftali, L. Z. 2015. Chukaru Peki Cu-Au deposit, Serbia Discovery History, Geology and Ore Types. NewGenGold Pan Pacific Perth. Australia.
Cornejo, P. 2017. Petrography and Mineralogy Microscope Study Including Spectral Electronic Microspope (Sem) Results of Hole TC150091. Brestovać-Metovnica. Internal report.
Curtin university/GEOING group d.o.o., 2014. Seismic Experimental report.
Cvetković, V., Šarić, K & Pačevski, A., 2012. Petrographic, ore microscopic and SEM-EDS studies of the samples from the drill-hole FMTC 1210. Unpublished Company Report, p59.
Cvetković, V., Šarić, K & Pačevski, A., 2013. Petrographic, ore microscopic and SEM-EDS studies of ten samples from the drill-holes FMTC 1327, 1328 and 1332. Unpublished Company Report, p39.
Đorđević, M. & Banješević, M., 1997. Geology of the southern part of the Timok Magmatic Complex, Booklet and Geological Map 1:50000. p171. Federal Ministry of Economy FR Yugoslavia, Belgrade (in Serbian).
Dewey, J. F., W. C. Pitman, W. B. F. Ryan, and J. Bonnin, 1973. Plate tectonics and the evolution of the Alpine system, Geol. Soc. Am. Bull., 84(10), 3137–3180, doi:10.1130/0016-7606(1973)84<3137: ptateo>2.0.co;2.
Drew, L. J. (2005), A tectonic model for the spatial occurrence of porphyry copper and polymetallic vein deposits: Applications to central Europe, Rep., 36 pp, USGS, Reston.
E&MJ News, 2011. RTB Bor: The Comeback of Serbian Copper. Available Online at: [http://www.e-mj.com/features/1357-rtb-bor-the-comeback-of-serbian-copper.html] Accessed 2014.
Envico, 2016. Report on Permitting Procedure for Mine Development, prepared for Rakita Exploration d.o.o. Bor, Serbia, July 2016, 56 pp.
| Various/RJM/PJD | Timok_PEA_NI43-101_Report_2CR021.006_20171130.docx | November 2017 |
| SRK Consulting | |
| Timok PEA NI 43-101 | Page 207 |
ERM, 2006. Environmental Assessment of the RTB Bor Operations. Report for the Privatisation Agency of the Republic of Serbia.
Esri Basemap, 2016.
Esri, USGS, NOAA Basemap, 2016.
GEO-SLOPE International Ltd. (Geo-Slope), 2012. Geostudio 2012. C, Canada.
Giroud, J.P. & Bonaparte, R., 1989a. Leakage Through Liners Constructed with Geomembranes – Part I – Geomembrane Liners. Geotextiles and Geomembranes, Volume 8, pp. 27-67.
Giroud, J.P. & Bonaparte, R., 1989b. Leakage Through Liners Constructed with Geomembranes – Part II – Composite Liners. Geotextiles and Geomembranes, Volume 8, pp. 71-111.
Giroud, J.P., 1997. Equations for Calculating the Rate of Liquid Migration Through Composite Liners Due to Geomembrane Defects. Geosynthetics International, Volume 4, Nos. 3-4, pp. 335-348.
Gallhofer D., von Quadt A., Peytcheva I., Schmid S. M., and Heinrich C. A. Tectonic, magmatic and metallogenic evolution of the Late Cretaceous Arc in the Carpathian - Balkan orogen. AGU-PUBLICATIONS, Research article No 10.1002/2015TC003834. August 2015.
Hedenquist, J.W., Arribas, A.R., Gonzalez-Urien, E., 2000. Exploration for epithermal gold deposits. SEG Reviews, 13, pp. 245-277.
Hedenquist, J.W., Arribas, A. & Reynolds, T.J., 1998. Evolution of an Intrusion-Centered Hydrothermal System: Far Southeast-Lepanto Porphyry and Epithermal Cu-Au Deposits, Philippines. Econ. Geol., v. 93, pp. 373-404.
Hedenquist, J.W. & Taran, Y.A., 2013. Modelling the Formation of Advanced Argillic Lithocaps: Volcanic Vapor Condensation Above Porphyry Intrusions. Econ. Geol., v. 108, pp. 1523-1540.
Heinrich, C.A. & Neubauer, F., 2002. Cu-Au-Pb-Zn-Ag Metallogeny of the Alpine-Balkan- Carpathian-Dinaride Geodynamic Province; Mineraliun Deposita, v. 37, pp. 533-540.
International Commission on Large Dams (ICOLD), 1995. Tailings Dams and Seismicity: Review and Recommendations. Bulletin 98.
Janković, S.R., Jelenković, R.J. & Koželj, D.I., 2002. The Bor Copper and Gold Deposit. Mining & Smelting Basin Bor (RTB Bor) – Copper Institute Bor (CIB). pp. 298.
Janković, S. (1997): The Carpatho-Balkanides and adjacent area: a sector of the Tethyan Eurasian metallogenic belt. Mineralium Deposita 32: 426-433.
| Various/RJM/PJD | Timok_PEA_NI43-101_Report_2CR021.006_20171130.docx | November 2017 |
| SRK Consulting | |
| Timok PEA NI 43-101 | Page 208 |
Jeffrey Jaacks, Ph.D., C.P.G. (AIPG# 11249), Historical Control Limits for Evaluating QC Data, 31 December 2015.
Jelenković, R.J. & Koželj, D.J., 2002. Morphgenetical types of porphyry copper mineralisation. in the Bor metallogenic zone. In: Koželj, D.J. & Jelenković, R.J. (eds), Proceedings of the international symposium Geology and Metallogeny of copper and gold deposits in the Bor metallogenic zone – Bor 100 years, pp. 29 – 56.
Jelenković, R., Milovanović, D., Koželj, D., Banješević, M., 2016. The Mineral Resources of the Bor Metallogenic Zone: A Review. Geologia Croatica, 69, v.1, pp.143-155.
Karamata, S., 2006. The geological development of the Balkan Peninsula related to the approach, collision and compression of Gondwanan and Eurasian units. In: Robertson, A.H.F. & Mountrakis, D. (eds), Tectonic Development of the Eastern Mediterranean Region. Geological Society, London, Special Publications, 260, pp 155-178.
Knight Piésold Ltd. (KP), 2016. A Waste and Water Management Conceptual Study and Selection of Preferred Tailings Storage Site Report. Report prepared for Nevsun Resources Ltd., 25 October 2016, 43 pp. Reference VA501-56/2-1, Rev.0.
Knight Piésold Ltd. (KP), 2017a. Factual Site Investigation Report. Report prepared for Rakita Exploration d.o.o., Report is in Progress, 314 pp. Reference VA501-56/3-1, Rev.A.
Knight Piésold Ltd. (KP), 2017b. Tailings Storage Alternatives Assessment, report prepared for Rakita Exploration d.o.o., 2 August 2017, 39 pp. Report VA501-56/3-3, Rev.0.
Knight Piésold Ltd. (KP), 2017c. Timok Monthly Water balance, 15 November 2017, 12 pp. Letter VA17-01843, Rev.A.
Kolb, M., von Quadt, A., Peytcheva, I., Heinrich, C.A., Fowler, S.J. & Cvetkovic, V., 2013. Adakite-like and Normal Arc Magmas: Distinct Fractionation Paths in the East Serbian Segment of the Balkan-Carpathian Arc. Journal of Petrology v. 54 (3), pp 421-451.
Kouzmanov, K., Moritz, R., Chiaradia, M., Fontignie, D. and Ramboz, C., 2001. Sr and Pb isotope study of Au–Cu epithermal and porphyry-Cu deposits from the southern part of the Panagyurishte district, Sredna Gora zone, Bulgaria. In: Piestrzynski, A. et al. (eds.): Mineral deposits at the beginning of the 21st century, Proceedings 6th biennial SGA meeting, Krakow, Poland, 539–542.
Law on Environmental Impact Assessment (Official Gazette RS, No. 135/2004, 36/2009).
Law on Environmental Protection (Official Gazette RS, No. 135/2004, 36/2009, 43/2011).
Law on Mining and Geological Research (Official Gazette RS, No. 88/2011).
Law on Strategic Environmental Impact Assessment (Official Gazette RS, No. 135/2004, 88/2010).
| Various/RJM/PJD | Timok_PEA_NI43-101_Report_2CR021.006_20171130.docx | November 2017 |
| SRK Consulting | |
| Timok PEA NI 43-101 | Page 209 |
Law on Waters (Official Gazette RS, No. 30/10, 93/12).
Makdisi, F.I. and Seed, H.B. 1978. Simplified Procedure for Estimating Dam and Embankment Earthquake-Induced Deformations. Journal of the Geotechnical Engineering Division, American Society of Civil Engineers. Vol 104, No. GT7. pp 849-867.
Melo, C. and Sharma, S. (2004), “Seismic Coefficients for Pseudostatic Slope Analysis”, 13th World Conference on Earthquake Engineering, Vancouver, B.C., Canada, Paper No. 369.
Milanović, S., Stevanović, Z., Vasić, L. & Vakanjac, V. 2011. Monitoring and Modelling of Karst System as a Base for its Evaluation and Utilisation – a Case Study from Eastern Serbia.
Milijasević, D., Milanović, A., Brankov, J & Radovanović, M., 2011. Water Quality Assessment of the Borsksa River using the WPI (Water Pollution Index) Method. Arch. Biol. Sci., Belgrade, 63, pp 819 – 824.
Monthel, J., Vadala, P., Leistel, J.M., & Cottard, F., with the collaboration of Ilic, M., Strumberger, A., Tosovic, R. & Stepanovic, A., 2002. Mineral Deposits and Mining Districts of Serbia: Compilation Map and GIS databases; BRGM RC-51448-FR, p67.
National Geographic Basemap, 2014.
National Geographic, Esri Basemap, 2016.
Newmark, N.M., 1965, Effects of Earthquakes on Dams and Embankments. Vol. 15 No. 2 pp 139 – 159.
Nikova, L., 2011. CSAMT Survey Report.
NKO Partners Law Office, 2016. Re: Legal Due Diligence Report for Nevsun Resources Ltd of Rakita Exploration d.o.o., Deli Jovan d.o.o. Balkan Exploration and Mining d.o.o. and Tilva d.o.o., dated 26 April 2016.
NTI, 2017. Nikola Tesla Electrical Engineering Institute – Power Systems Department. Preliminary Solution for Power Supply of Flotation and Mine at Čukaru Peki, Bor. p35. 7 July 2017.
OMC 2017. Čukaru Peki Mill Sizing Report Rakita Exploration d.o.o. Bor. Report No 7208.30 – RPT-001 Rev 0. April 2017.
Pačevski, A., Cvetković, V. and Šarić, K., 2013. Petrographic, ore microscopic and SEM-EDS studies of the samples from 11 drill-holes from the Bor area. Unpublished Company Report, p136.
Perelló, J., Razique, A., Schloderer, J., and Rehman, A.-U., 2008, The Chagai porphyry copper belt, Baluchistan province, Pakistan: ECONOMIC GEOLOGY, v. 103, p. 1583−1612.
| Various/RJM/PJD | Timok_PEA_NI43-101_Report_2CR021.006_20171130.docx | November 2017 |
| SRK Consulting | |
| Timok PEA NI 43-101 | Page 210 |
Petrunov, R., Dragov, P. and Neykov, H., 1991. Polyelemental (with As, Sn, V, Bi, Ag, Te, Ge, Se etc.) mineralization in Assarel porphyry-copper deposit (in Bulgarian). Rev. Bulg. Geol. Soc. 52, 1–7
Petrović D. et al., 2012. “Borska Reka” orebody, the future of the exploitation in Bor Mine. Faculty of Mining and Geology, Belgrade. Underground Mining Engineering 21 (2012) pp 83-88. Available at: http://www.rgf.rs/publikacije/PodzemniRadovi/radovi/dec2012/eng/01%20PR%2021_08%20ENG.pdf.
Popov, P., T. Berza, A. Grubic, and D. Ioane, 2002. Late Cretaceous Apuseni-Banat-Timok-Srednogorie (ABTS) magmatic and metallogenic belt in the Carpathian-Balkan orogen, Geol. Balc., 32(2–4), 145–163.
Popov, P., S. Strashimirov, K. Popov, K. Bogdanov, R. Radichev, S. Dimovski, and S. Stoykov, 2012. Geology and Metallogeny of the Panagyurishte Ore Region, pp. 227, Ivan Rilski House, Sofia, Bulgaria.
Popov, P., Petrunov, R., Kovachev, V., Strashimirov, S. and Kanazirski, M., 2000. Elatsite-Chelopech ore field. In: Strashimirov S. and Popov, P. (eds.): Geology and metallogeny of the Panagyurishte ore region (Srednogorie zone, Bulgaria), ABCD-GEODE 2000 workshop, Guidebook to excursions, 8–18.
Regional Spatial Plan of Timocka Krajina (Official Gazette RS, 51/2011) RTB Bor website, www.rtb.rs
Richards, J.P. 2015, Tectonic, magmatic, and metallogenic evolution of the Tethyan orogen: From subduction to collision: Ore Geology Reviews, v. 70, p. 323. Elsevier, OctoverOctober 2015.
Richards, J. P., Spell, T., Rameh, E., Razique, A., Fletcher, T. 2012. High Sr/Y Magmas Reflect Arc Maturity, High Magmatic Water Content, and Porphyry Cu ± Mo ± Au Potential: Examples from the Tethyan Arcs of Central and Eastern Iran and Western Pakistan. 2012 Society of Economic Geologists, Inc. Economic Geology, v. 107, pp. 295–332.
Schmid, S. M., D. Bernoulli, B. Fügenschuh, L. Matenco, S. Schefer, R. Schuster, M. Tischler, and K. Ustaszewski, 2008. The Alpine-Carpathian- Dinaridic orogenic system: Correlation and evolution of tectonic units, Swiss J. Geosci., 101(1), 139–183, doi:10.1007/s00015-008-1247-3.
SGS Canada, Inc, 2016. An Investigation into Characterization and Metallurgical Testwork on Seven Samples from the Čukaru Peki Deposit prepared for Rakita Exploration d.o.o. Bor. Project 15242-001A Final Report. May 16, 2016.
| Various/RJM/PJD | Timok_PEA_NI43-101_Report_2CR021.006_20171130.docx | November 2017 |
| SRK Consulting | |
| Timok PEA NI 43-101 | Page 211 |
SGS Canada, Inc, 2017a. Prefeasibility Flotation Testing on Samples from the Čukaru Peki Deposit prepared for Rakita Exploration d.o.o. Bor. Project 15242-002 Report No 1 – Flotation Testing Final Report. June 30, 2017.
SGS Canada, Inc, 2017b. An Investigation into Phase II Test program on the Čukaru Peki Deposit for Pre-Feasibility Study prepared for Rakita Exploration d.o.o. Bor. Project 15242-003 Final Report. September 29, 2017.
SGS Canada, Inc, 2017c. An Investigation into the Submicroscopic Gold Balance in Three Metallurgical Products Čukaru Peki Deposit prepared for Rakita Exploration d.o.o. Bor. Project 15242-002 Summary Report Final. July 24, 2017.
SGS Canada, Inc, 2017d. Phase II Test program on the Čukaru Peki Deposit for a Pre-Feasibility Study prepared for Rakita Exploration d.o.o. Bor. Project 15242-003 Report 1 Ore Aging – Final Report. October 11, 2017.
SIECO, 2008. Environmental and Risk Assessment of the Timok River Basin, Regional Environment Centre, Available online at: http://timok.rec.org/download/timok_assessment.pdf,m Accessed: 15/07/2014.
Sillitoe, R.H., 2010. Porphyry copper systems. Econ. Geol. 105, 3–41.
Sillitoe, R.H. & Hedenquist, J.W., 2003. Linkages between Volcanotectonic Settings, Ore-Fluid Compositions, and Epithermal Precious Metal Deposits. Society of Economic Geologists, Special Publication 10, pp 315-343.
Sillitoe, R.H., 1999. Styles of high-sulphidation gold, silver and copper mineralisation in porphyry and epithermal environments. In: Weber, G. (ed.): Austr. Inst. Min. Metal., PacRim’99, Bali, Indonesia, 10–13 October, Proceedings, 29–44.: Weber, G. (ed.): Austr. Inst. Min. Metal., PacRim’99, Bali, Indonesia, 10–13 October, Proceedings, 29–44.
SNC, 2009. EIA Study – New Smelter and Sulphuric Acid Plant Project, Available online at: http://www.rtb.rs/media/dokumenti/nt/Section6-1.pdf, Accessed: 15 July 2014.
Sosson, M., et al., 2010. Subductions, obduction and collision in the Lesser Caucasus (Armenia, Azerbaijan, Georgia), new insights, Geol. Soc. London Spec. Publ., 340(1), 329–352, doi:10.1144/sp340.14.
Spatial plan of the Special Purpose of Bor – Majdanpek mining basin (Official Gazette RS, April 2014).
SRK NA, 2016a. High Level Conceptual Mining Study for Čukaru Peki Deposit 2UR021-001 Report. June 2016.
SRK NA, 2016b. Čukaru Peki AH Tradeoff Report 2CN010-023 Report. August 2016.
SRK NA, 2016c. Čukaru Peki Mining Method Trade-off Study 2CR021-004 Report. January 2017.
| Various/RJM/PJD | Timok_PEA_NI43-101_Report_2CR021.006_20171130.docx | November 2017 |
| SRK Consulting | |
| Timok PEA NI 43-101 | Page 212 |
SRK (UK), 2017. Interim Technical Report Submitted to Nevsun.
SRK (UK), 2016. NI 43-101 Preliminary Economic Assessment of the Čukaru Peki Upper Zone Deposit, Serbia. SRK Consulting (UK) Ltd. March 2016.
SRK (UK), 2014. NI 43-101 Technical Report on a Mineral Resource Estimate on the Čukaru Peki Deposit, Brestovać-Metovnica Exploration Permit, Serbia, January 2014.
SRTM mission Basemap, USGS, 2016.
Stevanović et al., 1991. The Influence of Karst Aquifer on Ore Deposits in East Serbia, Yugoslavia. IMWA conference, Slovenia, September 2011, pp 119 - 124.
Stinnette 2013, Queen’s University, “Establishing total airflow requirements for underground metal/non-metal mines based on the diesel equipment fleet”, May 2013, A thesis submitted to the department of Mining Engineering.
Sutphin, D.M., Hammarstrom, J.M., Drew, L.J., Large, D.E., Berger, B.B., Dicken, C.L., & DeMarr, M.W., with contributions from Billa, M., Briskey, J.A., Cassard, D., Lips, A., Pertold, Z., & Roşu, E., 2013, Porphyry copper assessment of Europe, exclusive of the Fennoscandian Shield: U.S. Geological Survey Scientific Investigations Report 2010-5090-K, p197.
Swaisgood, J. R., 2014. Behavior of Embankment Dams During Earthquake. The Journal of Dam Safety, Association of State Dam Safety Organization. V.12 No.2.
Toljić, M. 2016. REPORT On Studies of Tectonic Setting of Čukaru Peki Area (South from Bor). Internal Rakita report. Un-publish.
United Nations Economic Commission for Europe, Regional Environmental Centre for Central and Eastern Europe and Danube River Basin Directorate, 2008. Environmental and Risk Assessment of the Timok River Basin.
United States Environmental Protection Agency, 1992. Action Leakage Rates for Leak Detection Systems. United States Environmental Protection Agency, Office of Solid Waste, EPA 530-R-92-004, January 1992.
UoB 2016. University of Belgrade Faculty of Mining and Geology. Hydrology Study in Support of Preliminary Project Documentation for the Construction of the Exploration Decline in the Brestovacka River Basin.
UoB 2017a. University of Belgrade Faculty of Mining and Geology. Hydrogeological PFS Report (Version 1.0 Draft). Belgrade, Serbia. June 2017.
UoB 2017b. University of Belgrade Faculty of Mining and Geology. Report on Hydrogeological Site Investigations at TSF Area (Čukaru Peki Project). Belgrade, Serbia. July 2017.
| Various/RJM/PJD | Timok_PEA_NI43-101_Report_2CR021.006_20171130.docx | November 2017 |
| SRK Consulting | |
| Timok PEA NI 43-101 | Page 213 |
UoB 2017(c). University of Belgrade (Faculty of Mining and Geology). “Annex of the Report on the Conducted Hydrodynamic Research in the Wider Area of the Polymetallic Copper Deposits of Čukaru Peki, Serbia”. July 2017
Valencia, V. 2017. Geoservices Corporation-GEO-Zircon Dating. Internal report. “170503_Geoservices Corporation-GEO-Zircon Dating-001.xlsx”
Vasić, N., 2017. Sedimentological Researches of Lithological Units Drilled by the Boreholes TC-160135 and TC-160137. Belgrade. May-June
| Various/RJM/PJD | Timok_PEA_NI43-101_Report_2CR021.006_20171130.docx | November 2017 |
| SRK Consulting | |
| Timok PEA NI 43-101 | Page 214 |
28 Date and Signature Page
This technical report was written by the following “Qualified Persons” and contributing authors. The effective date of this technical report is September 1, 2017.
Qualified Person | Signature | Date |
Andrew Jennings, PEng | “original signed” | November 30, 2017 |
Daniel Stinnette, Peng | “original signed” | November 30, 2017 |
David McKay, MAIG | “original signed” | November 30, 2017 |
Dylan McGregor, PEng | “original signed” | November 30, 2017 |
Jarek Jakubec, CEng | “original signed” | November 30, 2017 |
Lucas Hekma, PE | “original signed” | November 30, 2017 |
Martin Pittuck, CEng | “original signed” | November 30, 2017 |
Mihajlo Samoukovic, PEng | “original signed” | November 30, 2017 |
Neil Winkelmann, FAusIMM | “original signed” | November 30, 2017 |
Peter Manojlovic, Pgeo | “original signed” | November 30, 2017 |
Ray Walton, PEng | “original signed” | November 30, 2017 |
Riley Devlin, PEng | “original signed” | November 30, 2017 |
Robert Raponi, PEng | “original signed” | November 30, 2017 |
Reviewed by
Name, PhD., PGeo, Etc.
Project Reviewer
All data used as source material plus the text, tables, figures, and attachments of this document have been reviewed and prepared in accordance with generally accepted professional engineering and environmental practice.