Legg Mason Partners Oregon Municipals Fund Inactive
Filed: 12 Jan 05, 12:00am
UNITED STATES
SECURITIES AND EXCHANGE COMMISSION
Washington, D.C. 20549
FORM N-CSR
CERTIFIED SHAREHOLDER REPORT OF REGISTERED MANAGEMENT INVESTMENT COMPANIES
Investment Company Act file number 811-7149
Smith Barney Oregon Municipals Fund
(Exact name of registrant as specified in charter)
125 Broad Street, New York, NY 10004
(Address of principal executive offices) (Zip code)
Robert I. Frenkel, Esq.Smith
Barney Fund Management LLC
300 First Stamford Place
Stamford, CT 06902
(Name and address of agent for service)
Registrant’s telephone number, including area code: (800) 451-2010
Date of fiscal year end: April 30
Date of reporting period: October 31, 2004
ITEM 1. REPORT TO STOCKHOLDERS.
The Semi-Annual Report to Stockholders is filed herewith.
SMITH BARNEY CLASSIC SERIES | SEMI-ANNUAL REPORT | OCTOBER 31, 2004
|
| NOT FDIC INSURED • NOT BANK GUARANTEED • MAY LOSE VALUE |
| WHAT’S INSIDE |
Dear Shareholder, For the first time in four years, the Federal Reserve Board’s (“Fed”)i monetary policymaking committee raised its federal funds rateii target from a four-decade low of 1% to 1.25% at the end of June. Higher rates can help slow a potential acceleration of economic growth and thereby help maintain a balance between that growth and the inflation that can generally accompany it. The increase marked a significant reversal from the Fed’s monetary policy position from June 2003, when it last slashed its rate target following a long series of accommodative rate cuts. The Fed again raised its fed funds target by 0.25% in both August and September to 1.75%. Given that bond prices had already factored in rate hikes to a significant extent, and coupling this with a lack of inflationary pressures, bond prices held up and actually rose during the third quarter. In September and October, the bond market benefited from falling stock and rising oil prices, which encouraged investors to reallocate capital into fixed-income securities. During the six months, the economy continued to grow at a moderate rate yet more robust pace versus early 2003.iii After generating surprisingly strong results in March and April, labor market growthiv tapered off earlier in the period.v Despite a resurgence in inflation earlier this year, results in the latter part of the period were benign. After the period ended, yields on bonds rose as their prices dropped in reaction to an employment report issued in November that yielded surprisingly robust labor market results for October.iv The Fed subsequently raised its fed funds rate target an additional 0.25% to 2.00% on November 10th noting in its statement, “Output appears to be growing at a moderate pace despite the rise in energy prices, and labor market conditions have improved. Inflation and longer-term inflation expectations remain well contained.” The monetary policymaking committee retained wording from its previous statements stating its stance that policy accommodation can be removed “at a pace that is likely to be measured.”i |
| 1 Smith Barney Oregon Municipals Fund | 2004 Semi-Annual Report |
Over the six-month period, the Lehman Brothers Oregon Municipal Bond Indexvi returned 4.34%, slightly below that of the broader-based Lehman Brothers Municipal Bond Index’svii return of 4.79% for the period. Although the fund’s lower-durationviii approach limited its ability to completely participate in the market’s upside moves, this more defensive approach to interest rate risk resulted in a smoother ride for investors who held the fund over the period in comparison to longer-duration portfolios. While rising interest rates are generally troublesome for longer-term fixed income securities, since bond prices decline as rates are expected to rise, rising rates result in higher levels of income on new bonds issued in the future. In the recent market and rate environment, the fund’s manager believes that his cautious approach to managing interest rate risk is more prudent than a longer-duration strategy. The portfolio manager has maintained a focus on targeting issues with competitive coupons in a diverse cross-section of market segments that the manager perceives as offering favorable prospects on a risk/reward basis. |
PERFORMANCE SNAPSHOT | |
| 6 Months | |
| Class A Shares—Oregon Municipals Fund | 2.17% |
| Lehman Brothers Municipal Bond Index | 4.79% |
| Lipper Oregon Municipal Debt Funds Category Average | 3.69% |
| 30 Day SEC Yield | 4.16% |
The performance shown represents past performance. Past performance is no guarantee of future results and current performance may be higher or lower than the performance shown above. Principal value and investment returns will fluctuate and investors’ shares, when redeemed, may be worth more or less than their original cost. To obtain performance data current to the most recent month-end, please visit our website at www.smithbarneymutualfunds.com. The fund yields reflect voluntary fee waivers, which may be reduced or terminated at any time. In the absence of fee waivers, the fund’s yield would have been 4.01%. Class A share returns assume the reinvestment of income dividends and capital gains distributions at net asset value and the deduction of all fund expenses. Returns have not been adjusted to include sales charges that may apply when shares are purchased or the deduction of taxes that a shareholder would pay on fund distributions. Excluding sales charges, Class B shares returned 1.81% and Class C shares returned 1.88% over the six months ended October 31, 2004. |
| 2 Smith Barney Oregon Municipals Fund | 2004 Semi-Annual Report |
Performance Review For the six-months ended October 31, 2004, Class A shares of the Smith Barney Oregon Municipals Fund, excluding sales charges, returned 2.17%. In comparison, the unmanagedbroad-based Lehman Brothers Municipal Bond Index,vii returned 4.79% for the same period. The Lipper Oregon municipal debt funds category average1 was 3.69%. Certain investors may be subject to the federal Alternative Minimum Tax, and state and local taxes may apply. Capital gains, if any, are fully taxable. Please consult your personal tax or legal adviser. Information About Your Fund As you may be aware several issues in the mutual fund industry have recently come under the scrutiny of federal and state regulators. The fund’s Adviser and some of its affiliates have received requests for information from various government regulators regarding market timing, late trading, fees, and other mutual fund issues in connection with various investigations. The regulators appear to be examining, among other things, the fund’s response to market timing and shareholder exchange activity, including compliance with prospectus disclosure related to these subjects. The fund has been informed that the Adviser and its affiliates are responding to those information requests, but are not in a position to predict the outcome of these requests and investigations. In November 2003, Citigroup Asset Management (“CAM”) disclosed an investigation by the Securities and Exchange Commission (“SEC”) and the U.S. Attorney relating to CAM’s entry into the transfer agency business during 1997-1999. Citigroup has disclosed that the Staff of the SEC is considering recommending a civil injunctive action and/or an administrative proceeding against certain advisory and transfer agent entities affiliated with Citigroup, the former CEO of CAM, two former employees and a current employee of CAM, relating to the creation, operation and fees of its internal transfer agent unit that serves various CAM-managed funds. Citigroup is cooperating with the SEC and will seek to resolve this matter in discussion with the SEC Staff. Although there can be no assurance, Citigroup does not believe that this matter will have a material adverse effect on the fund. |
| 1 | Lipper, Inc. is a major independent mutual-fund tracking organization. Returns are based on the 6-month period ended October 31, 2004, calculated among the 23 funds in the fund’s Lipper category, including the reinvestment of dividends and capital gains, if any, and excluding sales charges. |
| 3 Smith Barney Oregon Municipals Fund | 2004 Semi-Annual Report |
As always, thank you for your confidence in our stewardship of your assets. We look forward to helping you continue to meet your financial goals. Sincerely, November 12, 2004 |
The information provided is not intended to be a forecast of future events, a guarantee of future results or investment advice. Views expressed may differ from those of the firm as a whole. RISKS: Keep in mind, the fund’s investments are subject to interest rate and credit risks. As interest rates rise, bond prices fall, reducing the value of the fund’s share price. Lower-rated, higher yielding bonds known as “junk bonds” are subject to greater credit risk, including the risk of default, than higher-rated obligations. High-yield bonds involve greater credit and liquidity risks than investment grade bonds. As a non-diversified fund, it can invest a larger percentage of its assets in fewer issues than a diversified fund. This may magnify the fund’s losses from events affecting a particular issuer. The fund may use derivatives, such as options and futures, which can be illiquid, may disproportionately increase losses, and have a potentially large impact on fund performance. All index performance reflects no deduction for fees, expenses or taxes. Please note an investor cannot invest directly in an index. |
| i | Source: U.S. Federal Reserve Board. The Fed is responsible for the formulation of a policy designed to promote economic growth, full employment, stable prices, and a sustainable pattern of international trade and payments. |
| ii | The federal funds rate is the interest rate that banks with excess reserves at a Federal Reserve district bank charge other banks that need overnight loans. |
| iii | Source: Commerce Department (Bureau of Economic Analysis). Refers to quarterly growth of Gross Domestic Product (“GDP”). GDP is a market value of goods and services produced by labor and property in a given country. |
| iv | Source: Bureau of Labor Statistics based upon the growth of non-farm payroll jobs. |
| v | Sources: Lehman Brothers. Inflation data based upon Consumer Price Index/deflation data. |
| vi | The Lehman Brothers Oregon Municipal Bond Index is a broad measure of the Oregon municipal bond market with an overall average maturity of approximately three years. |
| vii | The Lehman Brothers Municipal Bond Index is a broad measure of the municipal bond market with an overall average maturity of approximately three years. |
| viii | Duration is a common gauge of the price sensitivity of a fixed-income asset or portfolio to a change in interest rates. |
| 4 Smith Barney Oregon Municipals Fund | 2004 Semi-Annual Report |
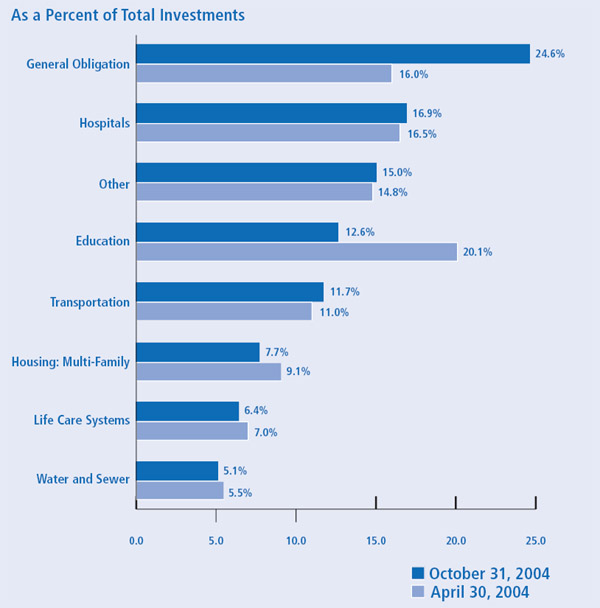
Investment Breakdown
|
| 5 Smith Barney Oregon Municipals Fund | 2004 Semi-Annual Report |
Example As a shareholder of the Fund, you may incur two types of costs: (1) transaction costs, including front-end and back-end sales charges (loads) on purchase payments, reinvested dividends, or other distributions; and (2) ongoing costs, including management fees; distribution and/or service (12b-1) fees; and other Fund expenses. This example is intended to help you understand your ongoing costs (in dollars) of investing in the Fund and to compare these costs with the ongoing costs of investing in other mutual funds. This example is based on an investment of $1,000 invested on May 1, 2004 and held for the six months ended October 31, 2004. Actual Expenses The table below titled “Based on Actual Total Return” provides information about actual account values and actual expenses. You may use the information provided in this table, together with the amount you invested, to estimate the expenses that you paid over the period. To estimate the expenses you paid on your account, divide your ending account value by $1,000 (for example, an $8,600 ending account value divided by $1,000 = 8.6), then multiply the result by the number under the heading entitled “Expenses Paid During the Period”. |
| Based on Actual Total Return(1) |
| Actual Total Return Without Sales Charges(2) | Beginning Account Value | Ending Account Value | Annualized Expense Ratios | Expenses Paid During the Period(3) | |||||||||||||
| Class A | 2.17 | % | $ | 1,000.00 | $ | 1,021.70 | 0.75 | % | $ | 3.82 | |||||||
| Class B | 1.81 | 1,000.00 | 1,018.10 | 1.32 | 6.71 | ||||||||||||
| Class C | 1.88 | 1,000.00 | 1,018.80 | 1.30 | 6.62 | ||||||||||||
| (1) | For the six months ended October 31, 2004. |
| (2) | Assumes reinvestment of all dividends and capital gain distributions, if any, at net asset value. Total return is not annualized, as it may not be representative of the total return for the year. Performance figures may reflect fee waivers and/or expense reimbursements. Past performance is no guarantee of future results. In the absence of fee waivers and/or expense reimbursements, the total return would have been lower. |
| (3) | Expenses (net of voluntary waiver) are equal to each class’s respective annualized expense ratio multiplied by the average account value over the period, multiplied by the number of days in the most recent fiscal half-year then divided by 365. |
| 6 Smith Barney Oregon Municipals Fund | 2004 Semi-Annual Report |
Fund Expenses (unaudited) (continued) Hypothetical Example for Comparison Purposes The table below titled “Based on Hypothetical Total Return” provides information about hypothetical account values and hypothetical expenses based on the actual expense ratio and an assumed rate of return of 5.00% per year before expenses, which is not the Fund’s actual return. The hypothetical account values and expenses may not be used to estimate the actual ending account balance or expenses you paid for the period. You may use the information provided in this table to compare the ongoing costs of investing in the Fund and other funds. To do so, compare the 5.00% hypothetical example relating to the Fund with the 5.00% hypothetical examples that appear in the shareholder reports of the other funds. Please note that the expenses shown in the table below are meant to highlight your ongoing costs only and do not reflect any transactional costs, such as front-end or back-end sales charges (loads). Therefore, the table is useful in comparing ongoing costs only, and will not help you determine the relative total costs of owning different funds. In addition, if these transaction costs were included, your costs would have been higher. |
Based on Hypothetical Total Return(1) |
| Hypothetical Total Return | Beginning Account Value | Ending Account Value | Annualized Expense Ratios | Expenses Paid During the Period(2) | |||||||||||||
| Class A | 5.00 | % | $ | 1,000.00 | $ | 1,021.42 | 0.75 | % | $ | 3.82 | |||||||
| Class B | 5.00 | 1,000.00 | 1,018.55 | 1.32 | 6.72 | ||||||||||||
| Class C | 5.00 | 1,000.00 | 1,018.65 | 1.30 | 6.61 | ||||||||||||
| (1) | For the six months ended October 31, 2004. |
| (2) | Expenses (net of voluntary waiver) are equal to each class’s respective annualized expense ratio multiplied by the average account value over the period, multiplied by the number of days in the most recent fiscal half-year, then divided by 365. |
| 7 Smith Barney Oregon Municipals Fund | 2004 Semi-Annual Report |
| Schedule of Investments (unaudited) | October 31, 2004 |
| FACE AMOUNT | RATING(a) SECURITY | VALUE | ||||
| Education — 12.6% | ||||||
| $ | 850,000 | AA | Forest Grove, Campus Improvement & Refunding Revenue, | |||
| Pacific University, Radian-Insured, 6.300% due 5/1/25 | $ | 967,113 | ||||
| 600,000 | BBB+ | Multnomah County, Educational Facilities Revenue, (University | ||||
| of Portland Project), 6.000% due 4/1/25 | 646,650 | |||||
| 500,000 | AAA | Oregon State Department of Administrative Services, COP, | ||||
| Series A, AMBAC-Insured, (Pre-Refunded — Escrowed | ||||||
| with state and local government and FNMA securities | ||||||
| to 5/1/10 Call @ 101), 6.250% due 5/1/17 † | 590,455 | |||||
| 1,240,000 | AAA | Oregon State Facility Authority Revenue, (Willamette University | ||||
| Project), Series A, FGIC-Insured, 5.000%, 10/1/34 (b) | 1,285,074 | |||||
| Oregon State Health, Housing, Educational & Cultural Facilities | ||||||
| Authority, Series A: | ||||||
| 1,000,000 | Baa1* | Linfield College Project, 6.625% due 10/1/20 (b) | 1,126,280 | |||
| 430,000 | NR | Oak Tree Foundation Project, (Pre-Refunded with REFCORP | ||||
| and U.S. Treasury Obligation to 5/1/05 Call @ 101), | ||||||
| 6.100% due 5/1/15 | 443,278 | |||||
| Western States Chiropractic, ACA-Insured: | ||||||
| 785,000 | A | 6.350% due 12/1/20 | 855,642 | |||
| 545,000 | A | 6.350% due 12/1/25 | 587,112 | |||
| 500,000 | A | University of the Virgin Islands, Refunding & Improvement Bonds, | ||||
| Series A, ACA-Insured, 6.250% due 12/1/29 | 554,270 | |||||
| 7,055,874 | ||||||
| Finance — 3.0% | ||||||
| 1,000,000 | BBB | Virgin Islands, Public Finance Authority Revenue, Series A: | ||||
| Gross Receipts Taxes Loan Notes, 6.500% due 10/1/24 (b) | 1,143,430 | |||||
| 500,000 | A | Sr. Lien, ACA/CBI-Insured, 5.500% due 10/1/18 | 528,375 | |||
| 1,671,805 | ||||||
| General Obligation — 24.7% | ||||||
| Clackamas County GO: | ||||||
| 500,000 | AA- | Canby School District No. 86, School Board Guaranty, | ||||
| (Pre-Refunded — Escrowed with state and local government | ||||||
| securities to 6/15/10 Call @ 100), 5.250% due 6/15/20 | 562,135 | |||||
| 500,000 | Aaa* | Lake Oswego School District No. 7J, MBIA-Insured, | ||||
| 5.000% due 6/1/26 | 518,980 | |||||
| 300,000 | Aaa* | Deschutes County GO, Administrative School District No. 1, | ||||
| Series A, FSA-School Board Guaranty, 5.500% due 6/15/18 | 336,093 | |||||
| 500,000 | AAA | Jackson County GO, Central Point School District No. 6, FGIC- | ||||
| School Board Guaranty, (Pre-Refunded — Escrowed with state | ||||||
| and local government securities to 6/15/10 Call @ 100), | ||||||
| 5.250% due 6/15/20 | 562,135 | |||||
| 500,000 | AAA | Jefferson County GO, School District No. 509J, FGIC-School Board | ||||
| Guaranty, 5.250% due 6/15/16 | 558,750 | |||||
| See Notes to Financial Statements. | |
| 8 Smith Barney Oregon Municipals Fund | 2004 Semi-Annual Report |
| Schedule of Investments (unaudited) (continued) | October 31, 2004 |
| FACE AMOUNT | RATING(a) SECURITY | VALUE | ||||
| General Obligation — 24.7% (continued) | ||||||
| Lane County GO: | ||||||
| $ | 500,000 | AAA | Bethel School District No. 52, FGIC-Insured, | |||
| (Call 12/1/06 @ 100), 6.400% due 12/1/09 (c) | $ | 544,545 | ||||
| 2,000,000 | Aaa* | Eugene School District No. 4J, FSA-Insured, | ||||
| 5.000% due 7/1/17 (b) | 2,163,660 | |||||
| 500,000 | Aaa* | Multnomah-Clackamas Counties GO, Centennial School District | ||||
| No. 28-302, FGIC-School Board Guaranty, 5.000% due 6/15/21 | 531,185 | |||||
| 500,000 | AA- | Multnomah County GO, Reynolds School District No. 7, School | ||||
| Board Guaranty, 5.125% due 6/15/20 | 536,300 | |||||
| 500,000 | NR | Northern Mariana Islands Commonwealth GO, Series A, | ||||
| 7.375% due 6/1/30 | 523,245 | |||||
| 285,000 | AA | Oregon State GO, Veterans Welfare, Series 80A, | ||||
| 5.700% due 10/1/32 | 297,455 | |||||
| Puerto Rico Commonwealth GO: | ||||||
| 1,000,000 | AAA | Public Improvement, Series A, XLCA-Insured, | ||||
| 5.500%, 7/1/17 (b) | 1,176,160 | |||||
| 1,500,000 | AAA | RITES-PA 931, XLCA-Insured, 8.383% due 7/1/17 (b)(d) | 2,028,480 | |||
| 500,000 | AAA | Tillamook County GO, School District No. 9, FSA-School Board | ||||
| Guaranty, 5.250% due 6/15/22 | 545,810 | |||||
| 1,135,000 | Aaa* | Washington, Multnomah & Yamhill Counties GO, School | ||||
| District No. 1J, MBIA-Insured, 5.125% due 6/1/17 | 1,227,945 | |||||
| Washington County GO: | ||||||
| 1,000,000 | AAA | Beaverton School District No. 48J, Series A, FSA-Insured, | ||||
| 5.000% due 6/1/14 | 1,128,960 | |||||
| 500,000 | Aaa* | Forest Grove School District No. 15, FSA-School Board | ||||
| Guaranty, 5.000% due 6/15/21 | 529,690 | |||||
| 13,771,528 | ||||||
| Hospitals — 17.0% | ||||||
| Clackamas County Hospital Facility Authority Revenue: | ||||||
| 500,000 | AA | Gross-Williamette Falls Hospital Project, Radian-Insured, | ||||
| 5.500% due 4/1/22 | 544,330 | |||||
| Legacy Health System: | ||||||
| 500,000 | AA | 5.750% due 5/1/16 | 552,570 | |||
| 1,000,000 | AA | 5.250% due 5/1/21 | 1,048,560 | |||
| 1,000,000 | Baa2* | Williamette Falls Hospital Project, 6.000% due 4/1/19 | 1,047,540 | |||
| 1,000,000 | AA | Hillsboro Hospital Facility Authority Revenue, (Tuality Healthcare | ||||
| Project), Radian-Insured, 5.375% due 10/1/31 | 1,050,230 | |||||
| 1,000,000 | BBB | Klamath Falls, Inter-Community Hospital Authority Revenue, | ||||
| (Merle West Medical Center Project), 6.250% due 9/1/31 (b) | 1,057,530 | |||||
| 500,000 | AA | Multnomah County Hospital Facility Authority Revenue, | ||||
| Providence Health System, 5.250% due 10/1/24 | 525,615 | |||||
| 1,000,000 | BBB- | Puerto Rico Industrial, Tourist, Educational, Medical & | ||||
| Environmental Control Facility, (Ryder Memorial Hospital | ||||||
| Project), Series A, 6.700% due 5/1/24 | 1,011,420 | |||||
| See Notes to Financial Statements. | |
| 9 Smith Barney Oregon Municipals Fund | 2004 Semi-Annual Report |
| Schedule of Investments (unaudited) (continued) | October 31, 2004 |
| FACE AMOUNT | RATING(a) SECURITY | VALUE | ||||
| Hospitals — 17.0% (continued) | ||||||
| Umatilla County Hospital Facility Authority Revenue, | ||||||
| Catholic Health Initiatives, Series A: | ||||||
| $ | 1,000,000 | AA | 5.750% due 12/1/20 (b) | $ | 1,064,240 | |
| 500,000 | AA | 5.500% due 3/1/22 | 528,930 | |||
| 1,000,000 | AA | 5.000% due 5/1/22 | 1,048,530 | |||
| 9,479,495 | ||||||
| Housing: Multi-Family — 7.7% | ||||||
| 470,000 | NR | Multi-Family Housing Revenue Bond Pass-Through Certificates | ||||
| Beneficial Ownership, Pacific Tower Apartments, | ||||||
| Series 6, 6.050% due 11/1/34 (e) | 456,093 | |||||
| 185,000 | A+ | Oregon State Housing & Community Services Department, | ||||
| Housing Finance Revenue, Assisted or Insured Multi-Unit, | ||||||
| Series A, FHA-Insured, 6.800% due 7/1/13 | 185,150 | |||||
| Portland Housing Authority, Multi-Family Revenue: | ||||||
| 500,000 | Aaa* | Cherry Blossom Apartments, Series A, GNMA-Collateralized, | ||||
| 6.100% due 12/20/26 (e) | 526,225 | |||||
| 850,000 | Aa2* | Cherry Ridge Project, LOC-U.S. Bank Trust N.A., | ||||
| 6.250% due 5/1/12 (e) | 858,100 | |||||
| Washington County Housing Authority, Multi-Family Revenue: | ||||||
| 1,000,000 | NR | Affordable Housing Pool, Series A, 6.125% due 7/1/29 | 1,028,530 | |||
| 1,000,000 | Aa3* | Bethany Meadows Project, LOC-U.S. Bank N.A., | ||||
| 6.250% due 8/1/13 (e) | 1,033,210 | |||||
| 220,000 | AAA | Terrace View Project, FNMA-Collateralized, | ||||
| 5.500% due 12/1/17 (e) | 228,162 | |||||
| 4,315,470 | ||||||
| Housing: Single-Family — 1.7% | ||||||
| 450,000 | Aa2* | Oregon State Housing & Community Services Department, | ||||
| Mortgage Revenue, Single-Family Mortgage Program, | ||||||
| Series F, 5.550% due 7/1/30 | 461,273 | |||||
| 295,000 | AAA | Puerto Rico Housing Bank & Finance Agency, Single-Family | ||||
| Mortgage Revenue, Affordable Housing Mortgage-Portfolio I, | ||||||
| GNMA/FNMA/FHLMC-Collateralized, 6.250% due 4/1/29 (e) | 302,502 | |||||
| 185,000 | AAA | Virgin Islands HFA, Single-Family Revenue, GNMA | ||||
| Mortgage-Backed Securities Program, Series A, | ||||||
| GNMA-Collateralized, 6.450% due 3/1/16 (e) | 189,453 | |||||
| 953,228 | ||||||
| Industrial Development — 1.8% | ||||||
| 1,000,000 | BB+ | Oregon State EDR, Georgia-Pacific Corp., Series CLVII, | ||||
| 6.350% due 8/1/25 (e) | 1,006,160 | |||||
| Life Care Systems — 6.4% | ||||||
| Clackamas County, Hospital Facility Authority Revenue: | ||||||
| 2,000,000 | NR | Mary’s Woods at Marylhurst Inc., Sr. Living Facility, Series A, | ||||
| 6.625% due 5/15/29 (b) | 2,088,620 | |||||
| See Notes to Financial Statements. | |
| 10 Smith Barney Oregon Municipals Fund | 2004 Semi-Annual Report |
| Schedule of Investments (unaudited) (continued) | October 31, 2004 |
| FACE AMOUNT | RATING(a) SECURITY | VALUE | ||||
| Life Care Systems — 6.4% (continued) | ||||||
| $ | 500,000 | NR | Robison Jewish Home Project, 6.250% due 10/1/28 | $ | 503,265 | |
| 1,000,000 | NR | Yamhill County Hospital Authority, Friendsview Retirement | ||||
| Community, 7.00% due 12/1/34 | 999,300 | |||||
| 3,591,185 | ||||||
| Miscellaneous — 3.5% | ||||||
| 300,000 | NR | Lebanon Urban Renewal Agency, 5.500% due 6/1/14 | 325,431 | |||
| Oregon State Department of Administrative Services Lottery | ||||||
| Revenue, Series B, FSA-Insured, | ||||||
| 1,000,000 | AAA | 5.000% due 4/1/18 (b) | 1,092,510 | |||
| 500,000 | AAA | 5.000% due 4/1/19 | 547,500 | |||
| 1,965,441 | ||||||
| Public Facilities — 1.0% | ||||||
| 500,000 | AAA | Oregon State Bond Bank Revenue, Economic & Community | ||||
| Development Department, Series B, MBIA-Insured, | ||||||
| 5.500% due 1/1/26 | 537,940 | |||||
| Solid Waste — 3.8% | ||||||
| 1,975,000 | NR | Wasco County Solid Waste Disposal Revenue, | ||||
| (Waste Connections Inc. Project), 7.250% due 3/1/21(b)(e) | 2,121,683 | |||||
| Transportation — 11.7% | ||||||
| Oregon State Department of Transportation, Highway User Tax | ||||||
| Revenue: | ||||||
| 500,000 | AA+ | 5.375% due 11/15/20 | 549,730 | |||
| Series A: | ||||||
| 1,000,000 | AA+ | Call 11/15/12 @ 100, 5.500% due 11/15/18 (b)(c) | 1,162,550 | |||
| 1,000,000 | AA+ | 5.500% due 11/15/20 (b) | 1,129,280 | |||
| 1,000,000 | AAA | Port of Portland Airport Revenue, Portland International Airport, | ||||
| Series B, AMBAC-Insured, 5.500% due 7/1/18 (b)(e) | 1,072,790 | |||||
| 800,000 | A-1+ | Port of Portland Special Obligation Revenue, (Horizon Air | ||||
| Industries, Inc. Project), LOC-Bank of America N.A., | ||||||
| 1.760% due 6/15/27 (e)(f) | 800,000 | |||||
| 945,000 | A | Puerto Rico Commonwealth Highway & Transportation Authority | ||||
| Revenue, Series H, 5.000% due 7/1/28 | 967,623 | |||||
| 500,000 | CCC | Puerto Rico Port Authority Revenue, Special Facilities, | ||||
| American Airlines Inc., Series A, 6.250% due 6/1/26 (e) | 309,030 | |||||
| 500,000 | AA+ | Tri-County Metropolitan Transportation District Revenue, | ||||
| Series A, 5.375% due 8/1/20 | 546,200 | |||||
| 6,537,203 | ||||||
| Utilities — 0.2% | ||||||
| 100,000 | NR | Western Generation Agency, Cogeneration Project Revenue, | ||||
| (Wauna Cogeneration Project), Series B, 7.250% due 1/1/09 (e) | 101,276 | |||||
| See Notes to Financial Statements. | |
| 11 Smith Barney Oregon Municipals Fund | 2004 Semi-Annual Report |
| Schedule of Investments (unaudited) (continued) | October 31, 2004 |
| FACE AMOUNT | RATING(a) SECURITY | VALUE | |||||
| Water and Sewer — 5.1% | |||||||
| $ | 360,000 | AA- | Clackamas County, Service District No. 1, Sewer Revenue, | ||||
| (Pre-Refunded — Escrowed with state and local government | |||||||
| securities to 10/1/06 Call @ 100), 6.375% due 10/1/14 | $ | 389,804 | |||||
| 500,000 | AAA | Eugene Water Revenue, Utility System, FSA-Insured, | |||||
| 5.875% due 8/1/30 | 561,835 | ||||||
| 1,000,000 | AAA | Klamath Falls Wastewater Revenue, AMBAC-Insured, | |||||
| 5.500% due 6/1/25 (b) | 1,082,600 | ||||||
| 600,000 | Aa1* | Port of Umatilla Water Revenue, LOC-Bank of America N.A., | |||||
| 6.650% due 8/1/22 (e) | 607,788 | ||||||
| 165,000 | AAA | Puerto Rico Commonwealth, Aqueduct & Sewer Authority | |||||
| Revenue, 10.250% due 7/1/09 (g) | 201,726 | ||||||
| 2,843,753 | |||||||
| TOTAL INVESTMENTS — 100.2% | |||||||
| (Cost — $52,589,269**) | 55,952,041 | ||||||
| Liabilities in Excess of Other Assets — (0.2)% | (119,658 | ) | |||||
| NET ASSETS — 100.0% | $ | 55,832,383 | |||||
| (a) | All ratings are by Standard & Poor’s Ratings Service, except those identified by an asterisk (*), which are rated by Moody’s Investors Services. |
| (b) | All or portion of this security is segregated for open futures contracts. |
| (c) | Pre-Refunded bonds are escrowed with U.S. government securities and are considered by the manager to be triple-A rated even if the issuer has not applied for new ratings. |
| (d) | Inverse floating rate security-coupon varies inversely with level of short term tax exempt interest rates. |
| (e) | Income from these issues is considered a preference item for purposes of calculating the alternative minimum tax. |
| (f) | Variable rate obligation payable at par on demand at any time on no more than seven days notice. |
| (g) | Bonds are escrowed to maturity with U.S. government securities and are considered by the manager to be triple-A rated even if the issuer has not applied for new ratings. |
| † | All or portion of this security is held as collateral for open futures contracts. |
| ** | Aggregate cost for Federal income tax purposes is substantially the same. |
| See pages 13 to 14 for definitions of ratings and certain abbreviations. |
| See Notes to Financial Statements. | |
| 12 Smith Barney Oregon Municipals Fund | 2004 Semi-Annual Report |
| Bond Ratings (unaudited) |
| The definitions of the applicable rating symbols are set forth below: | ||
Standard & Poor’s Ratings Service (“Standard & Poor’s”) — Ratings from “AA” to “CCC” may be modified by the addition of a plus (+) or minus (-) sign to show relative standings within the major rating categories. | ||
| AAA | — | Bonds rated “AAA” have the highest rating assigned by Standard & Poor’s. Capacity to pay interest and repay principal is extremely strong. |
| AA | — | Bonds rated “AA” have a very strong capacity to pay interest and repay principal and differs from the highest rated issue only in a small degree. |
| A | — | Bonds rated “A” have a strong capacity to pay interest and repay principal although it is somewhat more susceptible to the adverse effects of changes in circumstances and economic conditions than debt in higher rated categories. |
| BBB | — | Bonds rated “BBB” are regarded as having an adequate capacity to pay interest and repay principal. Whereas they normally exhibit adequate protection parameters, adverse economic conditions or changing circumstances are more likely to lead to a weakened capacity to pay interest and repay principal for debt in this category than in higher rated categories. |
| BB, B, CCC, CC and C | — | Bonds rated “BB”, “B”, “CCC”, “CC” and “C” are regarded, on balance, as predominantly speculative with respect to capacity to pay interest and repay principal in accordance with the terms of the obligation. “BB” represents the lowest degree of speculation and “C” the highest degree of speculation. While such bonds will likely have some quality and protective characteristics, these are outweighed by large uncertainties or major risk exposures to adverse conditions. |
Moody’s Investors Service (“Moody’s”) — Numerical modifiers 1, 2 and 3 may be applied to each generic rating from “Aa” to “Caa,” where 1 is the highest and 3 the lowest ranking within its generic category. | ||
| Aaa | — | Bonds rated “Aaa” are judged to be of the best quality. They carry the smallest degree of investment risk and are generally referred to as “gilt edge.” Interest payments are protected by a large or by an exceptionally stable margin and principal is secure. While the various protective elements are likely to change, such changes as can be visualized are most unlikely to impair the fundamentally strong position of such issues. |
| Aa | — | Bonds rated “Aa” are judged to be of high quality by all standards. Together with the “Aaa” group they comprise what are generally known as high grade bonds. They are rated lower than the best bonds because margins of protection may not be as large in “Aaa” securities or fluctuation of protective elements may be of greater amplitude or there may be other elements present which make the long-term risks appear somewhat larger than in “Aaa” securities. |
| A | — | Bonds rated “A” possess many favorable investment attributes and are to be considered as upper medium grade obligations. Factors giving security to principal and interest are considered adequate but elements may be present which suggest a susceptibility to impairment some time in the future. |
| Baa | — | Bonds rated “Baa” are considered as medium grade obligations, i.e., they are neither highly protected nor poorly secured. Interest payments and principal security appear adequate for the present but certain protective elements may be lacking or may be characteristically unreliable over any great length of time. Such bonds lack outstanding investment characteristics and in fact have speculative characteristics as well. |
| B | — | Bonds that are rated “B” generally lack characteristics of desirable investments. Assurance of interest and principal payments or of maintenance of other terms of the contract over any long period of time may be small. |
| Caa | — | Bonds rated “Caa” are of poor standing. These issues may be in default, or present elements of danger may exist with respect to principal or interest. |
| NR | — | Indicates that the Bond is not rated by Standard & Poor’s or Moody’s. |
| 13 Smith Barney Oregon Municipals Fund | 2004 Semi-Annual Report |
| Short-Term Security Ratings (unaudited) |
| SP-1 | — | Standard & Poor’s highest rating indicating very strong or strong capacity to pay principal and interest; those issues determined to possess overwhelming safety characteristics are denoted with a plus (+) sign. |
| A-1 | — | Standard & Poor’s highest commercial paper and variable-rate demand obligation (VRDO) rating indicating that the degree of safety regarding timely payment is either overwhelming or very strong; those issues determined to possess overwhelming safety characteristics are denoted with a plus (+) sign. |
| VMIG 1 | — | Moody’s highest rating for issues having a demand feature — VRDO. |
| P-1 | — | Moody’s highest rating for commercial paper and for VRDO prior to the advent of the VMIG 1 rating. |
Abbreviations* (unaudited) |
| ABAG | — | Association of Bay Area | GO | — | General Obligation |
| Governments | HDC | — | Housing Development | ||
| ACA | — | American Capital Assurance | Corporation | ||
| AIG | — | American International Guaranty | HFA | — | Housing Finance Authority |
| AMBAC | — | Ambac Assurance Corporation | IDA | — | Industrial Development |
| BAN | — | Bond Anticipation Notes | Authority | ||
| BIG | — | Bond Investors Guaranty | IDB | — | Industrial Development Board |
| CBI | — | Certificate of Bond Insurance | IDR | — | Industrial Development Revenue |
| CGIC | — | Capital Guaranty Insurance | INFLOS | — | Inverse Floaters |
| Company | ISD | — | Independent School District | ||
| CHFCLI | — | California Health Facility | LOC | — | Letter of Credit |
| Construction Loan Insurance | MBIA | — | Municipal Bond Investors | ||
| CONNIE | Assurance Corporation | ||||
| LEE | — | College Construction Loan | MFH | — | Multi-Family Housing |
| Insurance Association | MVRICS | — | Municipal Variable Rate Inverse | ||
| COP | — | Certificate of Participation | Coupon Security | ||
| EDA | — | Economic Development | PCR | — | Pollution Control Revenue |
| Authority | PSF | — | Permanent School Fund | ||
| EDR | — | Economic Development | RAN | — | Revenue Anticipation Notes |
| Revenue | REFORP | — | Refinance Corp. | ||
| ETM | — | Escrowed To Maturity | RIBS | — | Residual Interest Bonds |
| FGIC | — | Financial Guaranty Insurance | RITES | — | Residual Interest Tax-Exempt |
| Company | Securities | ||||
| FHA | — | Federal Housing Administration | TAN | — | Tax Anticipation Notes |
| FHLMC | — | Federal Home Loan Mortgage | TECP | — | Tax-Exempt Commercial Paper |
| Corporation | TOB | — | Tender Option Bonds | ||
| FLAIRS | — | Floating Adjustable Interest Rate | TRAN | — | Tax and Revenue Anticipation |
| Securities | Notes | ||||
| FNMA | — | Federal National Mortgage | SYCC | — | Structured Yield Curve |
| Association | Certificate | ||||
| FRTC | — | Floating Rate Trust Certificates | VA | — | Veterans Administration |
| FSA | — | Financing Security Assurance | VRDD | — | Variable Rate Daily Demand |
| GIC | — | Guaranteed Investment Contract | VRWE | — | Variable Rate Wednesday |
| GNMA | — | Government National Mortgage | Demand | ||
| Association | XLCA | — | XL Capital Assurance Inc. |
| ____________ |
| * Abbreviations may or may not appear in the schedule of investments. |
| 14 Smith Barney Oregon Municipals Fund | 2004 Semi-Annual Report |
| * | Redemption price is NAV of Class B and C shares reduced by 4.50% and 1.00% CDSC, respectively, if shares are redeemed within one year from purchase payments. (See Note 2). |
| See Notes to Financial Statements. | |
| 15 Smith Barney Oregon Municipals Fund | 2004 Semi-Annual Report |
| Statement of Operations (unaudited) For the Six Months Ended October 31, 2004 |
| INVESTMENT INCOME: | |||||
| Interest | $ | 1,460,983 | |||
| EXPENSES: | |||||
| Distribution plan fees (Notes 2 and 4) | 110,656 | ||||
| Investment advisory fee (Note 2) | 82,633 | ||||
| Administration fee (Note 2) | 55,088 | ||||
| Audit and legal | 27,048 | ||||
| Shareholder communications (Note 4) | 20,424 | ||||
| Custody | 11,224 | ||||
| Transfer agency services (Notes 2 and 4) | 9,016 | ||||
| Trustees’fees | 6,624 | ||||
| Registration fees | 1,288 | ||||
| Other expenses | 2,392 | ||||
| Total Expenses | 326,393 | ||||
| Less: Investment advisory and administration fee waivers (Notes 2 and 8) | (45,556 | ) | |||
| Net Expenses | 280,837 | ||||
| Net Investment Income | 1,180,146 | ||||
| REALIZED AND UNREALIZED GAIN (LOSS) ON | |||||
| INVESTMENTS (NOTES 1 AND 3): | |||||
| Realized Gain (Loss) From: | |||||
| Investment transactions | 123,969 | ||||
| Futures contracts | (110,247 | ) | |||
| Net Realized Gain | 13,722 | ||||
| Net Decrease in Unrealized Appreciation of Investments and Futures Contracts | (89,237 | ) | |||
| Net Loss on Investments and Futures Contracts | (75,515 | ) | |||
| Increase in Net Assets From Operations | $ | 1,104,631 | |||
| See Notes to Financial Statements. | |
| 16 Smith Barney Oregon Municipals Fund | 2004 Semi-Annual Report |
| Statements of Changes in Net Assets |
For the Six Months Ended October 31, 2004 (unaudited) |
| October 31 | April 30 | |||||||
| OPERATIONS: | ||||||||
| Net investment income | $ | 1,180,146 | $ | 2,445,115 | ||||
| Net realized gain (loss) | 13,722 | (138,114 | ) | |||||
| Net increase (decrease) in unrealized appreciation | (89,237 | ) | 50,659 | |||||
| Increase in Net Assets From Operations | 1,104,631 | 2,357,660 | ||||||
| DIVIDENDS TO SHAREHOLDERS | ||||||||
| FROM (NOTE 5): | ||||||||
| Net investment income | (1,209,472 | ) | (2,389,110 | ) | ||||
| Decrease in Net Assets From | ||||||||
| Dividends to Shareholders | (1,209,472 | ) | (2,389,110 | ) | ||||
| FUND SHARE TRANSACTIONS (NOTE 6): | ||||||||
| Net proceeds from sale of shares | 7,267,277 | 7,097,910 | ||||||
| Net asset value of shares issued for reinvestment | ||||||||
| of dividends | 722,846 | 1,426,138 | ||||||
| Cost of shares reacquired | (4,820,154 | ) | (9,832,724 | ) | ||||
| Increase (Decrease) in Net Assets From | ||||||||
| Fund Share Transactions | 3,169,969 | (1,308,676 | ) | |||||
| Increase (Decrease) in Net Assets | 3,065,128 | (1,340,126 | ) | |||||
NET ASSETS: | ||||||||
| Beginning of period | 52,767,255 | 54,107,381 | ||||||
| End of period* | $ | 55,832,383 | $ | 52,767,255 | ||||
| * Includes undistributed net investment income of: | $ | 36,579 | $ | 65,905 | ||||
| See Notes to Financial Statements. | |
| 17 Smith Barney Oregon Municipals Fund | 2004 Semi-Annual Report |
Financial Highlights (unaudited) For a share of beneficial interest outstanding throughout each year ended April 30, unless otherwise noted: |
| Class A Shares(1) | 2004(2) | 2004 | 2003 | 2002 | 2001 | 2000 | ||||||||||||||
| Net Asset Value, | ||||||||||||||||||||
| Beginning of Period | $ | 10.69 | $ | 10.70 | $ | 10.57 | $ | 10.33 | $ | 10.02 | $ | 10.87 | ||||||||
| Income (Loss) | ||||||||||||||||||||
| From Operations: | ||||||||||||||||||||
| Net investment income | 0.24 | 0.52 | 0.52 | 0.53 | (3) | 0.54 | 0.51 | |||||||||||||
| Net realized and unrealized | ||||||||||||||||||||
| gain (loss) | (0.01 | ) | (0.02 | ) | 0.13 | 0.25 | (3) | 0.31 | (0.84 | ) | ||||||||||
| Total Income (Loss) | ||||||||||||||||||||
| From Operations | 0.23 | 0.50 | 0.65 | 0.78 | 0.85 | (0.33 | ) | |||||||||||||
| Less Dividends and | ||||||||||||||||||||
| Distributions From: | ||||||||||||||||||||
| Net investment income | (0.25 | ) | (0.51 | ) | (0.51 | ) | (0.54 | ) | (0.54 | ) | (0.50 | ) | ||||||||
| Net realized gains | — | — | — | — | — | (0.02 | ) | |||||||||||||
| In excess of net investment income | — | — | (0.01 | ) | — | — | — | |||||||||||||
| Total Dividends and Distributions | (0.25 | ) | (0.51 | ) | (0.52 | ) | (0.54 | ) | (0.54 | ) | (0.52 | ) | ||||||||
| Net Asset Value, | ||||||||||||||||||||
| End of Period | $ | 10.67 | $ | 10.69 | $ | 10.70 | $ | 10.57 | $ | 10.33 | $ | 10.02 | ||||||||
| Total Return(4) | 2.17 | %‡ | 4.74 | % | 6.29 | % | 7.67 | % | 8.62 | % | (3.01 | )% | ||||||||
| Net Assets, | ||||||||||||||||||||
| End of Period (000s) | $ | 28,832 | $ | 28,041 | $ | 27,820 | $ | 24,163 | $ | 16,657 | $ | 14,272 | ||||||||
| Ratios to Average | ||||||||||||||||||||
| Net Assets: | ||||||||||||||||||||
| Expenses(5) | 0.75 | %† | 0.74 | % | 0.81 | % | 0.77 | % | 0.82 | % | 0.83 | % | ||||||||
| Net investment income | 4.55 | † | 4.82 | 4.85 | 4.98 | (3) | 5.23 | 5.02 | ||||||||||||
| Portfolio Turnover Rate | 5 | % | 14 | % | 19 | % | 20 | % | 35 | % | 81 | % | ||||||||
| (1) | Per share amounts have been calculated using the monthly average shares method. |
| (2) | For the six months ended October 31, 2004 (unaudited). |
| (3) | Effective May 1, 2001, the Fund adopted a change in the accounting method that requires the Fund to amortize premiums and accrete all discounts. Without the adoption of this change, for the year ended April 30, 2002, the ratio of net investment income to average net assets would have been 4.99%. Per share, ratios and supplemental data for the periods prior to May 1, 2001 have not been restated to reflect this change in presentation. In addition, the impact of this change to net invest-ment income and net realized and unrealized gain was less than $0.01. |
| (4) | Performance figures may reflect fee waivers and/or expense reimbursements. Past performance is no guarantee of future results. In the absence of fee waivers and/or expense reimbursements, the total return would have been lower. |
| (5) | The investment adviser and administrator waived all or portion of its management fees for the six months ended October 31, 2004 and for each of the years ended April 30, 2004, 2003, 2002, 2001 and 2000. If such fees were not waived, the actual expense ratio for Class A would have been 0.92% annualized, 0.89%, 0.96%, 0.92%, 0.97% and 0.98% for the six months ended October 31, 2004 and each of the years ended April 30, 2004, 2003, 2002, 2001 and 2000, respectively. |
| ‡ | Total return is not annualized, as it may not be representative of the total return for the year. |
| † | Annualized. |
| See Notes to Financial Statements. | |
| 18 Smith Barney Oregon Municipals Fund | 2004 Semi-Annual Report |
Financial Highlights (unaudited) (continued) For a share of beneficial interest outstanding throughout each year ended April 30, unless otherwise noted: |
| Class B Shares(1) | 2004(2) | 2004 | 2003 | 2002 | 2001 | 2000 | ||||||||||||||
| Net Asset Value, | ||||||||||||||||||||
| Beginning of Period | $ | 10.63 | $ | 10.63 | $ | 10.52 | $ | 10.29 | $ | 10.00 | $ | 10.85 | ||||||||
| Income (Loss) | ||||||||||||||||||||
| From Operations: | ||||||||||||||||||||
| Net investment income | 0.21 | 0.46 | 0.45 | 0.47 | (3) | 0.48 | 0.46 | |||||||||||||
| Net realized and unrealized gain (loss) | (0.02 | ) | (0.01 | ) | 0.12 | 0.26 | (3) | 0.31 | (0.84 | ) | ||||||||||
| Total Income (Loss) | ||||||||||||||||||||
| From Operations | 0.19 | 0.45 | 0.57 | 0.73 | 0.79 | (0.38 | ) | |||||||||||||
| Less Dividends and | ||||||||||||||||||||
| Distributions From: | ||||||||||||||||||||
| Net investment income | (0.22 | ) | (0.45 | ) | (0.45 | ) | (0.50 | ) | (0.50 | ) | (0.45 | ) | ||||||||
| Net realized gains | — | — | — | — | — | (0.02 | ) | |||||||||||||
| In excess of net investment | ||||||||||||||||||||
| income | — | — | (0.01 | ) | — | — | — | |||||||||||||
| Total Dividends and Distributions | (0.22 | ) | (0.45 | ) | (0.46 | ) | (0.50 | ) | (0.50 | ) | (0.47 | ) | ||||||||
| Net Asset Value, | ||||||||||||||||||||
| End of Period | $ | 10.60 | $ | 10.63 | $ | 10.63 | $ | 10.52 | $ | 10.29 | $ | 10.00 | ||||||||
| Total Return(4) | 1.81 | %‡ | 4.25 | % | 5.53 | % | 7.21 | % | 8.06 | % | (3.52 | )% | ||||||||
| Net Assets, | ||||||||||||||||||||
| End of Period (000s) | $ | 11,651 | $ | 13,057 | $ | 15,718 | $ | 17,014 | $ | 16,572 | $ | 16,199 | ||||||||
| Ratios to Average | ||||||||||||||||||||
| Net Assets: | ||||||||||||||||||||
| Expenses(5) | 1.32 | %† | 1.27 | % | 1.39 | % | 1.29 | % | 1.35 | % | 1.35 | % | ||||||||
| Net investment income | 3.97 | † | 4.29 | 4.26 | 4.46 | (3) | 4.72 | 4.49 | ||||||||||||
| Portfolio Turnover Rate | 5 | % | 14 | % | 19 | % | 20 | % | 35 | % | 81 | % | ||||||||
| (1) | Per share amounts have been calculated using the monthly average shares method. |
| (2) | For the six months ended October 31, 2004 (unaudited). |
| (3) | Effective May 1, 2001, the Fund adopted a change in the accounting method that requires the Fund to amortize premiums and accrete all discounts. Without the adoption of this change, for the year ended April 30, 2002, the ratio of net investment income to average net assets would have been 4.47%. Per share, ratios and supplemental data for the periods prior to May 1, 2001 have not been restated to reflect this change in presentation. In addition, the impact of this change to net investment income and net realized and unrealized gain was less than $0.01. |
| (4) | Performance figures may reflect fee waivers and/or expense reimbursements. Past performance is no guarantee of future results. In the absence of fee waivers and/or expense reimbursements, the total return would have been lower. |
| (5) | The investment adviser and administrator waived all or portion of its management fees for the six months ended October 31, 2004 and for each of the years ended April 30, 2004, 2003, 2002, 2001 and 2000. If such fees were not waived, the actual expense ratio for Class B would have been 1.49% annualized, 1.42%, 1.54%, 1.44%, 1.49% and 1.49% for the six months ended October 31, 2004 and each of the years ended April 30, 2004, 2003, 2002, 2001 and 2000, respectively. |
| ‡ | Total return is not annualized, as it may not be representative of the total return for the year. |
| † | Annualized. |
| See Notes to Financial Statements. | |
| 19 Smith Barney Oregon Municipals Fund | 2004 Semi-Annual Report |
| Financial Highlights (unaudited) (continued) For a share of beneficial interest outstanding throughout each year ended April 30, unless otherwise noted: |
| Class C Shares(1) | 2004(2) | 2004 | 2003 | 2002 | 2001 | 2000 | ||||||||||||||
| Net Asset Value, | ||||||||||||||||||||
| Beginning of Period | $ | 10.64 | $ | 10.65 | $ | 10.53 | $ | 10.31 | $ | 10.01 | $ | 10.86 | ||||||||
| Income (Loss) | ||||||||||||||||||||
| From Operations: | ||||||||||||||||||||
| Net investment income | 0.21 | 0.45 | 0.46 | 0.46 | (3) | 0.48 | 0.46 | |||||||||||||
| Net realized and unrealized | ||||||||||||||||||||
| gain (loss) | (0.01 | ) | (0.01 | ) | 0.12 | 0.26 | (3) | 0.32 | (0.84 | ) | ||||||||||
| Total Income (Loss) | ||||||||||||||||||||
| From Operations | 0.20 | 0.44 | 0.58 | 0.72 | 0.80 | (0.38 | ) | |||||||||||||
| Less Dividends and | ||||||||||||||||||||
| Distributions From: | ||||||||||||||||||||
| Net investment income | (0.22 | ) | (0.45 | ) | (0.45 | ) | (0.50 | ) | (0.50 | ) | (0.45 | ) | ||||||||
| Net realized gains | — | — | — | — | — | (0.02 | ) | |||||||||||||
| In excess of net investment | ||||||||||||||||||||
| income | — | — | (0.01 | ) | — | — | — | |||||||||||||
| Total Dividends and Distributions | (0.22 | ) | (0.45 | ) | (0.46 | ) | (0.50 | ) | (0.50 | ) | (0.47 | ) | ||||||||
| Net Asset Value, | ||||||||||||||||||||
| End of Period | $ | 10.62 | $ | 10.64 | $ | 10.65 | $ | 10.53 | $ | 10.31 | $ | 10.01 | ||||||||
| Total Return(4) | 1.88 | %‡ | 4.15 | % | 5.57 | % | 7.05 | % | 8.10 | % | (3.55 | )% | ||||||||
| Net Assets, | ||||||||||||||||||||
| End of Period (000s) | $ | 15,349 | $ | 11,669 | $ | 10,569 | $ | 6,001 | $ | 3,724 | $ | 2,997 | ||||||||
| Ratios to Average | ||||||||||||||||||||
| Net Assets: | ||||||||||||||||||||
| Expenses(5) | 1.30 | %† | 1.33 | % | 1.39 | % | 1.35 | % | 1.39 | % | 1.39 | % | ||||||||
| Net investment income | 4.01 | † | 4.23 | 4.28 | 4.39 | (3) | 4.67 | 4.46 | ||||||||||||
| Portfolio Turnover Rate | 5 | % | 14 | % | 19 | % | 20 | % | 35 | % | 81 | % | ||||||||
| (1) | Per share amounts have been calculated using the monthly average shares method. |
| (2) | For the six months ended October 31, 2004 (unaudited). |
| (3) | Effective May 1, 2001, the Fund adopted a change in the accounting method that requires the Fund to amortize premiums and accrete all discounts. Without the adoption of this change, for the year ended April 30, 2002, net investment income, net realized and unrealized gain and the ratio of net investment income to average net assets would have been $0.47, $0.25 and 4.40%, respectively. Per share, ratios and supplemental data for the periods prior to May 1, 2001 have not been restated to reflect this change in presentation. |
| (4) | Performance figures may reflect fee waivers and/or expense reimbursements. Past performance is no guarantee of future results. In the absence of fee waivers and/or expense reimbursements, the total return would have been lower. |
| (5) | The investment adviser and administrator waived all or portion of its management fees for the six months ended October 31, 2004 and for each of the years ended April 30, 2004, 2003, 2002, 2001 and 2000. If such fees were not waived, the actual expense ratio for Class C would have been 1.47% annualized, 1.48%, 1.54%, 1.50%, 1.54% and 1.53% for the six months ended October 31, 2004 and each of the years ended April 30, 2004, 2003, 2002, 2001 and 2000, respectively. |
| ‡ | Total return is not annualized, as it may not be representative of the total return for the year. |
| † | Annualized. |
| See Notes to Financial Statements. | |
| 20 Smith Barney Oregon Municipals Fund | 2004 Semi-Annual Report |
1. Organization and Significant Accounting Policies | |
Smith Barney Oregon Municipals Fund (“Fund”), a Massachussets business trust, is registered under the Investment Company Act of 1940, as amended (“1940 Act”), as a non-diversified, open-end management investment company. The following are significant accounting policies consistently followed by the Fund and are in conformity with U.S. generally accepted accounting principles (“GAAP”). Estimates and assumptions are required to be made regarding assets, liabilities and changes in net assets resulting from operations when financial statements are prepared. Changes in the economic environment, financial markets and any other parameters used in determining these estimates could cause actual results to differ. (a) Investment Valuation. Securities are valued at the mean between the quoted bid and asked prices provided by an independent pricing service. When market quotations or official closing prices are not readily available, or are determined not to reflect accurately fair value, such as when the value of a security has been significantly affected by events after the close of the exchange or market on which the security is principally traded, but before the Fund calculates its net asset value, the Fund may value these investments at fair value as determined in accordance with the procedures approved by the Fund’s Board of Trustees. Short-term obligations maturing within 60 days are valued at amortized cost, which approximates value. (b) Futures Contracts. The Fund may enter into futures contracts to the extent permitted by its investment policies and objectives. Upon entering into a futures contract, the Fund is required to deposit cash or securities as initial margin. Additional securities are also segregated up to the current market value of the futures contracts. Subsequent payments, which are dependent on the daily fluctuations in the value of the underlying instrument, are made or received by the Fund each day (daily variation margin) and are recorded as unrealized gains or losses until the contracts are closed. When the contracts are closed, the Fund records a realized gain or loss equal to the difference between the proceeds from (or cost of) the closing transactions and the Fund’s basis in the contracts. The Fund enters into such contracts typically to hedge a portion of the portfolio. Risks of entering into futures contracts for hedging purposes include the possibility that a change in the value of the contract may not correlate with the changes in the value of the investments hedged. In addition, the purchase of a futures contract involves the risk that the Fund could lose more than the original margin deposit and subsequent payments required for a futures transaction. | |
| 21 Smith Barney Oregon Municipals Fund | 2004 Semi-Annual Report |
| Notes to Financial Statements (unaudited) (continued) |
(c) Investment Transactions and Investment Income. Security transactions are accounted for on trade date. Interest income adjusted for amortization of premium and accretion of discount, is recorded on an accrual basis. Gains or losses on the sale of securities are calculated by using the specific identification method. (d) Dividends and Distributions to Shareholders. Dividends and distributions to shareholders are recorded on the ex-dividend date. The character of income and gains to be distributed is determined in accordance with income tax regulations, which may differ from GAAP. The Fund intends to satisfy conditions that will enable interest from municipal securities, which is exempt from regular Federal income tax and from designated state income taxes, to retain such tax-exempt status when distributed to the shareholders of the Fund. It is the Fund’s policy to distribute dividends monthly. Capital gains distributions, if any, are taxable to shareholders, and are declared and paid at least annually. Additional taxable distributions may be made if necessary to avoid a Federal excise tax. (e) Fund Concentration. Since the Fund invests primarily in obligations of issuers within Oregon, it is subject to possible concentration risks associated with economic, political, or legal developments or industrial or regional matters specifically affecting Oregon. (f) Class Accounting. Class specific expenses are charged to each class; investment advisory, administration fees, general fund expenses, income, gains and/or losses are allocated on the basis of relative net assets of each class or on another reasonable basis. (g) Federal and Other Taxes. It is the Fund’s policy to comply with the federal income and excise tax requirements of the Internal Revenue Code of 1986, as amended, applicable to regulated investment companies. Accordingly, the Fund intends to distribute substantially all of its taxable income and net realized gains on investments, if any, to shareholders each year. Therefore, no federal income tax provision is required. Under the applicable foreign tax law a withholding tax may be imposed on interest, dividends, and capital gain at various rates. |
| 22 �� Smith Barney Oregon Municipals Fund | 2004 Semi-Annual Report |
Notes to Financial Statements (unaudited) (continued) |
2. Investment Advisory Agreement, Administration Agreement and Affiliated Transactions Smith Barney Fund Management LLC (“SBFM”), an indirect wholly-owned subsidiary of Citigroup Inc. (“Citigroup’’), acts as investment adviser to the Fund. The Fund pays SBFM an investment advisory fee calculated at an annual rate of 0.30% of the Fund’s average daily net assets. This fee is calculated daily and paid monthly. SBFM waived $29,029 of its investment advisory fee for the six months ended October 31, 2004. SBFM also acts as the Fund’s administrator for which the Fund pays a fee calculated at an annual rate of 0.20% of the Fund’s average daily net assets up to $500 million and 0.18% of the Fund’s average daily net assets in excess of $500 million. This fee is calculated daily and paid monthly. SBFM waived $16,527 of its administration fee for the six months ended October 31, 2004. Citicorp Trust Bank, fsb. (“CTB’’), another subsidiary of Citigroup, acts as the Fund’s transfer agent. PFPC Inc. (“PFPC’’) acts as the Fund’s sub-transfer agent. CTB receives account fees and asset-based fees that vary according to the size and type of account. PFPC is responsible for shareholder recordkeeping and financial processing for all shareholder accounts and is paid by CTB. For the six months ended October 31, 2004, the Fund paid transfer agent fees of $6,323 to CTB. Citigroup Global Markets Inc. (“CGM”), another indirect wholly-owned subsidiary of Citigroup, acts as the Fund’s distributor. There is a maximum sales charge of 4.00% for Class A shares. There is a contingent deferred sales charge (“CDSC’’) of 4.50% on Class B shares, which applies if redemption occurs within one year from purchase payment. This CDSC declines by 0.50% the first year after purchase and thereafter by 1.00% per year until no CDSC is incurred. Class C shares have a 1.00% CDSC, which applies if redemption occurs within one year from purchase payment. In certain cases, Class A shares have a 1.00% CDSC, which applies if redemption occurs within one year from purchase payment. This CDSC only applies to those purchases of Class A shares, which, when combined with current holdings of Class A shares, equal or exceed $500,000 in the aggregate. These purchases do not incur an initial sales charge. |
| 23 Smith Barney Oregon Municipals Fund | 2004 Semi-Annual Report |
Notes to Financial Statements (unaudited) (continued) For the six months ended October 31, 2004, CGM received sales charges of approximately $26,000 on sales of the Fund’s Class A shares. In addition, for the six months ended October 31, 2004, CDSCs paid to CGM were approximately $10,000 for Class B shares. All officers and one Trustee of the Fund are employees of Citigroup or its affiliates and do not receive compensation from the Fund. 3. Investments During the six months ended October 31, 2004, the aggregate cost of purchases and proceeds from sales of investments (excluding short-term investments) were as follows: |
| Purchases | $ | 6,666,694 | |||
| Sales | 2,566,295 | ||||
At October 31, 2004, the aggregate gross unrealized appreciation and depreciation of investments for Federal income tax purposes were substantially as follows: |
| Gross unrealized appreciation | $ | 3,562,477 | |||
| Gross unrealized depreciation | (199,705 | ) | |||
| Net unrealized appreciation | $ | 3,362,772 | |||
| At October 31, 2004, the Fund had the following open futures contracts: |
| Number of Contracts | Expiration Date | Basis Value | Market Value | Unrealized Loss | ||||||||||||
| To Sell: | ||||||||||||||||
| U.S. Treasury Bonds | 150 | 12/04 | $ | 16,432,032 | $ | 17,076,562 | $ | (644,530 | ) | |||||||
4. Class Specific Expenses Pursuant to a Rule 12b-1 Distribution Plan, the fund pays a service fee with respect to its Class A, B and C shares calculated at an annual rate of 0.15% of the average daily net assets for each respective class. In addition, the Fund pays a distribution fee with respect to its Class B and C shares calculated at an annual rate of 0.50% and 0.55% of the average daily net assets of each class, respectively. For the six months ended October 31, 2004, total Rule 12b-1 Distribution Plan fees, which are accrued daily and paid monthly, were as follows: |
| 24 Smith Barney Oregon Municipals Fund | 2004 Semi-Annual Report |
Notes to Financial Statements (unaudited) (continued) |
| Class A | Class B | Class C | |||||||||
| Rule 12b-1 Distribution Plan Fees | $ | 21,561 | $ | 40,279 | $ | 48,816 | |||||
For the six months ended October 31, 2004, total Transfer Agency Service expenses were as follows: |
| Class A | Class B | Class C | |||||||||
| Transfer Agency Service Expenses | $ | 3,864 | $ | 3,128 | $ | 2,024 | |||||
For the six months ended October 31, 2004, total Shareholder Communication expenses were as follows: |
| Class A | Class B | Class C | |||||||||
| Shareholder Communication Expenses | $ | 9,016 | $ | 6,992 | $ | 4,416 | |||||
| 5. Dividends Paid to Shareholders by Class |
| Six Months Ended October 31, 2004 | Year Ended April 30, 2004 | |||||||
| Class A | ||||||||
| Net investment income | $ | 667,262 | $ | 1,332,160 | ||||
| Total | $ | 667,262 | $ | 1,332,160 | ||||
| Class B | ||||||||
| Net investment income | $ | 253,618 | $ | 598,268 | ||||
| Total | $ | 253,618 | $ | 598,268 | ||||
| Class C | ||||||||
| Net investment income | $ | 288,592 | $ | 458,682 | ||||
| Total | $ | 288,592 | $ | 458,682 | ||||
6. Shares of Beneficial Interest At October 31, 2004, the Fund had an unlimited amount of shares of beneficial interest authorized with a par value of $0.001 per share.The Fund has the ability to issue multiple classes of shares. Each share of a class represents an identical interest and has the same rights, except that each class bears certain direct expenses, including those specifically related to the distribution of its shares. |
| 25 Smith Barney Oregon Municipals Fund | 2004 Semi-Annual Report |
Notes to Financial Statements (unaudited) (continued) Transactions in shares of each class were as follows: |
| Six Months Ended October 31, 2004 | Year Ended April 30, 2004 | |||||||||||||
| Shares | Amount | Shares | Amount | |||||||||||
| Class A | ||||||||||||||
| Shares sold | 241,305 | $ | 2,570,069 | 353,925 | $ | 3,820,603 | ||||||||
| Shares issued on reinvestment | 35,831 | 381,108 | 73,132 | 787,878 | ||||||||||
| Shares reacquired | (197,688 | ) | (2,105,323 | ) | (404,533 | ) | (4,370,388 | ) | ||||||
| Net Increase | 79,448 | $ | 845,854 | 22,524 | $ | 238,093 | ||||||||
| Class B | ||||||||||||||
| Shares sold | 9,194 | $ | 97,705 | 81,417 | $ | 875,212 | ||||||||
| Shares issued on reinvestment | 12,904 | 136,441 | 31,973 | 342,497 | ||||||||||
| Shares reacquired | (151,846 | ) | (1,607,604 | ) | (363,261 | ) | (3,887,510 | ) | ||||||
| Net Decrease | (129,748 | ) | $ | (1,373,458 | ) | (249,871 | ) | $ | (2,669,801 | ) | ||||
| Class C | ||||||||||||||
| Shares sold | 433,796 | $ | 4,599,503 | 223,427 | $ | 2,402,095 | ||||||||
| Shares issued on reinvestment | 19,387 | 205,297 | 27,569 | 295,763 | ||||||||||
| Shares reacquired | (104,493 | ) | (1,107,227 | ) | (146,661 | ) | (1,574,826 | ) | ||||||
| Net Increase | 348,690 | $ | 3,697,573 | 104,335 | $ | 1,123,032 | ||||||||
7. Capital Loss Carryforward At April 30, 2004, the Fund had a net capital loss carryforward of approximately $871,000 of which $279,000 expires in 2008, $238,000 expires in 2009, $345,000 expires in 2011 and $9,000 expires in 2012. This amount will be available to offset like amounts of any future taxable gains. 8. Additional Information In connection with an investigation previously disclosed by Citigroup, the Staff of the Securities and Exchange Commission (SEC) has notified Citigroup Asset Management (CAM), the Citigroup business unit that includes the funds’ investment manager and other investment advisory companies; Citicorp Trust Bank (CTB), an affiliate of CAM; Thomas W. Jones, the former CEO of CAM; and three other individuals, one of whom is an employee and the other two of whom are former employees of CAM, that the SEC Staff is considering recommending a civil injunctive action and/or an administrative proceeding against each of them relating to the creation and operation of an internal transfer agent unit to serve various CAM-managed funds. |
| 26 Smith Barney Oregon Municipals Fund | 2004 Semi-Annual Report |
Notes to Financial Statements (unaudited) (continued) In 1999, CTB entered the transfer agent business. CTB hired an unaffiliated subcontractor to perform some of the transfer agent services. The subcontractor, in exchange, had signed a separate agreement with CAM in 1998 that guaranteed investment management revenue to CAM and investment banking revenue to a CAM affiliate. The subcontractor’s business was later taken over by PFPC Inc., and at that time the revenue guarantee was eliminated and a one-time payment was made by the subcontractor to a CAM affiliate. CAM did not disclose the revenue guarantee when the boards of various CAM-managed funds hired CTB as transfer agent. Nor did CAM disclose to the boards of the various CAM-managed funds the one-time payment received by the CAM affiliate when it was made. In addition, the SEC Staff has indicated that it is considering recommending action based on the adequacy of the disclosures made to the fund boards that approved the transfer agency arrangement, CAM’s initiation and operation of, and compensation for, the transfer agent business and CAM ’s retention of, and agreements with, the subcontractor. Citigroup is cooperating fully in the investigation and will seek to resolve the matter in discussions with the SEC Staff. Although there can be no assurance, Citigroup does not believe that this matter will have a material adverse effect on the funds. As previously disclosed, CAM has already agreed to pay the applicable funds, primarily through fee waivers, a total of approximately $17 million (plus interest) that is the amount of the revenue received by Citigroup relating to the revenue guarantee. 9. Legal Matters Beginning in June, 2004, class action lawsuits alleging violations of the federal securities laws were filed against Citigroup Global Markets Inc. (the “Distributor”) and a number of its affiliates, including Smith Barney Fund Management LLC and Salomon Brothers Asset Management Inc (the “Advisers”), substantially all of the mutual funds managed by the Advisers, including the Fund, and directors or trustees of the Funds (collectively, the “Defendants”). The complaints alleged, among other things, that the Distributor created various undisclosed incentives for its brokers to sell Smith Barney and Salomon Brothers funds. In addition, according to the complaints, the Advisers caused the Funds to pay excessive brokerage commissions to the Distributor for |
| 27 Smith Barney Oregon Municipals Fund | 2004 Semi-Annual Report |
Notes to Financial Statements (unaudited) (continued) steering clients towards proprietary funds.The complaints also alleged that the defendants breached their fiduciary duty to the Funds by improperly charging Rule 12b-1 fees and by drawing on fund assets to make undisclosed payments of soft dollars and excessive brokerage commissions. The complaints also alleged that the Funds failed to adequately disclose certain of the allegedly wrongful conduct. The complaints sought injunctive relief and compensatory and punitive damages, rescission of the Funds’ contracts with the Advisers, recovery of all fees paid to the Advisers pursuant to such contracts and an award of attorneys’ fees and litigation expenses. On December 15, 2004, a consolidated amended complaint (the “Complaint”) was filed alleging substantially similar cause of action. While the lawsuit is in its earliest stages, to the extent that the Complaint purports to state causes of action against the Funds, Citigroup Asset Management believes the Funds have significant defenses to such allegations, which the Funds intend to vigorously assert in responding to the Complaint. Additional lawsuits arising out of these circumstances and presenting similar allegations and requests for relief may be filed against the Defendants in the future. As of the date of this report, Citigroup Asset Management and the Funds believe that the resolution of the pending lawsuit will not have a material effect on the financial position or results of operations of the Funds or the ability of the Advisers and their affiliates to continue to render services to the Funds under their respective contracts. |
| 28 Smith Barney Oregon Municipals Fund | 2004 Semi-Annual Report |
| SMITH BARNEY |
OREGON MUNICIPALS FUND |
TRUSTEES | INVESTMENT |
Dwight B. Crane | ADVISER |
Burt N. Dorsett | Smith Barney Fund |
R. Jay Gerken, CFA | Management LLC |
Chairman | |
Elliott S. Jaffe | |
| Stephen E. Kaufman | DISTRIBUTOR |
Joseph J. McCann | Citigroup Global Markets Inc. |
| Cornelius C. Rose, Jr. |
|
| |
| CUSTODIAN |
OFFICERS | State Street Bank and |
R. Jay Gerken, CFA | Trust Company |
President and Chief |
|
Executive Officer | |
TRANSFER AGENT | |
Andrew B. Shoup | Citicorp Trust Bank, fsb. |
Senior Vice President and | 125 Broad Street, 11th Floor |
Chief Administrative Officer | New York, New York 10004 |
James M. Giallanza | |
Chief Financial Officer | SUB-TRANSFER AGENT |
and Treasurer | PFPC Inc. |
P.O. Box 9699 | |
Peter M. Coffey | Providence, Rhode Island |
Vice President and | 02940-9699 |
Investment Officer | |
Andrew Beagley | |
Chief Anti-Money | |
Laundering Compliance | |
Officer and Chief | |
Compliance Officer | |
Kaprel Ozsolak | |
Controller | |
Robert I. Frenkel | |
Secretary and | |
Chief Legal Officer |
Smith Barney Oregon Municipals Funds The Fund files its complete schedule of portfolio holdings with Securities and Exchange Commission for the first and third quarters of each fiscal year on Form N-Q. The Fund’s Forms N-Q are available on the Commission’s website at www.sec.gov. The Fund’s Forms N-Q may be reviewed and copied at the Commission’s Public Reference Room in Washington, D.C., and information on the operation of the Public Reference Room may be obtained by calling 1-800-SEC-0330. To obtain information on Form N-Q from the Fund, shareholders can call 1-800-451-2010. Information on how the Fund voted proxies relating to portfolio securities during the 12-month period ended June 30, 2004 and a description of the policies and procedures that the Fund uses to determine how to vote proxies relating to portfolio securities is available (1) without charge, upon request, by calling 1-800-451-2010, (2) on the Fund’s website at www.citigroupAM.com and (3) on the SEC’s website at www.sec.gov. This report is submitted for general information of the shareholders of Smith Barney Oregon Municipals Fund, but it may also be used as sales literature when preceded or accompanied by the current Prospectus. SMITH BARNEY OREGON MUNICIPALS FUND This document must be preceded or accompanied by a free prospectus. Investors should consider the fund’s investment objectives, risks, charges and expenses carefully before investing. The prospectus contains this and other important information about the fund. Please read the prospectus carefully before you invest or send money. www.smithbarneymutualfunds.com |
| ©2004 Citigroup Global Markets Inc. | |
Member NASD, SIPC |
| FD0820 12/04 | 04-7552 | ||
| ITEM 2. | CODE OF ETHICS. |
| Not applicable. |
| ITEM 3. | AUDIT COMMITTEE FINANCIAL EXPERT. |
| Not applicable. |
| ITEM 4. | PRINCIPAL ACCOUNTANT FEES AND SERVICES. |
| Not applicable. |
| ITEM 5. | AUDIT COMMITTEE OF LISTED REGISTRANTS. |
| Not applicable. |
| ITEM 6. | [RESERVED] |
| ITEM 7. | DISCLOSURE OF PROXY VOTING POLICIES AND PROCEDURES FOR CLOSED-END MANAGEMENT INVESTMENT COMPANIES. |
| Not applicable. |
| ITEM 8. | [RESERVED] |
| ITEM 9. | CONTROLS AND PROCEDURES. |
| (a) | The registrant's principal executive officer and principal financial officer have concluded that the registrant's disclosure controls and procedures (as defined in Rule 30a- 3(c) under the Investment Company Act of 1940, as amended (the "1940 Act")) are effective as of a date within 90 days of the filing date of this report that includes the disclosure required by this paragraph, based on their evaluation of the disclosure controls and procedures required by Rule 30a-3(b) under the 1940 Act and 15d-15(b) under the Securities Exchange Act of 1934. |
| (b) | There were no changes in the registrant's internal control over financial reporting (as defined in Rule 30a-3(d) under the 1940 Act) that occurred during the registrant's last fiscal half-year (the registrant's second fiscal half-year in the case of an annual report) that have materially affected, or are likely to materially affect the registrant's internal control over financial reporting. |
| ITEM 10. | EXHIBITS. |
| (a) | Not applicable. |
| (b) | Attached hereto. |
| Exhibit 99.CERT | Certifications pursuant to section 302 of the Sarbanes-Oxley Act of 2002 | |
| Exhibit 99.906CERT | Certifications pursuant to Section 906 of the Sarbanes-Oxley Act of 2002 |
SIGNATURES
Pursuant to the requirements of the Securities Exchange Act of 1934 and the Investment Company Act of 1940, the registrant has duly caused this Report to be signed on its behalf by the undersigned, there unto duly authorized.
Smith Barney Oregon Municipals Fund
| By: | /s/ R. Jay Gerken R. Jay Gerken Chief Executive Officer of Smith Barney Oregon Municipals Fund |
| Date: | January 4, 2005 |
Pursuant to the requirements of the Securities Exchange Act of 1934 and the Investment Company Act of 1940, this report has been signed below by the following persons on behalf of the registrant and in the capacities and on the dates indicated.
| By: | /s/ R. Jay Gerken (R. Jay Gerken) Chief Executive Officer of Smith Barney Oregon Municipals Fund |
| Date: | January 4, 2005 |
| By: | /s/ James M. Giallanza Chief Financial Officer of Smith Barney Oregon Municipals Fund |
| Date: | January 4, 2005 |