irpresentation88
1
Investor Presentation Trading Symbol | HTLF www.htlf.com
Lynn B. Fuller Chairman, President and CEO John K. Schmidt Chief Operating Officer Chief Financial Officer
Safe Harbor
This presentation may contain, and future oral and written statements of the Company and its management may contain, forward-looking statements within the meaning of the Private Securities Litigation Reform Act of 1995 with respect to the financial condition, results of operations, plans, objectives, future performance and business of the Company. Forward-looking statements, which may be based upon beliefs, expectations and assumptions of the Company’s management and on information currently available to management, are generally identifiable by the use of words such as believe, expect, anticipate, plan, intend, estimate, may, will, would, could, should or similar expressions. Additionally, all statements in this release, including forward-looking statements, speak only as of the date they are made, and the Company undertakes no obligation to update any statement in light of new information or future events. A number of factors, many of which are beyond the ability of the Company to control or predict, could cause actual results to differ materially from those in its forward-looking statements. These factors include, among others, the following: (i) the strength of the local and national economy; (ii) the economic impact of past and any future terrorist threats and attacks and any acts of war or threats thereof, (iii) changes in state and federal laws, regulations and governmental policies concerning the Company’s general business; (iv) changes in interest rates and prepayment rates of the Company’s assets; (v) increased competition in the financial services sector and the inability to attract new customers; (vi) changes in technology and the ability to develop and maintain secure and reliable electronic systems; (vii) the loss of key executives or employees; (viii) changes in consumer spending; (ix) unexpected results of acquisitions; (x) unexpected outcomes of existing or new litigation involving the Company; and (xi) changes in accounting policies and practices. These risks and uncertainties should be considered in evaluating forward-looking statements and undue reliance should not be placed on such statements. Additional information concerning the Company and its business, including other factors that could materially affect the Company’s financial results, is included in the Company’s filings with the Securities and Exchange Commission.
2
Heartland By The Numbers
3
An Expanding Franchise Midwest to West
4
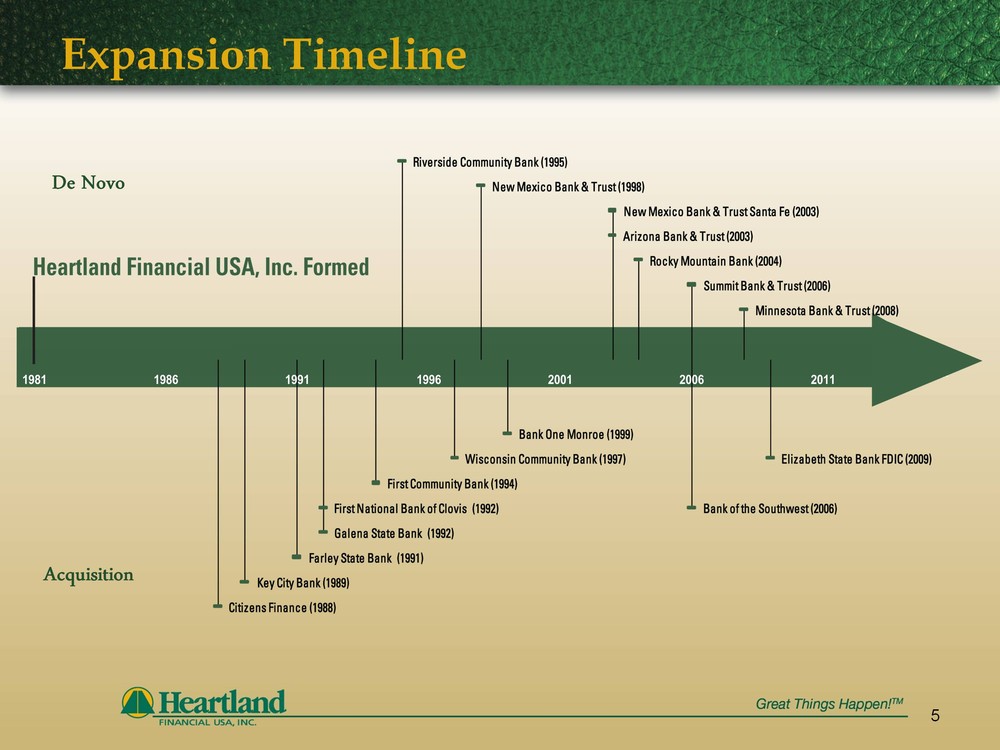
Expansion Timeline
5
De Novo
Acquisition
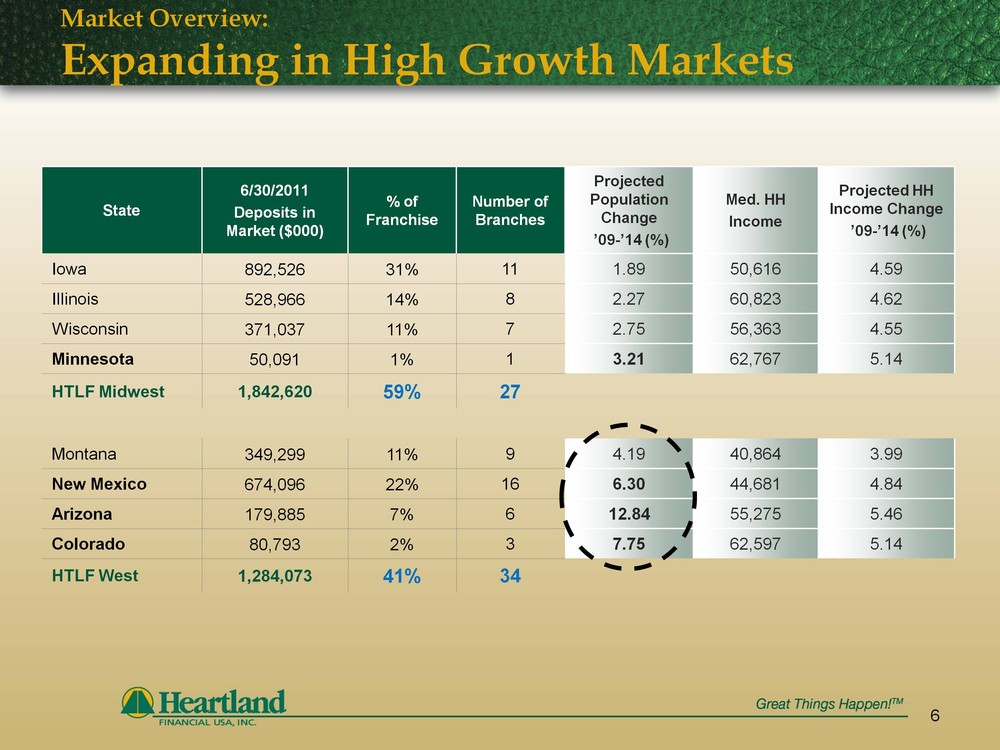
Market Overview: Expanding in High Growth Markets
6
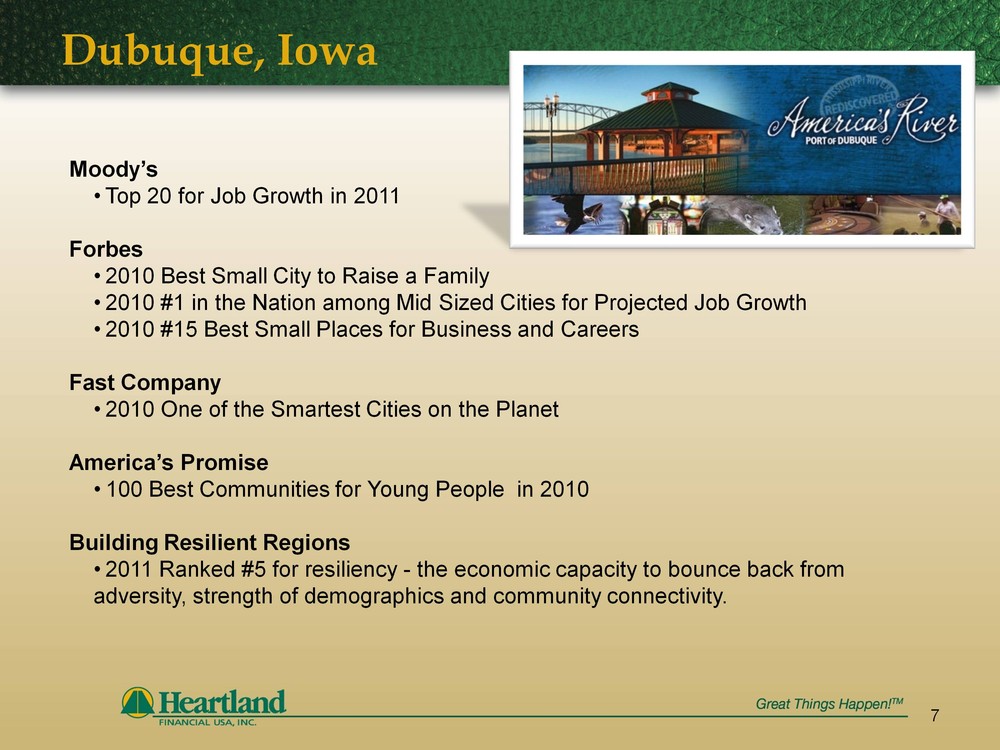
Dubuque, Iowa
Moody’s Top 20 for Job Growth in 2011 Forbes 2010 Best Small City to Raise a Family 2010 #1 in the Nation among Mid Sized Cities for Projected Job Growth 2010 #15 Best Small Places for Business and Careers Fast Company 2010 One of the Smartest Cities on the Planet America’s Promise 100 Best Communities for Young People in 2010 Building Resilient Regions 2011 Ranked #5 for resiliency - the economic capacity to bounce back from adversity, strength of demographics and community connectivity.
7
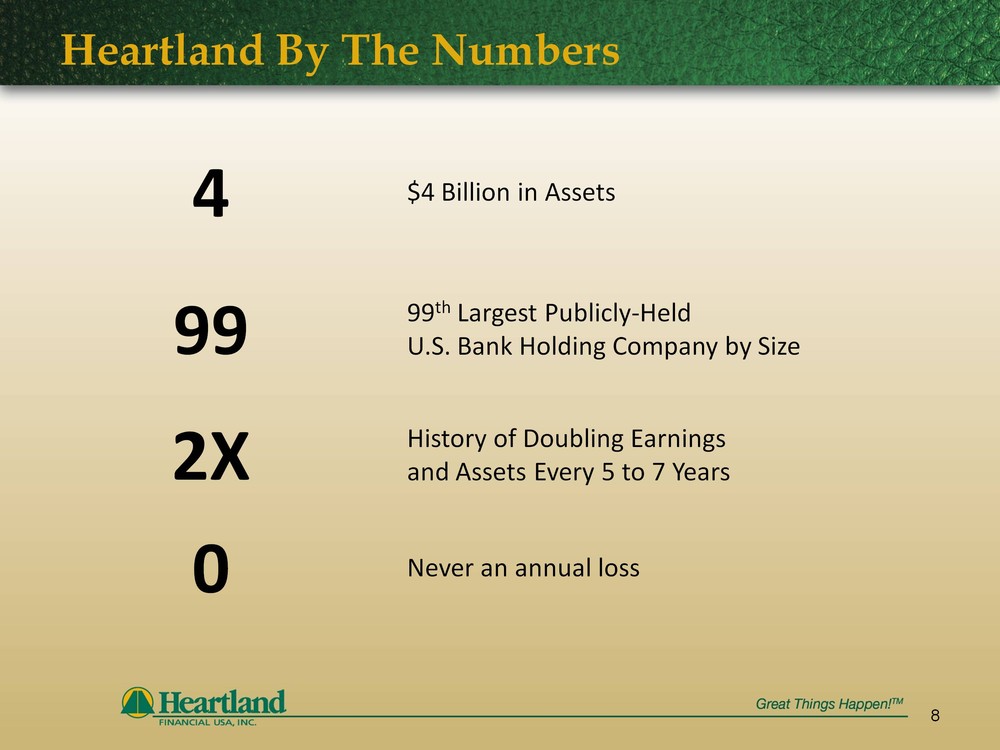
Heartland By The Numbers
8
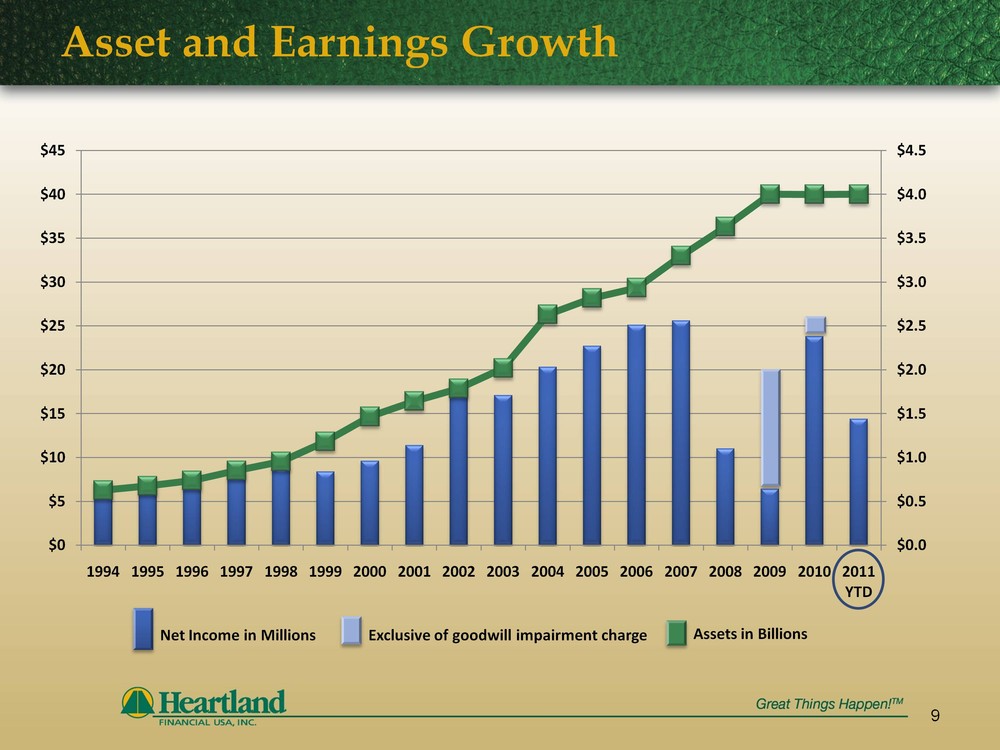
Asset and Earnings Growth
9
Heartland By The Numbers
10

History of Continuous Dividends
GOAL: 20%-30% Dividend Payout 1.5 %– 3.0% Dividend Yield
$0.28
$0.21
25% Change
$0.40
$0.40
As of December 31, 2010
30% Change
11
Company Snapshot 5 Primary Business Lines
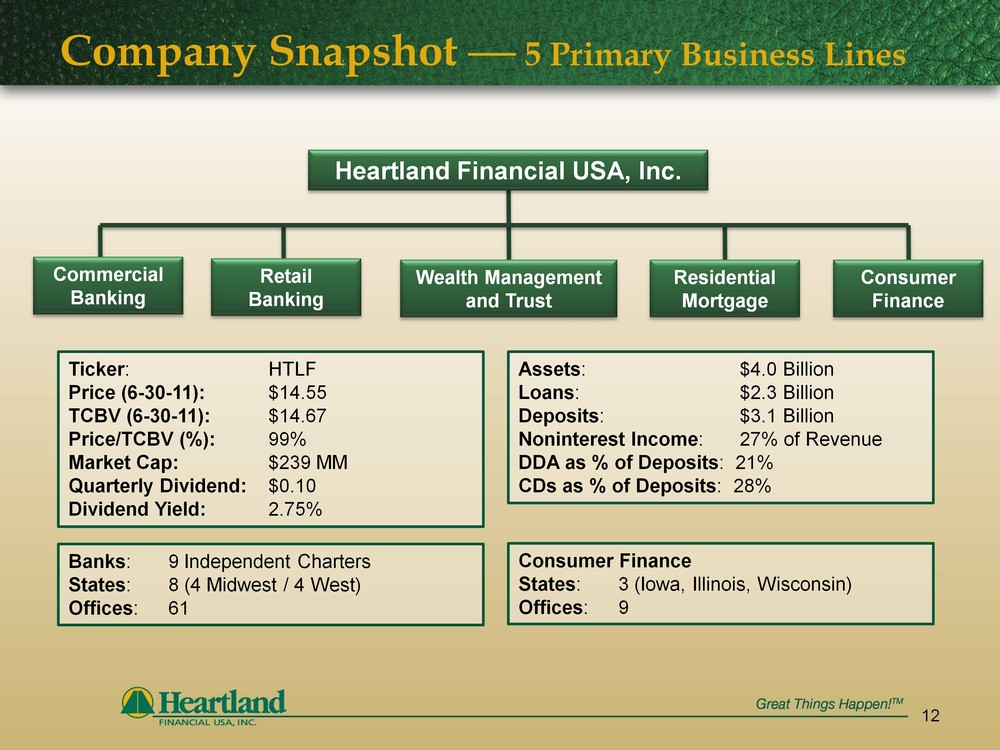
Heartland Financial USA, Inc.
Commercial Banking
Retail Banking
Wealth Management and Trust
Consumer Finance
Residential Mortgage
Ticker: HTLF Price (6-30-11): $14.55 TCBV (6-30-11): $14.67 Price/TCBV (%): 99% Market Cap: $239 MM Quarterly Dividend: $0.10 Dividend Yield: 2.75%
Assets: $4.0 Billion Loans: $2.3 Billion Deposits: $3.1 Billion Noninterest Income: 27% of Revenue DDA as % of Deposits: 21% CDs as % of Deposits: 28%
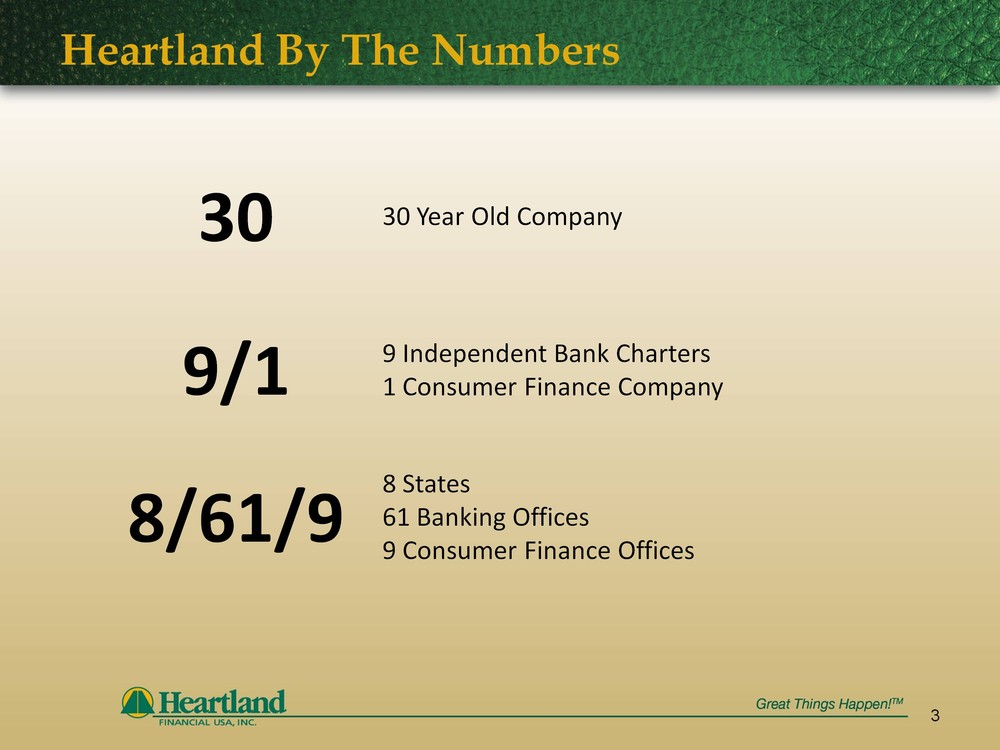
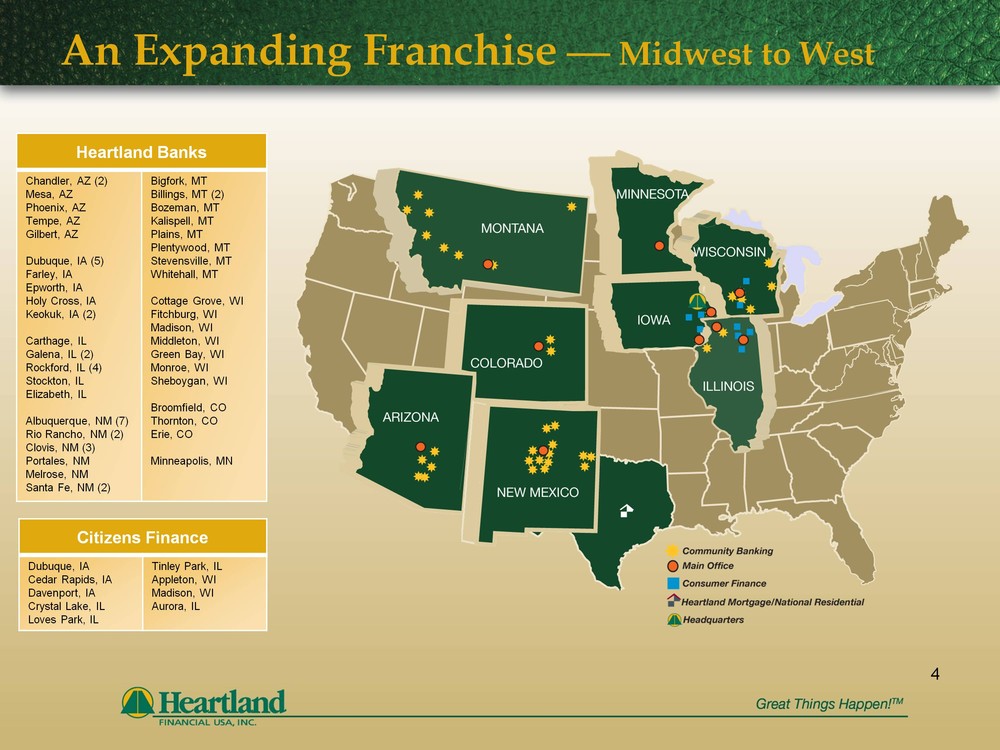
Banks: 9 Independent Charters States: 8 (4 Midwest / 4 West) Offices: 61
Consumer Finance States: 3 (Iowa, Illinois, Wisconsin) Offices: 9
12
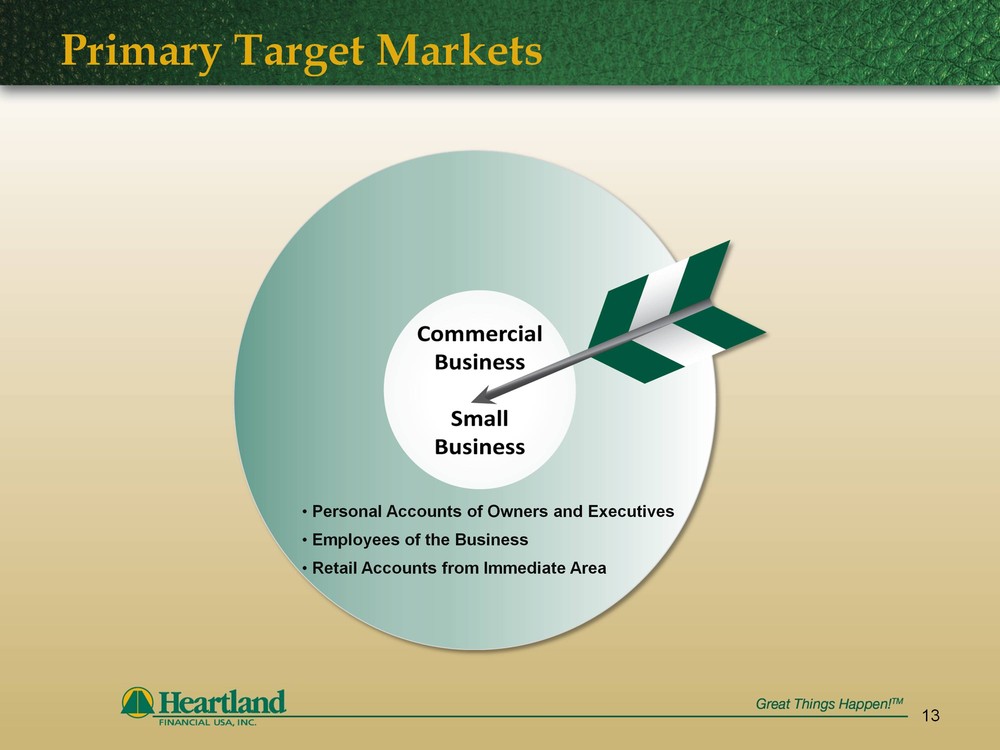
Primary Target Markets
Personal Accounts of Owners and Executives Employees of the Business Retail Accounts from Immediate Area
13

Three Core Pillars of Success
14
Highly Empowered, High-Touch Local Bank Delivery
Deeply rooted local leadership and boards Local decision-making Invested in local expertise Local brands and independent charters Commitment to exceptional experience, relationship building and value added delivery at competitive prices
Extensive Resources for Revenue Enhancement
Expanded commercial and retail products with focus on government guaranteed lending and treasury management Extensive “value menu” inclusive of wealth management, investment, insurance, leasing, mortgage and consumer financing Unique approach to consultative relationship building Highly trained and experienced staff
Customer--Transparent Backroom Cost Savings
Leading edge technology Efficient back-office support Leverage expertise across all banks gaining economies of scale Utilize best practices
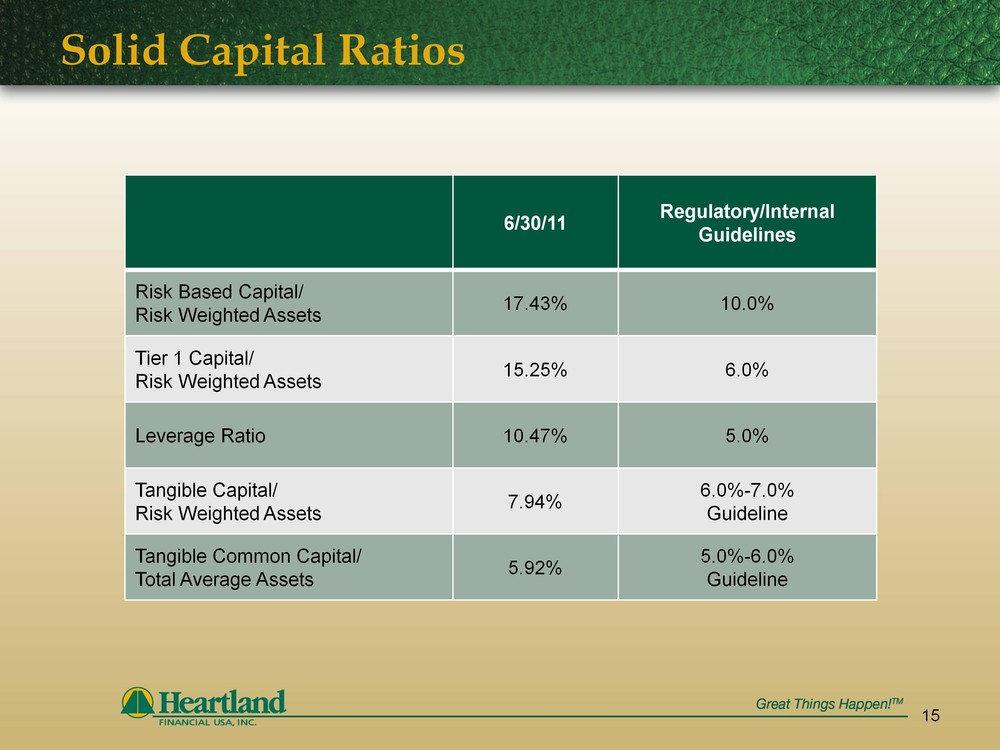
Solid Capital Ratios
15

Small Business Loan Fund
16
Application submitted Intend to pay off $81.7 million in TARP Vigorously pursuing loan growth Reduce the cost of non-common equity funding (TRUPS,TARP and other debt) currently fixed at 4.1% after tax
M & A
17
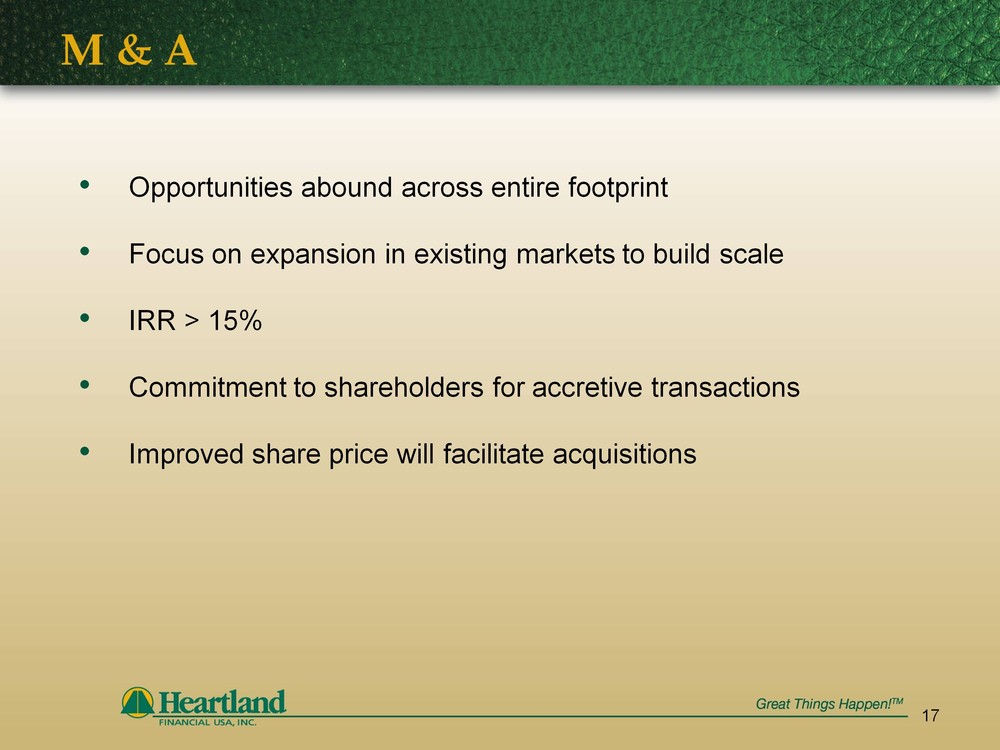
Opportunities abound across entire footprint Focus on expansion in existing markets to build scale IRR > 15% Commitment to shareholders for accretive transactions Improved share price will facilitate acquisitions
Investment Attributes
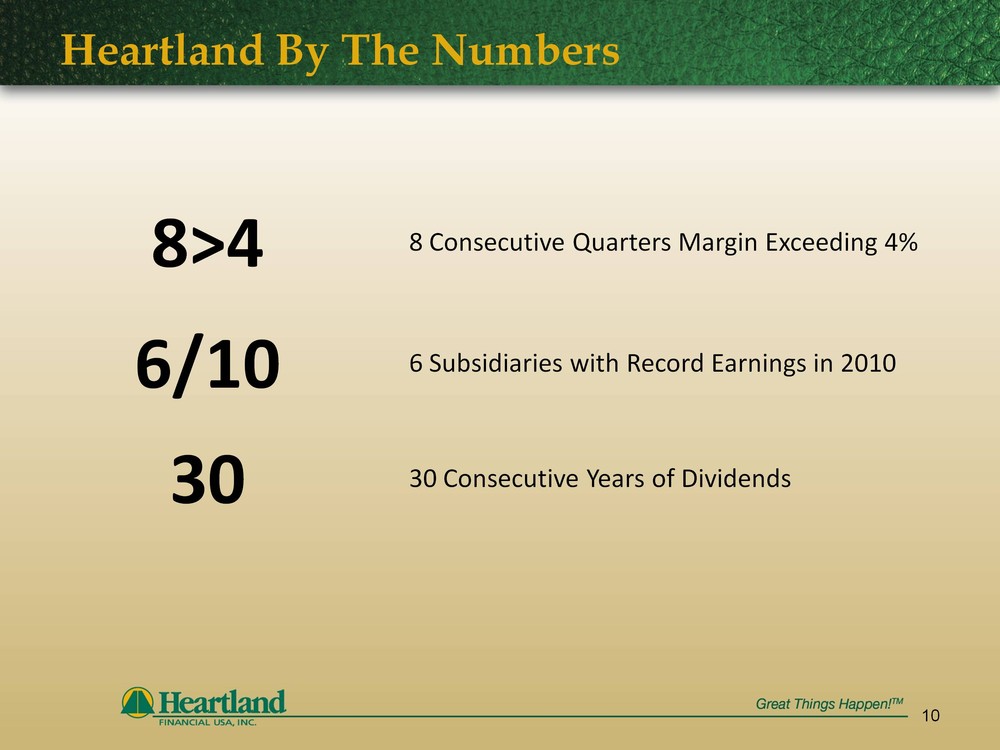
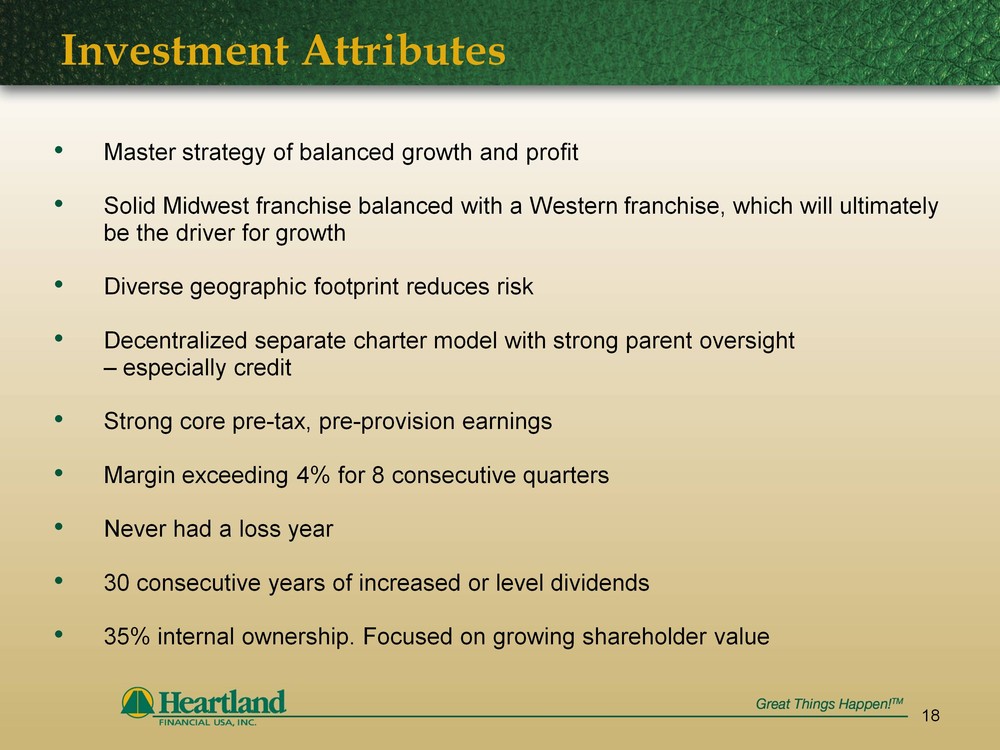
Master strategy of balanced growth and profit Solid Midwest franchise balanced with a Western franchise, which will ultimately be the driver for growth Diverse geographic footprint reduces risk Decentralized separate charter model with strong parent oversight – especially credit Strong core pre-tax, pre-provision earnings Margin exceeding 4% for 8 consecutive quarters Never had a loss year 30 consecutive years of increased or level dividends 35% internal ownership. Focused on growing shareholder value
18
Analyst Ratings
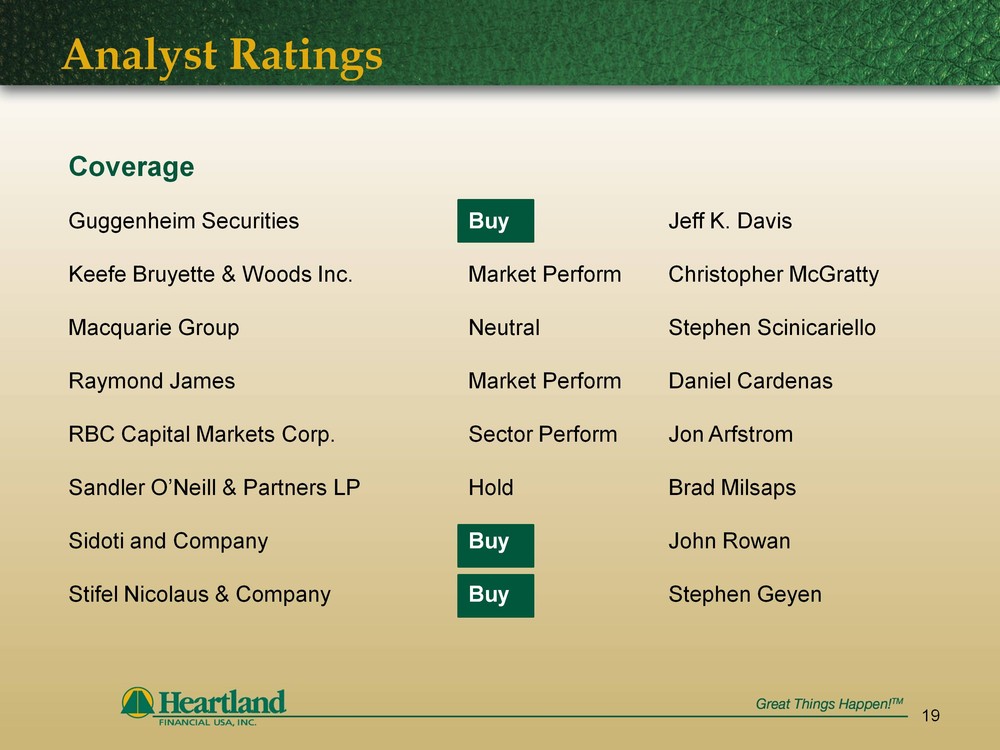
Coverage Guggenheim Securities Buy Jeff K. Davis Keefe Bruyette & Woods Inc. Market Perform Christopher McGratty Macquarie Group Neutral Stephen Scinicariello Raymond James Market Perform Daniel Cardenas RBC Capital Markets Corp. Sector Perform Jon Arfstrom Sandler O’Neill & Partners LP Hold Brad Milsaps Sidoti and Company Buy John Rowan Stifel Nicolaus & Company Buy Stephen Geyen
19
Media Ratings
20
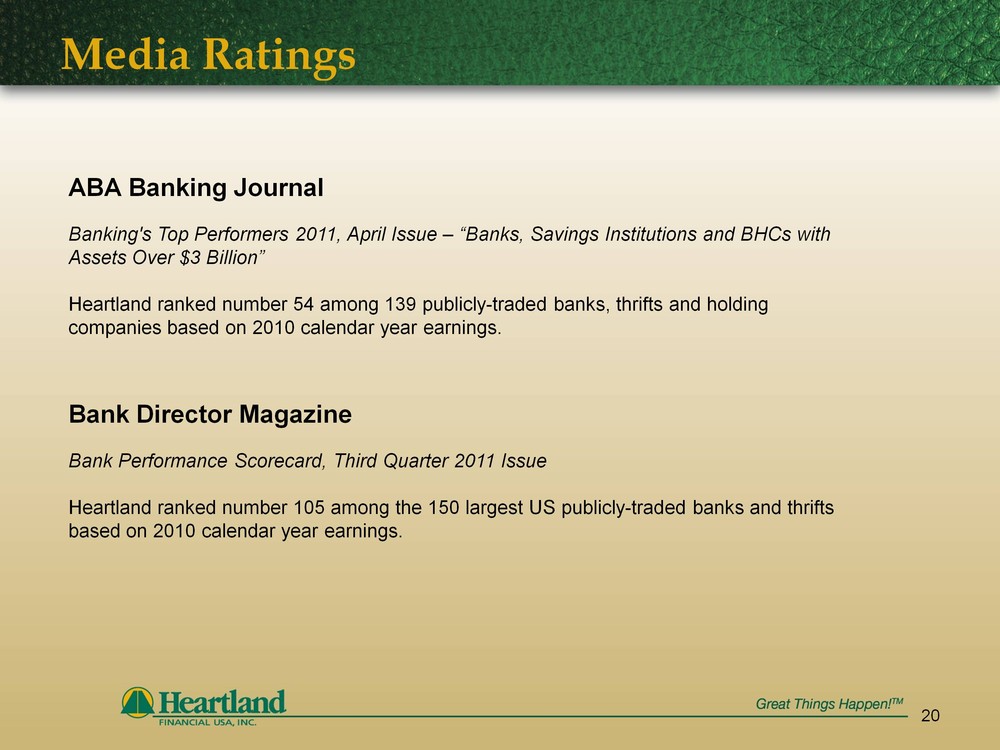
ABA Banking Journal Banking's Top Performers 2011, April Issue – “Banks, Savings Institutions and BHCs with Assets Over $3 Billion” Heartland ranked number 54 among 139 publicly-traded banks, thrifts and holding companies based on 2010 calendar year earnings. Bank Director Magazine Bank Performance Scorecard, Third Quarter 2011 Issue Heartland ranked number 105 among the 150 largest US publicly-traded banks and thrifts based on 2010 calendar year earnings.
21
Financial Highlights
Financial Performance
22
Loans Secured by Real Estate
23
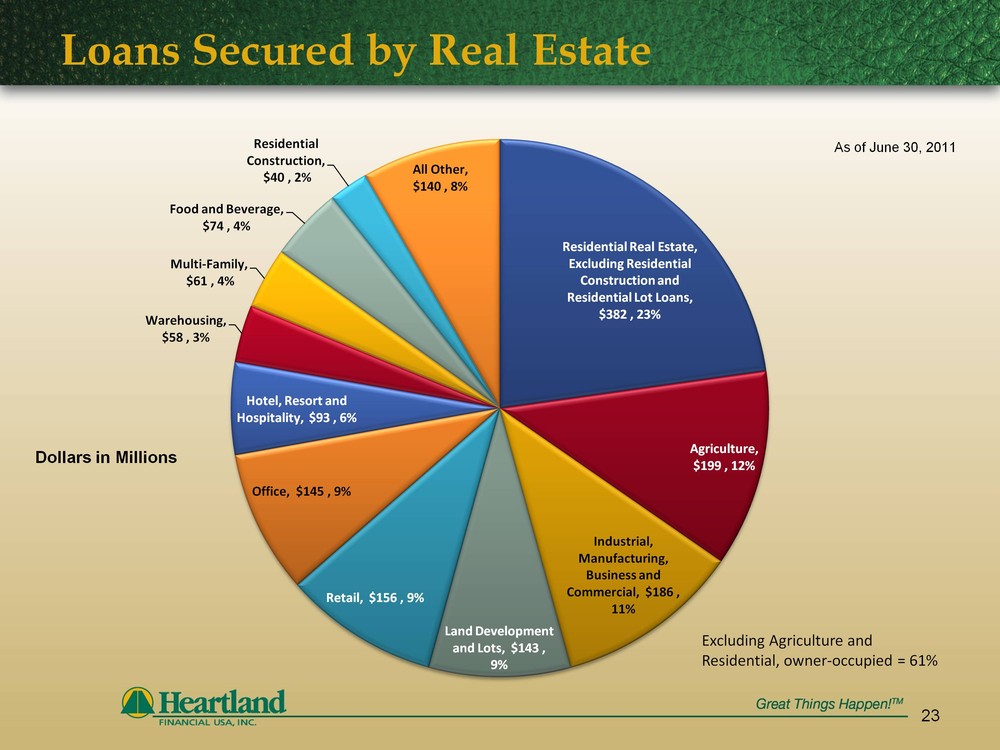
Dollars in Millions
As of June 30, 2011
Excluding Agriculture and Residential, owner-occupied = 61%
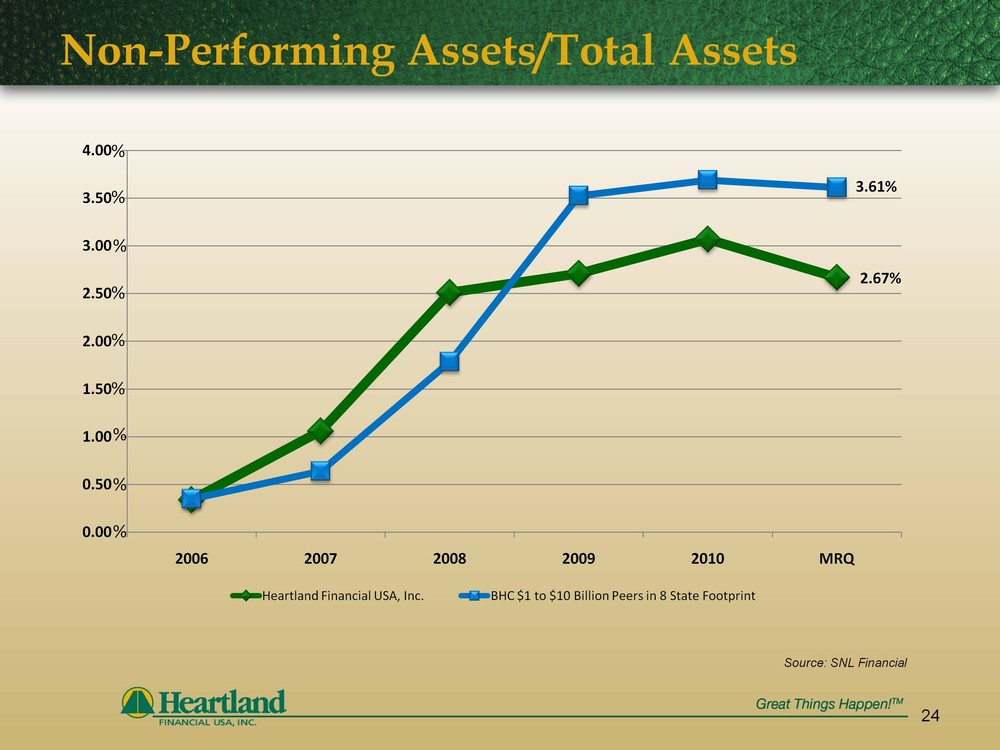
Non-Performing Assets/Total Assets
24
Source: SNL Financial
3.61%
2.67%
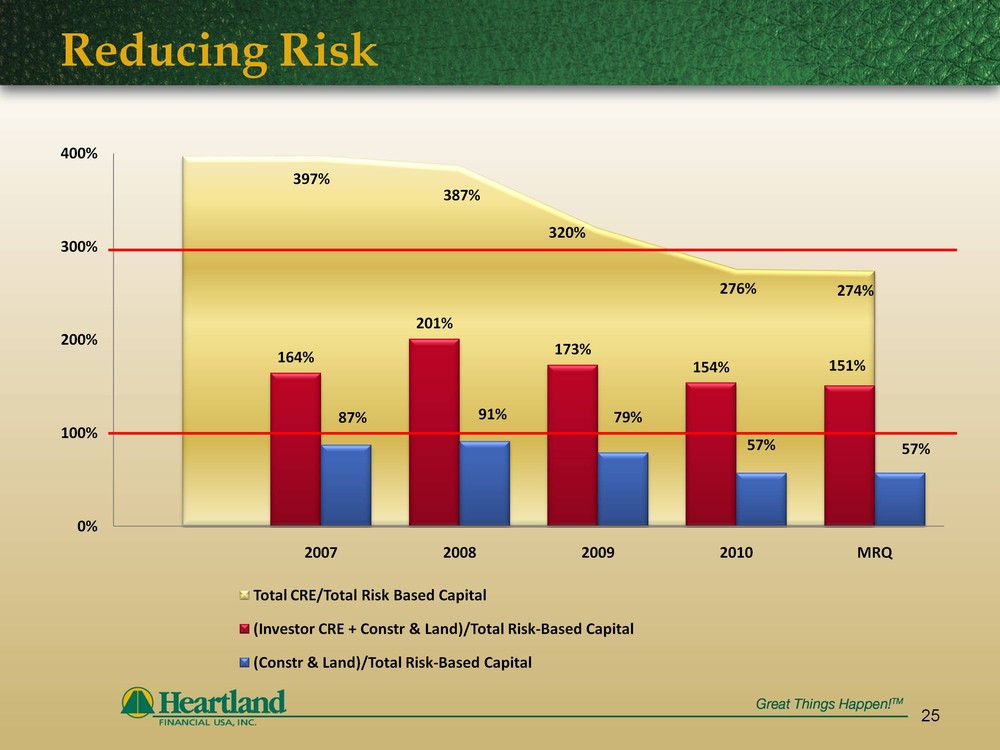
Reducing Risk
25
274%
151%
57%
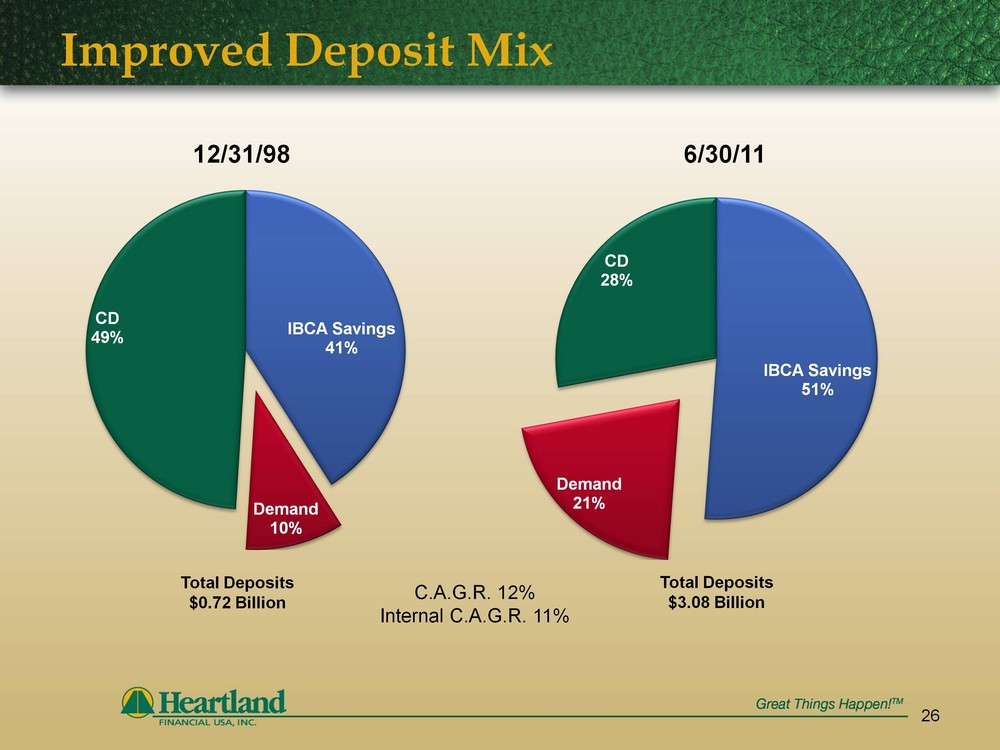
Improved Deposit Mix
Total Deposits $0.72 Billion
12/31/98
6/30/11
Total Deposits $3.08 Billion
C.A.G.R. 12% Internal C.A.G.R. 11%
26
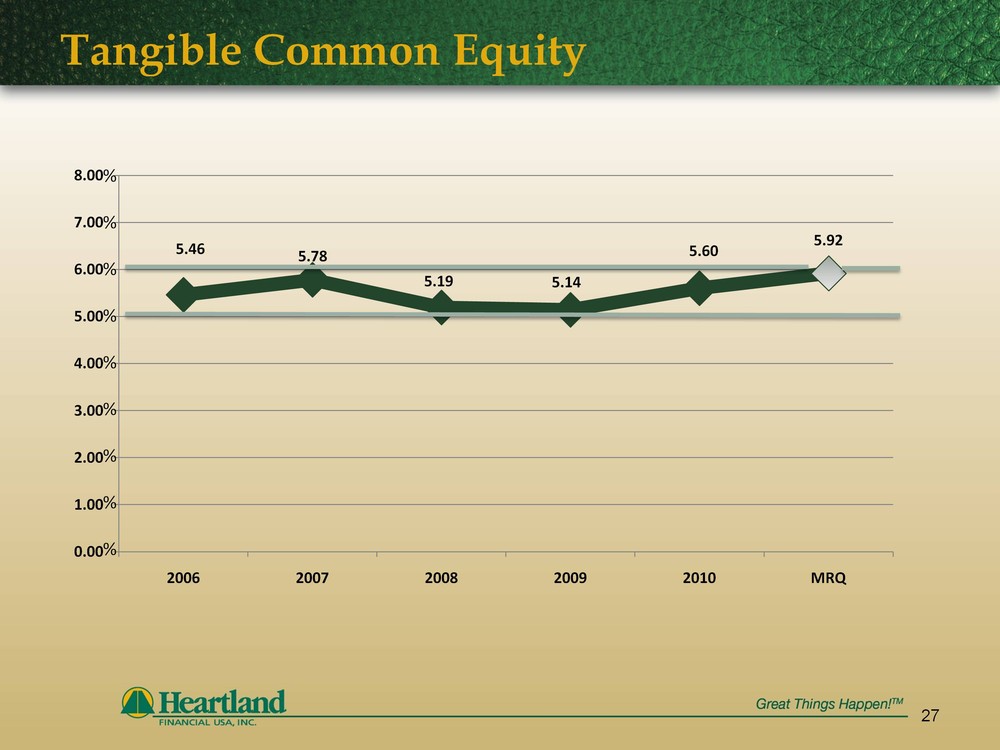
Tangible Common Equity
27
% % % % % % % % %
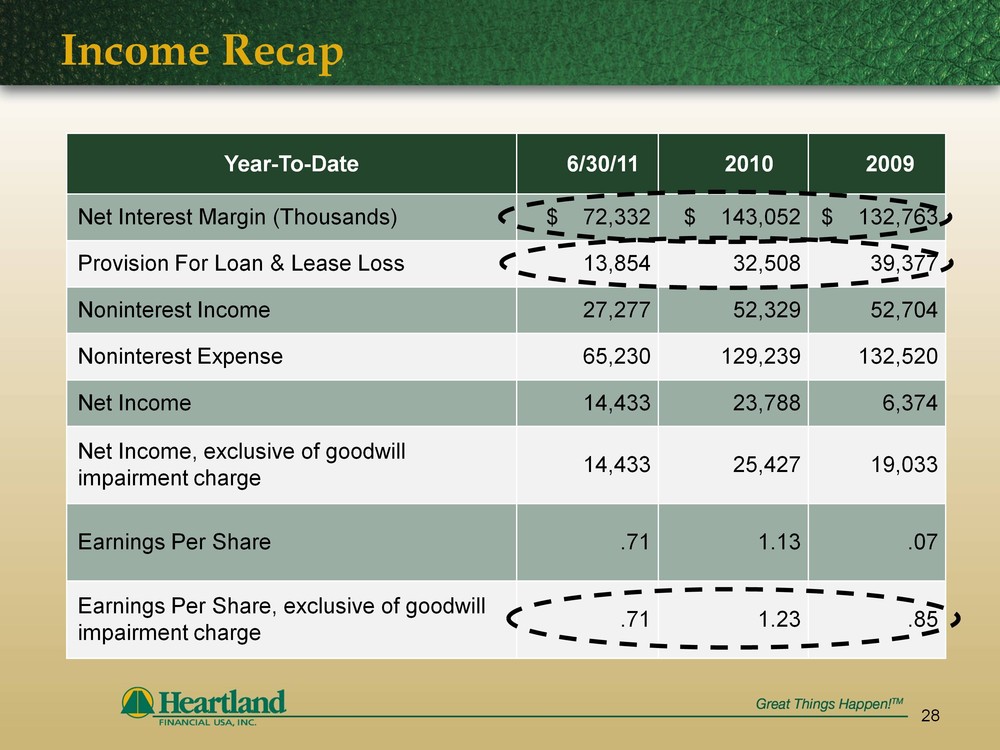
Income Recap
28

Net Interest Margin
29
Source: SNL Financial
4.23%
3.45%
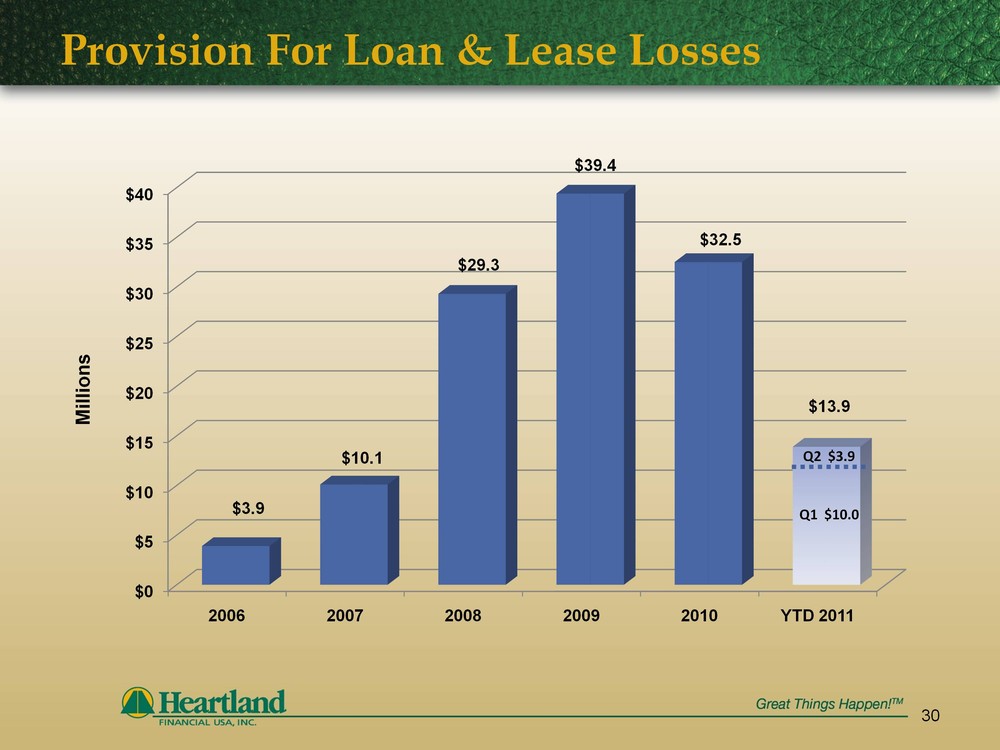
Provision For Loan & Lease Losses
30
Q1 $10.0
Q2 $3.9
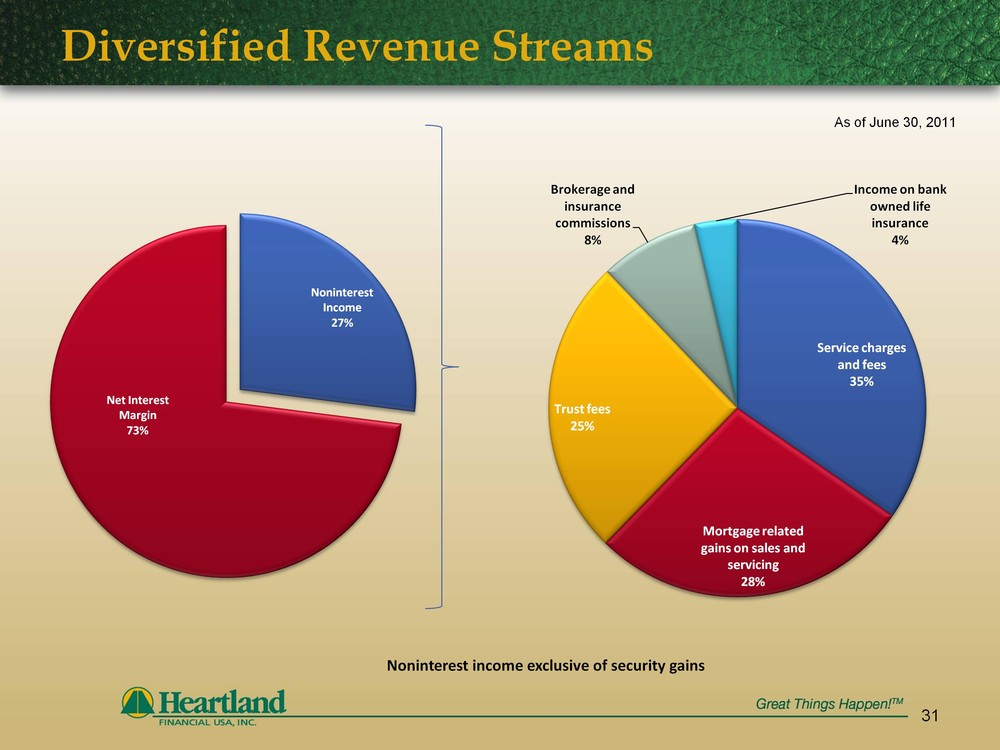
Diversified Revenue Streams
31
As of June 30, 2011
Noninterest income exclusive of security gains
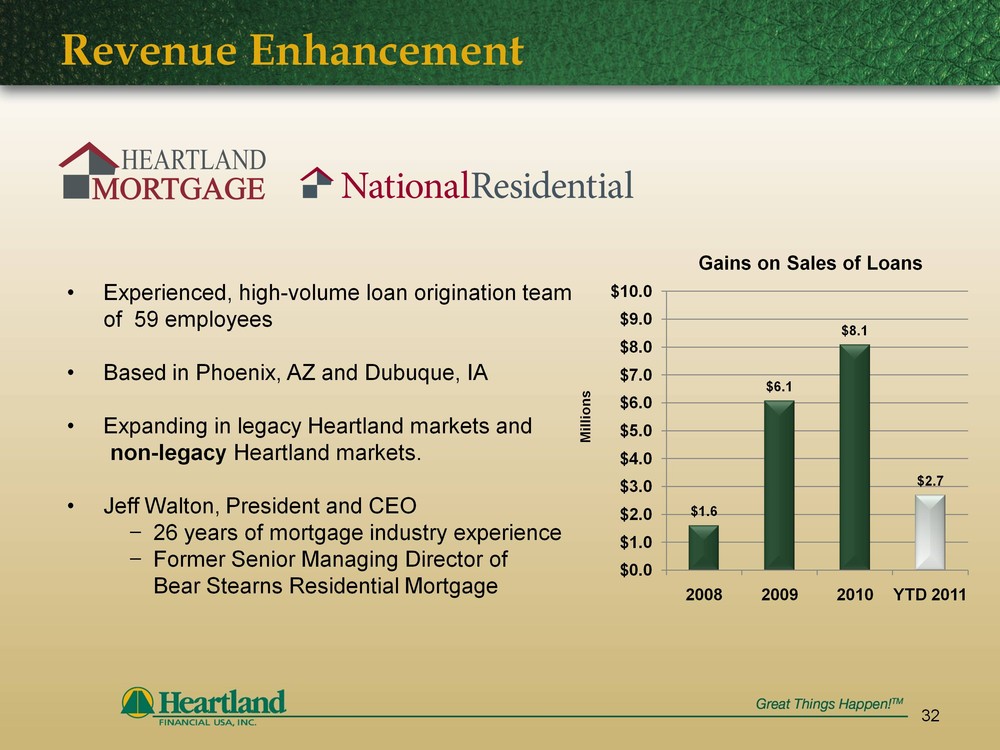
Revenue Enhancement
Experienced, high-volume loan origination team of 59 employees Based in Phoenix, AZ and Dubuque, IA Expanding in legacy Heartland markets and non-legacy Heartland markets. Jeff Walton, President and CEO 26 years of mortgage industry experience Former Senior Managing Director of Bear Stearns Residential Mortgage
32
Revenue Enhancement
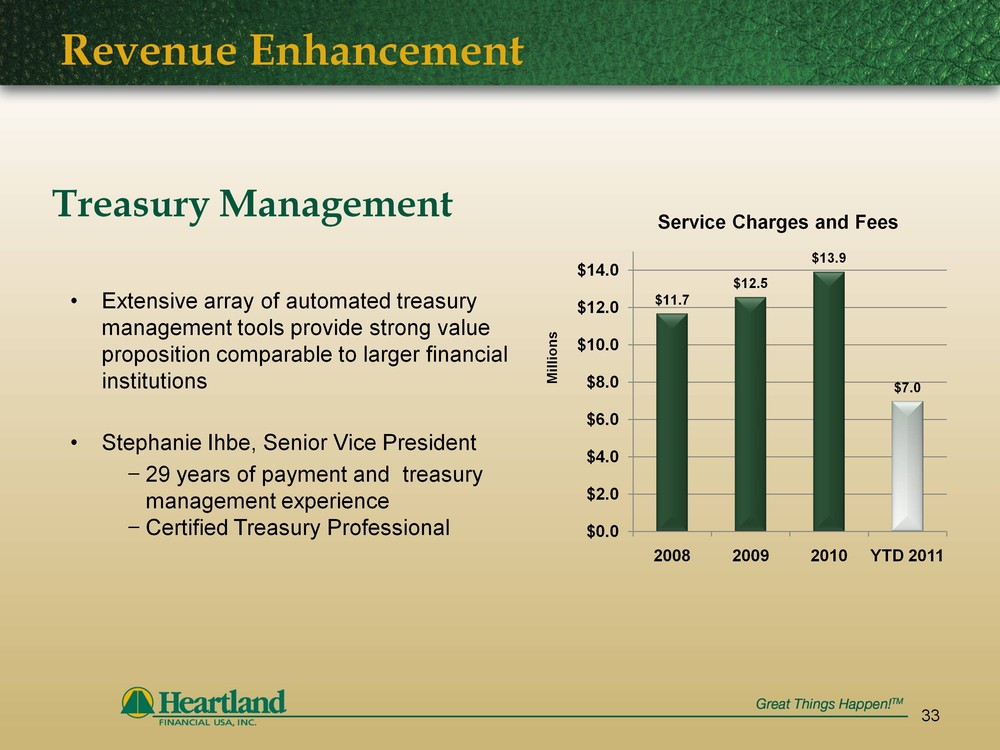
Treasury Management Extensive array of automated treasury management tools provide strong value proposition comparable to larger financial institutions Stephanie Ihbe, Senior Vice President 29 years of payment and treasury management experience Certified Treasury Professional
33
Revenue Enhancement
34
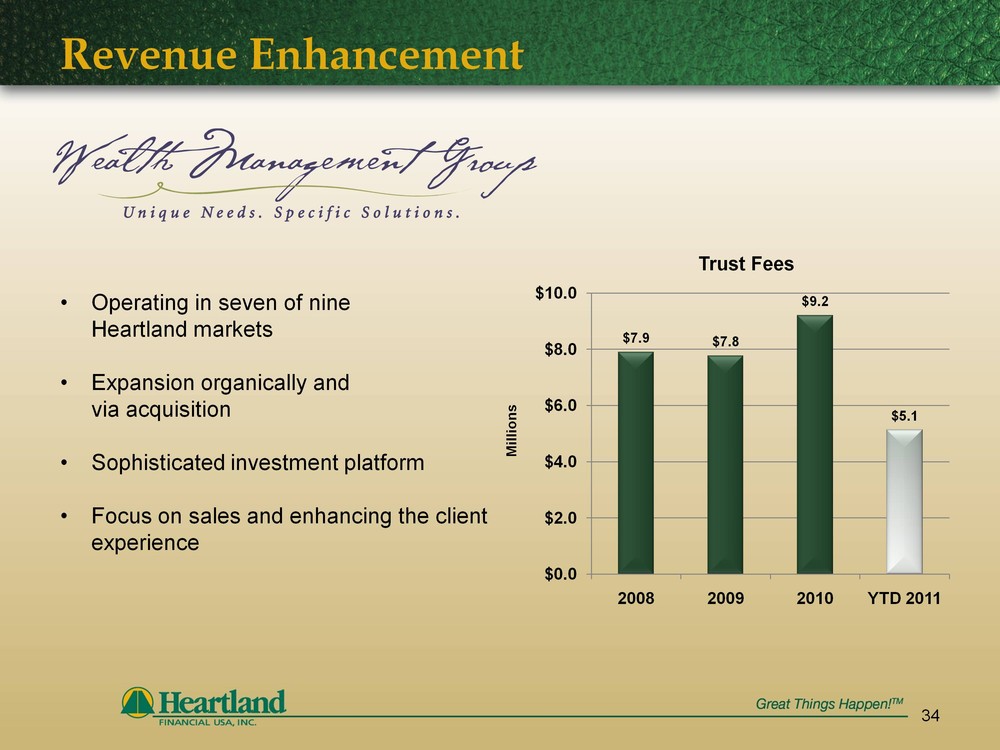
Operating in seven of nine Heartland markets Expansion organically and via acquisition Sophisticated investment platform Focus on sales and enhancing the client experience
Net Income
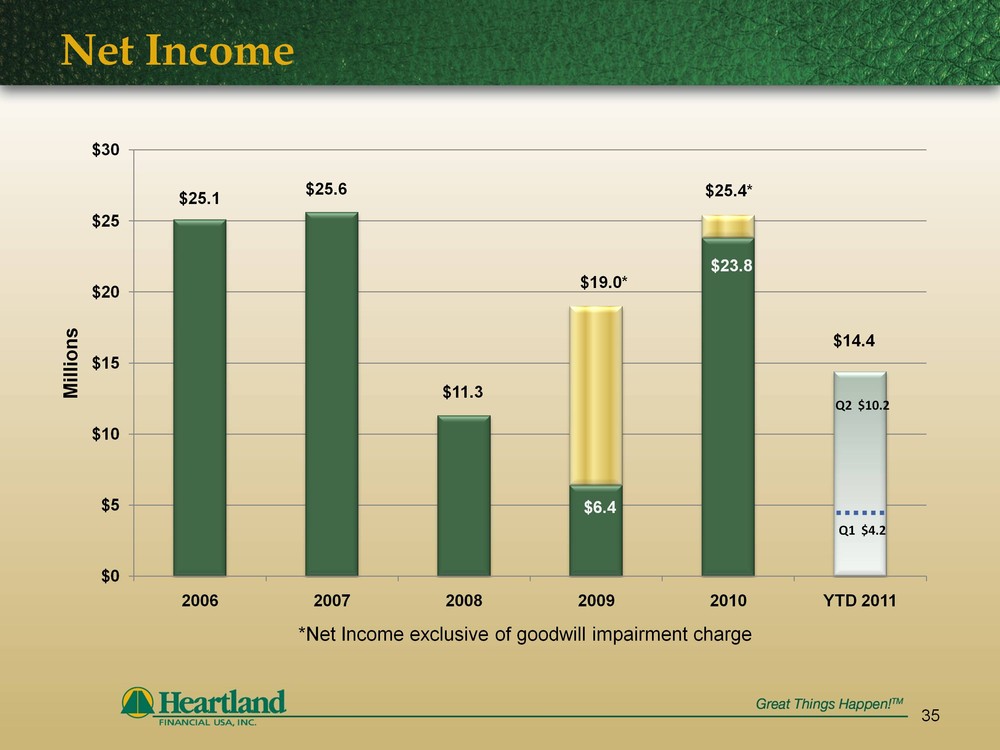
$23.8
$19.0*
$6.4
*Net Income exclusive of goodwill impairment charge
35
$25.4*
$14.4
Q1 $4.2
Q2 $10.2

Pre-Tax, Pre-Provision Earnings
Millions
36
Efficiency Ratio
37
Source: SNL Financial
% % % %
% % % %
%
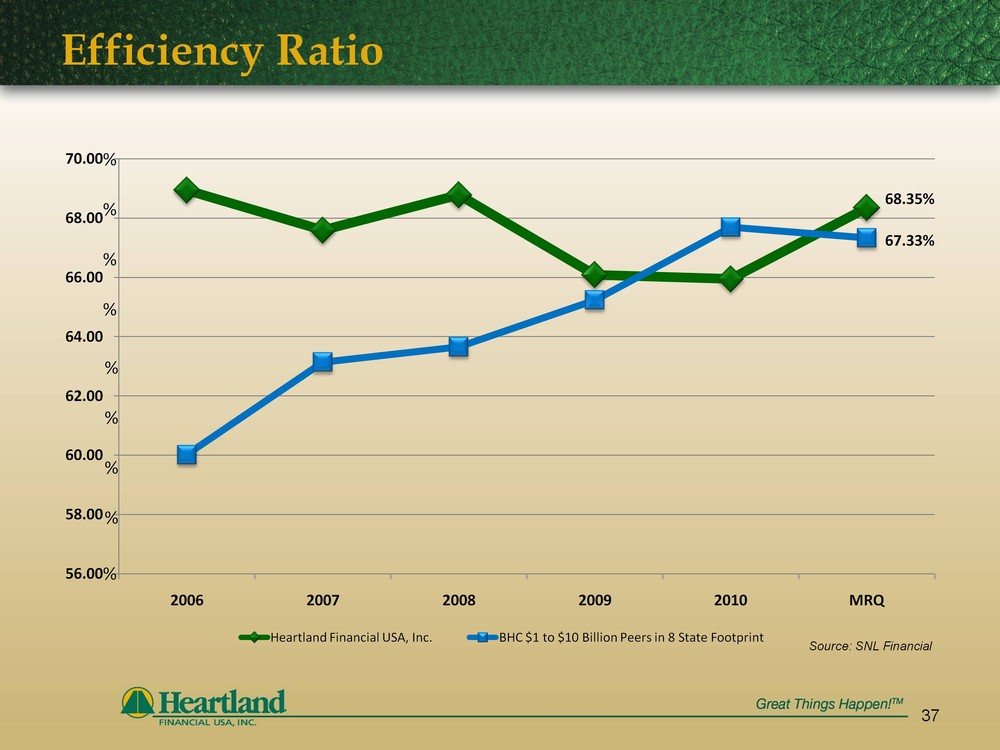
67.33%
68.35%
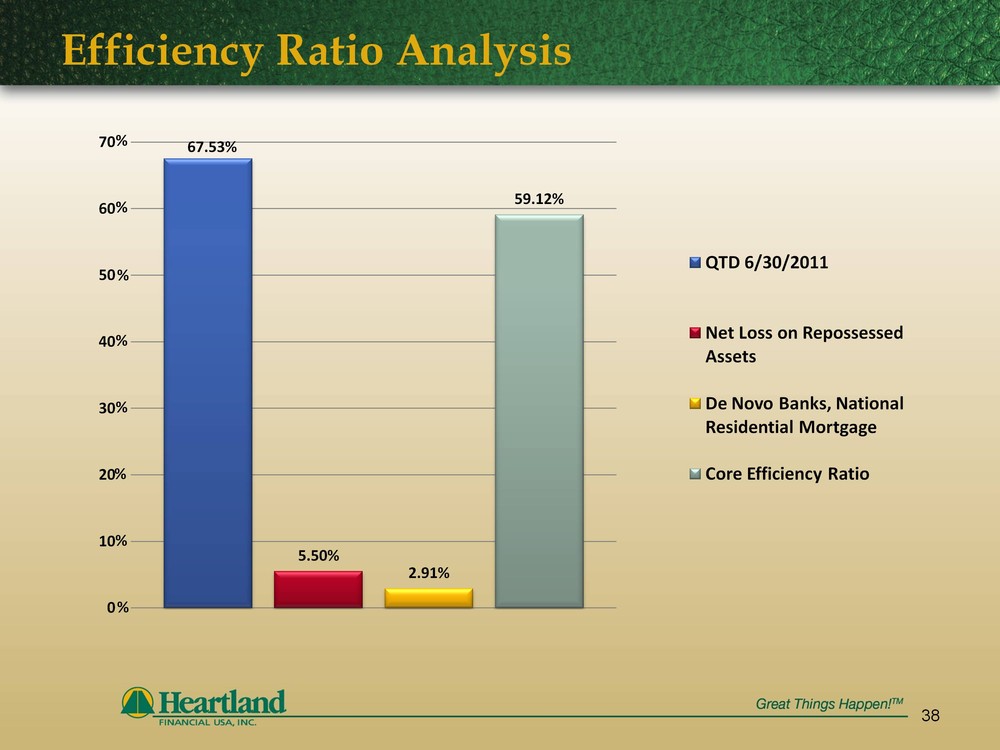
Efficiency Ratio Analysis
38
%
%
%
%
%
%
%
%
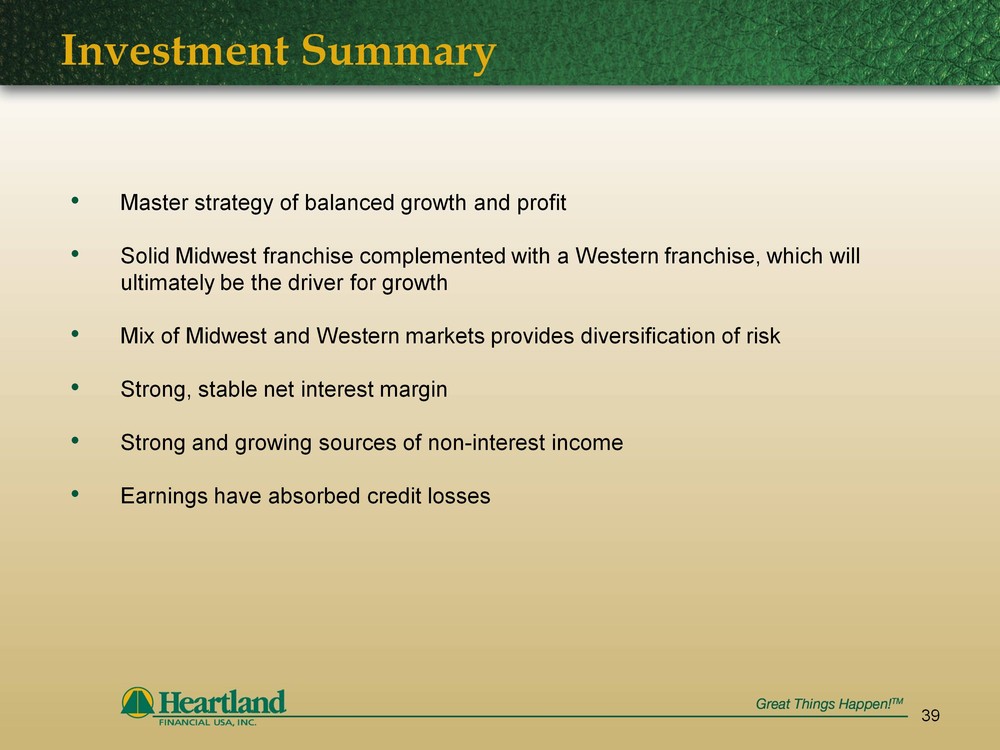
Investment Summary
Master strategy of balanced growth and profit Solid Midwest franchise complemented with a Western franchise, which will ultimately be the driver for growth Mix of Midwest and Western markets provides diversification of risk Strong, stable net interest margin Strong and growing sources of non-interest income Earnings have absorbed credit losses
39
40
1398 Central Avenue Dubuque, IA 52001 563.589.2100 Trading Symbol | HTLF www.htlf.com


