Acquisition of the Operations of Rockford Bank & Trust by Illinois Bank & Trust Creating a Premier Community Bank in Rockford August 13, 2019 Lynn B. Fuller Executive Operating Chairman Bruce K. Lee President and Chief Executive Officer HTLF | www.htlf.com
Safe Harbor This presentation contains forward-looking statements within the meaning of the Private Securities Litigation Reform Act of 1995. These forward-looking statements include, but are not limited to, statements about: (1) the benefits of the acquisition of the operations of Rockford Bank and Trust Company (“RB&T”), a wholly-owned Illinois banking subsidiary of QCR Holdings, Inc. (“QCRH”), by Illinois Bank & Trust (“IB&T”), a wholly-owned Illinois banking subsidiary of Heartland Financial USA, Inc. (“Heartland” or “HTLF”), including anticipated future results, cost savings and accretion to reported earnings that may be realized from the acquisition; (2) RB&T’s plans, objectives, expectations and intentions and other statements contained in this presentation that are not historical facts; and (3) other statements identified by words such as “expects”, “anticipates”, “intends”, “plans”, “believes”, “seeks”, “estimates” or works of similar meaning. Forward-looking statements involve risks and uncertainties that may cause actual results to differ materially from those in such statements. The following factors, among others, could cause actual results to differ materially from the anticipated results expressed in the forward-looking statements: the businesses of IB&T and RB&T may not be combined successfully, or such combination may take longer than expected; the cost savings from the acquisition may be less than expected; governmental approvals of the acquisition may not be obtained, or adverse regulatory conditions may be imposed in connection with governmental approvals of the acquisition or otherwise; credit and interest rate risks associated with IB&T’s and RB&T’s respective businesses may be greater than anticipated; and difficulties associated with achieving expected future financial results may occur. Additional factors that could cause actual results to differ materially from those expressed in the forward-looking statements are discussed in reports (such as the Annual Report on Form 10-K, Quarterly Reports on Form 10-Q and Current Reports on Form 8-K of Heartland) filed with the Securities and Exchange Commission (“SEC“) and available at the SEC’s Internet website (www.sec.gov). All subsequent written and oral forward-looking statements concerning the proposed acquisition and other matters relating to HTLF, IB&T, QCRH and RB&T or any person acting on their behalf are expressly qualified in their entirety by the cautionary statements above. Except as required by law, HTLF, IB&T, QCRH and RB&T do not undertake any obligation to update any forward-looking statement to reflect circumstances or events that occur after the date the forward-looking statement is made.
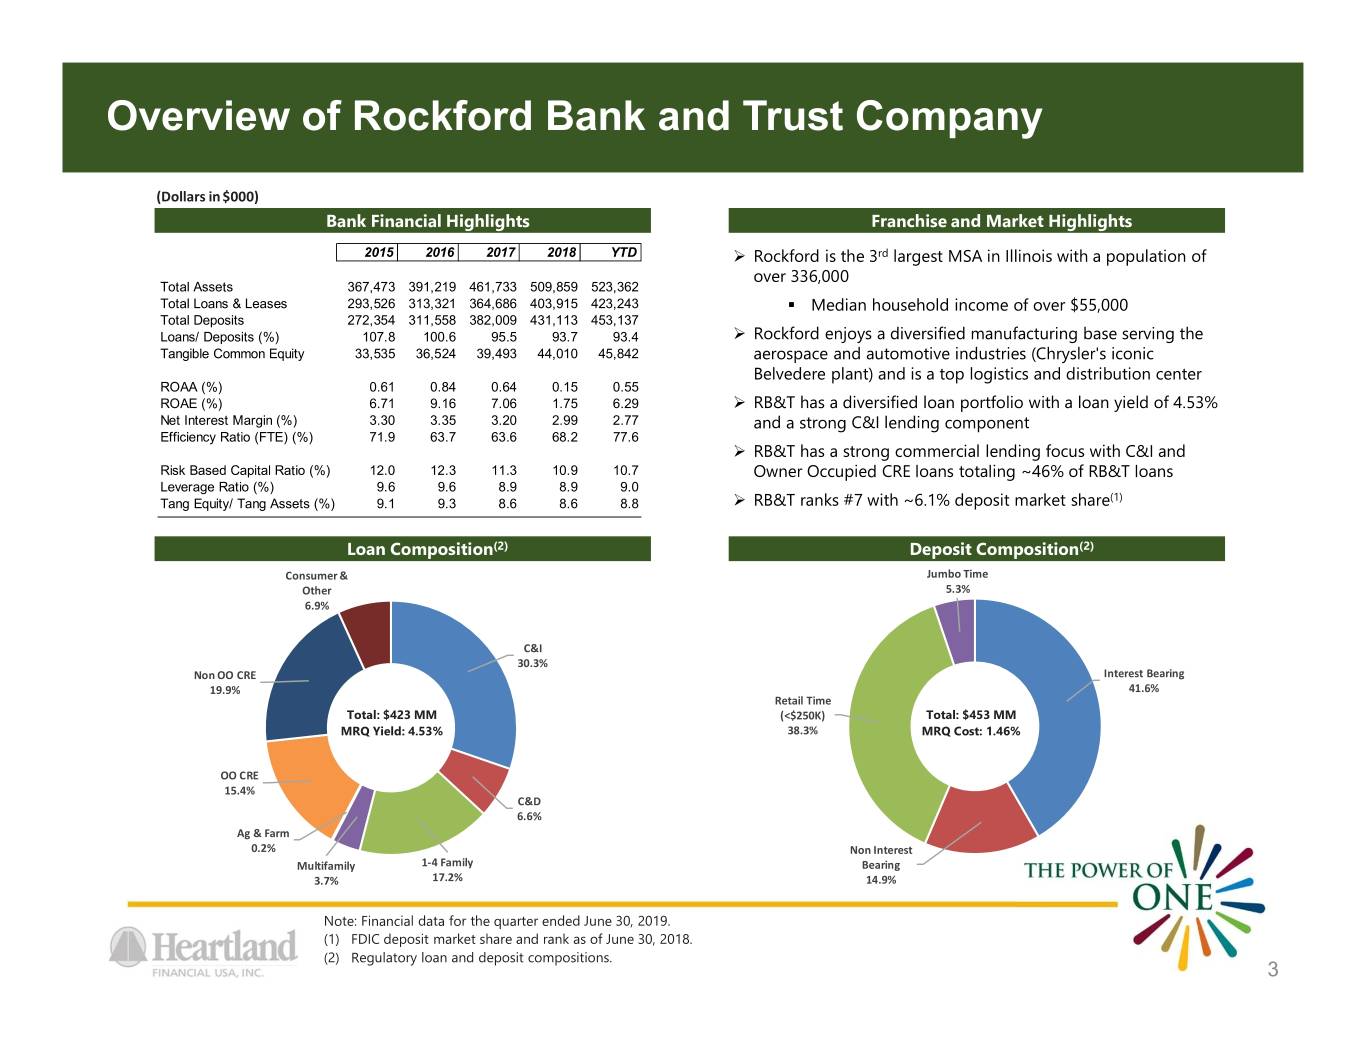
Overview of Rockford Bank and Trust Company (Dollars in $000) Bank Financial Highlights Franchise and Market Highlights 2015 2016 2017 2018 YTD Rockford is the 3rd largest MSA in Illinois with a population of over 336,000 Total Assets 367,473 391,219 461,733 509,859 523,362 Total Loans & Leases 293,526 313,321 364,686 403,915 423,243 . Median household income of over $55,000 Total Deposits 272,354 311,558 382,009 431,113 453,137 Loans/ Deposits (%) 107.8 100.6 95.5 93.7 93.4 Rockford enjoys a diversified manufacturing base serving the Tangible Common Equity 33,535 36,524 39,493 44,010 45,842 aerospace and automotive industries (Chrysler's iconic Belvedere plant) and is a top logistics and distribution center ROAA (%) 0.61 0.84 0.64 0.15 0.55 ROAE (%) 6.71 9.16 7.06 1.75 6.29 RB&T has a diversified loan portfolio with a loan yield of 4.53% Net Interest Margin (%) 3.30 3.35 3.20 2.99 2.77 and a strong C&I lending component Efficiency Ratio (FTE) (%) 71.9 63.7 63.6 68.2 77.6 RB&T has a strong commercial lending focus with C&I and Risk Based Capital Ratio (%) 12.0 12.3 11.3 10.9 10.7 Owner Occupied CRE loans totaling ~46% of RB&T loans Leverage Ratio (%) 9.6 9.6 8.9 8.9 9.0 Tang Equity/ Tang Assets (%) 9.1 9.3 8.6 8.6 8.8 RB&T ranks #7 with ~6.1% deposit market share(1) Loan Composition(2) Deposit Composition(2) Consumer & Jumbo Time Other 5.3% 6.9% C&I 30.3% Non OO CRE Interest Bearing 19.9% 41.6% Retail Time Total: $423 MM (<$250K) Total: $453 MM MRQ Yield: 4.53% 38.3% MRQ Cost: 1.46% OO CRE 15.4% C&D 6.6% Ag & Farm 0.2% Non Interest Multifamily 1-4 Family Bearing 3.7% 17.2% 14.9% Note: Financial data for the quarter ended June 30, 2019. (1) FDIC deposit market share and rank as of June 30, 2018. (2) Regulatory loan and deposit compositions. 3
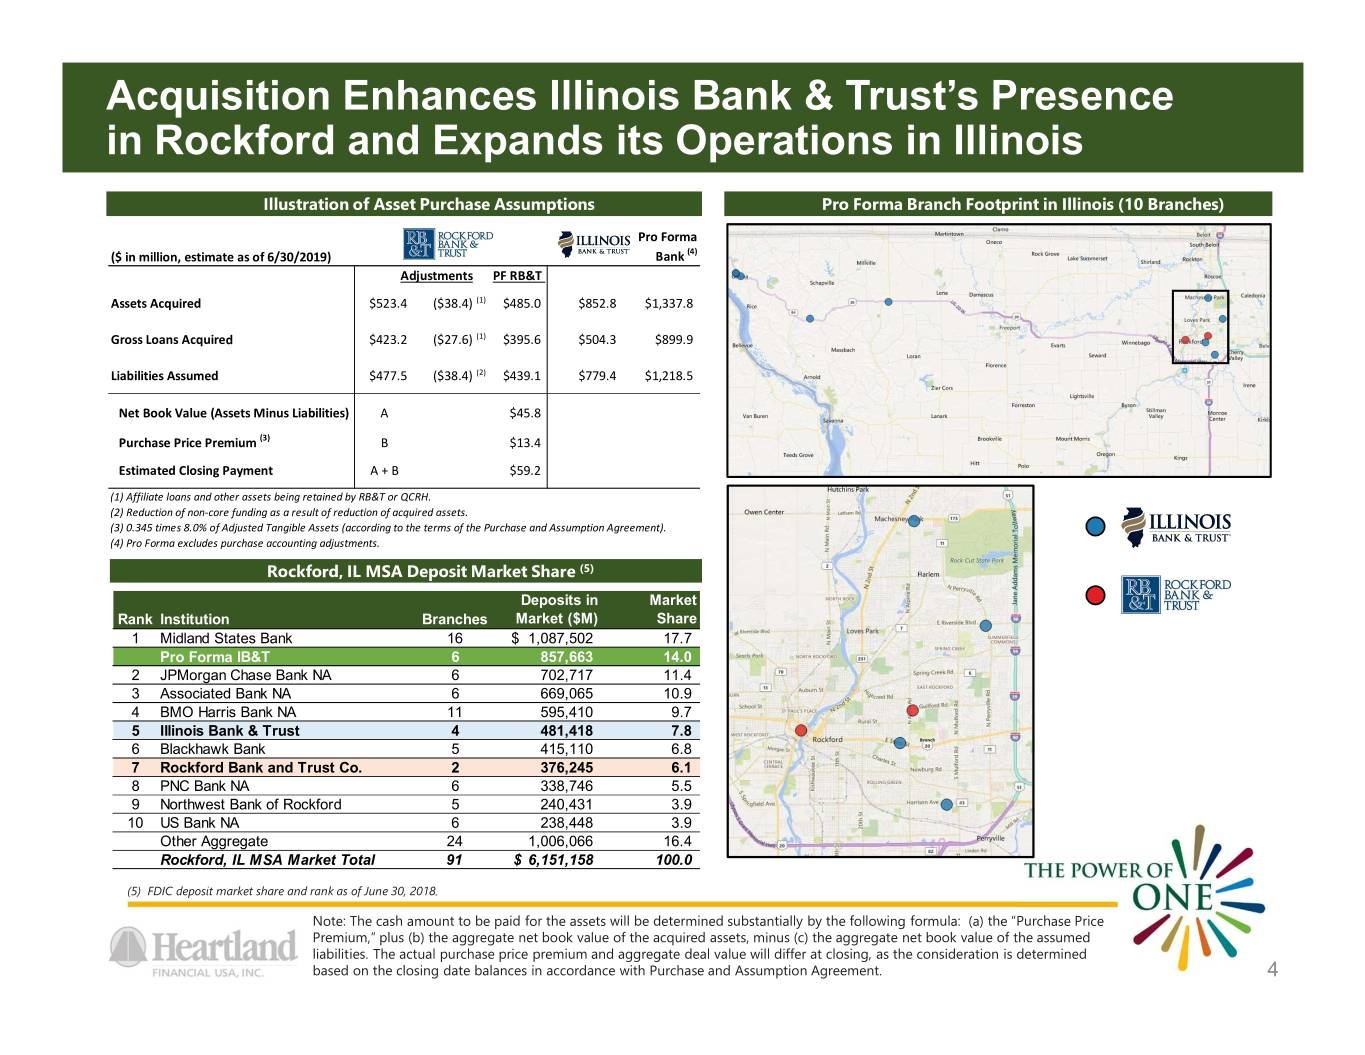
Acquisition Enhances Illinois Bank & Trust’s Presence in Rockford and Expands its Operations in Illinois Illustration of Asset Purchase Assumptions Pro Forma Branch Footprint in Illinois (10 Branches) Pro Forma ($ in million, estimate as of 6/30/2019) Bank (4) Adjustments PF RB&T Assets Acquired $523.4 ($38.4) (1) $485.0 $852.8 $1,337.8 Gross Loans Acquired $423.2 ($27.6) (1) $395.6 $504.3 $899.9 Liabilities Assumed $477.5 ($38.4) (2) $439.1 $779.4 $1,218.5 Net Book Value (Assets Minus Liabilities) A $45.8 Purchase Price Premium (3) B $13.4 Estimated Closing Payment A + B $59.2 (1) Affiliate loans and other assets being retained by RB&T or QCRH. (2) Reduction of non-core funding as a result of reduction of acquired assets. (3) 0.345 times 8.0% of Adjusted Tangible Assets (according to the terms of the Purchase and Assumption Agreement). (4) Pro Forma excludes purchase accounting adjustments. Rockford, IL MSA Deposit Market Share (5) Deposits in Market Rank Institution Branches Market ($M) Share 1 Midland States Bank 16$ 1,087,502 17.7 Pro Forma IB&T 6 857,663 14.0 2 JPMorgan Chase Bank NA 6 702,717 11.4 3 Associated Bank NA 6 669,065 10.9 4 BMO Harris Bank NA 11 595,410 9.7 5 Illinois Bank & Trust 4 481,418 7.8 6 Blackhawk Bank 5 415,110 6.8 7 Rockford Bank and Trust Co. 2 376,245 6.1 8 PNC Bank NA 6 338,746 5.5 9 Northwest Bank of Rockford 5 240,431 3.9 10 US Bank NA 6 238,448 3.9 Other Aggregate 24 1,006,066 16.4 Rockford, IL MSA Market Total 91$ 6,151,158 100.0 (5) FDIC deposit market share and rank as of June 30, 2018. Note: The cash amount to be paid for the assets will be determined substantially by the following formula: (a) the “Purchase Price Premium,” plus (b) the aggregate net book value of the acquired assets, minus (c) the aggregate net book value of the assumed liabilities. The actual purchase price premium and aggregate deal value will differ at closing, as the consideration is determined based on the closing date balances in accordance with Purchase and Assumption Agreement. 4
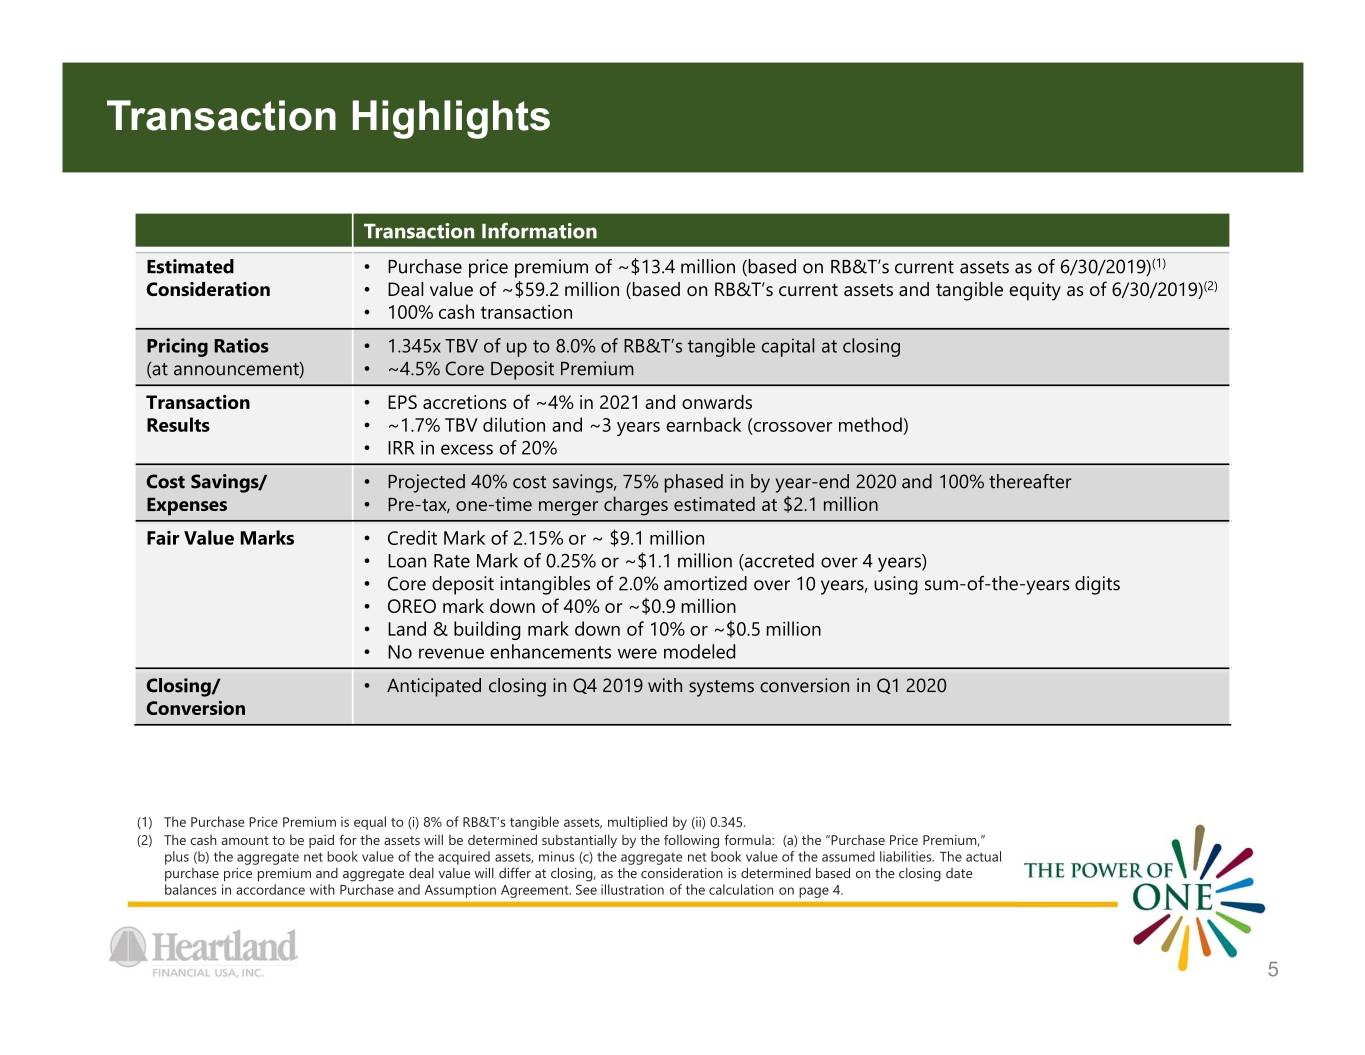
Transaction Highlights Transaction Information Estimated • Purchase price premium of ~$13.4 million (based on RB&T’s current assets as of 6/30/2019)(1) Consideration • Deal value of ~$59.2 million (based on RB&T’s current assets and tangible equity as of 6/30/2019)(2) • 100% cash transaction Pricing Ratios • 1.345x TBV of up to 8.0% of RB&T’s tangible capital at closing (at announcement) • ~4.5% Core Deposit Premium Transaction • EPS accretions of ~4% in 2021 and onwards Results • ~1.7% TBV dilution and ~3 years earnback (crossover method) • IRR in excess of 20% Cost Savings/ • Projected 40% cost savings, 75% phased in by year-end 2020 and 100% thereafter Expenses • Pre-tax, one-time merger charges estimated at $2.1 million Fair Value Marks • Credit Mark of 2.15% or ~ $9.1 million • Loan Rate Mark of 0.25% or ~$1.1 million (accreted over 4 years) • Core deposit intangibles of 2.0% amortized over 10 years, using sum-of-the-years digits • OREO mark down of 40% or ~$0.9 million • Land & building mark down of 10% or ~$0.5 million • No revenue enhancements were modeled Closing/ • Anticipated closing in Q4 2019 with systems conversion in Q1 2020 Conversion (1) The Purchase Price Premium is equal to (i) 8% of RB&T’s tangible assets, multiplied by (ii) 0.345. (2) The cash amount to be paid for the assets will be determined substantially by the following formula: (a) the “Purchase Price Premium,” plus (b) the aggregate net book value of the acquired assets, minus (c) the aggregate net book value of the assumed liabilities. The actual purchase price premium and aggregate deal value will differ at closing, as the consideration is determined based on the closing date balances in accordance with Purchase and Assumption Agreement. See illustration of the calculation on page 4. 5
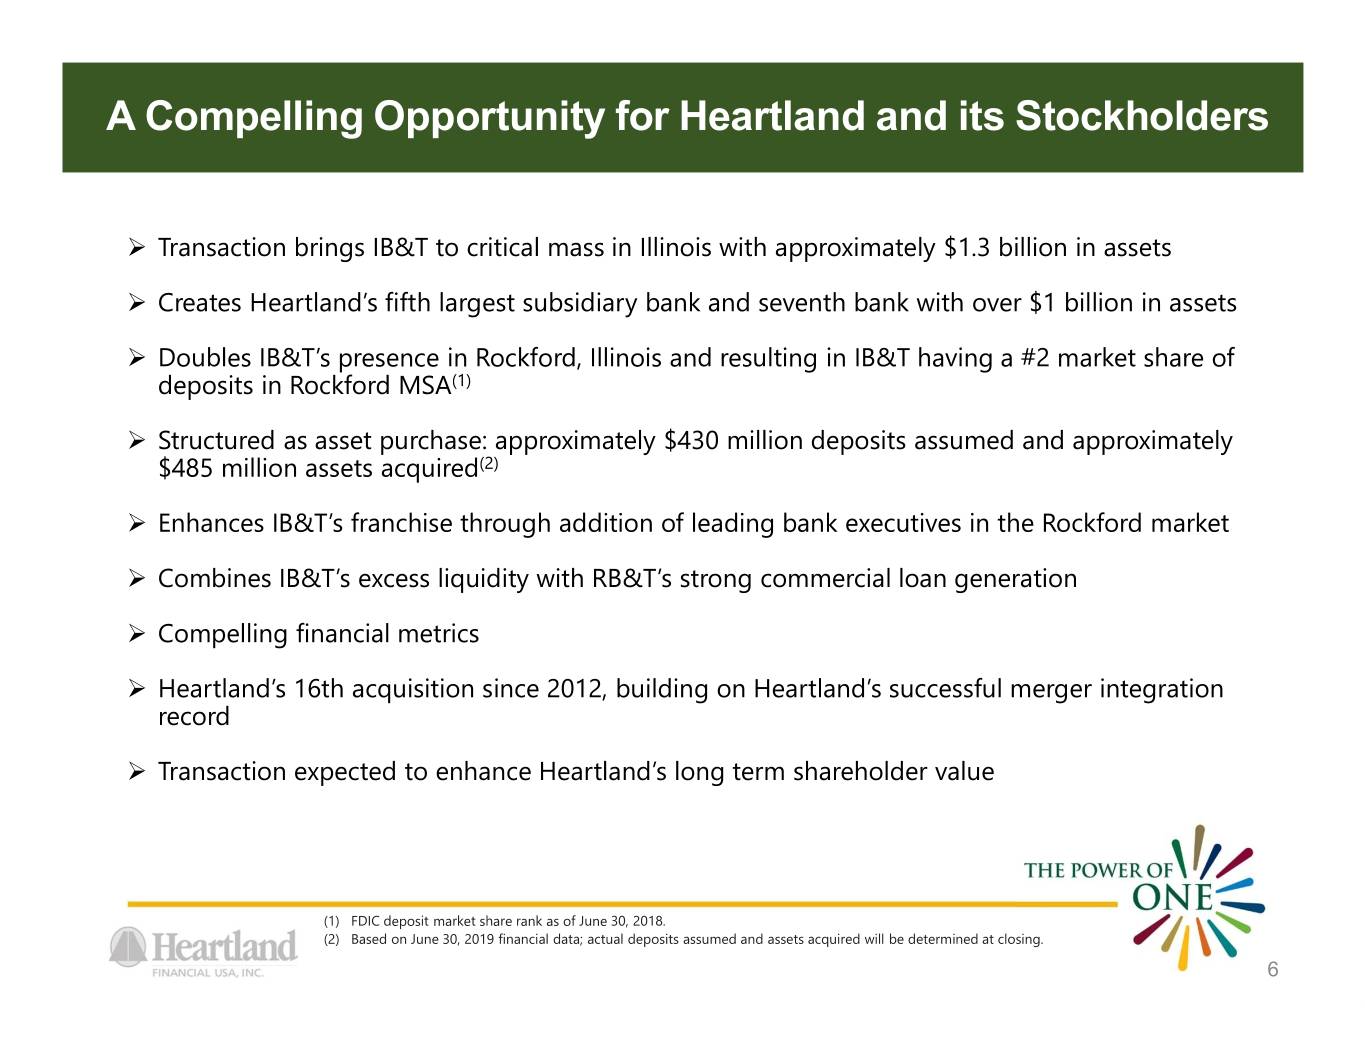
A Compelling Opportunity for Heartland and its Stockholders Transaction brings IB&T to critical mass in Illinois with approximately $1.3 billion in assets Creates Heartland’s fifth largest subsidiary bank and seventh bank with over $1 billion in assets Doubles IB&T’s presence in Rockford, Illinois and resulting in IB&T having a #2 market share of deposits in Rockford MSA(1) Structured as asset purchase: approximately $430 million deposits assumed and approximately $485 million assets acquired(2) Enhances IB&T’s franchise through addition of leading bank executives in the Rockford market Combines IB&T’s excess liquidity with RB&T’s strong commercial loan generation Compelling financial metrics Heartland’s 16th acquisition since 2012, building on Heartland’s successful merger integration record Transaction expected to enhance Heartland’s long term shareholder value (1) FDIC deposit market share rank as of June 30, 2018. (2) Based on June 30, 2019 financial data; actual deposits assumed and assets acquired will be determined at closing. 6


