Heartland Financial 1Q 2020 Performance
Safe Harbor This release, contains, and future oral and written statements of Heartland Financial USA, Inc. ("Heartland") and its management may contain, forward-looking statements within the meaning of such term in the Private Securities Litigation Reform Act of 1995, with respect to the business, financial condition, results of operations, plans, objectives and future performance of Heartland. Forward-looking statements, which may be based upon beliefs, expectations and assumptions of Heartland's management and on information currently available to management, are generally identifiable by the use of words such as "believe," "expect," "anticipate,“ "plan," "intend," "estimate," "may," "will," "would," "could," "should" or other similar expressions. Although Heartland has made these statements based on management's experience and best estimate of future events, there may be events or factors that management has not anticipated, and the accuracy and achievement of such forward-looking statements and estimates are subject to a number of risks, including those identified in our Annual Report on Form 10-K for the year ended December 31, 2019, as updated and supplemented in this Quarterly Report on Form 10-Q. Additionally, all statements in this document, including forward-looking statements, speak only as of the date they are made, and Heartland undertakes no obligation to update any statement in light of new information or future events. The COVID-19 pandemic is adversely affecting Heartland and its customers, counterparties, employees and third-party service providers. The pandemic’s severity, its duration and the extent of its impact on Heartland’s business, financial condition, results of operations, liquidity and prospects remain uncertain. The deterioration in general business and economic conditions and turbulence in domestic or global financial markets caused by the COVID-19 pandemic have negatively affected Heartland’s net income, total equity and book value per common share, and continued economic deterioration could adversely affect the value of its assets and liabilities, reduce the availability of funding to Heartland, lead to a tightening of credit and increase stock price volatility. Some economists and investment banks believe that a recession or depression may result from the continued spread of COVID-19 and the economic consequences. 2
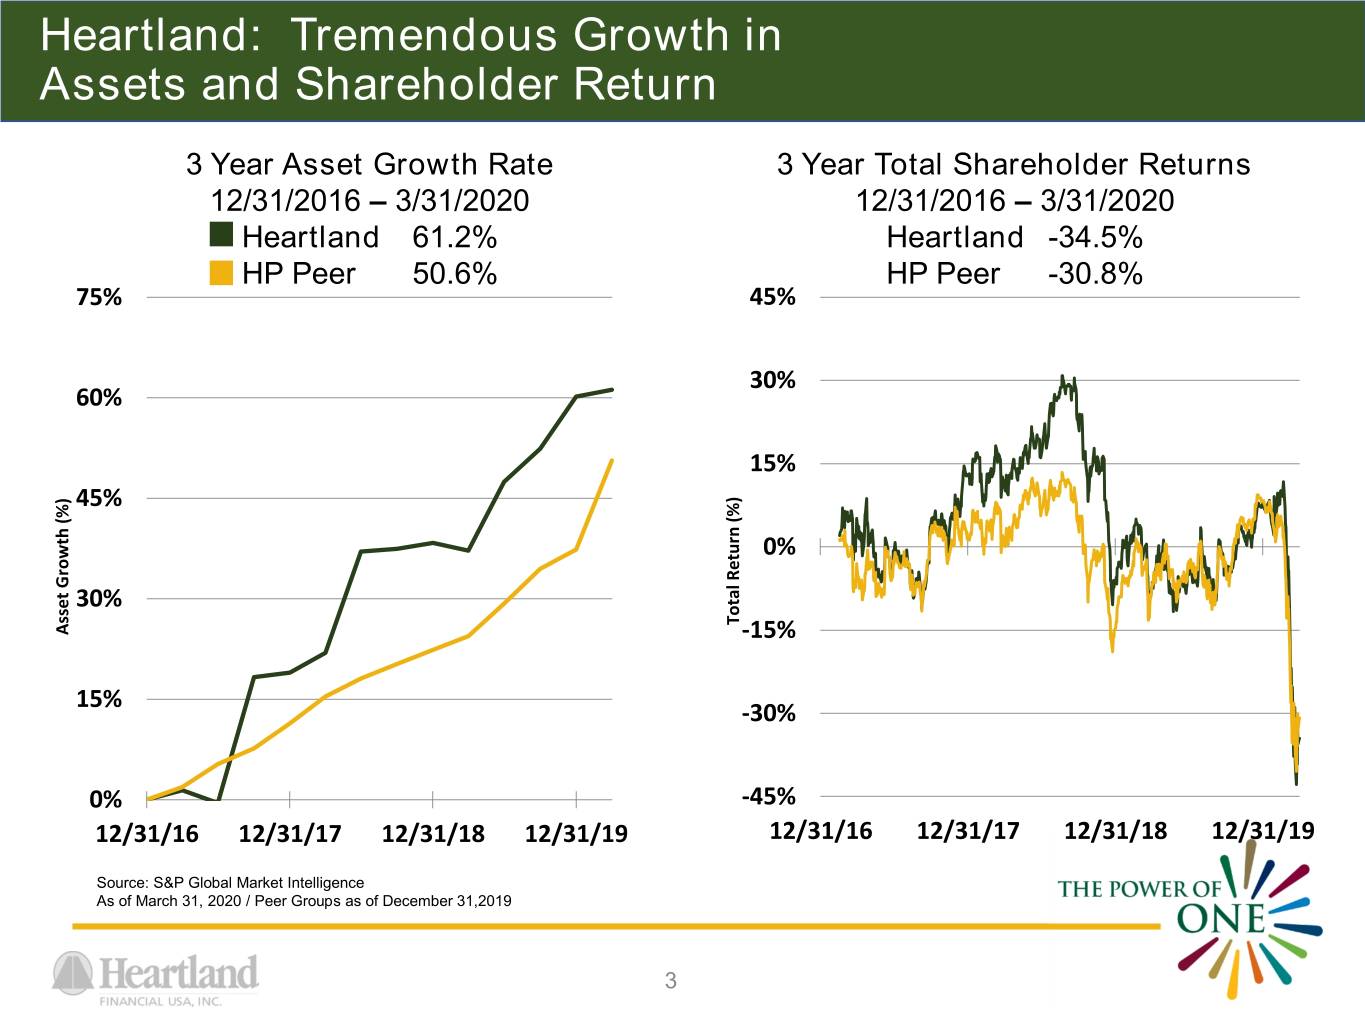
Heartland: Tremendous Growth in Assets and Shareholder Return 3 Year Asset Growth Rate 3 Year Total Shareholder Returns 12/31/2016 – 3/31/2020 12/31/2016 – 3/31/2020 Heartland 61.2% Heartland -34.5% HP Peer 50.6% HP Peer -30.8% 75% 45% 30% 60% 15% 45% 0% 30% TotalReturn (%) Asset Asset Growth(%) -15% 15% -30% 0% -45% 12/31/16 12/31/17 12/31/18 12/31/19 12/31/16 12/31/17 12/31/18 12/31/19 Source: S&P Global Market Intelligence As of March 31, 2020 / Peer Groups as of December 31,2019 3
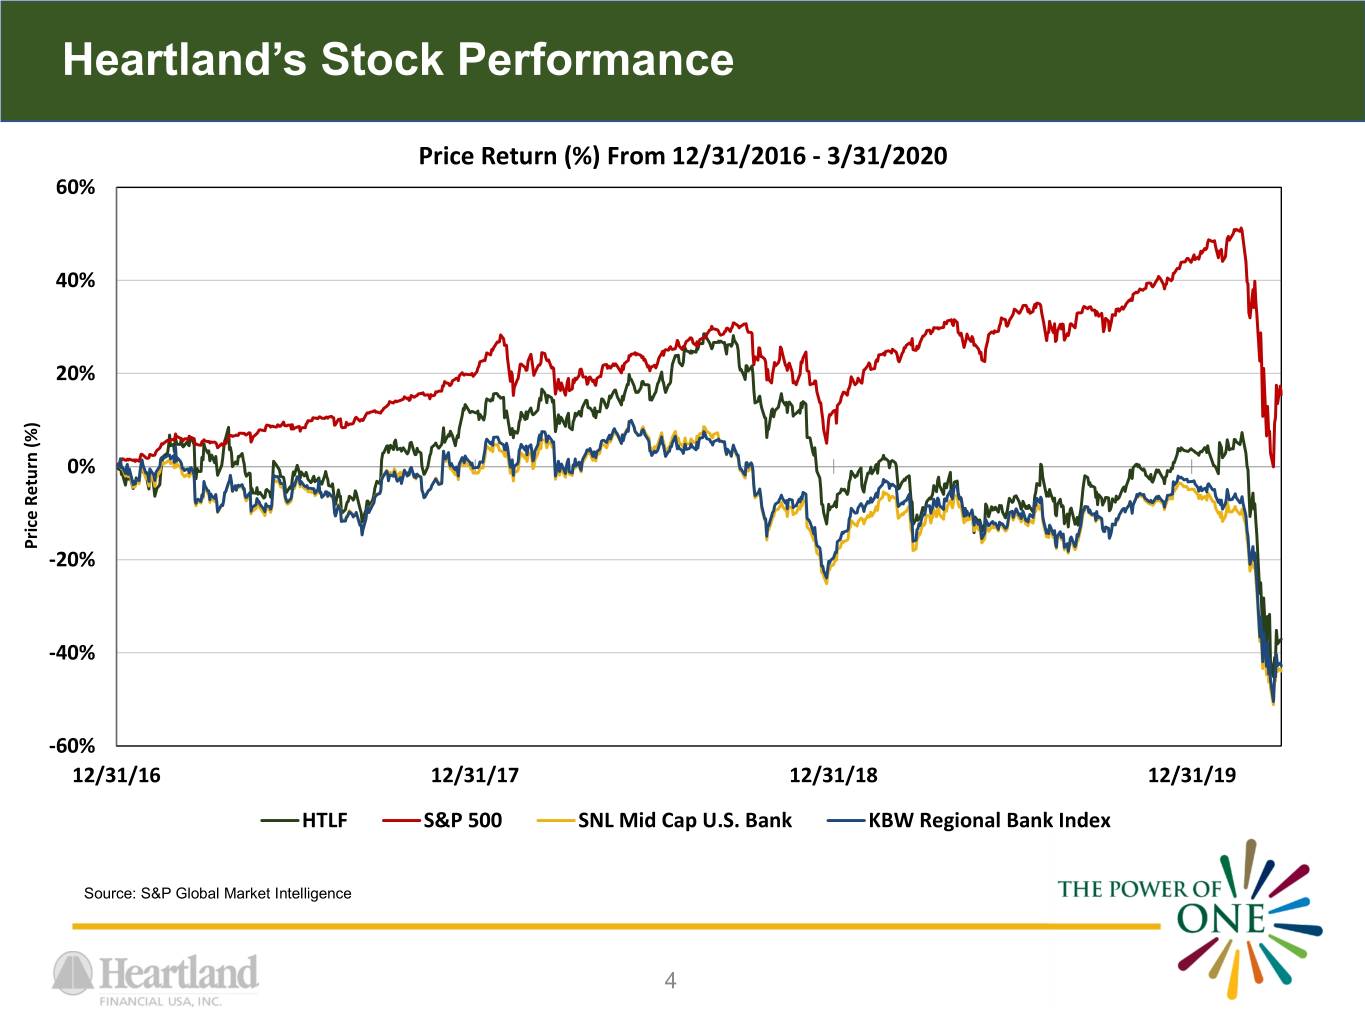
Heartland’s Stock Performance Price Return (%) From 12/31/2016 - 3/31/2020 60% 40% 20% 0% PriceReturn (%) -20% -40% -60% 12/31/16 12/31/17 12/31/18 12/31/19 HTLF S&P 500 SNL Mid Cap U.S. Bank KBW Regional Bank Index Source: S&P Global Market Intelligence 4
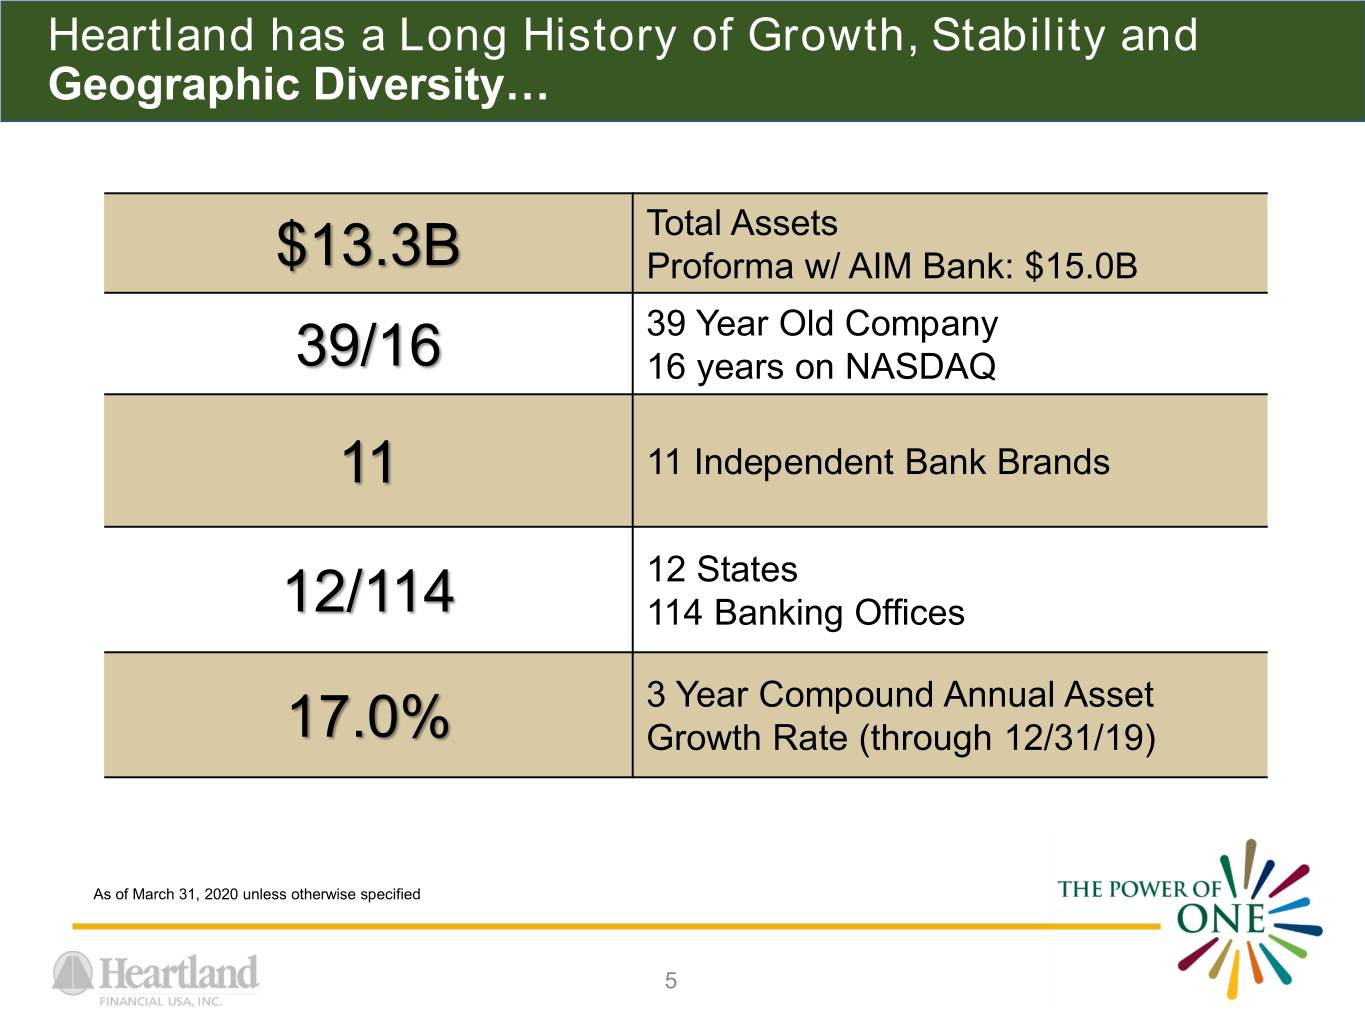
Heartland has a Long History of Growth, Stability and Geographic Diversity… Total Assets $13.3B Proforma w/ AIM Bank: $15.0B 39 Year Old Company 39/16 16 years on NASDAQ 11 11 Independent Bank Brands 12 States 12/114 114 Banking Offices 3 Year Compound Annual Asset 17.0% Growth Rate (through 12/31/19) As of March 31, 2020 unless otherwise specified 5
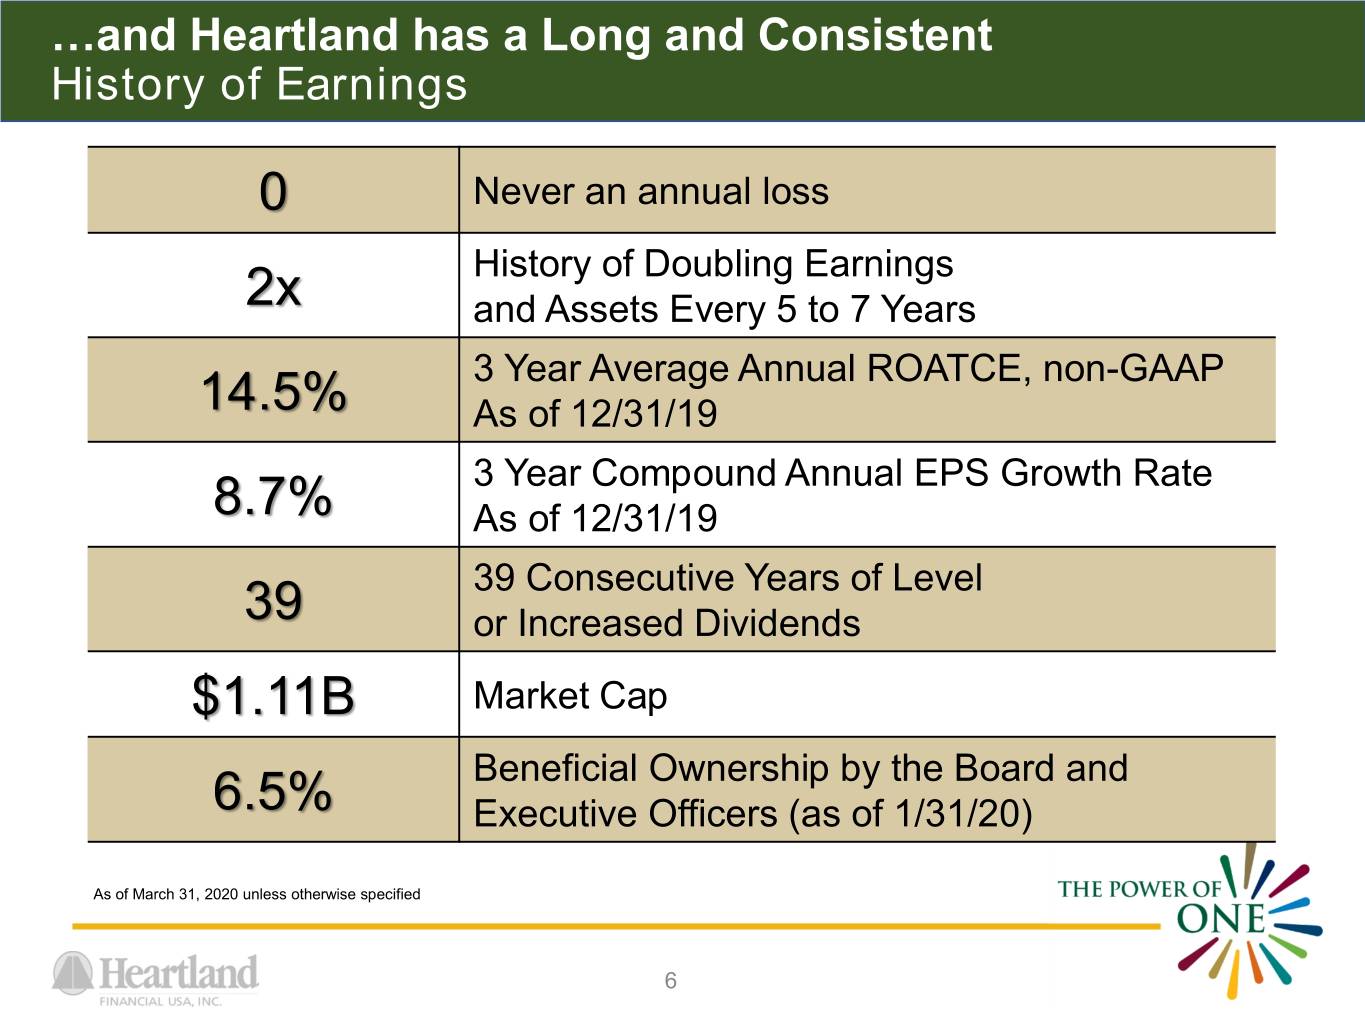
…and Heartland has a Long and Consistent History of Earnings 0 Never an annual loss History of Doubling Earnings 2x and Assets Every 5 to 7 Years 3 Year Average Annual ROATCE, non-GAAP 14.5% As of 12/31/19 3 Year Compound Annual EPS Growth Rate 8.7% As of 12/31/19 39 Consecutive Years of Level 39 or Increased Dividends $1.11B Market Cap Beneficial Ownership by the Board and 6.5% Executive Officers (as of 1/31/20) As of March 31, 2020 unless otherwise specified 6
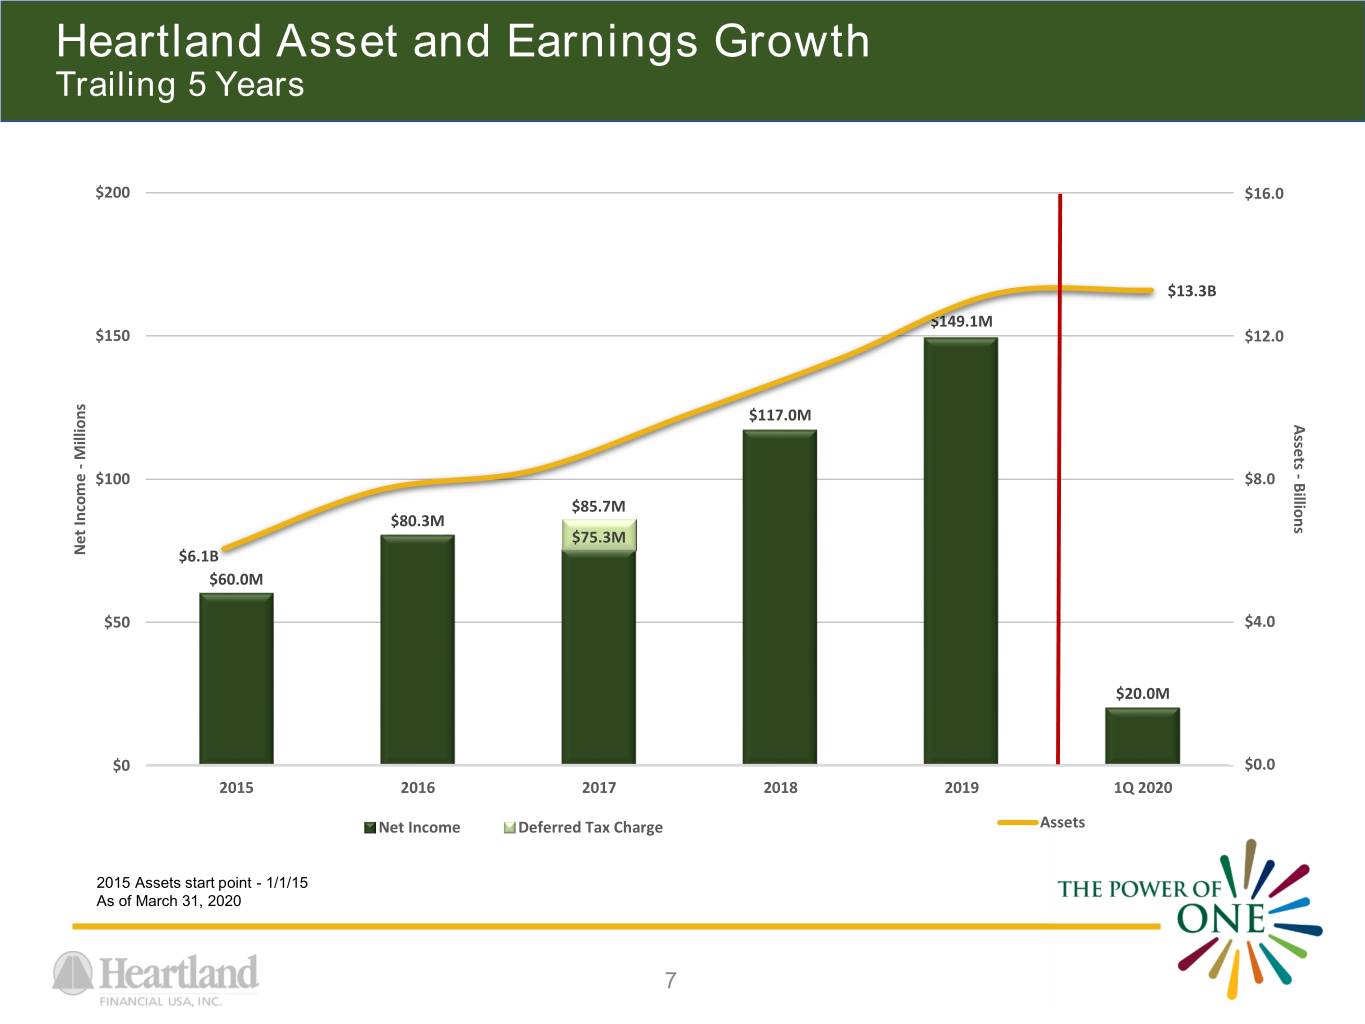
Heartland Asset and Earnings Growth Trailing 5 Years $200 $16.0 $13.3B $149.1M $150 $12.0 $117.0M Assets Millions - - $100 $8.0 Billions $85.7M $80.3M $75.3M Net Income Income Net $6.1B $60.0M $50 $4.0 $20.0M $0 $0.0 2015 2016 2017 2018 2019 1Q 2020 Net Income Deferred Tax Charge Assets 2015 Assets start point - 1/1/15 As of March 31, 2020 7
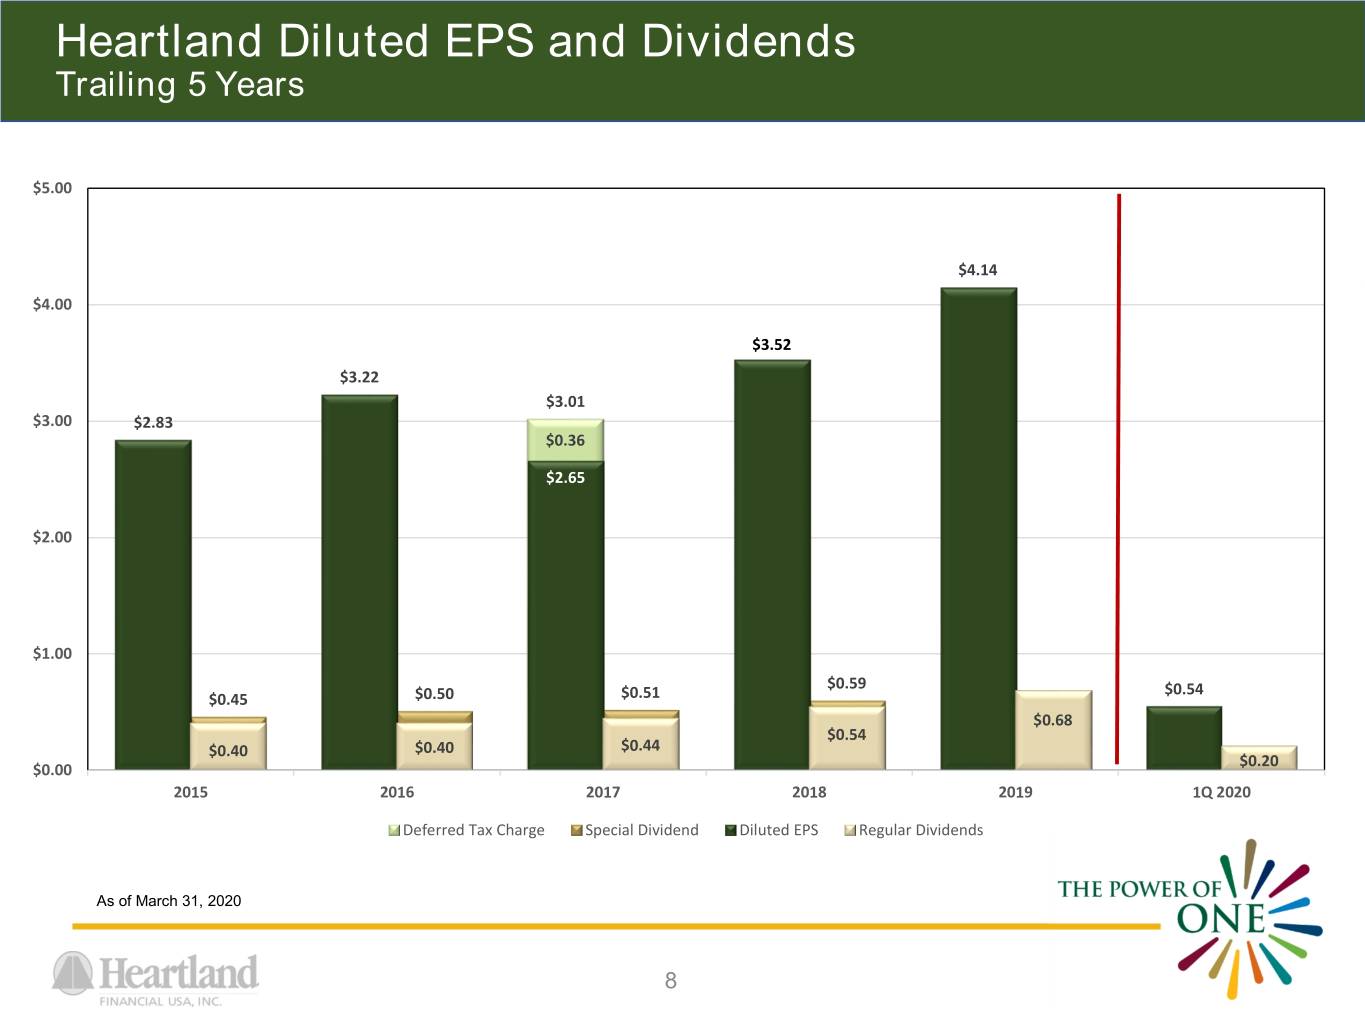
Heartland Diluted EPS and Dividends Trailing 5 Years $5.00 $4.14 $4.00 $3.52 $3.22 $3.01 $3.00 $2.83 $0.36 $2.65 $2.00 $1.00 $0.59 $0.54 $0.45 $0.50 $0.51 $0.68 $0.54 $0.40 $0.40 $0.44 $0.20 $0.00 2015 2016 2017 2018 2019 1Q 2020 Deferred Tax Charge Special Dividend Diluted EPS Regular Dividends As of March 31, 2020 8

M&A – Core Competency and Strategy Heartland’s model is attractive to sellers . A Core Competency (11 transactions completed in last 5 years) . Dedicated corporate development and conversion/integration staff . Sophisticated internally developed financial model – detailed conversion/integration playbook . Efficient Regulatory Application, SEC filing and close process – avg. 125 days post announcement . All new entities convert to our core systems platform – avg. 75 days post deal close . Focused on In Footprint Transactions . Opportunities abound across entire footprint – keep a deep active pipeline . Focus on expanding existing markets >= $1 Billion in assets . Deal Size “sweet spot” is moving up - $1 to $3 Billion in assets . Strong Core Deposits – Clean Credit Quality . Market Overlap . Must meet Conservatively Modeled Financial Benchmarks . Accretive to EPS immediately after conversion . Demonstrate an IRR > 15% . Tangible book value earn backs of 4 years or less 9
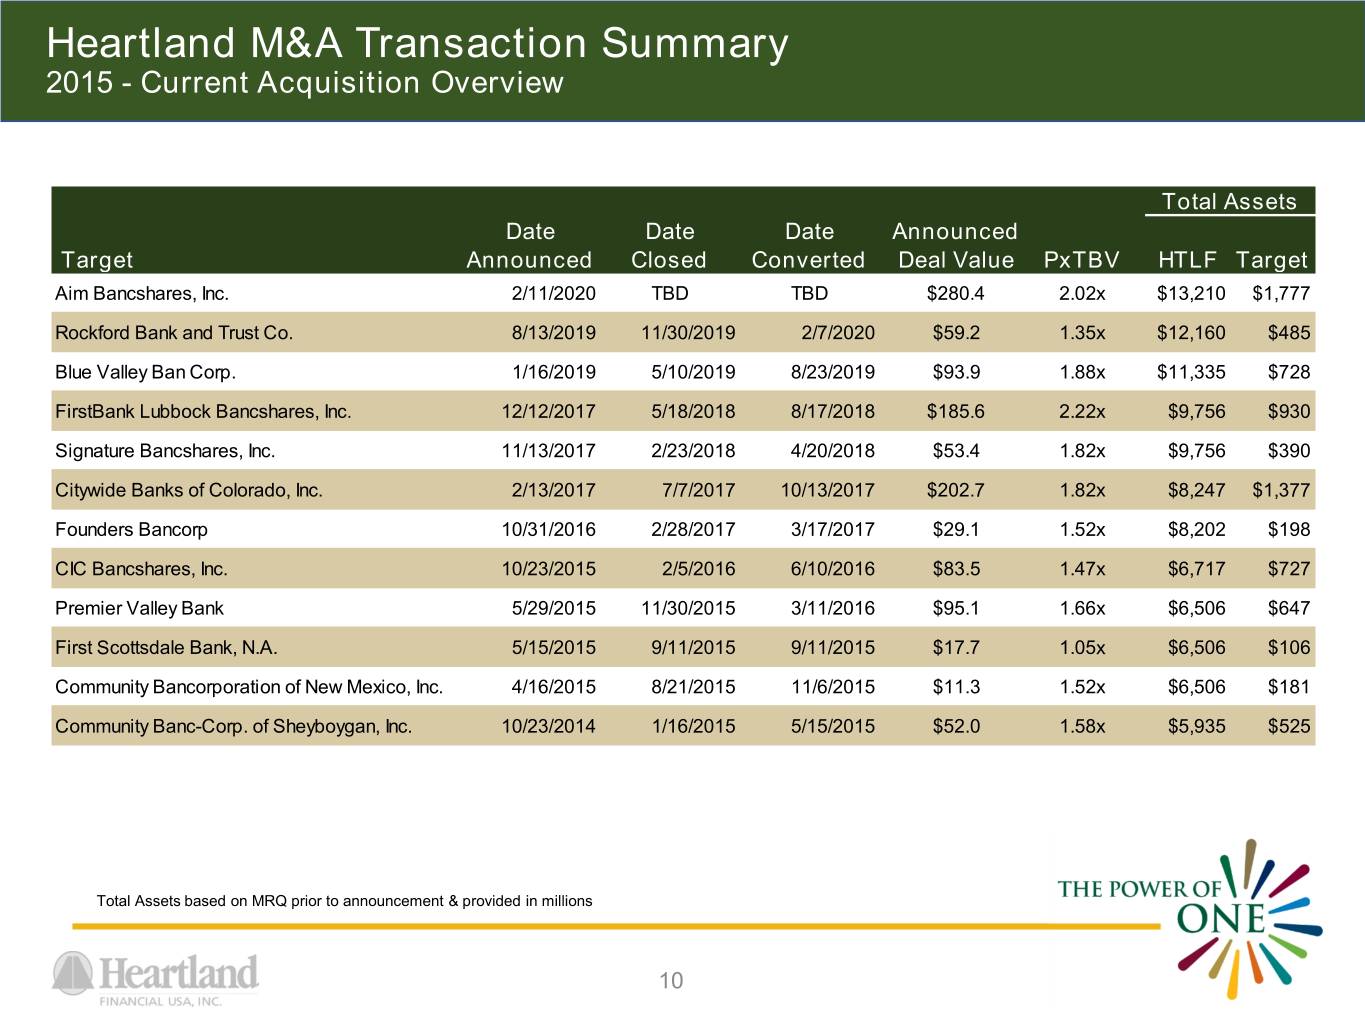
Heartland M&A Transaction Summary 2015 - Current Acquisition Overview Total Assets Date Date Date Announced Target Announced Closed Converted Deal Value PxTBV HTLF Target Aim Bancshares, Inc. 2/11/2020 TBD TBD $280.4 2.02x $13,210 $1,777 Rockford Bank and Trust Co. 8/13/2019 11/30/2019 2/7/2020 $59.2 1.35x $12,160 $485 Blue Valley Ban Corp. 1/16/2019 5/10/2019 8/23/2019 $93.9 1.88x $11,335 $728 FirstBank Lubbock Bancshares, Inc. 12/12/2017 5/18/2018 8/17/2018 $185.6 2.22x $9,756 $930 Signature Bancshares, Inc. 11/13/2017 2/23/2018 4/20/2018 $53.4 1.82x $9,756 $390 Citywide Banks of Colorado, Inc. 2/13/2017 7/7/2017 10/13/2017 $202.7 1.82x $8,247 $1,377 Founders Bancorp 10/31/2016 2/28/2017 3/17/2017 $29.1 1.52x $8,202 $198 CIC Bancshares, Inc. 10/23/2015 2/5/2016 6/10/2016 $83.5 1.47x $6,717 $727 Premier Valley Bank 5/29/2015 11/30/2015 3/11/2016 $95.1 1.66x $6,506 $647 First Scottsdale Bank, N.A. 5/15/2015 9/11/2015 9/11/2015 $17.7 1.05x $6,506 $106 Community Bancorporation of New Mexico, Inc. 4/16/2015 8/21/2015 11/6/2015 $11.3 1.52x $6,506 $181 Community Banc-Corp. of Sheyboygan, Inc. 10/23/2014 1/16/2015 5/15/2015 $52.0 1.58x $5,935 $525 Total Assets based on MRQ prior to announcement & provided in millions 10
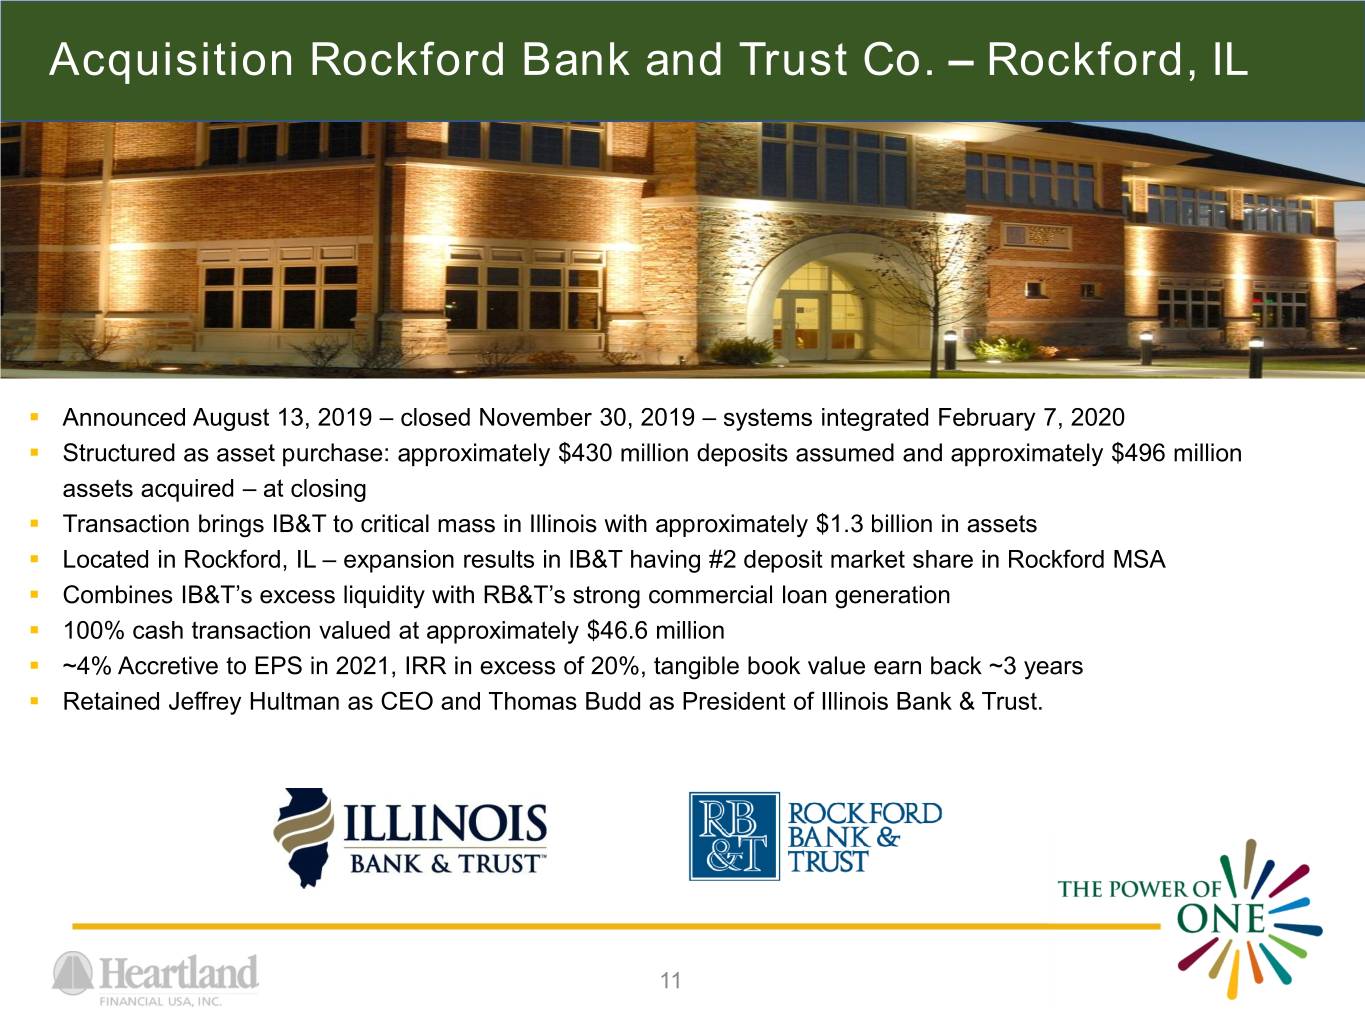
Acquisition Rockford Bank and Trust Co. – Rockford, IL . Announced August 13, 2019 – closed November 30, 2019 – systems integrated February 7, 2020 . Structured as asset purchase: approximately $430 million deposits assumed and approximately $496 million assets acquired – at closing . Transaction brings IB&T to critical mass in Illinois with approximately $1.3 billion in assets . Located in Rockford, IL – expansion results in IB&T having #2 deposit market share in Rockford MSA . Combines IB&T’s excess liquidity with RB&T’s strong commercial loan generation . 100% cash transaction valued at approximately $46.6 million . ~4% Accretive to EPS in 2021, IRR in excess of 20%, tangible book value earn back ~3 years . Retained Jeffrey Hultman as CEO and Thomas Budd as President of Illinois Bank & Trust. 11

Acquisition AIM Bancshares, Inc. – Lubbock, TX . Announced February 11, 2020 – anticipated close early 3Q 2020 – anticipated systems integration 4Q 2020 . Assets approximately $1.8 billion, loans approximately $1.2 billion, and deposits approximately $1.5 billion . AimBank combined with FB&T creates HTLF’s largest member bank with approximately $2.8 billion in assets . Transaction results in FB&T being the #5 largest bank headquartered in West Texas – ranking #3 deposit market share in Lubbock MSA . Headquarters will remain in Lubbock, Texas . 90% stock / 10% cash transaction valued at announcement approximately $280.4 million (1) . ~10% Accretive to EPS in 2021. IRR in excess of 20%. Tangible book value earn back ~3.6 years . Barry Orr continues as Chairman and CEO and retained Scott Wade as Vice Chairman and President of the South Division of FirstBank & Trust (1) The price at announcement was based on HTLF closing stock price of $49.88 on February 10, 2020 12

An Expanding Franchise Heartland Financial USA, Inc. Projected 5yr Assets % of Number of Population State (000's) Franchise Branches Change Iowa $1,591,312 11.9% 6 2.36% Illinois 1,295,984 9.7% 10 -0.18% Kansas/Missouri 1,222,358 9.1% 12 1.44% Wisconsin 1,079,582 8.0% 14 1.32% Minnesota 778,724 5.8% 2 3.26% HTLF Midwest $5,967,960 44.5% 44 New Mexico $1,670,097 12.5% 17 0.96% Texas 1,163,181 8.7% 7 7.10% Arizona 866,107 6.5% 6 6.02% HTLF Southwest $3,699,385 27.7% 30 Colorado $2,271,889 16.9% 23 6.90% California 889,280 6.6% 8 4.06% Montana 576,245 4.3% 9 4.38% HTLF West $3,737,414 27.8% 40 As of March 31, 2020 13
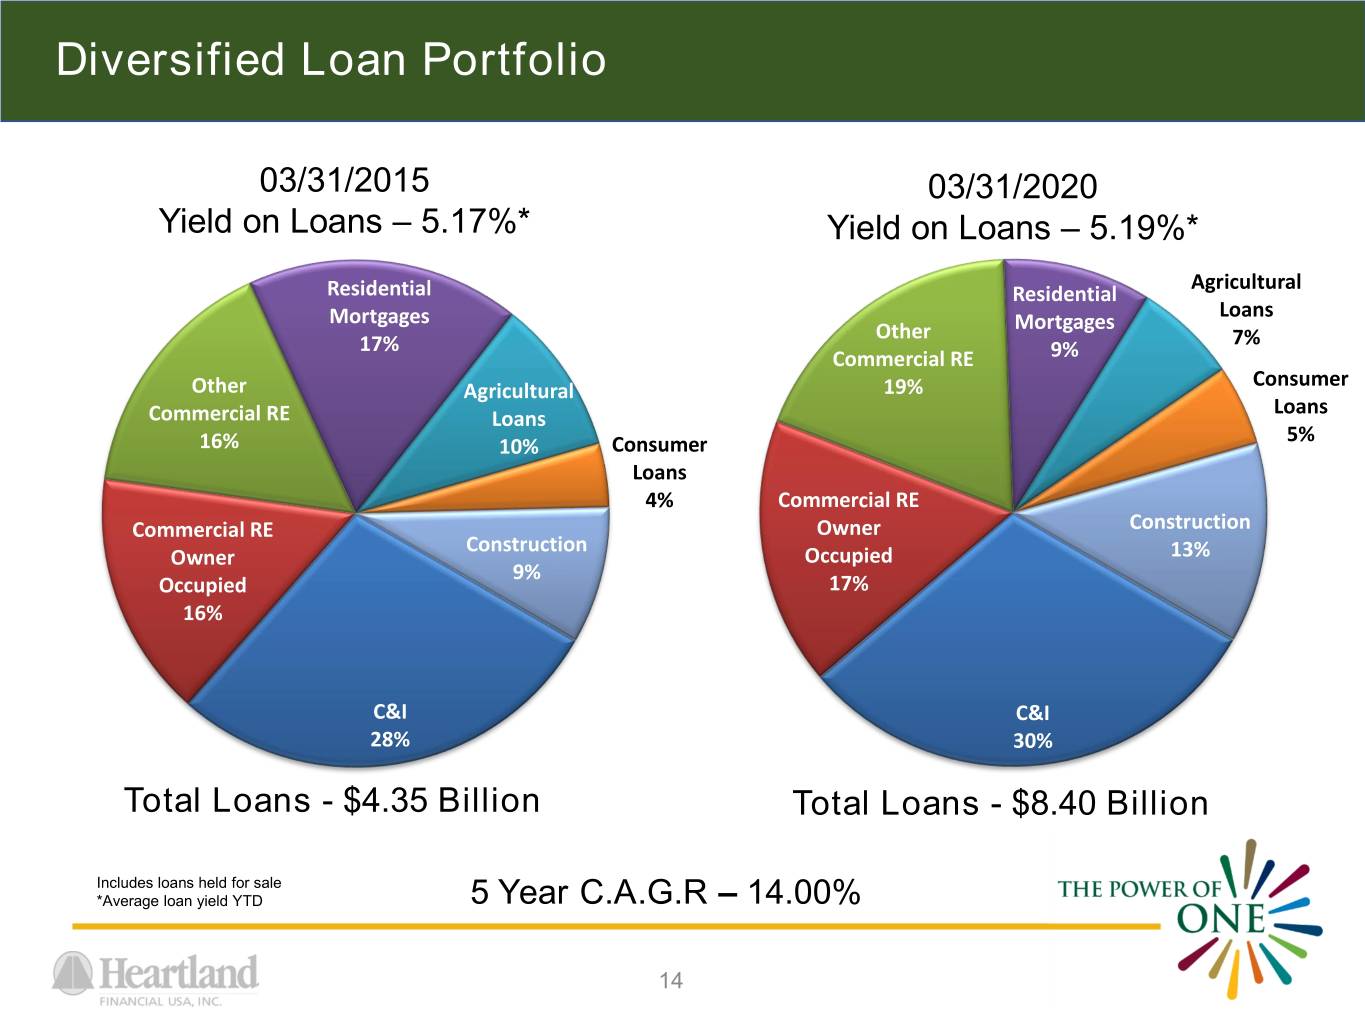
Diversified Loan Portfolio 03/31/2015 03/31/2020 Yield on Loans – 5.17%* Yield on Loans – 5.19%* Agricultural Residential Residential Mortgages Loans Other Mortgages 17% 7% Commercial RE 9% Consumer Other Agricultural 19% Loans Commercial RE Loans 5% 16% 10% Consumer Loans 4% Commercial RE Commercial RE Owner Construction Construction Owner Occupied 13% 9% Occupied 17% 16% C&I C&I 28% 30% Total Loans - $4.35 Billion Total Loans - $8.40 Billion Includes loans held for sale *Average loan yield YTD 5 Year C.A.G.R – 14.00% 14
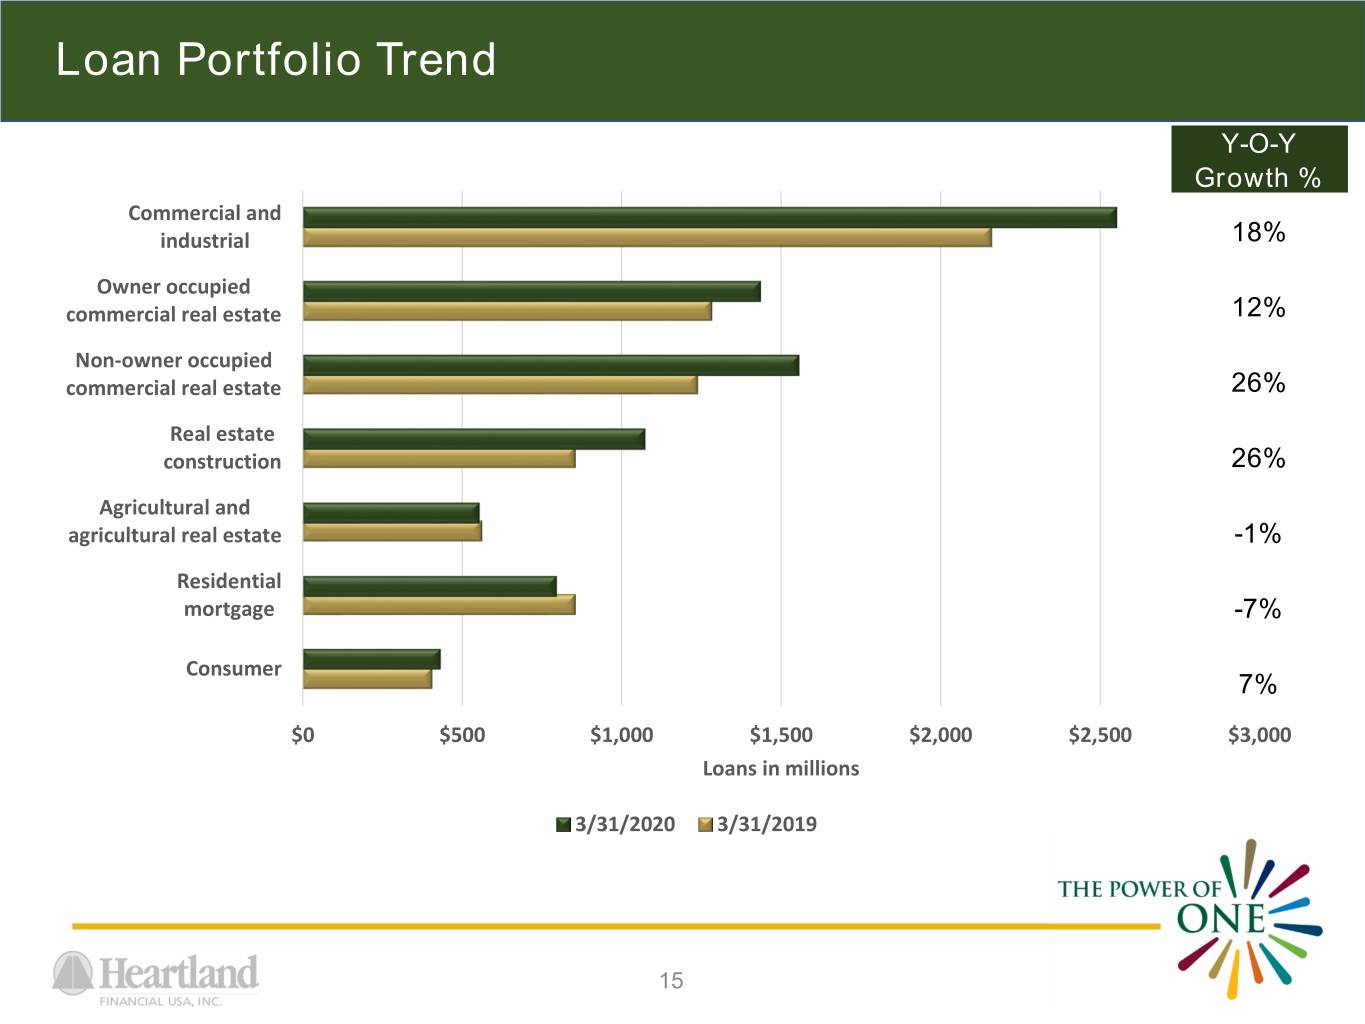
Loan Portfolio Trend Y-O-Y Growth % Commercial and industrial 18% Owner occupied commercial real estate 12% Non-owner occupied commercial real estate 26% Real estate construction 26% Agricultural and agricultural real estate -1% Residential mortgage -7% Consumer 7% $0 $500 $1,000 $1,500 $2,000 $2,500 $3,000 Loans in millions 3/31/2020 3/31/2019 15
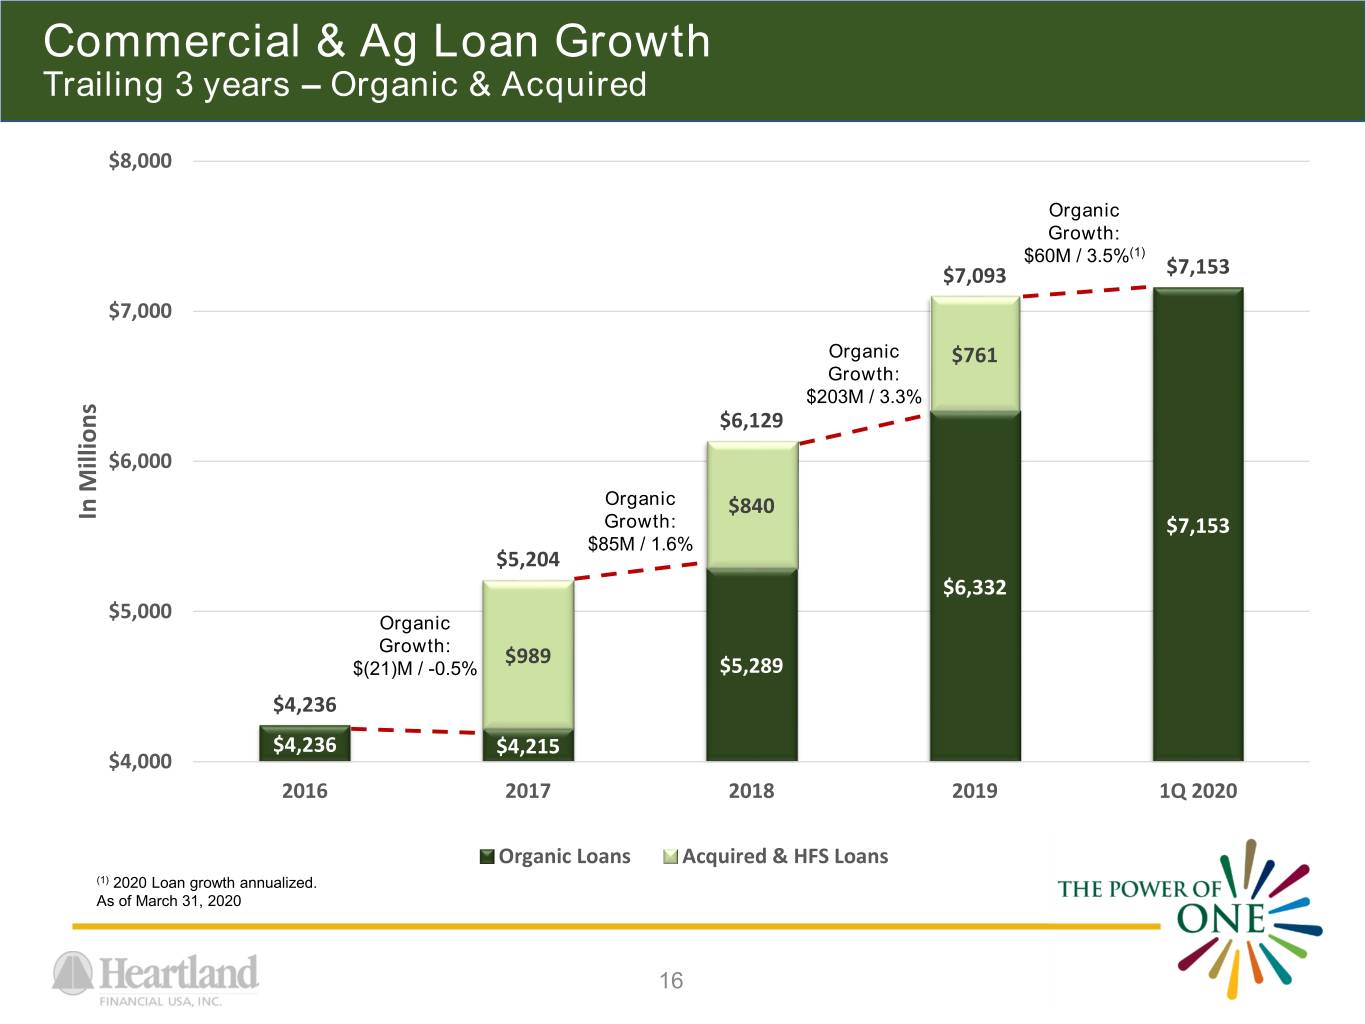
Commercial & Ag Loan Growth Trailing 3 years – Organic & Acquired $8,000 Organic Growth: $60M / 3.5%(1) $7,093 $7,153 $7,000 Organic $761 Growth: $203M / 3.3% $6,129 $6,000 Organic $840 In Millions In Growth: $7,153 $85M / 1.6% $5,204 $6,332 $5,000 Organic Growth: $989 $(21)M / -0.5% $5,289 $4,236 $4,236 $4,215 $4,000 2016 2017 2018 2019 1Q 2020 Organic Loans Acquired & HFS Loans (1) 2020 Loan growth annualized. As of March 31, 2020 16
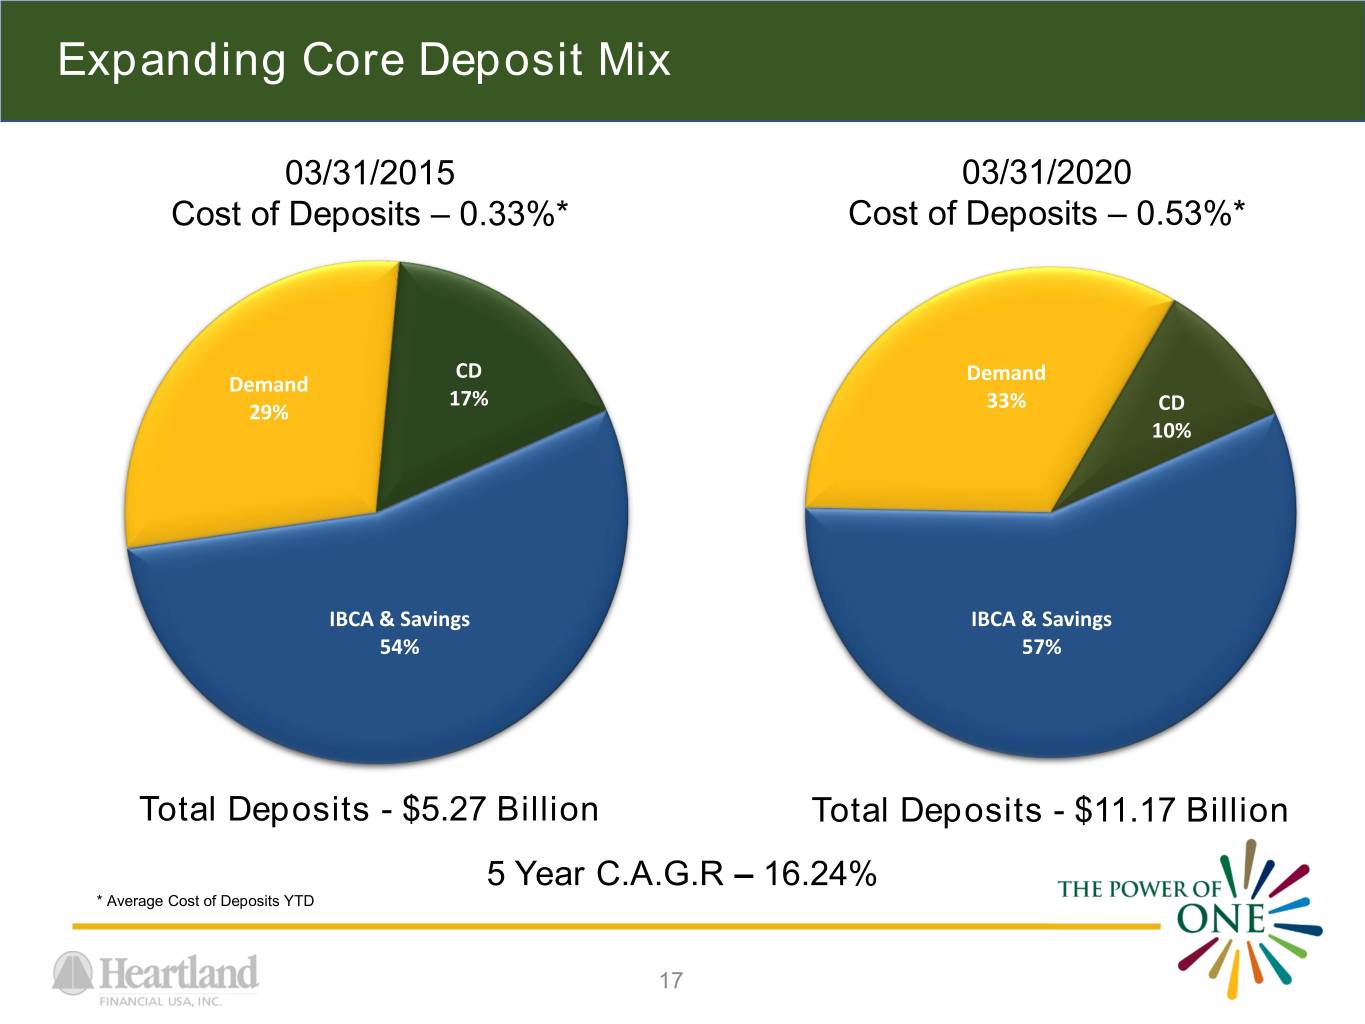
Expanding Core Deposit Mix 03/31/2015 03/31/2020 Cost of Deposits – 0.33%* Cost of Deposits – 0.53%* CD Demand Demand 17% 33% 29% CD 10% IBCA & Savings IBCA & Savings 54% 57% Total Deposits - $5.27 Billion Total Deposits - $11.17 Billion 5 Year C.A.G.R – 16.24% * Average Cost of Deposits YTD 17
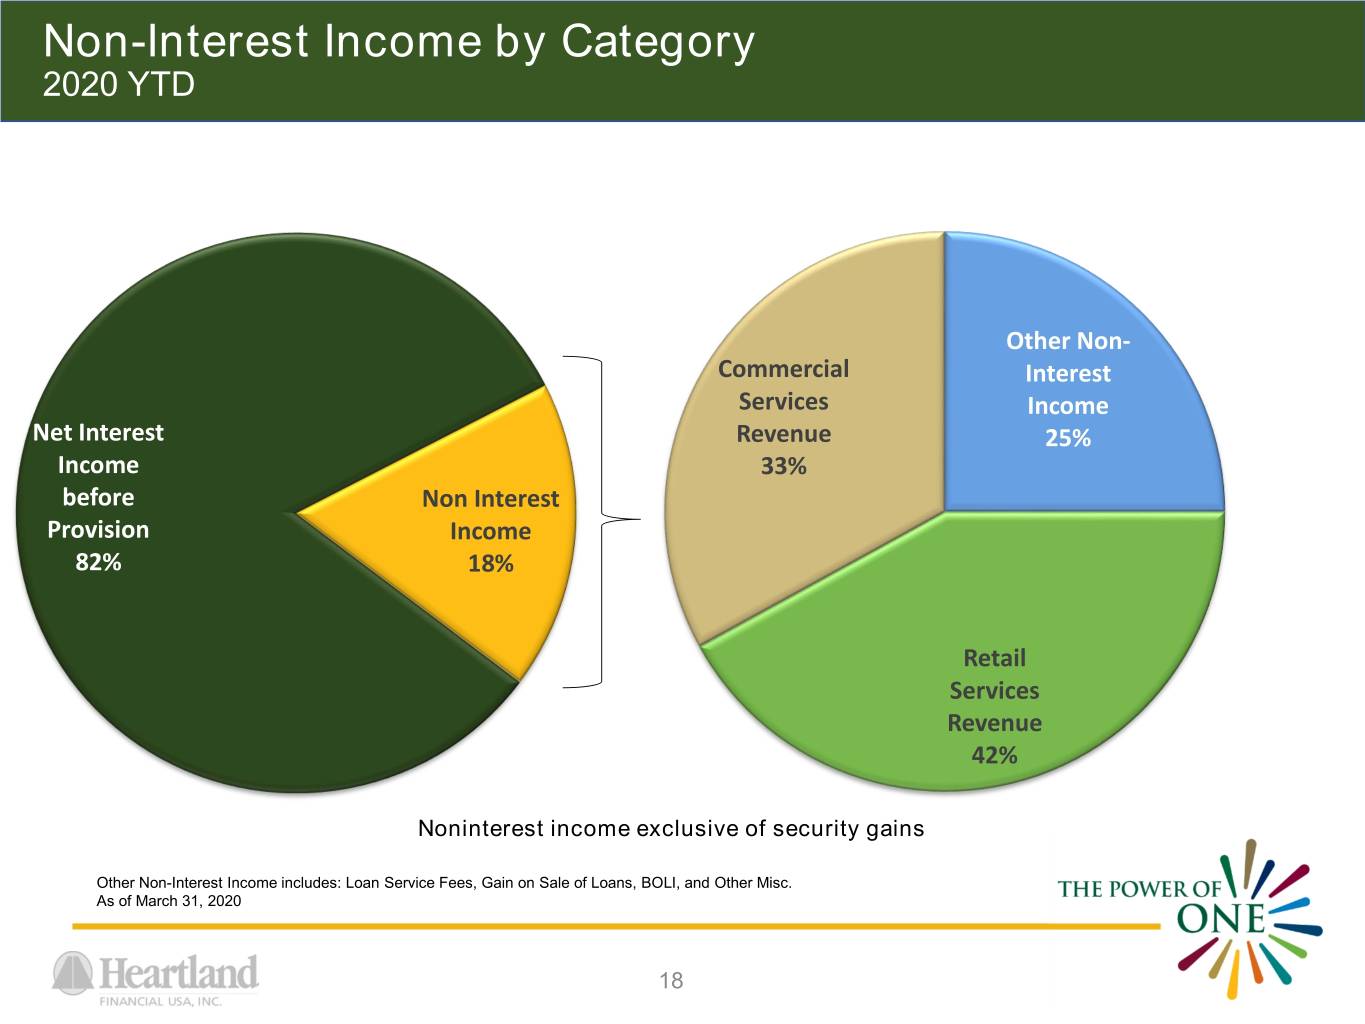
Non-Interest Income by Category 2020 YTD Other Non- Commercial Interest Services Income Net Interest Revenue 25% Income 33% before Non Interest Provision Income 82% 18% Retail Services Revenue 42% Noninterest income exclusive of security gains Other Non-Interest Income includes: Loan Service Fees, Gain on Sale of Loans, BOLI, and Other Misc. As of March 31, 2020 18
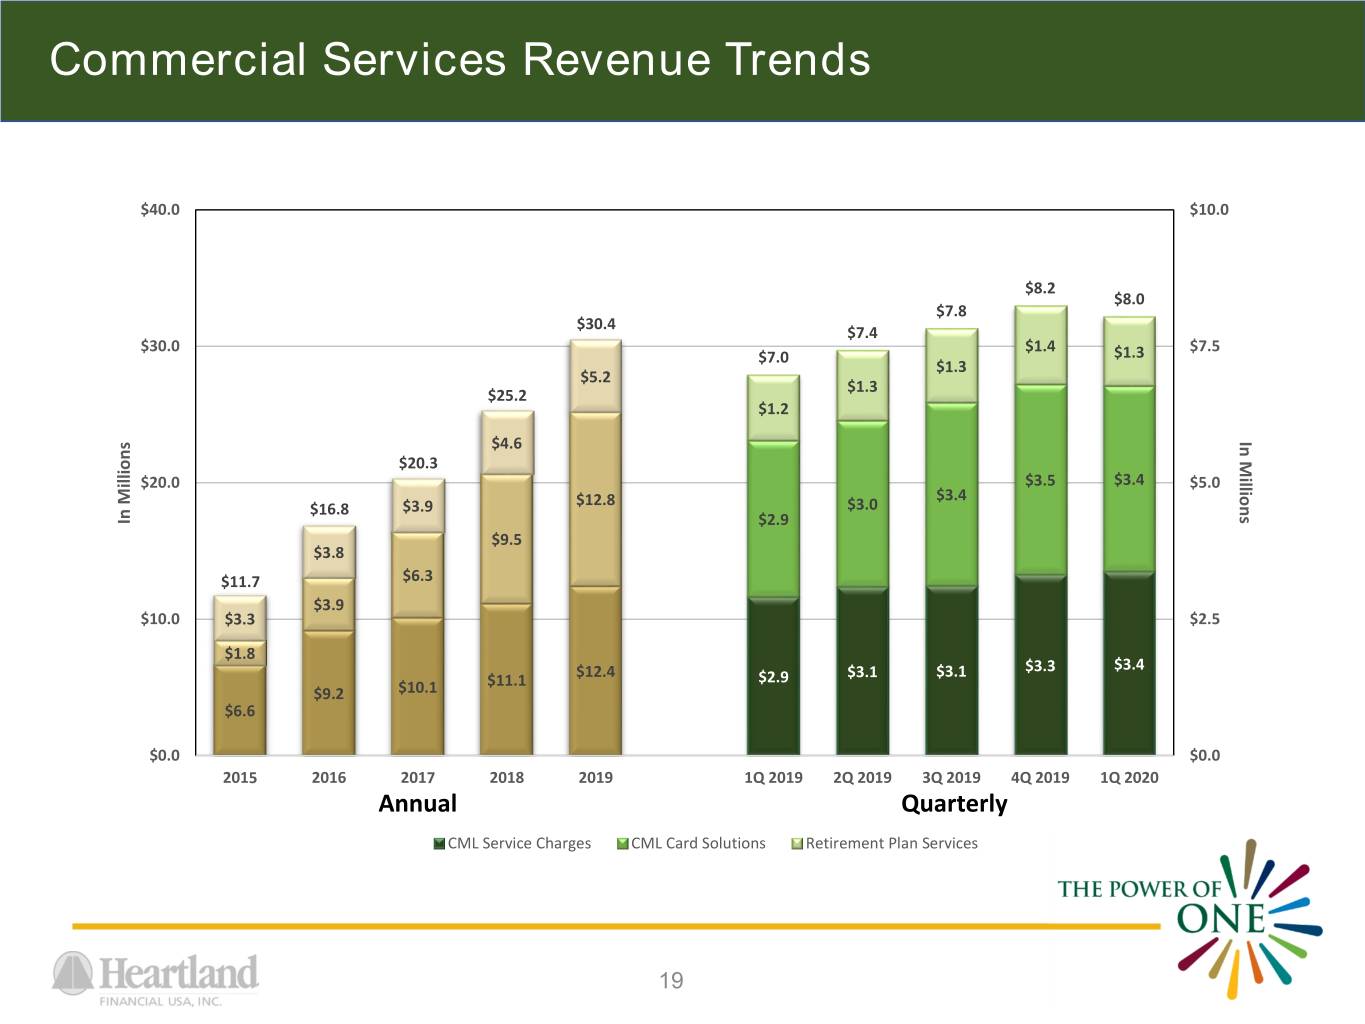
Commercial Services Revenue Trends $40.0 $10.0 $8.2 $8.0 $7.8 $30.4 $7.4 $30.0 $1.4 $7.5 $7.0 $1.3 $1.3 $5.2 $1.3 $25.2 $1.2 $4.6 Millions In $20.3 $20.0 $3.5 $3.4 $5.0 $12.8 $3.4 $16.8 $3.9 $3.0 InMillions $2.9 $9.5 $3.8 $11.7 $6.3 $3.9 $10.0 $3.3 $2.5 $1.8 $12.4 $3.1 $3.3 $3.4 $11.1 $2.9 $3.1 $9.2 $10.1 $6.6 $0.0 $0.0 2015 2016 2017 2018 2019 1Q 2019 2Q 2019 3Q 2019 4Q 2019 1Q 2020 Annual Quarterly CML Service Charges CML Card Solutions Retirement Plan Services 19
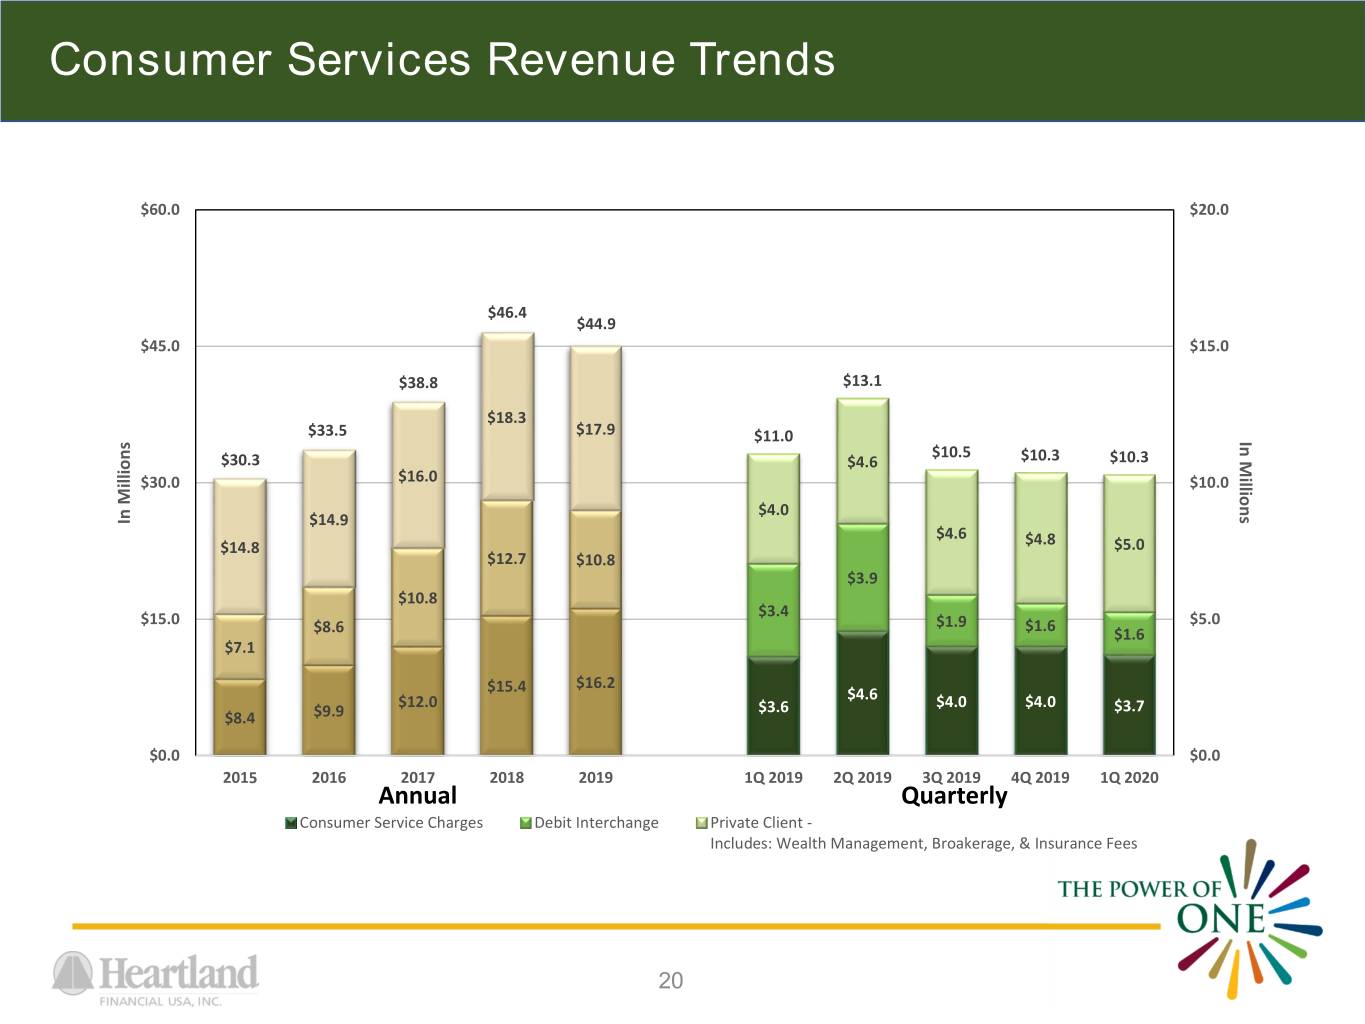
Consumer Services Revenue Trends $60.0 $20.0 $46.4 $44.9 $45.0 $15.0 $38.8 $13.1 $18.3 $33.5 $17.9 $11.0 Millions In $10.5 $30.3 $4.6 $10.3 $10.3 $30.0 $16.0 $10.0 $4.0 InMillions $14.9 $4.6 $14.8 $4.8 $5.0 $12.7 $10.8 $3.9 $10.8 $3.4 $15.0 $1.9 $1.6 $5.0 $8.6 $1.6 $7.1 $16.2 $15.4 $4.6 $12.0 $3.6 $4.0 $4.0 $3.7 $8.4 $9.9 $0.0 $0.0 2015 2016 2017 2018 2019 1Q 2019 2Q 2019 3Q 2019 4Q 2019 1Q 2020 Annual Quarterly Consumer Service Charges Debit Interchange Private Client - Includes: Wealth Management, Broakerage, & Insurance Fees 20
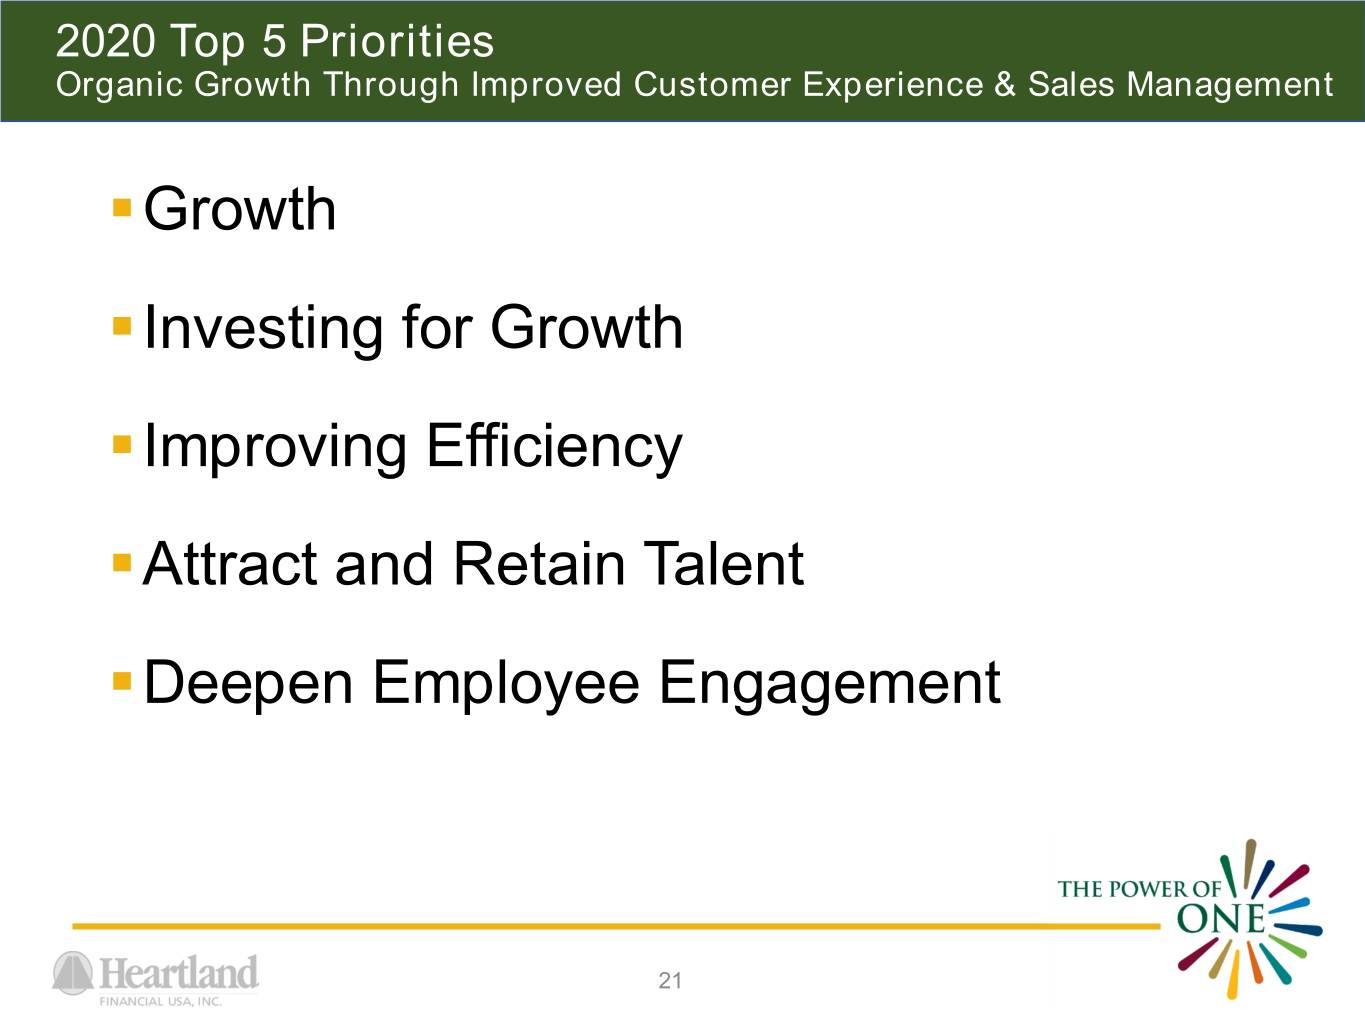
2020 Top 5 Priorities Organic Growth Through Improved Customer Experience & Sales Management .Growth .Investing for Growth .Improving Efficiency .Attract and Retain Talent .Deepen Employee Engagement 21
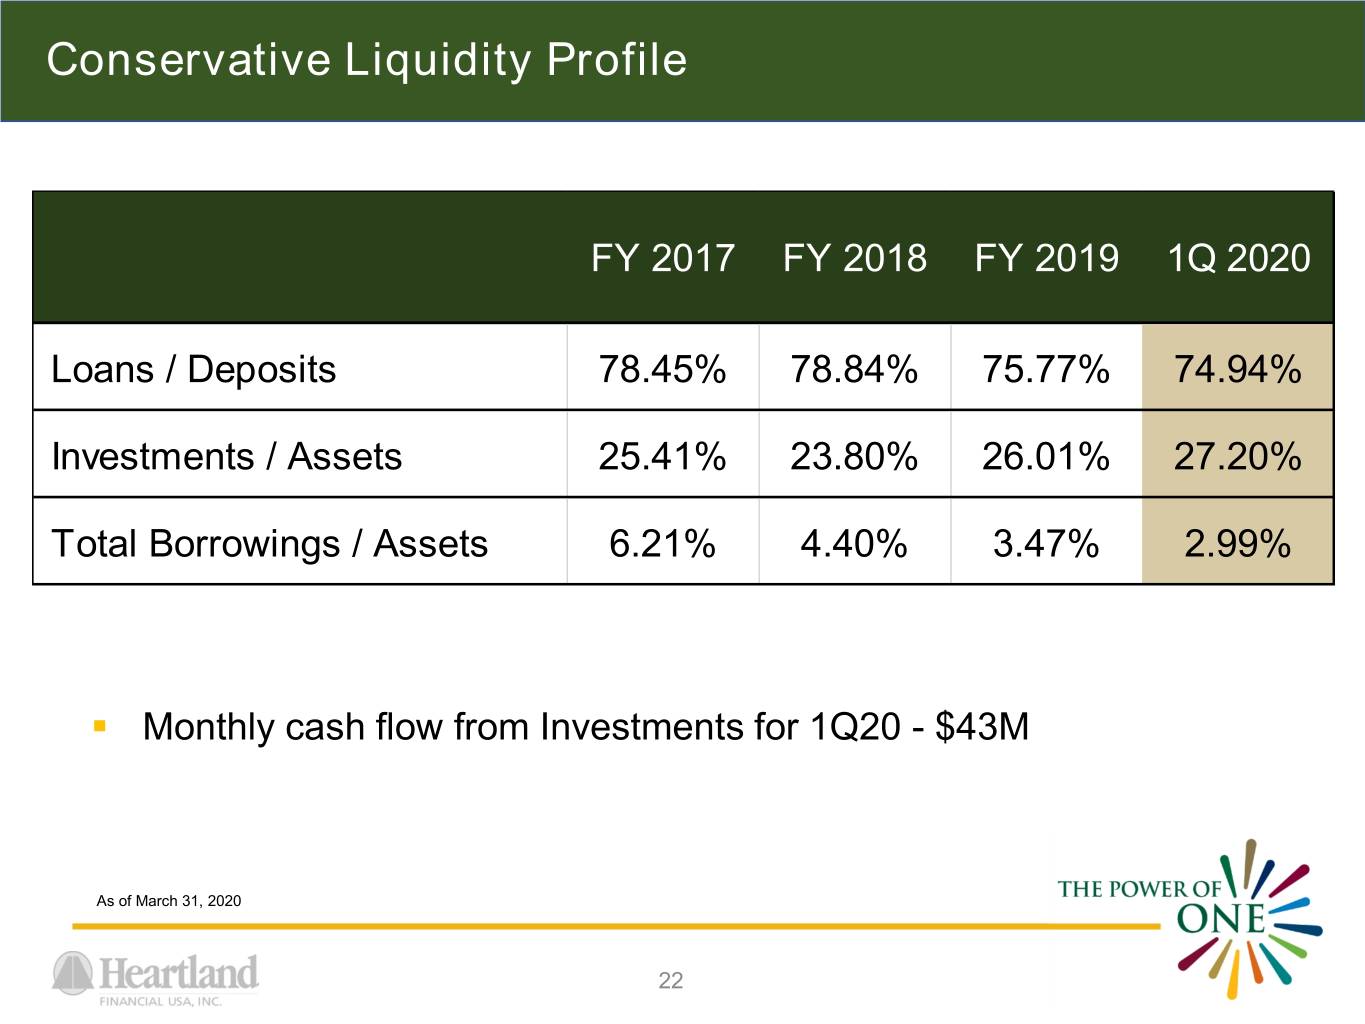
Conservative Liquidity Profile FY 2017 FY 2018 FY 2019 1Q 2020 Loans / Deposits 78.45% 78.84% 75.77% 74.94% Investments / Assets 25.41% 23.80% 26.01% 27.20% Total Borrowings / Assets 6.21% 4.40% 3.47% 2.99% . Monthly cash flow from Investments for 1Q20 - $43M As of March 31, 2020 22
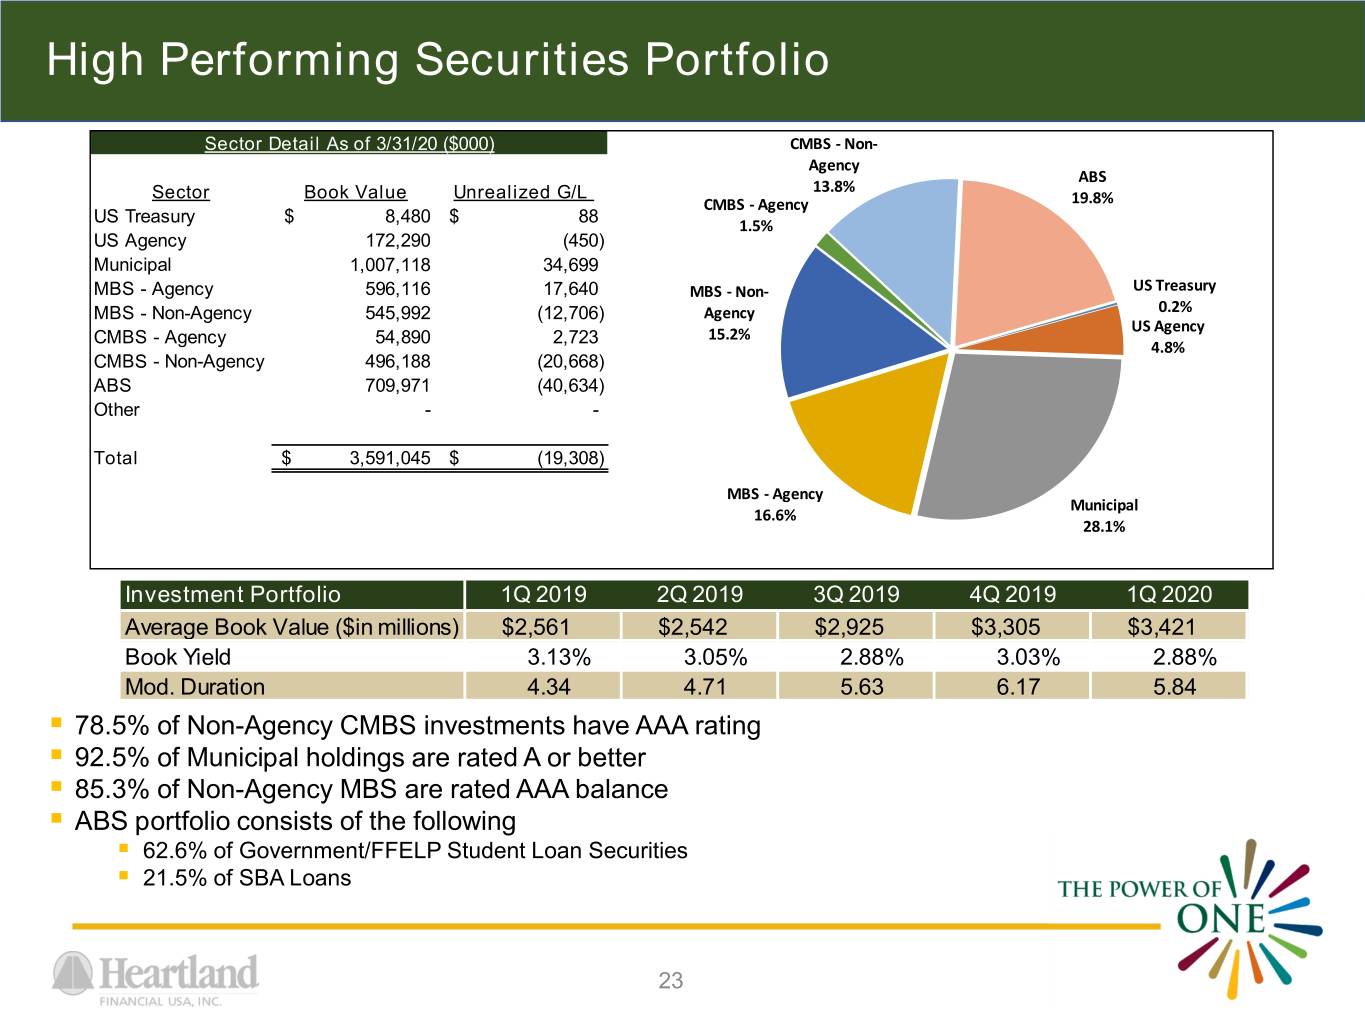
High Performing Securities Portfolio Sector Detail As of 3/31/20 ($000) CMBS - Non- Agency ABS Sector Book Value Unrealized G/L 13.8% CMBS - Agency 19.8% US Treasury $ 8,480 $ 88 1.5% US Agency 172,290 (450) Municipal 1,007,118 34,699 MBS - Agency 596,116 17,640 MBS - Non- US Treasury MBS - Non-Agency 545,992 (12,706) Agency 0.2% US Agency CMBS - Agency 54,890 2,723 15.2% 4.8% CMBS - Non-Agency 496,188 (20,668) ABS 709,971 (40,634) Other - - Total $ 3,591,045 $ (19,308) MBS - Agency Municipal 16.6% 28.1% Investment Portfolio 1Q 2019 2Q 2019 3Q 2019 4Q 2019 1Q 2020 Average Book Value ($in millions) $2,561 $2,542 $2,925 $3,305 $3,421 Book Yield 3.13% 3.05% 2.88% 3.03% 2.88% Mod. Duration 4.34 4.71 5.63 6.17 5.84 . 78.5% of Non-Agency CMBS investments have AAA rating . 92.5% of Municipal holdings are rated A or better . 85.3% of Non-Agency MBS are rated AAA balance . ABS portfolio consists of the following . 62.6% of Government/FFELP Student Loan Securities . 21.5% of SBA Loans 23
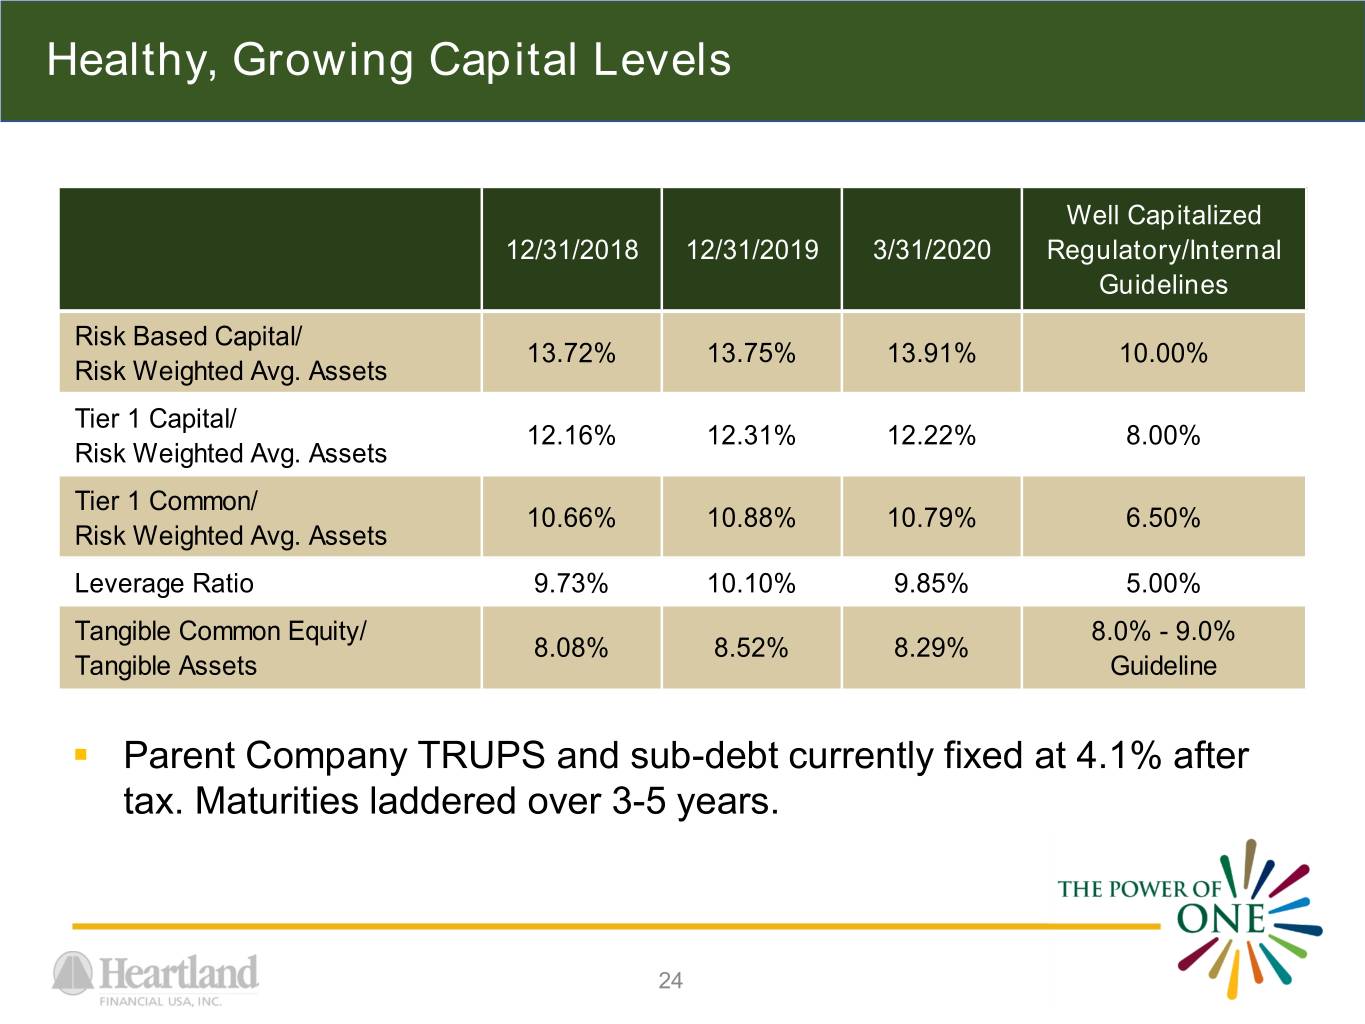
Healthy, Growing Capital Levels Well Capitalized 12/31/2018 12/31/2019 3/31/2020 Regulatory/Internal Guidelines Risk Based Capital/ 13.72% 13.75% 13.91% 10.00% Risk Weighted Avg. Assets Tier 1 Capital/ 12.16% 12.31% 12.22% 8.00% Risk Weighted Avg. Assets Tier 1 Common/ 10.66% 10.88% 10.79% 6.50% Risk Weighted Avg. Assets Leverage Ratio 9.73% 10.10% 9.85% 5.00% Tangible Common Equity/ 8.0% - 9.0% 8.08% 8.52% 8.29% Tangible Assets Guideline . Parent Company TRUPS and sub-debt currently fixed at 4.1% after tax. Maturities laddered over 3-5 years. 24

Net Interest Margin Fully Tax Equivalent 4.60% 4.40% 4.20% 4.00% 3.84% 3.80% 3.65% 3.60% 3.63% 3.40% 3.20% 2015 2016 2017 2018 2019 1Q 2020 Heartland Publicly Traded BHC $5-25B Total Asset Peers High Performance Peer Group Source: HTLF – As reported, non-GAAP / Peer Groups – S&P Global Market Intelligence As of March 31, 2020 / Peer Groups as of December 31,2019 25
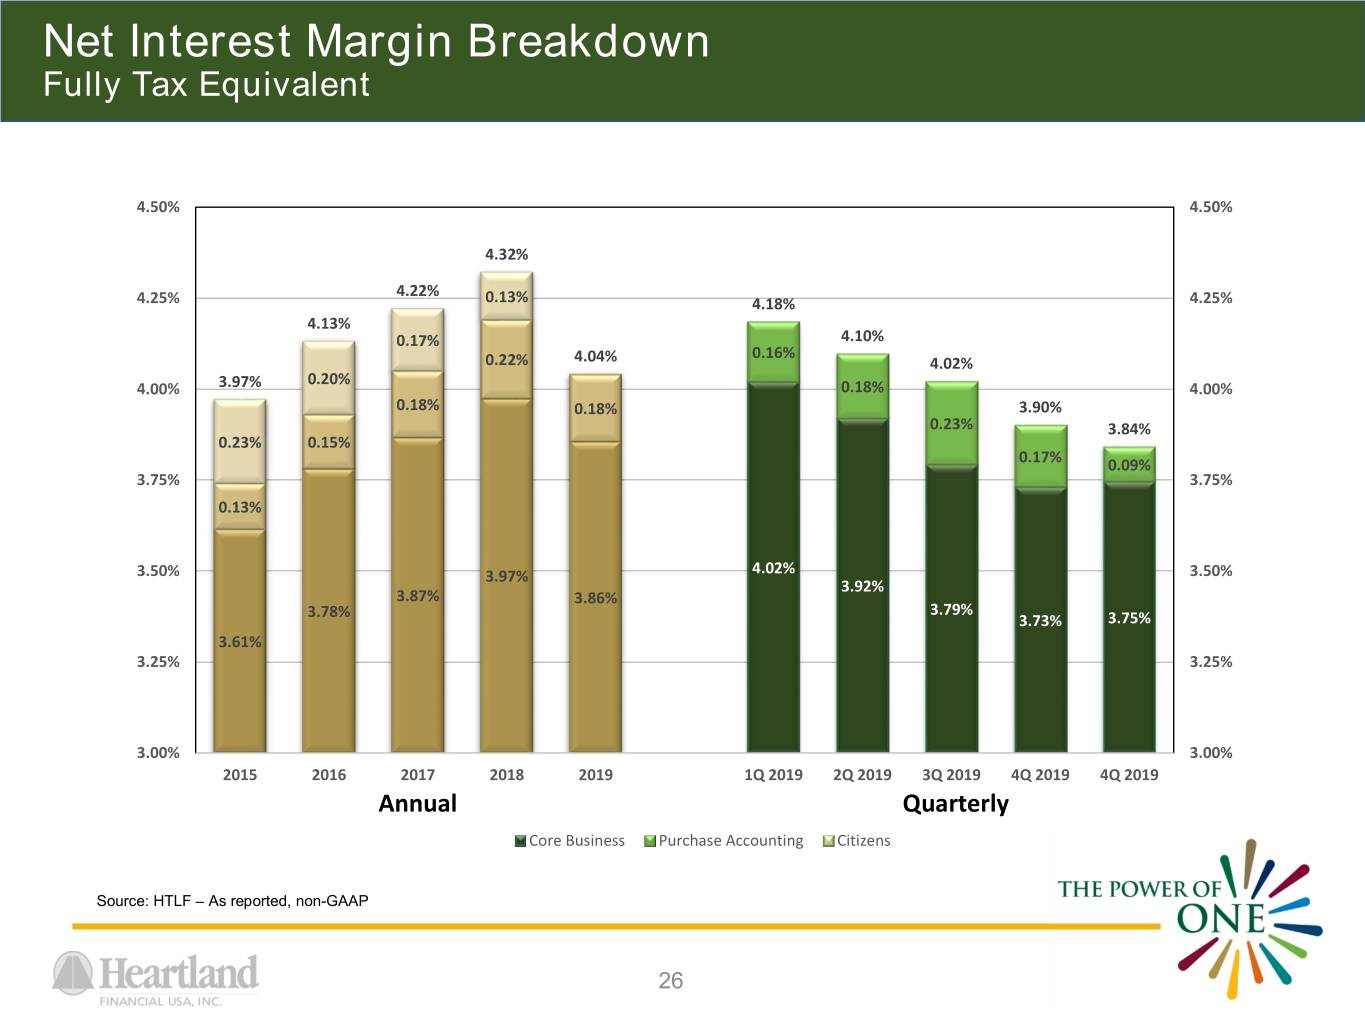
Net Interest Margin Breakdown Fully Tax Equivalent 4.50% 4.50% 4.32% 4.22% 4.25% 0.13% 4.18% 4.25% 4.13% 0.17% 4.10% 0.16% 0.22% 4.04% 4.02% 0.20% 4.00% 3.97% 0.18% 4.00% 0.18% 0.18% 3.90% 0.23% 3.84% 0.23% 0.15% 0.17% 0.09% 3.75% 3.75% 0.13% 3.50% 3.97% 4.02% 3.50% 3.92% 3.87% 3.86% 3.78% 3.79% 3.73% 3.75% 3.61% 3.25% 3.25% 3.00% 3.00% 2015 2016 2017 2018 2019 1Q 2019 2Q 2019 3Q 2019 4Q 2019 4Q 2019 Annual Quarterly Core Business Purchase Accounting Citizens Source: HTLF – As reported, non-GAAP 26
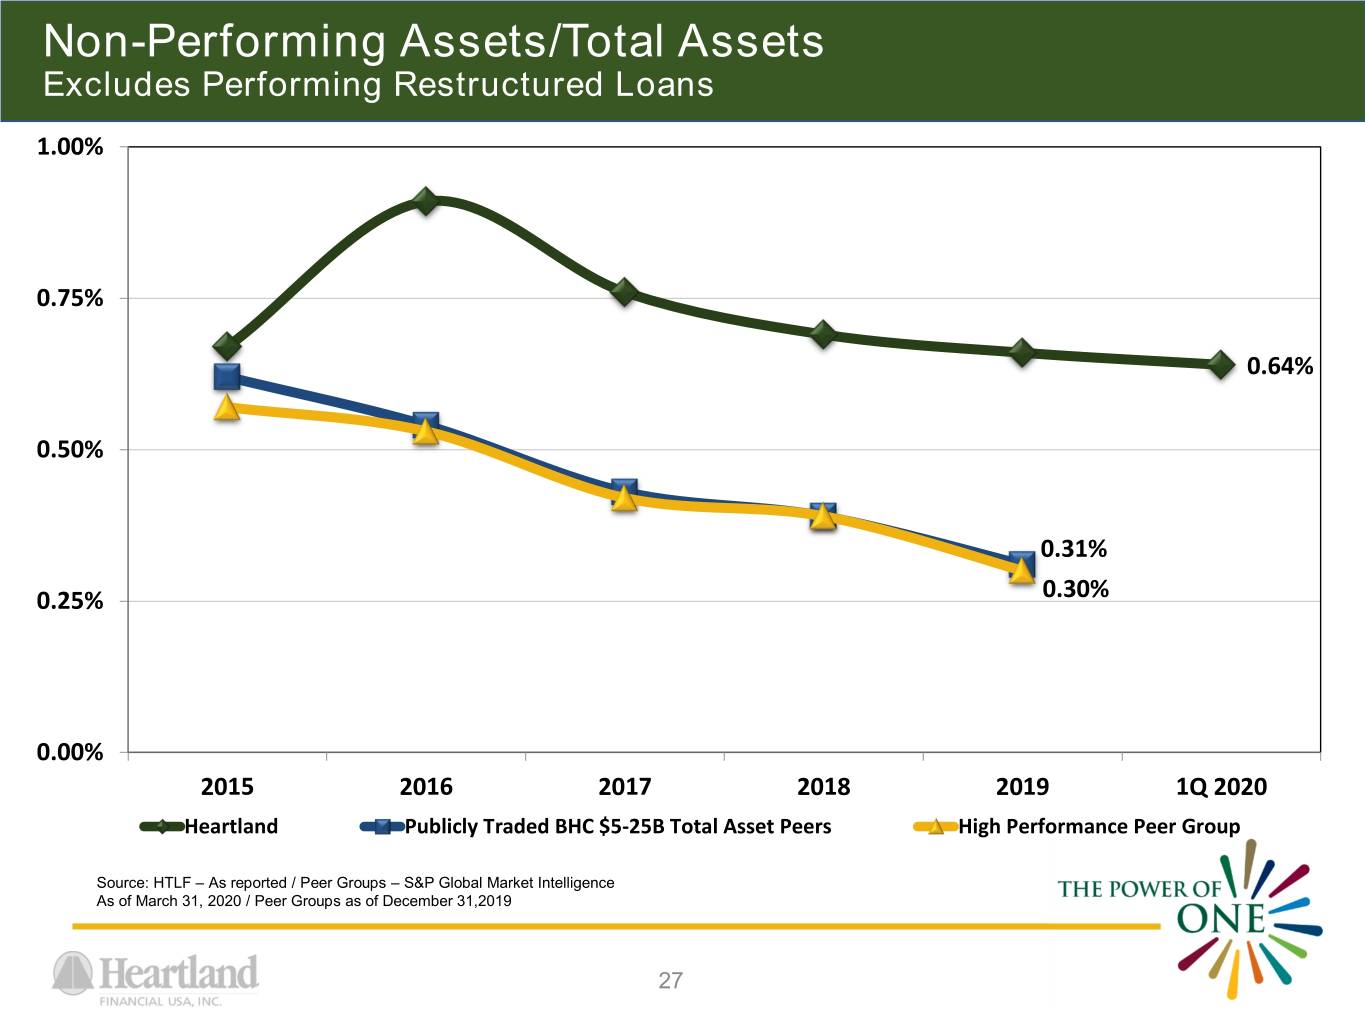
Non-Performing Assets/Total Assets Excludes Performing Restructured Loans 1.00% 0.75% 0.64% 0.50% 0.31% 0.25% 0.30% 0.00% 2015 2016 2017 2018 2019 1Q 2020 Heartland Publicly Traded BHC $5-25B Total Asset Peers High Performance Peer Group Source: HTLF – As reported / Peer Groups – S&P Global Market Intelligence As of March 31, 2020 / Peer Groups as of December 31,2019 27
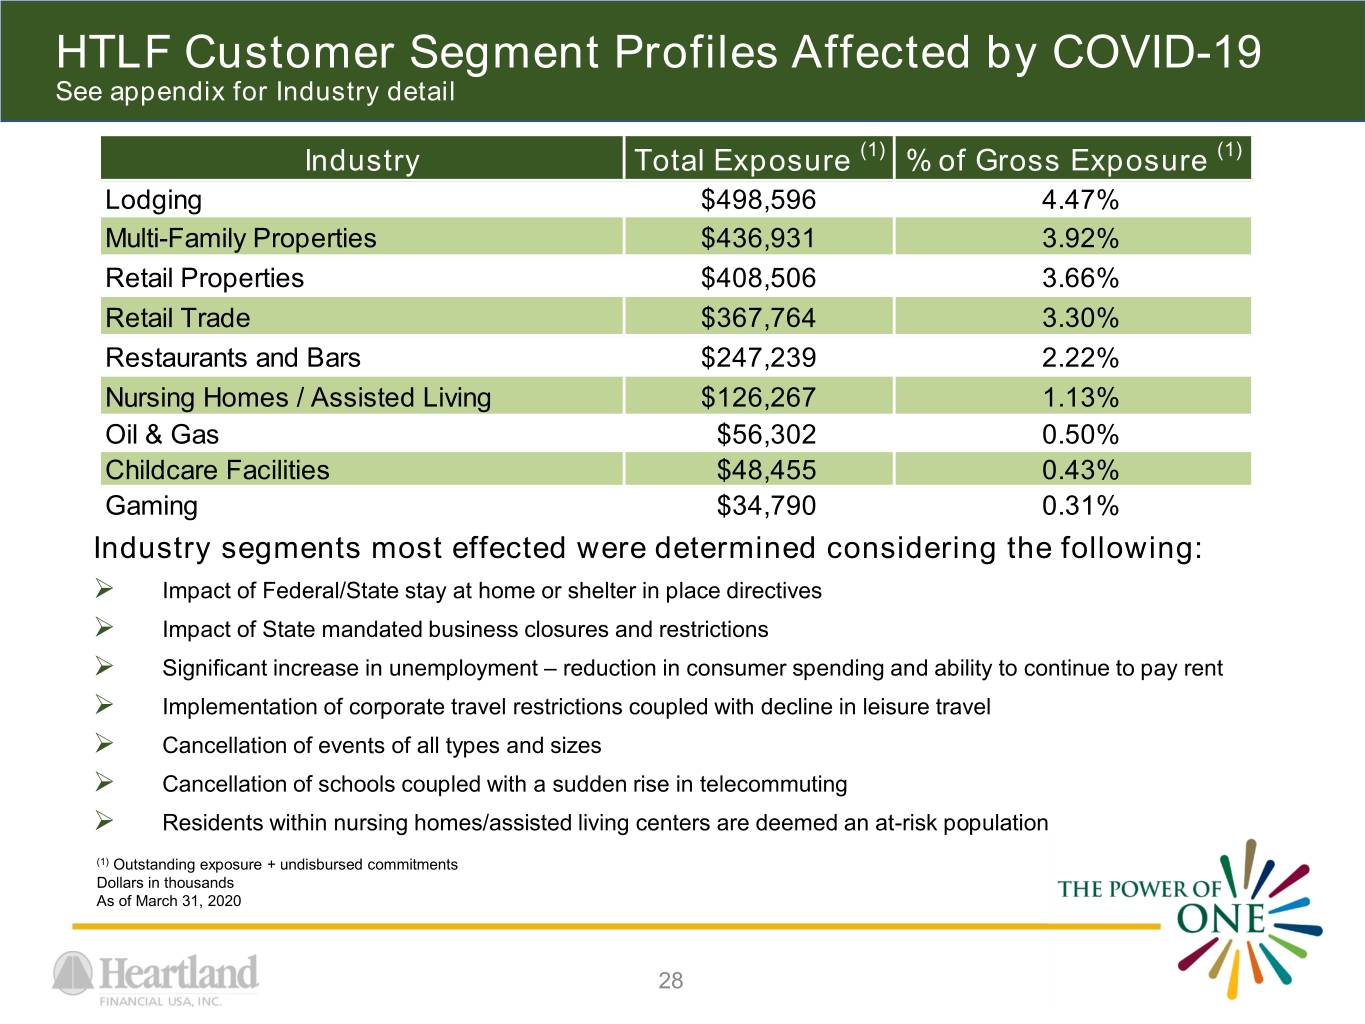
HTLF Customer Segment Profiles Affected by COVID-19 See appendix for Industry detail Industry Total Exposure (1) % of Gross Exposure (1) Lodging $498,596 4.47% Multi-Family Properties $436,931 3.92% Retail Properties $408,506 3.66% Retail Trade $367,764 3.30% Restaurants and Bars $247,239 2.22% Nursing Homes / Assisted Living $126,267 1.13% Oil & Gas $56,302 0.50% Childcare Facilities $48,455 0.43% Gaming $34,790 0.31% Industry segments most effected were determined considering the following: Impact of Federal/State stay at home or shelter in place directives Impact of State mandated business closures and restrictions Significant increase in unemployment – reduction in consumer spending and ability to continue to pay rent Implementation of corporate travel restrictions coupled with decline in leisure travel Cancellation of events of all types and sizes Cancellation of schools coupled with a sudden rise in telecommuting Residents within nursing homes/assisted living centers are deemed an at-risk population (1) Outstanding exposure + undisbursed commitments Dollars in thousands As of March 31, 2020 28
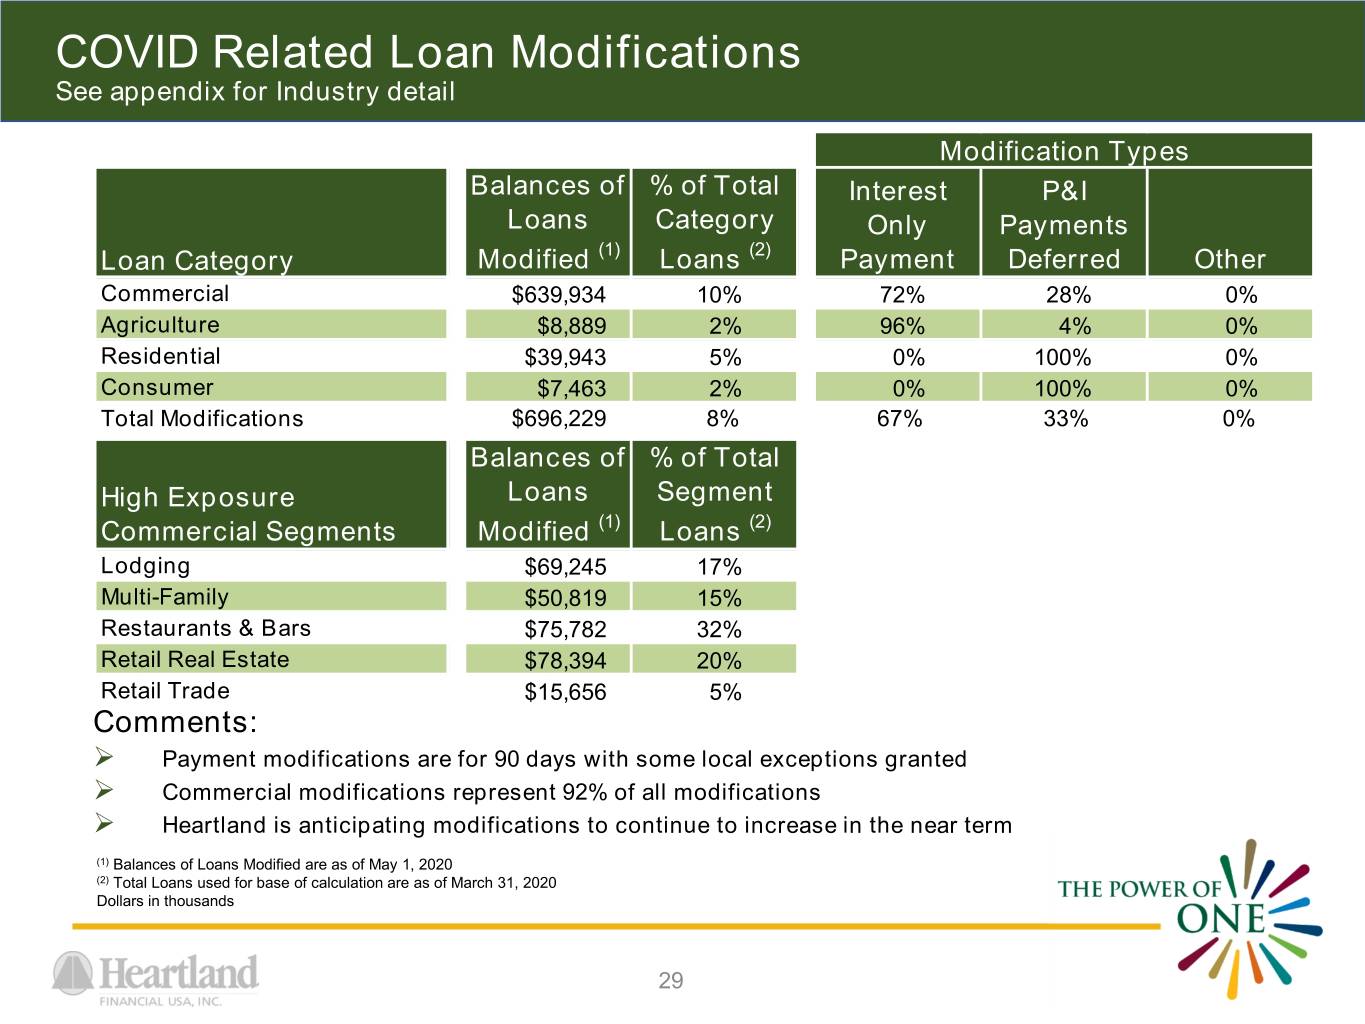
COVID Related Loan Modifications See appendix for Industry detail Modification Types Balances of % of Total Interest P&I Loans Category Only Payments Loan Category Modified (1) Loans (2) Payment Deferred Other Commercial $639,934 10% 72% 28% 0% Agriculture $8,889 2% 96% 4% 0% Residential $39,943 5% 0% 100% 0% Consumer $7,463 2% 0% 100% 0% Total Modifications $696,229 8% 67% 33% 0% Balances of % of Total High Exposure Loans Segment Commercial Segments Modified (1) Loans (2) Lodging $69,245 17% Multi-Family $50,819 15% Restaurants & Bars $75,782 32% Retail Real Estate $78,394 20% Retail Trade $15,656 5% Comments: Payment modifications are for 90 days with some local exceptions granted Commercial modifications represent 92% of all modifications Heartland is anticipating modifications to continue to increase in the near term (1) Balances of Loans Modified are as of May 1, 2020 (2) Total Loans used for base of calculation are as of March 31, 2020 Dollars in thousands 29
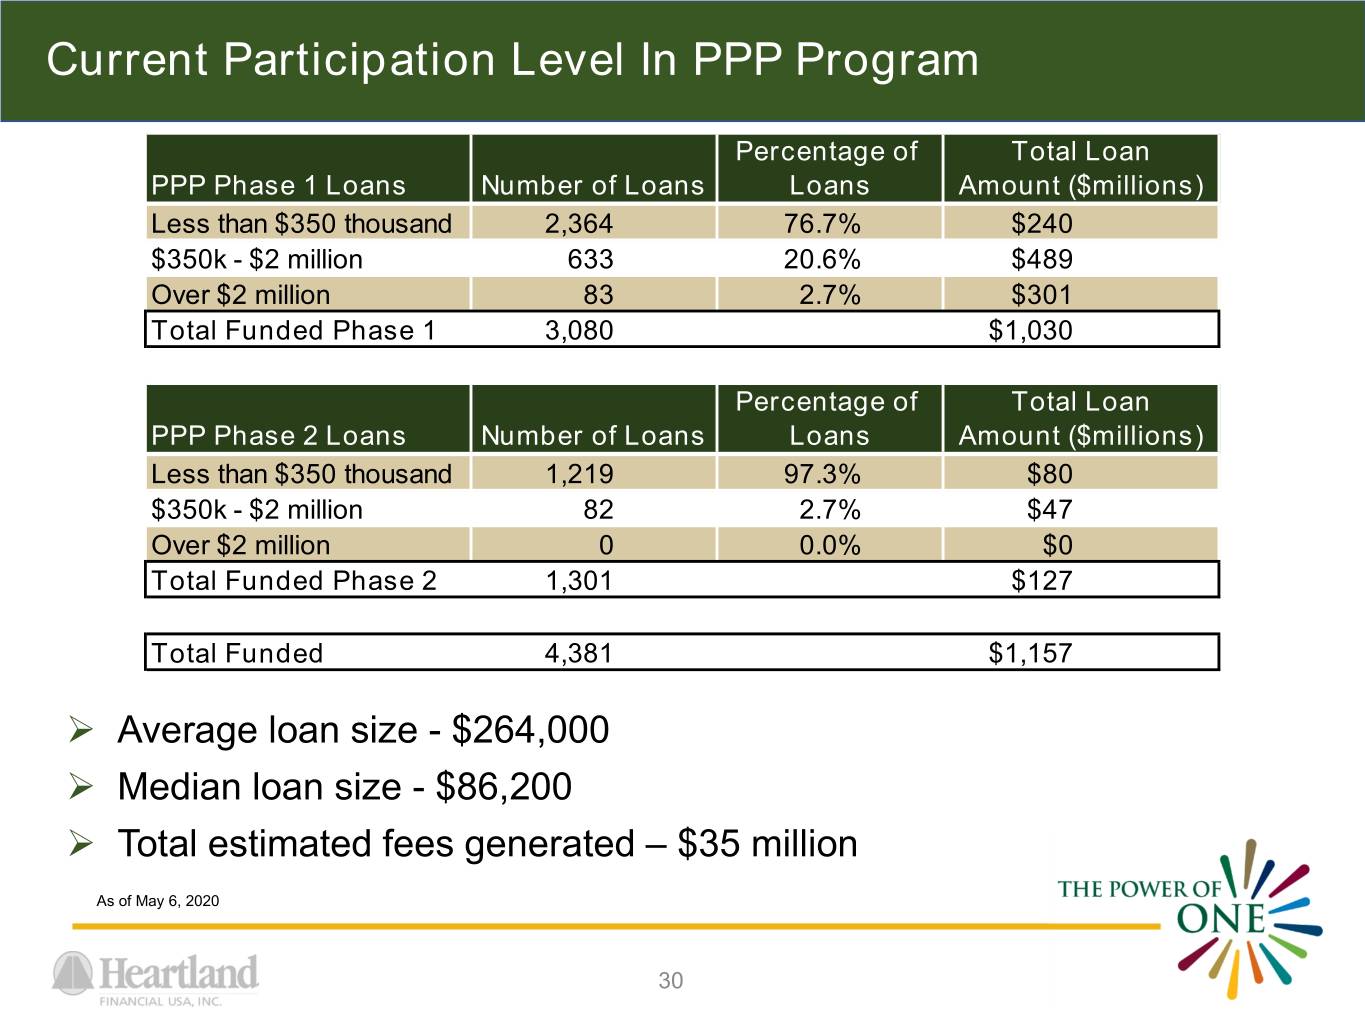
Current Participation Level In PPP Program Percentage of Total Loan PPP Phase 1 Loans Number of Loans Loans Amount ($millions) Less than $350 thousand 2,364 76.7% $240 $350k - $2 million 633 20.6% $489 Over $2 million 83 2.7% $301 Total Funded Phase 1 3,080 $1,030 Percentage of Total Loan PPP Phase 2 Loans Number of Loans Loans Amount ($millions) Less than $350 thousand 1,219 97.3% $80 $350k - $2 million 82 2.7% $47 Over $2 million 0 0.0% $0 Total Funded Phase 2 1,301 $127 Total Funded 4,381 $1,157 Average loan size - $264,000 Median loan size - $86,200 Total estimated fees generated – $35 million As of May 6, 2020 30
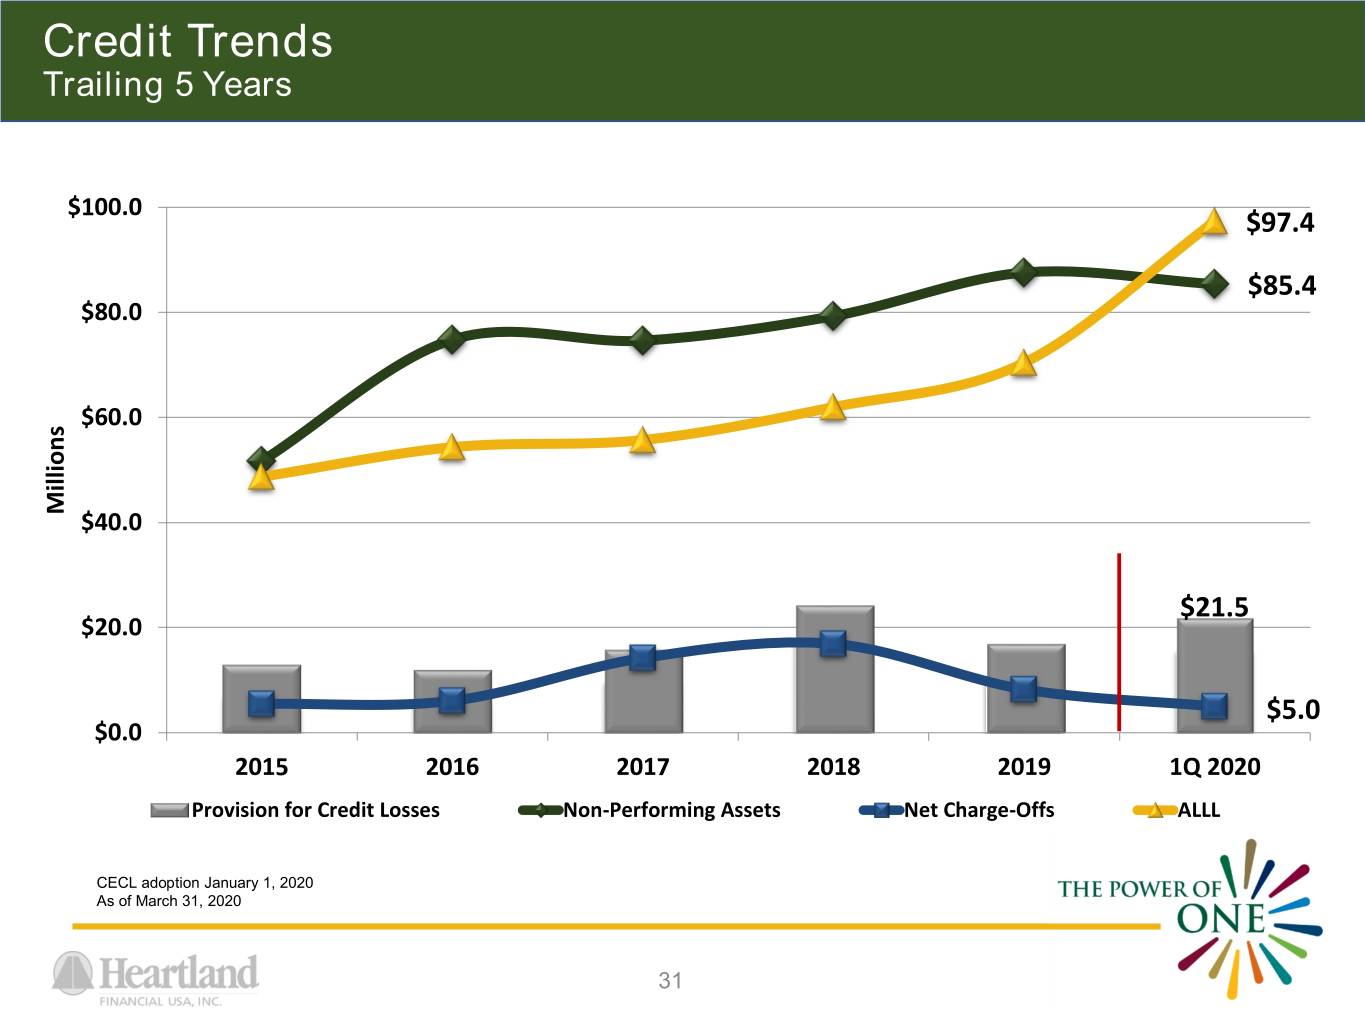
Credit Trends Trailing 5 Years $100.0 $97.4 $85.4 $80.0 $60.0 Millions $40.0 $21.5 $20.0 $5.0 $0.0 2015 2016 2017 2018 2019 1Q 2020 Provision for Credit Losses Non-Performing Assets Net Charge-Offs ALLL CECL adoption January 1, 2020 As of March 31, 2020 31
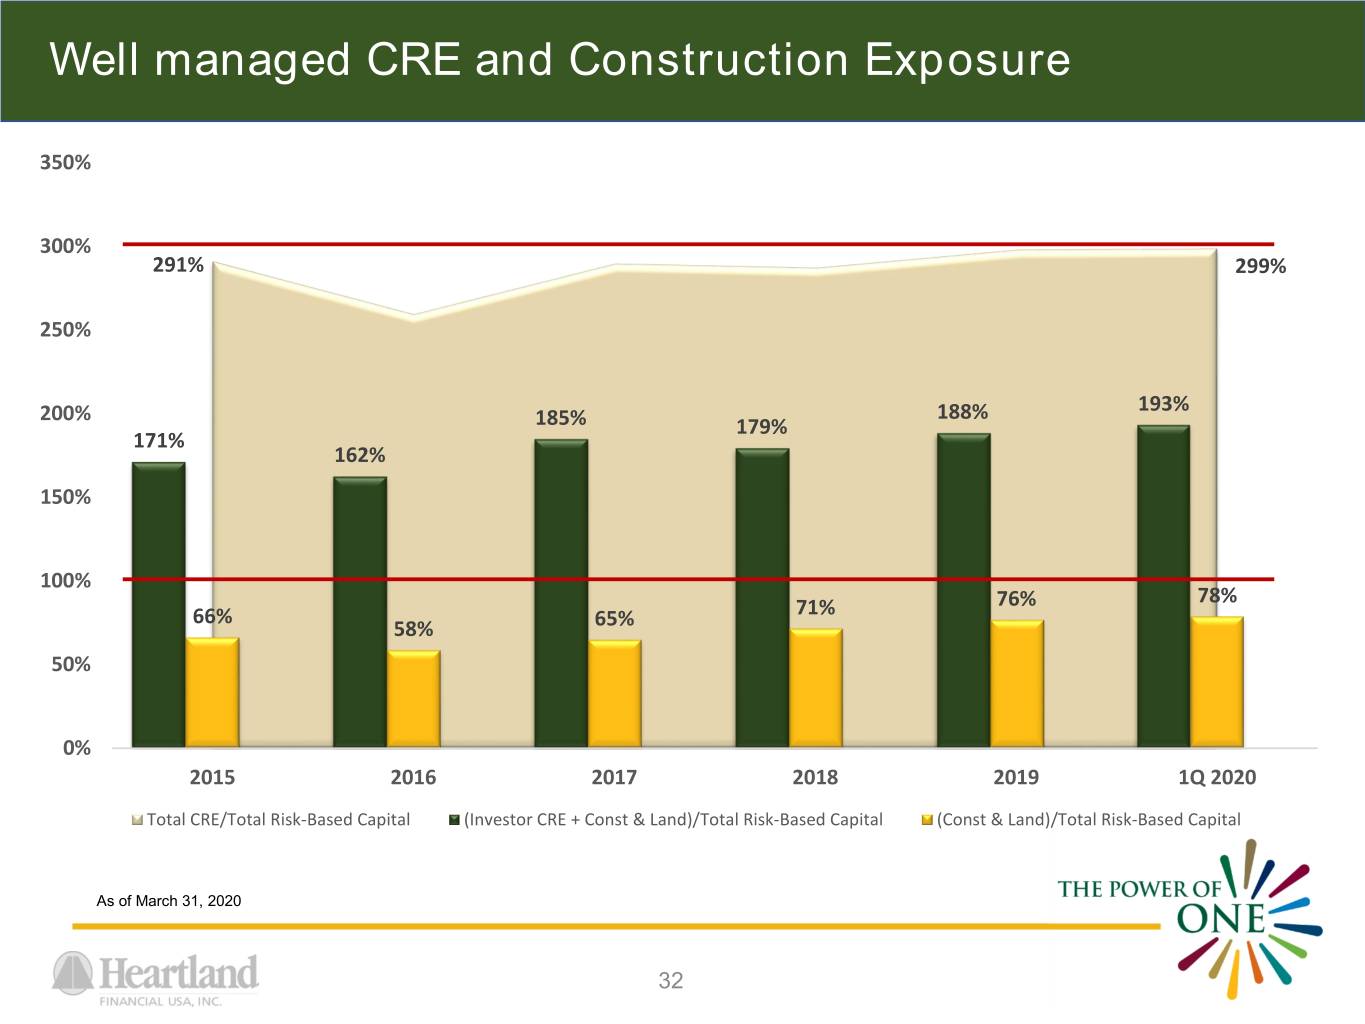
Well managed CRE and Construction Exposure 350% 300% 291% 299% 250% 200% 188% 193% 185% 179% 171% 162% 150% 100% 76% 78% 66% 71% 58% 65% 50% 0% 2015 2016 2017 2018 2019 1Q 2020 Total CRE/Total Risk-Based Capital (Investor CRE + Const & Land)/Total Risk-Based Capital (Const & Land)/Total Risk-Based Capital As of March 31, 2020 32
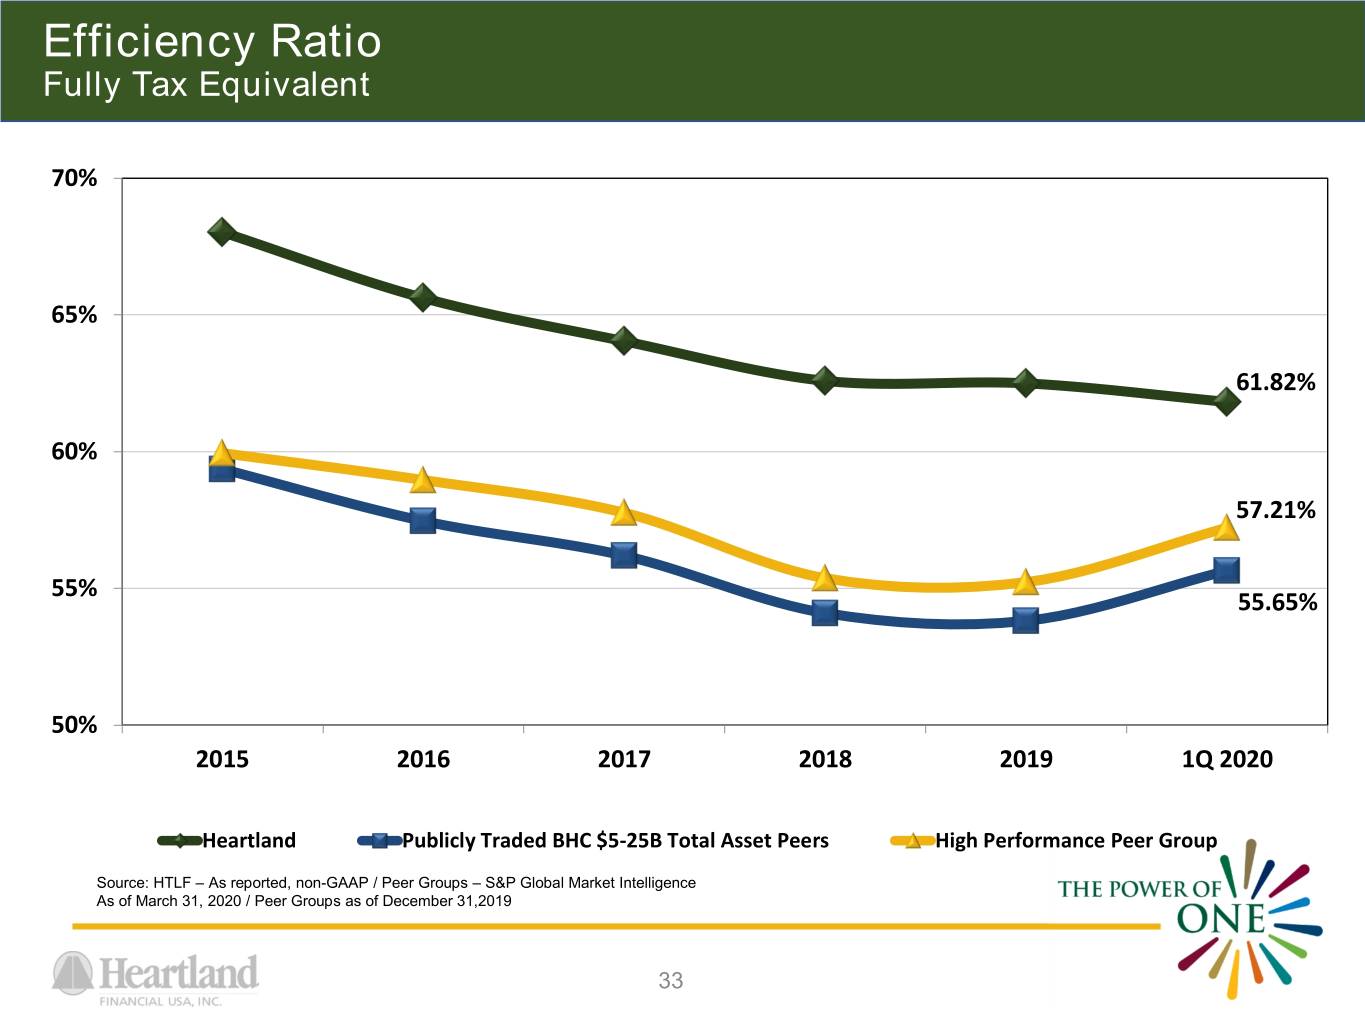
Efficiency Ratio Fully Tax Equivalent 70% 65% 61.82% 60% 57.21% 55% 55.65% 50% 2015 2016 2017 2018 2019 1Q 2020 Heartland Publicly Traded BHC $5-25B Total Asset Peers High Performance Peer Group Source: HTLF – As reported, non-GAAP / Peer Groups – S&P Global Market Intelligence As of March 31, 2020 / Peer Groups as of December 31,2019 33
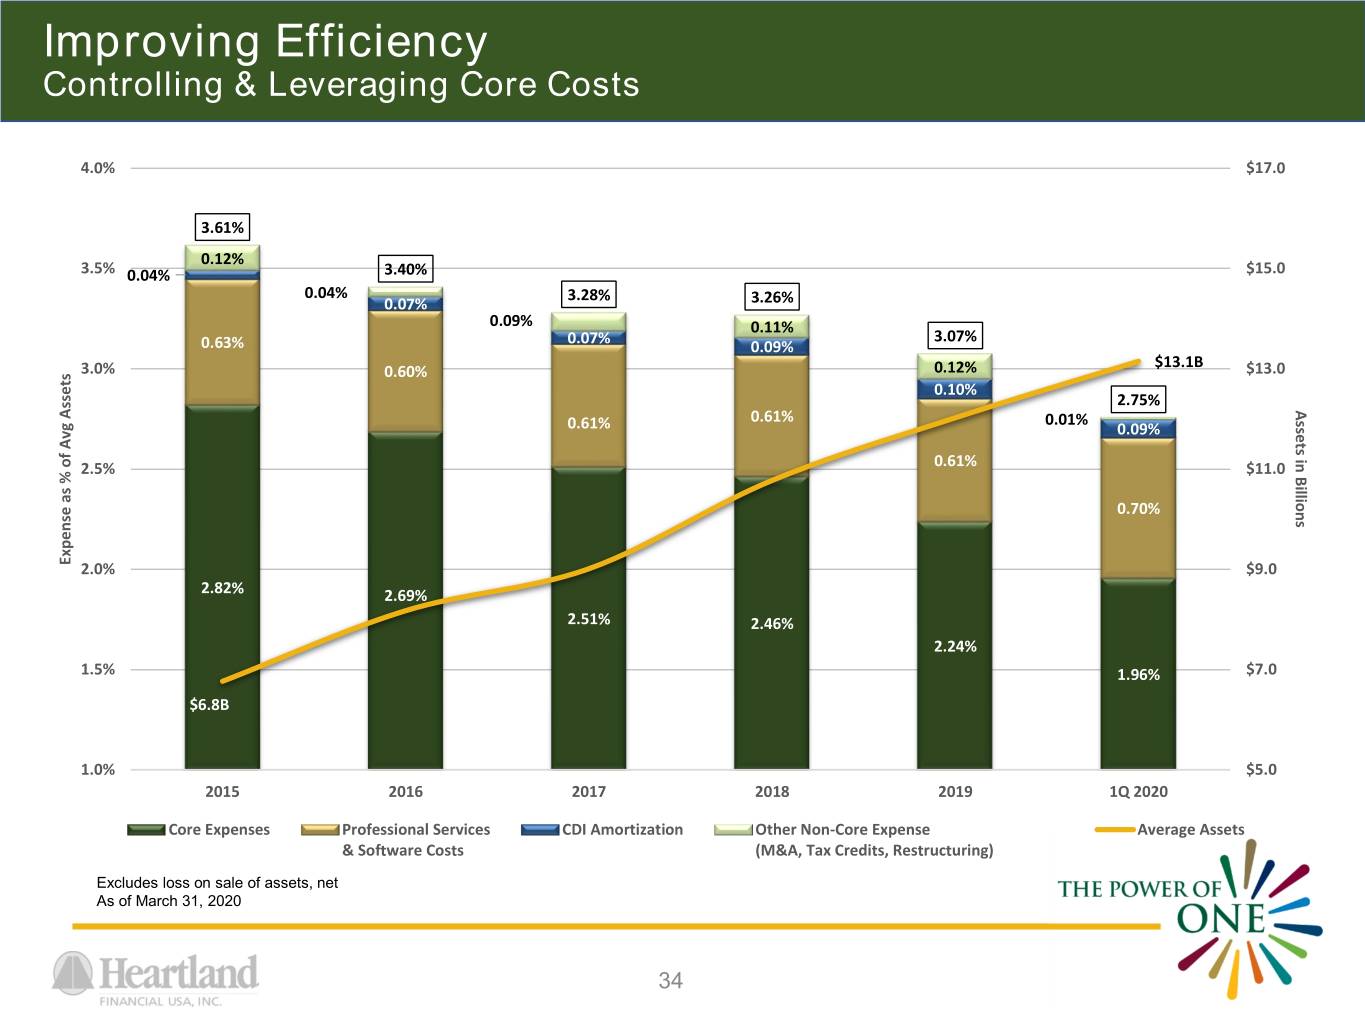
Improving Efficiency Controlling & Leveraging Core Costs 4.0% $17.0 3.61% 0.12% 3.5% 0.04% 3.40% $15.0 0.04% 3.28% 0.07% 3.26% 0.09% 0.11% 0.07% 3.07% 0.63% 0.09% $13.1B 3.0% 0.60% 0.12% $13.0 0.10% 2.75% Assets in BillionsAssetsin 0.61% 0.01% 0.61% 0.09% 2.5% 0.61% $11.0 0.70% Expense as % of Avg Avg of Assets % as Expense 2.0% $9.0 2.82% 2.69% 2.51% 2.46% 2.24% 1.5% 1.96% $7.0 $6.8B 1.0% $5.0 2015 2016 2017 2018 2019 1Q 2020 Core Expenses Professional Services CDI Amortization Other Non-Core Expense Average Assets & Software Costs (M&A, Tax Credits, Restructuring) Excludes loss on sale of assets, net As of March 31, 2020 34
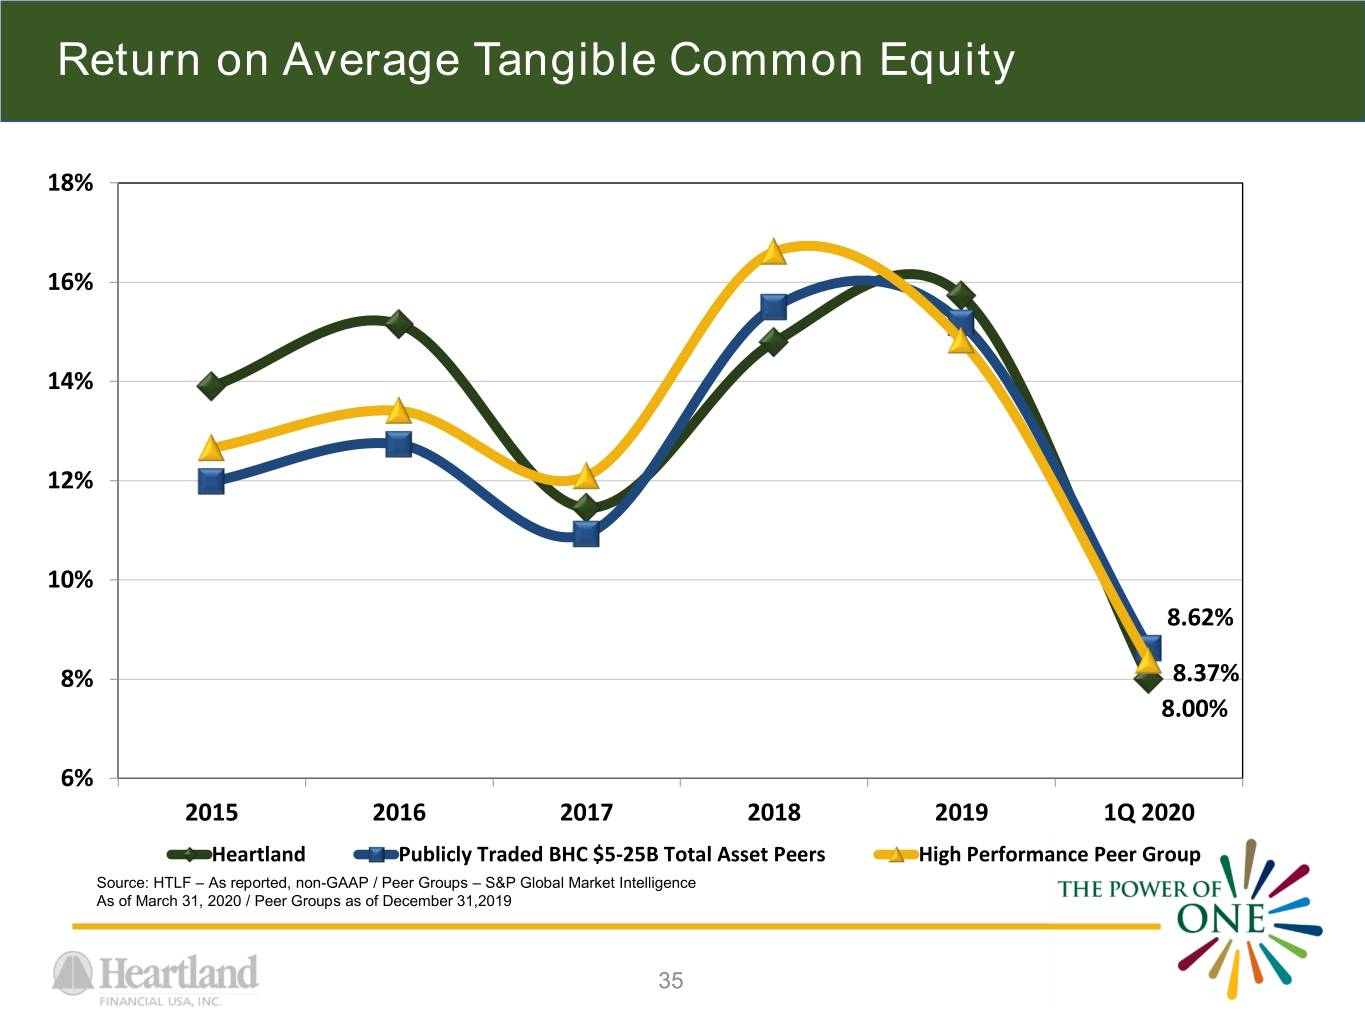
Return on Average Tangible Common Equity 18% 16% 14% 12% 10% 8.62% 8% 8.37% 8.00% 6% 2015 2016 2017 2018 2019 1Q 2020 Heartland Publicly Traded BHC $5-25B Total Asset Peers High Performance Peer Group Source: HTLF – As reported, non-GAAP / Peer Groups – S&P Global Market Intelligence As of March 31, 2020 / Peer Groups as of December 31,2019 35
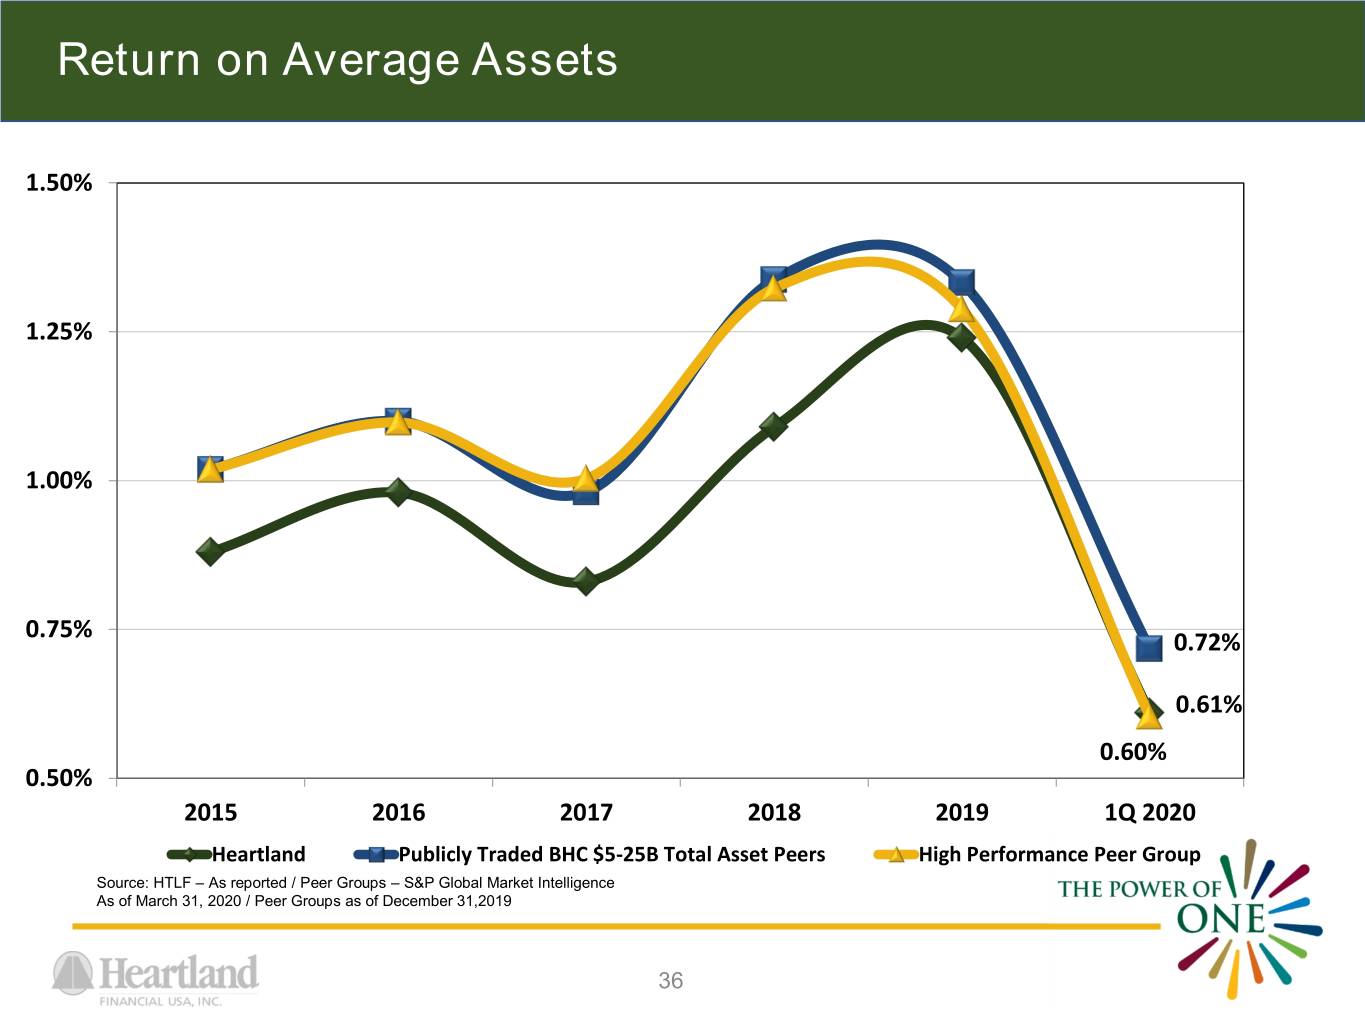
Return on Average Assets 1.50% 1.25% 1.00% 0.75% 0.72% 0.61% 0.60% 0.50% 2015 2016 2017 2018 2019 1Q 2020 Heartland Publicly Traded BHC $5-25B Total Asset Peers High Performance Peer Group Source: HTLF – As reported / Peer Groups – S&P Global Market Intelligence As of March 31, 2020 / Peer Groups as of December 31,2019 36
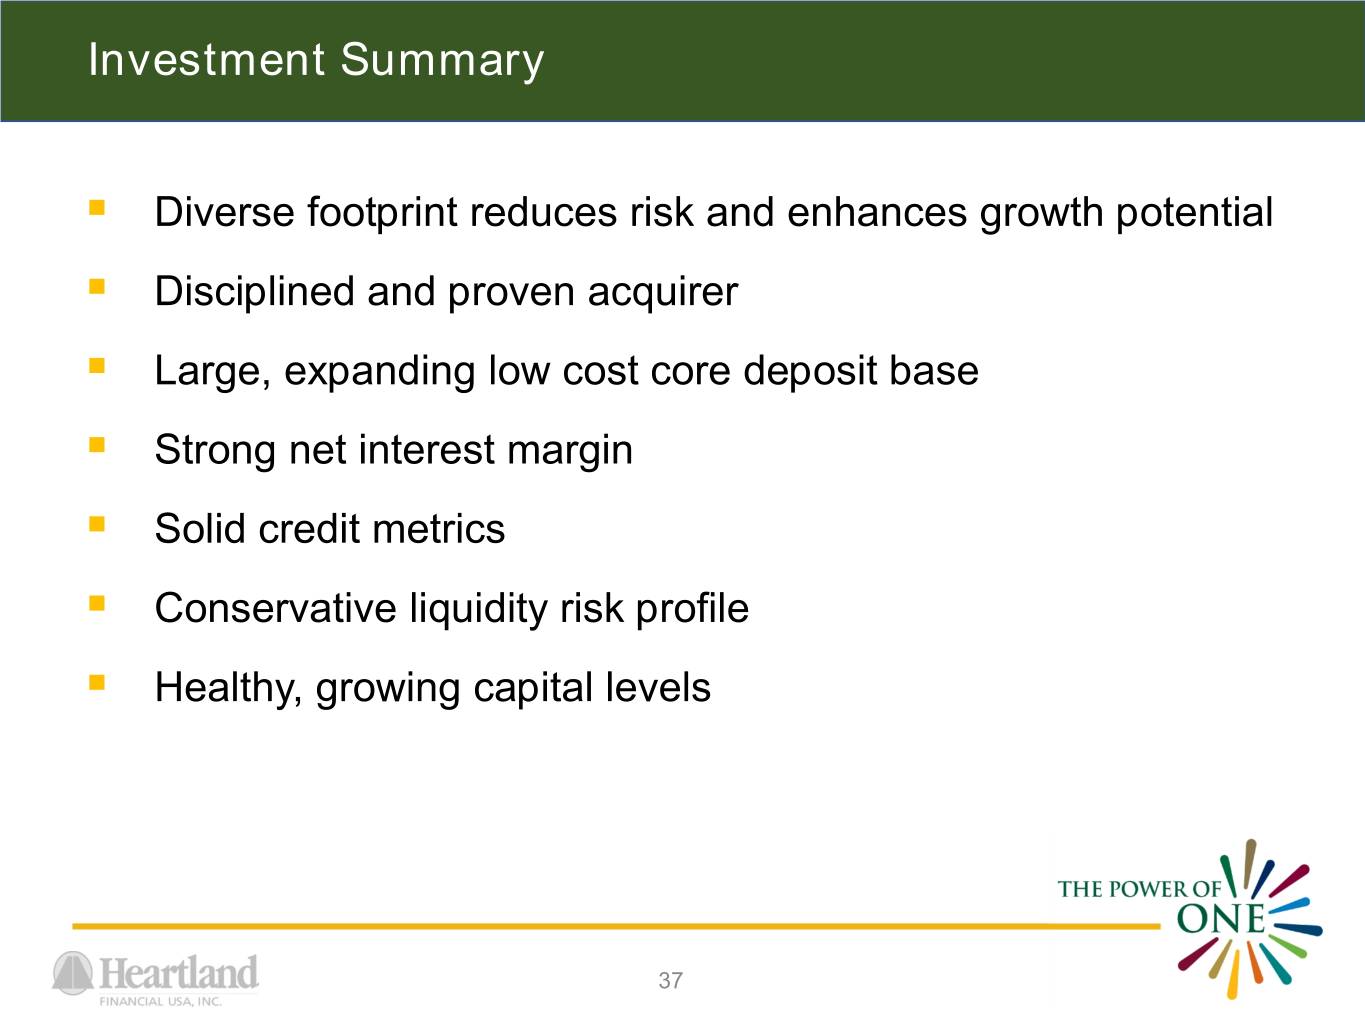
Investment Summary . Diverse footprint reduces risk and enhances growth potential . Disciplined and proven acquirer . Large, expanding low cost core deposit base . Strong net interest margin . Solid credit metrics . Conservative liquidity risk profile . Healthy, growing capital levels 37
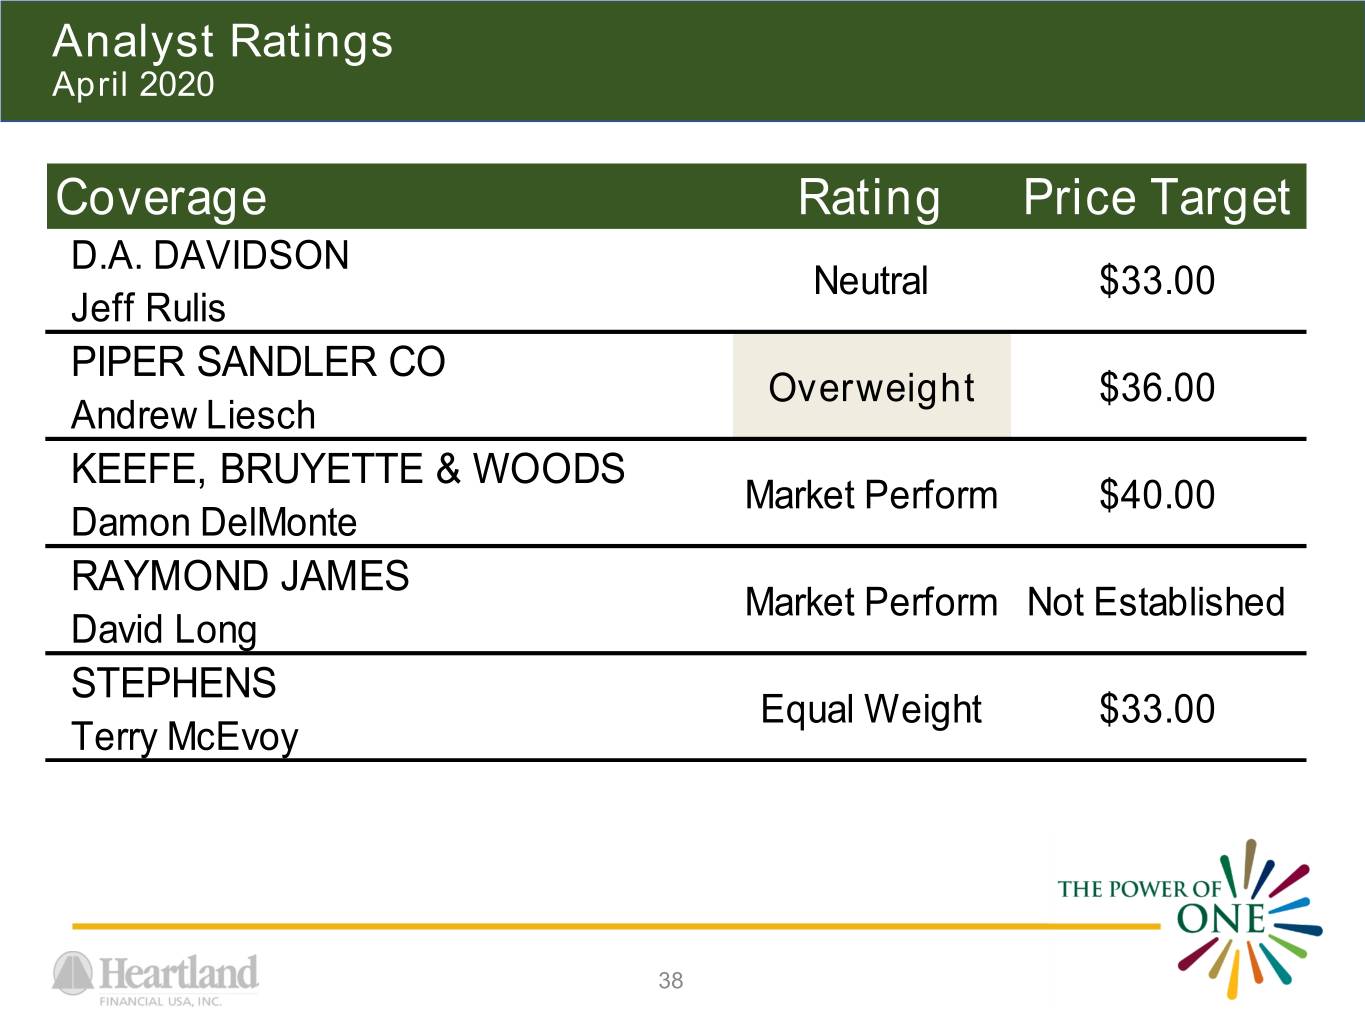
Analyst Ratings April 2020 Coverage Rating Price Target D.A. DAVIDSON Neutral $33.00 Jeff Rulis PIPER SANDLER CO Overweight $36.00 Andrew Liesch KEEFE, BRUYETTE & WOODS Market Perform $40.00 Damon DelMonte RAYMOND JAMES Market Perform Not Established David Long STEPHENS Equal Weight $33.00 Terry McEvoy 38

Contact Information 39
APPENDIX 40
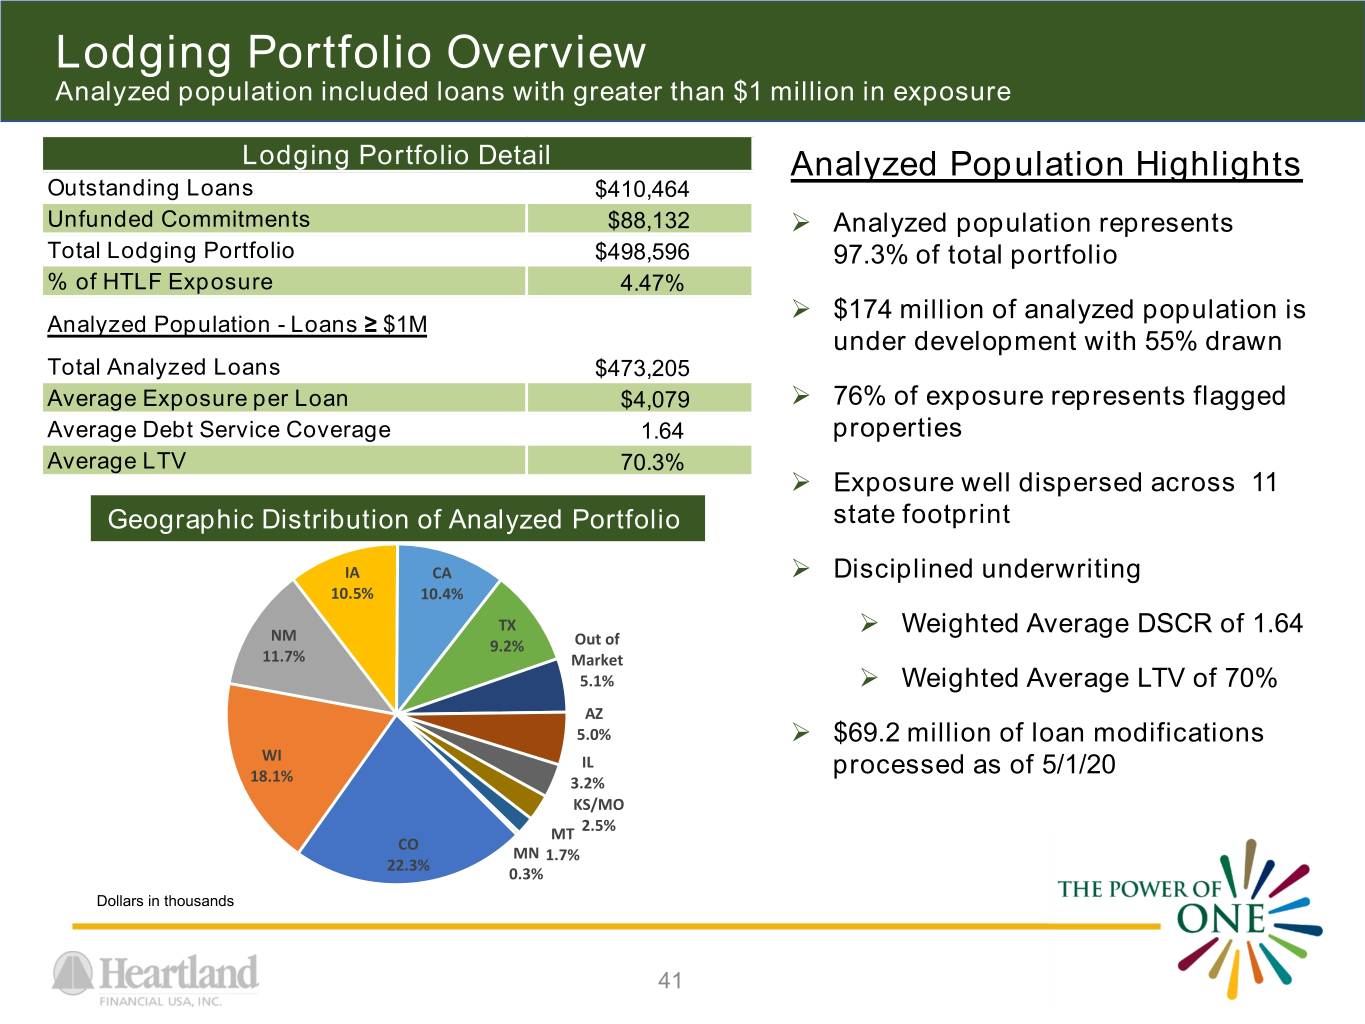
Lodging Portfolio Overview Analyzed population included loans with greater than $1 million in exposure Lodging Portfolio Detail Analyzed Population Highlights Outstanding Loans $410,464 Unfunded Commitments $88,132 Analyzed population represents Total Lodging Portfolio $498,596 97.3% of total portfolio % of HTLF Exposure 4.47% $174 million of analyzed population is Analyzed Population - Loans ≥ $1M under development with 55% drawn Total Analyzed Loans $473,205 Average Exposure per Loan $4,079 76% of exposure represents flagged Average Debt Service Coverage 1.64 properties Average LTV 70.3% Exposure well dispersed across 11 Geographic Distribution of Analyzed Portfolio state footprint IA CA Disciplined underwriting 10.5% 10.4% TX NM Weighted Average DSCR of 1.64 9.2% Out of 11.7% Market 5.1% Weighted Average LTV of 70% AZ 5.0% $69.2 million of loan modifications WI IL processed as of 5/1/20 18.1% 3.2% KS/MO MT 2.5% CO MN 1.7% 22.3% 0.3% Dollars in thousands 41
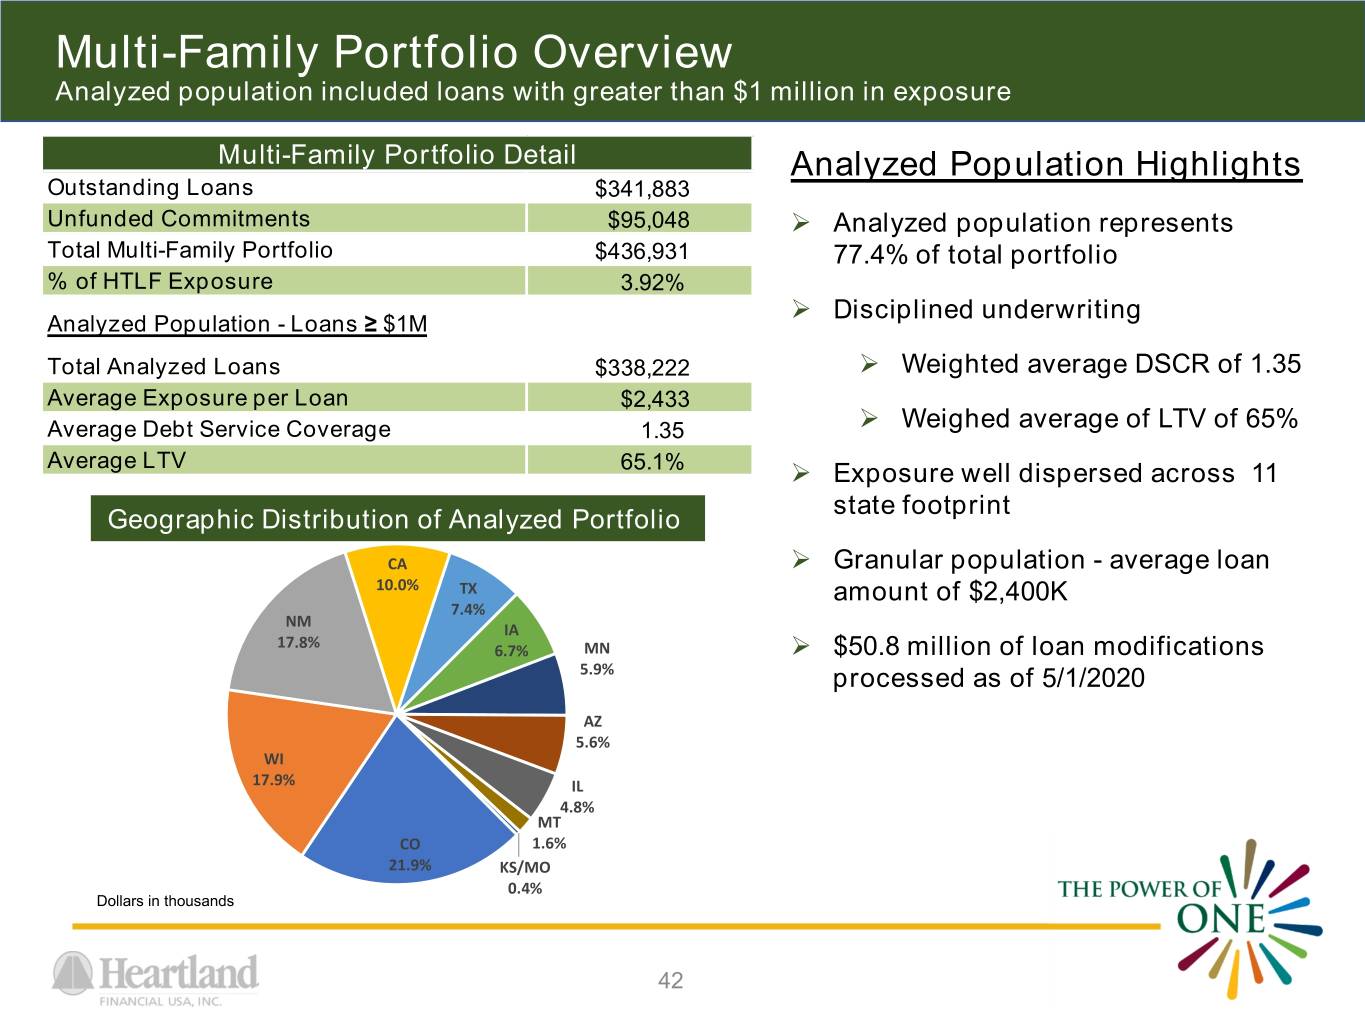
Multi-Family Portfolio Overview Analyzed population included loans with greater than $1 million in exposure Multi-Family Portfolio Detail Analyzed Population Highlights Outstanding Loans $341,883 Unfunded Commitments $95,048 Analyzed population represents Total Multi-Family Portfolio $436,931 77.4% of total portfolio % of HTLF Exposure 3.92% Disciplined underwriting Analyzed Population - Loans ≥ $1M Total Analyzed Loans $338,222 Weighted average DSCR of 1.35 Average Exposure per Loan $2,433 Average Debt Service Coverage 1.35 Weighed average of LTV of 65% Average LTV 65.1% Exposure well dispersed across 11 state footprint Geographic Distribution of Analyzed Portfolio CA Granular population - average loan 10.0% TX amount of $2,400K 7.4% NM IA 17.8% 6.7% MN $50.8 million of loan modifications 5.9% processed as of 5/1/2020 AZ 5.6% WI 17.9% IL 4.8% MT CO 1.6% 21.9% KS/MO 0.4% Dollars in thousands 42
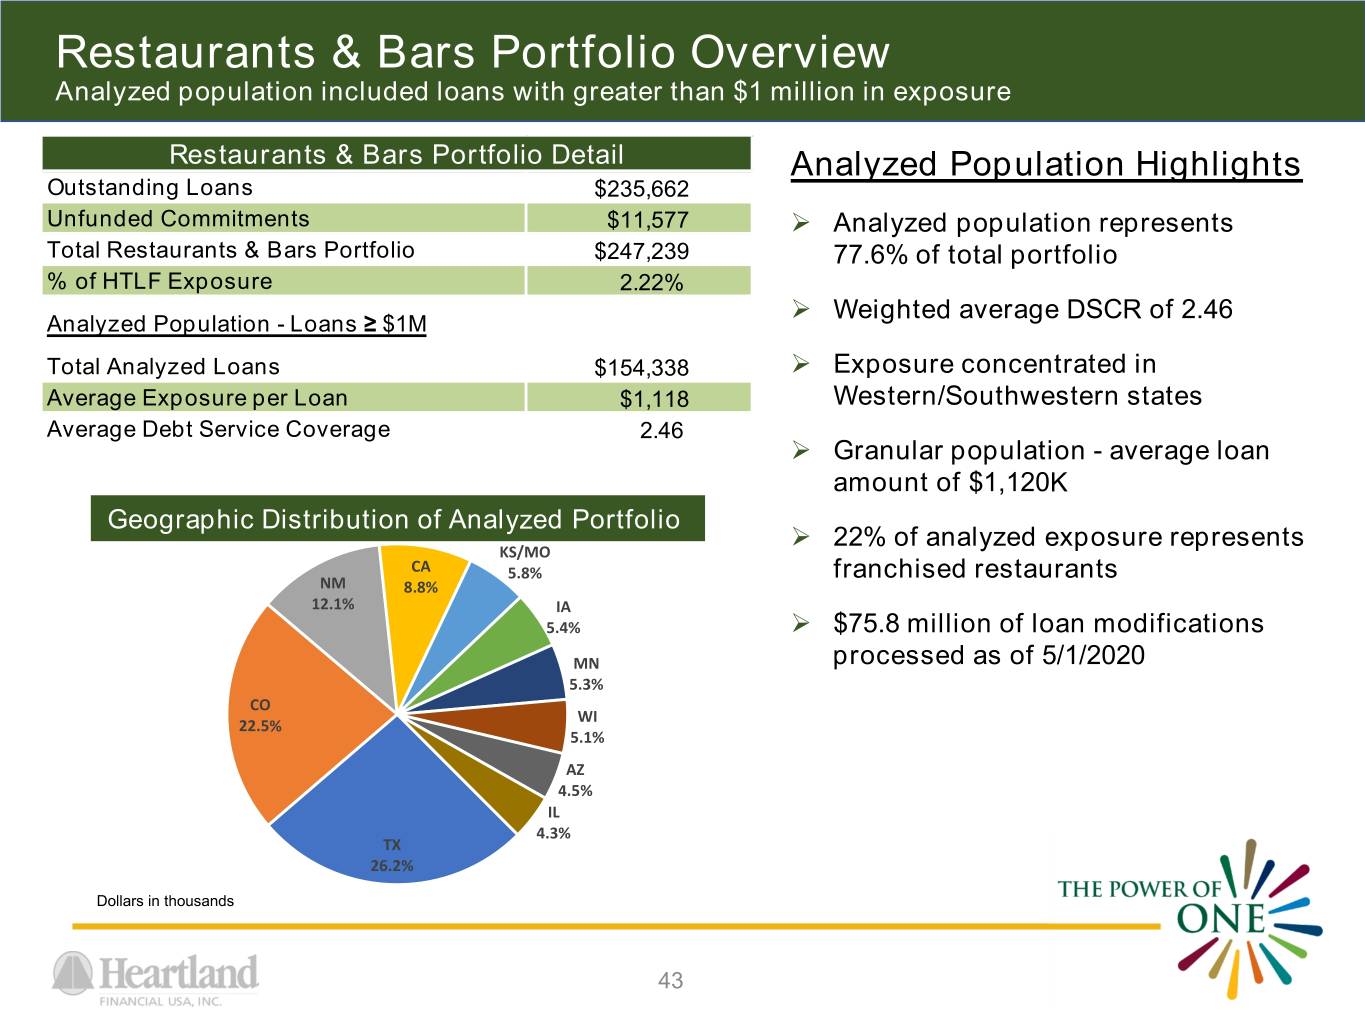
Restaurants & Bars Portfolio Overview Analyzed population included loans with greater than $1 million in exposure Restaurants & Bars Portfolio Detail Analyzed Population Highlights Outstanding Loans $235,662 Unfunded Commitments $11,577 Analyzed population represents Total Restaurants & Bars Portfolio $247,239 77.6% of total portfolio % of HTLF Exposure 2.22% Weighted average DSCR of 2.46 Analyzed Population - Loans ≥ $1M Total Analyzed Loans $154,338 Exposure concentrated in Average Exposure per Loan $1,118 Western/Southwestern states Average Debt Service Coverage 2.46 Granular population - average loan amount of $1,120K Geographic Distribution of Analyzed Portfolio 22% of analyzed exposure represents KS/MO CA 5.8% franchised restaurants NM 8.8% 12.1% IA 5.4% $75.8 million of loan modifications MN processed as of 5/1/2020 5.3% CO WI 22.5% 5.1% AZ 4.5% IL 4.3% TX 26.2% Dollars in thousands 43
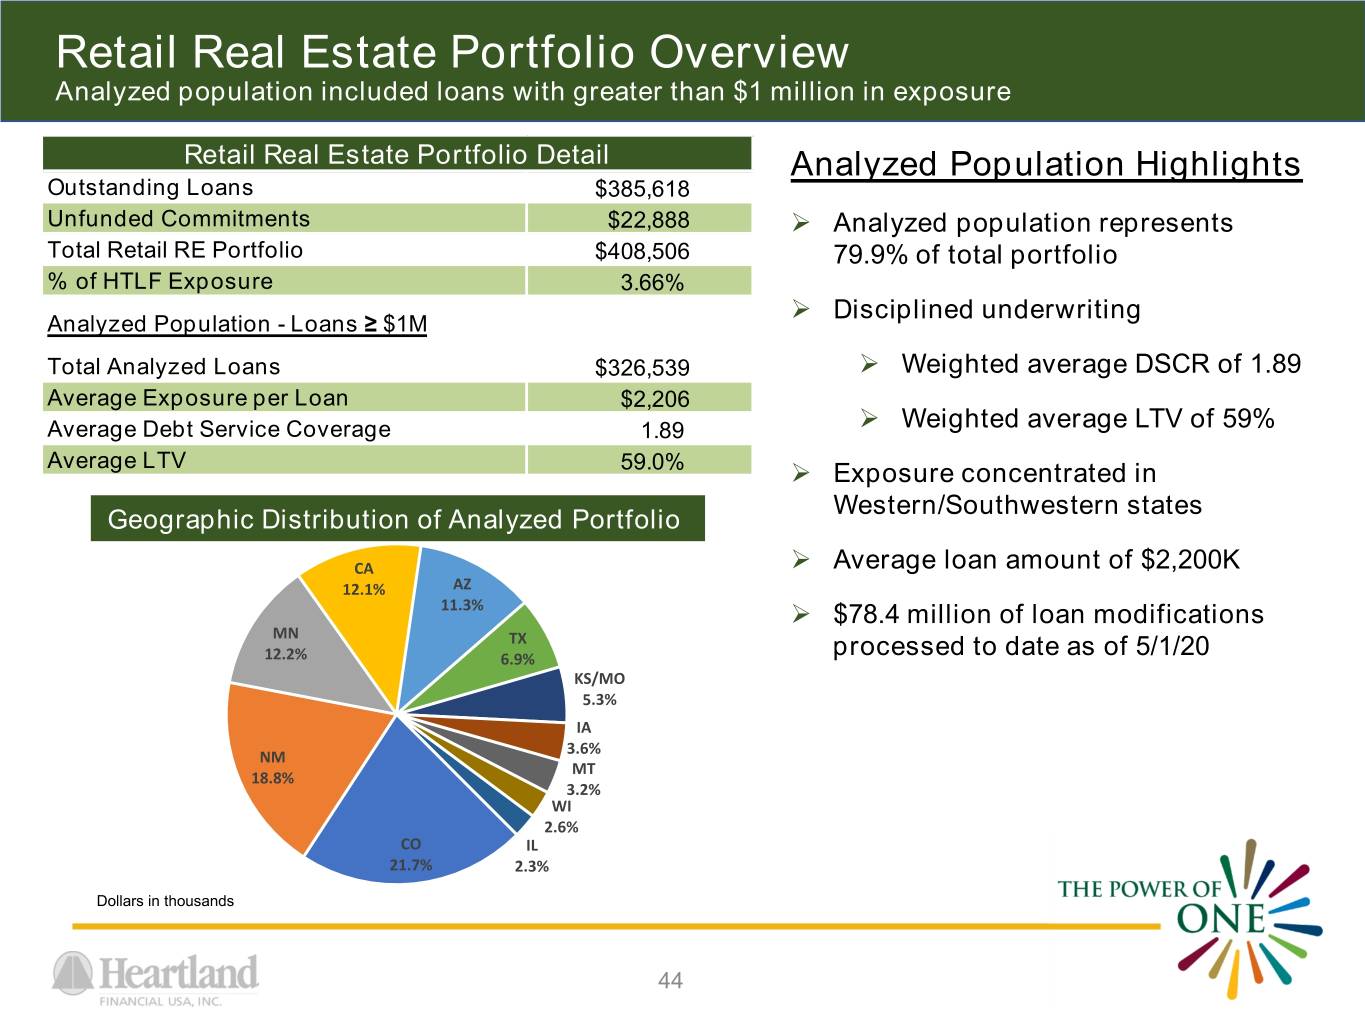
Retail Real Estate Portfolio Overview Analyzed population included loans with greater than $1 million in exposure Retail Real Estate Portfolio Detail Analyzed Population Highlights Outstanding Loans $385,618 Unfunded Commitments $22,888 Analyzed population represents Total Retail RE Portfolio $408,506 79.9% of total portfolio % of HTLF Exposure 3.66% Disciplined underwriting Analyzed Population - Loans ≥ $1M Total Analyzed Loans $326,539 Weighted average DSCR of 1.89 Average Exposure per Loan $2,206 Average Debt Service Coverage 1.89 Weighted average LTV of 59% Average LTV 59.0% Exposure concentrated in Western/Southwestern states Geographic Distribution of Analyzed Portfolio CA Average loan amount of $2,200K 12.1% AZ 11.3% $78.4 million of loan modifications MN TX 12.2% 6.9% processed to date as of 5/1/20 KS/MO 5.3% IA 3.6% NM MT 18.8% 3.2% WI 2.6% CO IL 21.7% 2.3% Dollars in thousands 44
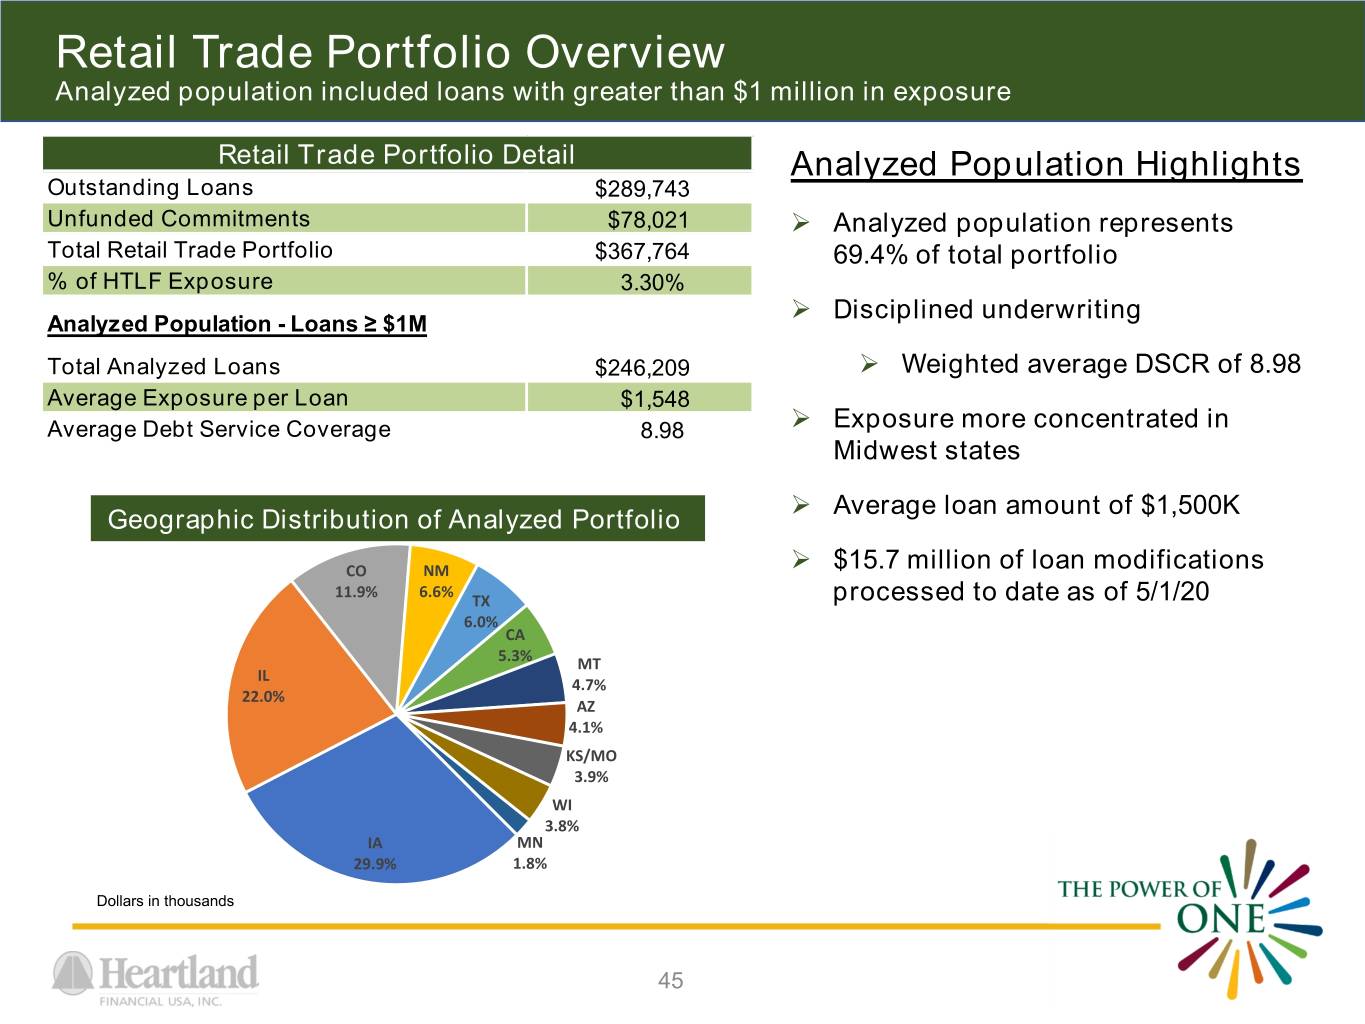
Retail Trade Portfolio Overview Analyzed population included loans with greater than $1 million in exposure Retail Trade Portfolio Detail Analyzed Population Highlights Outstanding Loans $289,743 Unfunded Commitments $78,021 Analyzed population represents Total Retail Trade Portfolio $367,764 69.4% of total portfolio % of HTLF Exposure 3.30% Disciplined underwriting Analyzed Population - Loans ≥ $1M Total Analyzed Loans $246,209 Weighted average DSCR of 8.98 Average Exposure per Loan $1,548 Average Debt Service Coverage 8.98 Exposure more concentrated in Midwest states Average loan amount of $1,500K Geographic Distribution of Analyzed Portfolio CO NM $15.7 million of loan modifications 11.9% 6.6% TX processed to date as of 5/1/20 6.0% CA 5.3% MT IL 4.7% 22.0% AZ 4.1% KS/MO 3.9% WI 3.8% IA MN 29.9% 1.8% Dollars in thousands 45
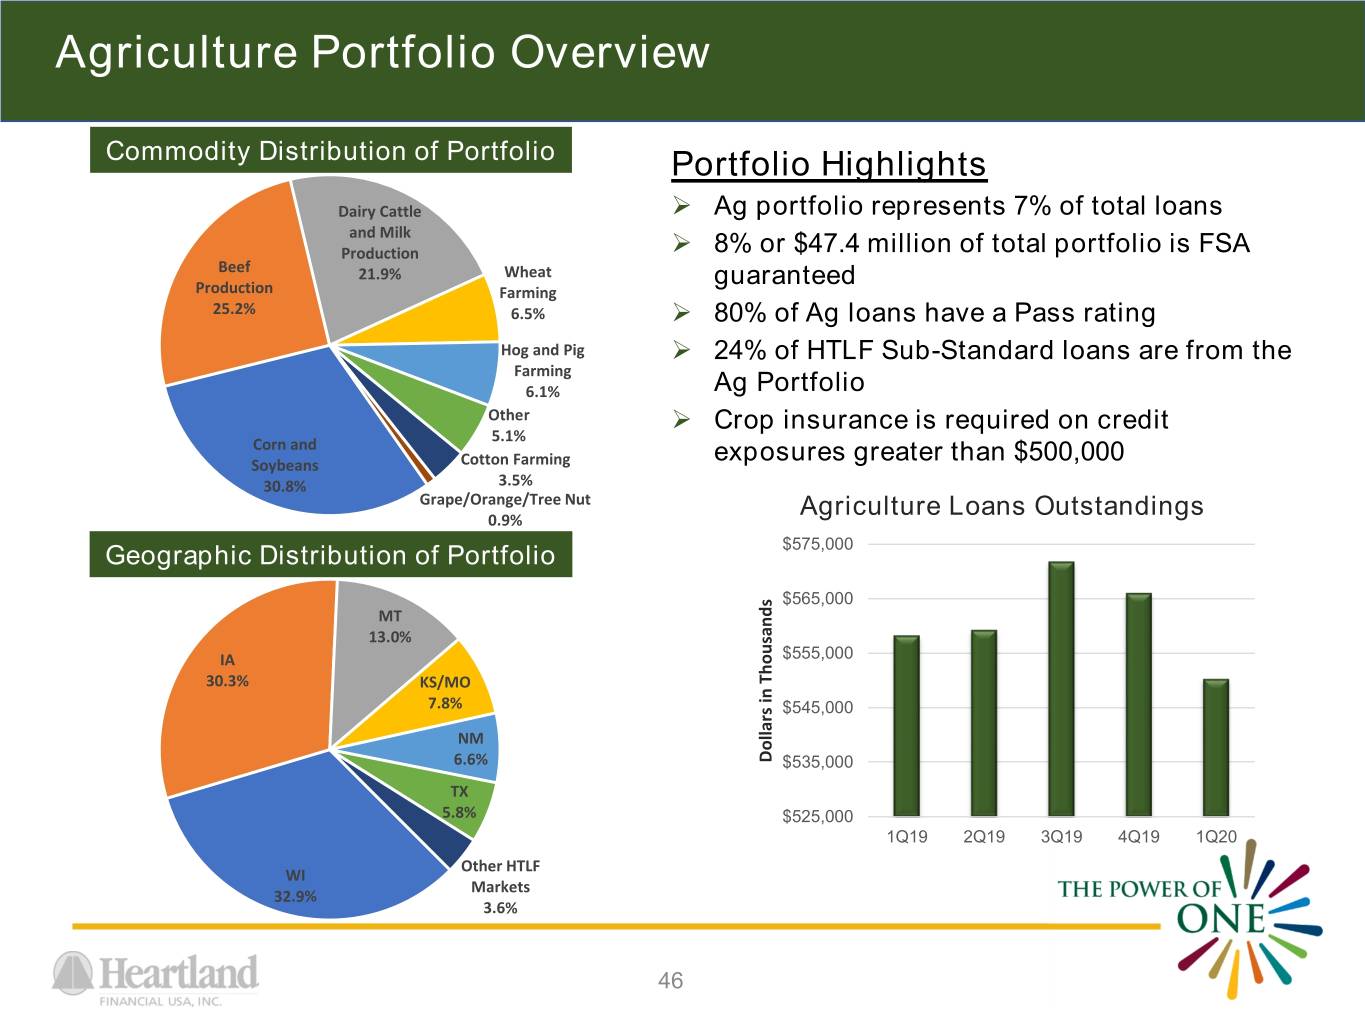
Agriculture Portfolio Overview Commodity Distribution of Portfolio Portfolio Highlights Dairy Cattle Ag portfolio represents 7% of total loans and Milk Production 8% or $47.4 million of total portfolio is FSA Beef 21.9% Wheat guaranteed Production Farming 25.2% 6.5% 80% of Ag loans have a Pass rating Hog and Pig 24% of HTLF Sub-Standard loans are from the Farming 6.1% Ag Portfolio Other Crop insurance is required on credit 5.1% Corn and exposures greater than $500,000 Soybeans Cotton Farming 30.8% 3.5% Grape/Orange/Tree Nut Agriculture Loans Outstandings 0.9% Geographic Distribution of Portfolio $575,000 $565,000 MT 13.0% IA $555,000 30.3% KS/MO 7.8% $545,000 NM 6.6% Dollars Thousands in $535,000 TX 5.8% $525,000 1Q19 2Q19 3Q19 4Q19 1Q20 Other HTLF WI Markets 32.9% 3.6% 46
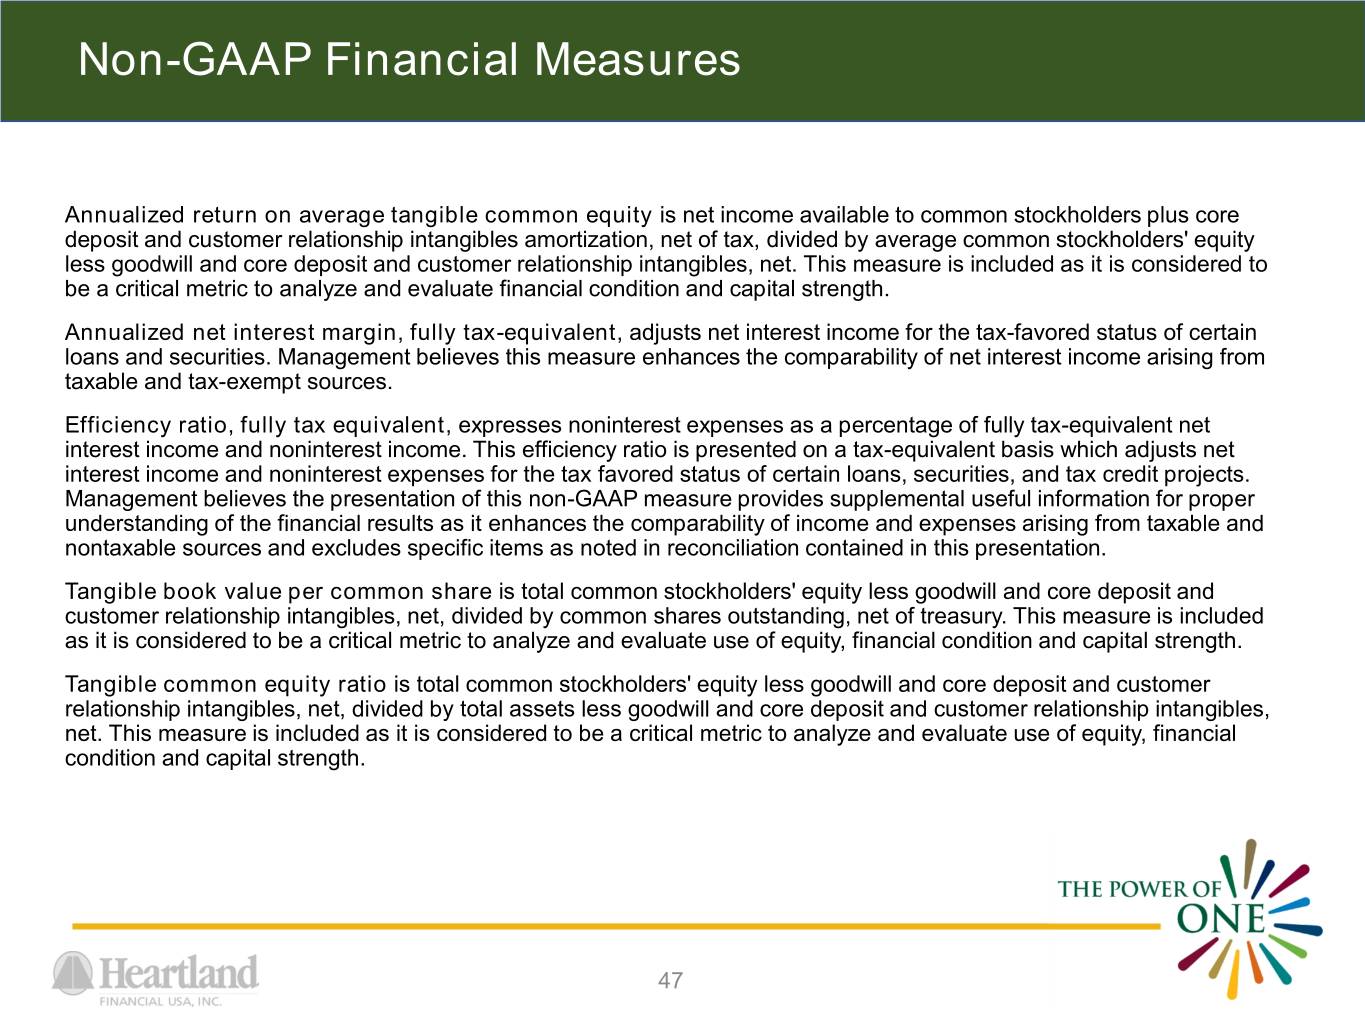
Non-GAAP Financial Measures Annualized return on average tangible common equity is net income available to common stockholders plus core deposit and customer relationship intangibles amortization, net of tax, divided by average common stockholders' equity less goodwill and core deposit and customer relationship intangibles, net. This measure is included as it is considered to be a critical metric to analyze and evaluate financial condition and capital strength. Annualized net interest margin, fully tax-equivalent, adjusts net interest income for the tax-favored status of certain loans and securities. Management believes this measure enhances the comparability of net interest income arising from taxable and tax-exempt sources. Efficiency ratio, fully tax equivalent, expresses noninterest expenses as a percentage of fully tax-equivalent net interest income and noninterest income. This efficiency ratio is presented on a tax-equivalent basis which adjusts net interest income and noninterest expenses for the tax favored status of certain loans, securities, and tax credit projects. Management believes the presentation of this non-GAAP measure provides supplemental useful information for proper understanding of the financial results as it enhances the comparability of income and expenses arising from taxable and nontaxable sources and excludes specific items as noted in reconciliation contained in this presentation. Tangible book value per common share is total common stockholders' equity less goodwill and core deposit and customer relationship intangibles, net, divided by common shares outstanding, net of treasury. This measure is included as it is considered to be a critical metric to analyze and evaluate use of equity, financial condition and capital strength. Tangible common equity ratio is total common stockholders' equity less goodwill and core deposit and customer relationship intangibles, net, divided by total assets less goodwill and core deposit and customer relationship intangibles, net. This measure is included as it is considered to be a critical metric to analyze and evaluate use of equity, financial condition and capital strength. 47
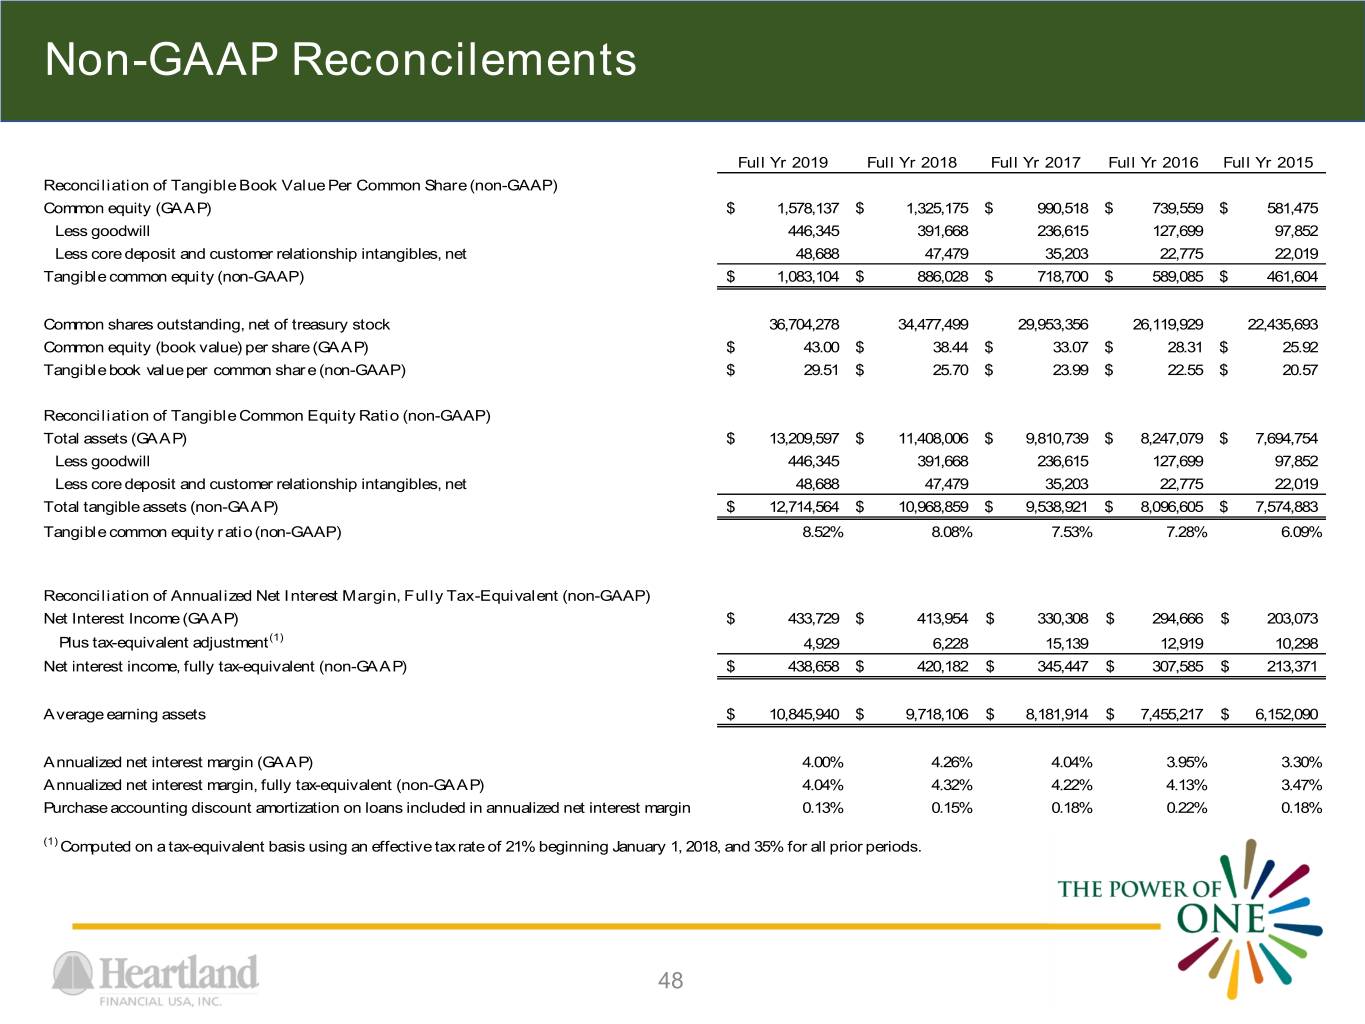
Non-GAAP Reconcilements Full Yr 2019 Full Yr 2018 Full Yr 2017 Full Yr 2016 Full Yr 2015 Reconciliation of Tangible Book Value Per Common Share (non-GAAP) Common equity (GAAP) $ 1,578,137 $ 1,325,175 $ 990,518 $ 739,559 $ 581,475 Less goodwill 446,345 391,668 236,615 127,699 97,852 Less core deposit and customer relationship intangibles, net 48,688 47,479 35,203 22,775 22,019 Tangible common equity (non-GAAP) $ 1,083,104 $ 886,028 $ 718,700 $ 589,085 $ 461,604 Common shares outstanding, net of treasury stock 36,704,278 34,477,499 29,953,356 26,119,929 22,435,693 Common equity (book value) per share (GAAP) $ 43.00 $ 38.44 $ 33.07 $ 28.31 $ 25.92 Tangible book value per common share (non-GAAP) $ 29.51 $ 25.70 $ 23.99 $ 22.55 $ 20.57 Reconciliation of Tangible Common Equity Ratio (non-GAAP) Total assets (GAAP) $ 13,209,597 $ 11,408,006 $ 9,810,739 $ 8,247,079 $ 7,694,754 Less goodwill 446,345 391,668 236,615 127,699 97,852 Less core deposit and customer relationship intangibles, net 48,688 47,479 35,203 22,775 22,019 Total tangible assets (non-GAAP) $ 12,714,564 $ 10,968,859 $ 9,538,921 $ 8,096,605 $ 7,574,883 Tangible common equity ratio (non-GAAP) 8.52% 8.08% 7.53% 7.28% 6.09% Reconciliation of Annualized Net Interest Margin, Fully Tax-Equivalent (non-GAAP) Net Interest Income (GAAP) $ 433,729 $ 413,954 $ 330,308 $ 294,666 $ 203,073 Plus tax-equivalent adjustment(1) 4,929 6,228 15,139 12,919 10,298 Net interest income, fully tax-equivalent (non-GAAP) $ 438,658 $ 420,182 $ 345,447 $ 307,585 $ 213,371 Average earning assets $ 10,845,940 $ 9,718,106 $ 8,181,914 $ 7,455,217 $ 6,152,090 Annualized net interest margin (GAAP) 4.00% 4.26% 4.04% 3.95% 3.30% Annualized net interest margin, fully tax-equivalent (non-GAAP) 4.04% 4.32% 4.22% 4.13% 3.47% Purchase accounting discount amortization on loans included in annualized net interest margin 0.13% 0.15% 0.18% 0.22% 0.18% (1) Computed on a tax-equivalent basis using an effective tax rate of 21% beginning January 1, 2018, and 35% for all prior periods. 48
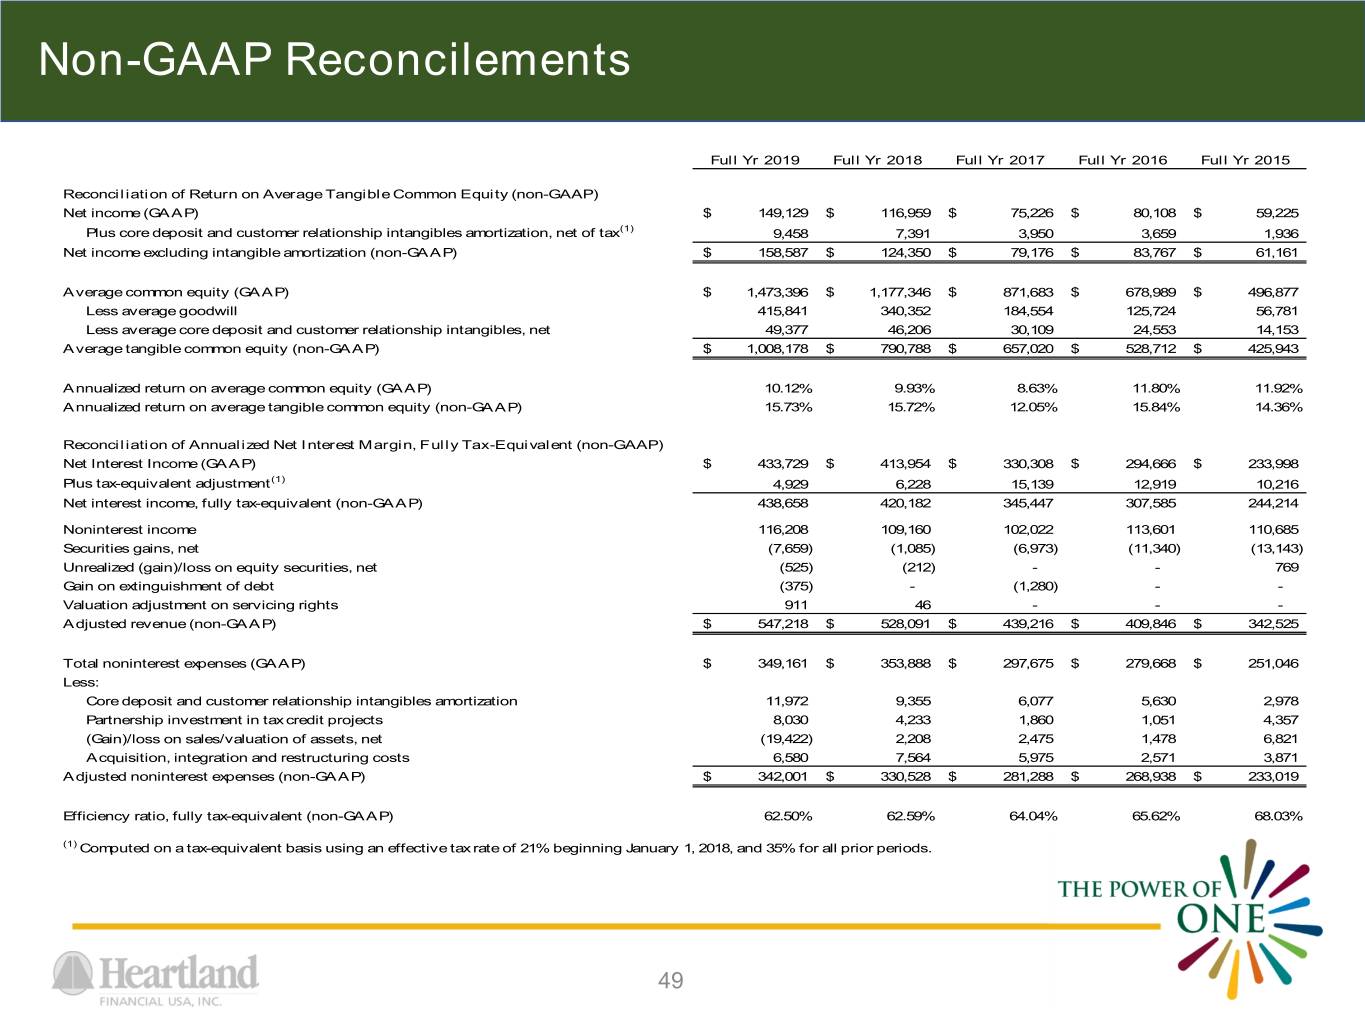
Non-GAAP Reconcilements Full Yr 2019 Full Yr 2018 Full Yr 2017 Full Yr 2016 Full Yr 2015 Reconciliation of Return on Average Tangible Common Equity (non-GAAP) Net income (GAAP) $ 149,129 $ 116,959 $ 75,226 $ 80,108 $ 59,225 Plus core deposit and customer relationship intangibles amortization, net of tax(1) 9,458 7,391 3,950 3,659 1,936 Net income excluding intangible amortization (non-GAAP) $ 158,587 $ 124,350 $ 79,176 $ 83,767 $ 61,161 Average common equity (GAAP) $ 1,473,396 $ 1,177,346 $ 871,683 $ 678,989 $ 496,877 Less average goodwill 415,841 340,352 184,554 125,724 56,781 Less average core deposit and customer relationship intangibles, net 49,377 46,206 30,109 24,553 14,153 Average tangible common equity (non-GAAP) $ 1,008,178 $ 790,788 $ 657,020 $ 528,712 $ 425,943 Annualized return on average common equity (GAAP) 10.12% 9.93% 8.63% 11.80% 11.92% Annualized return on average tangible common equity (non-GAAP) 15.73% 15.72% 12.05% 15.84% 14.36% Reconciliation of Annualized Net Interest Margin, Fully Tax-Equivalent (non-GAAP) Net Interest Income (GAAP) $ 433,729 $ 413,954 $ 330,308 $ 294,666 $ 233,998 Plus tax-equivalent adjustment(1) 4,929 6,228 15,139 12,919 10,216 Net interest income, fully tax-equivalent (non-GAAP) 438,658 420,182 345,447 307,585 244,214 Noninterest income 116,208 109,160 102,022 113,601 110,685 Securities gains, net (7,659) (1,085) (6,973) (11,340) (13,143) Unrealized (gain)/loss on equity securities, net (525) (212) - - 769 Gain on extinguishment of debt (375) - (1,280) - - Valuation adjustment on servicing rights 911 46 - - - Adjusted revenue (non-GAAP) $ 547,218 $ 528,091 $ 439,216 $ 409,846 $ 342,525 Total noninterest expenses (GAAP) $ 349,161 $ 353,888 $ 297,675 $ 279,668 $ 251,046 Less: Core deposit and customer relationship intangibles amortization 11,972 9,355 6,077 5,630 2,978 Partnership investment in tax credit projects 8,030 4,233 1,860 1,051 4,357 (Gain)/loss on sales/valuation of assets, net (19,422) 2,208 2,475 1,478 6,821 Acquisition, integration and restructuring costs 6,580 7,564 5,975 2,571 3,871 Adjusted noninterest expenses (non-GAAP) $ 342,001 $ 330,528 $ 281,288 $ 268,938 $ 233,019 Efficiency ratio, fully tax-equivalent (non-GAAP) 62.50% 62.59% 64.04% 65.62% 68.03% (1) Computed on a tax-equivalent basis using an effective tax rate of 21% beginning January 1, 2018, and 35% for all prior periods. 49
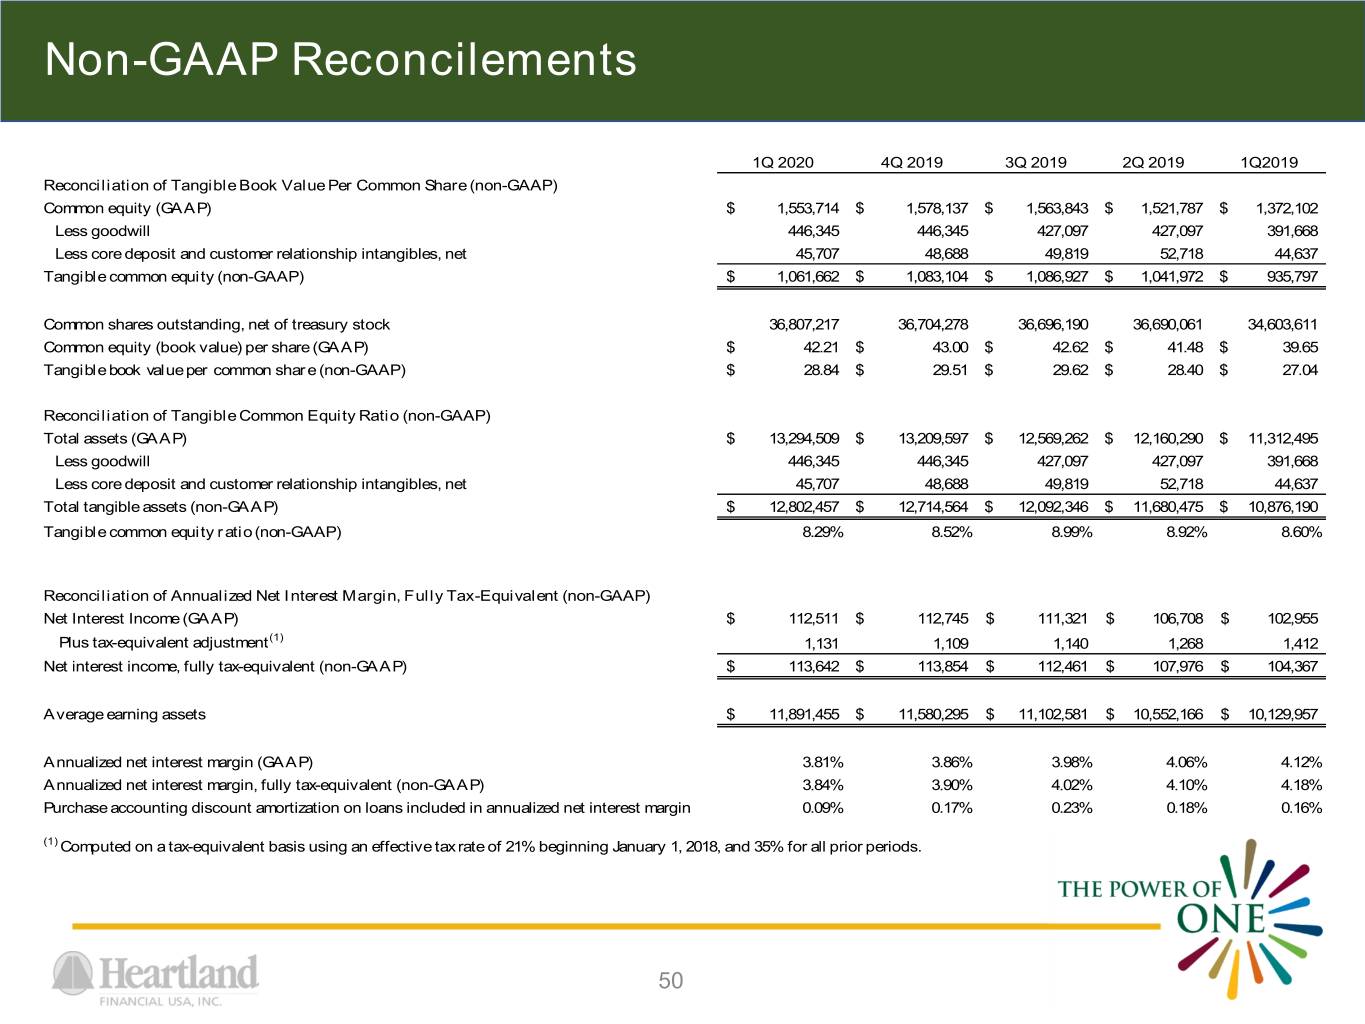
Non-GAAP Reconcilements 1Q 2020 4Q 2019 3Q 2019 2Q 2019 1Q2019 Reconciliation of Tangible Book Value Per Common Share (non-GAAP) Common equity (GAAP) $ 1,553,714 $ 1,578,137 $ 1,563,843 $ 1,521,787 $ 1,372,102 Less goodwill 446,345 446,345 427,097 427,097 391,668 Less core deposit and customer relationship intangibles, net 45,707 48,688 49,819 52,718 44,637 Tangible common equity (non-GAAP) $ 1,061,662 $ 1,083,104 $ 1,086,927 $ 1,041,972 $ 935,797 Common shares outstanding, net of treasury stock 36,807,217 36,704,278 36,696,190 36,690,061 34,603,611 Common equity (book value) per share (GAAP) $ 42.21 $ 43.00 $ 42.62 $ 41.48 $ 39.65 Tangible book value per common share (non-GAAP) $ 28.84 $ 29.51 $ 29.62 $ 28.40 $ 27.04 Reconciliation of Tangible Common Equity Ratio (non-GAAP) Total assets (GAAP) $ 13,294,509 $ 13,209,597 $ 12,569,262 $ 12,160,290 $ 11,312,495 Less goodwill 446,345 446,345 427,097 427,097 391,668 Less core deposit and customer relationship intangibles, net 45,707 48,688 49,819 52,718 44,637 Total tangible assets (non-GAAP) $ 12,802,457 $ 12,714,564 $ 12,092,346 $ 11,680,475 $ 10,876,190 Tangible common equity ratio (non-GAAP) 8.29% 8.52% 8.99% 8.92% 8.60% Reconciliation of Annualized Net Interest Margin, Fully Tax-Equivalent (non-GAAP) Net Interest Income (GAAP) $ 112,511 $ 112,745 $ 111,321 $ 106,708 $ 102,955 Plus tax-equivalent adjustment(1) 1,131 1,109 1,140 1,268 1,412 Net interest income, fully tax-equivalent (non-GAAP) $ 113,642 $ 113,854 $ 112,461 $ 107,976 $ 104,367 Average earning assets $ 11,891,455 $ 11,580,295 $ 11,102,581 $ 10,552,166 $ 10,129,957 Annualized net interest margin (GAAP) 3.81% 3.86% 3.98% 4.06% 4.12% Annualized net interest margin, fully tax-equivalent (non-GAAP) 3.84% 3.90% 4.02% 4.10% 4.18% Purchase accounting discount amortization on loans included in annualized net interest margin 0.09% 0.17% 0.23% 0.18% 0.16% (1) Computed on a tax-equivalent basis using an effective tax rate of 21% beginning January 1, 2018, and 35% for all prior periods. 50
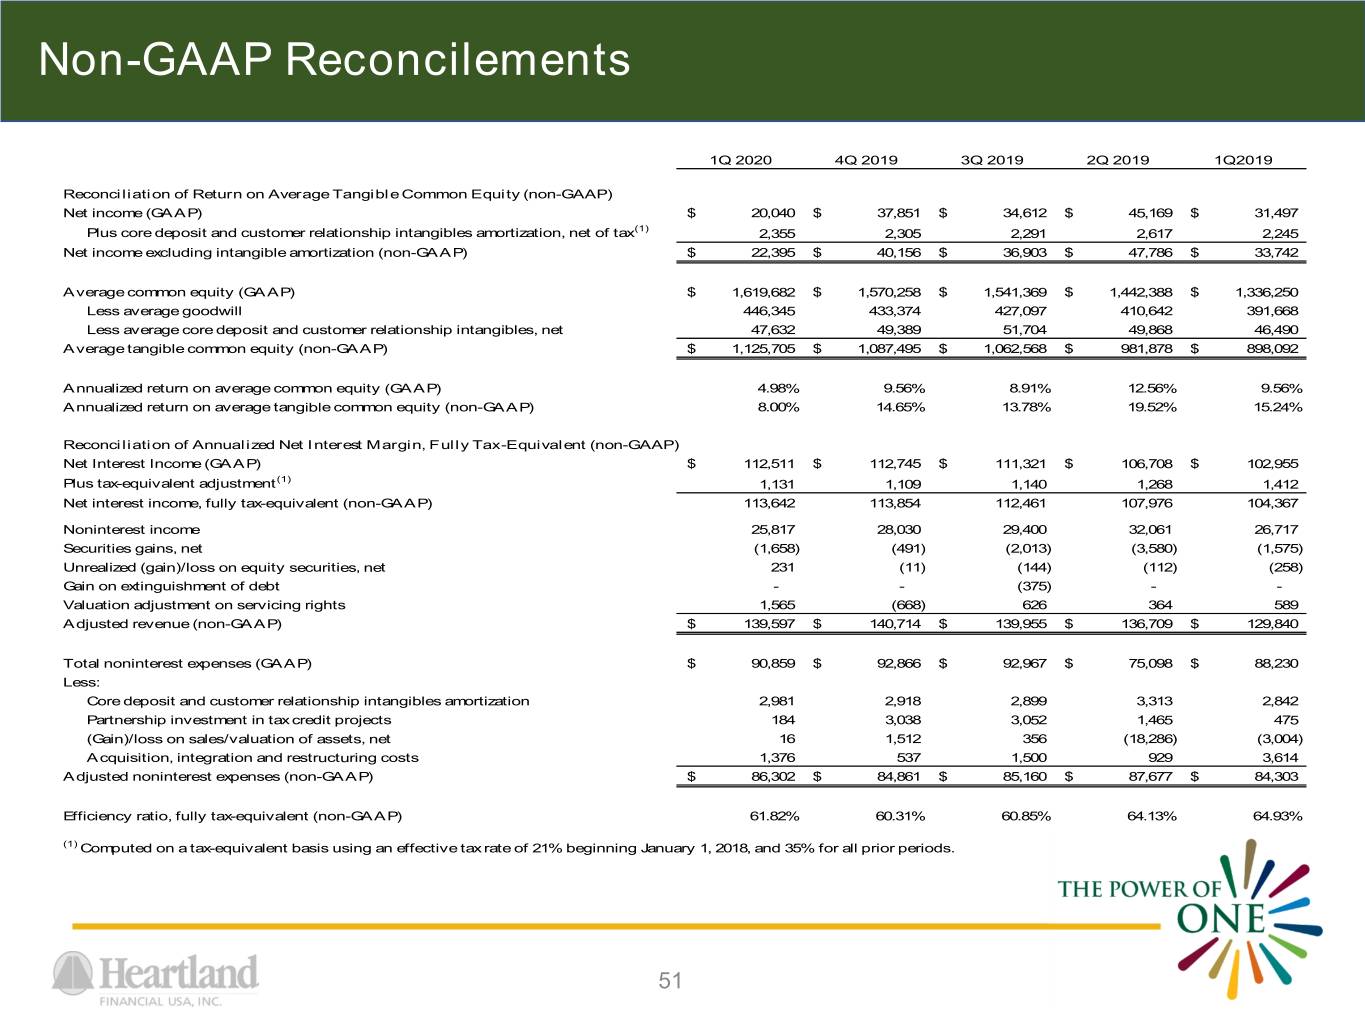
Non-GAAP Reconcilements 1Q 2020 4Q 2019 3Q 2019 2Q 2019 1Q2019 Reconciliation of Return on Average Tangible Common Equity (non-GAAP) Net income (GAAP) $ 20,040 $ 37,851 $ 34,612 $ 45,169 $ 31,497 Plus core deposit and customer relationship intangibles amortization, net of tax(1) 2,355 2,305 2,291 2,617 2,245 Net income excluding intangible amortization (non-GAAP) $ 22,395 $ 40,156 $ 36,903 $ 47,786 $ 33,742 Average common equity (GAAP) $ 1,619,682 $ 1,570,258 $ 1,541,369 $ 1,442,388 $ 1,336,250 Less average goodwill 446,345 433,374 427,097 410,642 391,668 Less average core deposit and customer relationship intangibles, net 47,632 49,389 51,704 49,868 46,490 Average tangible common equity (non-GAAP) $ 1,125,705 $ 1,087,495 $ 1,062,568 $ 981,878 $ 898,092 Annualized return on average common equity (GAAP) 4.98% 9.56% 8.91% 12.56% 9.56% Annualized return on average tangible common equity (non-GAAP) 8.00% 14.65% 13.78% 19.52% 15.24% Reconciliation of Annualized Net Interest Margin, Fully Tax-Equivalent (non-GAAP) Net Interest Income (GAAP) $ 112,511 $ 112,745 $ 111,321 $ 106,708 $ 102,955 Plus tax-equivalent adjustment(1) 1,131 1,109 1,140 1,268 1,412 Net interest income, fully tax-equivalent (non-GAAP) 113,642 113,854 112,461 107,976 104,367 Noninterest income 25,817 28,030 29,400 32,061 26,717 Securities gains, net (1,658) (491) (2,013) (3,580) (1,575) Unrealized (gain)/loss on equity securities, net 231 (11) (144) (112) (258) Gain on extinguishment of debt - - (375) - - Valuation adjustment on servicing rights 1,565 (668) 626 364 589 Adjusted revenue (non-GAAP) $ 139,597 $ 140,714 $ 139,955 $ 136,709 $ 129,840 Total noninterest expenses (GAAP) $ 90,859 $ 92,866 $ 92,967 $ 75,098 $ 88,230 Less: Core deposit and customer relationship intangibles amortization 2,981 2,918 2,899 3,313 2,842 Partnership investment in tax credit projects 184 3,038 3,052 1,465 475 (Gain)/loss on sales/valuation of assets, net 16 1,512 356 (18,286) (3,004) Acquisition, integration and restructuring costs 1,376 537 1,500 929 3,614 Adjusted noninterest expenses (non-GAAP) $ 86,302 $ 84,861 $ 85,160 $ 87,677 $ 84,303 Efficiency ratio, fully tax-equivalent (non-GAAP) 61.82% 60.31% 60.85% 64.13% 64.93% (1) Computed on a tax-equivalent basis using an effective tax rate of 21% beginning January 1, 2018, and 35% for all prior periods. 51
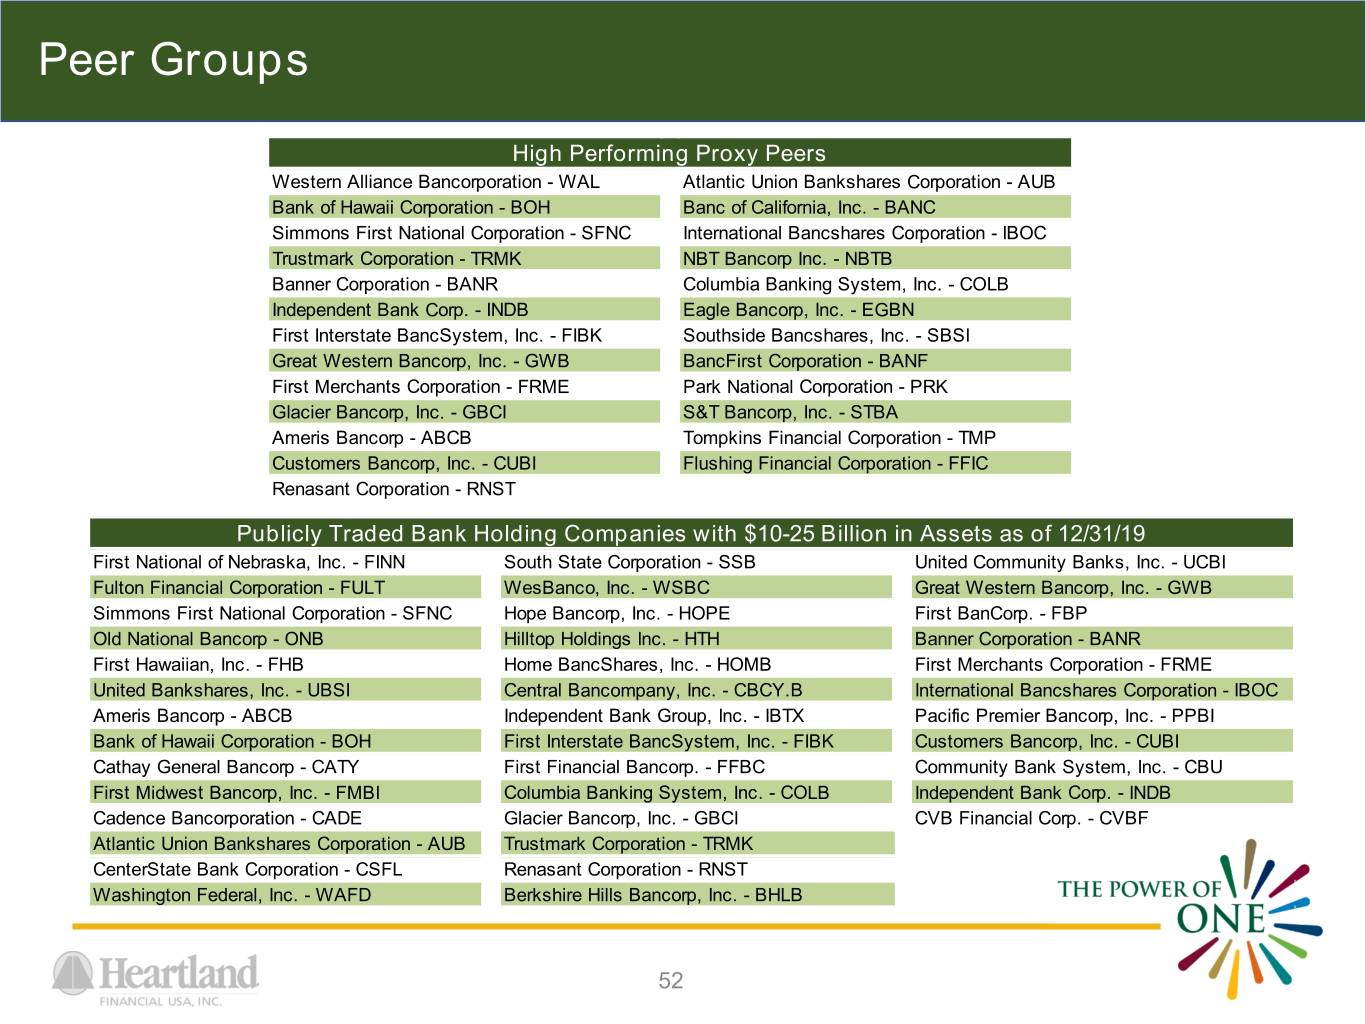
Peer Groups High Performing Proxy Peers Western Alliance Bancorporation - WAL Atlantic Union Bankshares Corporation - AUB Bank of Hawaii Corporation - BOH Banc of California, Inc. - BANC Simmons First National Corporation - SFNC International Bancshares Corporation - IBOC Trustmark Corporation - TRMK NBT Bancorp Inc. - NBTB Banner Corporation - BANR Columbia Banking System, Inc. - COLB Independent Bank Corp. - INDB Eagle Bancorp, Inc. - EGBN First Interstate BancSystem, Inc. - FIBK Southside Bancshares, Inc. - SBSI Great Western Bancorp, Inc. - GWB BancFirst Corporation - BANF First Merchants Corporation - FRME Park National Corporation - PRK Glacier Bancorp, Inc. - GBCI S&T Bancorp, Inc. - STBA Ameris Bancorp - ABCB Tompkins Financial Corporation - TMP Customers Bancorp, Inc. - CUBI Flushing Financial Corporation - FFIC Renasant Corporation - RNST Publicly Traded Bank Holding Companies with $10-25 Billion in Assets as of 12/31/19 First National of Nebraska, Inc. - FINN South State Corporation - SSB United Community Banks, Inc. - UCBI Fulton Financial Corporation - FULT WesBanco, Inc. - WSBC Great Western Bancorp, Inc. - GWB Simmons First National Corporation - SFNC Hope Bancorp, Inc. - HOPE First BanCorp. - FBP Old National Bancorp - ONB Hilltop Holdings Inc. - HTH Banner Corporation - BANR First Hawaiian, Inc. - FHB Home BancShares, Inc. - HOMB First Merchants Corporation - FRME United Bankshares, Inc. - UBSI Central Bancompany, Inc. - CBCY.B International Bancshares Corporation - IBOC Ameris Bancorp - ABCB Independent Bank Group, Inc. - IBTX Pacific Premier Bancorp, Inc. - PPBI Bank of Hawaii Corporation - BOH First Interstate BancSystem, Inc. - FIBK Customers Bancorp, Inc. - CUBI Cathay General Bancorp - CATY First Financial Bancorp. - FFBC Community Bank System, Inc. - CBU First Midwest Bancorp, Inc. - FMBI Columbia Banking System, Inc. - COLB Independent Bank Corp. - INDB Cadence Bancorporation - CADE Glacier Bancorp, Inc. - GBCI CVB Financial Corp. - CVBF Atlantic Union Bankshares Corporation - AUB Trustmark Corporation - TRMK CenterState Bank Corporation - CSFL Renasant Corporation - RNST Washington Federal, Inc. - WAFD Berkshire Hills Bancorp, Inc. - BHLB 52


