
3rd Quarter 2022 Financials
2 Safe Harbor Within the charts and tables presented, certain segments, columns and rows may not sum to totals shown due to rounding. This investor presentation (including any information incorporated herein by reference) and future oral and written statements of HTLF and its management, may contain forward-looking statements within the meaning of Section 27A of the Securities Act of 1933, as amended, and Section 21E of the Securities Exchange Act of 1934, as amended, with respect to the business, financial condition, results of operations, plans, objectives and future performance of HTLF. Any statements about HTLF's expectations, beliefs, plans, objectives, assumptions or future events or performance are not historical facts and may be forward-looking. Forward-looking statements may include information about possible or assumed future results of HTLF's operations or performance, and may be based upon beliefs, expectations and assumptions of HTLF's management. These forward-looking statements are generally identified by the use of the words such as "believe", "expect", "anticipate", "plan", "intend", "estimate", "project", "may", "will", "would", "could", "should", "may", "view", "opportunity", "potential", or similar or negative expressions of these words or phrases that are used in this investor presentation, , and future oral and written statements of HTLF and its management. Although HTLF may make these statements based on management’s experience, beliefs, expectations, assumptions and best estimate of future events, the ability of HTLF to predict results or the actual effect or outcomes of plans or strategies is inherently uncertain, and there may be events or factors that management has not anticipated. Therefore, the accuracy and achievement of such forward-looking statements and estimates are subject to a number of risks, many of which are beyond the ability of management to control or predict, that could cause actual results to differ materially from those in its forward-looking statements. These factors, which HTLF currently believes could have a material effect on its operations and future prospects, are detailed below and in the risk factors in HTLF's reports filed with the Securities and Exchange Commission ("SEC"), including the "Risk Factors" section under Item 1A of Part I of HTLF’s Annual Report on Form 10-K for the year ended December 31, 2021, include, among others: • Coronavirus Disease 2019 ("COVID-19") Pandemic Risks, including risks related to the ongoing COVID-19 pandemic and measures enacted by the U.S. federal and state governments and adopted by private businesses in response to the COVID-19 pandemic; • Economic and Market Conditions Risks, including risks related to changes in the U.S. economy in general and in the local economies in which HTLF conducts its operations and future civil unrest, natural disasters, terrorist threats or acts of war; • Credit Risks, including risks of increasing credit losses due to deterioration in the financial condition of HTLF's borrowers, changes in asset and collateral values and climate and other borrower industry risks which may impact the provision for credit losses and net charge-offs; • Liquidity and Interest Rate Risks, including the impact of capital market conditions and changes in monetary policy on our borrowings and net interest income; • Operational Risks, including processing, information systems, cybersecurity, vendor, business interruption, and fraud risks; • Strategic and External Risks, including economic, political and competitive forces impacting our business; • Legal, Compliance and Reputational Risks, including regulatory and litigation risks; and • Risks of Owning Stock in HTLF, including stock price volatility and dilution as a result of future equity offerings and acquisitions. There can be no assurance that other factors not currently anticipated by HTLF will not materially and adversely affect HTLF's business, financial condition and results of operations. In addition, many of these risks and uncertainties are currently amplified by and may continue to be amplified by the COVID-19 pandemic and the impact of varying governmental responses that affect HTLF’s customers and the economies where they operate. Additionally, all statements in this investor presentation, including forward-looking statements speak only as of the date they are made. HTLF does not undertake and specifically disclaims any obligation to publicly release the results of any revisions which may be made to any forward-looking statement to reflect events or circumstances after the date of such statements or to reflect the occurrence of anticipated or unanticipated events or to otherwise update any statement in light of new information or future events. Further information concerning HTLF and its business, including additional factors that could materially affect HTLF’s financial results, is included in HTLF's filings with the SEC.

3 $1.28 EPS available to common shareholders 0.10% Loan Delinquencies NCOs/Average Loans were virtually zero for the quarter $219M C&I Loan Growth excluding PPP Loans 3Q 2022 Highlights $8.1 million total revenue growth Charter Consolidation Progress Completed the consolidation of two bank charters during the quarter, and one charter consolidation completed subsequent to the end of the quarter 3.45% NIM fully tax equivalent (non-GAAP) 55.26% Efficiency Ratio fully tax equivalent (non-GAAP)
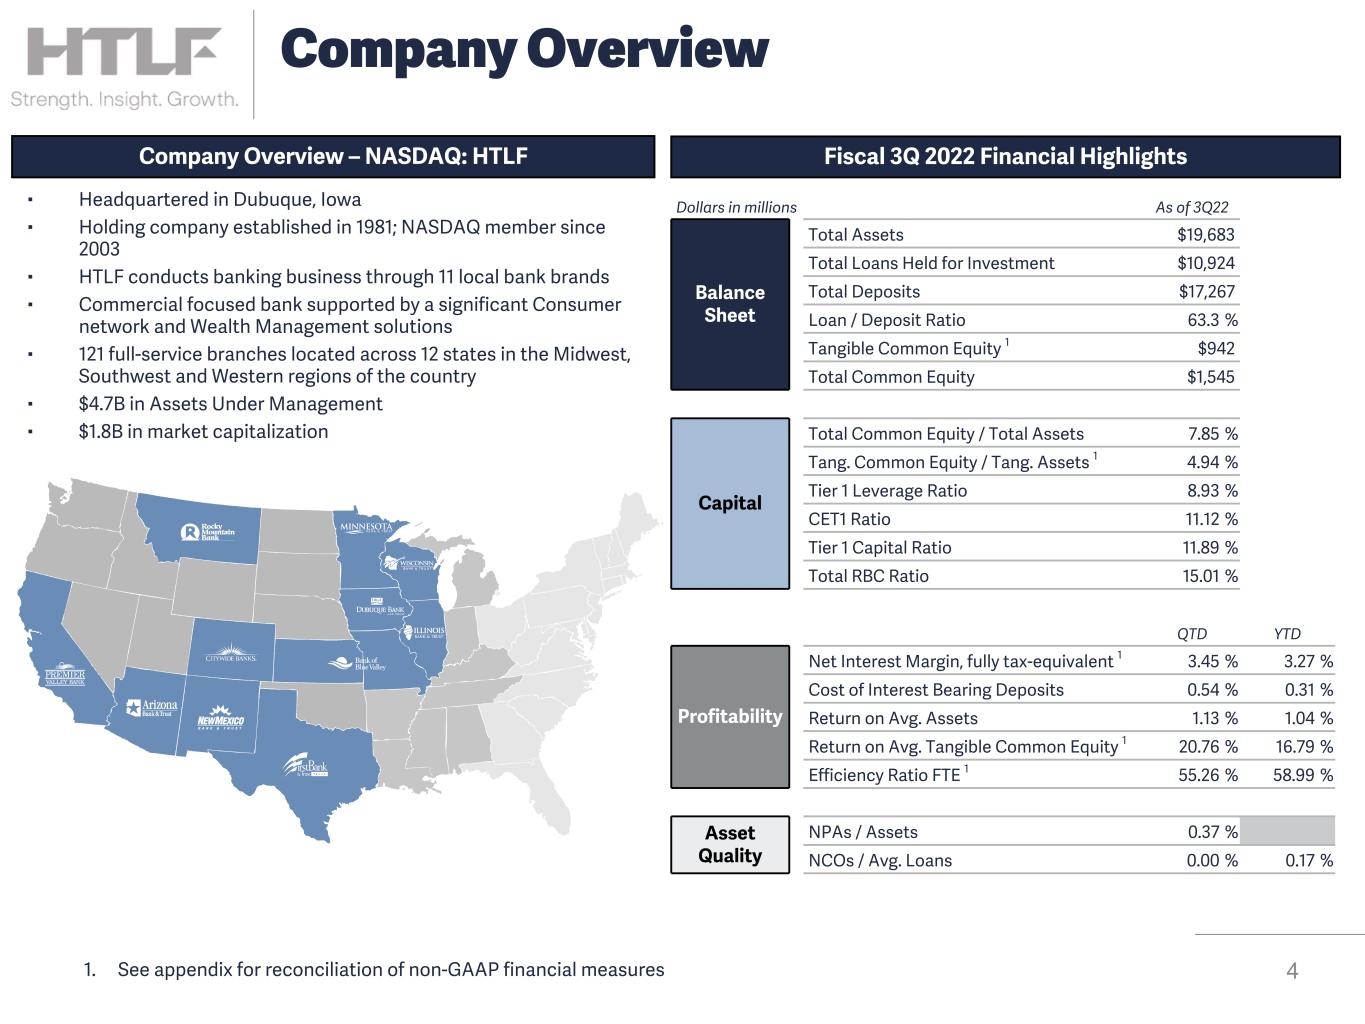
Company Overview – NASDAQ: HTLF Fiscal 3Q 2022 Financial Highlights ▪ Headquartered in Dubuque, Iowa ▪ Holding company established in 1981; NASDAQ member since 2003 ▪ HTLF conducts banking business through 11 local bank brands ▪ Commercial focused bank supported by a significant Consumer network and Wealth Management solutions ▪ 121 full-service branches located across 12 states in the Midwest, Southwest and Western regions of the country ▪ $4.7B in Assets Under Management ▪ $1.8B in market capitalization Dollars in millions As of 3Q22 Balance Sheet Total Assets $19,683 Total Loans Held for Investment $10,924 Total Deposits $17,267 Loan / Deposit Ratio 63.3 % Tangible Common Equity 1 $942 Total Common Equity $1,545 Capital Total Common Equity / Total Assets 7.85 % Tang. Common Equity / Tang. Assets 1 4.94 % Tier 1 Leverage Ratio 8.93 % CET1 Ratio 11.12 % Tier 1 Capital Ratio 11.89 % Total RBC Ratio 15.01 % QTD YTD Profitability Net Interest Margin, fully tax-equivalent 1 3.45 % 3.27 % Cost of Interest Bearing Deposits 0.54 % 0.31 % Return on Avg. Assets 1.13 % 1.04 % Return on Avg. Tangible Common Equity 1 20.76 % 16.79 % Efficiency Ratio FTE 1 55.26 % 58.99 % Asset Quality NPAs / Assets 0.37 % NCOs / Avg. Loans 0.00 % 0.17 % 4 Company Overview 1. See appendix for reconciliation of non-GAAP financial measures
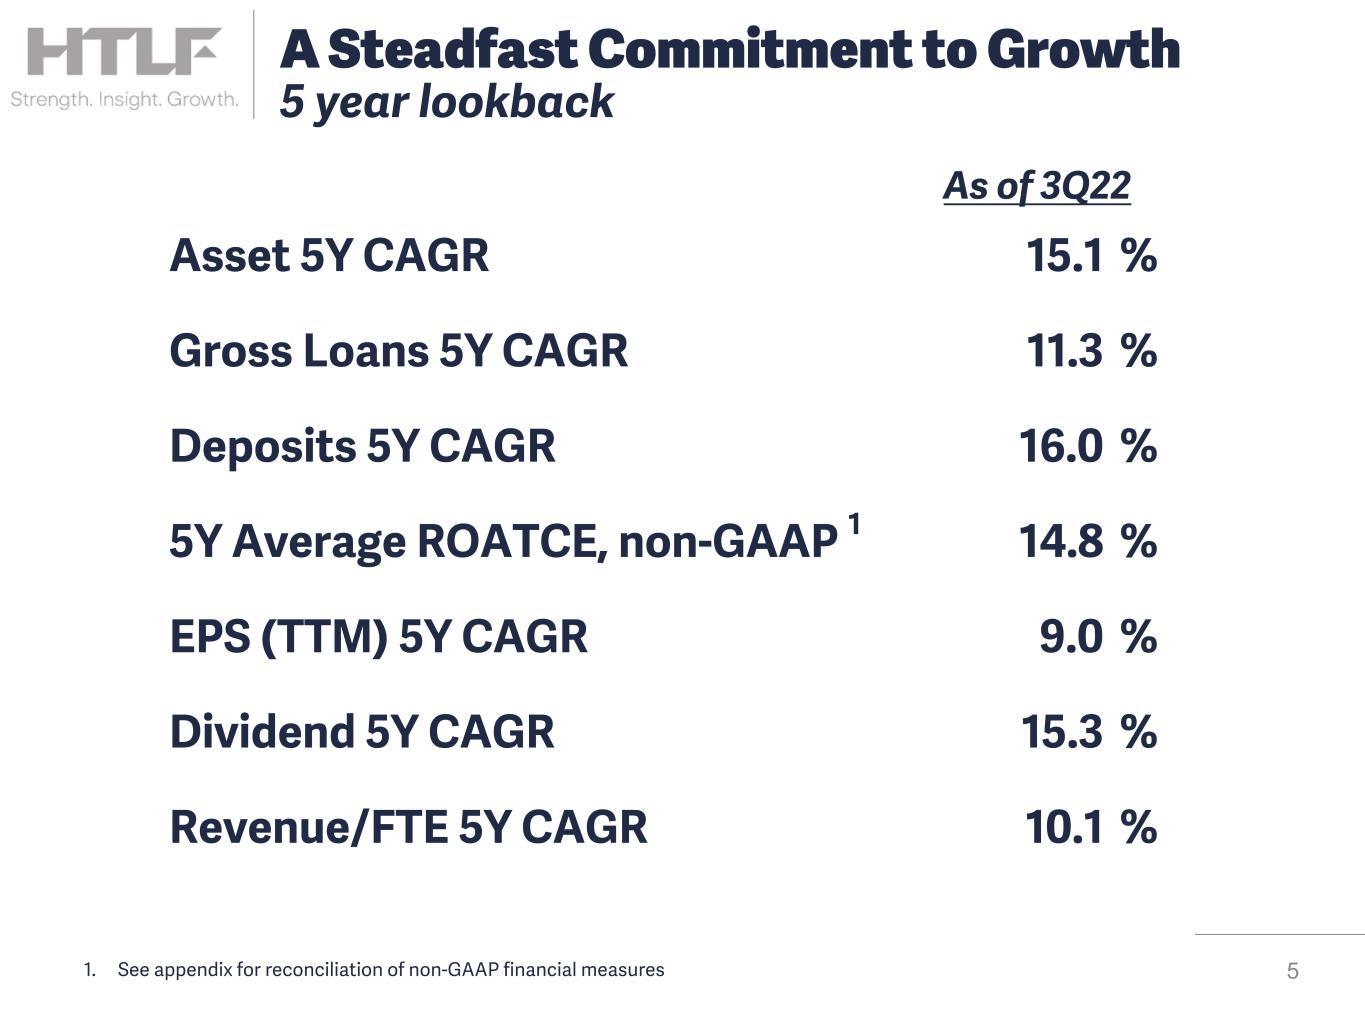
As of 3Q22 Asset 5Y CAGR 15.1 % Gross Loans 5Y CAGR 11.3 % Deposits 5Y CAGR 16.0 % 5Y Average ROATCE, non-GAAP 1 14.8 % EPS (TTM) 5Y CAGR 9.0 % Dividend 5Y CAGR 15.3 % Revenue/FTE 5Y CAGR 10.1 % 51. See appendix for reconciliation of non-GAAP financial measures A Steadfast Commitment to Growth 5 year lookback
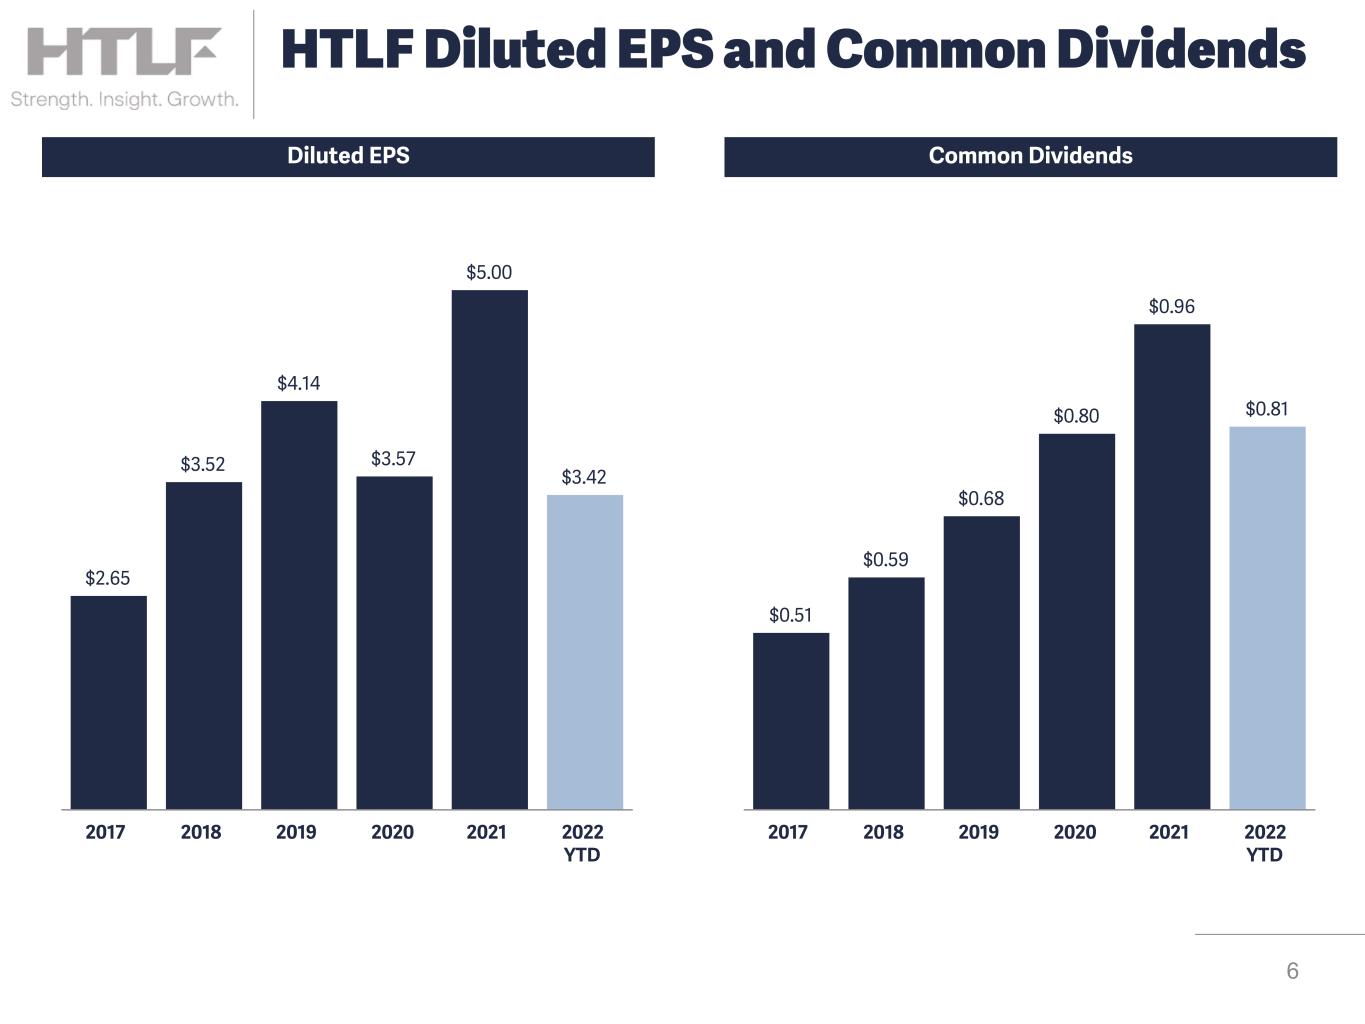
$0.51 $0.59 $0.68 $0.80 $0.96 $0.81 2017 2018 2019 2020 2021 2022 YTD $2.65 $3.52 $4.14 $3.57 $5.00 $3.42 2017 2018 2019 2020 2021 2022 YTD 6 HTLF Diluted EPS and Common Dividends Diluted EPS Common Dividends
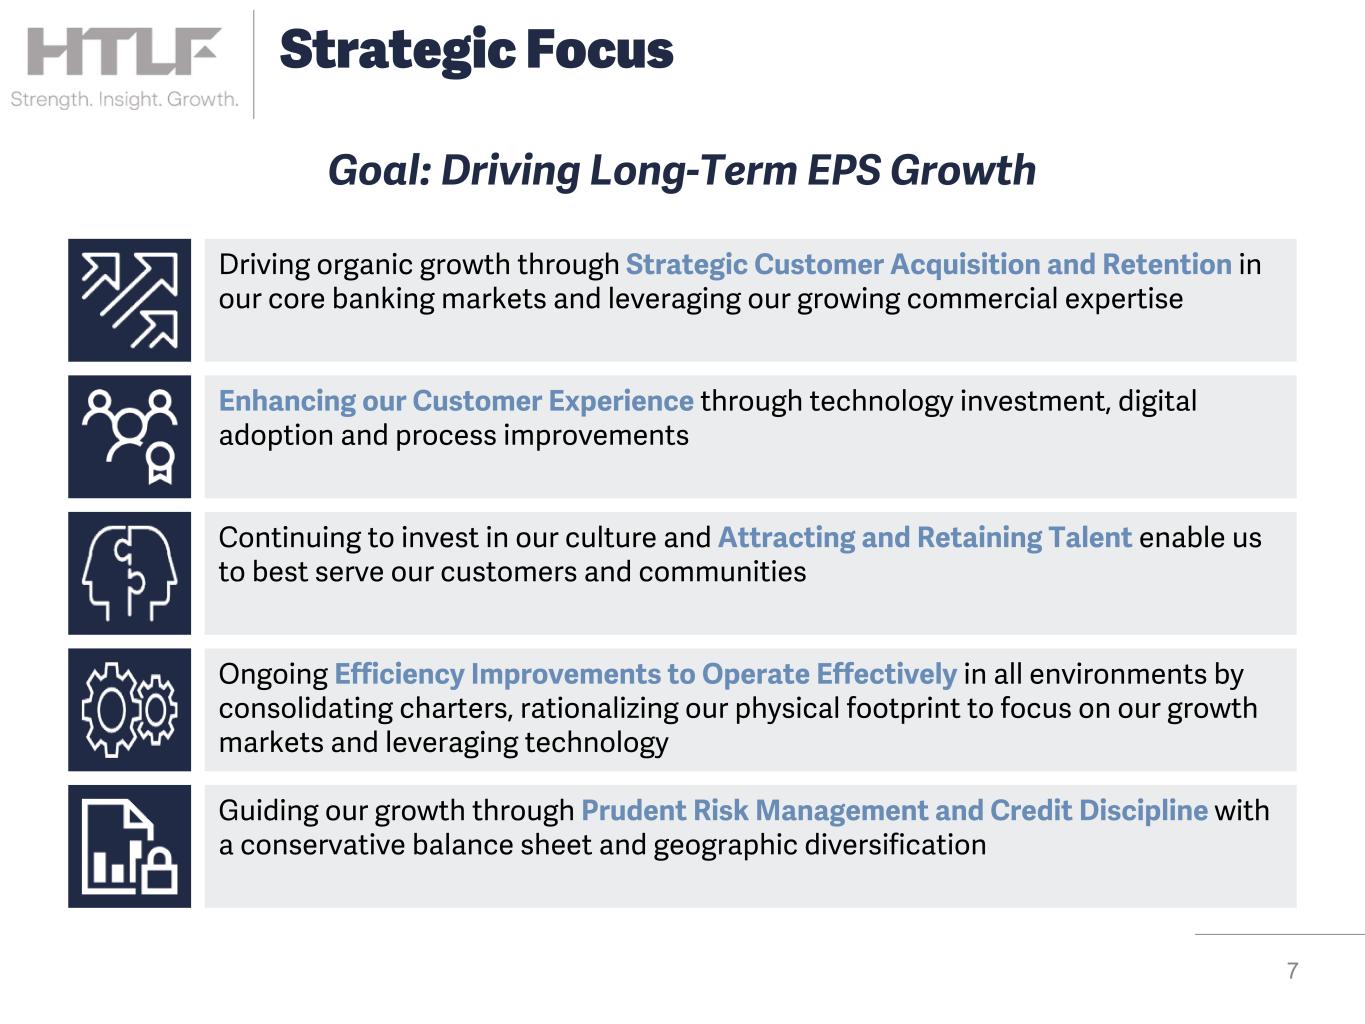
Driving organic growth through Strategic Customer Acquisition and Retention in our core banking markets and leveraging our growing commercial expertise 7 Strategic Focus Enhancing our Customer Experience through technology investment, digital adoption and process improvements Ongoing Efficiency Improvements to Operate Effectively in all environments by consolidating charters, rationalizing our physical footprint to focus on our growth markets and leveraging technology Continuing to invest in our culture and Attracting and Retaining Talent enable us to best serve our customers and communities Guiding our growth through Prudent Risk Management and Credit Discipline with a conservative balance sheet and geographic diversification Goal: Driving Long-Term EPS Growth
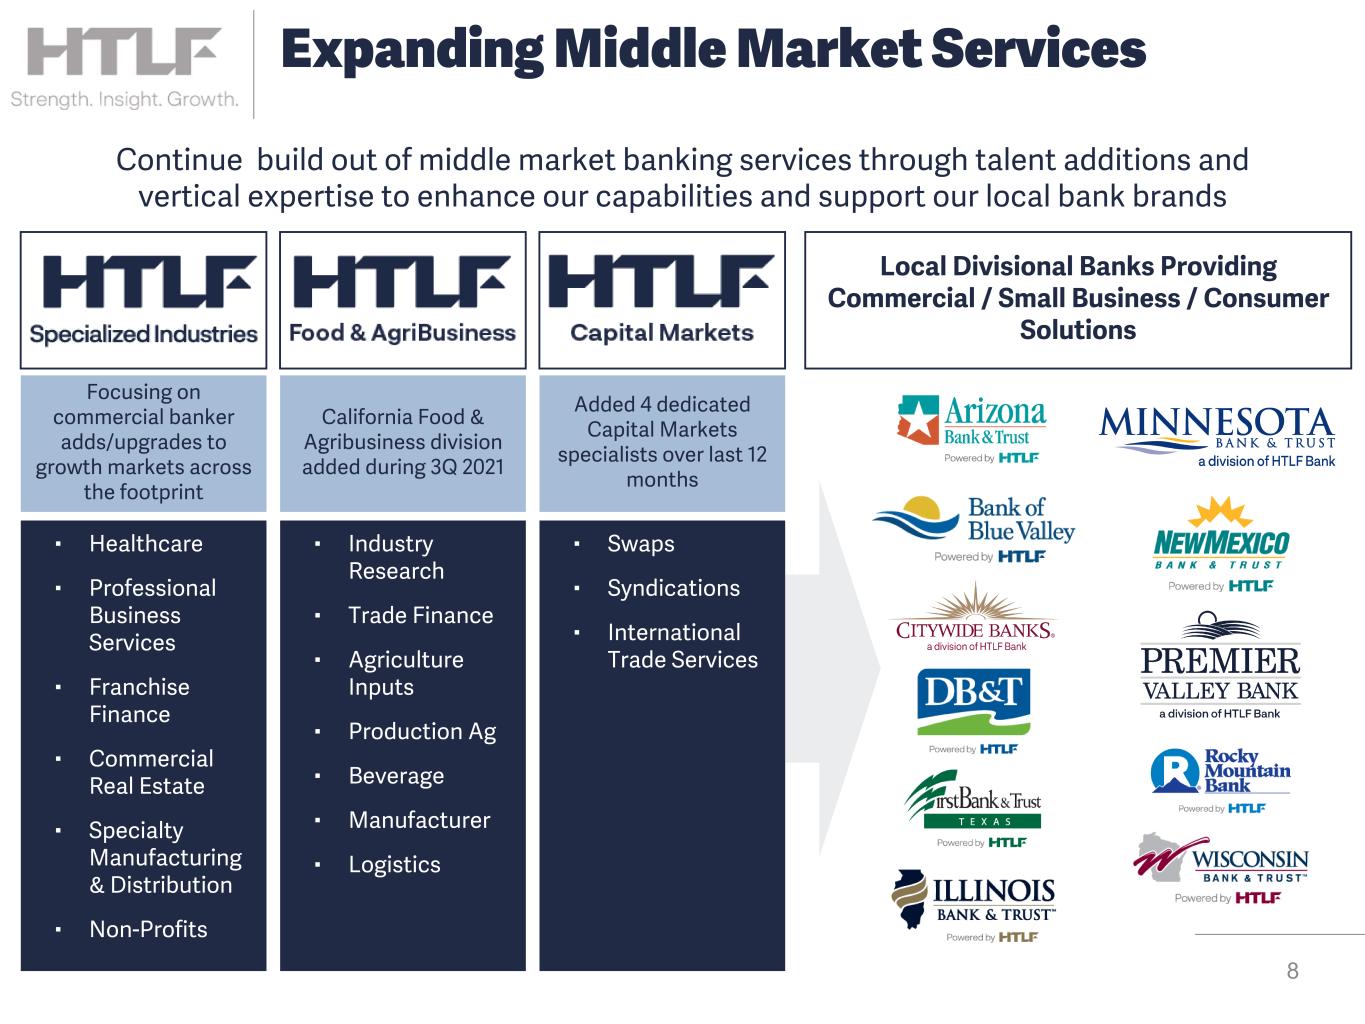
8 Expanding Middle Market Services Continue build out of middle market banking services through talent additions and vertical expertise to enhance our capabilities and support our local bank brands ▪ Healthcare ▪ Professional Business Services ▪ Franchise Finance ▪ Commercial Real Estate ▪ Specialty Manufacturing & Distribution ▪ Non-Profits ▪ Industry Research ▪ Trade Finance ▪ Agriculture Inputs ▪ Production Ag ▪ Beverage ▪ Manufacturer ▪ Logistics ▪ Swaps ▪ Syndications ▪ International Trade Services Local Divisional Banks Providing Commercial / Small Business / Consumer Solutions Focusing on commercial banker adds/upgrades to growth markets across the footprint California Food & Agribusiness division added during 3Q 2021 Added 4 dedicated Capital Markets specialists over last 12 months
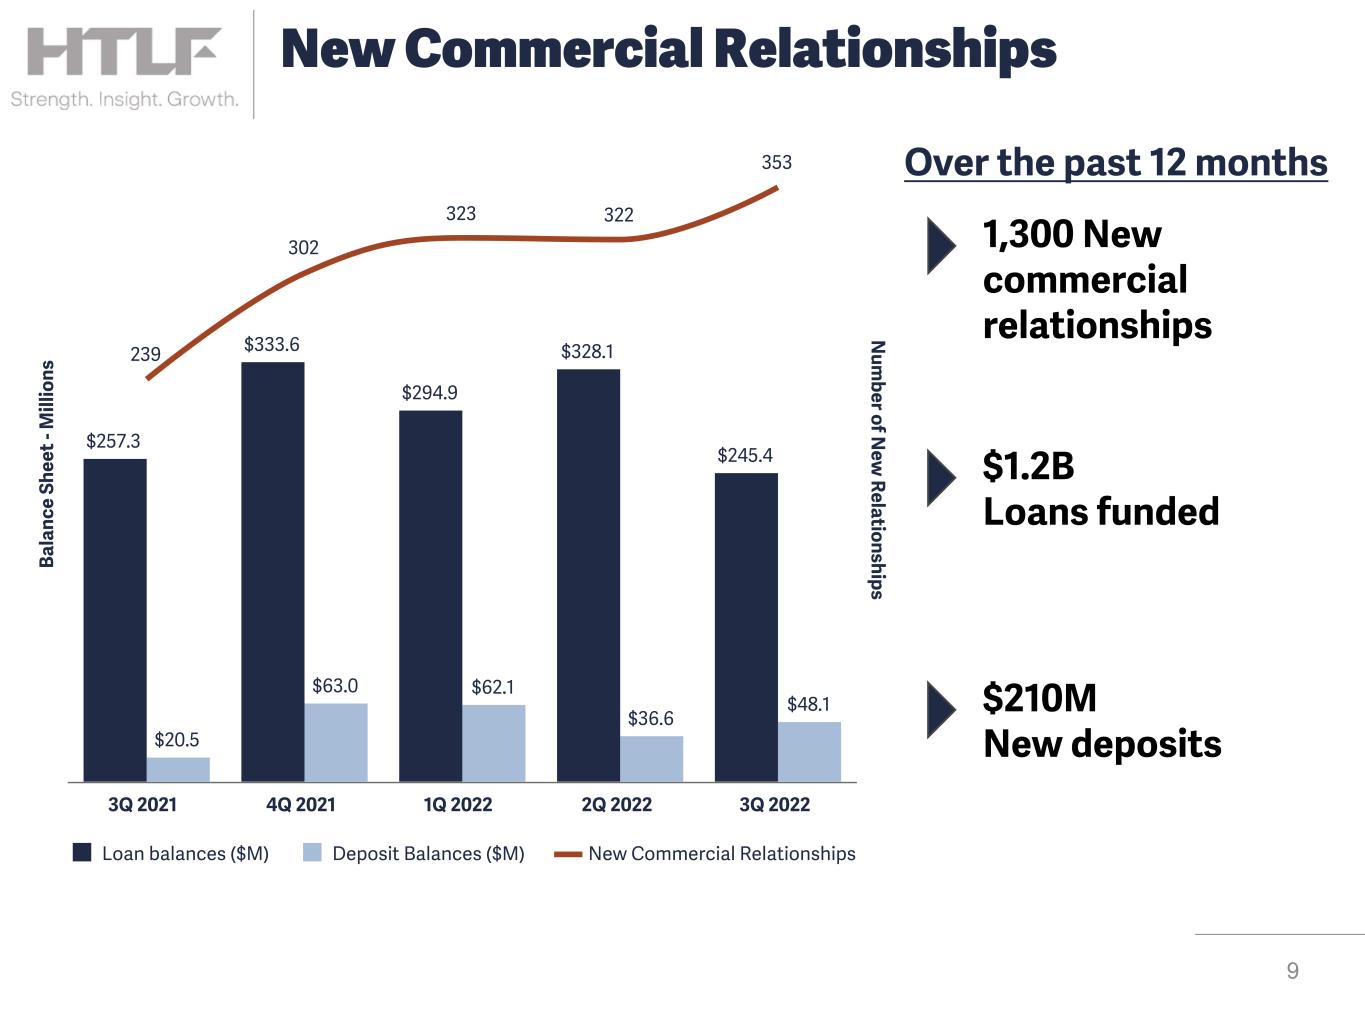
9 New Commercial Relationships B al an ce S he et - M ill io ns N um ber of N ew R elationships $257.3 $333.6 $294.9 $328.1 $245.4 $20.5 $63.0 $62.1 $36.6 $48.1 239 302 323 322 353 Loan balances ($M) Deposit Balances ($M) New Commercial Relationships 3Q 2021 4Q 2021 1Q 2022 2Q 2022 3Q 2022 1,300 New commercial relationships $210M New deposits $1.2B Loans funded Over the past 12 months
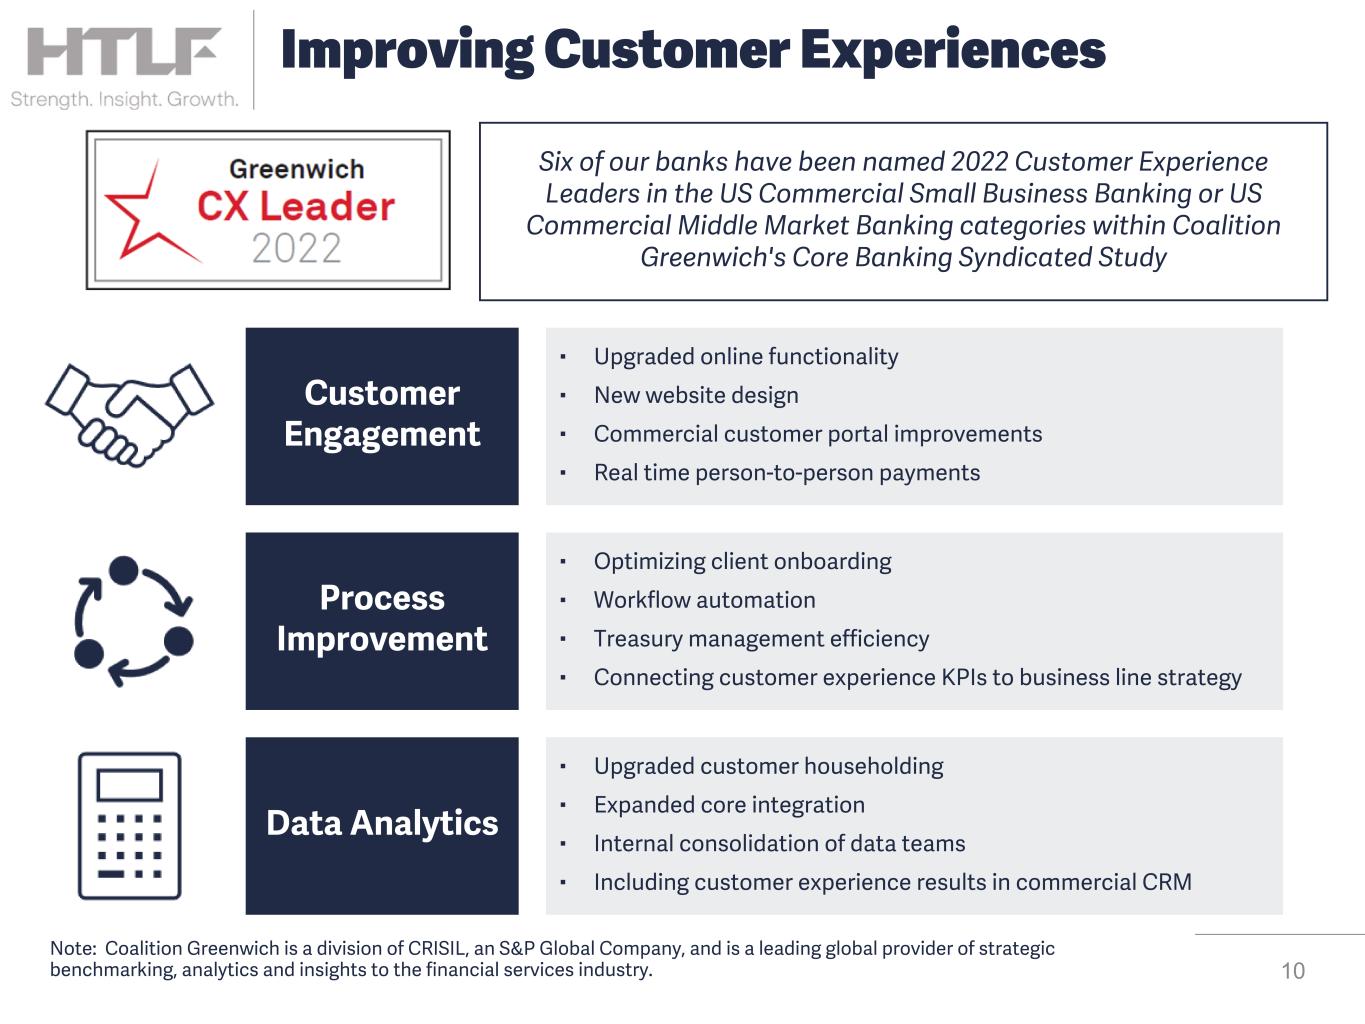
10 Improving Customer Experiences Customer Engagement Process Improvement Data Analytics ▪ Upgraded online functionality ▪ New website design ▪ Commercial customer portal improvements ▪ Real time person-to-person payments ▪ Optimizing client onboarding ▪ Workflow automation ▪ Treasury management efficiency ▪ Connecting customer experience KPIs to business line strategy ▪ Upgraded customer householding ▪ Expanded core integration ▪ Internal consolidation of data teams ▪ Including customer experience results in commercial CRM Note: Coalition Greenwich is a division of CRISIL, an S&P Global Company, and is a leading global provider of strategic benchmarking, analytics and insights to the financial services industry. Six of our banks have been named 2022 Customer Experience Leaders in the US Commercial Small Business Banking or US Commercial Middle Market Banking categories within Coalition Greenwich's Core Banking Syndicated Study

Note: 2022 Forbes Media LLC, used with permission AMONG THE HIGHEST PURCHASE VOLUME GROWTH FOR VISA® COMMERCIAL CARD ISSUERS 2015 | 2016 | 2017 | 2018 2019 | 2020 | 2021 Forbes Best Banks in America 2013 | 2017 | 2018 | 2019 2020 | 2021 | 2022 Ranked #28 in 2022 HTLF Excellence Recognition 11
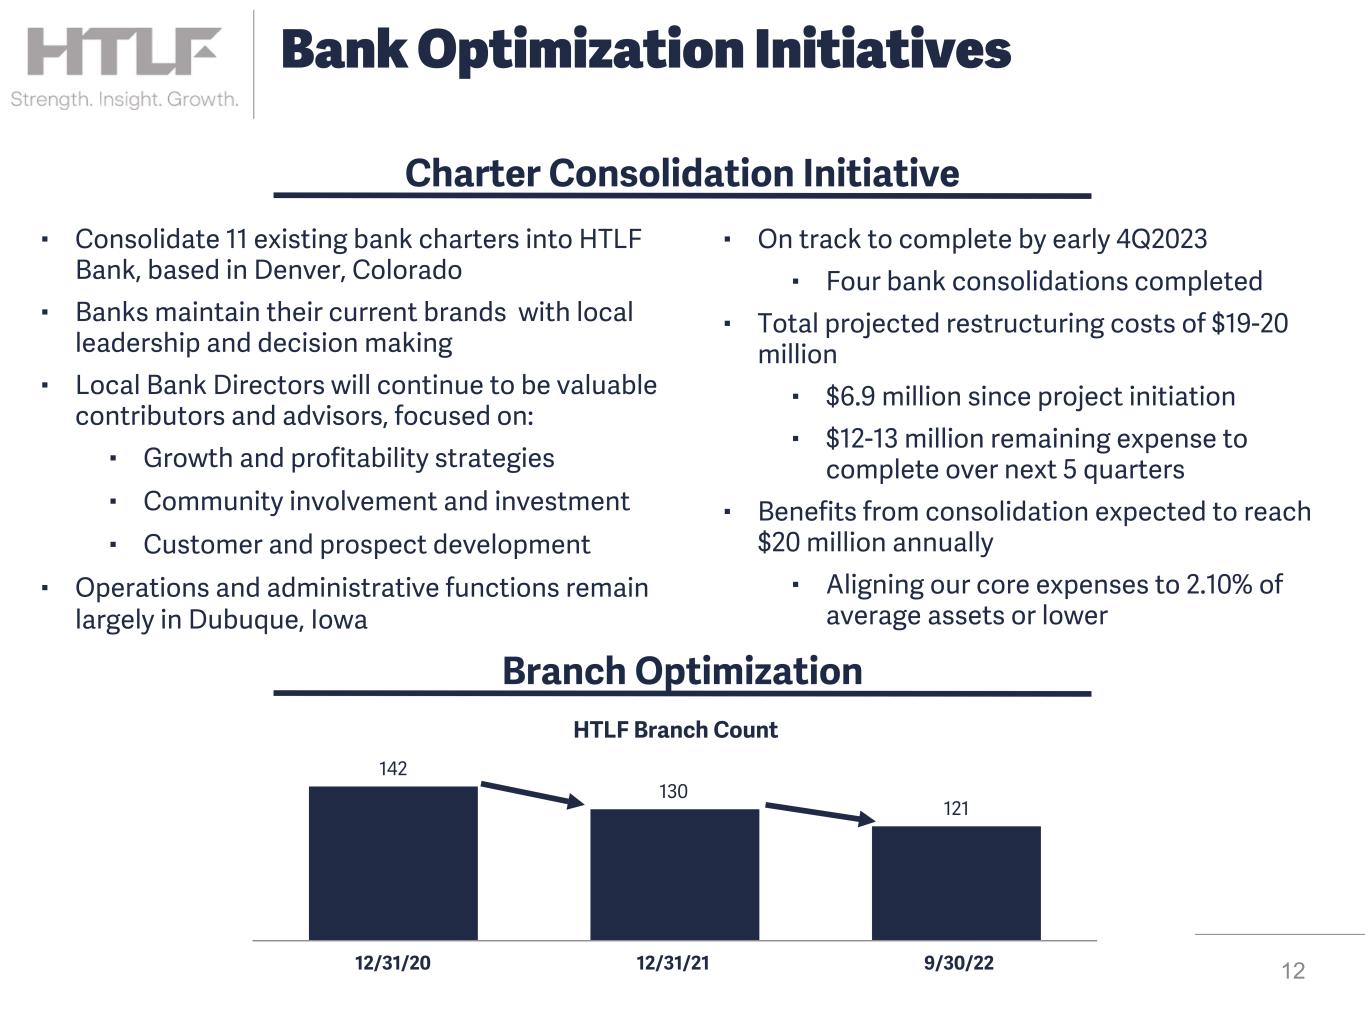
▪ Consolidate 11 existing bank charters into HTLF Bank, based in Denver, Colorado ▪ Banks maintain their current brands with local leadership and decision making ▪ Local Bank Directors will continue to be valuable contributors and advisors, focused on: ▪ Growth and profitability strategies ▪ Community involvement and investment ▪ Customer and prospect development ▪ Operations and administrative functions remain largely in Dubuque, Iowa HTLF Branch Count 142 130 121 12/31/20 12/31/21 9/30/22 Charter Consolidation Initiative ▪ On track to complete by early 4Q2023 ▪ Four bank consolidations completed ▪ Total projected restructuring costs of $19-20 million ▪ $6.9 million since project initiation ▪ $12-13 million remaining expense to complete over next 5 quarters ▪ Benefits from consolidation expected to reach $20 million annually ▪ Aligning our core expenses to 2.10% of average assets or lower 12 Bank Optimization Initiatives Branch Optimization

62.50% 56.65% 59.48% 58.99% 55.26% 2019 2020 2021 2022 YTD 3Q 2022 1. Non-Core Expenses include: restructuring costs, tax credits, CDI Amortization, and sale of assets 2. See appendix for reconciliation of non-GAAP financial measures Efficiency Ratio2 Trend Leveraging Core Costs and Growth 2.90% 2.51% 2.33% 2.23% 2.18% 2.84% 2.34% 2.22% 2.17% 2.09%$12.0 $19.5 $19.8 Core Expenses Non-Core Expenses Average Assets ($B) 2019 2020 2021 2022 YTD 3Q 2022 13 Operating Efficiency Improving by Leveraging Core Costs and Growth 1
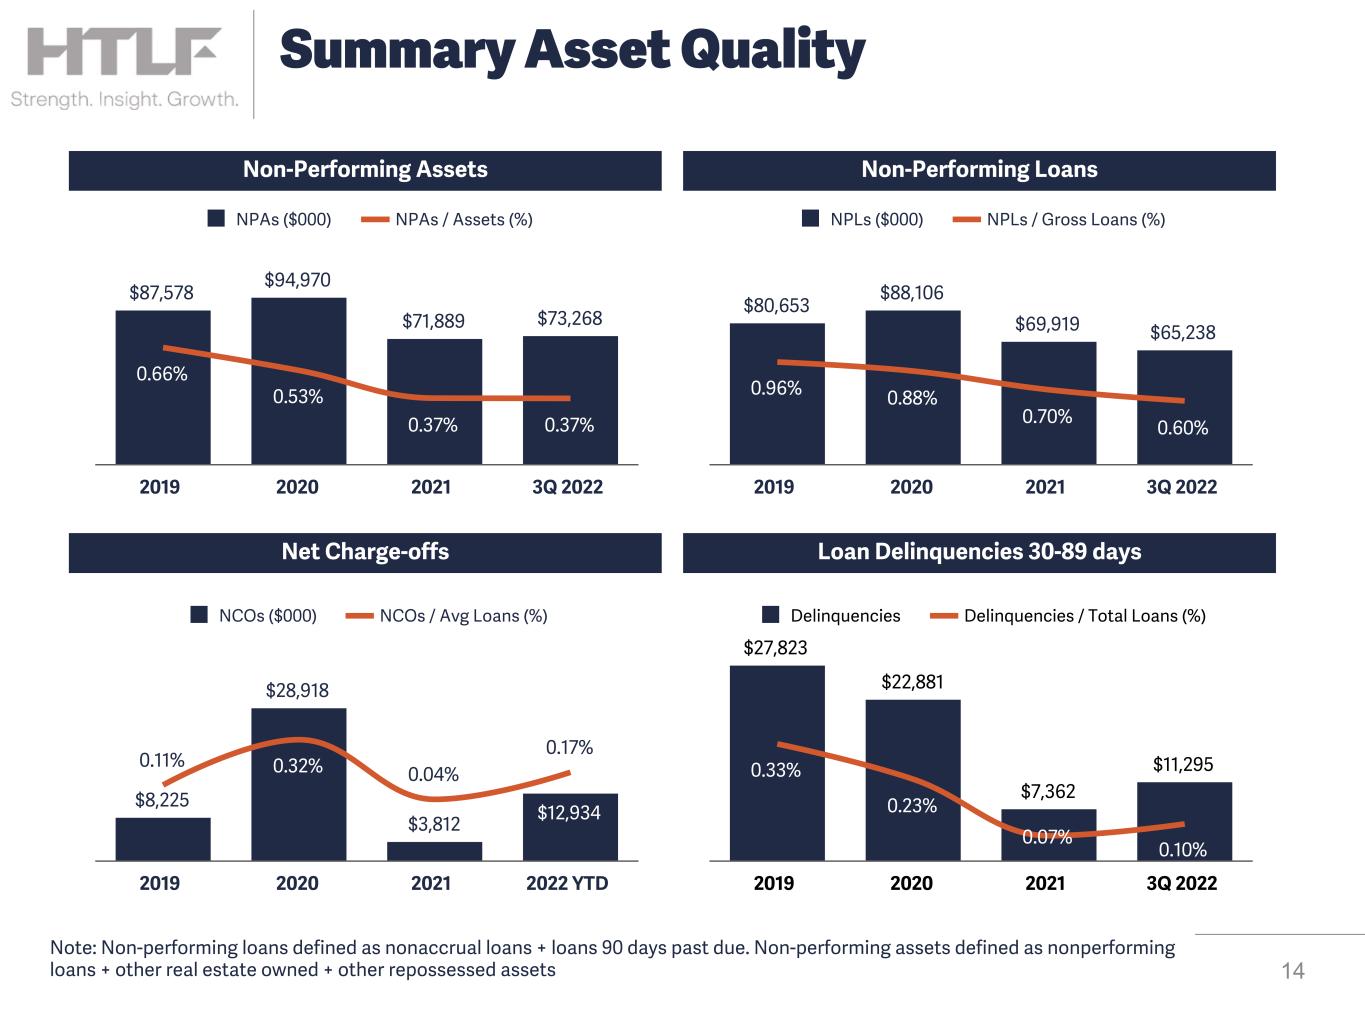
Non-Performing Assets Non-Performing Loans Net Charge-offs Loan Delinquencies 30-89 days $87,578 $94,970 $71,889 $73,268 0.66% 0.53% 0.37% 0.37% NPAs ($000) NPAs / Assets (%) 2019 2020 2021 3Q 2022 $80,653 $88,106 $69,919 $65,238 0.96% 0.88% 0.70% 0.60% NPLs ($000) NPLs / Gross Loans (%) 2019 2020 2021 3Q 2022 $8,225 $28,918 $3,812 $12,934 0.11% 0.32% 0.04% 0.17% NCOs ($000) NCOs / Avg Loans (%) 2019 2020 2021 2022 YTD $27,823 $22,881 $7,362 $11,2950.33% 0.23% 0.07% 0.10% Delinquencies Delinquencies / Total Loans (%) 2019 2020 2021 3Q 2022 14 Summary Asset Quality Note: Non-performing loans defined as nonaccrual loans + loans 90 days past due. Non-performing assets defined as nonperforming loans + other real estate owned + other repossessed assets
Financial Summary 15
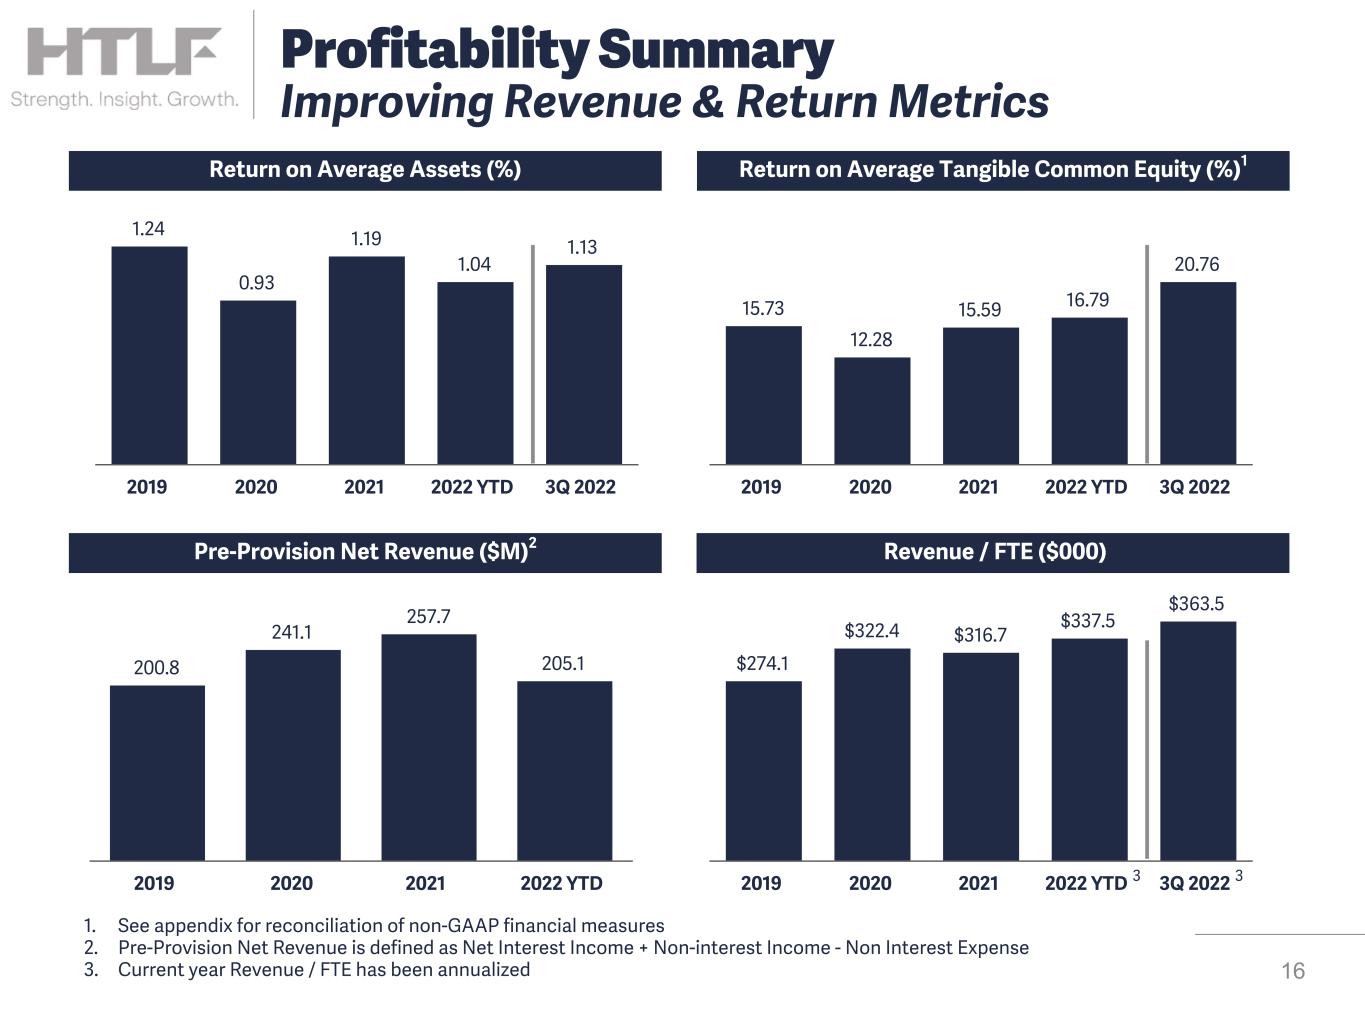
Return on Average Assets (%) Return on Average Tangible Common Equity (%)1 Pre-Provision Net Revenue ($M)2 Revenue / FTE ($000) 1.24 0.93 1.19 1.04 1.13 2019 2020 2021 2022 YTD 3Q 2022 $274.1 $322.4 $316.7 $337.5 $363.5 2019 2020 2021 2022 YTD 3Q 2022 200.8 241.1 257.7 205.1 2019 2020 2021 2022 YTD 16 1. See appendix for reconciliation of non-GAAP financial measures 2. Pre-Provision Net Revenue is defined as Net Interest Income + Non-interest Income - Non Interest Expense 3. Current year Revenue / FTE has been annualized 15.73 12.28 15.59 16.79 20.76 2019 2020 2021 2022 YTD 3Q 2022 Profitability Summary Improving Revenue & Return Metrics 33

4.04% 3.69% 3.33% 3.27% 3.86% 3.57% 3.24% 3.22% 0.18% 0.12% 0.09% 0.05% 2019 2020 2021 2022 YTD 3.34% 3.12% 3.12% 3.22% 3.45% 3.26% 3.07% 3.07% 3.15% 3.42% 0.08% 0.05% 0.05% 0.07% 0.03% 3Q 2021 4Q 2021 1Q 2022 2Q 2022 3Q 2022 n Core Business n Purchase Accounting 171. On a fully tax equivalent basis; See appendix for reconciliation of non-GAAP financial measures Net Interest Margin Breakdown Quarterly - NIM1Annualized - NIM1
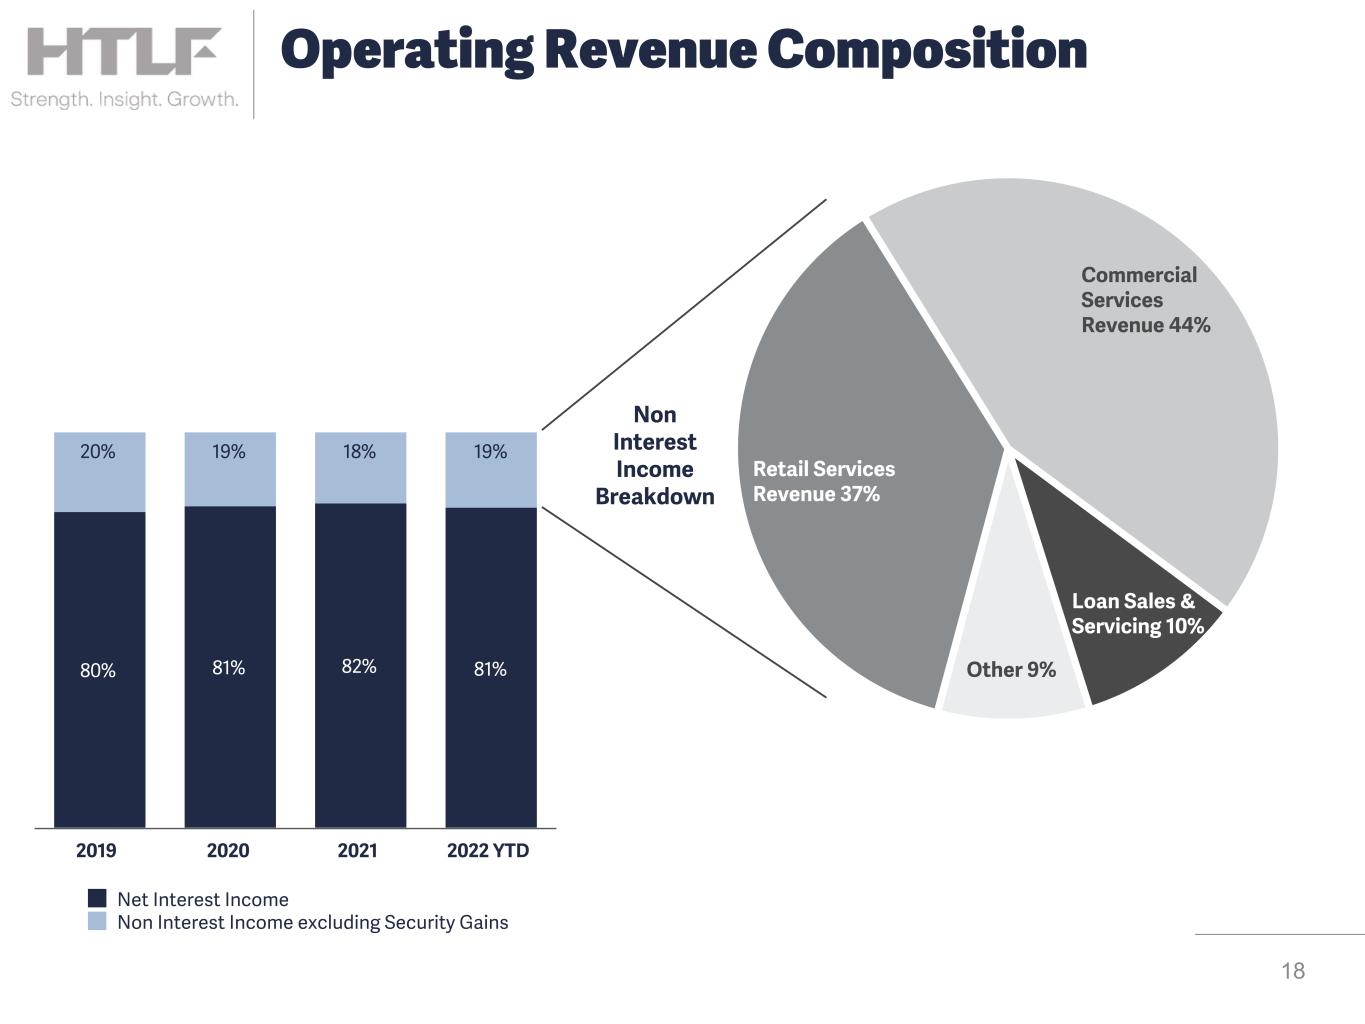
Non Interest Income Breakdown 80% 81% 82% 81% 20% 19% 18% 19% Net Interest Income Non Interest Income excluding Security Gains 2019 2020 2021 2022 YTD Retail Services Revenue 37% Commercial Services Revenue 44% Loan Sales & Servicing 10% Other 9% 18 Operating Revenue Composition
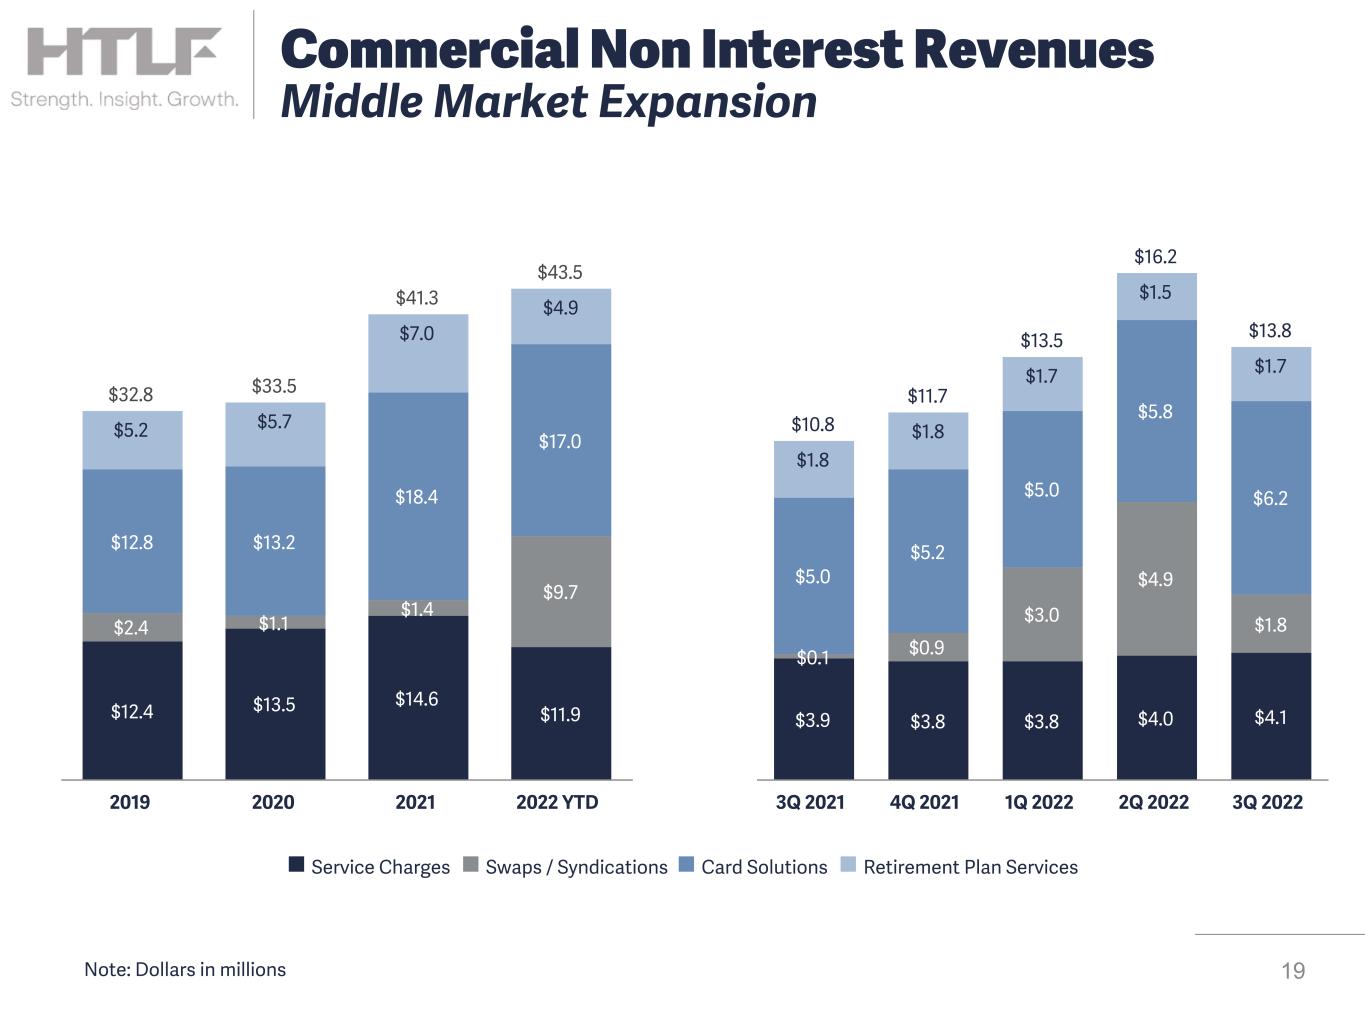
$32.8 $33.5 $41.3 $43.5 $12.4 $13.5 $14.6 $11.9 $2.4 $1.1 $1.4 $9.7 $12.8 $13.2 $18.4 $17.0$5.2 $5.7 $7.0 $4.9 2019 2020 2021 2022 YTD $10.8 $11.7 $13.5 $16.2 $13.8 $3.9 $3.8 $3.8 $4.0 $4.1 $0.1 $0.9 $3.0 $4.9 $1.8 $5.0 $5.2 $5.0 $5.8 $6.2 $1.8 $1.8 $1.7 $1.5 $1.7 3Q 2021 4Q 2021 1Q 2022 2Q 2022 3Q 2022 n Service Charges n Swaps / Syndications n Card Solutions n Retirement Plan Services 19Note: Dollars in millions Commercial Non Interest Revenues Middle Market Expansion
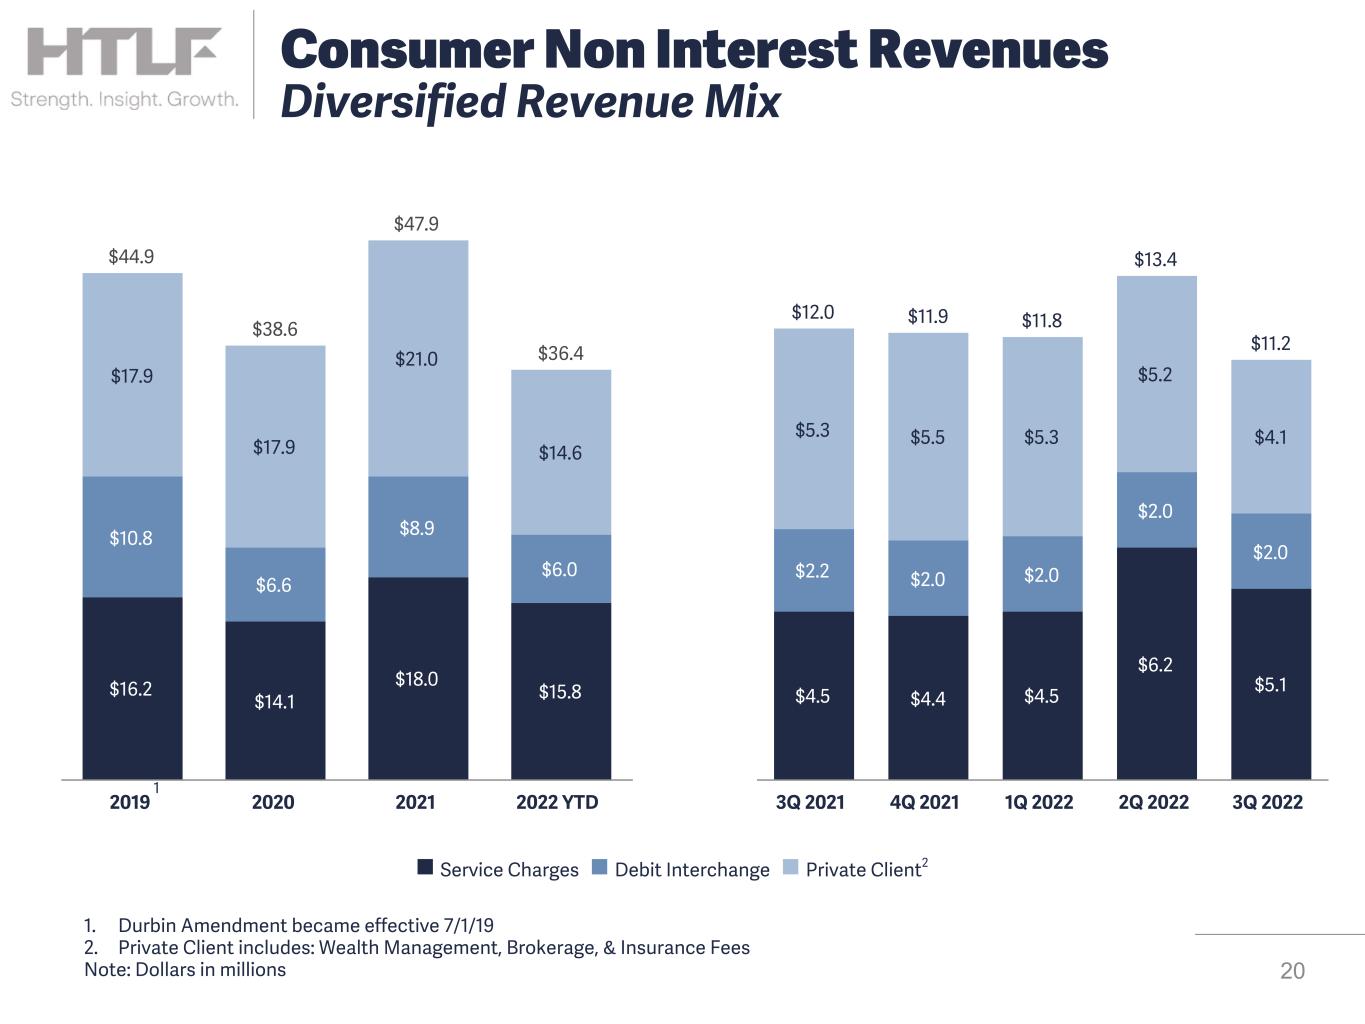
1. Durbin Amendment became effective 7/1/19 2. Private Client includes: Wealth Management, Brokerage, & Insurance Fees Note: Dollars in millions $44.9 $38.6 $47.9 $36.4 $16.2 $14.1 $18.0 $15.8 $10.8 $6.6 $8.9 $6.0 $17.9 $17.9 $21.0 $14.6 2019 2020 2021 2022 YTD $12.0 $11.9 $11.8 $13.4 $11.2 $4.5 $4.4 $4.5 $6.2 $5.1 $2.2 $2.0 $2.0 $2.0 $2.0 $5.3 $5.5 $5.3 $5.2 $4.1 3Q 2021 4Q 2021 1Q 2022 2Q 2022 3Q 2022 n Service Charges n Debit Interchange n Private Client2 20 Consumer Non Interest Revenues Diversified Revenue Mix 1
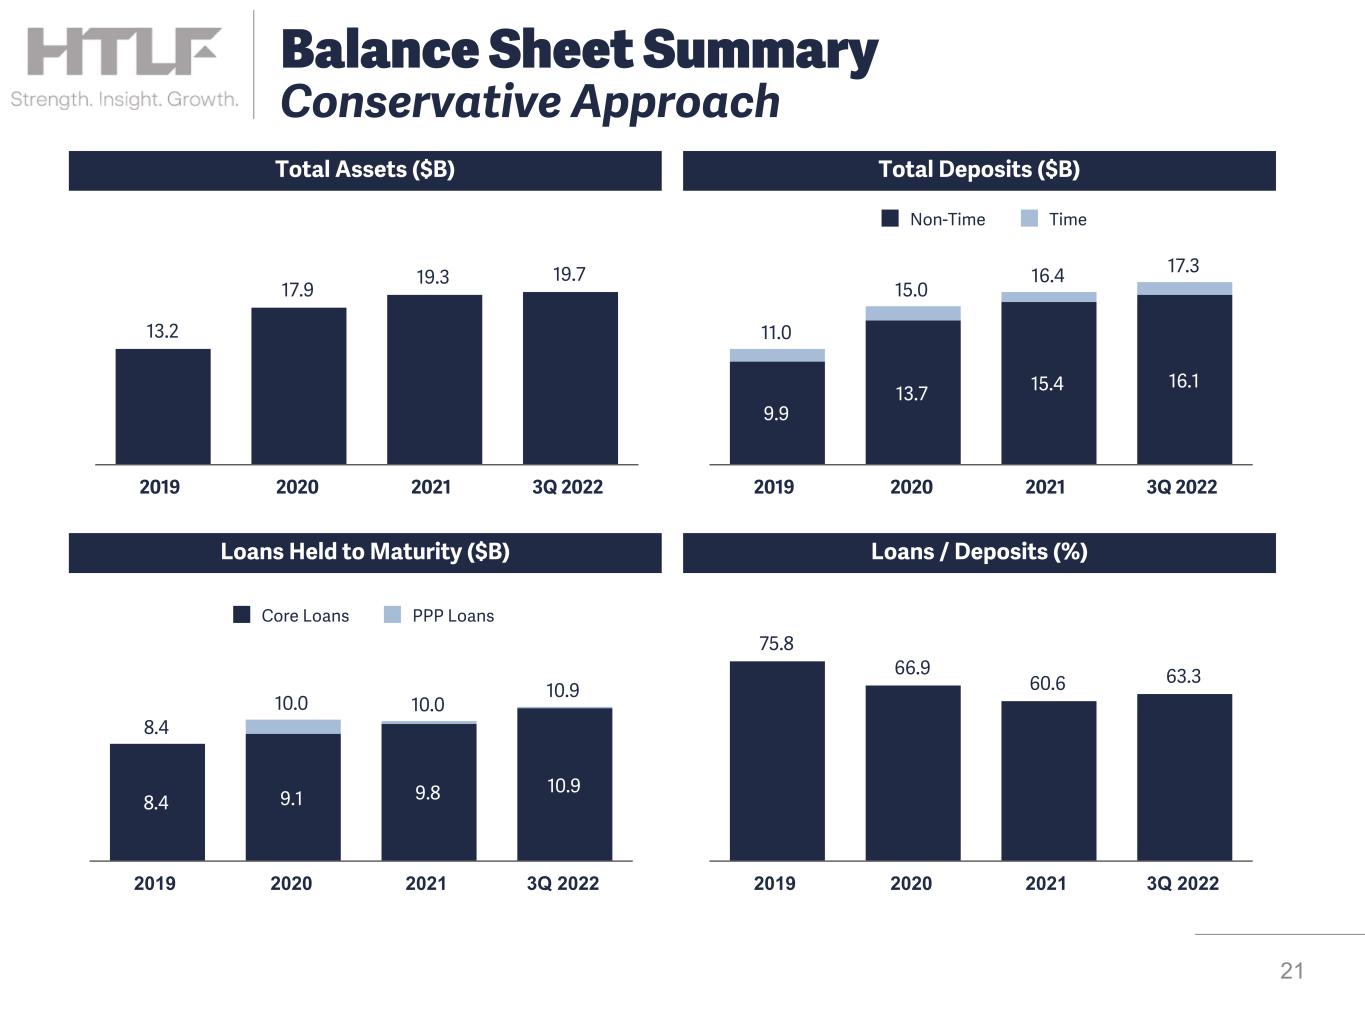
Total Assets ($B) Total Deposits ($B) Loans Held to Maturity ($B) Loans / Deposits (%) 13.2 17.9 19.3 19.7 2019 2020 2021 3Q 2022 11.0 15.0 16.4 17.3 9.9 13.7 15.4 16.1 Non-Time Time 2019 2020 2021 3Q 2022 8.4 10.0 10.0 10.9 8.4 9.1 9.8 10.9 Core Loans PPP Loans 2019 2020 2021 3Q 2022 75.8 66.9 60.6 63.3 2019 2020 2021 3Q 2022 21 Balance Sheet Summary Conservative Approach

Loan Composition by Product Type Loans by Bank Division Loan Held to Maturity ($M)Operating Line Utilization Rates C&I 30% CRE-OO 21% CRE-NOO 20% RESI 8% AG 7% CONS 5% CONST 9% Yield on Loans: 4.58%1 TX 14% CO 13% NM 8% IA 10% IL 8% AZ 12% WI 9% KS/MO 6% CA 8% MN 6% MT 4% 30% 30% 31% 33% 33% 45% 47% 44% 42% 36% C&I Loans Ag 3Q 2021 4Q 2021 1Q 2022 2Q 2022 3Q 2022 $9,855 $9,955 $10,177 $10,678 $10,924 $9,446 $9,755 $10,103 $10,655 $10,910 $409 HTM Loans ex PPP PPP 3Q 2021 4Q 2021 1Q 2022 2Q 2022 3Q 2022 22 1. Based on average loans QTD as of September 30, 2022 and includes AFS loans and nonaccrual loans; includes purchase accounting of 0.03% Diversified Loan Portfolio Across both Product and Footprint
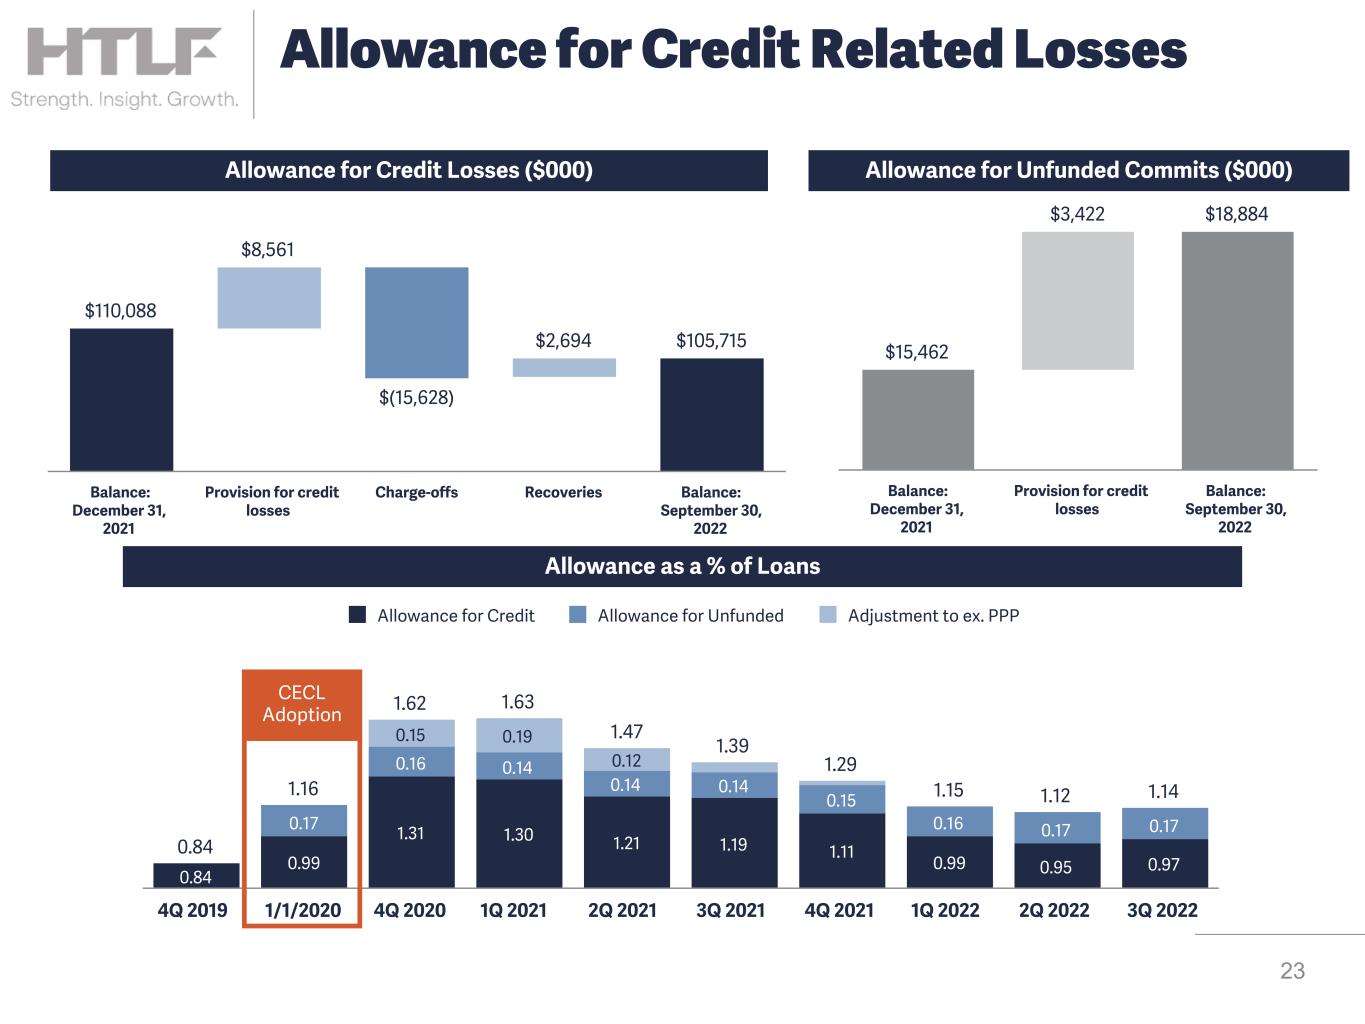
0.84 1.16 1.15 1.12 1.14 1.62 1.63 1.47 1.39 1.29 0.84 0.99 1.31 1.30 1.21 1.19 1.11 0.99 0.95 0.97 0.17 0.16 0.14 0.14 0.14 0.15 0.16 0.17 0.17 0.15 0.19 0.12 Allowance for Credit Allowance for Unfunded Adjustment to ex. PPP 4Q 2019 1/1/2020 4Q 2020 1Q 2021 2Q 2021 3Q 2021 4Q 2021 1Q 2022 2Q 2022 3Q 2022 $15,462 $3,422 $18,884 Balance: December 31, 2021 Provision for credit losses Balance: September 30, 2022 Allowance as a % of Loans Allowance for Credit Losses ($000) Allowance for Unfunded Commits ($000) $110,088 $8,561 $(15,628) $2,694 $105,715 Balance: December 31, 2021 Provision for credit losses Charge-offs Recoveries Balance: September 30, 2022 23 Allowance for Credit Related Losses CECL Adoption
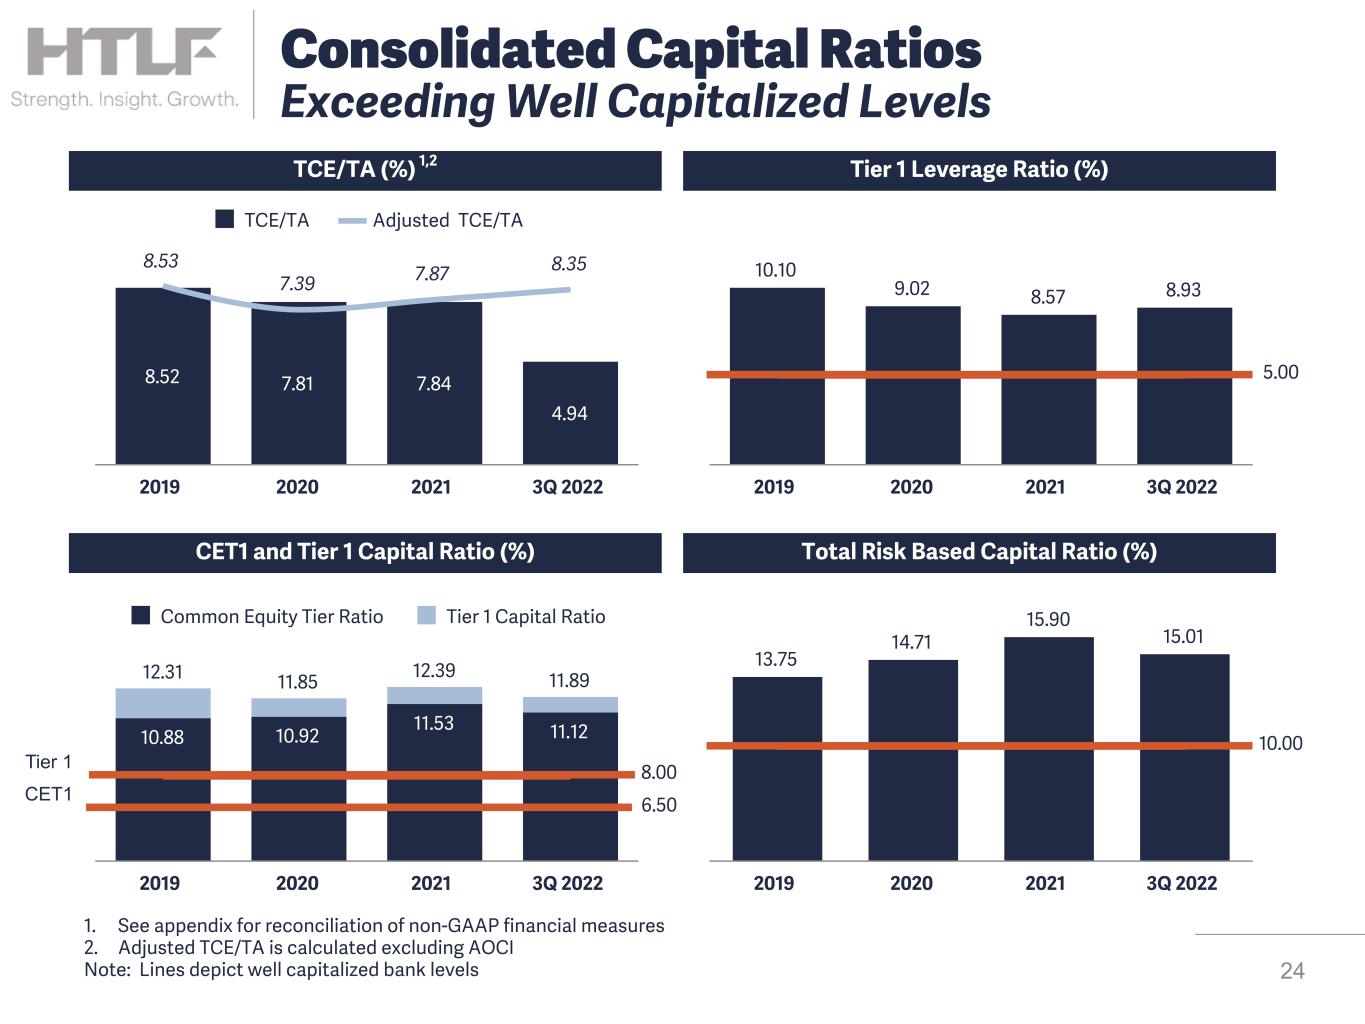
TCE/TA (%) 1,2 Tier 1 Leverage Ratio (%) CET1 and Tier 1 Capital Ratio (%) Total Risk Based Capital Ratio (%) 8.52 7.81 7.84 4.94 8.53 7.39 7.87 8.35 TCE/TA Adjusted TCE/TA 2019 2020 2021 3Q 2022 10.10 9.02 8.57 8.93 5.00 2019 2020 2021 3Q 2022 12.31 11.85 12.39 11.89 10.88 10.92 11.53 11.12 Common Equity Tier Ratio Tier 1 Capital Ratio 2019 2020 2021 3Q 2022 13.75 14.71 15.90 15.01 2019 2020 2021 3Q 2022 CET1 Tier 1 24 1. See appendix for reconciliation of non-GAAP financial measures 2. Adjusted TCE/TA is calculated excluding AOCI Note: Lines depict well capitalized bank levels Consolidated Capital Ratios Exceeding Well Capitalized Levels 5.00 6.50 8.00 10.00
Liquidity, Investments & Funding 25
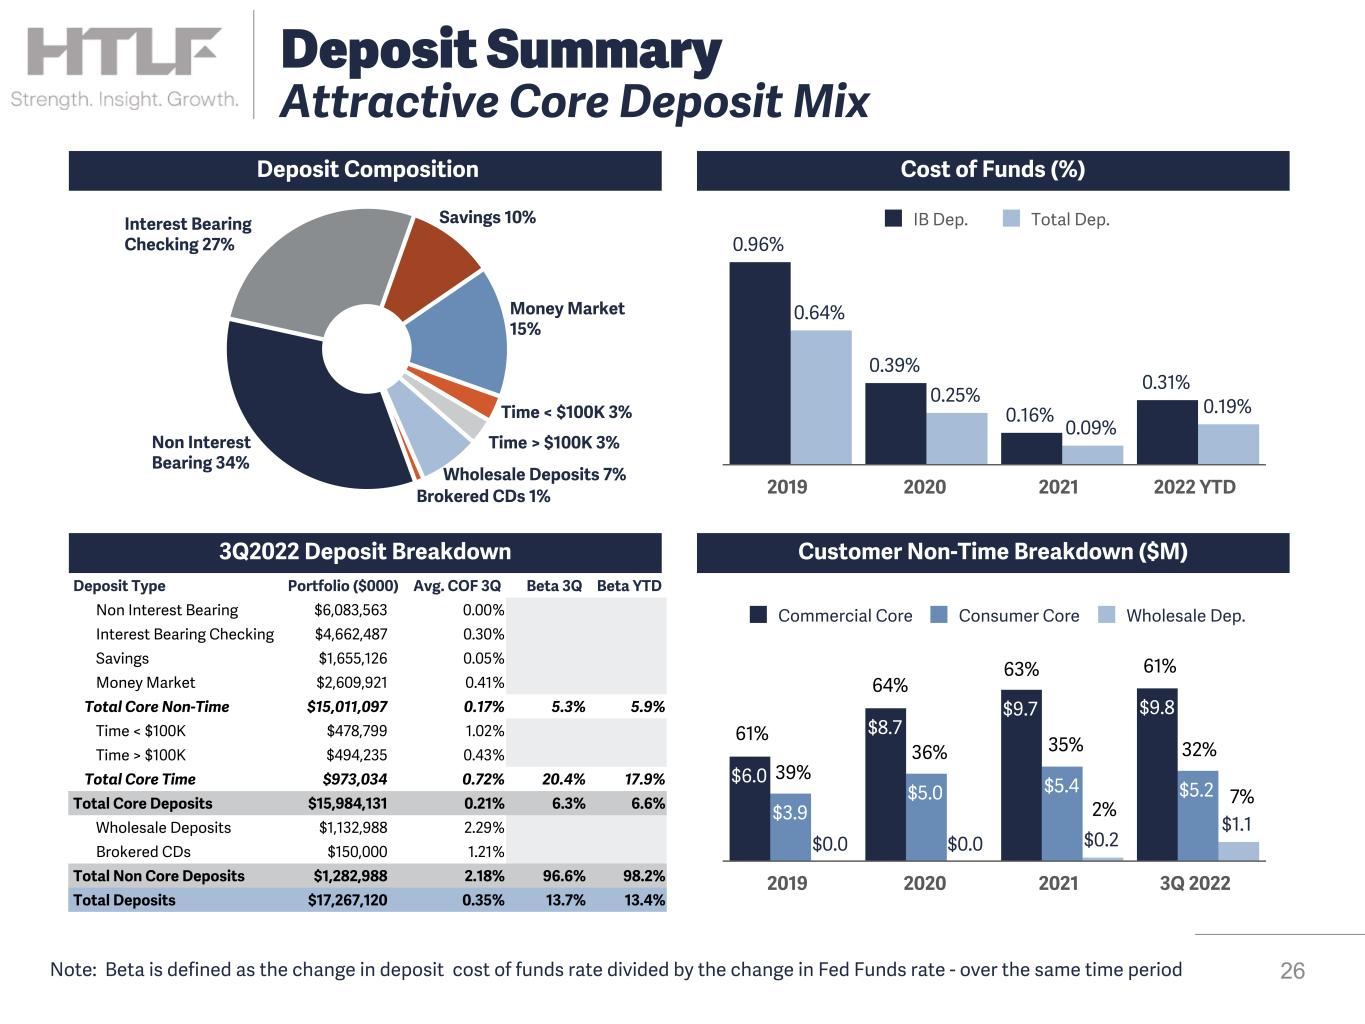
$6.0 $8.7 $9.7 $9.8 $3.9 $5.0 $5.4 $5.2 $0.0 $0.0 $0.2 $1.1 Commercial Core Consumer Core Wholesale Dep. 2019 2020 2021 3Q 2022 Deposit Composition Cost of Funds (%) Customer Non-Time Breakdown ($M) 0.96% 0.39% 0.16% 0.31% 0.64% 0.25% 0.09% 0.19% IB Dep. Total Dep. 2019 2020 2021 2022 YTD 61% 39% 64% 36% 63% 35% 61% 32% 26 Deposit Summary Attractive Core Deposit Mix Non Interest Bearing 34% Interest Bearing Checking 27% Savings 10% Money Market 15% Time < $100K 3% Time > $100K 3% Wholesale Deposits 7% Brokered CDs 1% 7% 2% Deposit Type Portfolio ($000) Avg. COF 3Q Beta 3Q Beta YTD Non Interest Bearing $6,083,563 0.00 % Interest Bearing Checking $4,662,487 0.30 % Savings $1,655,126 0.05 % Money Market $2,609,921 0.41 % Total Core Non-Time $15,011,097 0.17 % 5.3 % 5.9 % Time < $100K $478,799 1.02 % Time > $100K $494,235 0.43 % Total Core Time $973,034 0.72 % 20.4 % 17.9 % Total Core Deposits $15,984,131 0.21 % 6.3 % 6.6 % Wholesale Deposits $1,132,988 2.29 % Brokered CDs $150,000 1.21 % Total Non Core Deposits $1,282,988 2.18 % 96.6 % 98.2 % Total Deposits $17,267,120 0.35 % 13.7 % 13.4 % 3Q2022 Deposit Breakdown Note: Beta is defined as the change in deposit cost of funds rate divided by the change in Fed Funds rate - over the same time period
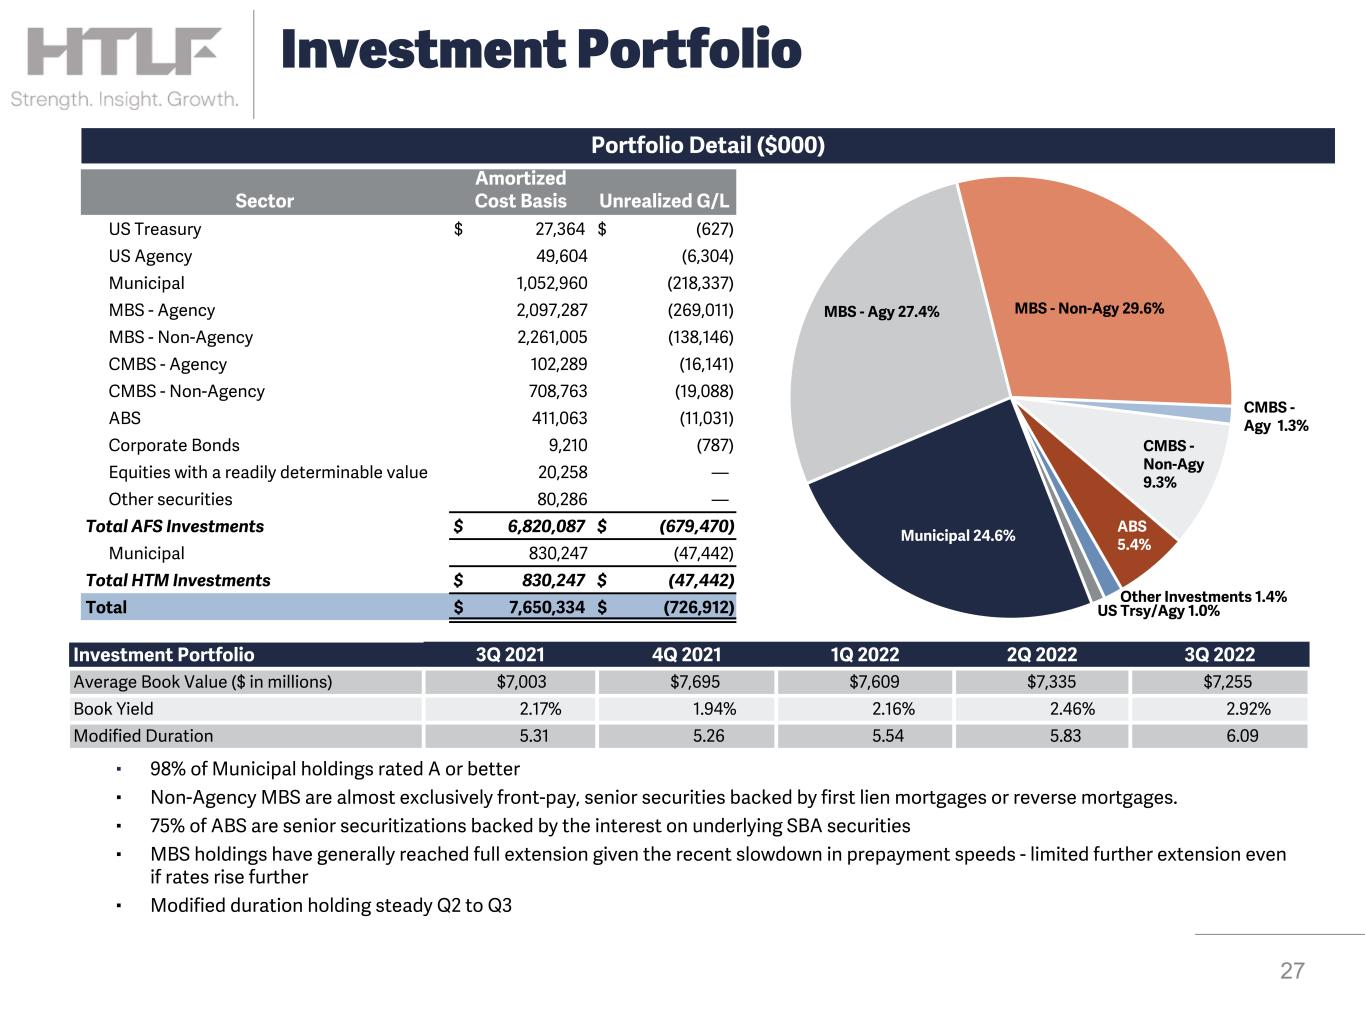
▪ 98% of Municipal holdings rated A or better ▪ Non-Agency MBS are almost exclusively front-pay, senior securities backed by first lien mortgages or reverse mortgages. ▪ 75% of ABS are senior securitizations backed by the interest on underlying SBA securities ▪ MBS holdings have generally reached full extension given the recent slowdown in prepayment speeds - limited further extension even if rates rise further ▪ Modified duration holding steady Q2 to Q3 Portfolio Detail ($000) Sector Amortized Cost Basis Unrealized G/L US Treasury $ 27,364 $ (627) US Agency 49,604 (6,304) Municipal 1,052,960 (218,337) MBS - Agency 2,097,287 (269,011) MBS - Non-Agency 2,261,005 (138,146) CMBS - Agency 102,289 (16,141) CMBS - Non-Agency 708,763 (19,088) ABS 411,063 (11,031) Corporate Bonds 9,210 (787) Equities with a readily determinable value 20,258 — Other securities 80,286 — Total AFS Investments $ 6,820,087 $ (679,470) Municipal 830,247 (47,442) Total HTM Investments $ 830,247 $ (47,442) Total $ 7,650,334 $ (726,912) Investment Portfolio 3Q 2021 4Q 2021 1Q 2022 2Q 2022 3Q 2022 Average Book Value ($ in millions) $7,003 $7,695 $7,609 $7,335 $7,255 Book Yield 2.17% 1.94% 2.16% 2.46% 2.92% Modified Duration 5.31 5.26 5.54 5.83 6.09 US Trsy/Agy 1.0% Municipal 24.6% MBS - Agy 27.4% MBS - Non-Agy 29.6% CMBS - Agy 1.3% CMBS - Non-Agy 9.3% ABS 5.4% Other Investments 1.4% 27 Investment Portfolio

Projected cash flow from Investments for the next 12 months: > $1 billion Capital Instruments ($M)Liquidity Metrics Additional Sources of Bank Funding ($M)Holding Company Detail ($M) Type Amount Outstanding Available Cash & Due from Banks N/A $ 297.3 Revolving Credit Line with Unaffiliated Bank $ — 100.0 Subordinated Debt 222.6 — Trust Preferred 148.0 — Preferred Stock 110.7 — Total $ 481.3 $ 397.3 Type Amount Outstanding Available FHLB Advances $ 0.8 $ 762.0 Federal Funds Purchased — 426.5 Securities Sold Under Agreement to Repurchase 111.0 — Federal Reserve Discount Window 30.0 567.3 Other Short-term Borrowings 6.0 — Total $ 147.8 $ 1,755.8 2019 2020 2021 2022 Loans / Deposits 75.8 % 66.9 % 60.6 % 63.3 % Investments / Assets 26.0 % 35.1 % 39.9 % 35.4 % Total Borrowings / Assets 3.5 % 3.5 % 2.6 % 2.6 % Outstanding Debt Amount Outstanding Mat. Date Current Rate (%)1 Trust Preferred Securities $ 148.0 Various 5.75 % Subordinated Note (non-callable) 74.7 12/30/2024 5.75 % Subordinated Note (fixed/float)2 147.9 9/15/2031 2.75 % Subtotal of debt $ 370.6 4.55 % Preferred Stock3 $ 110.7 7.00 % 28 1. Refers to weighted average rate of capital instruments 2. Subordinated note begins to float at 3 month SOFR + 210 bps on 9/15/2026, callable on this date 3. Preferred Stock begins to float at 5 yr Treasury + 6.675% on 7/15/2025, callable on this date Conservative Liquidity Profile
29 Integrity Community Accountability Excellence Always do the right thing - be honest and open Engage your community and your team - support one another and unlock the potential around you Own the opportunity and the outcome - keep your promises, follow through and follow up Exceed expectations - every customer, every time We See Growth Everywhere Living our Core Values

ESG Integration Project Identify Relevant ESG Sustainability Factors & Climate Risks Assess Current and Future ESG Performance, Risks, Opportunities, and Challenges Adopt a Framework to Integrate, Operationalize, Measure & Report ESG Performance 30 Contributed nearly $1.2M to local organizations in 2021 Investing in solar energy Health & Safety of employees and customers Buy Local Program In 2021, funded over 3,000 Buy Local loans Board Diversity Exceeds NASDAQ Board Diversity Objectives Volunteered over 2,000 hours Employee hours in 2021 Financing the development of low income housing Small Business Loans Processed 8,000 PPP loans for $1.6 billion DEI Initiatives Appointed a Chief Diversity & Inclusion Officer Established Diversity Advisory Counsel to oversee, advise and connect Diversity, Equity, and Inclusion (DEI) activities Published Inaugural DEI Annual Report Launched Employee Business Resource Groups Growth in Environmental, Social and Governance
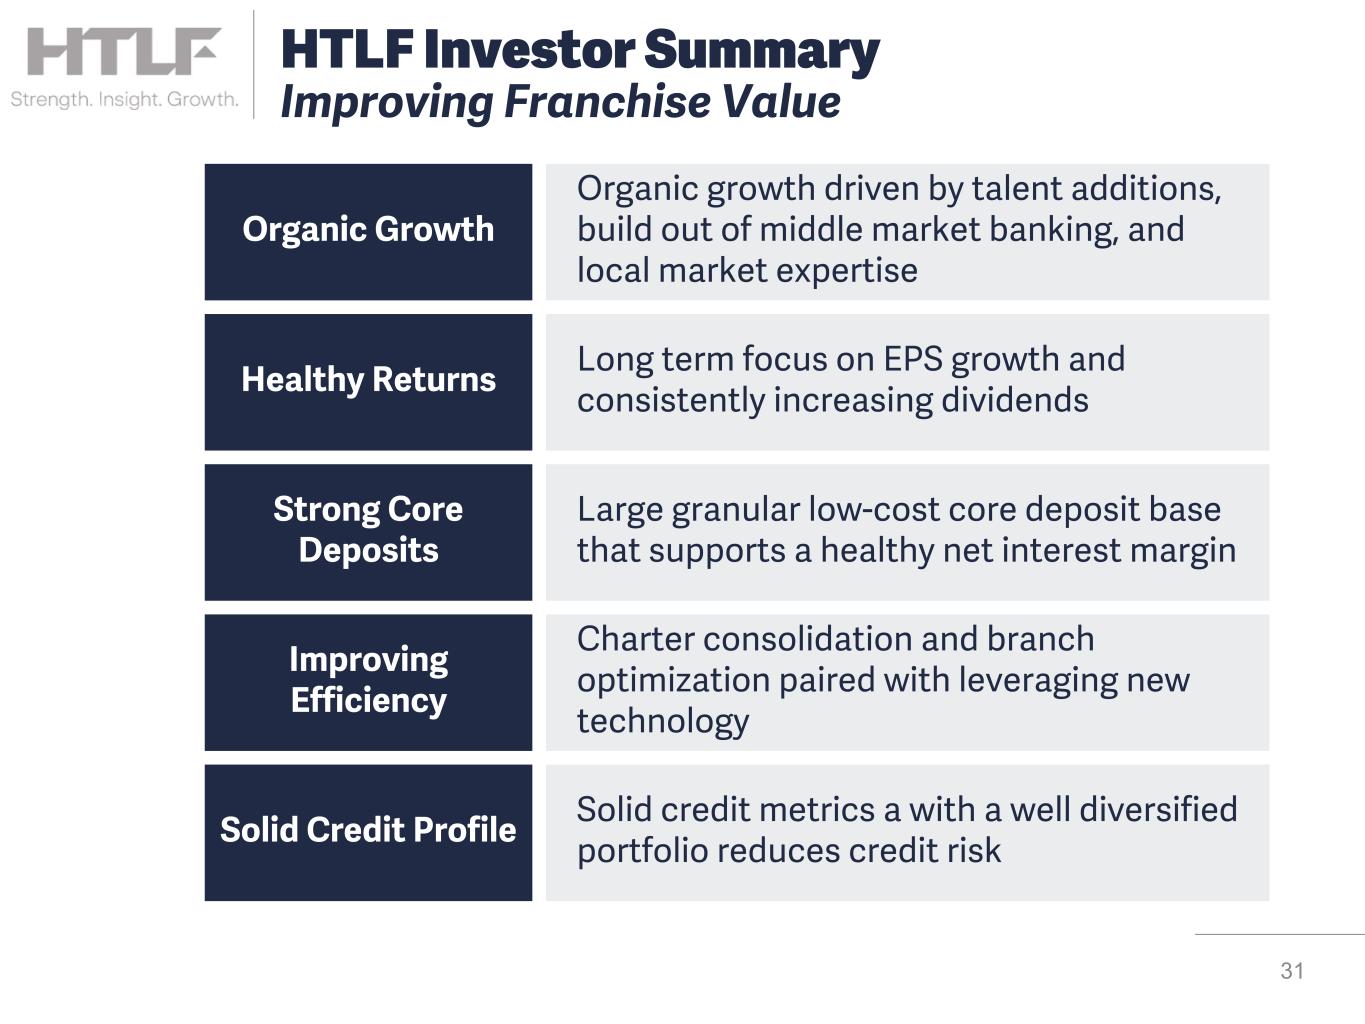
31 Organic Growth Healthy Returns Strong Core Deposits Improving Efficiency Organic growth driven by talent additions, build out of middle market banking, and local market expertise Large granular low-cost core deposit base that supports a healthy net interest margin Charter consolidation and branch optimization paired with leveraging new technology Long term focus on EPS growth and consistently increasing dividends Solid Credit Profile Solid credit metrics a with a well diversified portfolio reduces credit risk HTLF Investor Summary Improving Franchise Value
32 Contact Information

33 Supplementary Data
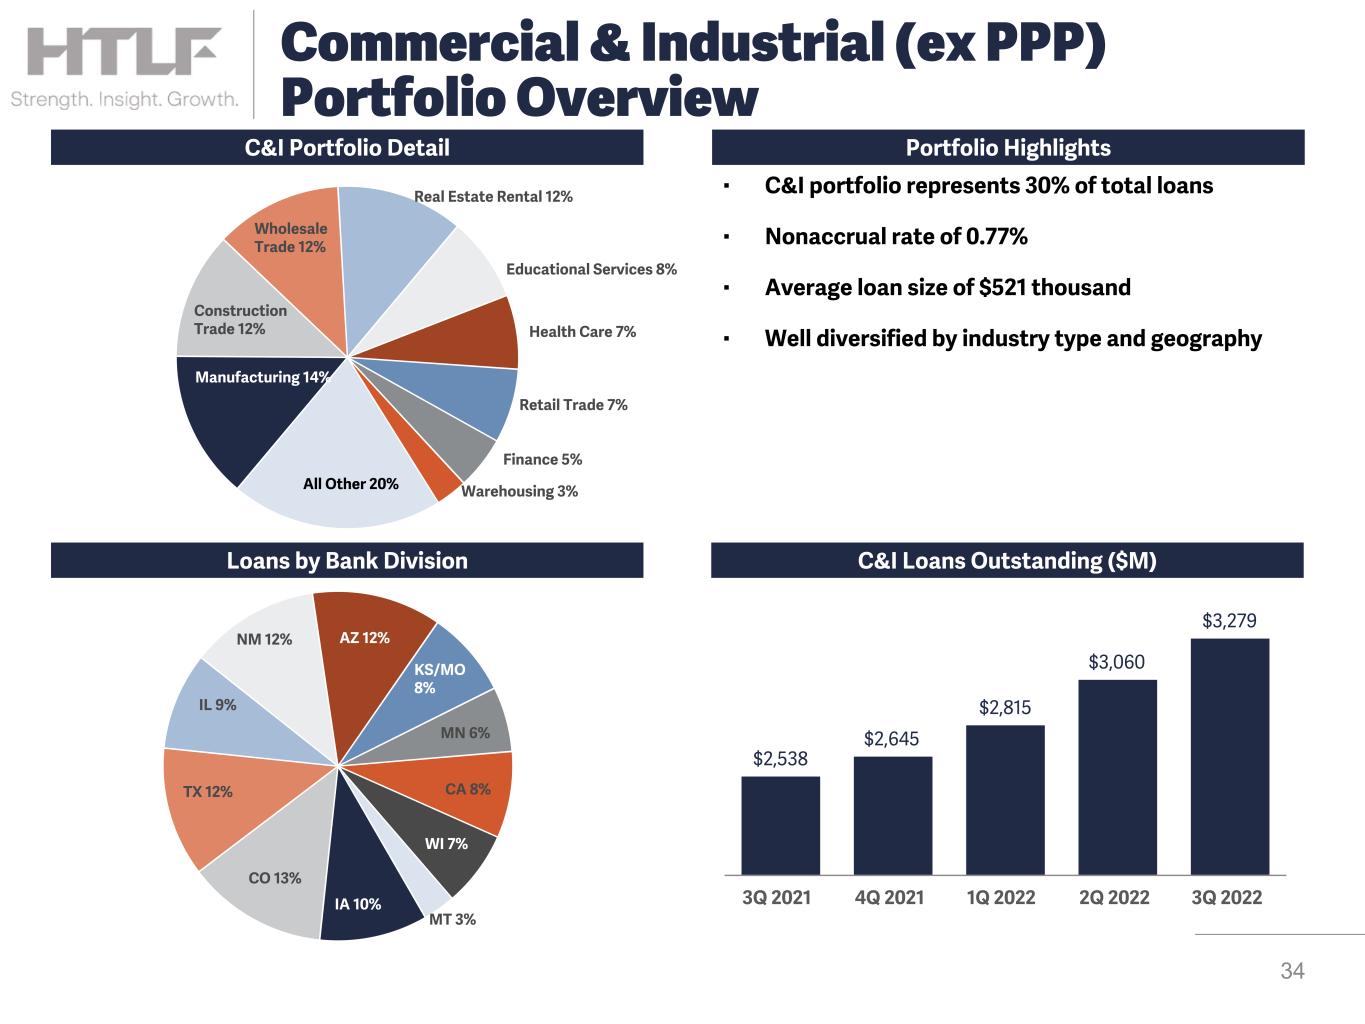
Manufacturing 14% Construction Trade 12% Wholesale Trade 12% Real Estate Rental 12% Educational Services 8% Health Care 7% Retail Trade 7% Finance 5% Warehousing 3%All Other 20% ▪ C&I portfolio represents 30% of total loans ▪ Nonaccrual rate of 0.77% ▪ Average loan size of $521 thousand ▪ Well diversified by industry type and geography C&I Portfolio Detail C&I Loans Outstanding ($M) Portfolio Highlights IA 10% CO 13% TX 12% IL 9% NM 12% AZ 12% KS/MO 8% MN 6% CA 8% WI 7% MT 3% $2,538 $2,645 $2,815 $3,060 $3,279 3Q 2021 4Q 2021 1Q 2022 2Q 2022 3Q 2022 34 Commercial & Industrial (ex PPP) Portfolio Overview Loans by Bank Division
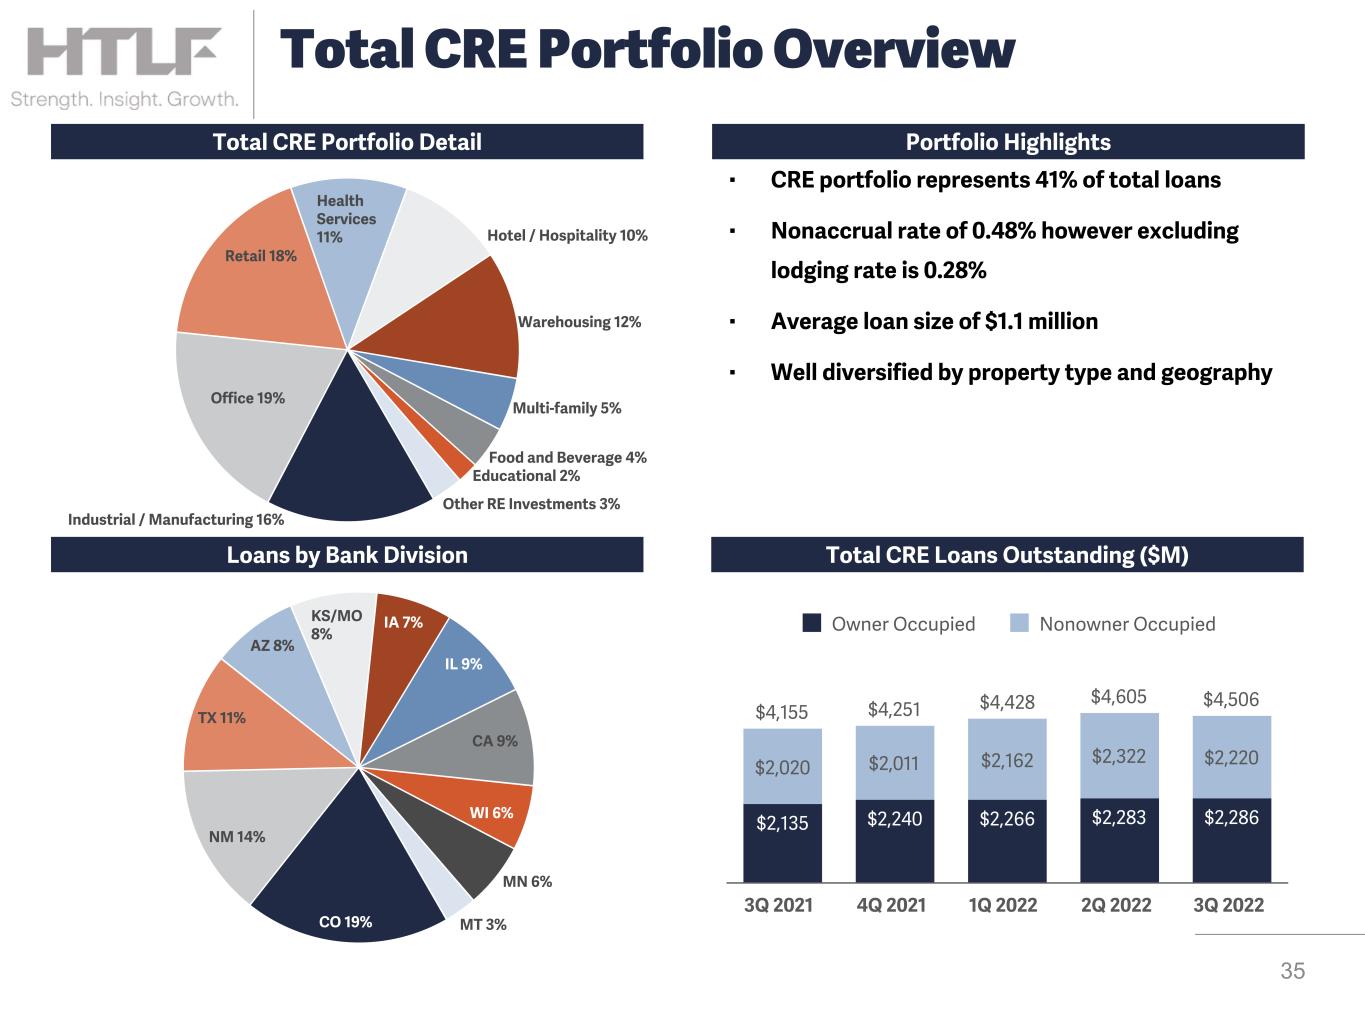
CO 19% NM 14% TX 11% AZ 8% KS/MO 8% IA 7% IL 9% CA 9% WI 6% MN 6% MT 3% Industrial / Manufacturing 16% Office 19% Retail 18% Health Services 11% Hotel / Hospitality 10% Warehousing 12% Multi-family 5% Food and Beverage 4% Educational 2% Other RE Investments 3% ▪ CRE portfolio represents 41% of total loans ▪ Nonaccrual rate of 0.48% however excluding lodging rate is 0.28% ▪ Average loan size of $1.1 million ▪ Well diversified by property type and geography Total CRE Portfolio Detail Total CRE Loans Outstanding ($M) Portfolio Highlights Loans by Bank Division $4,155 $4,251 $4,428 $4,605 $4,506 $2,135 $2,240 $2,266 $2,283 $2,286 $2,020 $2,011 $2,162 $2,322 $2,220 Owner Occupied Nonowner Occupied 3Q 2021 4Q 2021 1Q 2022 2Q 2022 3Q 2022 35 Total CRE Portfolio Overview

TX 24% WI 16% IA 14% NM 12% MT 10% KS/MO 8% CA 10% Other HTLF Markets 6% ▪ Ag portfolio represents 7% of total loans ▪ Nonaccrual rate of 1.04% ▪ Average loan size of $309 thousand ▪ Crop ins. is required on exposures >$500,000 ▪ Increase in Ag portfolio can be attributed to the newly integrated Food & Agribusiness division Portfolio Highlights Agriculture Loans Outstanding ($M) Beef Production 26% Corn and Soybeans 22% Dairy Cattle and Milk Production 9% Cotton Farming 11% Wheat Farming 4% Hog and Pig Farming 1% Other Farming 27% $685 $754 $766 $837 $781 3Q 2021 4Q 2021 1Q 2022 2Q 2022 3Q 2022 36 Agriculture Portfolio Overview Agriculture Portfolio Detail Loans by Bank Division
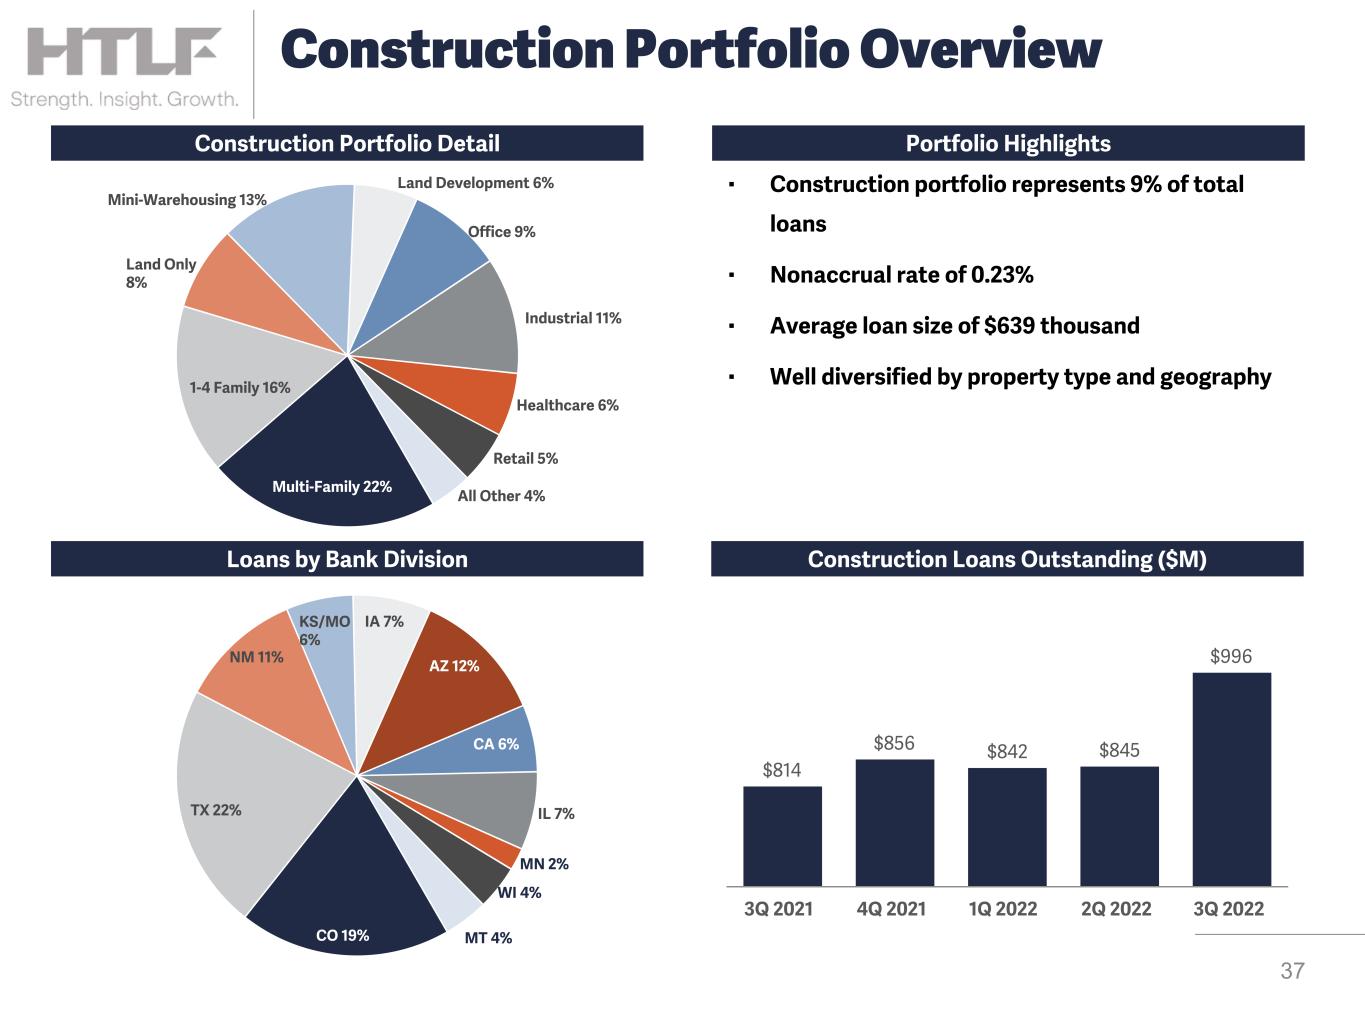
Multi-Family 22% 1-4 Family 16% Land Only 8% Mini-Warehousing 13% Land Development 6% Office 9% Industrial 11% Healthcare 6% Retail 5% All Other 4% Portfolio HighlightsConstruction Portfolio Detail ▪ Construction portfolio represents 9% of total loans ▪ Nonaccrual rate of 0.23% ▪ Average loan size of $639 thousand ▪ Well diversified by property type and geography Loans by Bank Division Construction Loans Outstanding ($M) CO 19% TX 22% NM 11% KS/MO 6% IA 7% AZ 12% CA 6% IL 7% MN 2% WI 4% MT 4% $814 $856 $842 $845 $996 3Q 2021 4Q 2021 1Q 2022 2Q 2022 3Q 2022 37 Construction Portfolio Overview
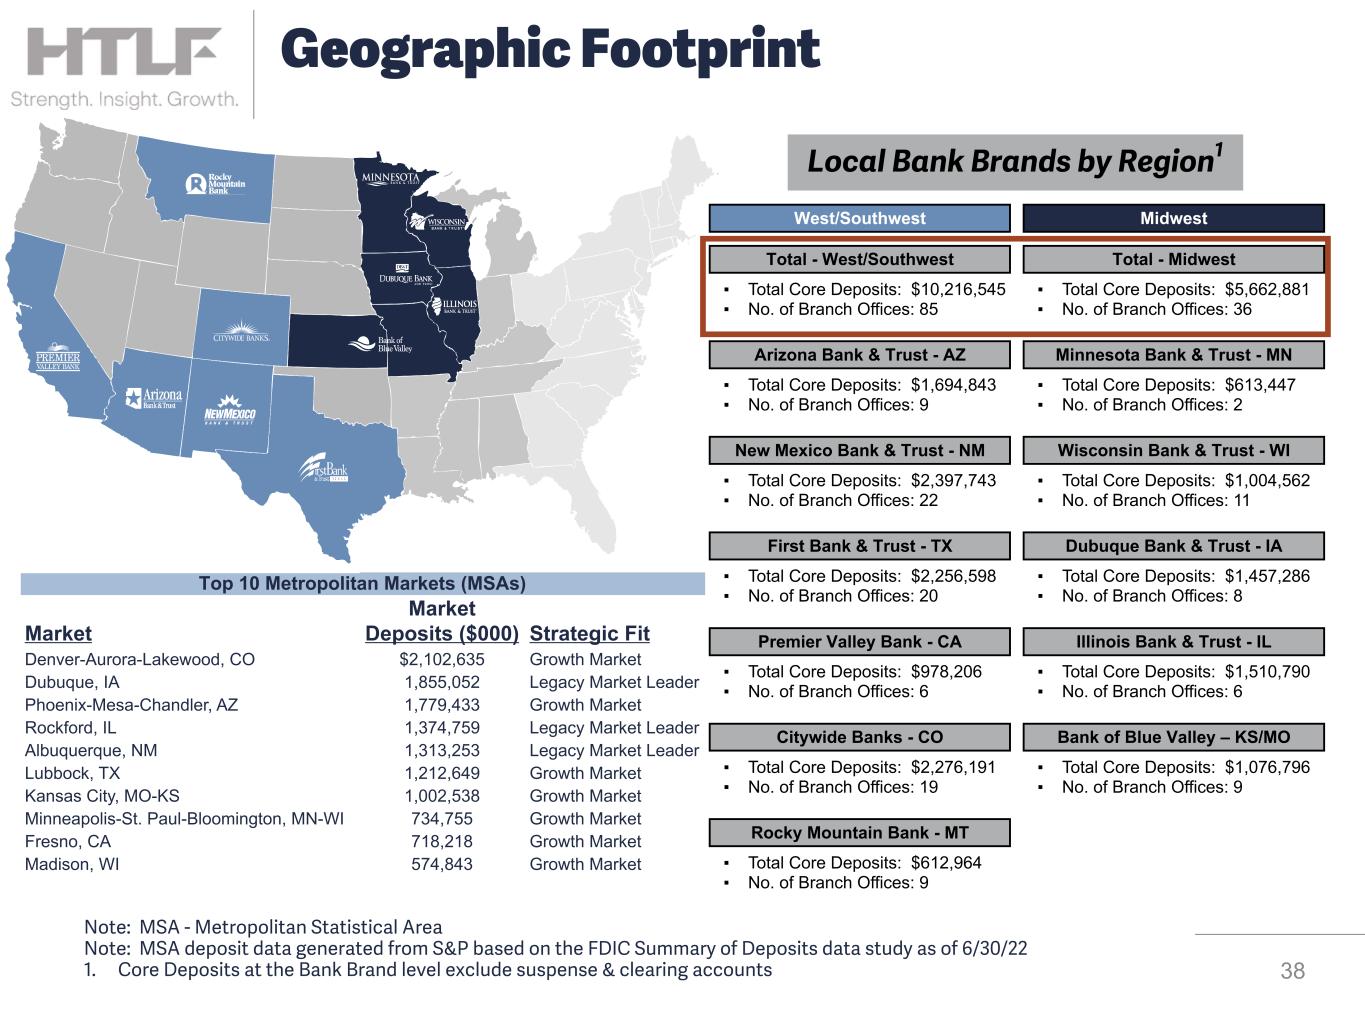
Local Bank Brands by Region1 Bank of Blue Valley – KS/MO Illinois Bank & Trust - IL Total - Midwest Midwest ▪ Total Core Deposits: $1,510,790 ▪ No. of Branch Offices: 6 ▪ Total Core Deposits: $1,076,796 ▪ No. of Branch Offices: 9 Rocky Mountain Bank - MT Citywide Banks - CO Premier Valley Bank - CA West/Southwest ▪ Total Core Deposits: $2,276,191 ▪ No. of Branch Offices: 19 ▪ Total Core Deposits: $978,206 ▪ No. of Branch Offices: 6 ▪ Total Core Deposits: $612,964 ▪ No. of Branch Offices: 9 Wisconsin Bank & Trust - WI ▪ Total Core Deposits: $1,004,562 ▪ No. of Branch Offices: 11 ▪ Total Core Deposits: $5,662,881 ▪ No. of Branch Offices: 36 New Mexico Bank & Trust - NM Total - West/Southwest ▪ Total Core Deposits: $2,397,743 ▪ No. of Branch Offices: 22 ▪ Total Core Deposits: $10,216,545 ▪ No. of Branch Offices: 85 Top 10 Metropolitan Markets (MSAs) Market Market Deposits ($000) Strategic Fit Denver-Aurora-Lakewood, CO $2,102,635 Growth Market Dubuque, IA 1,855,052 Legacy Market Leader Phoenix-Mesa-Chandler, AZ 1,779,433 Growth Market Rockford, IL 1,374,759 Legacy Market Leader Albuquerque, NM 1,313,253 Legacy Market Leader Lubbock, TX 1,212,649 Growth Market Kansas City, MO-KS 1,002,538 Growth Market Minneapolis-St. Paul-Bloomington, MN-WI 734,755 Growth Market Fresno, CA 718,218 Growth Market Madison, WI 574,843 Growth Market Dubuque Bank & Trust - IA ▪ Total Core Deposits: $1,457,286 ▪ No. of Branch Offices: 8 First Bank & Trust - TX ▪ Total Core Deposits: $2,256,598 ▪ No. of Branch Offices: 20 Minnesota Bank & Trust - MN ▪ Total Core Deposits: $613,447 ▪ No. of Branch Offices: 2 Arizona Bank & Trust - AZ ▪ Total Core Deposits: $1,694,843 ▪ No. of Branch Offices: 9 38 Geographic Footprint Note: MSA - Metropolitan Statistical Area Note: MSA deposit data generated from S&P based on the FDIC Summary of Deposits data study as of 6/30/22 1. Core Deposits at the Bank Brand level exclude suspense & clearing accounts

39 Appendix
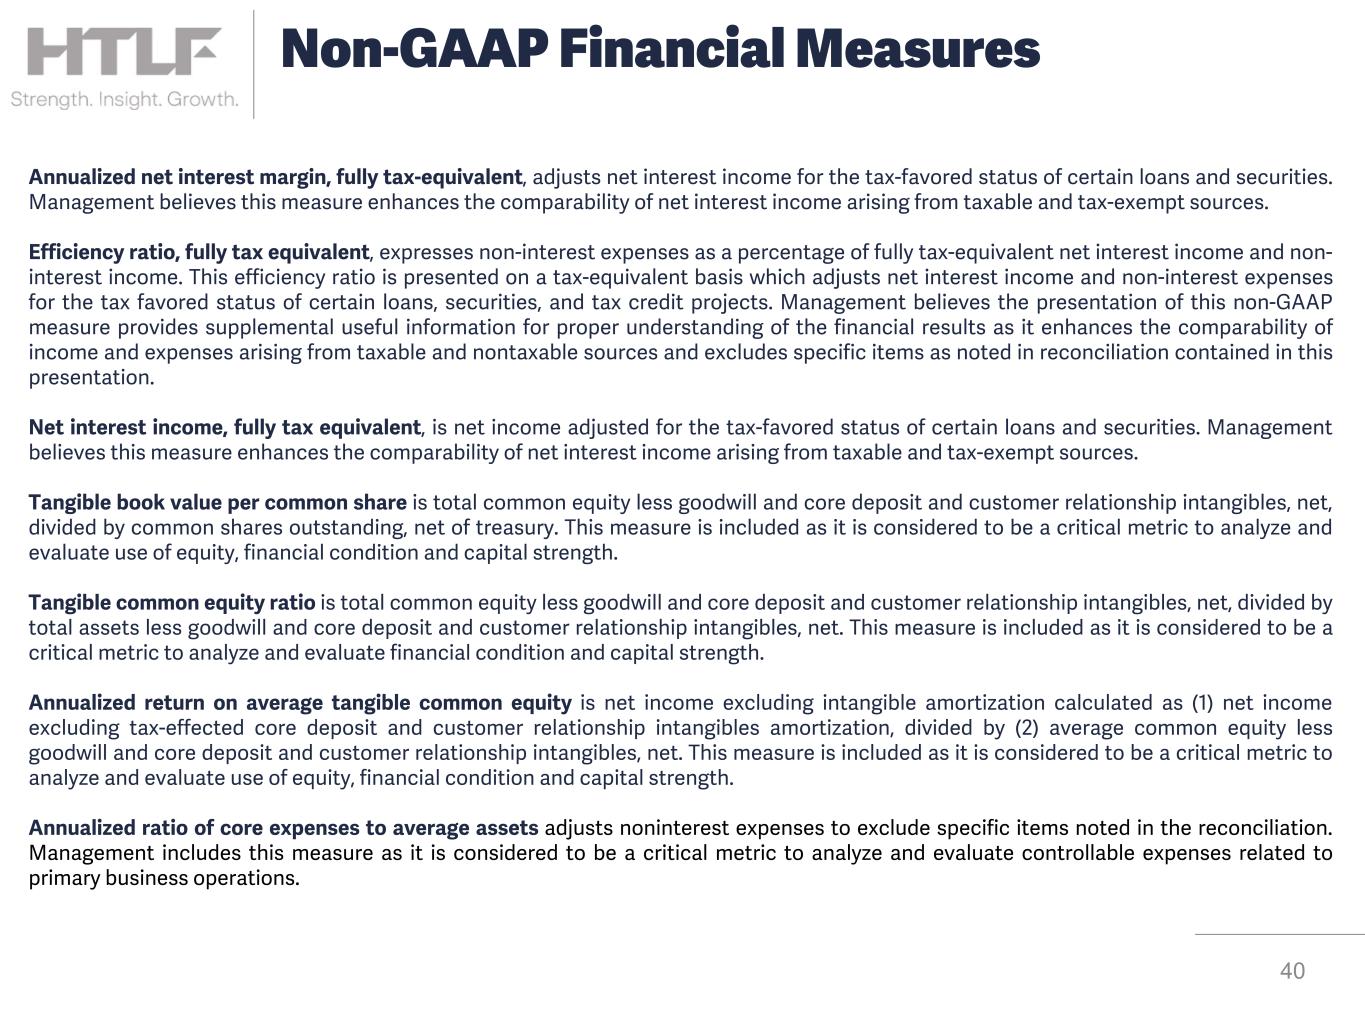
Annualized net interest margin, fully tax-equivalent, adjusts net interest income for the tax-favored status of certain loans and securities. Management believes this measure enhances the comparability of net interest income arising from taxable and tax-exempt sources. Efficiency ratio, fully tax equivalent, expresses non-interest expenses as a percentage of fully tax-equivalent net interest income and non- interest income. This efficiency ratio is presented on a tax-equivalent basis which adjusts net interest income and non-interest expenses for the tax favored status of certain loans, securities, and tax credit projects. Management believes the presentation of this non-GAAP measure provides supplemental useful information for proper understanding of the financial results as it enhances the comparability of income and expenses arising from taxable and nontaxable sources and excludes specific items as noted in reconciliation contained in this presentation. Net interest income, fully tax equivalent, is net income adjusted for the tax-favored status of certain loans and securities. Management believes this measure enhances the comparability of net interest income arising from taxable and tax-exempt sources. Tangible book value per common share is total common equity less goodwill and core deposit and customer relationship intangibles, net, divided by common shares outstanding, net of treasury. This measure is included as it is considered to be a critical metric to analyze and evaluate use of equity, financial condition and capital strength. Tangible common equity ratio is total common equity less goodwill and core deposit and customer relationship intangibles, net, divided by total assets less goodwill and core deposit and customer relationship intangibles, net. This measure is included as it is considered to be a critical metric to analyze and evaluate financial condition and capital strength. Annualized return on average tangible common equity is net income excluding intangible amortization calculated as (1) net income excluding tax-effected core deposit and customer relationship intangibles amortization, divided by (2) average common equity less goodwill and core deposit and customer relationship intangibles, net. This measure is included as it is considered to be a critical metric to analyze and evaluate use of equity, financial condition and capital strength. Annualized ratio of core expenses to average assets adjusts noninterest expenses to exclude specific items noted in the reconciliation. Management includes this measure as it is considered to be a critical metric to analyze and evaluate controllable expenses related to primary business operations. 40 Non-GAAP Financial Measures
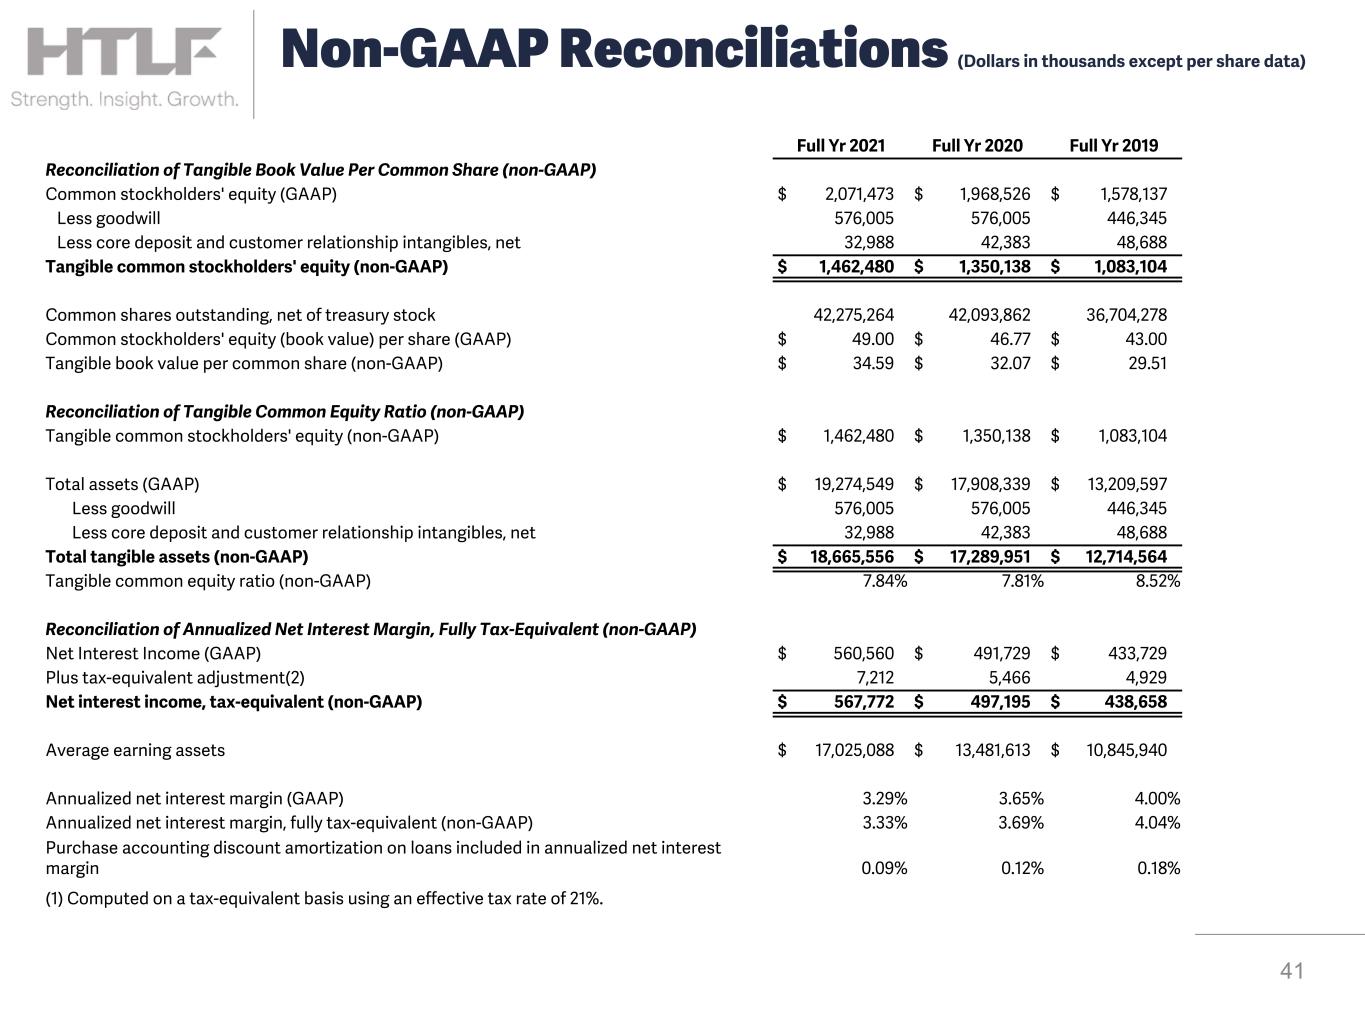
Full Yr 2021 Full Yr 2020 Full Yr 2019 Reconciliation of Tangible Book Value Per Common Share (non-GAAP) Common stockholders' equity (GAAP) $ 2,071,473 $ 1,968,526 $ 1,578,137 Less goodwill 576,005 576,005 446,345 Less core deposit and customer relationship intangibles, net 32,988 42,383 48,688 Tangible common stockholders' equity (non-GAAP) $ 1,462,480 $ 1,350,138 $ 1,083,104 Common shares outstanding, net of treasury stock 42,275,264 42,093,862 36,704,278 Common stockholders' equity (book value) per share (GAAP) $ 49.00 $ 46.77 $ 43.00 Tangible book value per common share (non-GAAP) $ 34.59 $ 32.07 $ 29.51 Reconciliation of Tangible Common Equity Ratio (non-GAAP) Tangible common stockholders' equity (non-GAAP) $ 1,462,480 $ 1,350,138 $ 1,083,104 Total assets (GAAP) $ 19,274,549 $ 17,908,339 $ 13,209,597 Less goodwill 576,005 576,005 446,345 Less core deposit and customer relationship intangibles, net 32,988 42,383 48,688 Total tangible assets (non-GAAP) $ 18,665,556 $ 17,289,951 $ 12,714,564 Tangible common equity ratio (non-GAAP) 7.84 % 7.81 % 8.52 % Reconciliation of Annualized Net Interest Margin, Fully Tax-Equivalent (non-GAAP) Net Interest Income (GAAP) $ 560,560 $ 491,729 $ 433,729 Plus tax-equivalent adjustment(2) 7,212 5,466 4,929 Net interest income, tax-equivalent (non-GAAP) $ 567,772 $ 497,195 $ 438,658 Average earning assets $ 17,025,088 $ 13,481,613 $ 10,845,940 Annualized net interest margin (GAAP) 3.29 % 3.65 % 4.00 % Annualized net interest margin, fully tax-equivalent (non-GAAP) 3.33 % 3.69 % 4.04 % Purchase accounting discount amortization on loans included in annualized net interest margin 0.09 % 0.12 % 0.18 % (1) Computed on a tax-equivalent basis using an effective tax rate of 21%. 41 Non-GAAP Reconciliations (Dollars in thousands except per share data)
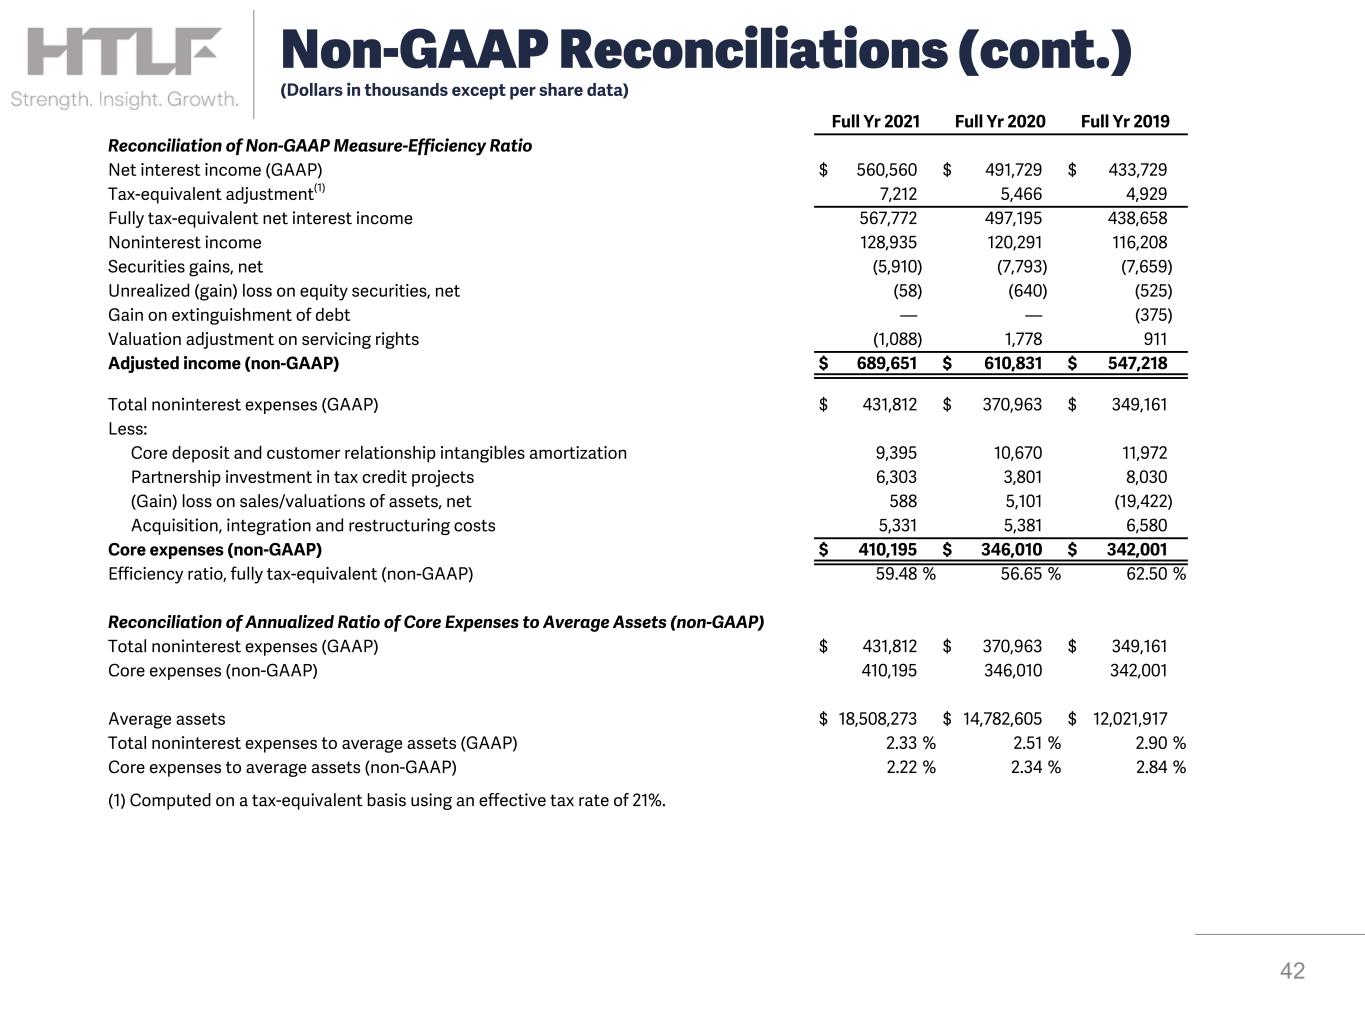
Full Yr 2021 Full Yr 2020 Full Yr 2019 Reconciliation of Non-GAAP Measure-Efficiency Ratio Net interest income (GAAP) $ 560,560 $ 491,729 $ 433,729 Tax-equivalent adjustment(1) 7,212 5,466 4,929 Fully tax-equivalent net interest income 567,772 497,195 438,658 Noninterest income 128,935 120,291 116,208 Securities gains, net (5,910) (7,793) (7,659) Unrealized (gain) loss on equity securities, net (58) (640) (525) Gain on extinguishment of debt — — (375) Valuation adjustment on servicing rights (1,088) 1,778 911 Adjusted income (non-GAAP) $ 689,651 $ 610,831 $ 547,218 Total noninterest expenses (GAAP) $ 431,812 $ 370,963 $ 349,161 Less: Core deposit and customer relationship intangibles amortization 9,395 10,670 11,972 Partnership investment in tax credit projects 6,303 3,801 8,030 (Gain) loss on sales/valuations of assets, net 588 5,101 (19,422) Acquisition, integration and restructuring costs 5,331 5,381 6,580 Core expenses (non-GAAP) $ 410,195 $ 346,010 $ 342,001 Efficiency ratio, fully tax-equivalent (non-GAAP) 59.48 % 56.65 % 62.50 % Reconciliation of Annualized Ratio of Core Expenses to Average Assets (non-GAAP) Total noninterest expenses (GAAP) $ 431,812 $ 370,963 $ 349,161 Core expenses (non-GAAP) 410,195 346,010 342,001 Average assets $ 18,508,273 $ 14,782,605 $ 12,021,917 Total noninterest expenses to average assets (GAAP) 2.33 % 2.51 % 2.90 % Core expenses to average assets (non-GAAP) 2.22 % 2.34 % 2.84 % (1) Computed on a tax-equivalent basis using an effective tax rate of 21%. 42 Non-GAAP Reconciliations (cont.) (Dollars in thousands except per share data)
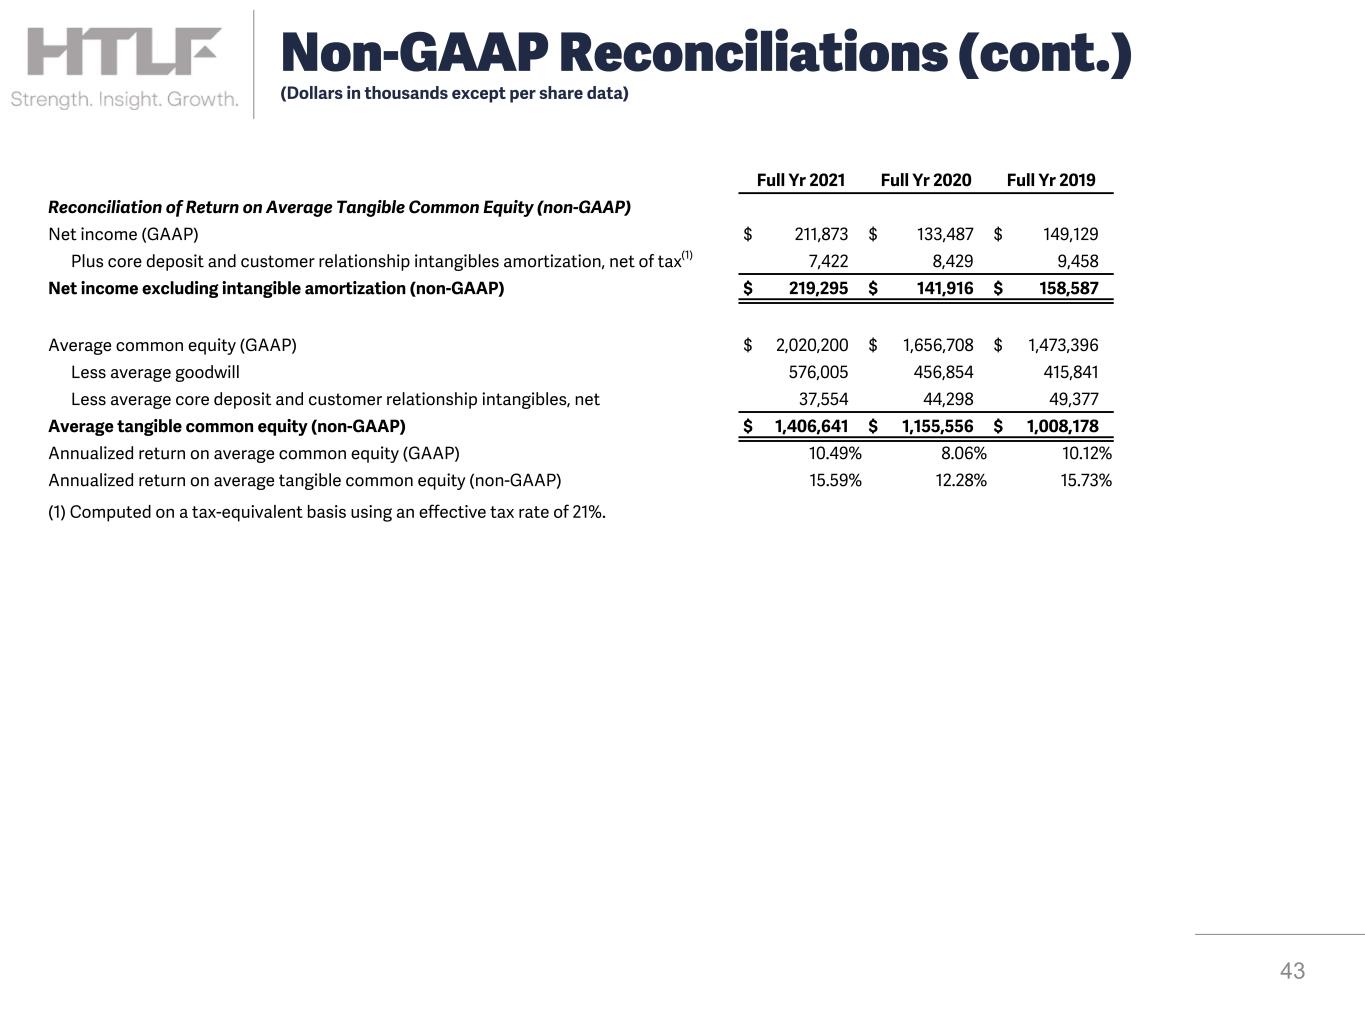
Non-GAAP Reconciliations (cont.) (Dollars in thousands except per share data) Full Yr 2021 Full Yr 2020 Full Yr 2019 Reconciliation of Return on Average Tangible Common Equity (non-GAAP) Net income (GAAP) $ 211,873 $ 133,487 $ 149,129 Plus core deposit and customer relationship intangibles amortization, net of tax(1) 7,422 8,429 9,458 Net income excluding intangible amortization (non-GAAP) $ 219,295 $ 141,916 $ 158,587 Average common equity (GAAP) $ 2,020,200 $ 1,656,708 $ 1,473,396 Less average goodwill 576,005 456,854 415,841 Less average core deposit and customer relationship intangibles, net 37,554 44,298 49,377 Average tangible common equity (non-GAAP) $ 1,406,641 $ 1,155,556 $ 1,008,178 Annualized return on average common equity (GAAP) 10.49 % 8.06 % 10.12 % Annualized return on average tangible common equity (non-GAAP) 15.59 % 12.28 % 15.73 % (1) Computed on a tax-equivalent basis using an effective tax rate of 21%. 43
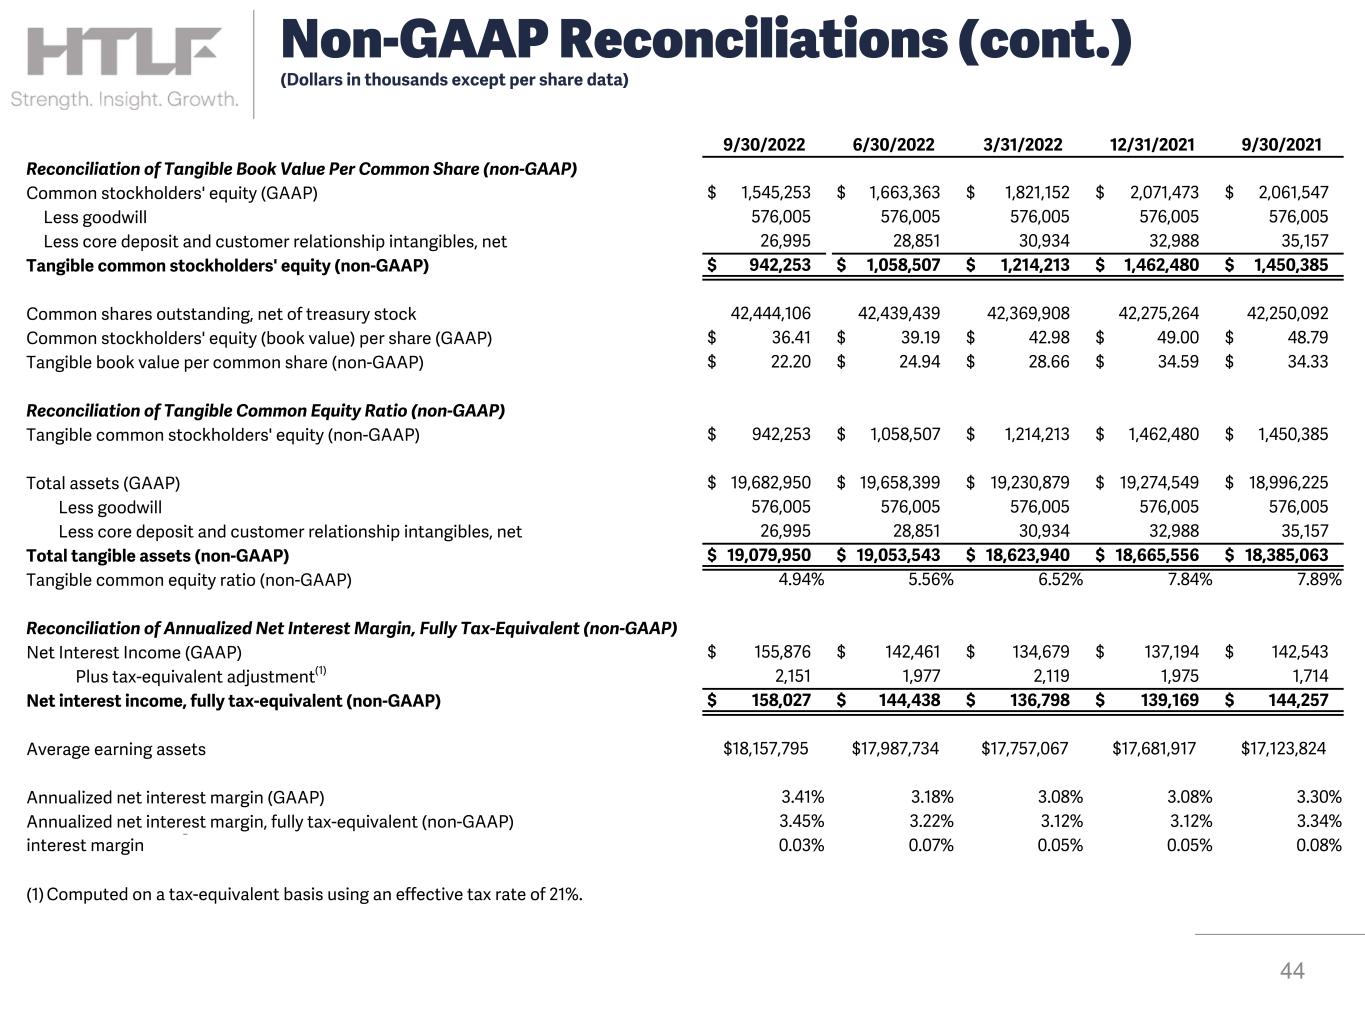
9/30/2022 6/30/2022 3/31/2022 12/31/2021 9/30/2021 Reconciliation of Tangible Book Value Per Common Share (non-GAAP) Common stockholders' equity (GAAP) $ 1,545,253 $ 1,663,363 $ 1,821,152 $ 2,071,473 $ 2,061,547 Less goodwill 576,005 576,005 576,005 576,005 576,005 Less core deposit and customer relationship intangibles, net 26,995 28,851 30,934 32,988 35,157 Tangible common stockholders' equity (non-GAAP) $ 942,253 $ 1,058,507 $ 1,214,213 $ 1,462,480 $ 1,450,385 Common shares outstanding, net of treasury stock 42,444,106 42,439,439 42,369,908 42,275,264 42,250,092 Common stockholders' equity (book value) per share (GAAP) $ 36.41 $ 39.19 $ 42.98 $ 49.00 $ 48.79 Tangible book value per common share (non-GAAP) $ 22.20 $ 24.94 $ 28.66 $ 34.59 $ 34.33 Reconciliation of Tangible Common Equity Ratio (non-GAAP) Tangible common stockholders' equity (non-GAAP) $ 942,253 $ 1,058,507 $ 1,214,213 $ 1,462,480 $ 1,450,385 Total assets (GAAP) $ 19,682,950 $ 19,658,399 $ 19,230,879 $ 19,274,549 $ 18,996,225 Less goodwill 576,005 576,005 576,005 576,005 576,005 Less core deposit and customer relationship intangibles, net 26,995 28,851 30,934 32,988 35,157 Total tangible assets (non-GAAP) $ 19,079,950 $ 19,053,543 $ 18,623,940 $ 18,665,556 $ 18,385,063 Tangible common equity ratio (non-GAAP) 4.94 % 5.56 % 6.52 % 7.84 % 7.89 % Reconciliation of Annualized Net Interest Margin, Fully Tax-Equivalent (non-GAAP) Net Interest Income (GAAP) $ 155,876 $ 142,461 $ 134,679 $ 137,194 $ 142,543 Plus tax-equivalent adjustment(1) 2,151 1,977 2,119 1,975 1,714 Net interest income, fully tax-equivalent (non-GAAP) $ 158,027 $ 144,438 $ 136,798 $ 139,169 $ 144,257 Average earning assets $18,157,795 $17,987,734 $17,757,067 $17,681,917 $17,123,824 Annualized net interest margin (GAAP) 3.41 % 3.18 % 3.08 % 3.08 % 3.30 % Annualized net interest margin, fully tax-equivalent (non-GAAP) 3.45 % 3.22 % 3.12 % 3.12 % 3.34 %Purchase accou ting discount amortization on loans included in annualized net interest margin 0.03 % 0.07 % 0.05 % 0.05 % 0.08 % (1) Computed on a tax-equivalent basis using an effective tax rate of 21%. 44 Non-GAAP Reconciliations (cont.) (Dollars in thousands except per share data)
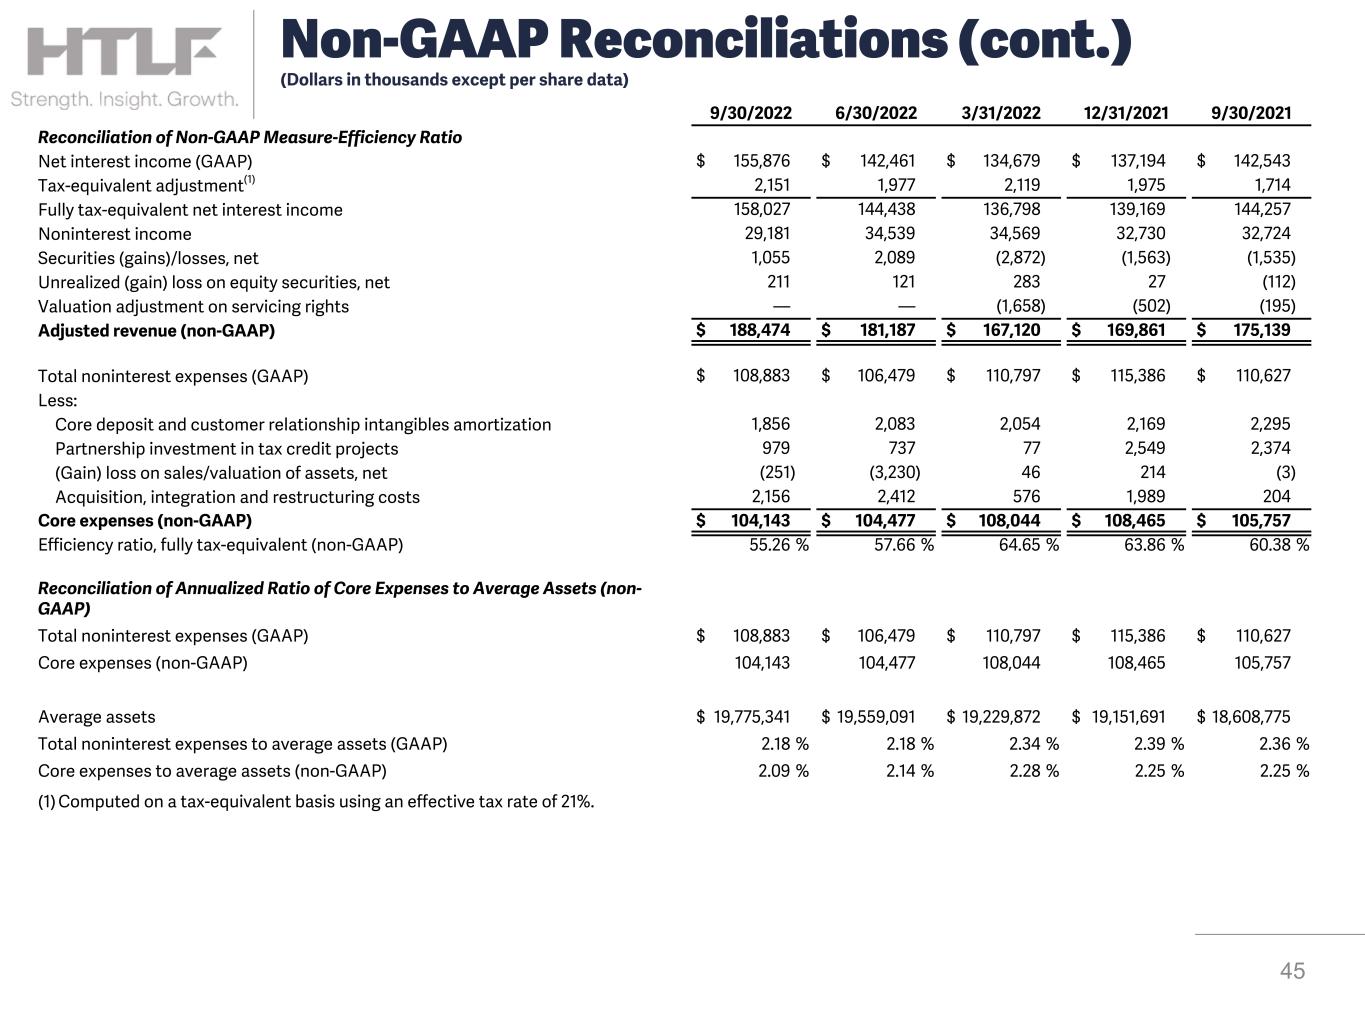
9/30/2022 6/30/2022 3/31/2022 12/31/2021 9/30/2021 Reconciliation of Non-GAAP Measure-Efficiency Ratio Net interest income (GAAP) $ 155,876 $ 142,461 $ 134,679 $ 137,194 $ 142,543 Tax-equivalent adjustment(1) 2,151 1,977 2,119 1,975 1,714 Fully tax-equivalent net interest income 158,027 144,438 136,798 139,169 144,257 Noninterest income 29,181 34,539 34,569 32,730 32,724 Securities (gains)/losses, net 1,055 2,089 (2,872) (1,563) (1,535) Unrealized (gain) loss on equity securities, net 211 121 283 27 (112) Valuation adjustment on servicing rights — — (1,658) (502) (195) Adjusted revenue (non-GAAP) $ 188,474 $ 181,187 $ 167,120 $ 169,861 $ 175,139 Total noninterest expenses (GAAP) $ 108,883 $ 106,479 $ 110,797 $ 115,386 $ 110,627 Less: Core deposit and customer relationship intangibles amortization 1,856 2,083 2,054 2,169 2,295 Partnership investment in tax credit projects 979 737 77 2,549 2,374 (Gain) loss on sales/valuation of assets, net (251) (3,230) 46 214 (3) Acquisition, integration and restructuring costs 2,156 2,412 576 1,989 204 Core expenses (non-GAAP) $ 104,143 $ 104,477 $ 108,044 $ 108,465 $ 105,757 Efficiency ratio, fully tax-equivalent (non-GAAP) 55.26 % 57.66 % 64.65 % 63.86 % 60.38 % Reconciliation of Annualized Ratio of Core Expenses to Average Assets (non- GAAP) Total noninterest expenses (GAAP) $ 108,883 $ 106,479 $ 110,797 $ 115,386 $ 110,627 Core expenses (non-GAAP) 104,143 104,477 108,044 108,465 105,757 Average assets $ 19,775,341 $ 19,559,091 $ 19,229,872 $ 19,151,691 $ 18,608,775 Total noninterest expenses to average assets (GAAP) 2.18 % 2.18 % 2.34 % 2.39 % 2.36 % Core expenses to average assets (non-GAAP) 2.09 % 2.14 % 2.28 % 2.25 % 2.25 % (1) Computed on a tax-equivalent basis using an effective tax rate of 21%. 45 Non-GAAP Reconciliations (cont.) (Dollars in thousands except per share data)
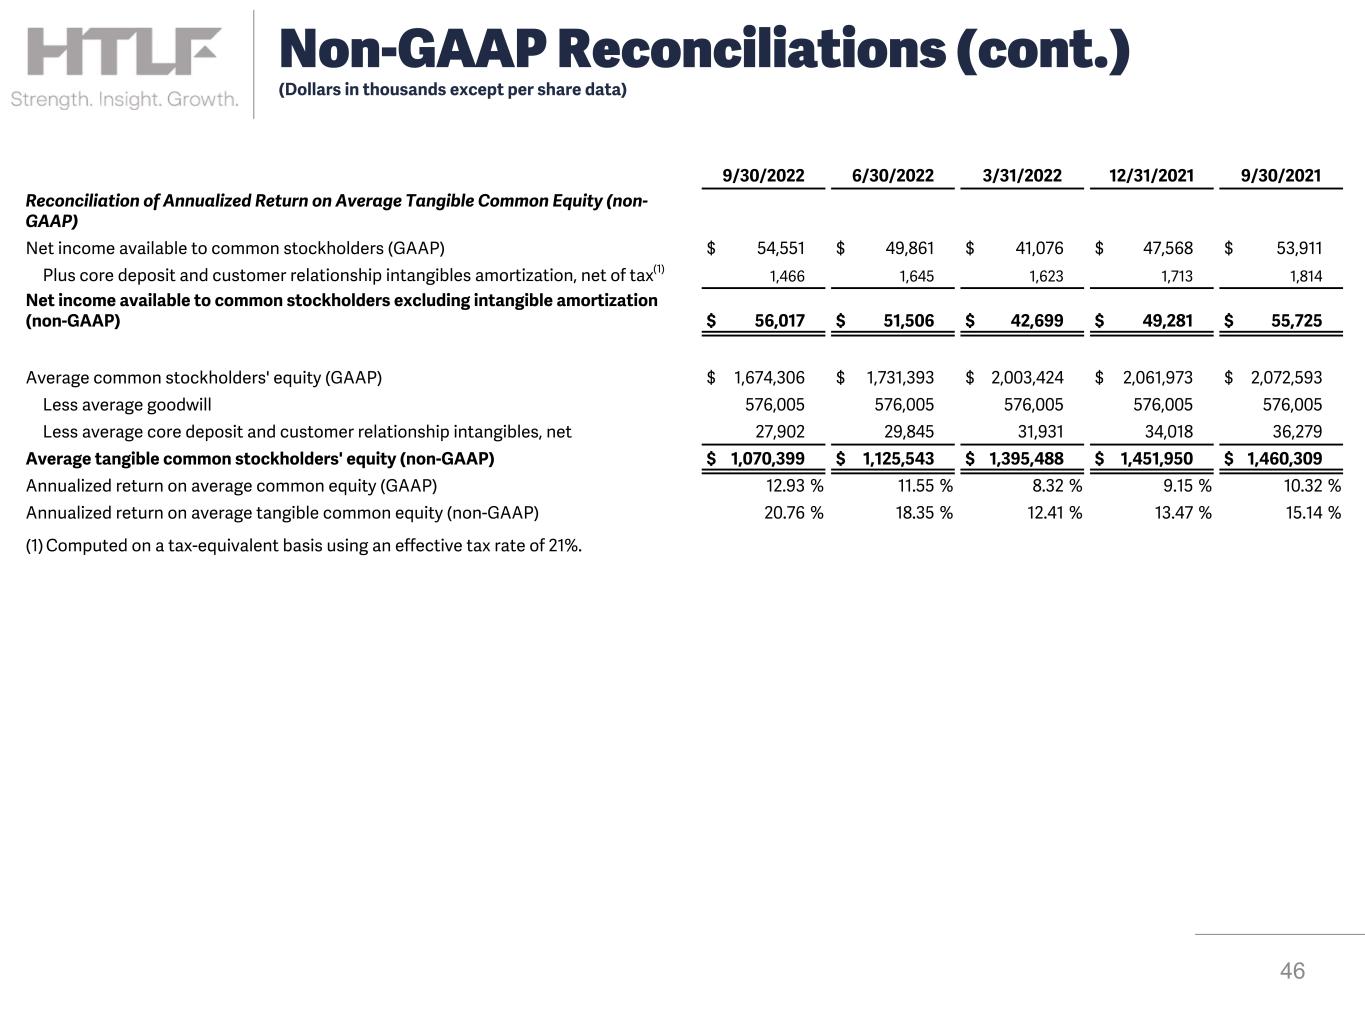
46 Non-GAAP Reconciliations (cont.) (Dollars in thousands except per share data) 9/30/2022 6/30/2022 3/31/2022 12/31/2021 9/30/2021 Reconciliation of Annualized Return on Average Tangible Common Equity (non- GAAP) Net income available to common stockholders (GAAP) $ 54,551 $ 49,861 $ 41,076 $ 47,568 $ 53,911 Plus core deposit and customer relationship intangibles amortization, net of tax(1) 1,466 1,645 1,623 1,713 1,814 Net income available to common stockholders excluding intangible amortization (non-GAAP) $ 56,017 $ 51,506 $ 42,699 $ 49,281 $ 55,725 Average common stockholders' equity (GAAP) $ 1,674,306 $ 1,731,393 $ 2,003,424 $ 2,061,973 $ 2,072,593 Less average goodwill 576,005 576,005 576,005 576,005 576,005 Less average core deposit and customer relationship intangibles, net 27,902 29,845 31,931 34,018 36,279 Average tangible common stockholders' equity (non-GAAP) $ 1,070,399 $ 1,125,543 $ 1,395,488 $ 1,451,950 $ 1,460,309 Annualized return on average common equity (GAAP) 12.93 % 11.55 % 8.32 % 9.15 % 10.32 % Annualized return on average tangible common equity (non-GAAP) 20.76 % 18.35 % 12.41 % 13.47 % 15.14 % (1) Computed on a tax-equivalent basis using an effective tax rate of 21%.
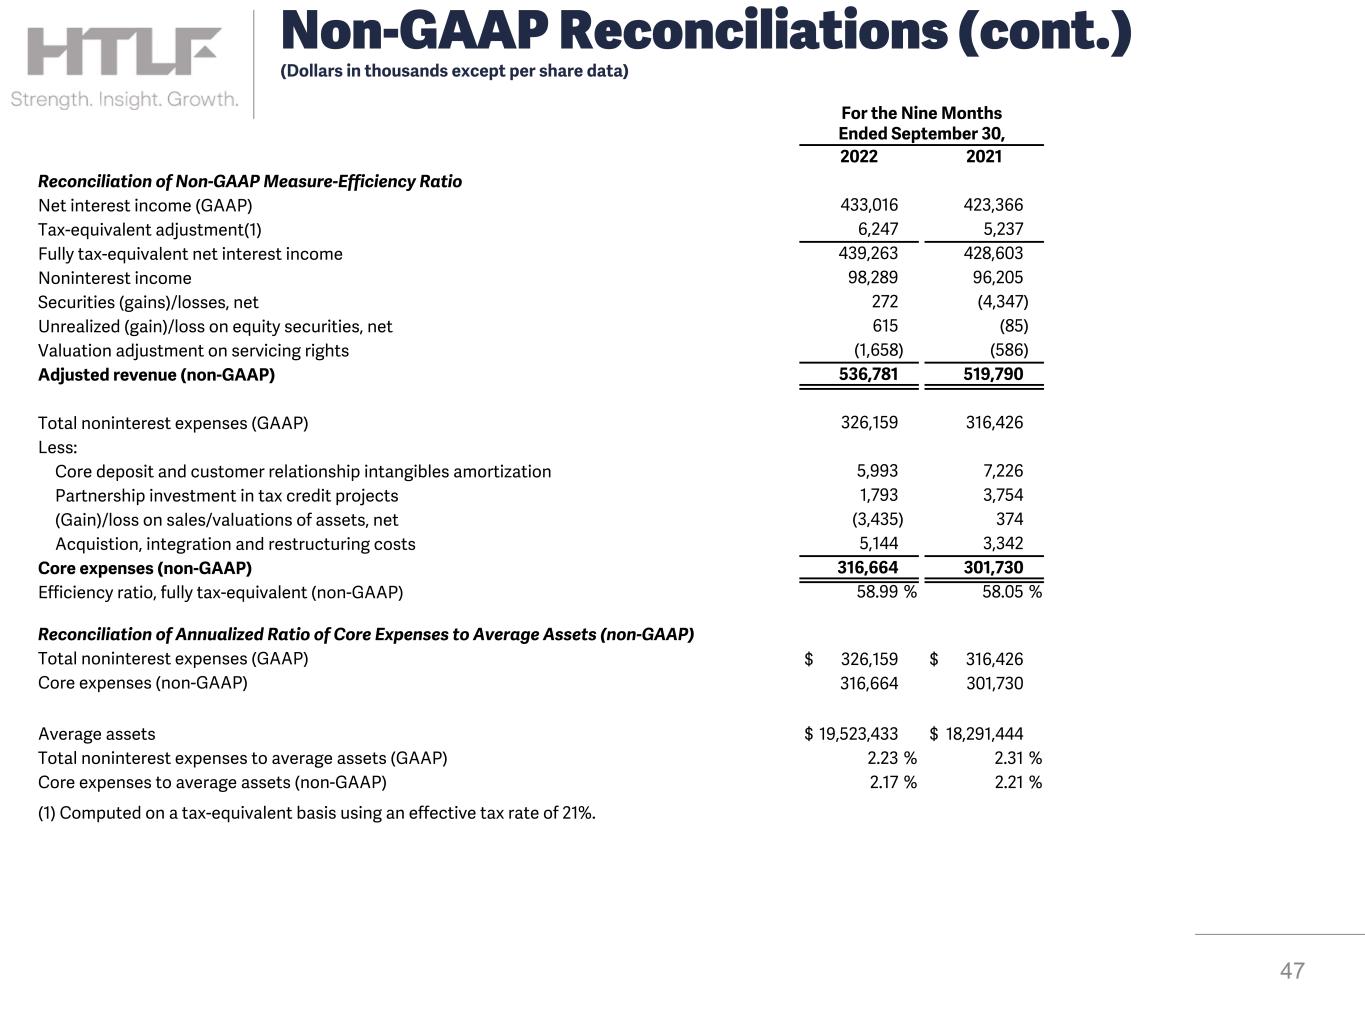
For the Nine Months Ended September 30, 2022 2021 Reconciliation of Non-GAAP Measure-Efficiency Ratio Net interest income (GAAP) 433,016 423,366 Tax-equivalent adjustment(1) 6,247 5,237 Fully tax-equivalent net interest income 439,263 428,603 Noninterest income 98,289 96,205 Securities (gains)/losses, net 272 (4,347) Unrealized (gain)/loss on equity securities, net 615 (85) Valuation adjustment on servicing rights (1,658) (586) Adjusted revenue (non-GAAP) 536,781 519,790 Total noninterest expenses (GAAP) 326,159 316,426 Less: Core deposit and customer relationship intangibles amortization 5,993 7,226 Partnership investment in tax credit projects 1,793 3,754 (Gain)/loss on sales/valuations of assets, net (3,435) 374 Acquistion, integration and restructuring costs 5,144 3,342 Core expenses (non-GAAP) 316,664 301,730 Efficiency ratio, fully tax-equivalent (non-GAAP) 58.99 % 58.05 % Reconciliation of Annualized Ratio of Core Expenses to Average Assets (non-GAAP) Total noninterest expenses (GAAP) $ 326,159 $ 316,426 Core expenses (non-GAAP) 316,664 301,730 Average assets $ 19,523,433 $ 18,291,444 Total noninterest expenses to average assets (GAAP) 2.23 % 2.31 % Core expenses to average assets (non-GAAP) 2.17 % 2.21 % (1) Computed on a tax-equivalent basis using an effective tax rate of 21%. 47 Non-GAAP Reconciliations (cont.) (Dollars in thousands except per share data)

48 Non-GAAP Reconciliations (cont.) (Dollars in thousands except per share data) For the Nine Months Ended September 30, 2022 2021 Reconciliation of Return on Average Tangible Common Equity (non-GAAP) Net income (GAAP) $ 145,488 $ 164,305 Plus core deposit and customer relationship intangibles amortization, net of tax(1) 4,734 5,709 Net income excluding intangible amortization (non-GAAP) $ 150,222 $ 170,014 Average common equity (GAAP) $ 1,801,835 $ 2,006,123 Less average goodwill 576,005 576,005 Less average core deposit and customer relationship intangibles, net 29,878 38,745 Average tangible common equity (non-GAAP) $ 1,195,952 $ 1,391,373 Annualized return on average common equity (GAAP) 10.80 % 10.95 % Annualized return on average tangible common equity (non-GAAP) 16.79 % 16.34 % Reconciliation of Annualized Net Interest Margin, Fully Tax-Equivalent (non-GAAP) Net Interest Income (GAAP) $ 433,016 $ 423,366 Plus tax-equivalent adjustment(1) 6,247 5,237 Net interest income, tax-equivalent (non-GAAP) $ 439,263 $ 428,603 Average earning assets 17,969,001 16,803,740 Annualized net interest margin (GAAP) 3.22 % 3.37 % Annualized net interest margin, fully tax-equivalent (non-GAAP) 3.27 % 3.41 % (1) Computed on a tax-equivalent basis using an effective tax rate of 21%.
