Exhibit 99.1
Investor PresentationAugust 2021
2 This presentation (including any information incorporated herein by reference), and future oral and written statements of HTLF and its management, may contain forward-looking statements within the meaning of Section 27A of the Securities Act of 1933, as amended, and Section 21E of the Securities Exchange Act of 1934, as amended, with respect to the business, financial condition, results of operations, plans, objectives and future performance of the company.Any statements about the company's expectations, beliefs, plans, objectives, assumptions or future events or performance are not historical facts and may be forward-looking. Forward-looking statements may include information about possible or assumed future results of the company's operations or performance. These forward-looking statements are generally identified by the use of words such as ‘‘believe”, “expect’’, “anticipate’’, ‘‘plan”, “intend”, “estimate’’, ‘‘project”, “may”, ‘‘will”, ‘‘would”, ‘‘could”, ‘‘should’’, “view”, “opportunity”, “potential”, or similar or negative expressions of these words or phrases. Although the company may make these statements based on management’s experience, beliefs, expectations, assumptions and best estimate of future events, the ability of the company to predict results or the actual effect or outcomes of plans or strategies is inherently uncertain, and there may be events or factors that management has not anticipated. Therefore, the accuracy and achievement of such forward-looking statements and estimates are subject to a number of risks, many of which are beyond the ability of management to control or predict, that could cause actual results to differ materially from those in its forward-looking statements. These factors, which the company currently believes could have a material effect on its operations and future prospects, are detailed below and in the risk factors in HTLF's reports filed with the Securities and Exchange Commission (“SEC”), including the “Risk Factors” section under Item 1A of Part I of the company’s Annual Report on Form 10-K for the year ended December 31, 2020, include, among others: COVID-19 Pandemic Risks, including risks related to the ongoing COVID-19 pandemic and measures enacted by the U.S. federal and state governments and adopted by private businesses in response to the COVID-19 pandemic;Economic and Market Conditions Risks, including risks related to changes in the U.S. economy in general and in the local economies in which HTLF conducts its operations and future civil unrest, natural disasters, terrorist threats or acts of war;Credit Risks, including risks of increasing credit losses due to deterioration in the financial condition of HTLF's borrowers, changes in asset and collateral values and climate and other borrower industry risks which may impact the provision for credit losses and net charge-offs;Liquidity and Interest Rate Risks, including the impact of capital market conditions and changes in monetary policy on our borrowings and net interest income;Operational Risks, including processing, information systems, cybersecurity, vendor, business interruption, and fraud risks;Strategic and External Risks, including competitive forces impacting our business and strategic acquisition risks;Legal, Compliance and Reputational Risks, including regulatory and litigation risks; andRisks of Owning Stock in HTLF, including stock price volatility and dilution as a result of future equity offerings and acquisitions.There can be no assurance that other factors not currently anticipated by HTLF will not materially and adversely affect the company’s business, financial condition and results of operations. In addition, many of these risks and uncertainties are currently amplified by and may continue to be amplified by the COVID-19 pandemic and the impact of varying governmental responses that affect the company’s customers and the economies where they operate. Additionally, all statements in this presentation, including forward-looking statements speak only as of the date they are made. The company does not undertake and specifically disclaims any obligation to publicly release the results of any revisions which may be made to or correct or update any forward-looking statement to reflect events or circumstances after the date of such statements or to reflect the occurrence of anticipated or unanticipated events or to otherwise update any statement in light of new information or future events. Further information concerning HTLF and its business, including additional factors that could materially affect the company’s financial results, is included in the company’s filings with the SEC. Safe Harbor Notes Regarding the Use of Non-GAAP Financial MeasuresThis presentation contains financial information determined by methods other than in accordance with accounting principles generally accepted in the United States of America (“GAAP”). Management uses these “non-GAAP” measures in its analysis of the HTLF’s performance. Management believes these non-GAAP financial measures allow for better comparability of period to period operating performance. Additionally, HTLF believes this information is utilized by regulators and market analysts to evaluate a company’s financial condition and therefore, such information is useful to investors. These disclosures should not be viewed as a substitute for operating results determined in accordance with GAAP, nor are they necessarily comparable to non-GAAP performance measures that may be presented by other companies. A reconciliation of the non-GAAP measures used in this presentation to the most directly comparable GAAP measures is provided in the Appendix to this presentation.
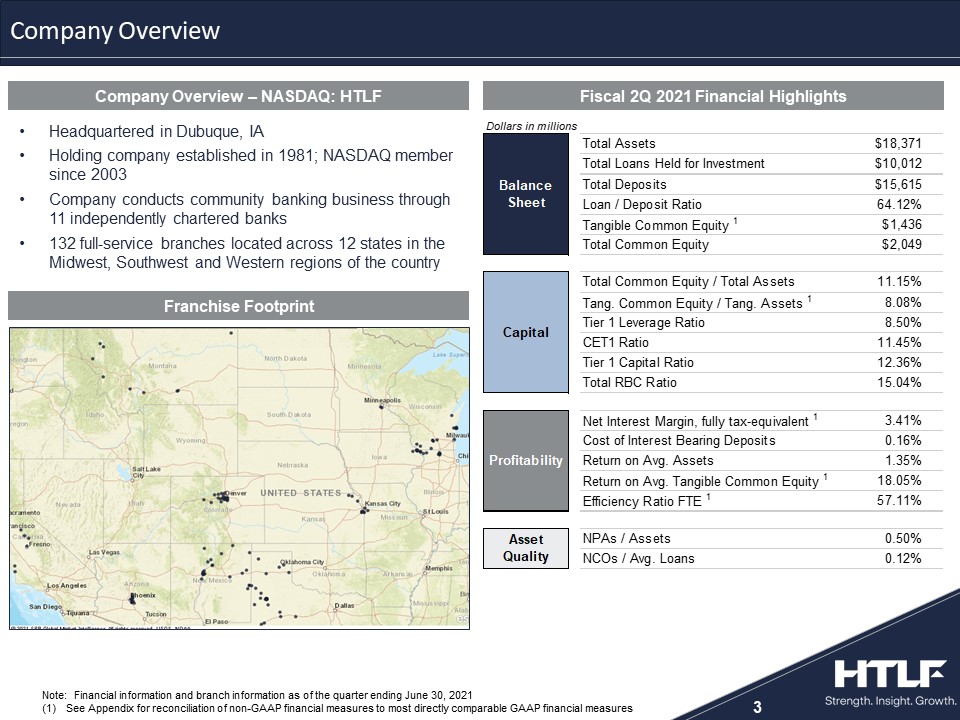
Company Overview 3 Company Overview – NASDAQ: HTLF Fiscal 2Q 2021 Financial Highlights Headquartered in Dubuque, IAHolding company established in 1981; NASDAQ member since 2003Company conducts community banking business through 11 independently chartered banks132 full-service branches located across 12 states in the Midwest, Southwest and Western regions of the country Note: Financial information and branch information as of the quarter ending June 30, 2021See Appendix for reconciliation of non-GAAP financial measures to most directly comparable GAAP financial measures 324268 105140183 167188214 201203205 2108846 223134103 138141143 235236237 1616835 Franchise Footprint
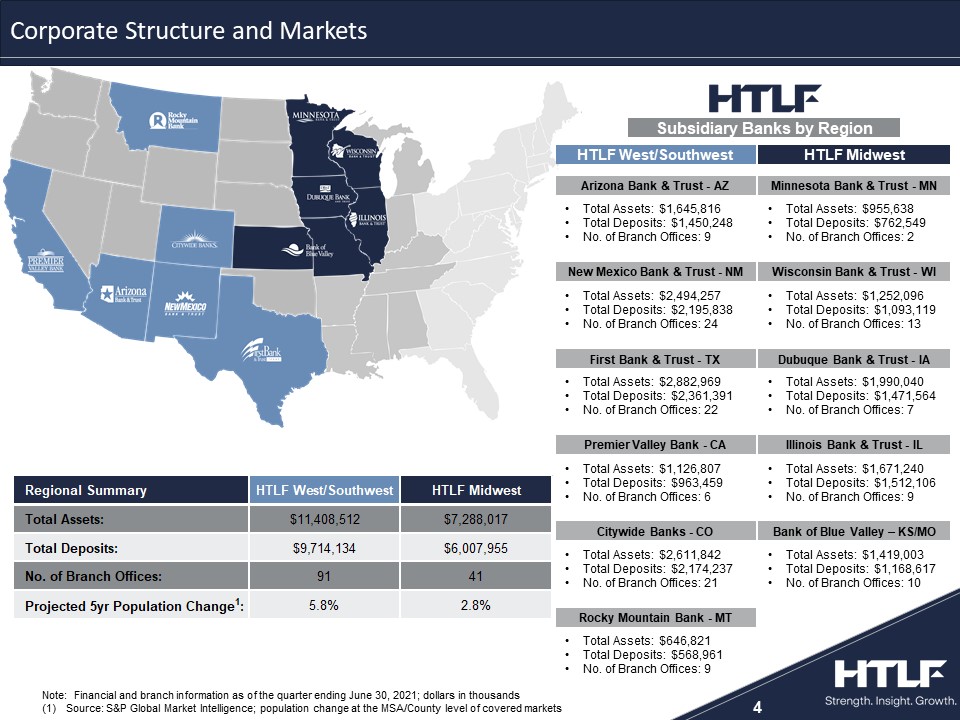
4 Subsidiary Banks by Region Note: Financial and branch information as of the quarter ending June 30, 2021; dollars in thousandsSource: S&P Global Market Intelligence; population change at the MSA/County level of covered markets Bank of Blue Valley – KS/MO Illinois Bank & Trust - IL Minnesota Bank & Trust - MN HTLF Midwest Total Assets: $1,671,240Total Deposits: $1,512,106No. of Branch Offices: 9 Total Assets: $955,638Total Deposits: $762,549No. of Branch Offices: 2 Total Assets: $1,419,003Total Deposits: $1,168,617No. of Branch Offices: 10 Rocky Mountain Bank - MT Citywide Banks - CO Premier Valley Bank - CA HTLF West/Southwest Total Assets: $2,611,842Total Deposits: $2,174,237No. of Branch Offices: 21 Total Assets: $1,126,807Total Deposits: $963,459No. of Branch Offices: 6 Total Assets: $646,821Total Deposits: $568,961No. of Branch Offices: 9 Dubuque Bank & Trust - IA Wisconsin Bank & Trust - WI Total Assets: $1,252,096Total Deposits: $1,093,119No. of Branch Offices: 13 Total Assets: $1,990,040Total Deposits: $1,471,564No. of Branch Offices: 7 324268 105140183 167188214 201203205 2108846 223134103 138141143 235236237 1616835 First Bank & Trust - TX New Mexico Bank & Trust - NM Arizona Bank & Trust - AZ Total Assets: $2,494,257Total Deposits: $2,195,838No. of Branch Offices: 24 Total Assets: $1,645,816Total Deposits: $1,450,248No. of Branch Offices: 9 Total Assets: $2,882,969Total Deposits: $2,361,391No. of Branch Offices: 22 Corporate Structure and Markets

Broad footprint enhances profitable growth strategies and diversifies riskExpands opportunities for new client acquisition – both organic and through M&ACredit exposure is not geographically concentrated – spread over 12 state footprintHTLF projected 5yr MSA growth rate of 4.5% exceeds National Average of 2.9%1HTLF West/Southwest – 5.8%HTLF Midwest – 2.8%Focus on gaining significant presence within each marketTop 10 deposit share in 26 of the 38 MSAs in which we operate2Top 5 deposit share in 12 of those MSAs2 Enhances Talent Acquisition and Branch OptimizationLocal Banking Model emphasizes responsiveness to clients and communities Local leadership facilitates development and retention of new client deposit/loan relationshipsEnsures engagement in the communities we serveCentral support functions provide efficiencies and sophistication Centralized “back-office” operations and support functions maximize operating efficiencyCentralized risk management functions support strong corporate-wide oversight Financial strength to invest in sophisticated system-wide technology platforms and tools 5 Key Factors Driving Business Strategy Source: S&P Global Market IntelligenceDeposit information as of June 30, 2020
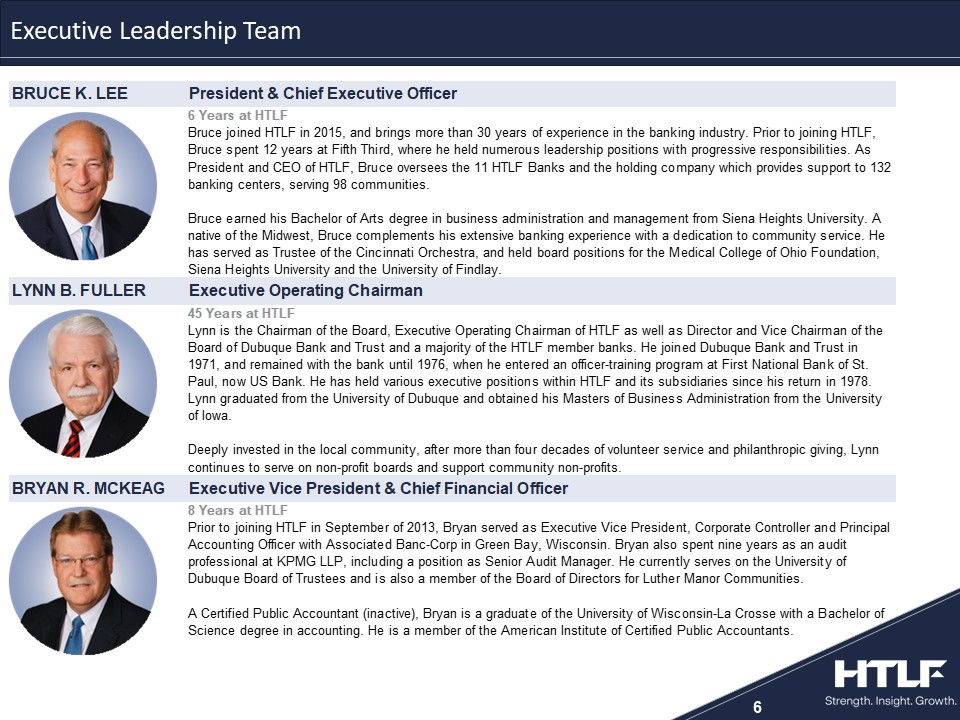
6 Executive Leadership Team

7 Total Assets ($B) Total Deposits ($B)1 Loans Held to Maturity ($B) Loans / Deposits (%) Includes deposits held for sale in 2018 of $0.106B 324268 105140183 167188214 201203205 2108846 223134103 138141143 235236237 1616835 Summary Balance Sheet Items
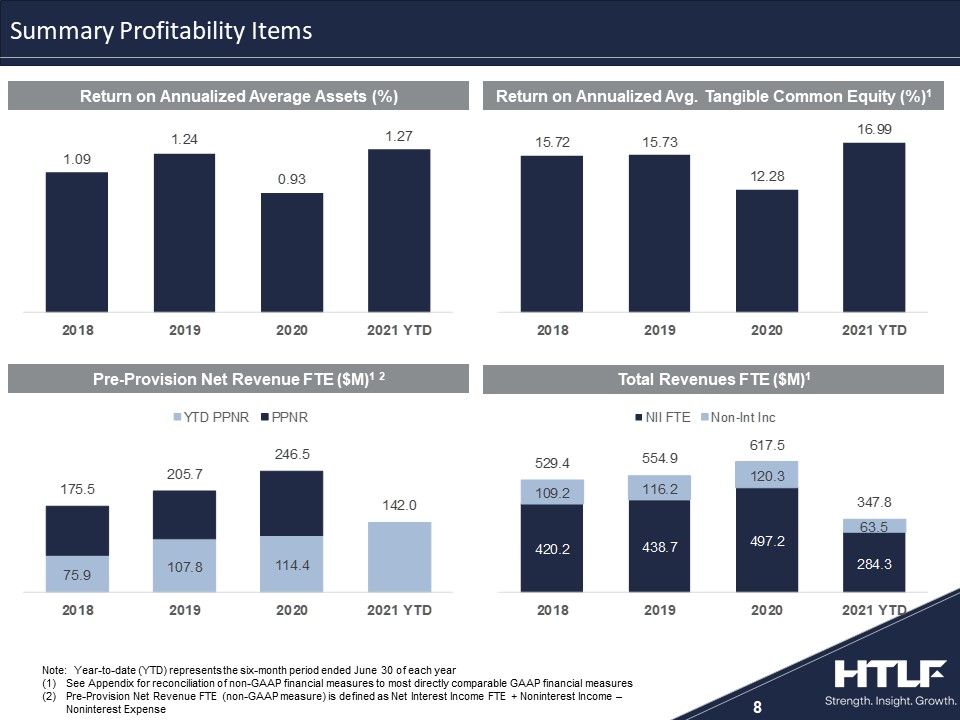
8 Note: Year-to-date (YTD) represents the six-month period ended June 30 of each yearSee Appendix for reconciliation of non-GAAP financial measures to most directly comparable GAAP financial measuresPre-Provision Net Revenue FTE (non-GAAP measure) is defined as Net Interest Income FTE + Noninterest Income – Noninterest Expense 324268 105140183 167188214 201203205 2108846 223134103 138141143 235236237 1616835 Return on Annualized Average Assets (%) Return on Annualized Avg. Tangible Common Equity (%)1 Pre-Provision Net Revenue FTE ($M)1 2 Total Revenues FTE ($M)1 Summary Profitability Items
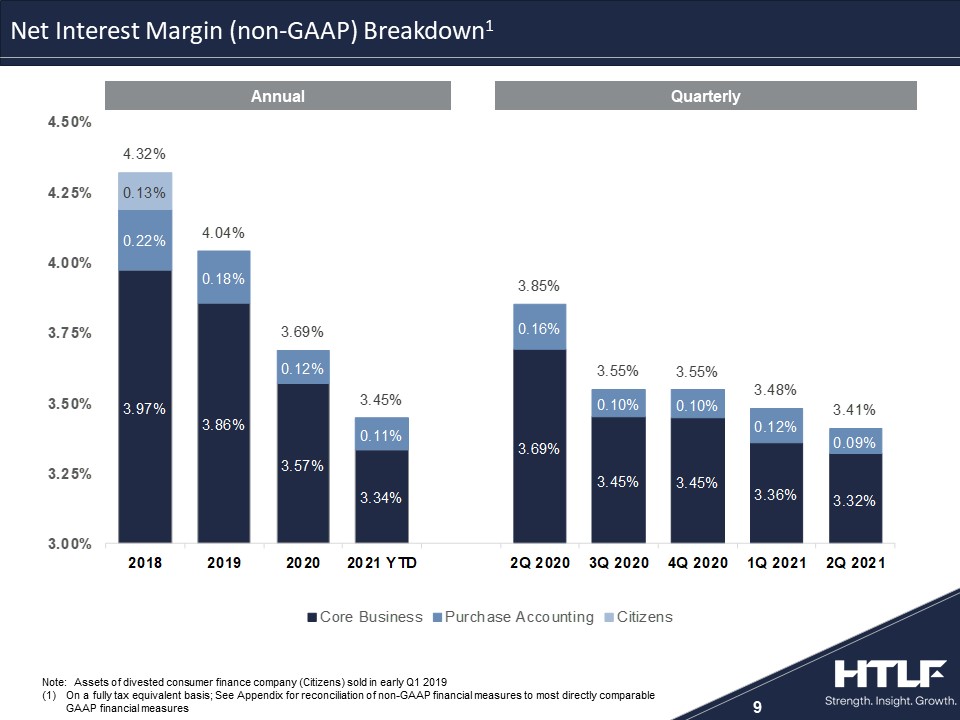
9 Note: Assets of divested consumer finance company (Citizens) sold in early Q1 2019On a fully tax equivalent basis; See Appendix for reconciliation of non-GAAP financial measures to most directly comparable GAAP financial measures 324268 105140183 167188214 201203205 2108846 223134103 138141143 235236237 1616835 Net Interest Margin (non-GAAP) Breakdown1 Annual Quarterly
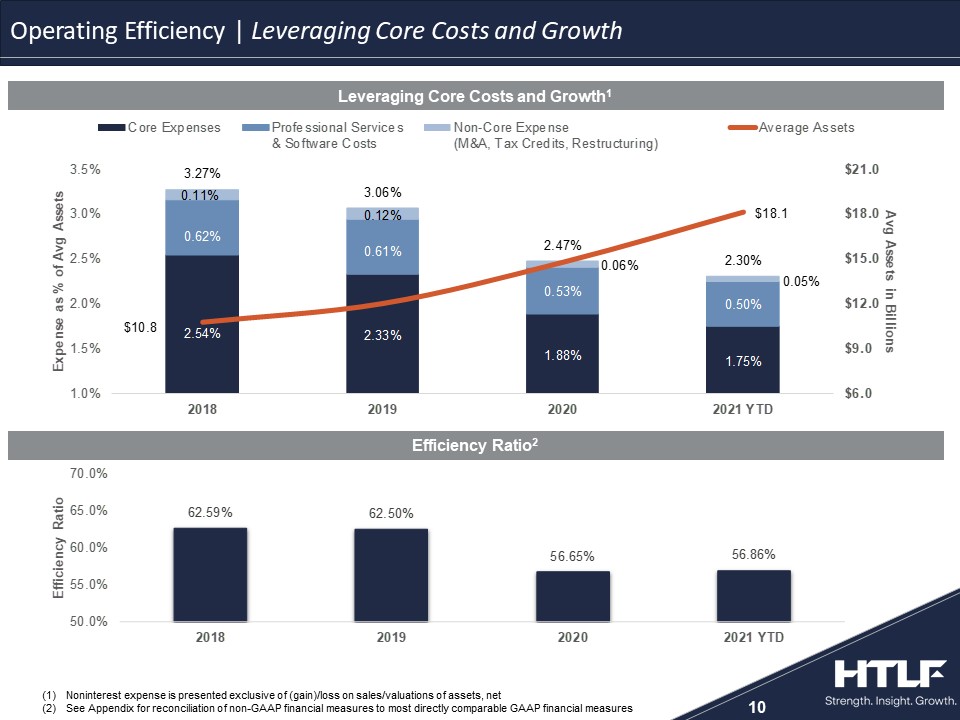
10 324268 105140183 167188214 201203205 2108846 223134103 138141143 235236237 1616835 Leveraging Core Costs and Growth1 Noninterest expense is presented exclusive of (gain)/loss on sales/valuations of assets, netSee Appendix for reconciliation of non-GAAP financial measures to most directly comparable GAAP financial measures Operating Efficiency | Leveraging Core Costs and Growth Efficiency Ratio2
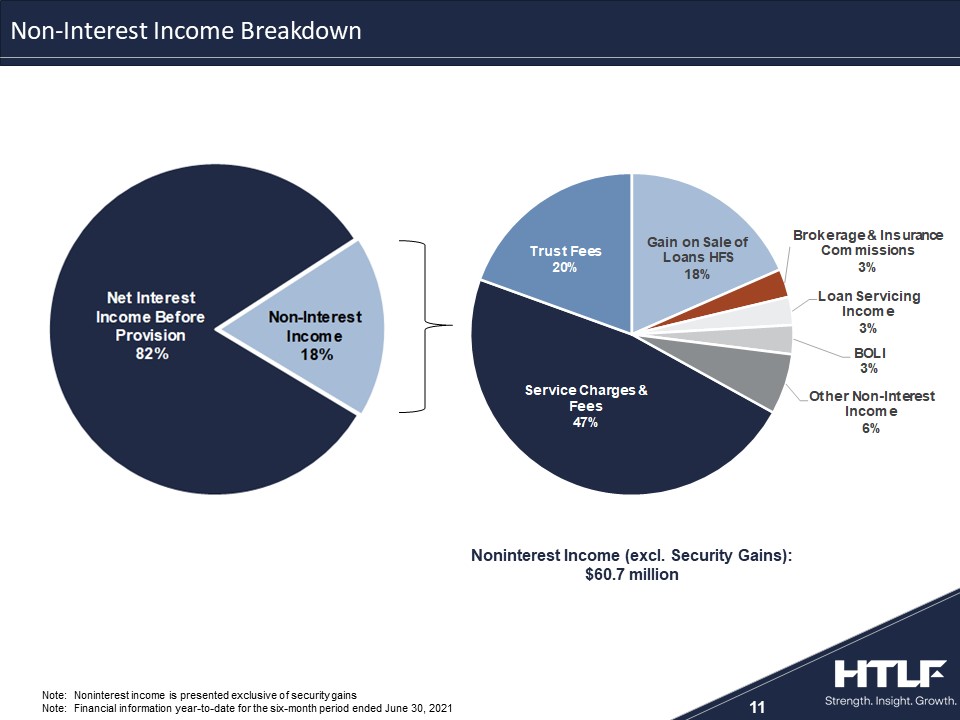
11 Note: Noninterest income is presented exclusive of security gainsNote: Financial information year-to-date for the six-month period ended June 30, 2021 324268 105140183 167188214 201203205 2108846 223134103 138141143 235236237 1616835 Non-Interest Income Breakdown Noninterest Income (excl. Security Gains): $60.7 million
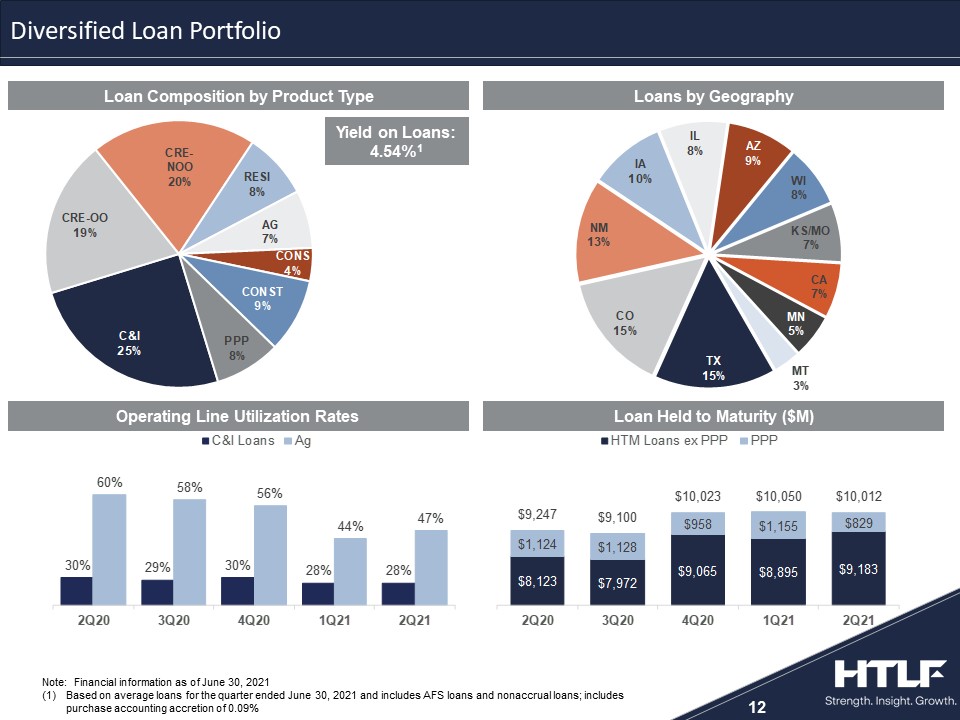
12 Loan Held to Maturity ($M) Note: Financial information as of June 30, 2021Based on average loans for the quarter ended June 30, 2021 and includes AFS loans and nonaccrual loans; includes purchase accounting accretion of 0.09% Yield on Loans: 4.54%1 324268 105140183 167188214 201203205 2108846 223134103 138141143 235236237 1616835 Operating Line Utilization Rates Diversified Loan Portfolio Loan Composition by Product Type Loans by Geography
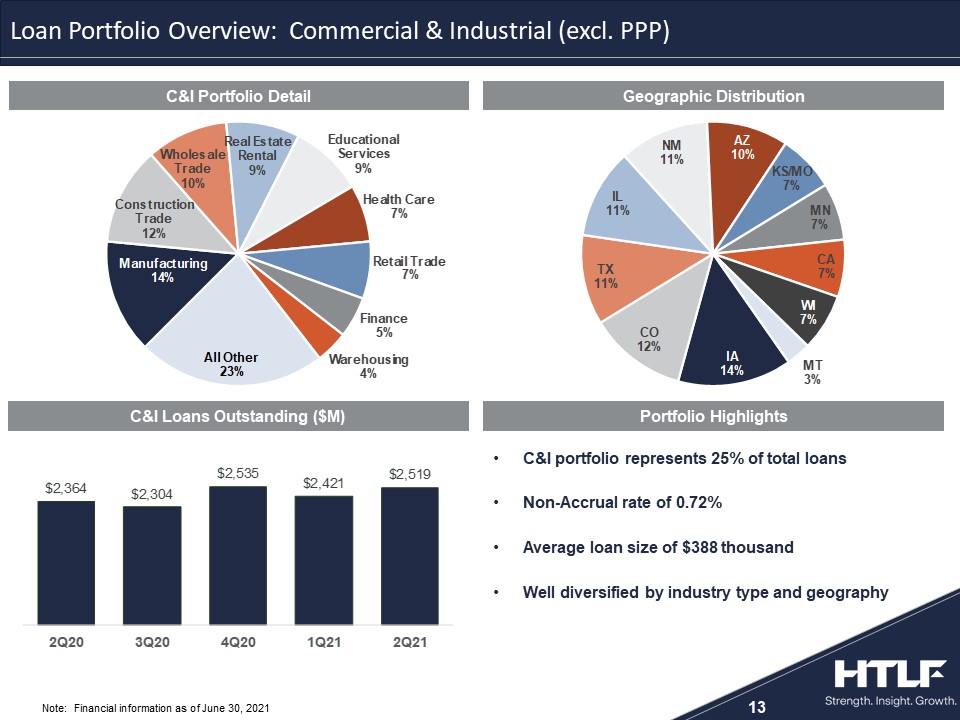
C&I portfolio represents 25% of total loansNon-Accrual rate of 0.72%Average loan size of $388 thousandWell diversified by industry type and geography 13 Note: Financial information as of June 30, 2021 324268 105140183 167188214 201203205 2108846 223134103 138141143 235236237 1616835 Loan Portfolio Overview: Commercial & Industrial (excl. PPP) C&I Portfolio Detail Geographic Distribution Portfolio Highlights C&I Loans Outstanding ($M)
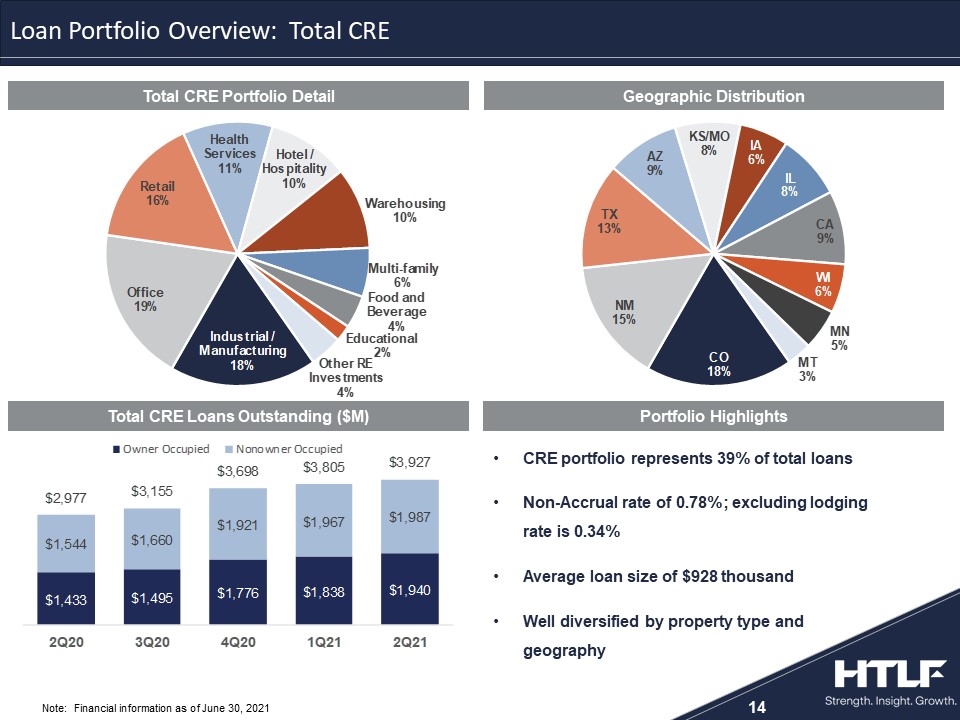
CRE portfolio represents 39% of total loansNon-Accrual rate of 0.78%; excluding lodging rate is 0.34%Average loan size of $928 thousandWell diversified by property type and geography 14 Note: Financial information as of June 30, 2021 324268 105140183 167188214 201203205 2108846 223134103 138141143 235236237 1616835 Loan Portfolio Overview: Total CRE Total CRE Portfolio Detail Geographic Distribution Portfolio Highlights Total CRE Loans Outstanding ($M)
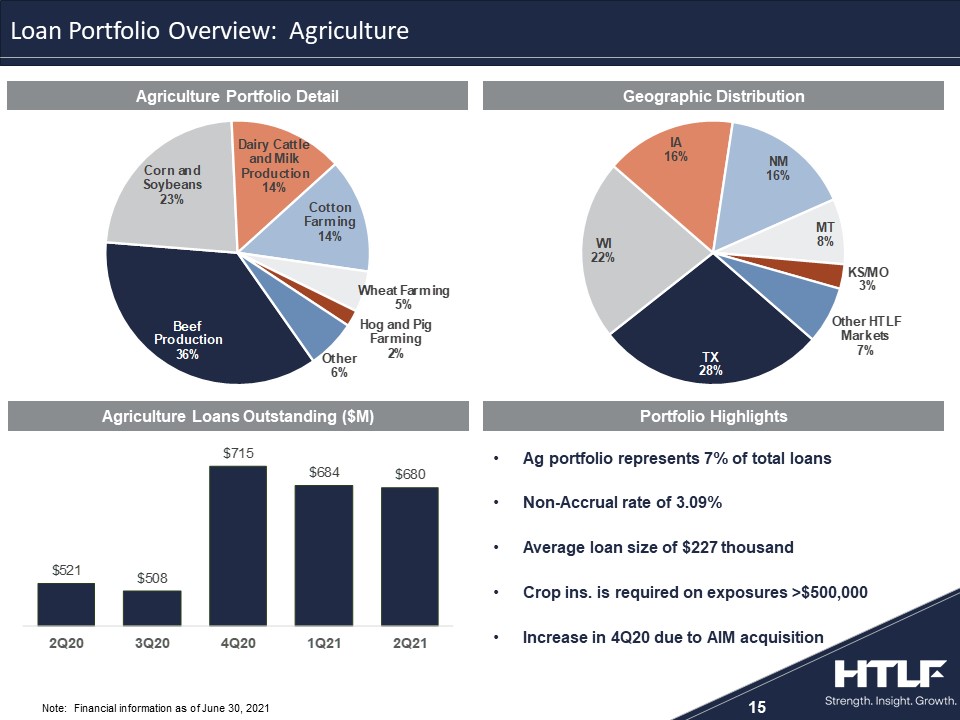
Ag portfolio represents 7% of total loansNon-Accrual rate of 3.09%Average loan size of $227 thousandCrop ins. is required on exposures >$500,000Increase in 4Q20 due to AIM acquisition 15 Note: Financial information as of June 30, 2021 324268 105140183 167188214 201203205 2108846 223134103 138141143 235236237 1616835 Loan Portfolio Overview: Agriculture Agriculture Portfolio Detail Geographic Distribution Portfolio Highlights Agriculture Loans Outstanding ($M)
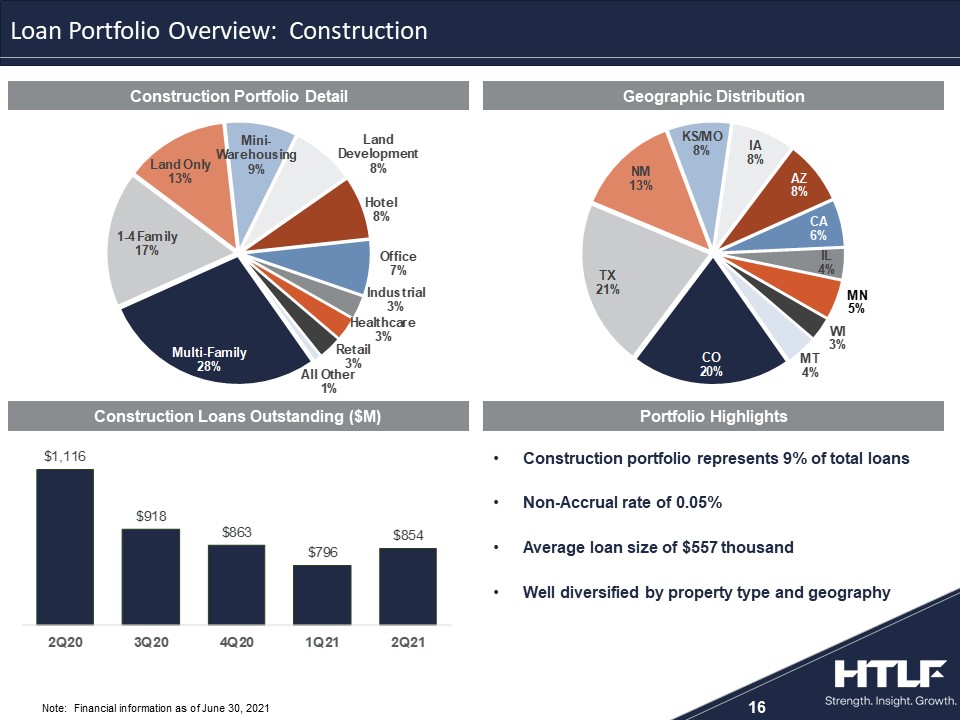
Construction portfolio represents 9% of total loansNon-Accrual rate of 0.05%Average loan size of $557 thousandWell diversified by property type and geography 16 Note: Financial information as of June 30, 2021 324268 105140183 167188214 201203205 2108846 223134103 138141143 235236237 1616835 Loan Portfolio Overview: Construction Construction Portfolio Detail Geographic Distribution Portfolio Highlights Construction Loans Outstanding ($M)
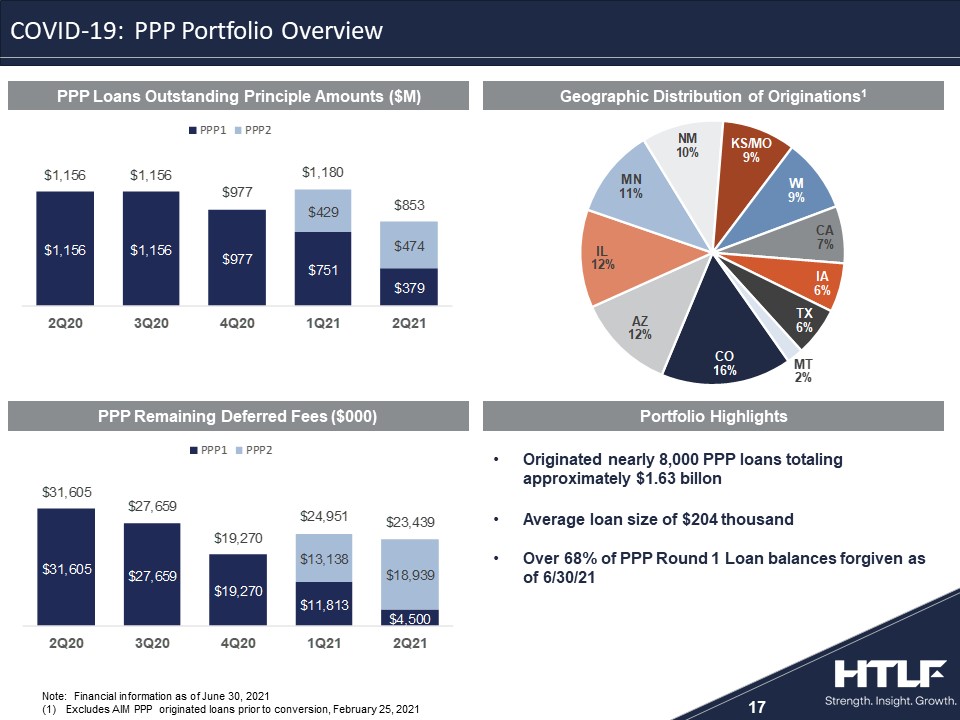
Originated nearly 8,000 PPP loans totaling approximately $1.63 billonAverage loan size of $204 thousandOver 68% of PPP Round 1 Loan balances forgiven as of 6/30/21 17 Note: Financial information as of June 30, 2021Excludes AIM PPP originated loans prior to conversion, February 25, 2021 324268 105140183 167188214 201203205 2108846 223134103 138141143 235236237 1616835 COVID-19: PPP Portfolio Overview PPP Loans Outstanding Principle Amounts ($M) Geographic Distribution of Originations1 Portfolio Highlights PPP Remaining Deferred Fees ($000)
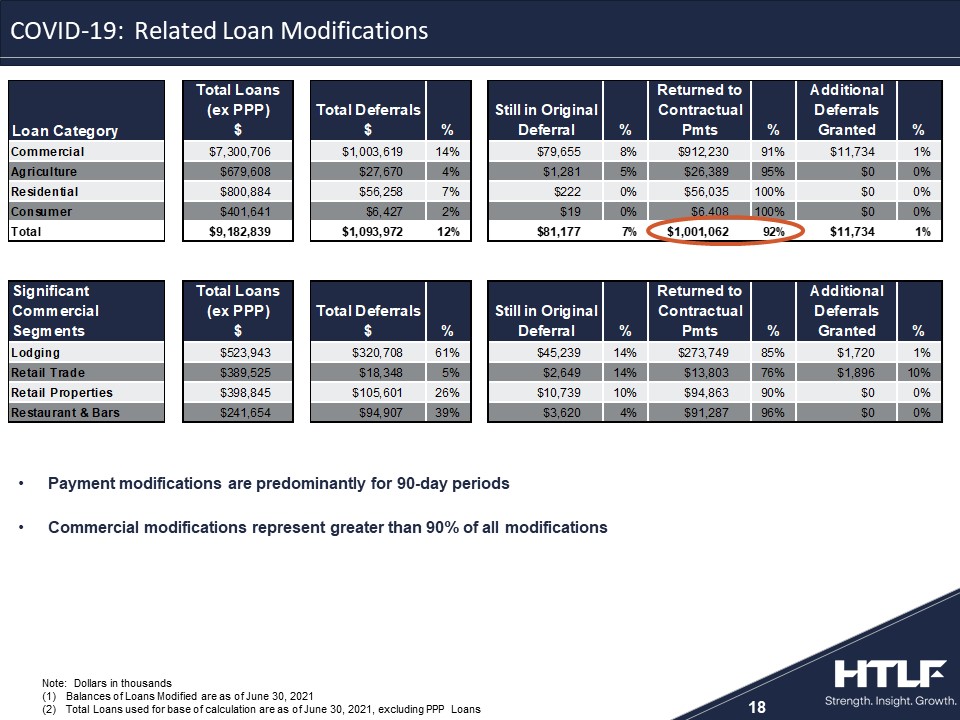
18 Payment modifications are predominantly for 90-day periodsCommercial modifications represent greater than 90% of all modifications Note: Dollars in thousandsBalances of Loans Modified are as of June 30, 2021Total Loans used for base of calculation are as of June 30, 2021, excluding PPP Loans 324268 105140183 167188214 201203205 2108846 223134103 138141143 235236237 1616835 COVID-19: Related Loan Modifications
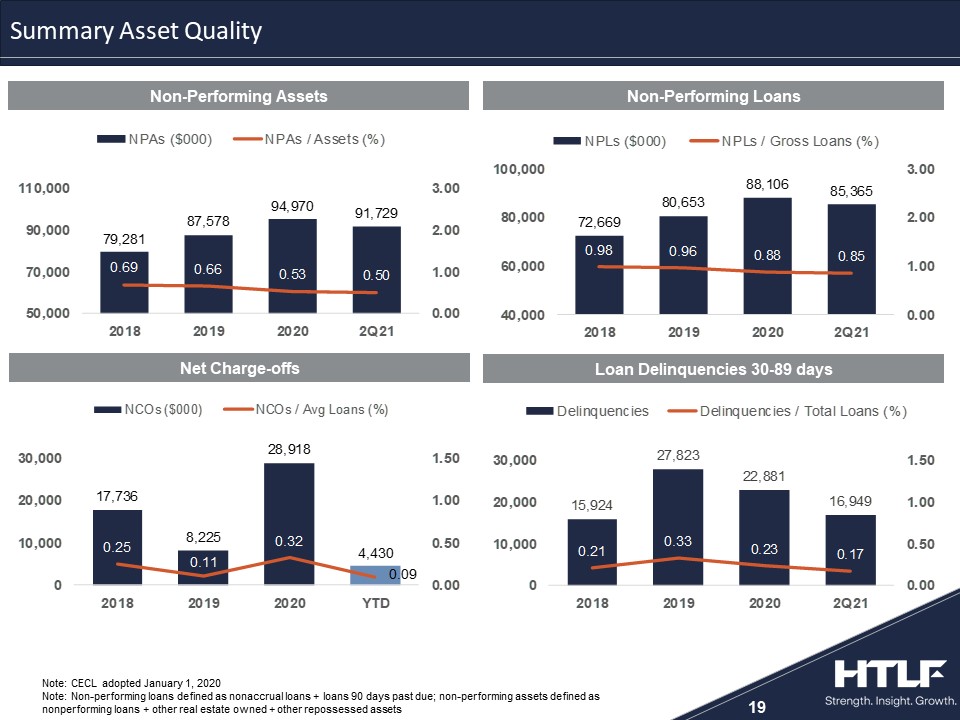
19 Note: CECL adopted January 1, 2020Note: Non-performing loans defined as nonaccrual loans + loans 90 days past due; non-performing assets defined as nonperforming loans + other real estate owned + other repossessed assets 324268 105140183 167188214 201203205 2108846 223134103 138141143 235236237 1616835 Non-Performing Assets Non-Performing Loans Net Charge-offs Loan Delinquencies 30-89 days Summary Asset Quality
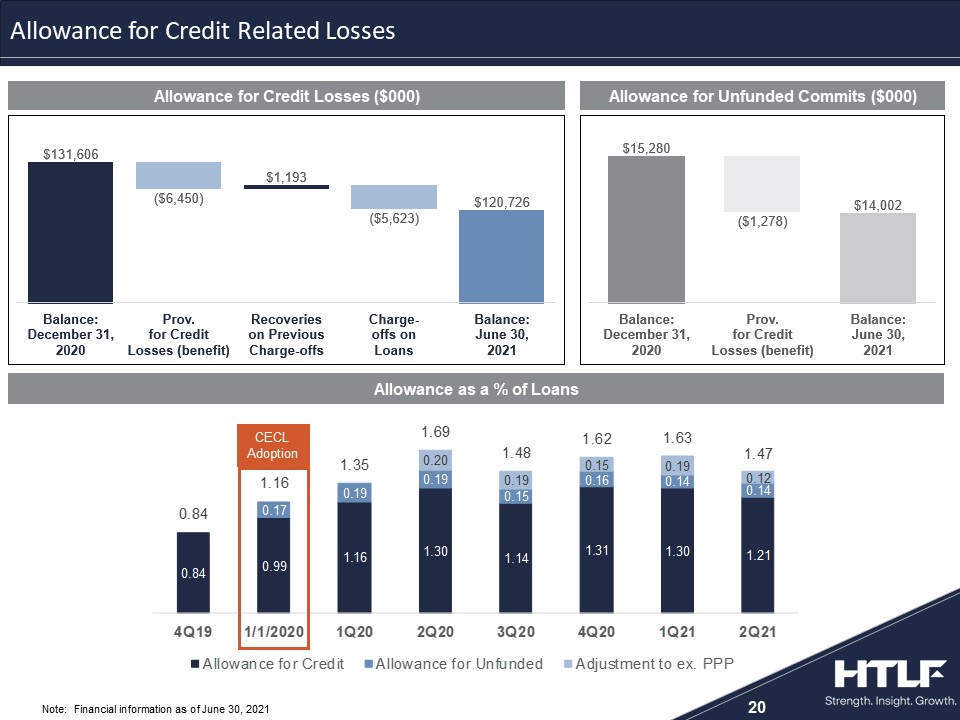
Allowance for Credit Losses ($000) Allowance for Unfunded Commits ($000) 20 Note: Financial information as of June 30, 2021 324268 105140183 167188214 201203205 2108846 223134103 138141143 235236237 1616835 CECLAdoption Allowance as a % of Loans Allowance for Credit Related Losses

Deposit Composition Cost of Interest-Bearing Deposits (%) Customer Non-Time Breakdown ($M) 21 Note: Financial information as of June 30, 2021 324268 105140183 167188214 201203205 2108846 223134103 138141143 235236237 1616835 Deposit Mix 5,991
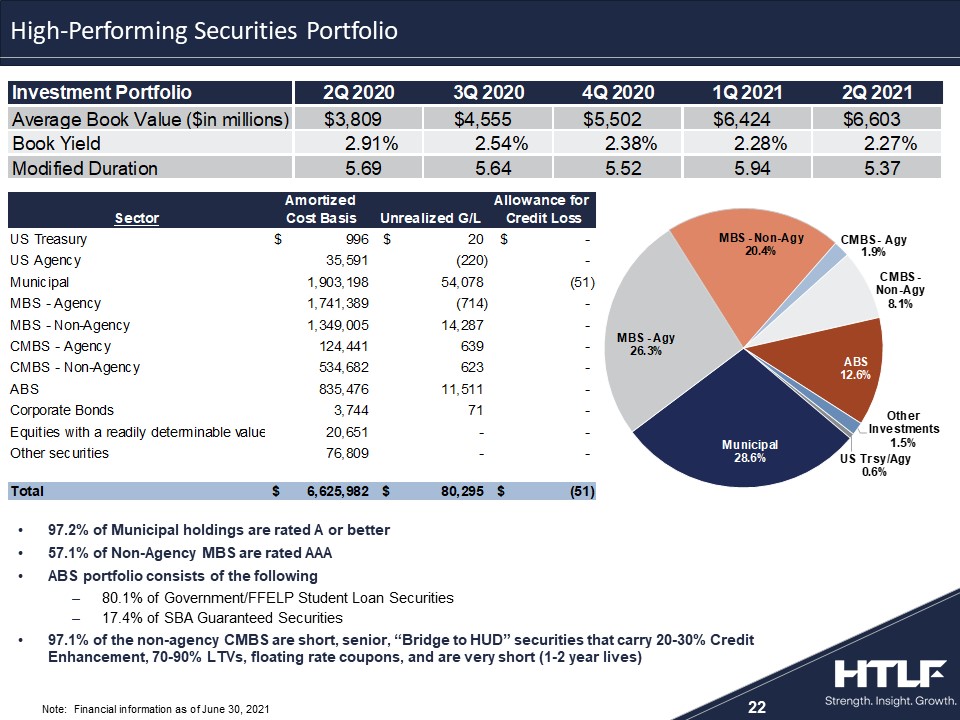
22 97.2% of Municipal holdings are rated A or better57.1% of Non-Agency MBS are rated AAAABS portfolio consists of the following80.1% of Government/FFELP Student Loan Securities17.4% of SBA Guaranteed Securities97.1% of the non-agency CMBS are short, senior, “Bridge to HUD” securities that carry 20-30% Credit Enhancement, 70-90% LTVs, floating rate coupons, and are very short (1-2 year lives) 324268 105140183 167188214 201203205 2108846 223134103 138141143 235236237 1616835 Note: Financial information as of June 30, 2021 High-Performing Securities Portfolio
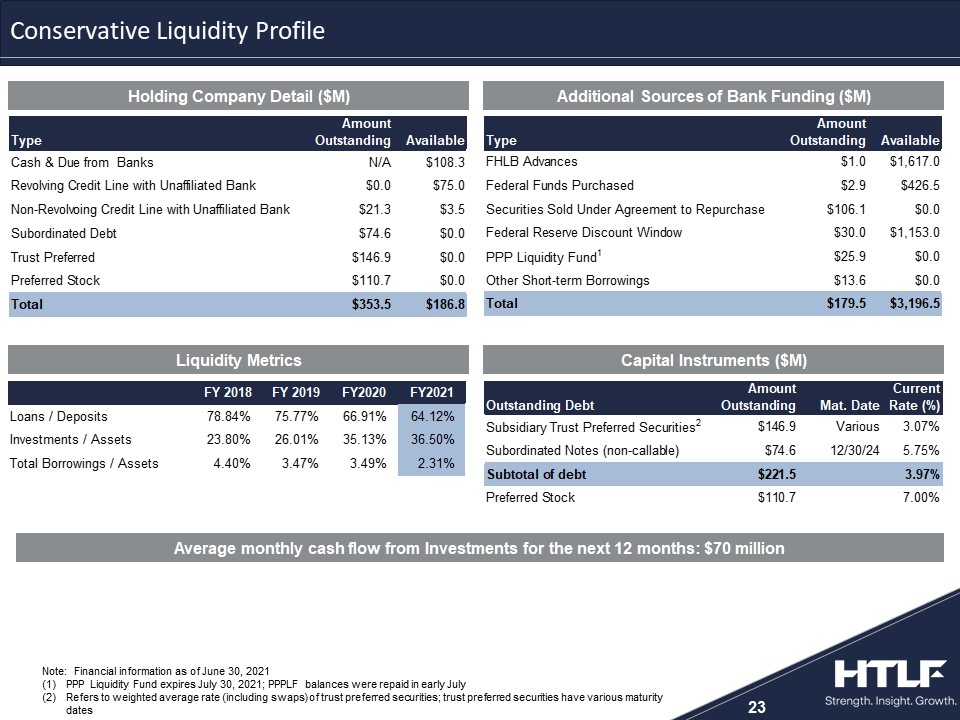
23 Average monthly cash flow from Investments for the next 12 months: $70 million Capital Instruments ($M) Liquidity Metrics Note: Financial information as of June 30, 2021PPP Liquidity Fund expires July 30, 2021; PPPLF balances were repaid in early JulyRefers to weighted average rate (including swaps) of trust preferred securities; trust preferred securities have various maturity dates 324268 105140183 167188214 201203205 2108846 223134103 138141143 235236237 1616835 Additional Sources of Bank Funding ($M) Holding Company Detail ($M) Conservative Liquidity Profile
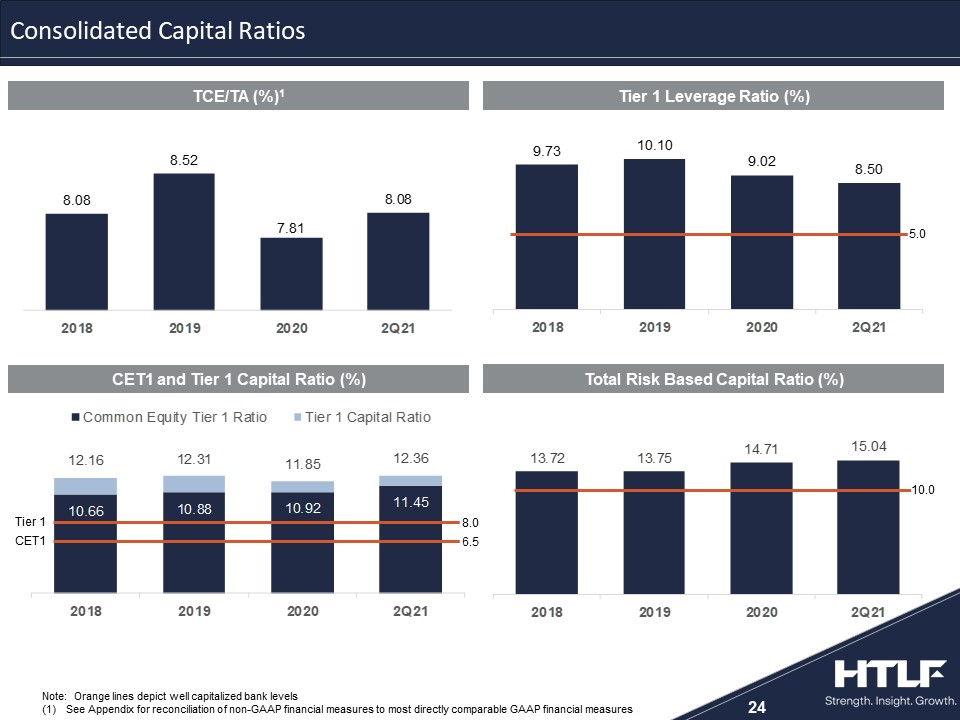
Total Risk Based Capital Ratio (%) 24 10.0 CET1 and Tier 1 Capital Ratio (%) Tier 1 CET1 8.0 6.5 Note: Orange lines depict well capitalized bank levelsSee Appendix for reconciliation of non-GAAP financial measures to most directly comparable GAAP financial measures 5.0 324268 105140183 167188214 201203205 2108846 223134103 138141143 235236237 1616835 Consolidated Capital Ratios TCE/TA (%)1 Tier 1 Leverage Ratio (%)
25 Attractive footprint MSA’s enhance growth opportunityConsistent earnings performance, utilizing leverage to drive efficiencyDisciplined and proven acquirerLarge granular low-cost core deposit baseSolid credit metrics through many credit cyclesGeographic and portfolio diversification reduces credit risk Low risk liquidity profile with healthy capital levels Summary

Appendix
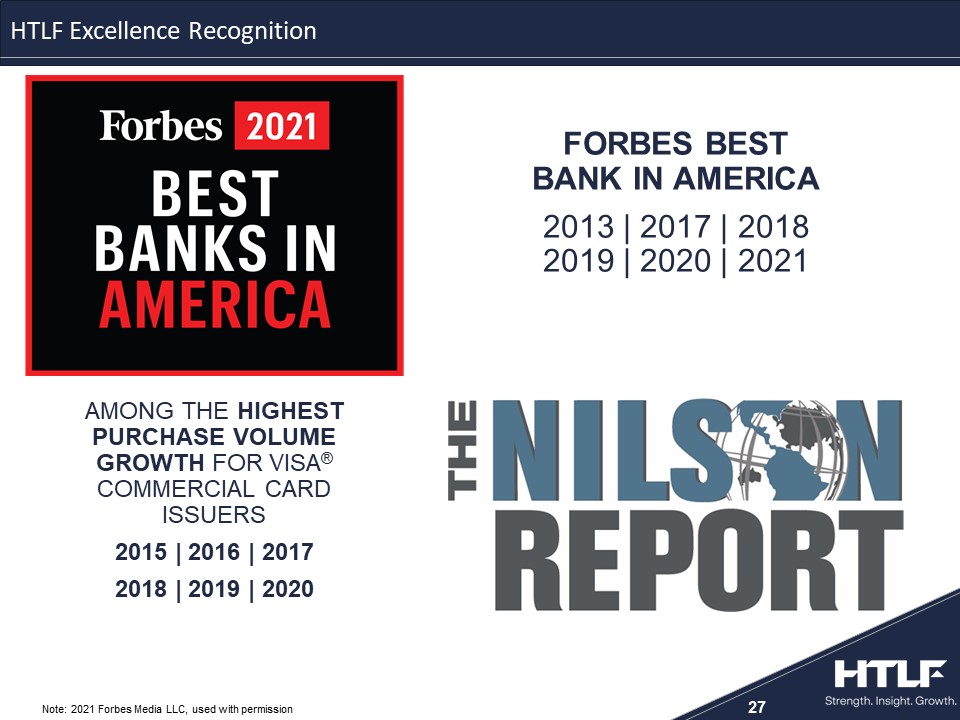
27 Note: 2021 Forbes Media LLC, used with permission 324268 105140183 167188214 201203205 2108846 223134103 138141143 235236237 1616835 AMONG THE HIGHEST PURCHASE VOLUME GROWTH FOR VISA® COMMERCIAL CARD ISSUERS2015 | 2016 | 20172018 | 2019 | 2020 Forbes Best Bank in America2013 | 2017 | 2018 2019 | 2020 | 2021 HTLF Excellence Recognition

Values and Guiding PrinciplesIntegrity – Always do the right thing. Be honest and open.Accountability – Keep your promises, follow through and follow up. Community – Engage your community and your team. Unlock the potential around you.Excellence – Exceed expectations – every customer, every time. Strength. Insight. Growth. It’s what we bring to our customers, communities, employees and shareholdersStrong corporate leadership and innovative thinking have uniquely positioned usOur business model and diverse geographic footprint reduce risk and drive organic growthComplemented by strategic M&A and talent acquisition 28 We See Growth Everywhere
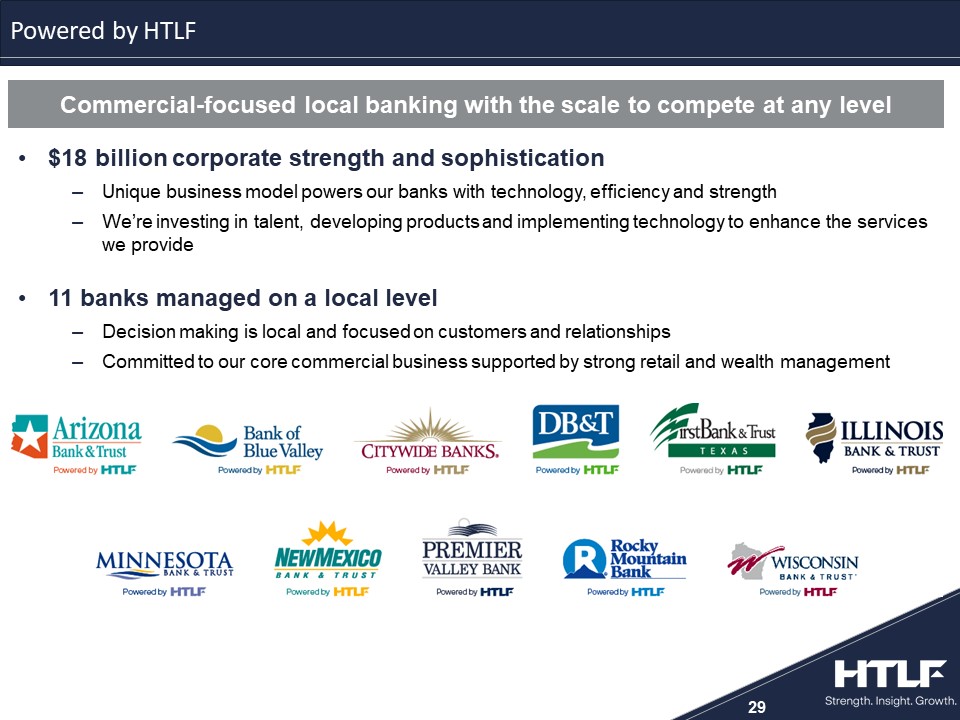
$18 billion corporate strength and sophistication Unique business model powers our banks with technology, efficiency and strengthWe’re investing in talent, developing products and implementing technology to enhance the services we provide11 banks managed on a local levelDecision making is local and focused on customers and relationshipsCommitted to our core commercial business supported by strong retail and wealth management 29 Powered by HTLF Commercial-focused local banking with the scale to compete at any level
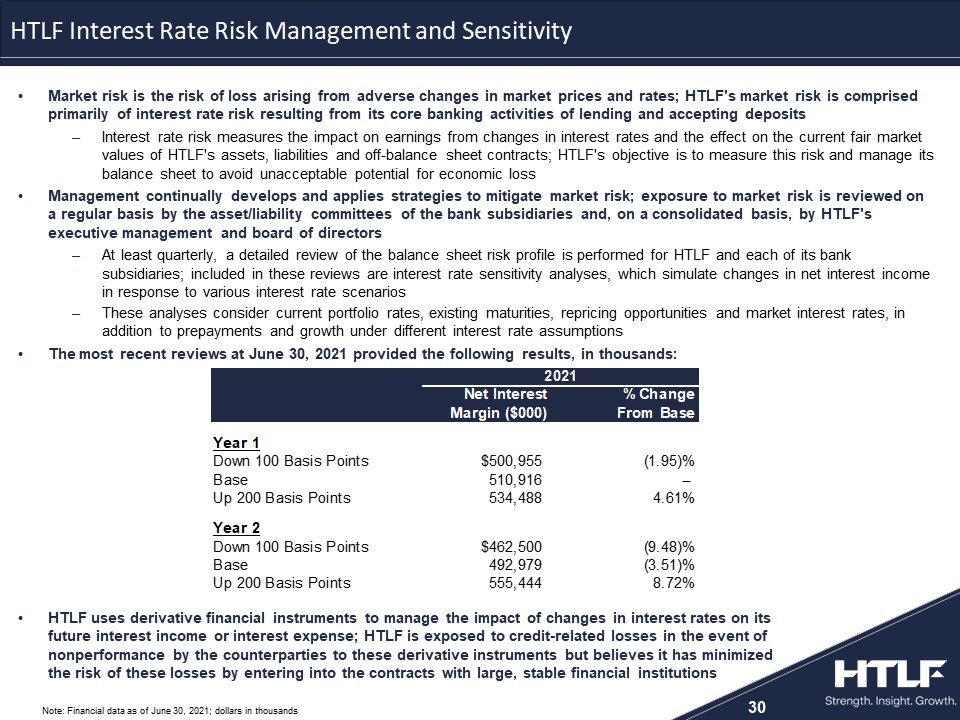
30 324268 105140183 167188214 201203205 2108846 223134103 138141143 235236237 1616835 HTLF Interest Rate Risk Management and Sensitivity Market risk is the risk of loss arising from adverse changes in market prices and rates; HTLF's market risk is comprised primarily of interest rate risk resulting from its core banking activities of lending and accepting depositsInterest rate risk measures the impact on earnings from changes in interest rates and the effect on the current fair market values of HTLF's assets, liabilities and off-balance sheet contracts; HTLF's objective is to measure this risk and manage its balance sheet to avoid unacceptable potential for economic lossManagement continually develops and applies strategies to mitigate market risk; exposure to market risk is reviewed on a regular basis by the asset/liability committees of the bank subsidiaries and, on a consolidated basis, by HTLF's executive management and board of directorsAt least quarterly, a detailed review of the balance sheet risk profile is performed for HTLF and each of its bank subsidiaries; included in these reviews are interest rate sensitivity analyses, which simulate changes in net interest income in response to various interest rate scenariosThese analyses consider current portfolio rates, existing maturities, repricing opportunities and market interest rates, in addition to prepayments and growth under different interest rate assumptionsThe most recent reviews at June 30, 2021 provided the following results, in thousands: Note: Financial data as of June 30, 2021; dollars in thousands HTLF uses derivative financial instruments to manage the impact of changes in interest rates on its future interest income or interest expense; HTLF is exposed to credit-related losses in the event of nonperformance by the counterparties to these derivative instruments but believes it has minimized the risk of these losses by entering into the contracts with large, stable financial institutions
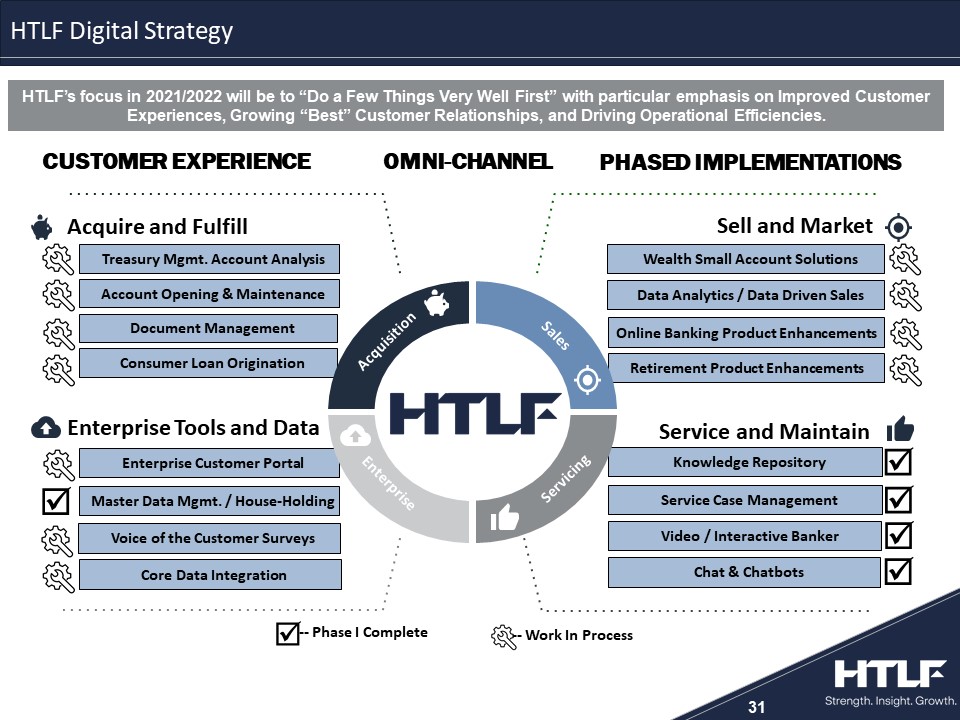
31 324268 105140183 167188214 201203205 2108846 223134103 138141143 235236237 1616835 Retirement Product Enhancements Online Banking Product Enhancements Document Management Consumer Loan Origination Account Opening & Maintenance Enterprise Tools and Data Acquire and Fulfill Sell and Market Service and Maintain Enterprise Customer Portal Master Data Mgmt. / House-Holding Knowledge Repository Service Case Management Treasury Mgmt. Account Analysis CUSTOMER EXPERIENCE OMNI-CHANNEL PHASED IMPLEMENTATIONS Video / Interactive Banker Wealth Small Account Solutions HTLF’s focus in 2021/2022 will be to “Do a Few Things Very Well First” with particular emphasis on Improved Customer Experiences, Growing “Best” Customer Relationships, and Driving Operational Efficiencies. Voice of the Customer Surveys Data Analytics / Data Driven Sales Chat & Chatbots Core Data Integration Sales Servicing Enterprise Acquisition -- Phase I Complete -- Work In Process HTLF Digital Strategy
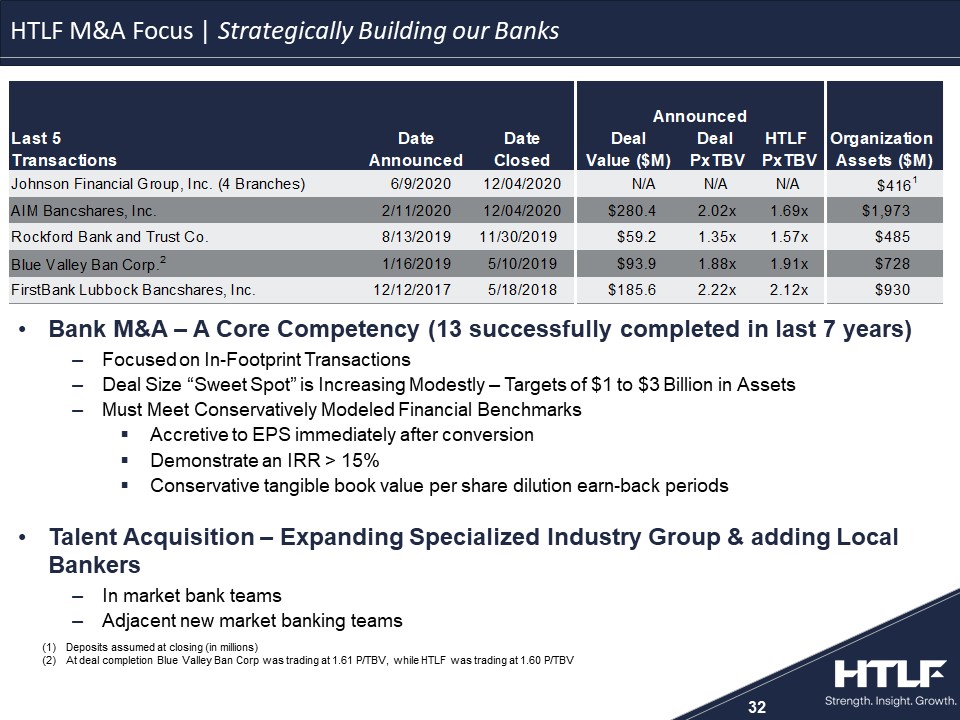
32 Deposits assumed at closing (in millions)At deal completion Blue Valley Ban Corp was trading at 1.61 P/TBV, while HTLF was trading at 1.60 P/TBV 324268 105140183 167188214 201203205 2108846 223134103 138141143 235236237 1616835 Bank M&A – A Core Competency (13 successfully completed in last 7 years)Focused on In-Footprint TransactionsDeal Size “Sweet Spot” is Increasing Modestly – Targets of $1 to $3 Billion in AssetsMust Meet Conservatively Modeled Financial BenchmarksAccretive to EPS immediately after conversionDemonstrate an IRR > 15%Conservative tangible book value per share dilution earn-back periodsTalent Acquisition – Expanding Specialized Industry Group & adding Local BankersIn market bank teamsAdjacent new market banking teams HTLF M&A Focus | Strategically Building our Banks
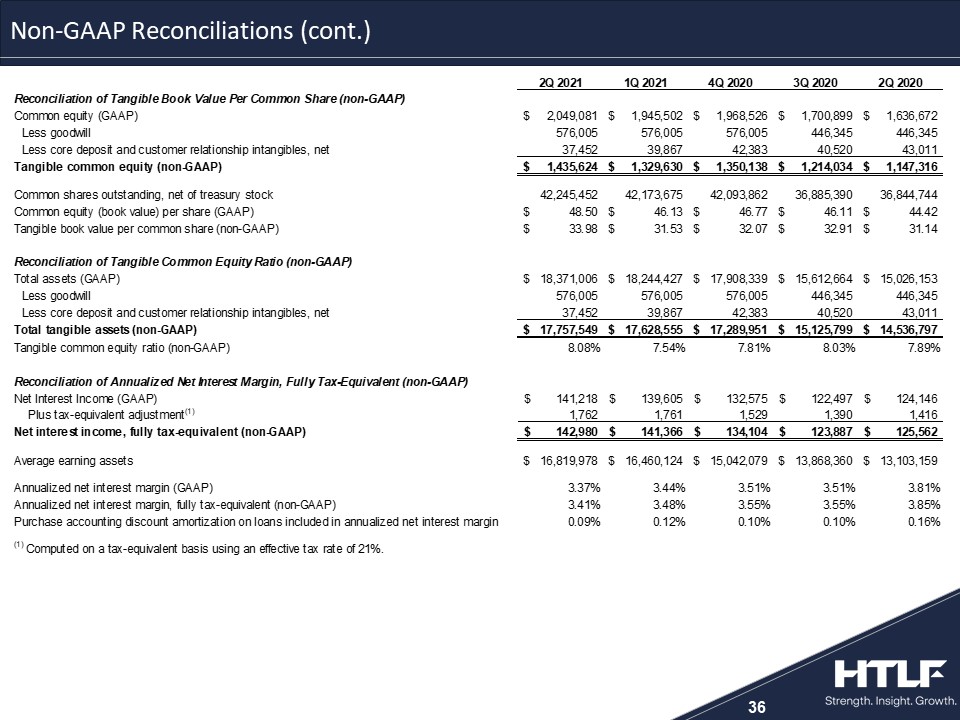
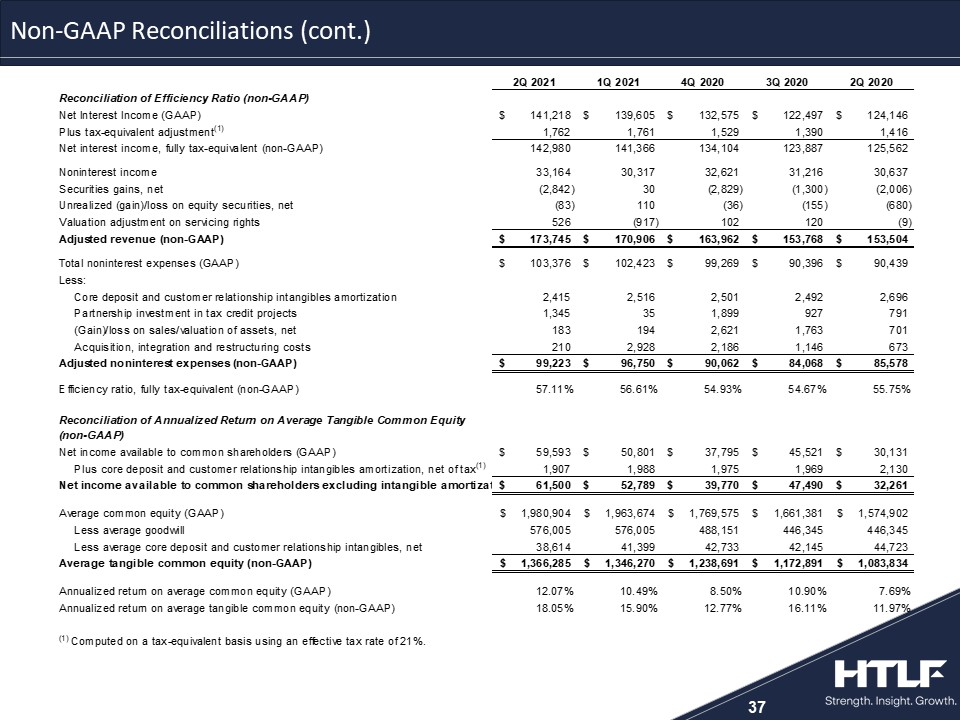
33 Annualized net interest margin, fully tax-equivalent, adjusts net interest income for the tax-favored status of certain loans and securities. Management believes this measure enhances the comparability of net interest income arising from taxable and tax-exempt sources.Efficiency ratio, fully tax equivalent, expresses noninterest expenses as a percentage of fully tax-equivalent net interest income and noninterest income. This efficiency ratio is presented on a tax-equivalent basis which adjusts net interest income and noninterest expenses for the tax favored status of certain loans, securities, and tax credit projects. Management believes the presentation of this non-GAAP measure provides supplemental useful information for proper understanding of the financial results as it enhances the comparability of income and expenses arising from taxable and nontaxable sources and excludes specific items as noted in reconciliation contained in this press release.Net interest income, fully tax equivalent, is net income adjusted for the tax-favored status of certain loans and securities. Management believes this measure enhances the comparability of net interest income arising from taxable and tax-exempt sources.Tangible book value per common share is total common equity less goodwill and core deposit and customer relationship intangibles, net, divided by common shares outstanding, net of treasury. This measure is included as it is considered to be a critical metric to analyze and evaluate use of equity, financial condition and capital strength.Tangible common equity ratio is total common equity less goodwill and core deposit and customer relationship intangibles, net, divided by total assets less goodwill and core deposit and customer relationship intangibles, net. This measure is included as it is considered to be a critical metric to analyze and evaluate financial condition and capital strength.Annualized return on average tangible common equity is net income excluding intangible amortization calculated as (1) net income excluding tax-effected core deposit and customer relationship intangibles amortization, divided by (2) average common equity less goodwill and core deposit and customer relationship intangibles, net. This measure is included as it is considered to be a critical metric to analyze and evaluate use of equity, financial condition and capital strength. Non-GAAP Financial Measures
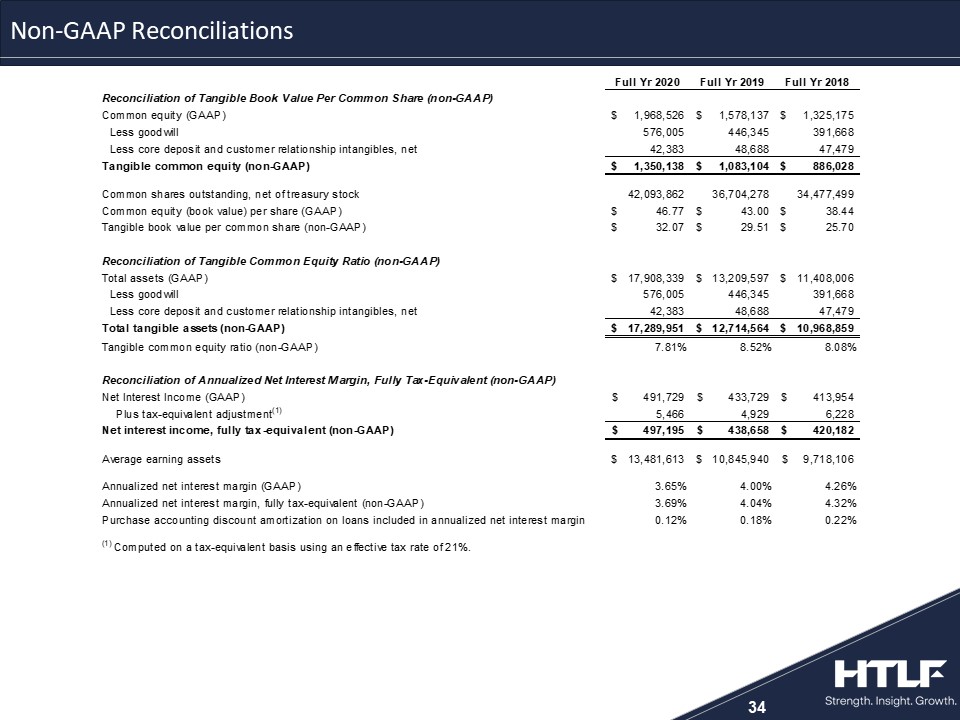
34 Non-GAAP Reconciliations
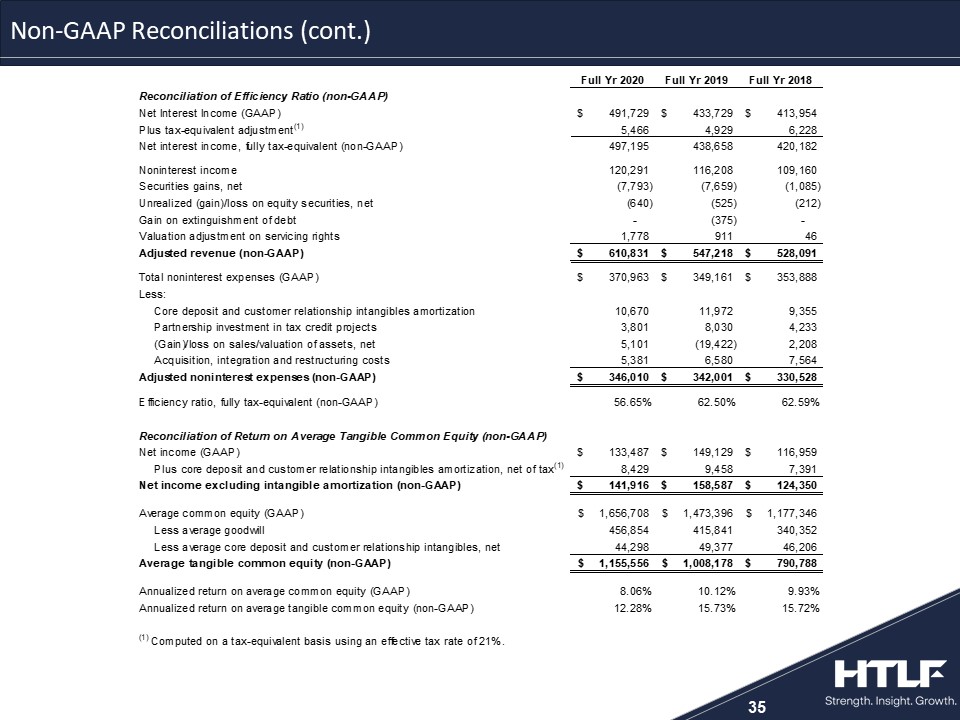
35 Non-GAAP Reconciliations (cont.)
36 Non-GAAP Reconciliations (cont.)
37 Non-GAAP Reconciliations (cont.)
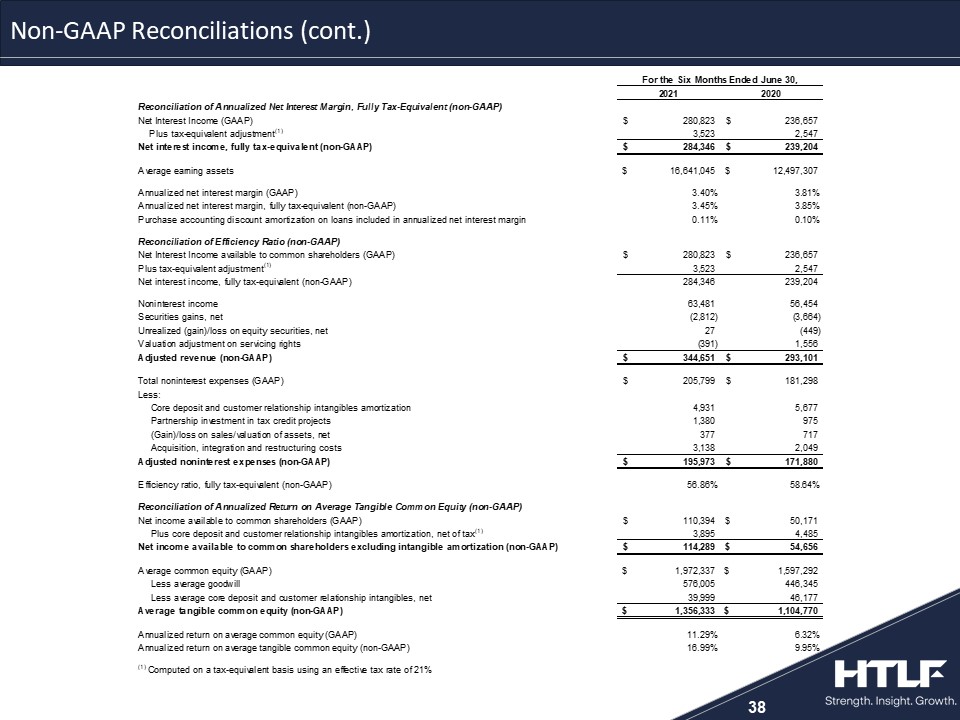
38 Non-GAAP Reconciliations (cont.)