UNITED STATES
SECURITIES AND EXCHANGE COMMISSION
WASHINGTON, D.C. 20549
FORM 8-K
CURRENT REPORT
PURSUANT TO SECTION 13 OR 15(d) OF THE SECURITIES EXCHANGE ACT OF 1934
November 10, 2011
(Date of earliest event reported)
LABORATORY CORPORATION OF
AMERICA HOLDINGS
(Exact Name of Registrant as Specified in its Charter)
| Delaware | 1-11353 | 13-3757370 | ||
| (State or other jurisdiction of Incorporation) | (Commission File Number) | (I.R.S. Employer Identification No.) |
| 358 South Main Street, | ||||
| Burlington, North Carolina | 27215 | 336-229-1127 | ||
| (Address of principal executive offices) | (Zip Code) | (Registrant’s telephone number including area code) |
Check the appropriate box below if the Form 8-K filing is intended to simultaneously satisfy the filing obligation of the registrant under any of the following provisions:
| [ ] | Written communication pursuant to Rule 425 under the Securities Act (17 CFR 230.425) |
| [ ] | Soliciting material pursuant to Rule 14a-12 under the Exchange Act (17 CFR 240.14a-12) |
| [ ] | Pre-commencement communications pursuant to Rule 14d-2(b) under the Exchange Act (17 CFR 240.14d-2(b)) |
| [ ] | Pre-commencement communications pursuant to Rule 13e-4(c) under the Exchange Act (17 CFR 240.13e-4(c)) |
| Item 7.01 | Regulation FD Disclosure |
Summary information of the Company in connection with the presentation at the Credit Suisse 2011 Healthcare Conference in Phoenix, AZ on November 10, 2011.
SIGNATURES
Pursuant to the requirements of the Securities Exchange Act of 1934, the registrant has duly caused this report to be signed on its behalf by the undersigned hereunto duly authorized.
LABORATORY CORPORATION OF AMERICA HOLDINGS
Registrant
| By: | /s/ F. SAMUEL EBERTS III | |
| F. Samuel Eberts III | ||
| Chief Legal Officer and Secretary |
November 10, 2011

November 10, 2011
Phoenix, AZ
Credit Suisse 2011
Healthcare Conference

2
This slide presentation contains forward-looking
statements which are subject to change based on
various important factors, including without limitation,
competitive actions in the marketplace and adverse
actions of governmental and other third-party payors.
statements which are subject to change based on
various important factors, including without limitation,
competitive actions in the marketplace and adverse
actions of governmental and other third-party payors.
Actual results could differ materially from those
suggested by these forward-looking statements.
Further information on potential factors that could
affect the Company’s financial results is included in
the Company’s Form 10-K for the year ended
December 31, 2010, and subsequent SEC filings.
suggested by these forward-looking statements.
Further information on potential factors that could
affect the Company’s financial results is included in
the Company’s Form 10-K for the year ended
December 31, 2010, and subsequent SEC filings.
Forward Looking Statement

Introduction
3
Leading National
Lab Provider
• Fastest growing national lab
• $55 billion market
• Clinical, Anatomic and Genomic Testing
• Serving clients in all 50 states and Canada
• Foremost clinical trials testing business
4
Introduction
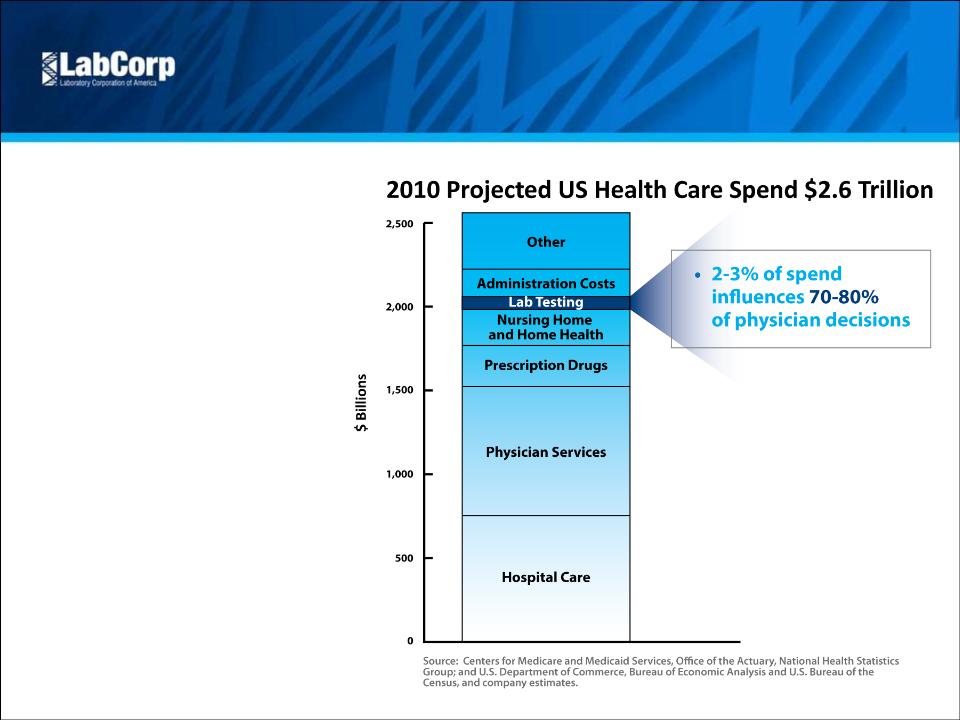
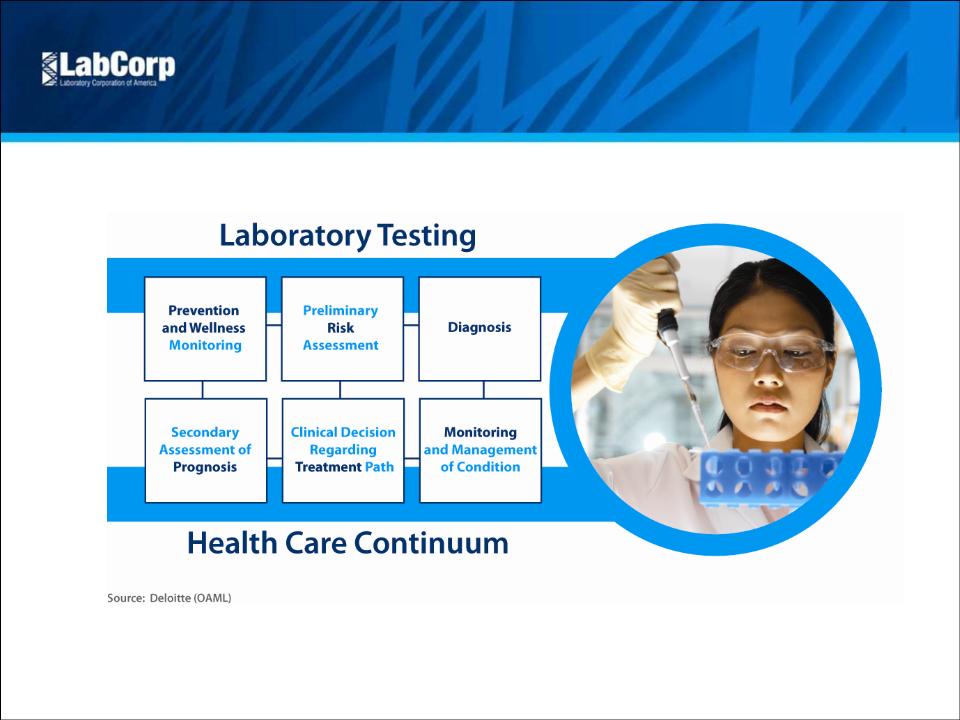
Valuable Service
• Small component of total cost
influences large percentage
of clinical decisions
• Screening, early detection,
and monitoring reduce
downstream costs
• Companion diagnostics
improve drug efficacy and
reduce adverse drug effects
Attractive Market
5
Attractive Market
6
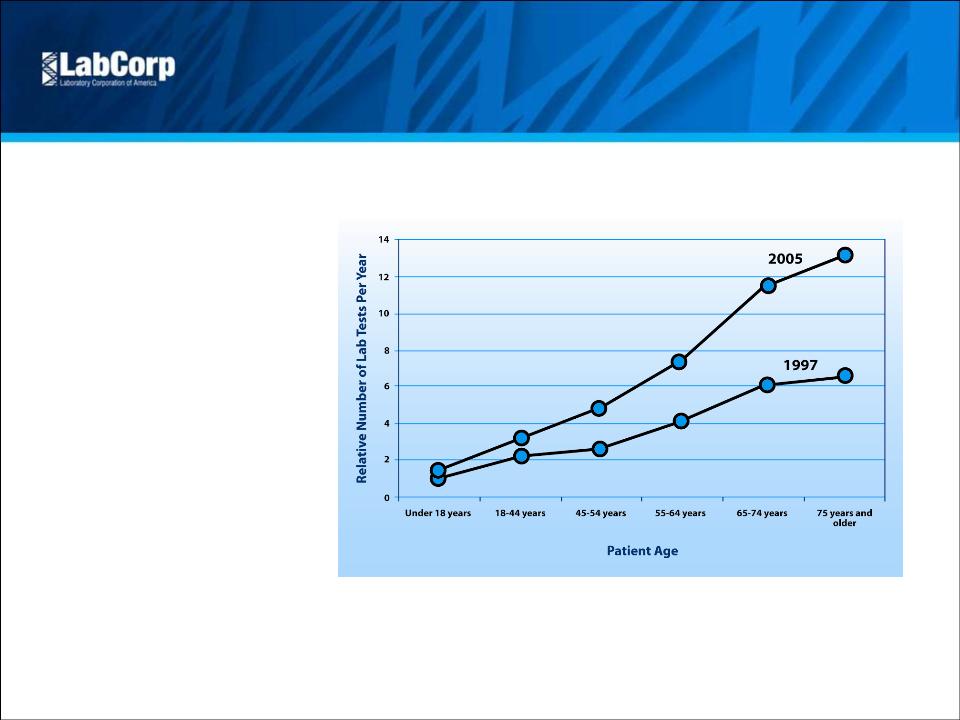
Growth Drivers
• Aging population
• Industry consolidation
• Advances in genomics
• Pharmacogenomics/
companion diagnostics
• Cost pressures
Source: CDC National Ambulatory Medical Care Survey and Company Estimates
Attractive Market
7
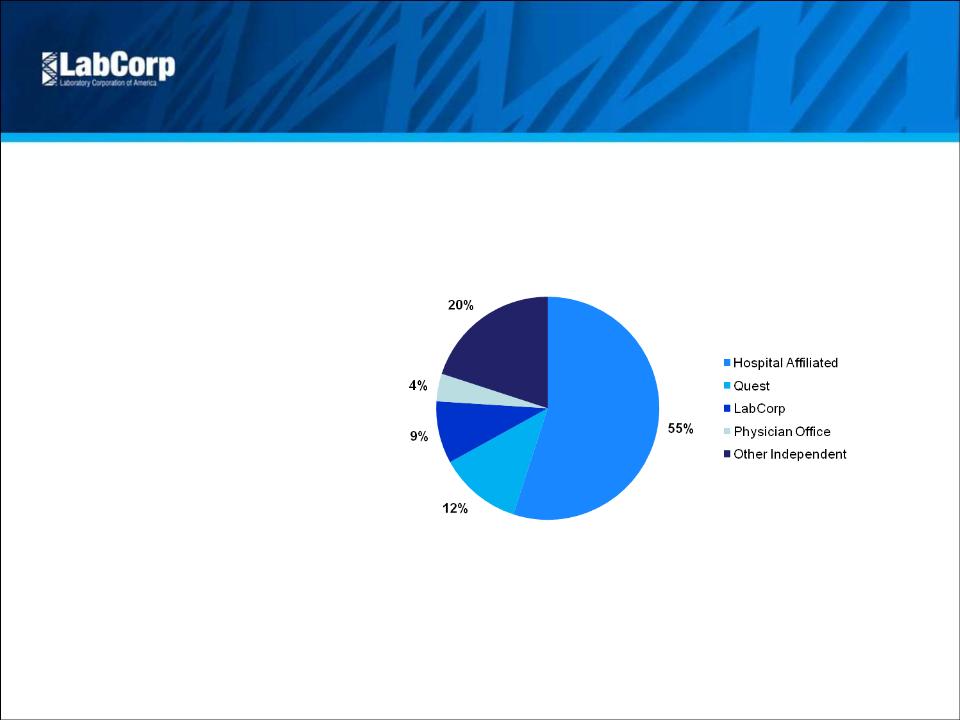
Opportunity to
Take Share
• Approximately 5,000
independent labs
• Less efficient, higher cost
competitors
Source: Washington G-2 Reports and Company estimates
$55 Billion US Lab Market
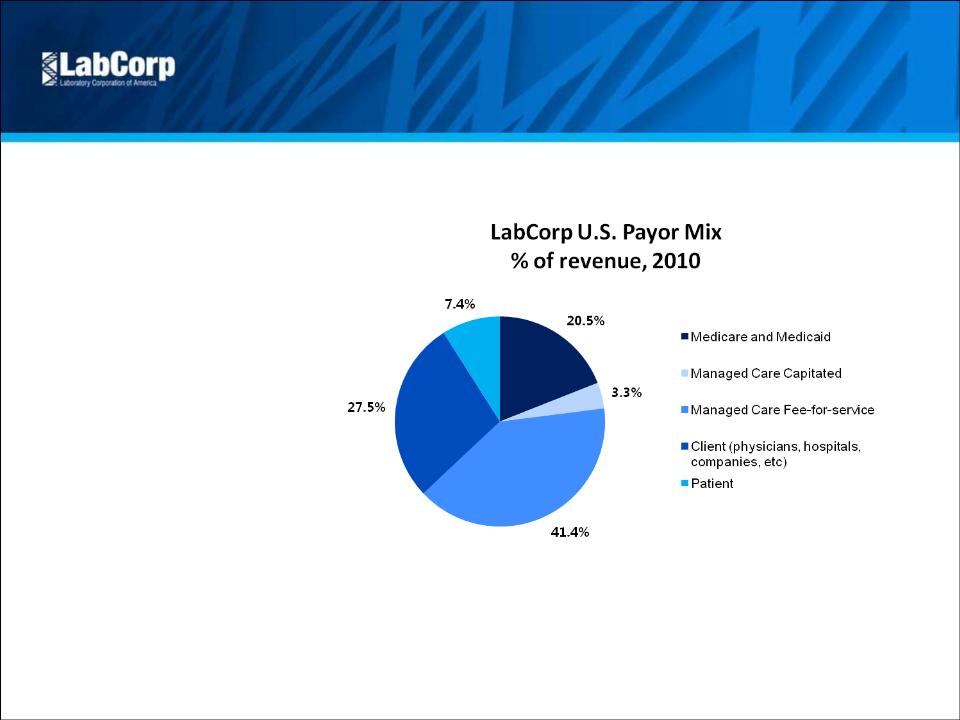
Attractive Market
Diversified Payor Mix
• No customer > 9% of revenue
• Limited government exposure
8
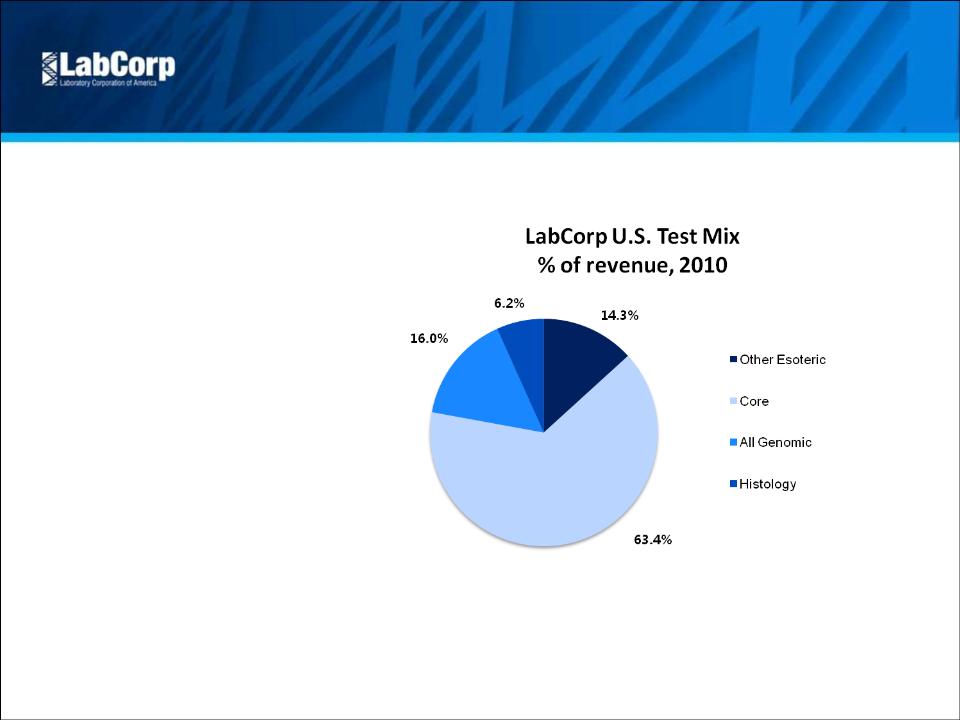
Attractive Market
Diversified Test Mix
With Genzyme GeneticsSM*
acquisition, esoteric testing
comprises approximately
40% of revenue
9
*GENZYME GENETICSSM and its logo are trademarks of Genzyme Corporation and used by Esoterix
Genetic Laboratories, LLC, a wholly-owned subsidiary of LabCorp, under license. Esoterix Genetic
Laboratories and LabCorp are operated independently from Genzyme Corporation.
Genetic Laboratories, LLC, a wholly-owned subsidiary of LabCorp, under license. Esoterix Genetic
Laboratories and LabCorp are operated independently from Genzyme Corporation.

Mission Statement
10
We Will Offer The Highest Quality
Laboratory Testing and Most
Compelling Value to Our
Customers
Laboratory Testing and Most
Compelling Value to Our
Customers
We Will Execute This Mission
Through Our Five Pillar Strategy
Through Our Five Pillar Strategy

Five Pillar Strategy
Pillar One
11
Deploy Cash to Enhance
Footprint and Test Menu
and to Buy Shares
Footprint and Test Menu
and to Buy Shares
Five Pillar Strategy—Pillar One
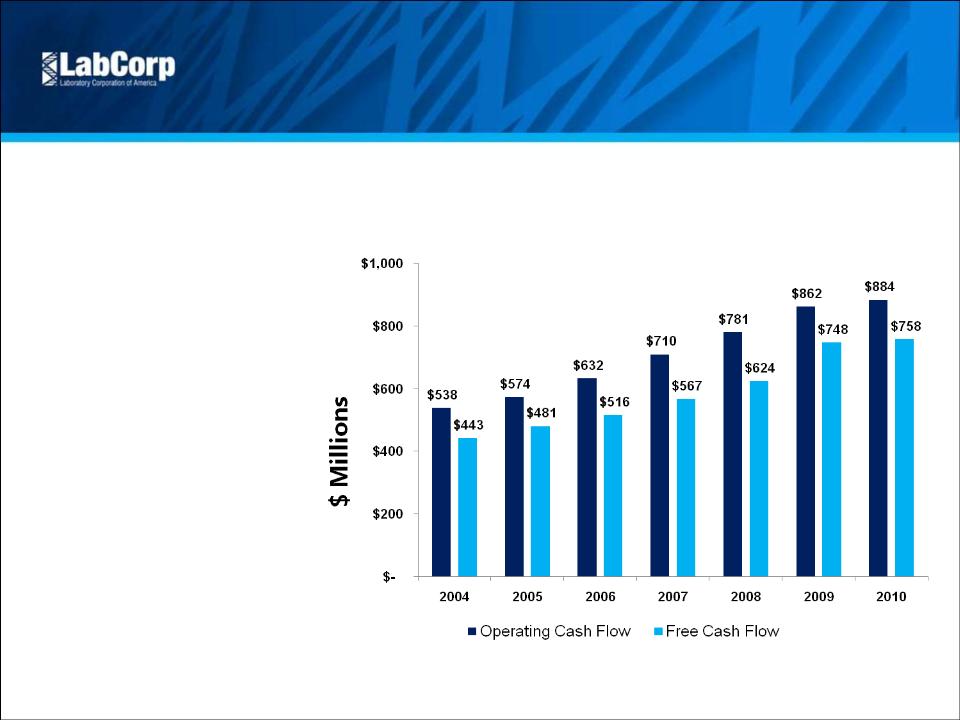
Strong Cash Generation
Strong Cash Generation
Cash Flow
• 6-year FCF CAGR of 9.4%
• Strategic acquisitions
• $3.7 B share repurchase
since 2004 (through Q3 2011)
Note: $ in millions and Free Cash Flow is a non-GAAP metric
12
Five Pillar Strategy—Pillar One
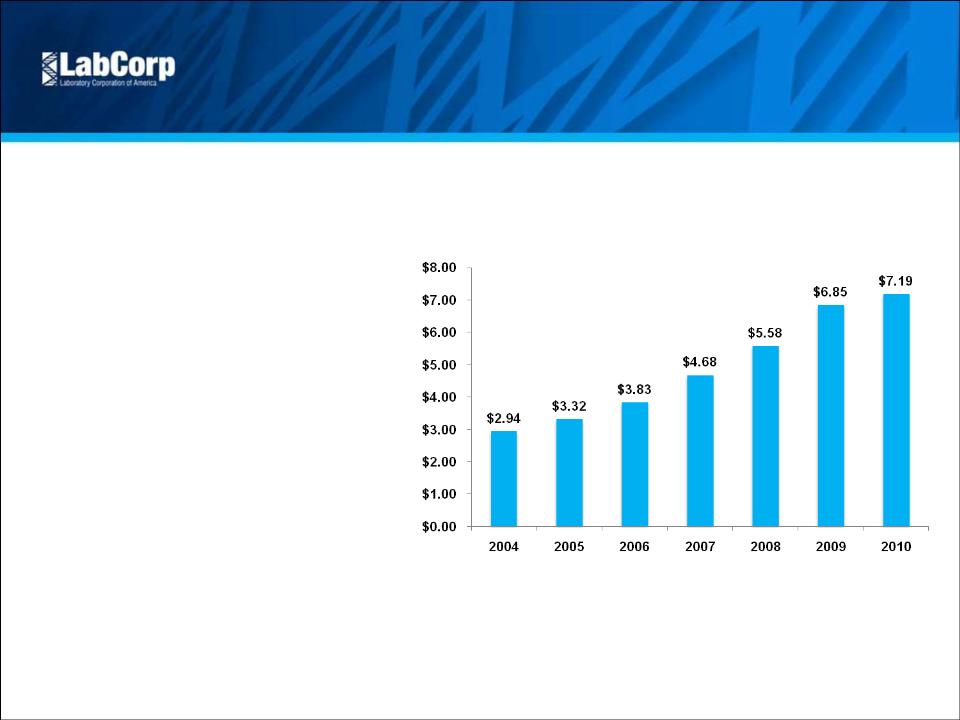
Impressive FCF Trend
Free Cash Flow Per Share
• 6-year FCF Per Share CAGR of 16.1%
• 2011 FCF Yield range of
approximately 8% to 10%
through Q3
Note: Free Cash Flow Per Share and Free Cash Flow Yield are non-GAAP metrics
13
Five Pillar Strategy—Pillar One
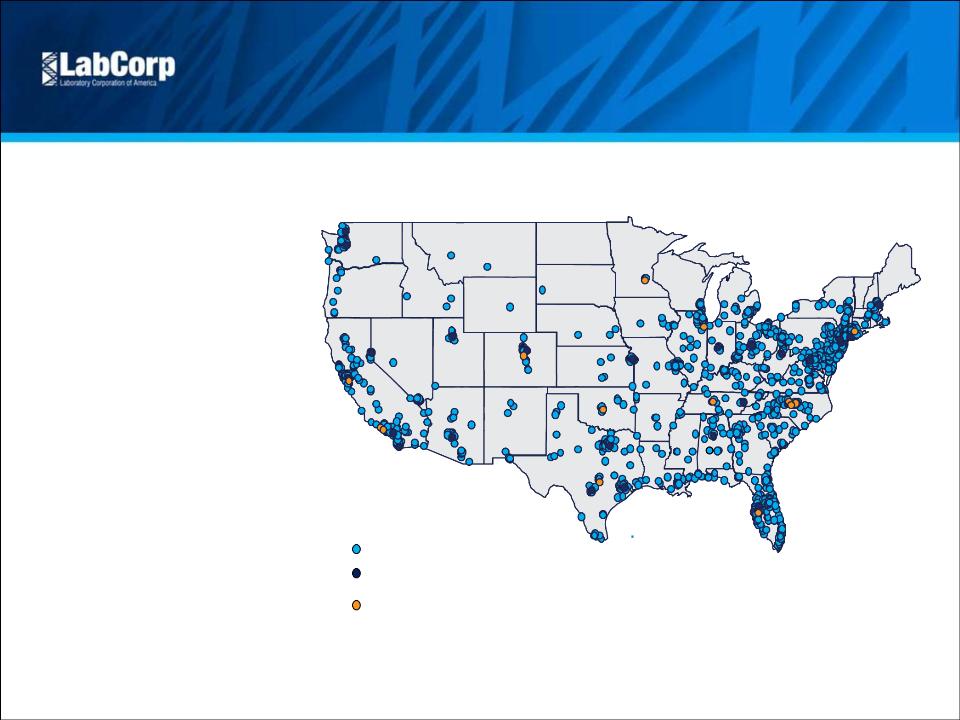
Competitive Position
Scale and Scope
• National infrastructure
• Broad test offering
• Managed care contracts
• Economies of scale
14
Primary LabCorp Testing Locations*
Esoteric Lab Locations
(CET, CMBP, Dianon, Esoterix, Monogram Biosciences, NGI, OTS, US Labs, Viromed)
Patient Service Centers*
Five Pillar Strategy—Pillar One
Key Uses of Cash
15
Key Uses of Cash
• Acquisitions
• Genzyme Genetics
• Westcliff (LabWest, Inc)
• DCL
• Share Repurchase
• $337 million in 2010
• $478 million through Q3 2011

Five Pillar Strategy—Pillar One
Genzyme Genetics Aquisition
16
Acquisition Rationale
• Creates the premier genetics and
oncology business in the industry
• Builds on our strategy of leadership in
personalized medicine
• Generates revenue opportunities
• Selling LabCorp’s test menu to
Genzyme Genetics accounts
• Selling Genzyme Genetics’ test menu to
LabCorp accounts
• Genzyme Genetics customer access to
LabCorp’s convenient PSC network
• Expanded use of genetic counselors
• Creates cost synergies
• Logistics
• Specimen collection
• G&A
• Facility overlap

Five Pillar Strategy—Pillar One
Importance of Genetics
• Preconception
• Pre- and post-natal
• Identification of disease carriers
• Identification of disease predisposition
• Diagnosis of genetically caused or
influenced conditions
(eg, developmental delay)
• Disease prognosis and treatment
(especially cancer)
17
• More sophisticated methods of cancer
testing complement traditional biopsies
• Value of diagnostics for disease prognosis,
and monitoring of progression and recurrence
• Critical role of testing in therapy
selection
18
Five Pillar Strategy—Pillar One
Importance of Oncology

19
Five Pillar Strategy
Pillar Two
Enhance IT Capabilities
To Improve Physician
and Patient Experience
To Improve Physician
and Patient Experience
Five Pillar Strategy—Pillar Two
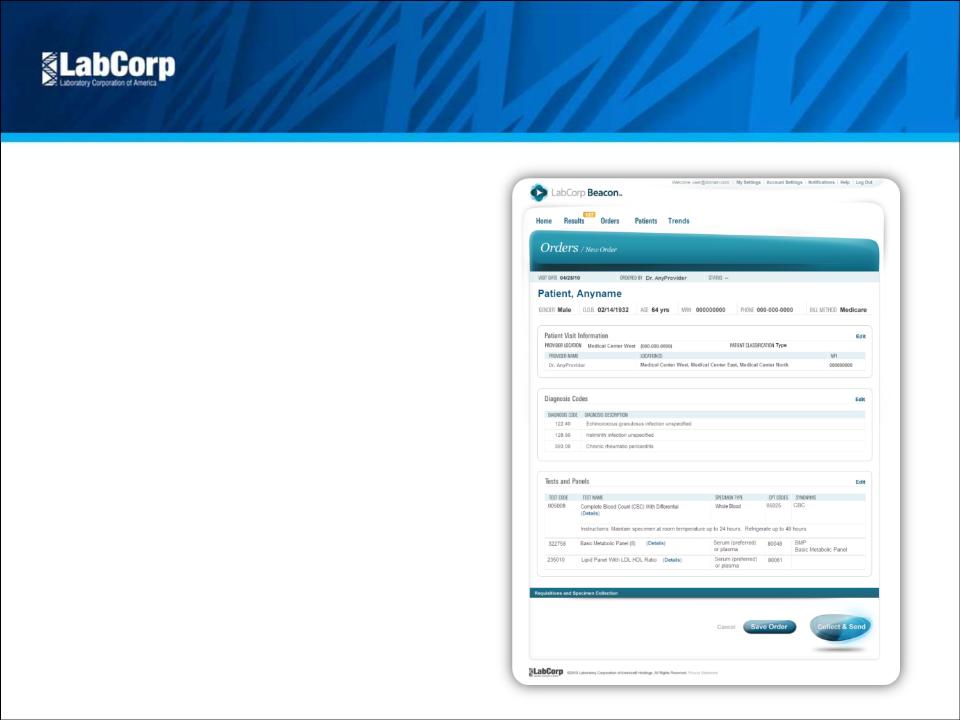
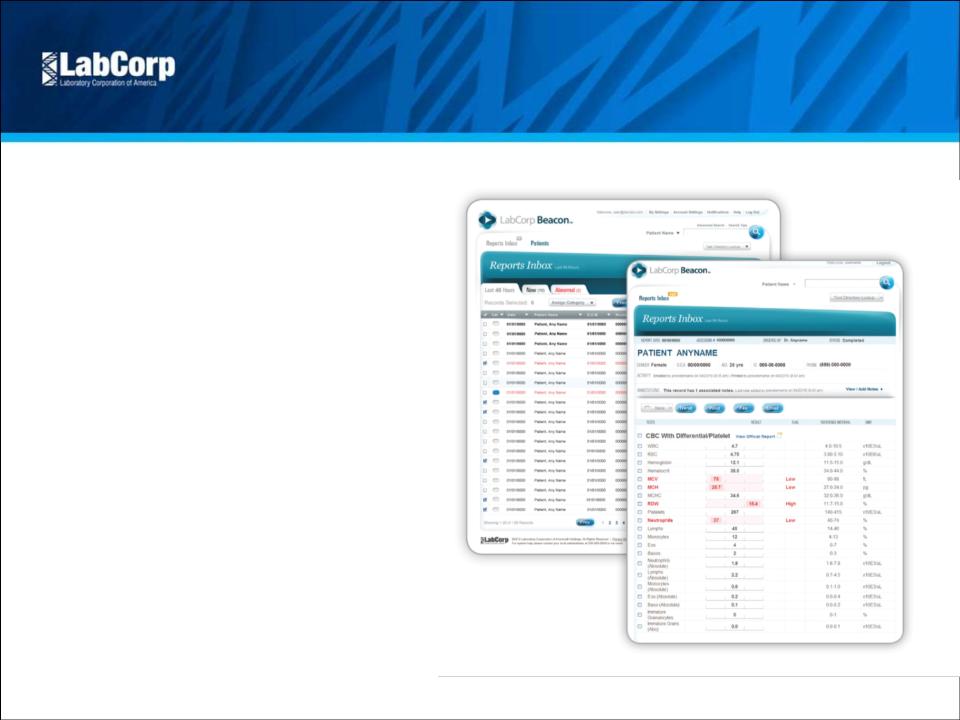
LabCorp Beacon™ | Physician
Experience
Experience
20
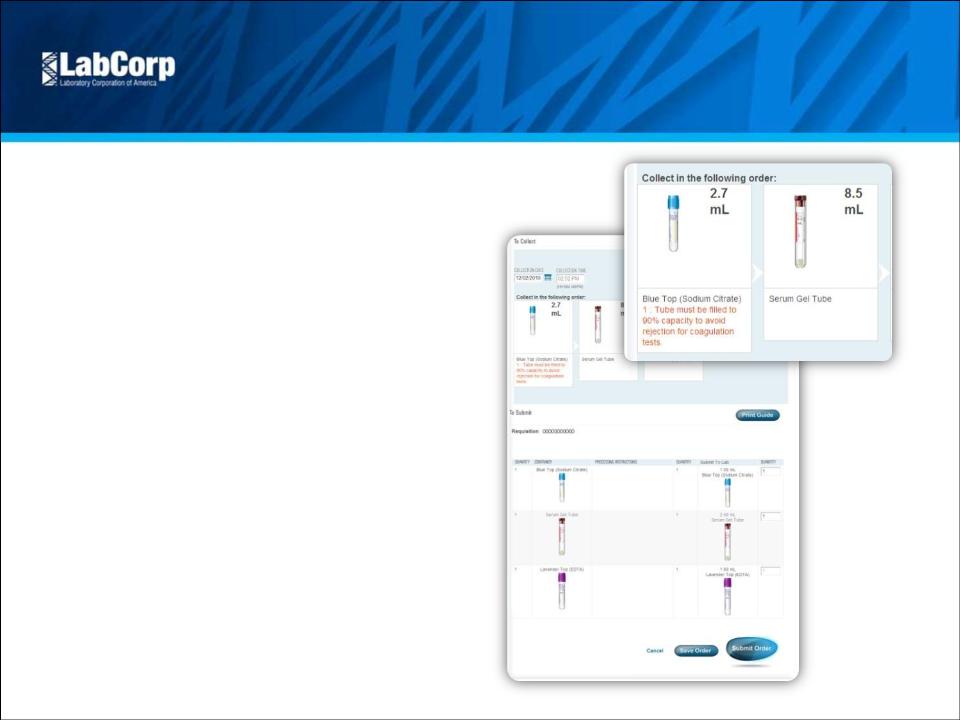
Intuitive Order Entry
•Streamlined Ordering
Provider, Diagnosis, Test and
Collection information are all displayed
in a single screen
Provider, Diagnosis, Test and
Collection information are all displayed
in a single screen
•Requisition and Account Logic
Automatically generates requisitions
with appropriate account numbers
Automatically generates requisitions
with appropriate account numbers
•Key Time-saving Features
• Send to PSC
• Standing orders
• Electronic add-on testing
• User-defined pick lists
21
Unified Results
•Centralizes Lab Connectivity
View lab reports from DIANON
Systems, Esoterix, LabCorp,
Litholink, US Labs, and CMBP
View lab reports from DIANON
Systems, Esoterix, LabCorp,
Litholink, US Labs, and CMBP
•Share Results
Email, fax, print and annotations
make it easy to share critical
information
Email, fax, print and annotations
make it easy to share critical
information
•Visual Cues
Supports physician decision making,
enhances the timeliness of patient
care and facilitates follow-up with
abnormal results in red and unread
reports in bold
Supports physician decision making,
enhances the timeliness of patient
care and facilitates follow-up with
abnormal results in red and unread
reports in bold
Five Pillar Strategy—Pillar Two
LabCorp Beacon™ | Physician
Experience
Experience
22
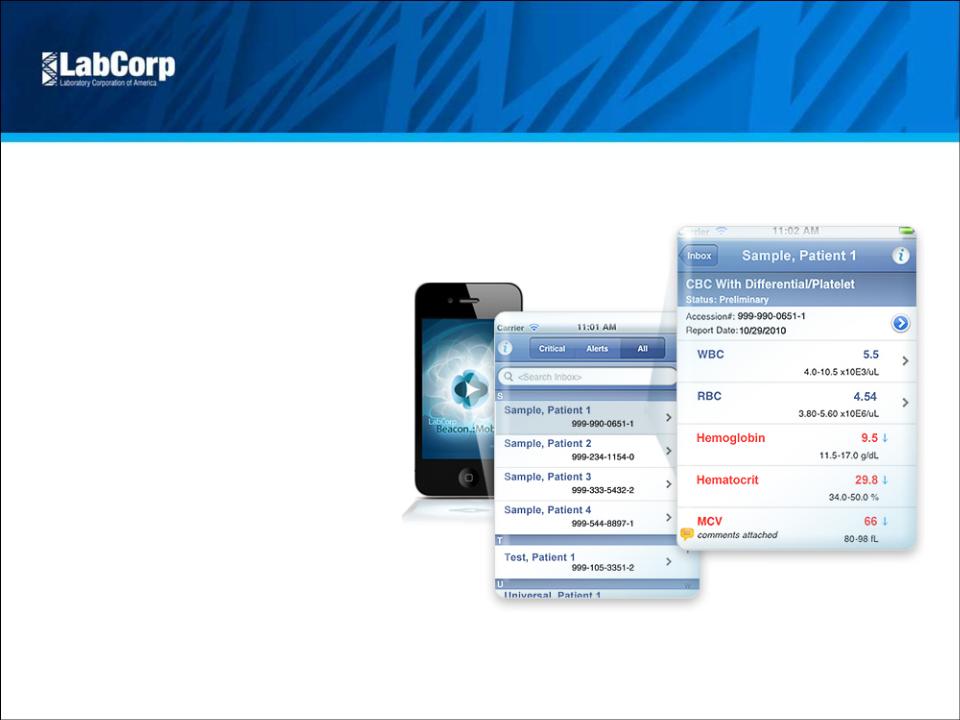
Results on the Go
•Clear, Concise Reports
Physicians and staff can quickly
access results via iPhone® or
iPad™ including alerts for abnormal
or critical lab results
Physicians and staff can quickly
access results via iPhone® or
iPad™ including alerts for abnormal
or critical lab results
•Connect to Patients
Access patient demographics
directly from results for phone or
email follow up
Access patient demographics
directly from results for phone or
email follow up
Five Pillar Strategy—Pillar Two
LabCorp Beacon™ | Physician
Experience
Experience
23
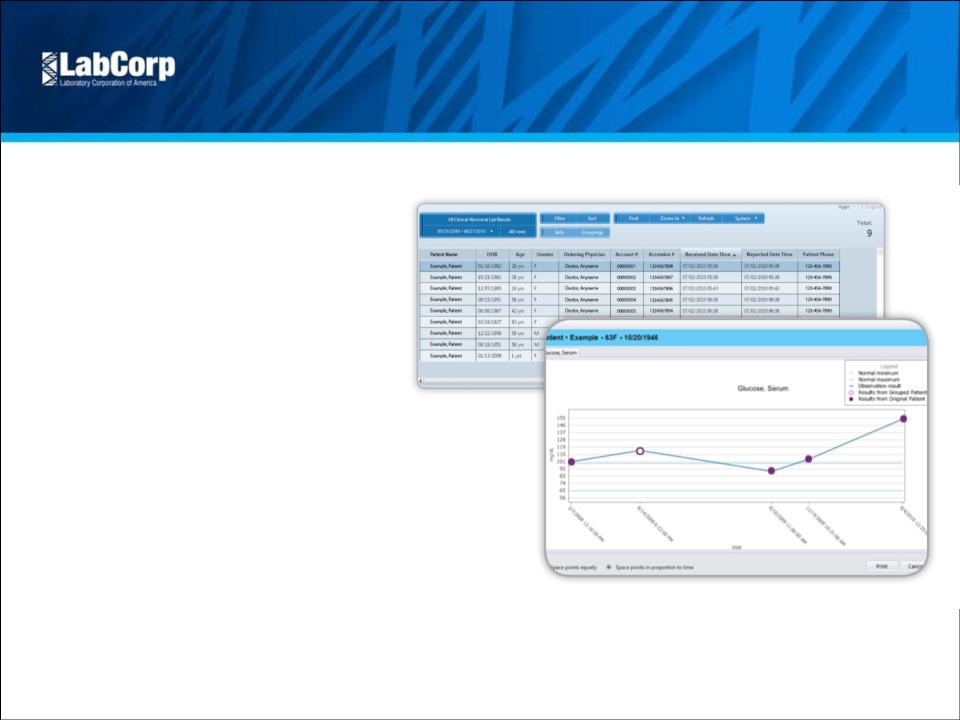
Trends & Analytics
•One-Click Trending
Physicians and staff can quickly view
a single test or analyte for one
patient and the trended history for
that patient
Physicians and staff can quickly view
a single test or analyte for one
patient and the trended history for
that patient
•Sort and Filter Results
Providers can filter their entire
patient population on
demographics and test results to
identify trends and patients at risk
Providers can filter their entire
patient population on
demographics and test results to
identify trends and patients at risk
•View Lab History
Five Pillar Strategy—Pillar Two
LabCorp Beacon™ | Physician
Experience
Experience
24
AccuDraw Integration
•Reduce Errors
•Reduce Training Time
•Proven Results
Success in LabCorp Patient Service
Centers will be extended to
customers
Success in LabCorp Patient Service
Centers will be extended to
customers
Online Appointment
Scheduling
•Patient Convenience
•Improved Service Experience
•2011 Enhancements Will Improve
Collections at the Time of
Scheduling
Collections at the Time of
Scheduling
Five Pillar Strategy—Pillar Two
LabCorp Beacon™ | Patient Experience

25
Five Pillar Strategy
Pillar Three
Continue to Improve
Efficiency to Offer the
Most Compelling Value
in Laboratory Services
Efficiency to Offer the
Most Compelling Value
in Laboratory Services
26
• Standardized lab and billing IT systems
• Automation of pre-analytics
• Supply chain optimization
•��Sysmex fully automated hematology
operations
• Consistent gross margin improvement
(net of acquisitions)
• Full year bad debt reduction of
50bp in 2010 and an additional
50bp in 2010 and an additional
reduction of 25bp in Q3 of 2011
Five Pillar Strategy—Pillar Three
Most Efficient Provider

27
Five Pillar Strategy
Pillar Four
Scientific Innovation At
Appropriate Pricing
Appropriate Pricing

28
Partner | Clinical Area |
ARCA biopharma | Companion Diagnostics (Cardiovascular Disease) |
BG Medicine | Cardiovascular Disease |
Duke University | Joint Venture in biomarker development |
Duke University | Lung Cancer |
Exact Sciences | Colon Cancer |
Intema Ltd. | Prenatal Testing |
Johns Hopkins | Melanoma |
MDxHealth | Companion Diagnostics (Oncology) |
Medco Health Solutions | Companion Diagnostics (Research) |
Merck | Companion Diagnostics (Infectious Disease) |
University of Minnesota | Lupus |
Veridex | Prostate Cancer |
Yale University | Ovarian Cancer (exclusive) |
Five Pillar Strategy—Pillar Four
Scientific Innovation
• Introduction of new tests
• Acquisitions and licensing
• Collaborations with leading
companies and academic
institutions

“K-RAS testing should be routinely conducted in
all colorectal cancer patients immediately after
diagnosis to ensure the best treatment strategies
for the individual Patient”
all colorectal cancer patients immediately after
diagnosis to ensure the best treatment strategies
for the individual Patient”
- Dr. Eric Van Cutsem, presenter at the June 2008 American
Society of Clinical Oncology meeting
FDA recommends genetic screening prior to
treatment with Abacavir
treatment with Abacavir
ROCKVILLE, Md -- July 24, 2008 -- The US Food and Drug Administration (FDA) has
issued an alert regarding serious, and sometimes fatal, hypersensitivity reactions (HSRs)
caused by abacavir (Ziagen) therapy in patients with a particular human leukocyte antigen
(HLA) allele, HLA-B* 5701.
issued an alert regarding serious, and sometimes fatal, hypersensitivity reactions (HSRs)
caused by abacavir (Ziagen) therapy in patients with a particular human leukocyte antigen
(HLA) allele, HLA-B* 5701.
Genetic tests for HLA-B*5701 are already available, and all patients should be screened for
the HLA-B*5701 allele before starting or restarting treatment with abacavir or abacavir-
containing medications.
the HLA-B*5701 allele before starting or restarting treatment with abacavir or abacavir-
containing medications.
“FDA has approved the expanded use of
Selzentry… to include adult patients with CCR5-
tropic HIV-1 virus who are starting treatment for
the first time.”
Selzentry… to include adult patients with CCR5-
tropic HIV-1 virus who are starting treatment for
the first time.”
- ViiV Healthcare Press Release, November 20th, 2009
29
Five Pillar Strategy—Pillar Four
Scientific Innovation
• Recent offerings in companion
diagnostics and personalized medicine
• IL-28B
• K-RAS
• HLA-B* 5701
• BRAF Gene Mutation Detection
• EGFR Mutation Analysis
• CYP 450 2C19
• Trofile® (CCR5 Tropism)
• PhenoSense®, PhenoSense GT®
• HERmark®
• Outcome Improvement Programs
• CKD program
• Litholink kidney stone program
• Clearstone acquisition
• Global clinical trials capability
• Presence in China

30
Five Pillar Strategy
Pillar Five
Alternative Delivery
Models
Models
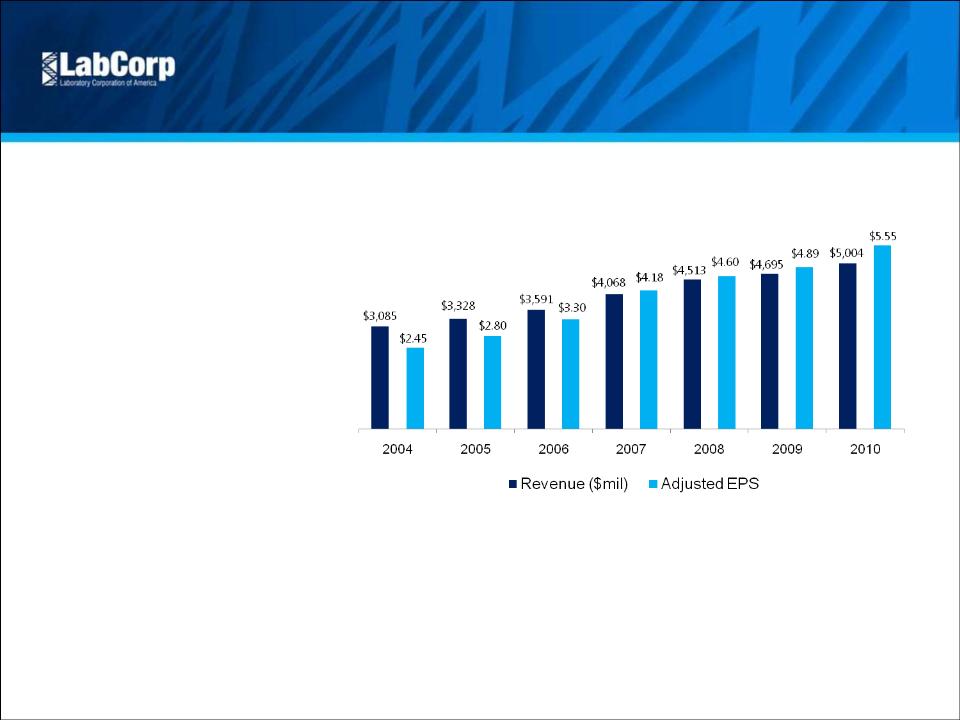
Revenue and
EPS Growth
• 6-year revenue CAGR of
approximately 8.4%
• 6-year Adjusted EPS CAGR
of approximately 14.6%
Revenue and Adjusted EPS Growth: 2004 - 2010 (1) (2)
(1) Excluding the $0.09 per diluted share impact in 2005 of restructuring and other special charges, and a
non-recurring investment loss; excluding the $0.06 per diluted share impact in 2006 of restructuring
and other special charges; excluding the $0.25 per diluted share impact in 2007 of restructuring and
other special charges; excluding the $0.44 per diluted share impact in 2008 of restructuring and other
special charges; excluding the ($0.09) per diluted share impact in 2009 of restructuring and other
special charges; excluding the ($0.17) per diluted share impact in 2010 of restructuring and other
special charges.
(2) EPS, as presented represents adjusted, non-GAAP financial measures. Diluted EPS, as reported in
the Company’s Annual Report were: $2.45 in 2004; $2.71 in 2005; $3.24 in 2006; $3.93 in 2007; $4.26
in 2008; $4.98 in 2009; and $5.29 in 2010
the Company’s Annual Report were: $2.45 in 2004; $2.71 in 2005; $3.24 in 2006; $3.93 in 2007; $4.26
in 2008; $4.98 in 2009; and $5.29 in 2010
31
Excellent Performance

32
Our Results
• Profitable revenue growth
• United contract extended
through the end of 2018
• Esoteric growth
• Acquisitions
• Improved IT and client connectivity
• Beacon order entry rollout
• Completed the Patient Portal
• Enhanced experience
for physicians and patients
• Continued scientific leadership
• Clearstone acquisition
• IL-28B
• New offerings in Women’s Health
and companion diagnostics
• Maintained price
• Managed care stability
• Strong results
Recent Accomplishments

Note: During both the first quarter of 2010 and the first quarter of 2011, inclement weather reduced Adjusted EPS Excluding Amortization by
approximately eight cents
33
Third Quarter and YTD
2011 Results
Three Months Ended Sep 30, | Nine Months Ended Sep 30, | ||||||||||||||
2011 | 2010 | +/(-) | 2011 | 2010 | +/(-) | ||||||||||
Revenue | $ 1,404.5 | $ 1,276.5 | 10.0% | $ 4,176.2 | $ 3,708.5 | 12.6% | |||||||||
Adjusted Operating Income (1) | $ 263.5 | $ 250.1 | 5.4% | $ 806.8 | $ 764.1 | 5.6% | |||||||||
Adjusted Operating Income Margin (1) | 18.8% | 19.6% | -80 | bp | 19.3% | 20.6% | -130 | bp | |||||||
Adjusted EPS Excluding Amortization (1) | $ 1.61 | $ 1.58 | 1.9% | $ 4.80 | $ 4.54 | 5.7% | |||||||||
Operating Cash Flow (2) | $ 176.8 | $ 176.2 | 0.3% | $ 577.0 | $ 624.4 | -7.6% | |||||||||
Less: Capital Expenditures | $ (40.4) | $ (34.3) | 17.8% | $ (115.6) | $ (93.3) | 23.9% | |||||||||
Free Cash Flow | $ 136.4 | $ 141.9 | -3.9% | $ 461.4 | $ 531.1 | -13.1% | |||||||||
(1) See Reconciliation of non-GAAP Financial Measures (included herein) | |||||||||||||||
(2) Operating Cash Flow was reduced by $49.5 million as a result of the Hunter Labs settlement | |||||||||||||||
Operating Cash Flow | $ 176.8 | $ 577.0 | |||||||||||||
Hunter Labs settlement | $ 49.5 | $ 49.5 | |||||||||||||
Adjusted Operating Cash Flow | $ 226.3 | $ 626.5 | |||||||||||||

Key Points
• Critical position in health care delivery
system
system
• Attractive market
• Consistent strategy
• Excellent cash flow deployed to enhance
strong competitive position
strong competitive position
• IT innovation to improve physician and
patient experience
patient experience
• Most efficient provider delivering greatest
value
value
• Scientific leadership
• Alternative delivery models
• Track record of execution and success
Conclusion
34

35
Reconciliation of non-GAAP
Financial Measures
Reconciliation of non-GAAP Financial Measures | |||||
(In millions, except per share data) | |||||
Three Months Ended Sep 30, | |||||
Adjusted Operating Income | 2011 | 2010 | |||
Operating income | $ 239.4 | $ 235.3 | |||
Restructuring and other special charges (1) (2) | 24.1 | 14.8 | |||
Adjusted operating income | $ 263.5 | $ 250.1 | |||
Adjusted EPS Excluding Amortization | |||||
Diluted earnings per common share | $ 1.31 | $ 1.34 | |||
Impact of restructuring and other special charges (1) (2) | 0.17 | 0.13 | |||
Amortization expense | 0.13 | 0.11 | |||
Adjusted EPS Excluding Amortization (3) | $ 1.61 | $ 1.58 | |||
1) During the third quarter of 2011, the Company recorded net restructuring and other special charges of $24.1 million, consisting of $7.9 million in severance related liabilities and $16.2 million in net facility-related costs primarily associated with ongoing integration of the Clearstone, Genzyme Genetics and Westcliff acquisitions. The after tax impact of these charges decreased net earnings for the three months ended September 30, 2011, by $16.9 million and diluted earnings per share by $0.17 ($16.9 million divided by 102.2 million shares). |
During the first two quarters of 2011, the Company recorded restructuring and other special charges of $81.8 million. The restructuring charges included $10.9 million in net severance and other personnel costs along with $20.5 million in net facility-related costs primarily associated with the ongoing integration of the Genzyme Genetics and Westcliff acquisitions. The special charges also include $34.5 million ($49.5 million, net of previously recorded reserves of $15.0 million) relating to the settlement of the Hunter Labs litigation in California, along with $1.1 million for legal costs associated with the planned acquisition of Orchid Cellmark incurred during the second quarter of 2011, both of which were recorded in Selling, General and Administrative Expenses in the Company’s Statement of Operations. The charges also included a $14.8 million write-off of an investment made in a prior year. |
For the nine months ended September 30, 2011, the after tax impact of these combined charges decreased net earnings by $66.3 million and diluted earnings per share by $0.65 ($66.3 million divided by 102.3 million shares). |
2) During the third quarter of 2010, the Company recorded restructuring and other special charges of $21.8 million, consisting of $10.9 million in professional fees and expenses associated with acquisitions; $7.0 million in bridge financing fees associated with the signing of an asset purchase agreement for Genzyme Genetics; and $3.9 million in severance related liabilities associated with workforce reduction initiatives. The after tax impact of these charges decreased net earnings for the three months ended September 30, 2010, by $13.4 million and diluted earnings per share by $0.13 ($13.4 million divided by 104.1 million shares). |
During the first quarter of 2010, the Company recorded net charges of $9.3 million relating to severance payments and the closing of redundant and underutilized facilities as well as the write-off of development costs incurred on systems abandoned during the quarter. |
For the nine months ended September 30, 2010, the after tax impact of these combined charges decreased net earnings by $19.1 million and diluted earnings per share by $0.18 ($19.1 million divided by 105.4 million shares). |
3) The Company continues to grow its business through acquisitions and uses Adjusted EPS Excluding Amortization as a measure of operational performance, growth and shareholder returns. The Company believes adjusting EPS for amortization will provide investors with better insight into the operating performance of the business. For the quarters ended September 30, 2011 and 2010, intangible amortization was $21.2 million and $18.0 million, respectively ($13.0 million and $11.0 million net of tax, respectively) and decreased EPS by $0.13 ($13.0 million divided by 102.2 million shares) and $0.11 ($11.0 million divided by 104.1 million shares), respectively. For the nine months ended September 30, 2011 and 2010, intangible amortization was $64.6 million and $53.1 million respectively ($39.5 million and $32.5 million net of tax, respectively) and decreased EPS by $0.39 ($39.5 million divided by 102.3 million shares) and $0.31 ($32.5 million divided by 105.4 million shares), respectively. |

36
Reconciliation of non-GAAP
Financial Measures
Reconciliation of non-GAAP Financial Measures | |||||
(In millions, except per share data) | |||||
Nine Months Ended Sep 30, | |||||
Adjusted Operating Income | 2011 | 2010 | |||
Operating income | $ 700.9 | $ 740.0 | |||
Restructuring and other special charges (1) (2) | 105.9 | 24.1 | |||
Adjusted operating income | $ 806.8 | $ 764.1 | |||
Adjusted EPS Excluding Amortization | |||||
Diluted earnings per common share | $ 3.76 | $ 4.05 | |||
Impact of restructuring and other special charges (1) (2) | 0.65 | 0.18 | |||
Amortization expense | 0.39 | 0.31 | |||
Adjusted EPS Excluding Amortization (3) | $ 4.80 | $ 4.54 | |||
1) During the third quarter of 2011, the Company recorded net restructuring and other special charges of $24.1 million, consisting of $7.9 million in severance related liabilities and $16.2 million in net facility-related costs primarily associated with ongoing integration of the Clearstone, Genzyme Genetics and Westcliff acquisitions. The after tax impact of these charges decreased net earnings for the three months ended September 30, 2011, by $16.9 million and diluted earnings per share by $0.17 ($16.9 million divided by 102.2 million shares). |
During the first two quarters of 2011, the Company recorded restructuring and other special charges of $81.8 million. The restructuring charges included $10.9 million in net severance and other personnel costs along with $20.5 million in net facility-related costs primarily associated with the ongoing integration of the Genzyme Genetics and Westcliff acquisitions. The special charges also include $34.5 million ($49.5 million, net of previously recorded reserves of $15.0 million) relating to the settlement of the Hunter Labs litigation in California, along with $1.1 million for legal costs associated with the planned acquisition of Orchid Cellmark incurred during the second quarter of 2011, both of which were recorded in Selling, General and Administrative Expenses in the Company’s Statement of Operations. The charges also included a $14.8 million write-off of an investment made in a prior year. |
For the nine months ended September 30, 2011, the after tax impact of these combined charges decreased net earnings by $66.3 million and diluted earnings per share by $0.65 ($66.3 million divided by 102.3 million shares). |
2) During the third quarter of 2010, the Company recorded restructuring and other special charges of $21.8 million, consisting of $10.9 million in professional fees and expenses associated with acquisitions; $7.0 million in bridge financing fees associated with the signing of an asset purchase agreement for Genzyme Genetics; and $3.9 million in severance related liabilities associated with workforce reduction initiatives. The after tax impact of these charges decreased net earnings for the three months ended September 30, 2010, by $13.4 million and diluted earnings per share by $0.13 ($13.4 million divided by 104.1 million shares). |
During the first quarter of 2010, the Company recorded net charges of $9.3 million relating to severance payments and the closing of redundant and underutilized facilities as well as the write-off of development costs incurred on systems abandoned during the quarter. |
For the nine months ended September 30, 2010, the after tax impact of these combined charges decreased net earnings by $19.1 million and diluted earnings per share by $0.18 ($19.1 million divided by 105.4 million shares). |
3) The Company continues to grow its business through acquisitions and uses Adjusted EPS Excluding Amortization as a measure of operational performance, growth and shareholder returns. The Company believes adjusting EPS for amortization will provide investors with better insight into the operating performance of the business. For the quarters ended September 30, 2011 and 2010, intangible amortization was $21.2 million and $18.0 million, respectively ($13.0 million and $11.0 million net of tax, respectively) and decreased EPS by $0.13 ($13.0 million divided by 102.2 million shares) and $0.11 ($11.0 million divided by 104.1 million shares), respectively. For the nine months ended September 30, 2011 and 2010, intangible amortization was $64.6 million and $53.1 million respectively ($39.5 million and $32.5 million net of tax, respectively) and decreased EPS by $0.39 ($39.5 million divided by 102.3 million shares) and $0.31 ($32.5 million divided by 105.4 million shares), respectively. |

37
Supplemental Financial Information
Laboratory Corporation of America | ||||||||||||||||||||||
Other Financial Information | ||||||||||||||||||||||
FY 2009, FY 2010 and Q1-Q3 2011 | ||||||||||||||||||||||
Q1 09 | Q2 09 | Q3 09 | Q4 09 | Q1 10 | Q2 10 | Q3 10 | Q4 10 | Q1 11 | Q2 11 | Q3 11 | ||||||||||||
Bad debt as a percentage of sales | 5.3% | 5.3% | 5.3% | 5.3% | 5.0% | 4.8% | 4.8% | 4.7% | 4.7% | 4.7% | 4.5% | |||||||||||
Days sales outstanding | 52 | 50 | 48 | 44 | 46 | 45 | 44 | 46 | 47 | 46 | 46 | |||||||||||
A/R coverage (Allow. for Doubtful Accts. / A/R) | 19.5% | 20.6% | 21.9% | 23.2% | 21.7% | 20.7% | 20.4% | 18.5% | 19.4% | 20.6% | 21.1% | |||||||||||

©2011 LabCorp. All rights reserved. 8026-0411