Exhibit 99.3
|

Strictly private and confidential – Subject to Confidentiality Agreement Subject to FRE 408 Project Chelsea Cenveo Business Plan (“CVOBP”) January 2018p
 |
Strictly private and confidential – Subject to Confidentiality Agreement Subject to FRE 408 Disclaimer In addition to results presented in accordance with accounting principles generally accepted in the U.S. (“GAAP”), we use certainnon-GAAP financial measures, including Adjusted EBITDA,non-GAAP income (loss) from continuing operations,non-GAAP operating income,non-GAAP operating income margin, and adjusted free cash flow.Non-GAAP operating income is defined as operating income excluding integration, acquisition and other charges, stock-based compensation provision, and restructuring and other charges.Non-GAAP operating income margin is calculated by dividingnon-GAAP operating income into net sales.Non-GAAP income (loss) from continuing operations excludes integration, acquisition and other charges, stock-based compensation provision, impairment of intangible assets, restructuring and other charges, (gain) loss on early extinguishment of debt, net, and an adjustment to income taxes to reflect an estimated cash tax rate. Adjusted EBITDA is defined as earnings before interest, taxes, depreciation, amortization, integration, acquisition and other charges, stock-based compensation provision, restructuring and other charges, impairment of intangible assets, gain on bargain purchase, (gain) loss on early extinguishment of debt, net, and (loss) income from discontinued operations, net of taxes. Adjusted free cash flow is defined as Adjusted EBITDA less cash interest, cash taxes, and capital expenditures, net of proceeds from the sale of plant, property and equipment. These arenon-GAAP financial measures, as defined herein, and should be read in conjunction with GAAP financial measures. A reconciliation of income (loss) from continuing operations tonon-GAAP income (loss) from continuing operations, operating income tonon-GAAP operating income, and net income (loss) to Adjusted EBITDA is included as a part hereof. Thesenon-GAAP financial measures are not presented as an alternative to cash flows from continuing operations, as a measure of our liquidity or as an alternative to reported net loss as an indicator of our operating performance. Thenon-GAAP financial measures as used herein may not be comparable to similarly titled measures reported by competitors. We believe the use of Adjusted EBITDA,non-GAAP income (loss) from continuing operations,non-GAAP operating income,non-GAAP operating income margin and adjusted free cash flow along with GAAP financial measures enhances the understanding of our operating results and may be useful to investors in comparing our operating performance with that of our competitors and estimating our enterprise value. Adjusted EBITDA is also a useful tool in evaluating the core operating results of the Company given the significant variation that can result from, for example, the timing of capital expenditures, the amount of intangible assets recorded or the differences in assets’ lives. We also use Adjusted EBITDA internally to evaluate the operating performance of our segments, to allocate resources and capital to such segments, to measure performance for incentive compensation programs, and to evaluate future growth opportunities. Thenon-GAAP financial measures included in this presentation are reconciled to their most directly comparable GAAP financial measures in the tables included as part hereof. Statements made in this presentation, other than those concerning historical financial information, may be considered “forward-looking statements,” examples of which include statements relating to our 2017 outlook and future financial condition and operating results, as well as any other statement that does not directly relate to any historical or current fact. These forward-looking statements are based upon current expectations and involve a number of assumptions, risks and uncertainties that could cause actual results to differ materially from such forward-looking statements. In view of such uncertainties, investors should not place undue reliance on our forward-looking statements. Such statements speak only as of the date of this presentation, and we undertake no obligation to publicly update or revise any forward-looking statements, whether as a result of new information, future events or otherwise. Factors which could cause actual results to differ materially from management’s expectations include, without limitation: (i) our substantial level of indebtedness could materially adversely affect our financial condition, liquidity and ability to service or refinance our debt, and prevent us from fulfilling our business obligations; (ii) our ability to pay the principal of, or to reduce or refinance, our outstanding indebtedness; (iii) the terms of our indebtedness imposing significant restrictions on our operating and financial flexibility; (iv) additional borrowings available to us could further exacerbate our risk exposure from debt; (v) United States and global economic conditions have adversely affected us and could continue to adversely affect us; (vi) our ability to successfully integrate acquired businesses with our business; (vii) a decline in our consolidated profitability or profitability within one of our individual reporting units could result in the impairment of our assets, including goodwill and other long-lived assets; (viii) the industries in which we operate our business are highly competitive and extremely fragmented; (ix) a general absence of long-term customer agreements in our industry, subjecting our business to quarterly and cyclical fluctuations; (x) factors affecting the United States postal services impacting demand for our products; (xi) the availability of the Internet and other electronic media adversely affecting our business; (xii) increases in paper costs and decreases in the availability of raw materials; (xiii) increases in energy and transportation costs; (xiv) our labor relations; (xv) our compliance with environmental laws; (xvi) our dependence on key management personnel; (xvii) any failure, interruption or security lapse of our information technology systems; and (xviii) the unassured effectiveness of our 2017 Profitability Improvement Plan. This list of factors is not exhaustive, and new factors may emerge or changes to the foregoing factors may occur that would impact our business. Additional information regarding these and other factors can be found in Cenveo, Inc.’s periodic filings with the SEC, which are available at www.cenveo.com. 2p
 |
Strictly private and confidential – Subject to Confidentiality Agreement Subject to FRE 408 Contents Sections 1 Executive summary 4 2 Cenveo Business Plan (“CVOBP”) 6 3 Cost Savings Initiatives 14 4 Appendix 17p
 |
Strictly private and confidential – Subject to Confidentiality Agreement Subject to FRE 408 1 Executive Summaryp
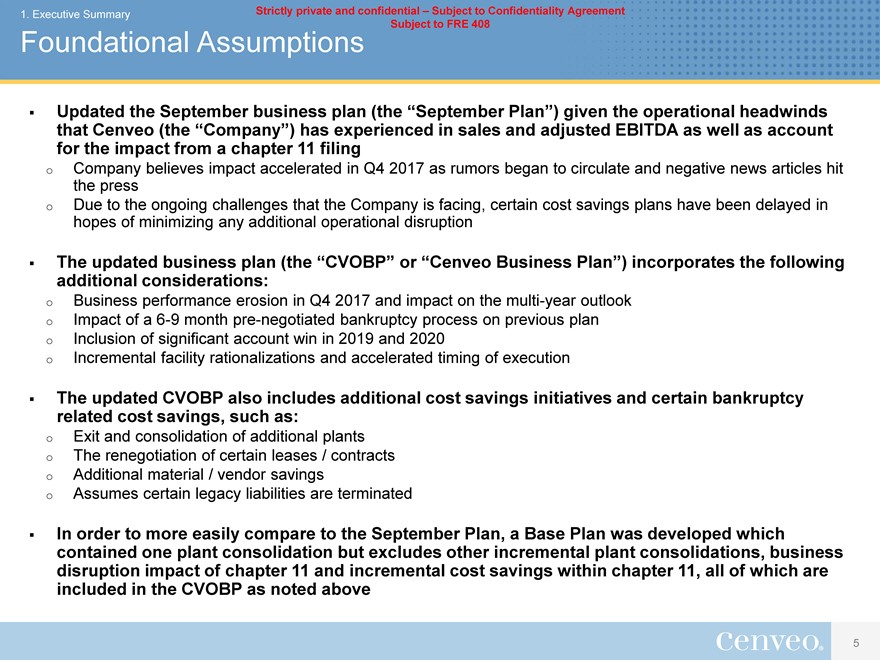 |
1. Executive Summary Strictly private and confidential – Subject to Confidentiality Agreement Subject to FRE 408 Foundational Assumptions Updated the September business plan (the “September Plan”) given the operational headwinds that Cenveo (the “Company”) has experienced in sales and adjusted EBITDA as well as account for the impact from a chapter 11 filing o Company believes impact accelerated in Q4 2017 as rumors began to circulate and negative news articles hit the press o Due to the ongoing challenges that the Company is facing, certain cost savings plans have been delayed in hopes of minimizing any additional operational disruption The updated business plan (the “CVOBP” or “Cenveo Business Plan”) incorporates the following additional considerations: o Business performance erosion in Q4 2017 and impact on the multi-year outlook o Impact of a6-9 monthpre-negotiated bankruptcy process on previous plan o Inclusion of significant account win in 2019 and 2020 o Incremental facility rationalizations and accelerated timing of execution The updated CVOBP also includes additional cost savings initiatives and certain bankruptcy related cost savings, such as: o Exit and consolidation of additional plants o The renegotiation of certain leases / contracts o Additional material / vendor savings o Assumes certain legacy liabilities are terminated In order to more easily compare to the September Plan, a Base Plan was developed which contained one plant consolidation but excludes other incremental plant consolidations, business disruption impact of chapter 11 and incremental cost savings within chapter 11, all of which are included in the CVOBP as noted above 5p
 |
Strictly private and confidential – Subject to Confidentiality Agreement Subject to FRE 408 2 CVOBP
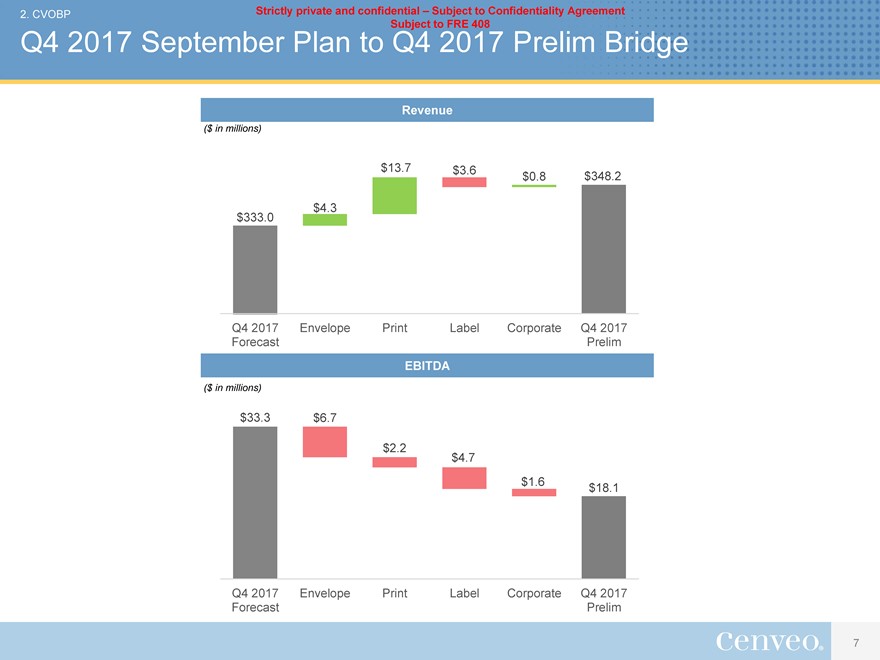 |
2. CVOBP Strictly private and confidential – Subject to Confidentiality Agreement Subject to FRE 408 Q4 2017 September Plan to Q4 2017 Prelim Bridge Revenue ($ in millions) $13.7 $3.6 $0.8 $348.2 $4.3 $333.0 Q4 2017 Envelope Print Label Corporate Q4 2017 Forecast Prelim EBITDA ($ in millions) $33.3 $6.7 $2.2 $4.7 $1.6 $18.1 Q4 2017 Envelope Print Label Corporate Q4 2017 Forecast Prelim 7
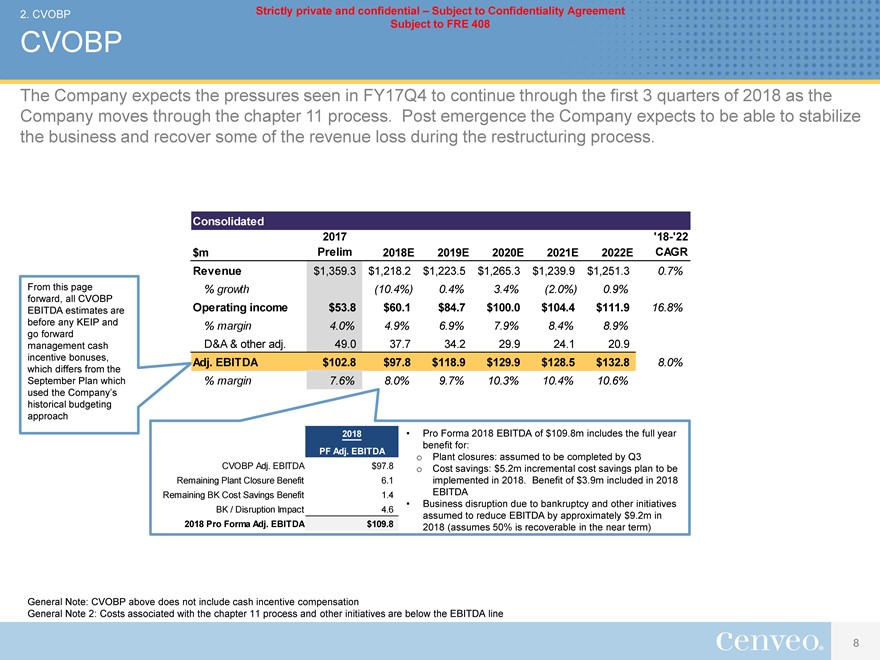 |
2. CVOBP Strictly private and confidential – Subject to Confidentiality Agreement Subject to FRE 408 CVOBP The Company expects the pressures seen in FY17Q4 to continue through the first 3 quarters of 2018 as the Company moves through the chapter 11 process. Post emergence the Company expects to be able to stabilize the business and recover some of the revenue loss during the restructuring process. Consolidated 2017‘18-‘22 $m Prelim 2018E 2019E 2020E 2021E 2022E CAGR Revenue $1,359.3 $1,218.2 $1,223.5 $1,265.3 $1,239.9 $1,251.3 0.7% From this page % growth (10.4%) 0.4% 3.4% (2.0%) 0.9% forward, all CVOBP EBITDA estimates are Operating income $53.8 $60.1 $84.7 $100.0 $104.4 $111.9 16.8% before any KEIP and % margin 4.0% 4.9% 6.9% 7.9% 8.4% 8.9% go forward management cash D&A & other adj. 49.0 37.7 34.2 29.9 24.1 20.9 incentive bonuses, Adj. EBITDA $102.8 $97.8 $118.9 $129.9 $128.5 $132.8 8.0% which differs from the September Plan which % margin 7.6% 8.0% 9.7% 10.3% 10.4% 10.6% used the Company’s historical budgeting approach 2018 • Pro Forma 2018 EBITDA of $109.8m includes the full year benefit for: PF Adj. EBITDA o Plant closures: assumed to be completed by Q3 CVOBP Adj. EBITDA $97.8 o Cost savings: $5.2m incremental cost savings plan to be Remaining Plant Closure Benefit 6.1 implemented in 2018. Benefit of $3.9m included in 2018 Remaining BK Cost Savings Benefit 1.4 EBITDA BK / Disruption Impact 4.6 • Business disruption due to bankruptcy and other initiatives assumed to reduce EBITDA by approximately $9.2m in 2018 Pro Forma Adj. EBITDA $109.8 2018 (assumes 50% is recoverable in the near term) General Note: CVOBP above does not include cash incentive compensation General Note 2: Costs associated with the chapter 11 process and other initiatives are below the EBITDA line 8
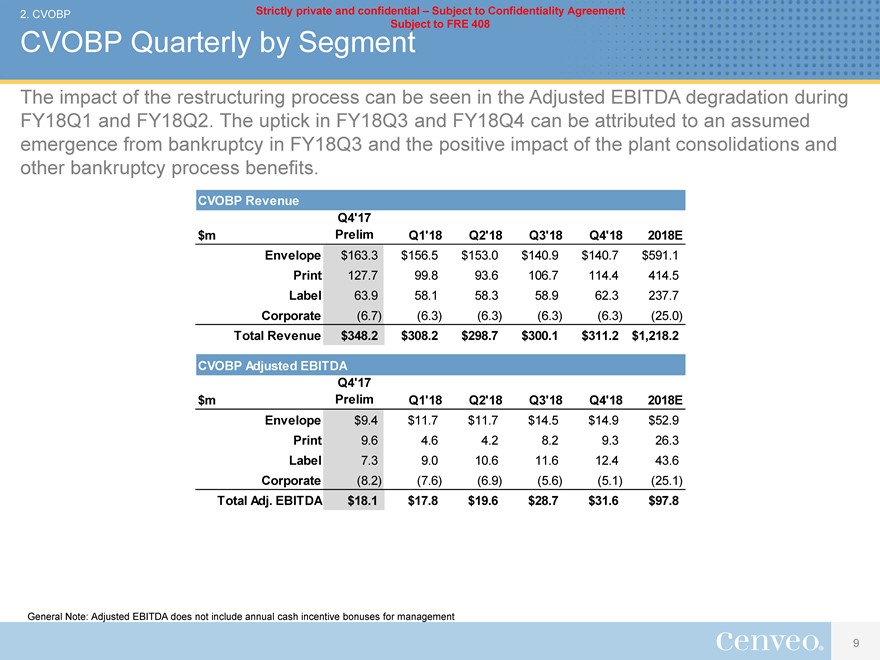 |
2. CVOBP Strictly private and confidential – Subject to Confidentiality Agreement Subject to FRE 408 CVOBP Quarterly by Segment The impact of the restructuring process can be seen in the Adjusted EBITDA degradation during FY18Q1 and FY18Q2. The uptick in FY18Q3 and FY18Q4 can be attributed to an assumed emergence from bankruptcy in FY18Q3 and the positive impact of the plant consolidations and other bankruptcy process benefits. CVOBP Revenue Q4’17 $m Prelim Q1’18 Q2’18 Q3’18 Q4’18 2018E Envelope $163.3 $156.5 $153.0 $140.9 $140.7 $591.1 Print 127.7 99.8 93.6 106.7 114.4 414.5 Label 63.9 58.1 58.3 58.9 62.3 237.7 Corporate (6.7) (6.3) (6.3) (6.3) (6.3) (25.0) Total Revenue $348.2 $308.2 $298.7 $300.1 $311.2 $1,218.2 CVOBP Adjusted EBITDA Q4’17 $m Prelim Q1’18 Q2’18 Q3’18 Q4’18 2018E Envelope $9.4 $11.7 $11.7 $14.5 $14.9 $52.9 Print 9.6 4.6 4.2 8.2 9.3 26.3 Label 7.3 9.0 10.6 11.6 12.4 43.6 Corporate (8.2) (7.6) (6.9) (5.6) (5.1) (25.1) Total Adj. EBITDA $18.1 $17.8 $19.6 $28.7 $31.6 $97.8 General Note: Adjusted EBITDA does not include annual cash incentive bonuses for management 9
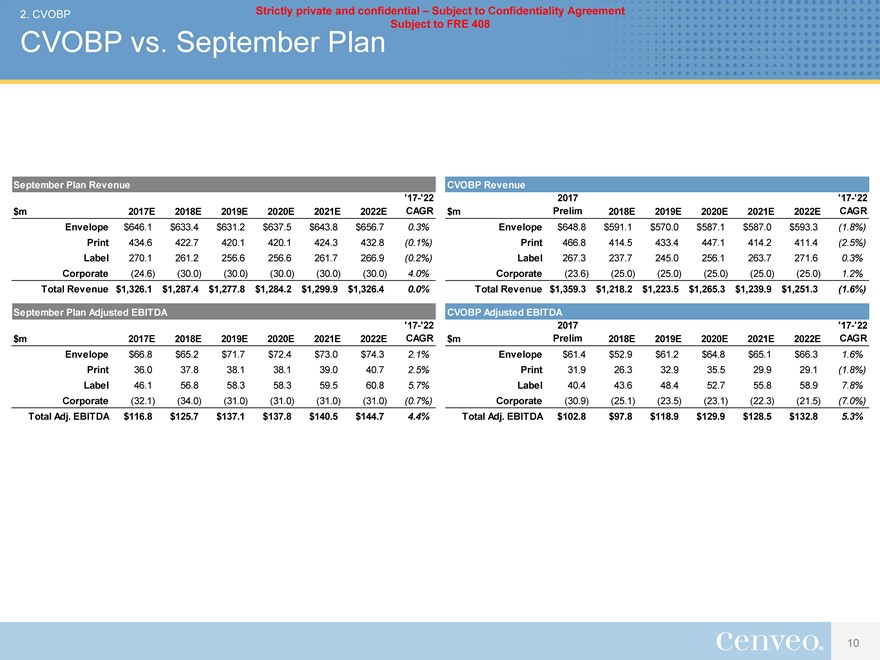 |
2. CVOBP Strictly private and confidential – Subject to Confidentiality Agreement Subject to FRE 408 CVOBP vs. September Plan September Plan Revenue CVOBP Revenue’17-‘22 2017‘17-‘22 $m 2017E 2018E 2019E 2020E 2021E 2022E CAGR $m Prelim 2018E 2019E 2020E 2021E 2022E CAGR Envelope $646.1 $633.4 $631.2 $637.5 $643.8 $656.7 0.3% Envelope $648.8 $591.1 $570.0 $587.1 $587.0 $593.3 (1.8%) Print 434.6 422.7 420.1 420.1 424.3 432.8 (0.1%) Print 466.8 414.5 433.4 447.1 414.2 411.4 (2.5%) Label 270.1 261.2 256.6 256.6 261.7 266.9 (0.2%) Label 267.3 237.7 245.0 256.1 263.7 271.6 0.3% Corporate (24.6) (30.0) (30.0) (30.0) (30.0) (30.0) 4.0% Corporate (23.6) (25.0) (25.0) (25.0) (25.0) (25.0) 1.2% Total Revenue $1,326.1 $1,287.4 $1,277.8 $1,284.2 $1,299.9 $1,326.4 0.0% Total Revenue $1,359.3 $1,218.2 $1,223.5 $1,265.3 $1,239.9 $1,251.3 (1.6%) September Plan Adjusted EBITDA CVOBP Adjusted EBITDA’17-‘22 2017‘17-‘22 $m 2017E 2018E 2019E 2020E 2021E 2022E CAGR $m Prelim 2018E 2019E 2020E 2021E 2022E CAGR Envelope $66.8 $65.2 $71.7 $72.4 $73.0 $74.3 2.1% Envelope $61.4 $52.9 $61.2 $64.8 $65.1 $66.3 1.6% Print 36.0 37.8 38.1 38.1 39.0 40.7 2.5% Print 31.9 26.3 32.9 35.5 29.9 29.1 (1.8%) Label 46.1 56.8 58.3 58.3 59.5 60.8 5.7% Label 40.4 43.6 48.4 52.7 55.8 58.9 7.8% Corporate (32.1) (34.0) (31.0) (31.0) (31.0) (31.0) (0.7%) Corporate (30.9) (25.1) (23.5) (23.1) (22.3) (21.5) (7.0%) Total Adj. EBITDA $116.8 $125.7 $137.1 $137.8 $140.5 $144.7 4.4% Total Adj. EBITDA $102.8 $97.8 $118.9 $129.9 $128.5 $132.8 5.3% 10
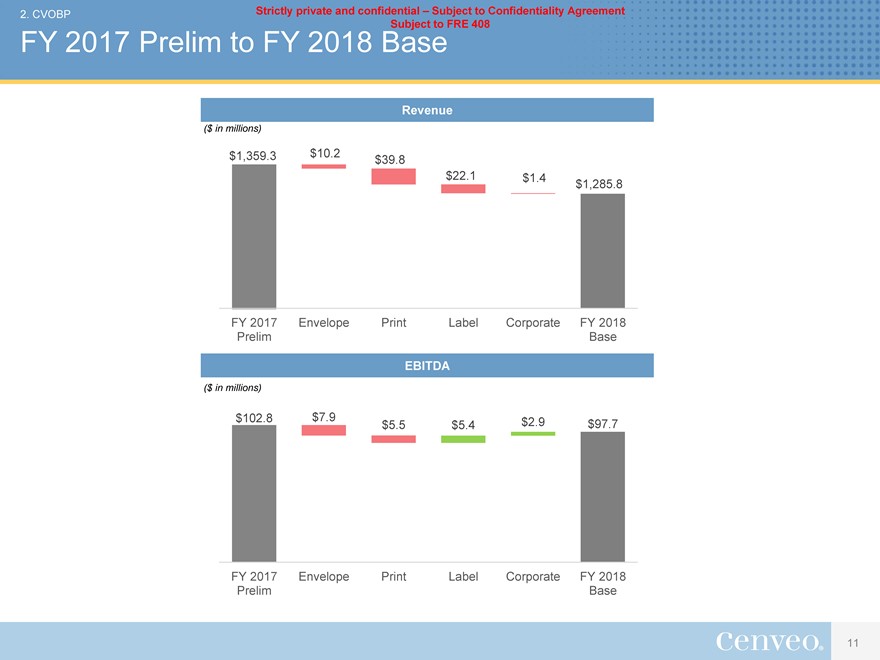 |
2. CVOBP Strictly private and confidential – Subject to Confidentiality Agreement Subject to FRE 408 FY 2017 Prelim to FY 2018 Base Revenue ($ in millions) $1,359.3 $10.2 $39.8 $22.1 $1.4 $1,285.8 FY 2017 Envelope Print Label Corporate FY 2018 Prelim Base EBITDA ($ in millions) $102.8 $7.9 $5.5 $5.4 $2.9 $97.7 FY 2017 Envelope Print Label Corporate FY 2018 Prelim Base 11
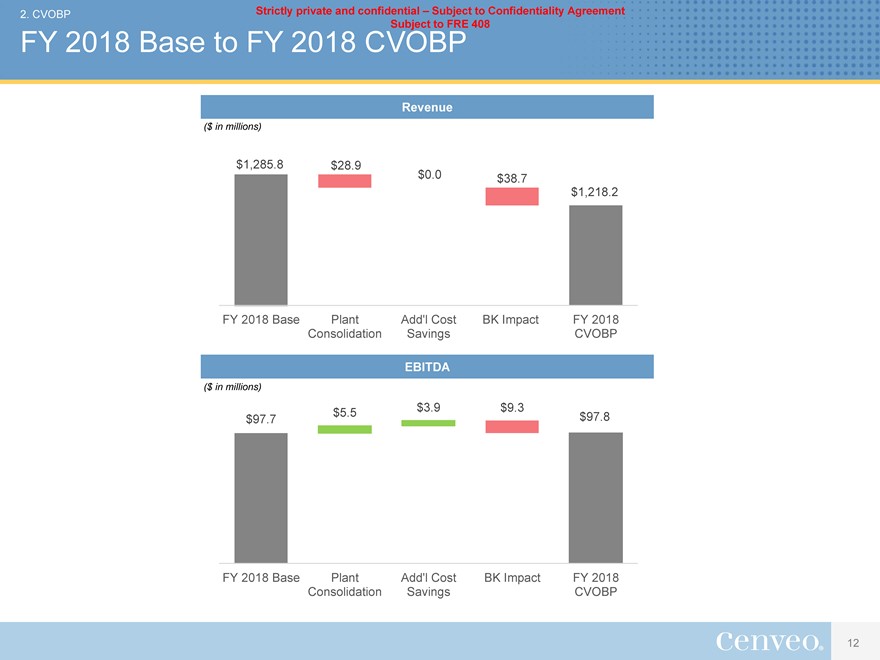 |
2. CVOBP Strictly private and confidential – Subject to Confidentiality Agreement Subject to FRE 408 FY 2018 Base to FY 2018 CVOBP Revenue ($ in millions) $1,285.8 $28.9 $0.0 $38.7 $1,218.2 FY 2018 Base Plant Add’l Cost BK Impact FY 2018 Consolidation Savings CVOBP EBITDA ($ in millions) $5.5 $3.9 $9.3 $97.7 $97.8 FY 2018 Base Plant Add’l Cost BK Impact FY 2018 Consolidation Savings CVOBP 12
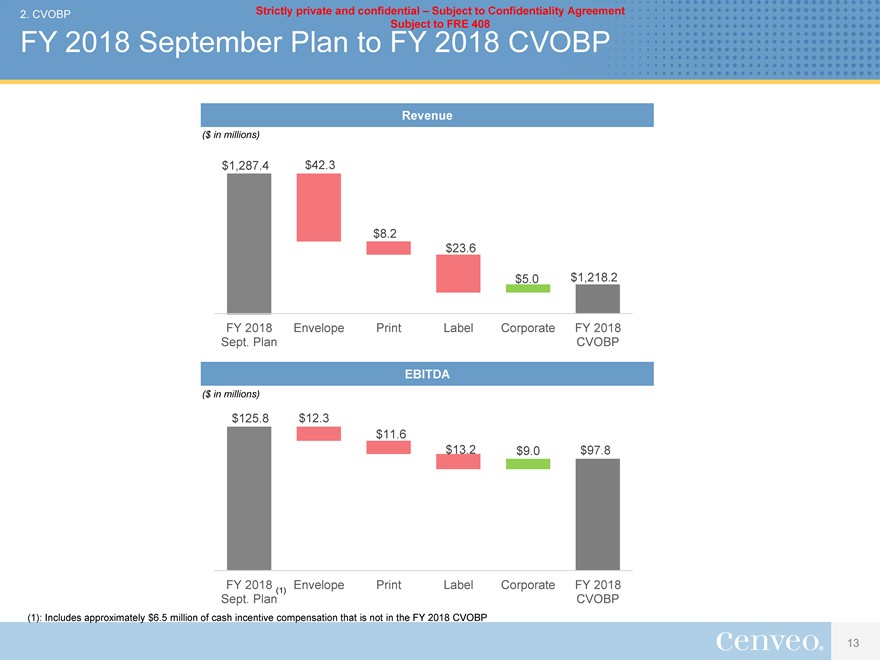 |
2. CVOBP Strictly private and confidential – Subject to Confidentiality Agreement Subject to FRE 408 FY 2018 September Plan to FY 2018 CVOBP Revenue ($ in millions) $1,287.4 $42.3 $8.2 $23.6 $5.0 $1,218.2 FY 2018 Envelope Print Label Corporate FY 2018 Sept. Plan CVOBP EBITDA ($ in millions) $125.8 $12.3 $11.6 $13.2 $9.0 $97.8 FY 2018 Envelope Print Label Corporate FY 2018 Sept. Plan(1) CVOBP (1): Includes approximately $6.5 million of cash incentive compensation that is not in the FY 2018 CVOBP 13
 |
Strictly private and confidential – Subject to Confidentiality Agreement Subject to FRE 408 3 Cost Savings Initiatives
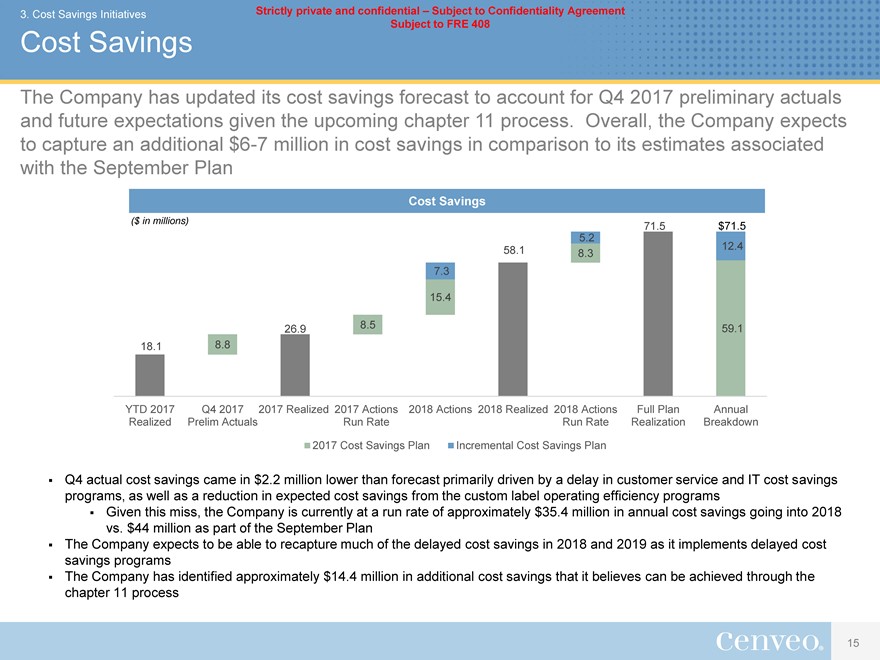 |
3. Cost Savings Initiatives Strictly private and confidential – Subject to Confidentiality Agreement Subject to FRE 408 Cost Savings The Company has updated its cost savings forecast to account for Q4 2017 preliminary actuals and future expectations given the upcoming chapter 11 process. Overall, the Company expects to capture an additional$6-7 million in cost savings in comparison to its estimates associated with the September Plan Cost Savings ($ in millions) 71.5 $71.5 5.2 58.1 8.3 12.4 7.3 15.4 26.9 8.5 59.1 18.1 8.8 YTD 2017 Q4 2017 2017 Realized 2017 Actions 2018 Actions 2018 Realized 2018 Actions Full Plan Annual Realized Prelim Actuals Run Rate Run Rate Realization Breakdown 2017 Cost Savings Plan Incremental Cost Savings Plan Q4 actual cost savings came in $2.2 million lower than forecast primarily driven by a delay in customer service and IT cost savings programs, as well as a reduction in expected cost savings from the custom label operating efficiency programs Given this miss, the Company is currently at a run rate of approximately $35.4 million in annual cost savings going into 2018 vs. $44 million as part of the September Plan The Company expects to be able to recapture much of the delayed cost savings in 2018 and 2019 as it implements delayed cost savings programs The Company has identified approximately $14.4 million in additional cost savings that it believes can be achieved through the chapter 11 process 15
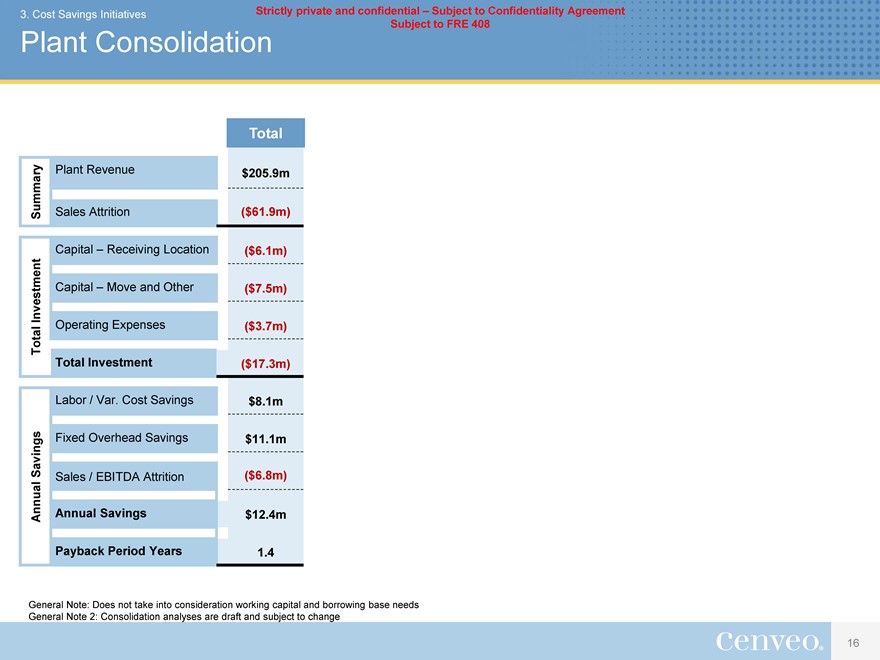 |
3. Cost Savings Initiatives Strictly private and confidential – Subject to Confidentiality Agreement Subject to FRE 408 Plant Consolidation Total Plant Revenue $205.9m Summary Sales Attrition ($61.9m) Capital – Receiving Location ($6.1m) Investment Capital – Move and Other ($7.5m) Operating Expenses ($3.7m) Total Total Investment ($17.3m) Labor / Var. Cost Savings $8.1m Savings Fixed Overhead Savings $11.1m Sales / EBITDA Attrition ($6.8m) Annual Annual Savings $12.4m Payback Period Years 1.4 General Note: Does not take into consideration working capital and borrowing base needs General Note 2: Consolidation analyses are draft and subject to change 16
 |
Strictly private and confidential – Subject to Confidentiality Agreement Subject to FRE 408 4 Appendix
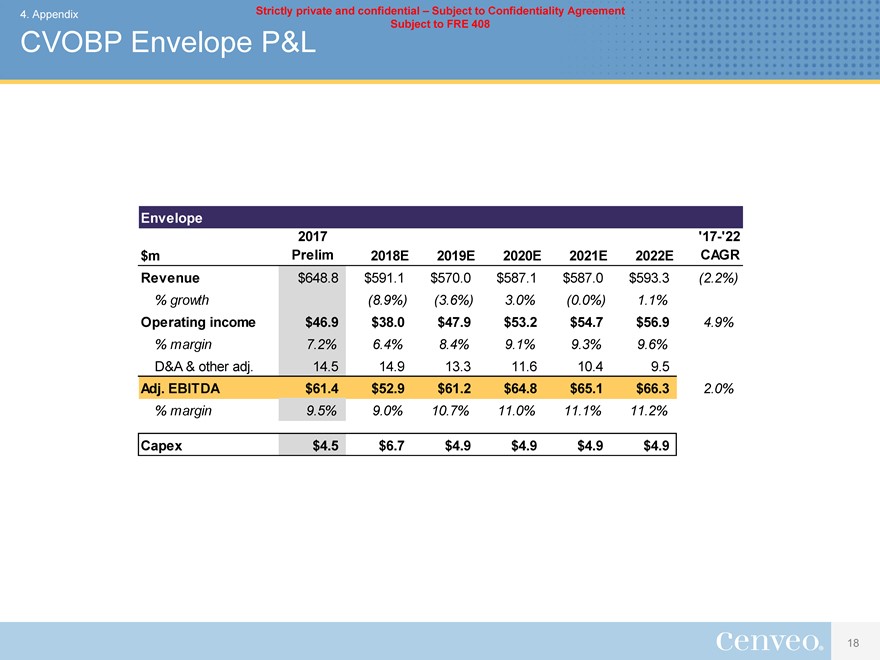 |
4. Appendix Strictly private and confidential – Subject to Confidentiality Agreement Subject to FRE 408 CVOBP Envelope P&L Envelope 2017‘17-‘22 $m Prelim 2018E 2019E 2020E 2021E 2022E CAGR Revenue $648.8 $591.1 $570.0 $587.1 $587.0 $593.3 (2.2%) % growth (8.9%) (3.6%) 3.0% (0.0%) 1.1% Operating income $46.9 $38.0 $47.9 $53.2 $54.7 $56.9 4.9% % margin 7.2% 6.4% 8.4% 9.1% 9.3% 9.6% D&A & other adj. 14.5 14.9 13.3 11.6 10.4 9.5 Adj. EBITDA $61.4 $52.9 $61.2 $64.8 $65.1 $66.3 2.0% % margin 9.5% 9.0% 10.7% 11.0% 11.1% 11.2% Capex $4.5 $6.7 $4.9 $4.9 $4.9 $4.9 18
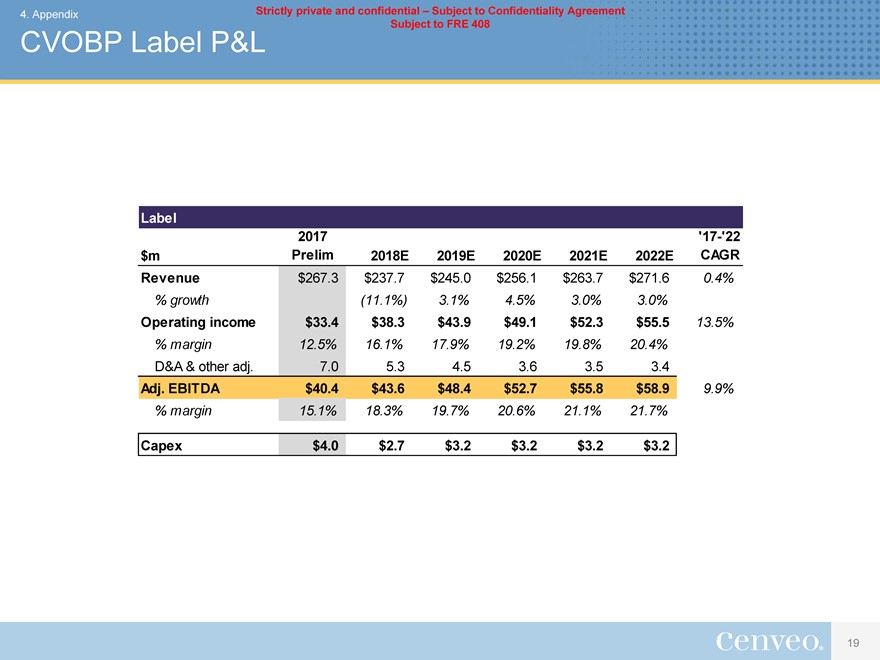 |
4. Appendix Strictly private and confidential – Subject to Confidentiality Agreement Subject to FRE 408 CVOBP Label P&L Label 2017‘17-‘22 $m Prelim 2018E 2019E 2020E 2021E 2022E CAGR Revenue $267.3 $237.7 $245.0 $256.1 $263.7 $271.6 0.4% % growth (11.1%) 3.1% 4.5% 3.0% 3.0% Operating income $33.4 $38.3 $43.9 $49.1 $52.3 $55.5 13.5% % margin 12.5% 16.1% 17.9% 19.2% 19.8% 20.4% D&A & other adj. 7.0 5.3 4.5 3.6 3.5 3.4 Adj. EBITDA $40.4 $43.6 $48.4 $52.7 $55.8 $58.9 9.9% % margin 15.1% 18.3% 19.7% 20.6% 21.1% 21.7% Capex $4.0 $2.7 $3.2 $3.2 $3.2 $3.2 19
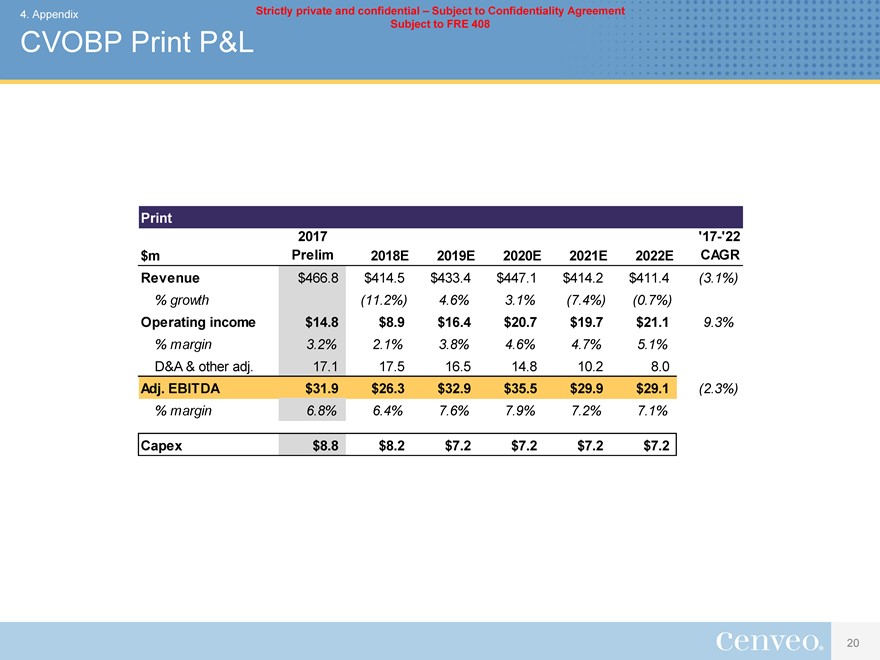 |
4. Appendix Strictly private and confidential – Subject to Confidentiality Agreement Subject to FRE 408 CVOBP Print P&L Print 2017‘17-‘22 $m Prelim 2018E 2019E 2020E 2021E 2022E CAGR Revenue $466.8 $414.5 $433.4 $447.1 $414.2 $411.4 (3.1%) % growth (11.2%) 4.6% 3.1% (7.4%) (0.7%) Operating income $14.8 $8.9 $16.4 $20.7 $19.7 $21.1 9.3% % margin 3.2% 2.1% 3.8% 4.6% 4.7% 5.1% D&A & other adj. 17.1 17.5 16.5 14.8 10.2 8.0 Adj. EBITDA $31.9 $26.3 $32.9 $35.5 $29.9 $29.1 (2.3%) % margin 6.8% 6.4% 7.6% 7.9% 7.2% 7.1% Capex $8.8 $8.2 $7.2 $7.2 $7.2 $7.2 20
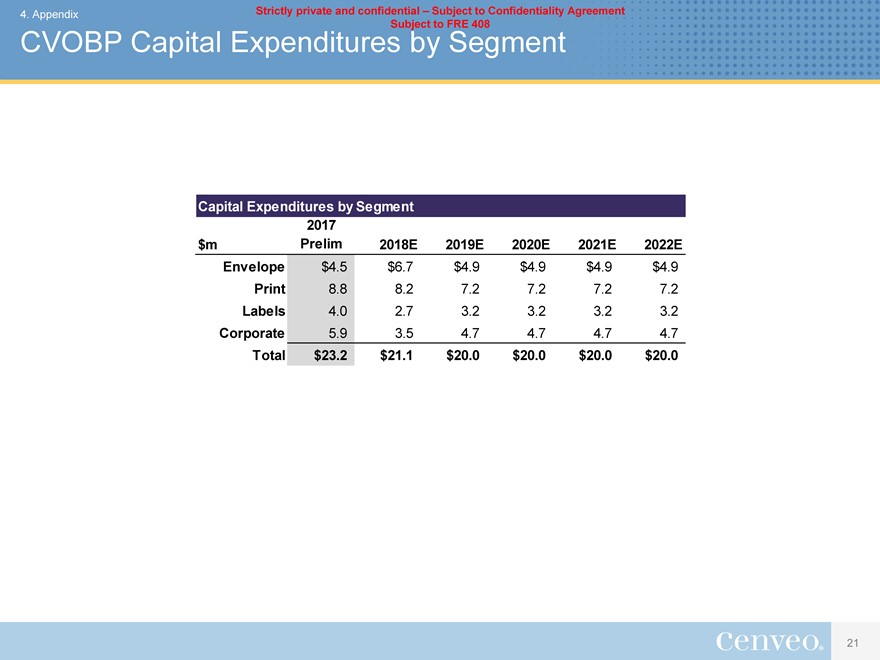 |
4. Appendix Strictly private and confidential – Subject to Confidentiality Agreement Subject to FRE 408 CVOBP Capital Expenditures by Segment Capital Expenditures by Segment 2017 $m Prelim 2018E 2019E 2020E 2021E 2022E Envelope $4.5 $6.7 $4.9 $4.9 $4.9 $4.9 Print 8.8 8.2 7.2 7.2 7.2 7.2 Labels 4.0 2.7 3.2 3.2 3.2 3.2 Corporate 5.9 3.5 4.7 4.7 4.7 4.7 Total $23.2 $21.1 $20.0 $20.0 $20.0 $20.0 21