
STRONG FOUNDATION. STRONGER FUTURE. Simpson Manufacturing Co., Inc. 2022 Off-Season Engagement Exhibit 99.1

This presentation contains forward-looking statements within the meaning of the Private Securities Litigation Reform Act of 1995, Section 27A of the Securities Act of 1933, as amended, and Section 2IE of the Securities Exchange Act of 1934, as amended. Forward-looking statements generally can be identified by words such as "anticipate," "believe," "estimate," "expect," "intend," "plan," "outlook," "target," "continue," "predict," "project," "change," "result," "future," "will," "could," "can," "may," "likely," "potentially," or similar expressions that concern our strategy, plans, expectations or intentions. Forward-looking statements are all statements other than those of historical fact and include, but are not limited to, statements about future financial and operating results, our plans, objectives, business outlook, priorities, expectations and intentions, expectations for sales growth, comparable sales, earnings and performance, stockholder value, capital expenditures, cash flows, the housing market, the home improvement industry, demand for services, share repurchases, the integration of the acquisition of ETANCO, our strategic initiatives, including the impact of these initiatives on our strategic and operational plans and financial results, and any statement of an assumption underlying any of the foregoing. Although we believe that the expectations, opinions, projections and comments reflected in these forward-looking statements are reasonable, such statements involve risks and uncertainties and we can give no assurance that such statements will prove to be correct. Actual results may differ materially from those expressed or implied in such statements. Forward-looking statements are subject to inherent uncertainties, risk and other factors that are difficult to predict and could cause our actual results to vary in material respects from what we have expressed or implied by these forward-looking statements. Important factors that could cause our actual results and financial condition to differ materially from those expressed in our forward-looking statements include the impact of the COVID-19 pandemic on our operations and supply chain, the operations of our customers, suppliers and business partners, and the successful integration of ETANCO, as well as those discussed in the :Risk Factors" and "Management's Discussion and Analysis of Financial Condition and Results of Operations" sections of our most recent Annual Report on Form 10-K, subsequent Quarterly Reports on Form 10-Q and other reports we file with the SEC. To the extent that the COVID-19 pandemic adversely affects our business and financial results, it may also have the effect of heightening many of such risks and other factors. We caution that you should not place undue reliance on these forward-looking statements, which speak only as of the date of this presentation. We undertake no obligation to publicly update any forward-looking statement, whether as a result of new information, future developments or otherwise, except as may be required by law. Readers are urged to carefully review and consider the various disclosures made in our reports filed with the SEC that advise of the risks and factors that may affect our business, results of operations and financial condition. 2 Safe Harbor

Industry leader with unique business model, strong brand recognition and trusted reputation Diversified product offerings and geographies mitigate exposure to cyclical U.S. housing market Leadership position in wood products with significant opportunities in all addressable markets Industry-leading gross profit and operating margins Strong balance sheet enables financial flexibility and stockholder returns ~59% of free cash flow returned to stockholders since 2019(1) (1) Time frame represents January 1, 2019 to September 30, 2022. 3 Investment Highlights
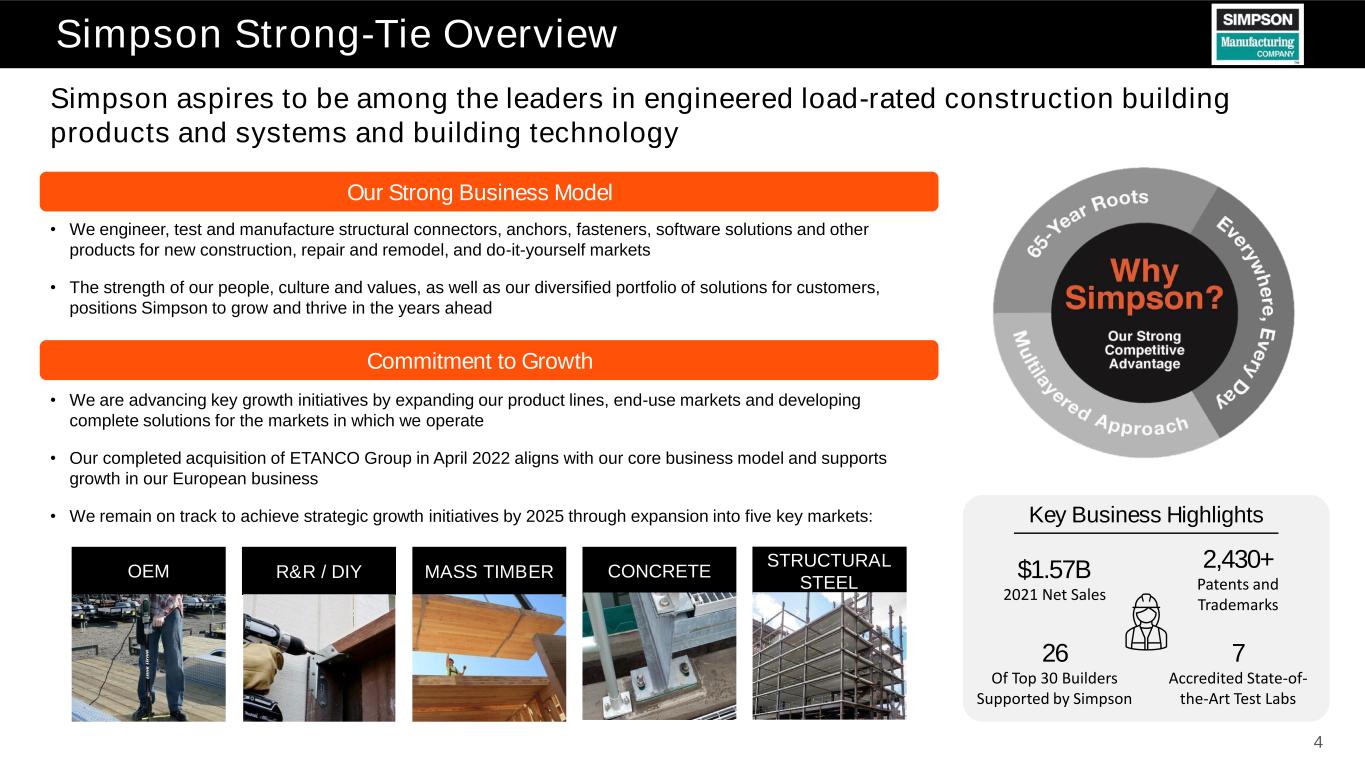
4 Simpson Strong-Tie Overview Commitment to Growth OEM R&R / DIY MASS TIMBER CONCRETE STRUCTURAL STEEL Our Strong Business Model • We engineer, test and manufacture structural connectors, anchors, fasteners, software solutions and other products for new construction, repair and remodel, and do-it-yourself markets • The strength of our people, culture and values, as well as our diversified portfolio of solutions for customers, positions Simpson to grow and thrive in the years ahead Simpson aspires to be among the leaders in engineered load-rated construction building products and systems and building technology • We are advancing key growth initiatives by expanding our product lines, end-use markets and developing complete solutions for the markets in which we operate • Our completed acquisition of ETANCO Group in April 2022 aligns with our core business model and supports growth in our European business • We remain on track to achieve strategic growth initiatives by 2025 through expansion into five key markets: Key Business Highlights 26 Of Top 30 Builders Supported by Simpson 2,430+ Patents and Trademarks $1.57B 2021 Net Sales 7 Accredited State-of- the-Art Test Labs

We are pleased with our continued strong performance, as evidenced by our ability to continue to grow both earnings and dividends Strong Business Drives Stockholder Value (1) The enactment of the Tax Cuts and Jobs Act in December 2017 resulted in a provisional net charge of $2.2 million in the fourth quarter of 2017, or an impact of $0.04 per fully diluted share. (2) Chart represents annual dividends declared. Part of the 2013 dividend was accelerated due to uncertainty of changes to tax code in 2013. The dividend paid in December 2012 is included in 2013. Our 2021 Sales by Product… ($ USD Millions) and Across Operating Segments ($ USD Millions) EPS(1) Dividends Per Share(2) Wood Construction $1,361 Concrete Construction $211 North America $1,363 Europe $197 Asia/Pacific $13 $1.04 $0.87 $1.05 $1.29 $1.38 $1.86 $1.94 $2.72 $2.98 $4.27 $6.12 2011 2012 2013 2014 2015 2016 2017 2018 2019 2020 2021 $0.50 $0.50 $0.50 $0.55 $0.62 $0.70 $0.81 $0.87 $0.91 $0.92 $0.98 2011 2012 2013 2014 2015 2016 2017 2018 2019 2020 2021 5
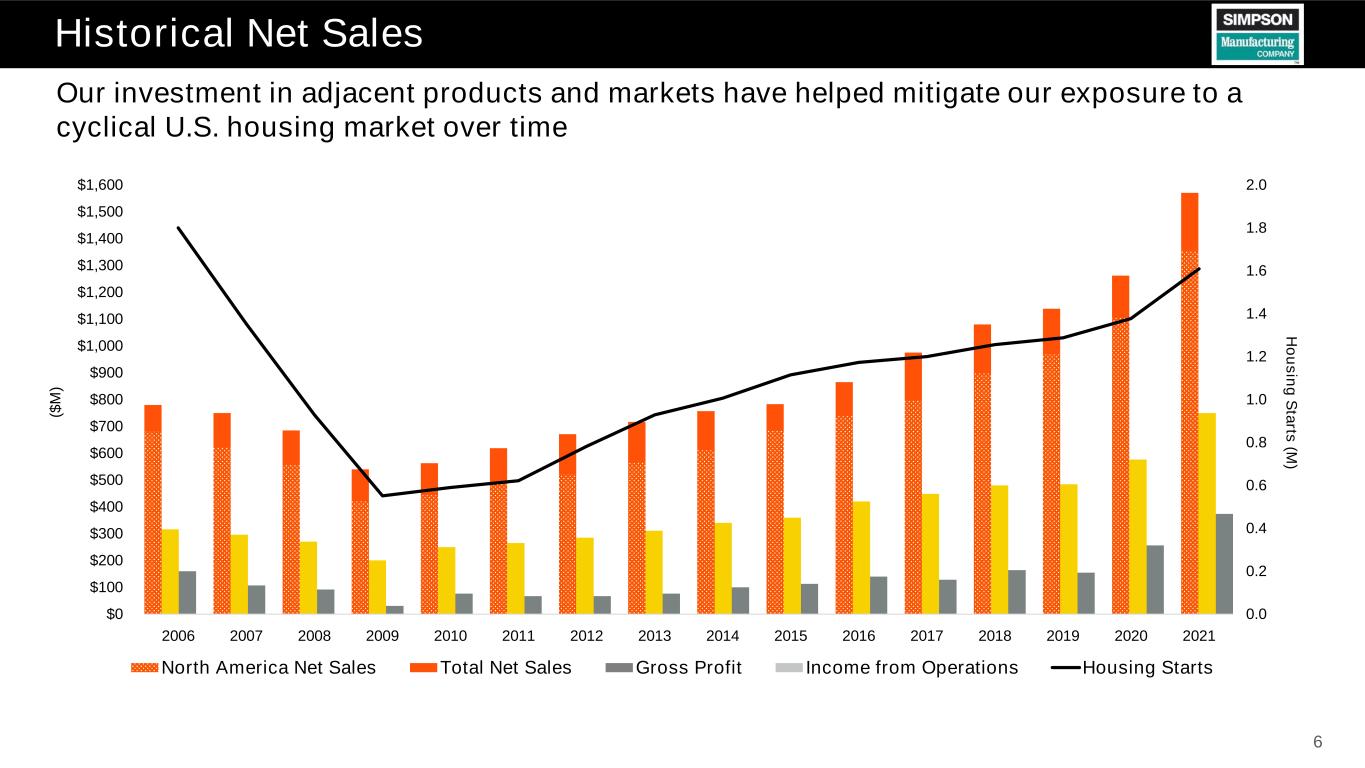
6 Our investment in adjacent products and markets have helped mitigate our exposure to a cyclical U.S. housing market over time Historical Net Sales 2006 2007 2008 2009 2010 2011 2012 2013 2014 2015 2016 2017 2018 2019 2020 2021 0.0 0.2 0.4 0.6 0.8 1.0 1.2 1.4 1.6 1.8 2.0 $0 $100 $200 $300 $400 $500 $600 $700 $800 $900 $1,000 $1,100 $1,200 $1,300 $1,400 $1,500 $1,600 H o u s in g S ta rts (M ) ($ M ) North America Net Sales Total Net Sales Gross Profit Income from Operations Housing Starts

Nov-2017 May-2018 Nov-2018 May-2019 Nov-2019 May-2020 Nov-2020 May-2021 Nov-2021 May-2022 Nov-2022 S&P 500 Dow Jones U.S. Building Materials & Fixtures Index Simpson Manufacturing Proxy Peer Average Note: Proxy peer average includes: AAON, AMWD, APOG, ATKR, AWI, DOOR, EXP,GCP, NX, PATK, PGTI, ROCK, SUM, TREX, and WMS. Note: As of November 18, 2022. Our strong earnings and effective working capital management have enabled us to continue to generate long-term strong stockholder returns 7 5-Year Relative TSR Performance Proxy Peers: +61.1% DJUSBM: +61.5% SSD: +67.7% S&P 500: +53.6%
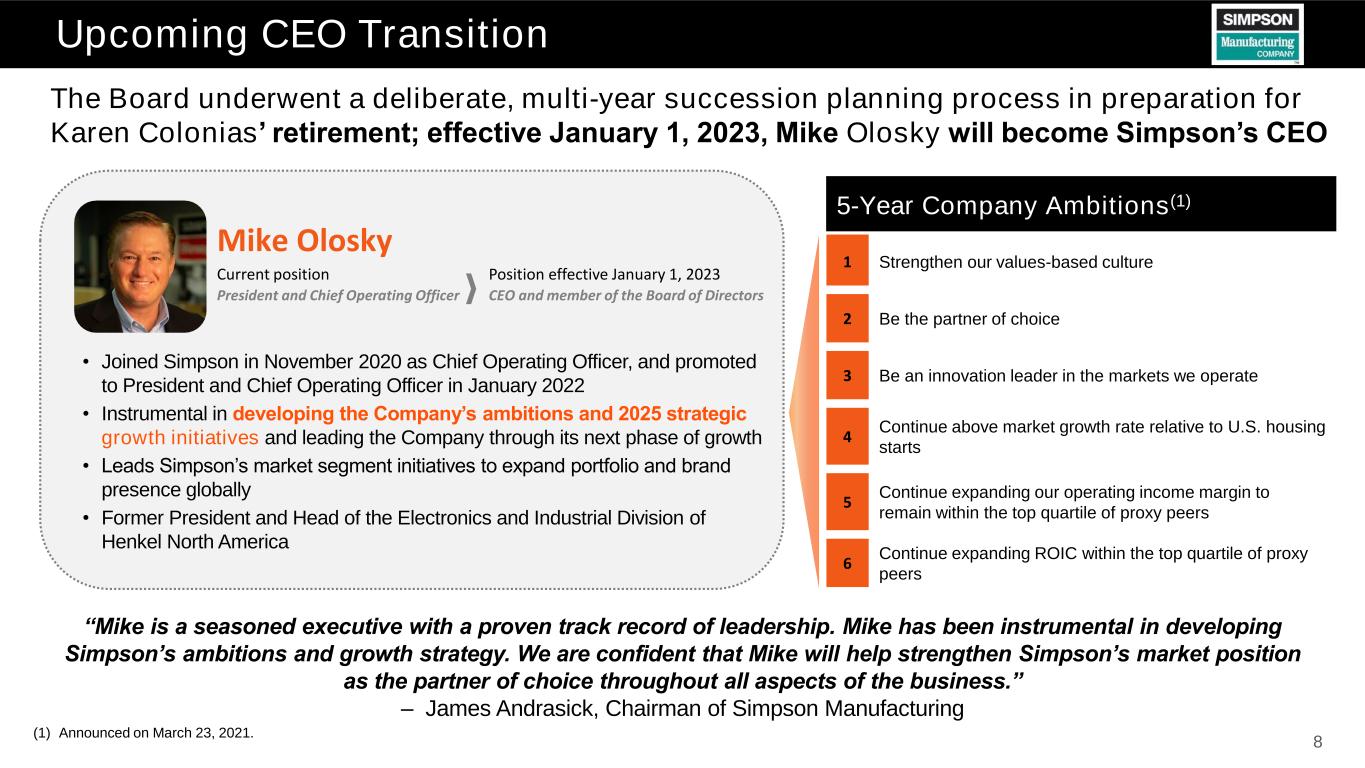
• Joined Simpson in November 2020 as Chief Operating Officer, and promoted to President and Chief Operating Officer in January 2022 • Instrumental in developing the Company’s ambitions and 2025 strategic growth initiatives and leading the Company through its next phase of growth • Leads Simpson’s market segment initiatives to expand portfolio and brand presence globally • Former President and Head of the Electronics and Industrial Division of Henkel North America Upcoming CEO Transition 8 Mike Olosky Current position Position effective January 1, 2023 President and Chief Operating Officer CEO and member of the Board of Directors “Mike is a seasoned executive with a proven track record of leadership. Mike has been instrumental in developing Simpson’s ambitions and growth strategy. We are confident that Mike will help strengthen Simpson’s market position as the partner of choice throughout all aspects of the business.” – James Andrasick, Chairman of Simpson Manufacturing 5-Year Company Ambitions(1) 1 Strengthen our values-based culture 2 Be the partner of choice 3 Be an innovation leader in the markets we operate 4 Continue above market growth rate relative to U.S. housing starts 5 Continue expanding our operating income margin to remain within the top quartile of proxy peers 6 Continue expanding ROIC within the top quartile of proxy peers The Board underwent a deliberate, multi-year succession planning process in preparation for Karen Colonias’ retirement; effective January 1, 2023, Mike Olosky will become Simpson’s CEO (1) Announced on March 23, 2021.
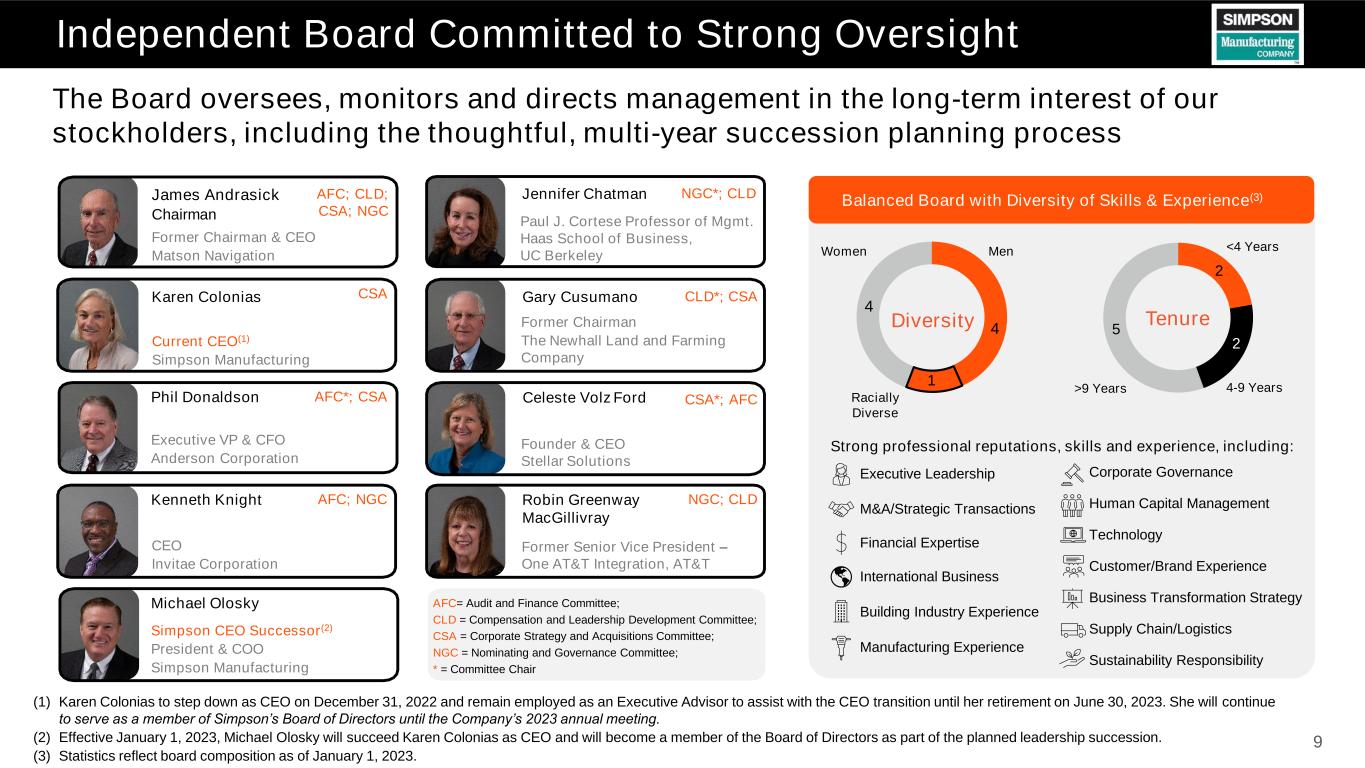
Independent Board Committed to Strong Oversight The Board oversees, monitors and directs management in the long-term interest of our stockholders, including the thoughtful, multi-year succession planning process AFC= Audit and Finance Committee; CLD = Compensation and Leadership Development Committee; CSA = Corporate Strategy and Acquisitions Committee; NGC = Nominating and Governance Committee; * = Committee Chair 9 Jennifer Chatman Paul J. Cortese Professor of Mgmt. Haas School of Business, UC Berkeley NGC*; CLD James Andrasick Chairman Former Chairman & CEO Matson Navigation AFC; CLD; CSA; NGC Gary Cusumano Former Chairman The Newhall Land and Farming Company CLD*; CSA Robin Greenway MacGillivray Former Senior Vice President – One AT&T Integration, AT&T NGC; CLD Executive VP & CFO Anderson Corporation Phil Donaldson AFC*; CSA Kenneth Knight CEO Invitae Corporation AFC; NGC (1) Karen Colonias to step down as CEO on December 31, 2022 and remain employed as an Executive Advisor to assist with the CEO transition until her retirement on June 30, 2023. She will continue to serve as a member of Simpson’s Board of Directors until the Company’s 2023 annual meeting. (2) Effective January 1, 2023, Michael Olosky will succeed Karen Colonias as CEO and will become a member of the Board of Directors as part of the planned leadership succession. (3) Statistics reflect board composition as of January 1, 2023. Michael Olosky Simpson CEO Successor(2) President & COO Simpson Manufacturing Celeste Volz Ford Founder & CEO Stellar Solutions CSA*; AFC 2 2 5 >9 Years 4-9 Years <4 Years Tenure Balanced Board with Diversity of Skills & Experience(3) Executive Leadership M&A/Strategic Transactions Financial Expertise International Business Building Industry Experience Manufacturing Experience Strong professional reputations, skills and experience, including: Corporate Governance Human Capital Management Technology Customer/Brand Experience Business Transformation Strategy Supply Chain/Logistics Sustainability Responsibility 4 4 Diversity Women 1 Racially Diverse Men Karen Colonias Current CEO(1) Simpson Manufacturing CSA
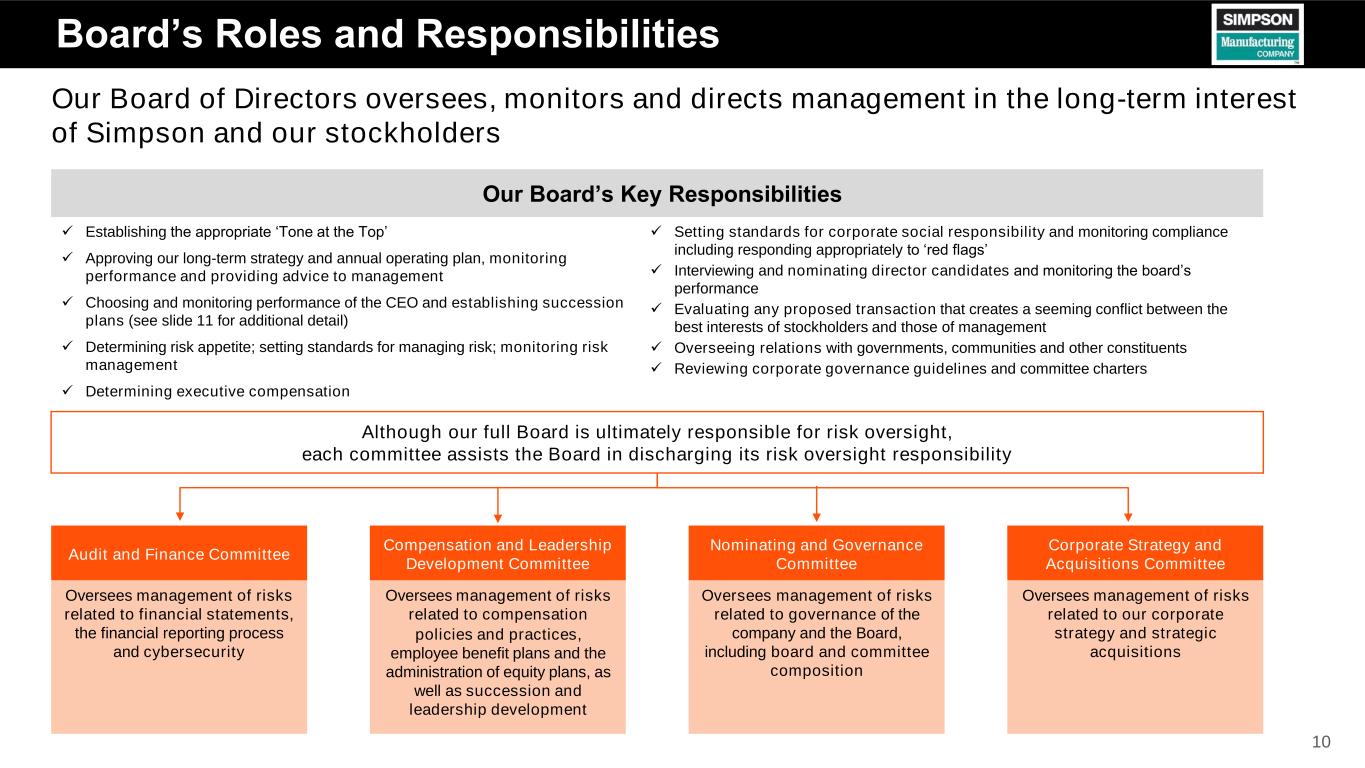
Our Board of Directors oversees, monitors and directs management in the long-term interest of Simpson and our stockholders Our Board’s Key Responsibilities ✓ Establishing the appropriate ‘Tone at the Top’ ✓ Approving our long-term strategy and annual operating plan, monitoring performance and providing advice to management ✓ Choosing and monitoring performance of the CEO and establishing succession plans (see slide 11 for additional detail) ✓ Determining risk appetite; setting standards for managing risk; monitoring risk management ✓ Determining executive compensation ✓ Setting standards for corporate social responsibility and monitoring compliance including responding appropriately to ‘red flags’ ✓ Interviewing and nominating director candidates and monitoring the board’s performance ✓ Evaluating any proposed transaction that creates a seeming conflict between the best interests of stockholders and those of management ✓ Overseeing relations with governments, communities and other constituents ✓ Reviewing corporate governance guidelines and committee charters Although our full Board is ultimately responsible for risk oversight, each committee assists the Board in discharging its risk oversight responsibility Audit and Finance Committee Oversees management of risks related to financial statements, the financial reporting process and cybersecurity Compensation and Leadership Development Committee Nominating and Governance Committee Corporate Strategy and Acquisitions Committee Oversees management of risks related to compensation policies and practices, employee benefit plans and the administration of equity plans, as well as succession and leadership development Oversees management of risks related to governance of the company and the Board, including board and committee composition Oversees management of risks related to our corporate strategy and strategic acquisitions Board’s Roles and Responsibilities 10

Succession Planning and Leadership Development The Board has robust processes in place to facilitate executive succession planning and leadership development As a part of succession planning, the Board conducts regular reviews to determine whether a satisfactory system is in effect for the education and development of senior officers and managers throughout the Company The Chairman leads the Board in an annual review of CEO succession, which includes an examination of potential permanent and interim candidates. The Board also conducts an annual review of senior management succession in consultation with the CEO 11 The Board regularly approves and maintains a process regarding CEO succession in the event of an emergency or the retirement or other temporary or permanent absence of the CEO To assist the Board with CEO succession planning, the CEO creates and periodically assesses (at least annually) a list of potential successors who may be able to perform the CEO's duties on an interim basis The Compensation and Leadership Development Committee oversees the succession planning process (including succession planning for emergencies) for the CEO and the CEO’s executive direct reports, and as appropriate, evaluates potential candidates Regular Discussion and Continuous Development

Commitment to Strong Governance Practices Our Board remains committed to constructive engagement with our stockholders and regularly reviews and incorporates stockholder perspectives into our key practices 12 Enhancements to our practices and policies and efforts taken to-date Governance Sustainability, Environmental and Social Responsibility • Separate Chair of the Board and CEO • Board comprised of majority independent directors • Strong shareholder engagement program led by the Board and senior management; in late 2021 and early 2022, we reached out to stockholders holding ~70.7% of our outstanding shares and our Chairman engaged with ~28.1% of our outstanding shares • Conducts annual Board and Committee self-evaluations and reviews of director qualifications • Issued inaugural ESG report in March 2020 ‒ Reported updated metrics in March 2021 addendum • Issued 2021 Sustainability, Environmental and Social Responsibility report in March 2022 ‒ Increased the number of ESG data metrics tracked and collected from 6 to 18 ‒ Conducted internal materiality analysis and published a SASB Index ‒ Calculated our Scope 1 and Scope 2 carbon footprint ‒ Published targets for health and safety performance • Established ESG task force with full Board oversight on sustainability strategy and progress • Engaged external ESG disclosure consultants and service providers • Enhanced disclosure on Human Capital Management • Updated our Code of Business Conduct and Ethics to describe behavioral expectations of our leaders and our employees • Launched Diversity, Equity & Inclusion Program • Renewed focus on employee health and safety Compensation • Enhanced transparency in CD&A, including disclosing specific targets of our compensation programs and how they tie to our strategy • Maintain longer performance-based equity award performance periods • Beginning with the 2021 plan, incorporated an individual modifier into the EOCPS based on the achievement of pre-established MBO goals • Require double-trigger vesting of equity awards upon a change in control • Maintain a rigorous approach to establishing performance goals under the incentive plans

Sustainability and Environmental and Social Responsibility 13 We operate in an environmentally responsible manner to protect our employees, customers and communities while prioritizing an inclusive, equitable and diverse company Four Key Aspects of Sustainability Manufacturing Process Energy Conservation Waste Reduction and Recycling Sustainable Building Practices Minimize amount of total waste generated by manufacturing processes through companywide lean practices Improve energy efficiencies at facilities globally to ensure eco-friendly, cost- effective operations Support the Circular Economy by minimizing our largest recognized waste stream and sending unused steel back upstream Support sustainable business practices, including U.S. Green Building Council’s LEED Rating System, among others Diversity, Equity and Inclusion Committed to fostering a supportive corporate culture that promotes leadership opportunities and diversity In 2021, we worked with a consultant to assess and benchmark DE&I • Conducted interviews with members of our senior leadership team • Held virtual employee focus groups • Analyzed diversity metrics of our workforce • Reviewed our policies and guidelines that impact diversity, equity and inclusion • Strong Leaders Program (for managers) and our Emerging Leaders Program (for non- managers) provide employees with tools and experiences to develop their fullest leadership potential • Strong For Life employee program provides no-cost trainings, tools and resources to educate and empower employees and their families • Launched and conducts a Sales Leadership Excellence training and development program DE&I Initiatives Leadership & Development
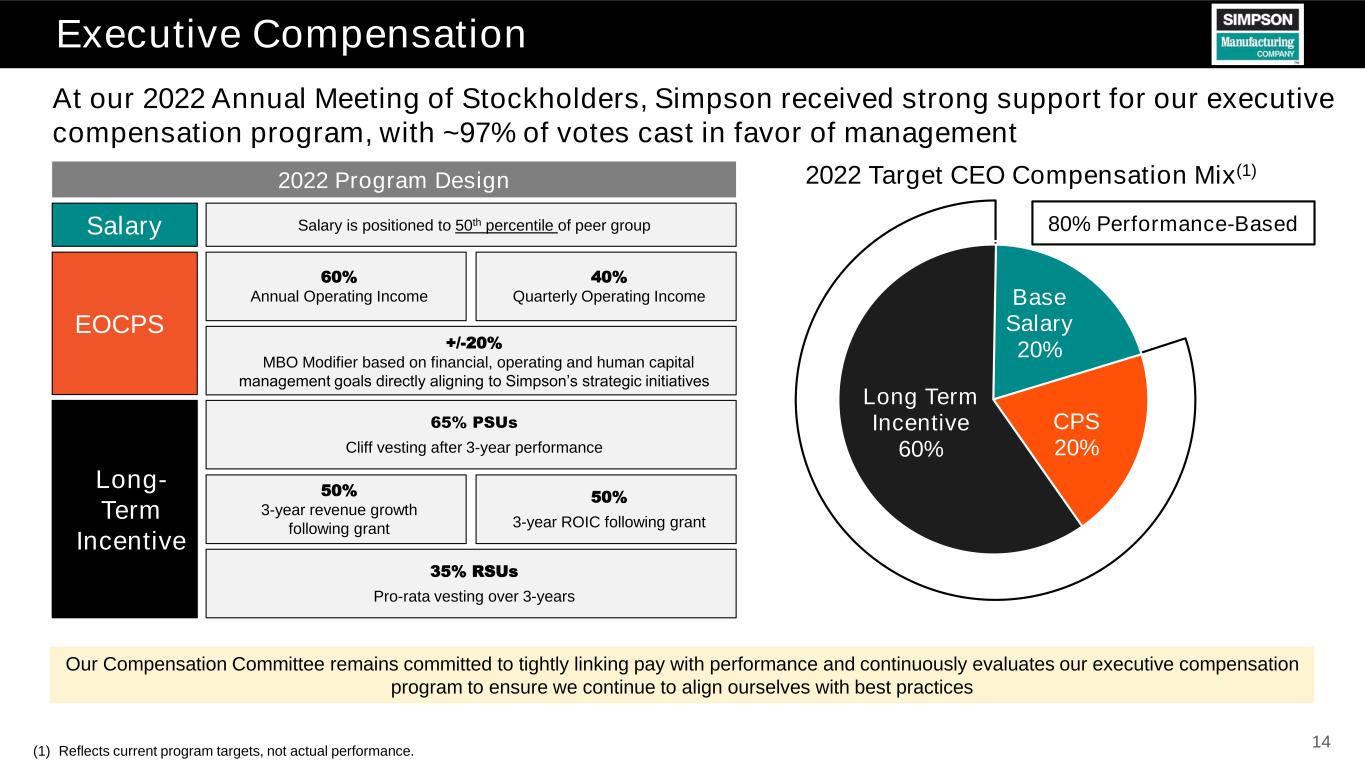
At our 2022 Annual Meeting of Stockholders, Simpson received strong support for our executive compensation program, with ~97% of votes cast in favor of management (1) Reflects current program targets, not actual performance. 14 2022 Target CEO Compensation Mix(1) Long- Term Incentive EOCPS 60% Annual Operating Income 2022 Program Design Salary Salary is positioned to 50th percentile of peer group 35% RSUs Pro-rata vesting over 3-years 65% PSUs Cliff vesting after 3-year performance 50% 3-year revenue growth following grant 50% 3-year ROIC following grant 40% Quarterly Operating Income Long Term Incentive 60% Long Term Incentive 60% Base Salary 20% CPS 20% 80% Performance-Based Our Compensation Committee remains committed to tightly linking pay with performance and continuously evaluates our executive compensation program to ensure we continue to align ourselves with best practices Executive Compensation +/-20% MBO Modifier based on financial, operating and human capital management goals directly aligning to Simpson’s strategic initiatives
Appendix 15
Return on Invested Capital (“ROIC”) Definition 16 When referred to in this presentation, return on invested capital (“ROIC”) for a fiscal year is calculated based on (i) the net income of that year as presented in the Company’s consolidated statements of operations prepared pursuant to generally accepted accounting principles in the U.S. (“GAAP”), as divided by (ii) the average of the sum of total stockholders’ equity and total long-term debt, at the beginning of and at the end of such year, as presented in the Company’s consolidated balance sheets prepared pursuant to GAAP for that applicable year. As such, the Company’s ROIC, a ratio or statistical measure, is calculated using exclusively GAAP financial measures.


