|
| |
| For Immediate Release | News Media & Financial Analyst Contact: |
| Unity Bancorp, Inc. (NSDQ: UNTY) | Alan J. Bedner, EVP and CFO |
| January 21, 2020 | (908) 713-4308 |
 Unity Bancorp Reports
Quarterly Earnings of $6.1 Million and
Full Year Earnings of $23.7 Million
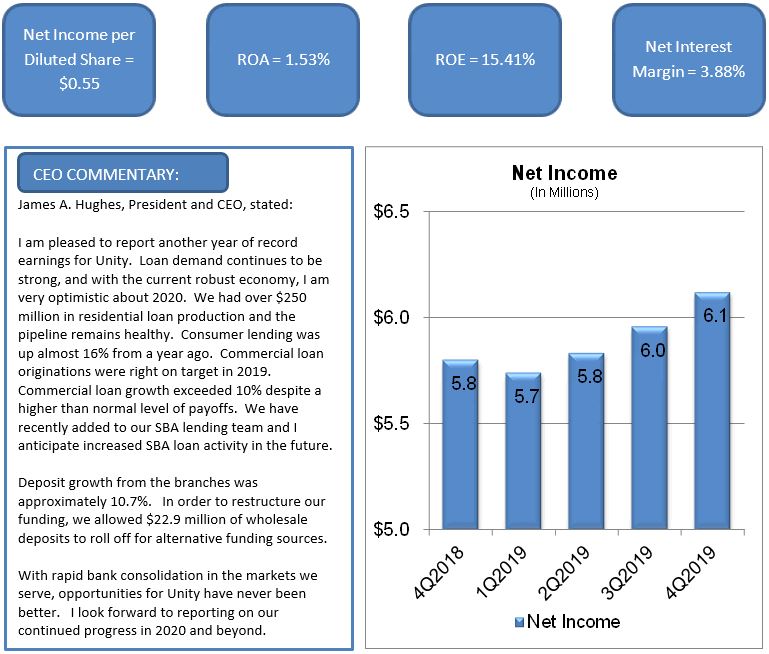
Clinton, NJ, January 21, 2020 - Unity Bancorp, Inc. (NASDAQ: UNTY), parent company of Unity Bank, reported net income of $6.1 million, or $0.55 per diluted share, for the quarter ended December 31, 2019, a 5.5% increase compared to the $5.8 million, or $0.53 per diluted share reported for the prior year’s fourth quarter. For the year ended December 31, 2019, Unity reported net income of $23.7 million, or $2.14 per diluted share, a 7.9% increase compared to $21.9 million or $2.01 per diluted share for the prior year’s period.
Fourth Quarter Earnings Highlights
| |
| • | Net interest income, our primary driver of earnings, increased $599 thousand to $14.8 million for the quarter ended December 31, 2019, compared to the prior year’s quarter, due to strong loan growth. |
| |
| • | Net interest margin decreased to 3.88% for the quarter ended December 31, 2019, compared to 4.01% for the prior year’s quarter due to recent interest rate cuts by the Federal Reserve Board. Our net interest margin remained stable compared to the 3.90% for the prior sequential quarter. |
| |
| • | The provision for loan losses was $500 thousand for the quarter ended December 31, 2019 and 2018 as asset quality remains favorable. |
| |
| • | Noninterest income increased $442 thousand to $2.4 million compared to the prior year’s quarter and decreased $314 thousand compared to the prior sequential quarter. The year-over-year increase was primarily due to market value fluctuations on our equity securities, increased gains on the sale of securities and increased mortgage gains as a result of an increase in volume in the current period. The decrease from the prior sequential quarter was primarily due to the $768 thousand gain on the sale of our Union, NJ branch building in September 2019. |
| |
| • | Noninterest expense increased $451 thousand to $8.7 million compared to the prior year’s quarter and decreased $10 thousand compared to the prior sequential quarter. The year-over-year increase was primarily due to increased compensation and mortgage commissions paid on a higher origination volume. |
| |
| • | The effective tax rate was 22.9% compared to 21.0% in the prior year’s quarter due to recent New Jersey tax legislation changes. The effective tax rate may increase in the future as a result of this legislation. |
Balance Sheet Highlights
| |
| • | Total loans increased $121.0 million, or 9.3%, from year-end 2018 to $1.4 billion at December 31, 2019. Commercial, residential mortgage and consumer loan portfolios increased $70.9 million, $31.7 million and $19.6 million, respectively, partially offset by a decline of $1.2 million in SBA loans. Loan growth was impacted by increased payoffs in 2019; however, our pipeline remains strong. |
| |
| • | Total deposits increased $42.4 million, or 3.5%, from year-end 2018 to $1.3 billion at December 31, 2019. Core growth resulted primarily from time deposit promotions. There was a planned reduction of $22.9 million in brokered deposits in 2019. |
| |
| • | Borrowed funds increased $73.0 million to $283.0 million at December 31, 2019, primarily due to the reduction in brokered deposits and a new $40.0 million fixed rate advance with a maturity date of August 22, 2024, at a rate of 1.81%. |
| |
| • | Shareholders’ equity was $160.7 million at December 31, 2019, an increase of $22.2 million from year-end 2018, due to retained net income. Shareholders’ equity continues to grow organically at a rate that exceeds balance sheet growth. |
| |
| • | Book value per common share was $14.77 as of December 31, 2019. |
| |
| • | At December 31, 2019, the leverage, common equity Tier I, Tier I and Total Risk Based Capital ratios were 10.59%, 11.97%, 12.73% and 13.49% respectively, all in excess of the ratios required to be deemed “well-capitalized.” |
| |
| • | Nonperforming loans totaled $5.6 million and included $3.9 million of well-secured residential mortgage loans, compared to nonperforming loans of $6.9 million in the prior year. Nonperforming assets to total assets were 0.43% at December 31, 2019 and 0.44% at December 31, 2018 and the allowance to total loans ratio was 1.15% at December 31, 2019 and 1.19% at December 31, 2018. Net charge-offs were $107 thousand for the quarter. |
Unity Bancorp, Inc. is a financial service organization headquartered in Clinton, New Jersey, with approximately $1.7 billion in assets and $1.3 billion in deposits. Unity Bank provides financial services to retail, corporate and small business customers through its 19 retail service centers located in Bergen, Hunterdon, Middlesex, Somerset, Union and Warren Counties in New Jersey and Northampton County in Pennsylvania. For additional information about Unity, visit our website at www.unitybank.com , or call 800-618-BANK.
This news release contains certain forward-looking statements, either expressed or implied, which are provided to assist the reader in understanding anticipated future financial performance. These statements may be identified by use of the words “believe”, “expect”, “intend”, “anticipate”, “estimate”, “project” or similar expressions. These statements involve certain risks, uncertainties, estimates and assumptions made by management, which are subject to factors beyond the company’s control and could impede its ability to achieve these goals. These factors include those items included in our Annual Report on Form 10-K under the heading “Item IA-Risk Factors” as well as general economic conditions, trends in interest rates, the ability of our borrowers to repay their loans, our ability to manage and reduce the level of our nonperforming assets, and results of regulatory exams, among other factors.
This communication does not constitute an offer to sell or the solicitation of an offer to buy any securities, nor shall there be any sale of securities in any jurisdiction in which such offer, solicitation or sale would be unlawful prior to registration or qualification under the securities laws of such jurisdiction.
UNITY BANCORP, INC.
SUMMARY FINANCIAL HIGHLIGHTS
December 31, 2019
|
| | | | | | | | | | | | | | | | | | | | |
| | | | | | | | | | | | | |
| | | | | | | | | | Dec 31, 2019 vs. | |
| | | | | | | | | | Sep 30, 2019 | | Dec 31, 2018 | |
| (In thousands, except percentages and per share amounts) | | Dec 31, 2019 | | Sep 30, 2019 | | Dec 31, 2018 | | | % | | % | |
| BALANCE SHEET DATA: | | | | | | | | | | | | |
| Total assets | | $ | 1,718,942 |
| | $ | 1,664,308 |
| | $ | 1,579,157 |
| | | 3.3 | % | | 8.9 | % | |
| Total deposits | | 1,250,114 |
| | 1,273,362 |
| | 1,207,687 |
| | | (1.8 | ) | | 3.5 |
| |
| Total loans | | 1,425,558 |
| | 1,368,474 |
| | 1,304,566 |
| | | 4.2 |
| | 9.3 |
| |
| Total securities | | 66,564 |
| | 63,991 |
| | 63,732 |
| | | 4.0 |
| | 4.4 |
| |
| Total shareholders' equity | | 160,709 |
| | 154,884 |
| | 138,488 |
| | | 3.8 |
| | 16.0 |
| |
| Allowance for loan losses | | (16,395 | ) | | (16,002 | ) | | (15,488 | ) | | | 2.5 |
| | 5.9 |
| |
| | | | | | | | | | | | | |
| FINANCIAL DATA - QUARTER TO DATE: | | | | | | | | | | |
| Income before provision for income taxes | | $ | 7,940 |
| | $ | 7,635 |
| | $ | 7,350 |
| | | 4.0 |
| | 8.0 |
| |
| Provision for income taxes | | 1,820 |
| | 1,676 |
| | 1,547 |
| | | 8.6 |
| | 17.6 |
| |
| Net income | | $ | 6,120 |
| | $ | 5,959 |
| | $ | 5,803 |
| | | 2.7 |
| | 5.5 |
| |
| | | | | | | | | | | | | |
| Net income per common share - Basic | | $ | 0.56 |
| | $ | 0.55 |
| | $ | 0.54 |
| | | 1.8 |
| | 3.7 |
| |
| Net income per common share - Diluted | | $ | 0.55 |
| | $ | 0.54 |
| | $ | 0.53 |
| | | 1.9 |
| | 3.8 |
| |
| | | | | | | | | | | | | |
| Performance ratios: | | | | | | | | | | | | |
| Return on average assets | | 1.53 |
| % | 1.53 |
| % | 1.56 |
| % | | | | | |
| Return on average equity | | 15.41 |
| % | 15.57 |
| % | 17.00 |
| % | | | | | |
| Efficiency ratio | | 51.29 |
| % | 51.06 |
| % | 50.69 |
| % | | | | | |
| Net interest margin | | 3.88 |
| % | 3.90 |
| % | 4.01 |
| % | | | | | |
| Noninterest expense to average assets | | 2.17 |
| % | 2.24 |
| % | 2.22 |
| % | | | | | |
| | | | | | | | | | | | | |
| FINANCIAL DATA - YEAR TO DATE: | | | | | | | | | | | | |
| Income before provision for income taxes | | $ | 30,315 |
| | | | $ | 27,307 |
| | | | | 11.0 |
| |
| Provision for income taxes | | 6,662 |
| | | | 5,388 |
| | | | | 23.6 |
| |
| Net income | | $ | 23,653 |
| | | | $ | 21,919 |
| | | | | 7.9 |
| |
| | | | | | | | | | | | | |
| Net income per common share - Basic | | $ | 2.18 |
| | | | $ | 2.04 |
| | | | | 6.9 |
| |
| Net income per common share - Diluted | | $ | 2.14 |
| | | | $ | 2.01 |
| | | | | 6.5 |
| |
| | | | | | | | | | | | | |
| Performance ratios: | | | | | | | | | | | | |
| Return on average assets | | 1.54 |
| % | | | 1.53 |
| % | | | | 0.7 |
| |
| Return on average equity | | 15.86 |
| % | | | 17.1 |
| % | | | | (7.3 | ) | |
| Efficiency ratio | | 52.00 |
| % | | | 53.07 |
| % | | | | (2.0 | ) | |
| Net interest margin | | 3.95 |
| % | | | 3.97 |
| % | | | | (0.5 | ) | |
| Noninterest expense to average assets | | 2.25 |
| % | | | 2.34 |
| % | | | | (3.8 | ) | |
| | | | | | | | | | | | | |
| SHARE INFORMATION: | | | | | | | | | | | | |
| Market price per share | | $ | 22.57 |
| | $ | 22.15 |
| | $ | 20.76 |
| | | 1.9 |
| | 8.7 |
| |
| Dividends paid | | $ | 0.08 |
| | $ | 0.08 |
| | $ | 0.07 |
| | | — |
| | 14.3 |
| |
| Book value per common share | | $ | 14.77 |
| | $ | 14.25 |
| | $ | 12.85 |
| | | 3.6 |
| | 14.9 |
| |
| Average diluted shares outstanding (QTD) | | 11,057 |
| | 11,036 |
| | 10,935 |
| | | 0.2 |
| | 1.1 |
| |
| | | | | | | | | | | | | |
| CAPITAL RATIOS: | | | | | | | | | | | | |
| Total equity to total assets | | 9.35 |
| % | 9.31 |
| % | 8.77 |
| % | | | | | |
| Leverage ratio | | 10.59 |
| % | 10.54 |
| % | 9.90 |
| % | | | | | |
| Common equity tier 1 risk-based capital ratio | | 11.97 |
| % | 12.24 |
| % | 11.40 |
| % | | | | | |
| Tier 1 risk-based capital ratio | | 12.73 |
| % | 13.04 |
| % | 12.24 |
| % | | | | | |
| Total risk-based capital ratio | | 13.48 |
| % | 14.28 |
| % | 13.49 |
| % | | | | | |
| | | | | | | | | | | | | |
| | | | | | | | | | | | | |
|
| | | | | | | | | | | | | | | | | | | | |
| CREDIT QUALITY AND RATIOS: | | | | | | | | | | | | |
| Nonperforming assets | | $ | 7,372 |
| | $ | 7,305 |
| | $ | 6,929 |
| | | 0.9 |
| | 6.3 |
| |
| QTD net chargeoffs (annualized) to QTD average loans | | 0.03 |
| % | 0.21 |
| % | — |
| % | | | | | |
| Allowance for loan losses to total loans | | 1.15 |
| % | 1.17 |
| % | 1.19 |
| % | | | | | |
Nonperforming assets to total loans
and OREO | | 0.52 |
| % | 0.53 |
| % | 0.53 |
| % | | | | | |
| Nonperforming assets to total assets | | 0.43 |
| % | 0.44 |
| % | 0.44 |
| % | | | | | |
| | | | | | | | | | | | | |
UNITY BANCORP, INC.
CONSOLIDATED BALANCE SHEETS
December 31, 2019 |
| | | | | | | | | | | | | | | | | | | | |
| | | | | | | | | | | | | |
| | | | | | | | | | Dec 31, 2019 vs. | |
| | | | | | | | | | Sep 30, 2019 | | Dec 31, 2018 | |
| (In thousands, except percentages) | | Dec 31, 2019 | | Sep 30, 2019 | | Dec 31, 2018 | | | % | | % | |
| ASSETS | | | | | | | | | | | | |
| Cash and due from banks | | $ | 21,106 |
| | $ | 29,426 |
| | $ | 20,028 |
| | | (28.3 | ) % | | 5.4 | % | |
| Federal funds sold, interest-bearing deposits and repos | | 136,910 |
| | 137,334 |
| | 125,487 |
| | | (0.3 | ) | | 9.1 |
| |
| Cash and cash equivalents | | 158,016 |
| | 166,760 |
| | 145,515 |
| | | (5.2 | ) | | 8.6 |
| |
| Securities: | | | | | | | | | | | | |
| Securities available for sale | | 64,275 |
| | 47,295 |
| | 46,713 |
| | | 35.9 |
| | 37.6 |
| |
| Securities held to maturity | | — |
| | 14,332 |
| | 14,875 |
| | | (100.0 | ) | | (100.0 | ) | |
| Equity securities | | 2,289 |
| | 2,364 |
| | 2,144 |
| | | (3.2 | ) | | 6.8 |
| |
| Total securities | | 66,564 |
| | 63,991 |
| | 63,732 |
| | | 4.0 |
| | 4.4 |
| |
| Loans: | | | | | | | | | | | | |
| SBA loans held for sale | | 13,529 |
| | 13,053 |
| | 11,171 |
| | | 3.6 |
| | 21.1 |
| |
| SBA loans held for investment | | 35,767 |
| | 36,380 |
| | 39,333 |
| | | (1.7 | ) | | (9.1 | ) | |
| Commercial loans | | 765,032 |
| | 723,249 |
| | 694,102 |
| | | 5.8 |
| | 10.2 |
| |
| Residential mortgage loans | | 467,706 |
| | 456,963 |
| | 436,056 |
| | | 2.4 |
| | 7.3 |
| |
| Consumer loans | | 143,524 |
| | 138,829 |
| | 123,904 |
| | | 3.4 |
| | 15.8 |
| |
| Total loans | | 1,425,558 |
| | 1,368,474 |
| | 1,304,566 |
| | | 4.2 |
| | 9.3 |
| |
| Allowance for loan losses | | (16,395 | ) | | (16,002 | ) | | (15,488 | ) | | | 2.5 |
| | 5.9 |
| |
| Net loans | | 1,409,163 |
| | 1,352,472 |
| | 1,289,078 |
| | | 4.2 |
| | 9.3 |
| |
| Premises and equipment, net | | 21,315 |
| | 21,700 |
| | 23,371 |
| | | (1.8 | ) | | (8.8 | ) | |
| Bank owned life insurance ("BOLI") | | 26,323 |
| | 25,302 |
| | 24,710 |
| | | 4.0 |
| | 6.5 |
| |
| Deferred tax assets | | 5,559 |
| | 5,768 |
| | 5,350 |
| | | (3.6 | ) | | 3.9 |
| |
| Federal Home Loan Bank ("FHLB") stock | | 14,184 |
| | 10,899 |
| | 10,795 |
| | | 30.1 |
| | 31.4 |
| |
| Accrued interest receivable | | 6,984 |
| | 6,858 |
| | 6,399 |
| | | 1.8 |
| | 9.1 |
| |
| Other real estate owned ("OREO") | | 1,723 |
| | 1,723 |
| | 56 |
| | | — |
| | 2,976.8 |
| |
| Goodwill | | 1,516 |
| | 1,516 |
| | 1,516 |
| | | — |
| | — |
| |
| Other assets | | 7,595 |
| | 7,319 |
| | 8,635 |
| | | 3.8 |
| | (12.0 | ) | |
| Total assets | | $ | 1,718,942 |
| | $ | 1,664,308 |
| | $ | 1,579,157 |
| | | 3.3 | % | | 8.9 | % | |
| | | | | | | | | | | | | |
| LIABILITIES AND SHAREHOLDERS' EQUITY | | | | | | | | | | |
| Liabilities: | | | | | | | | | | | | |
| Deposits: | | | | | | | | | | | | |
| Noninterest-bearing demand | | $ | 279,793 |
| | $ | 279,238 |
| | $ | 270,152 |
| | | 0.2 | % | | 3.6 | % | |
| Interest-bearing demand | | 176,335 |
| | 179,661 |
| | 185,792 |
| | | (1.9 | ) | | (5.1 | ) | |
| Savings | | 389,795 |
| | 394,333 |
| | 394,727 |
| | | (1.2 | ) | | (1.2 | ) | |
| Time Deposits | | 404,191 |
| | 420,130 |
| | 357,016 |
| | | (3.8 | ) | | 13.2 |
| |
| Total deposits | | 1,250,114 |
| | 1,273,362 |
| | 1,207,687 |
| | | (1.8 | ) | | 3.5 |
| |
| Borrowed funds | | 283,000 |
| | 210,000 |
| | 210,000 |
| | | 34.8 |
| | 34.8 |
| |
| Subordinated debentures | | 10,310 |
| | 10,310 |
| | 10,310 |
| | | — |
| | — |
| |
| Accrued interest payable | | 455 |
| | 420 |
| | 406 |
| | | 8.3 |
| | 12.1 |
| |
| Accrued expenses and other liabilities | | 14,354 |
| | 15,332 |
| | 12,266 |
| | | (6.4 | ) | | 17.0 |
| |
| Total liabilities | | 1,558,233 |
| | 1,509,424 |
| | 1,440,669 |
| | | 3.2 |
| | 8.2 |
| |
| Shareholders' equity: | | | | | | | | | | | | |
| Common stock | | 90,113 |
| | 89,753 |
| | 88,484 |
| | | 0.4 |
| | 1.8 |
| |
| Retained earnings | | 70,442 |
| | 65,199 |
| | 50,161 |
| | | 8.0 |
| | 40.4 |
| |
| Accumulated other comprehensive (loss) income | | 154 |
| | (68 | ) | | (157 | ) | | | NM | | NM | |
| Total shareholders' equity | | 160,709 |
| | 154,884 |
| | 138,488 |
| | | 3.8 |
| | 16.0 |
| |
| Total liabilities and shareholders' equity | | $ | 1,718,942 |
| | $ | 1,664,308 |
| | $ | 1,579,157 |
| | | 3.3 | % | | 8.9 | % | |
| | | | | | | | | | | | | |
| Issued and outstanding common shares | | 10,881 |
| | 10,869 |
| | 10,780 |
| | | | | | |
NM=Not meaningful
UNITY BANCORP, INC.
QTD CONSOLIDATED STATEMENTS OF INCOME
December 31, 2019 |
| | | | | | | | | | | | | | | | | | | | | | | | | | | | |
| | | | | | | | | | | | | | | | | |
| | | | | | | | | | Dec 31, 2019 vs. | |
| | | For the three months ended | | | Sep 30, 2019 | | Dec 31, 2018 | |
| (In thousands, except percentages and per share amounts) | | Dec 31, 2019 | | Sep 30, 2019 | | Dec 31, 2018 | | | $ | | % | | $ | | % | |
| INTEREST INCOME | | | | | | | | | | | | | | | | |
| Federal funds sold, interest-bearing deposits and repos | | $ | 182 |
| | $ | 271 |
| | $ | 210 |
| | | $ | (89 | ) | | (32.8 | )% | | $ | (28 | ) | | (13.3 | )% | |
| FHLB stock | | 110 |
| | 82 |
| | 104 |
| | | 28 |
| | 34.1 |
| | 6 |
| | 5.8 |
| |
| Securities: | | | | | | | | | | | | | | | | |
| Taxable | | 527 |
| | 463 |
| | 466 |
| | | 64 |
| | 13.8 |
| | 61 |
| | 13.1 |
| |
| Tax-exempt | | 22 |
| | 26 |
| | 28 |
| | | (4 | ) | | (15.4 | ) | | (6 | ) | | (21.4 | ) | |
| Total securities | | 549 |
| | 489 |
| | 494 |
| | | 60 |
| | 12.3 |
| | 55 |
| | 11.1 |
| |
| Loans: | | | | | | | | | | | | | | | | |
| SBA loans | | 900 |
| | 943 |
| | 974 |
| | | (43 | ) | | (4.6 | ) | | (74 | ) | | (7.6 | ) | |
| Commercial loans | | 9,684 |
| | 9,467 |
| | 9,167 |
| | | 217 |
| | 2.3 |
| | 517 |
| | 5.6 |
| |
| Residential mortgage loans | | 5,782 |
| | 5,606 |
| | 5,172 |
| | | 176 |
| | 3.1 |
| | 610 |
| | 11.8 |
| |
| Consumer loans | | 2,105 |
| | 2,197 |
| | 1,939 |
| | | (92 | ) | | (4.2 | ) | | 166 |
| | 8.6 |
| |
| Total loans | | 18,471 |
| | 18,213 |
| | 17,252 |
| | | 258 |
| | 1.4 |
| | 1,219 |
| | 7.1 |
| |
| Total interest income | | 19,312 |
| | 19,055 |
| | 18,060 |
| | | 257 |
| | 1.3 |
| | 1,252 |
| | 6.9 |
| |
| INTEREST EXPENSE | | | | | | | | | | | | | | | | |
| Interest-bearing demand deposits | | 506 |
| | 438 |
| | 389 |
| | | 68 |
| | 15.5 |
| | 117 |
| | 30.1 |
| |
| Savings deposits | | 996 |
| | 1,194 |
| | 1,103 |
| | | (198 | ) | | (16.6 | ) | | (107 | ) | | (9.7 | ) | |
| Time deposits | | 2,439 |
| | 2,577 |
| | 1,861 |
| | | (138 | ) | | (5.4 | ) | | 578 |
| | 31.1 |
| |
| Borrowed funds and subordinated debentures | | 608 |
| | 442 |
| | 543 |
| | | 166 |
| | 37.6 |
| | 65 |
| | 12.0 |
| |
| Total interest expense | | 4,549 |
| | 4,651 |
| | 3,896 |
| | | (102 | ) | | (2.2 | ) | | 653 |
| | 16.8 |
| |
| Net interest income | | 14,763 |
| | 14,404 |
| | 14,164 |
| | | 359 |
| | 2.5 |
| | 599 |
| | 4.2 |
| |
| Provision for loan losses | | 500 |
| | 750 |
| | 500 |
| | | (250 | ) | | (33.3 | ) | | — |
| | — |
| |
| Net interest income after provision for loan losses | | 14,263 |
| | 13,654 |
| | 13,664 |
| | | 609 |
| | 4.5 |
| | 599 |
| | 4.4 |
| |
| NONINTEREST INCOME | | | | | | | | | | | | | | | | |
| Branch fee income | | 383 |
| | 373 |
| | 413 |
| | | 10 |
| | 2.7 |
| | (30 | ) | | (7.3 | ) | |
| Service and loan fee income | | 432 |
| | 522 |
| | 690 |
| | | (90 | ) | | (17.2 | ) | | (258 | ) | | (37.4 | ) | |
| Gain on sale of SBA loans held for sale, net | | 355 |
| | — |
| | 298 |
| | | 355 |
| | 10,000.0 |
| | 57 |
| | 19.1 |
| |
| Gain on sale of mortgage loans, net | | 565 |
| | 545 |
| | 277 |
| | | 20 |
| | 3.7 |
| | 288 |
| | 104.0 |
| |
| BOLI income | | 152 |
| | 138 |
| | 165 |
| | | 14 |
| | 10.1 |
| | (13 | ) | | (7.9 | ) | |
| Net security gains (losses) | | 157 |
| | 18 |
| | (193 | ) | | | 139 |
| | 772.2 |
| | 350 |
| | 181.3 |
| |
| Other income | | 352 |
| | 1,114 |
| | 304 |
| | | (762 | ) | | (68.4 | ) | | 48 |
| | 15.8 |
| |
| Total noninterest income | | 2,396 |
| | 2,710 |
| | 1,954 |
| | | (314 | ) | | (11.6 | ) | | 442 |
| | 22.6 |
| |
| NONINTEREST EXPENSE | | | | | | | | | | | | | | | | |
| Compensation and benefits | | 5,282 |
| | 5,353 |
| | 4,845 |
| | | (71 | ) | | (1.3 | ) | | 437 |
| | 9.0 |
| |
| Occupancy | | 652 |
| | 651 |
| | 681 |
| | | 1 |
| | 0.2 |
| | (29 | ) | | (4.3 | ) | |
| Processing and communications | | 711 |
| | 749 |
| | 716 |
| | | (38 | ) | | (5.1 | ) | | (5 | ) | | (0.7 | ) | |
| Furniture and equipment | | 806 |
| | 711 |
| | 616 |
| | | 95 |
| | 13.4 |
| | 190 |
| | 30.8 |
| |
| Professional services | | 222 |
| | 274 |
| | 252 |
| | | (52 | ) | | (19.0 | ) | | (30 | ) | | (11.9 | ) | |
| Loan collection & OREO expenses (recoveries) | | 33 |
| | (48 | ) | | 31 |
| | | 81 |
| | 168.8 |
| | 2 |
| | 6.5 |
| |
| Other loan expenses (income) | | 70 |
| | 89 |
| | (2 | ) | | | (19 | ) | | (21.3 | ) | | 72 |
| | 3,600.0 |
| |
| Deposit insurance | | — |
| | — |
| | 189 |
| | | — |
| | — |
| | (189 | ) | | (100.0 | ) | |
| Advertising | | 302 |
| | 334 |
| | 360 |
| | | (32 | ) | | (9.6 | ) | | (58 | ) | | (16.1 | ) | |
| Director fees | | 175 |
| | 171 |
| | 169 |
| | | 4 |
| | 2.3 |
| | 6 |
| | 3.6 |
| |
| Other expenses | | 466 |
| | 445 |
| | 411 |
| | | 21 |
| | 4.7 |
| | 55 |
| | 13.4 |
| |
| Total noninterest expense | | 8,719 |
| | 8,729 |
| | 8,268 |
| | | (10 | ) | | (0.1 | ) | | 451 |
| | 5.5 |
| |
| Income before provision for income taxes | | 7,940 |
| | 7,635 |
| | 7,350 |
| | | 305 |
| | 4.0 |
| | 590 |
| | 8.0 |
| |
| Provision for income taxes | | 1,820 |
| | 1,676 |
| | 1,547 |
| | | 144 |
| | 8.6 |
| | 273 |
| | 17.6 |
| |
| Net income | | $ | 6,120 |
| | $ | 5,959 |
| | $ | 5,803 |
| | | $ | 161 |
| | 2.7 | % | | $ | 317 |
| | 5.5 | % | |
|
| | | | | | | | | | | | | | | | | | | | | | | | | | | | |
| | | | | | | | | | | | | | | | | |
| Effective tax rate | | 22.9 | % | | 22.0 | % | | 21.0 | % | | | | | | | | | | |
| | | | | | | | | | | | | | | | | |
| Net income per common share - Basic | | $ | 0.56 |
| | $ | 0.55 |
| | $ | 0.54 |
| | | | | | | | | | |
| Net income per common share - Diluted | | $ | 0.55 |
| | $ | 0.54 |
| | $ | 0.53 |
| | | | | | | | | | |
| | | | | | | | | | | | | | | | | |
| Weighted average common shares outstanding - Basic | | 10,872 |
| | 10,863 |
| | 10,765 |
| | | | | | | | | | |
| Weighted average common shares outstanding - Diluted | | 11,057 |
| | 11,036 |
| | 10,935 |
| | | | | | | | | | |
UNITY BANCORP, INC.
YTD CONSOLIDATED STATEMENTS OF INCOME
December 31, 2019 |
| | | | | | | | | | | | | | | | | |
| | | | | | | | | | | |
| | | For the twelve months ended December 31, | | | Current YTD vs Prior YTD | |
| (In thousands, except percentages and per share amounts) | | 2019 | | 2018 | | | $ | | % | |
| INTEREST INCOME | | | | | | | | | | |
| Federal funds sold, interest-bearing deposits and repos | | $ | 906 |
| | $ | 773 |
| | | $ | 133 |
| | 17.2 | % | |
| FHLB stock | | 385 |
| | 462 |
| | | (77 | ) | | (16.7 | ) | |
| Securities: | | | | | | | | | | |
| Taxable | | 1,926 |
| | 1,907 |
| | | 19 |
| | 1.0 |
| |
| Tax-exempt | | 104 |
| | 117 |
| | | (13 | ) | | (11.1 | ) | |
| Total securities | | 2,030 |
| | 2,024 |
| | | 6 |
| | 0.3 |
| |
| Loans: | | | | | | | | | | |
| SBA loans | | 3,780 |
| | 4,338 |
| | | (558 | ) | | (12.9 | ) | |
| Commercial loans | | 37,577 |
| | 33,886 |
| | | 3,691 |
| | 10.9 |
| |
| Residential mortgage loans | | 22,483 |
| | 18,837 |
| | | 3,646 |
| | 19.4 |
| |
| Consumer loans | | 8,487 |
| | 6,943 |
| | | 1,544 |
| | 22.2 |
| |
| Total loans | | 72,327 |
| | 64,004 |
| | | 8,323 |
| | 13.0 |
| |
| Total interest income | | 75,648 |
| | 67,263 |
| | | 8,385 |
| | 12.5 |
| |
| INTEREST EXPENSE | | | | | | | | | | |
| Interest-bearing demand deposits | | 1,795 |
| | 1,202 |
| | | 593 |
| | 49.3 |
| |
| Savings deposits | | 4,497 |
| | 3,871 |
| | | 626 |
| | 16.2 |
| |
| Time deposits | | 9,460 |
| | 5,903 |
| | | 3,557 |
| | 60.3 |
| |
| Borrowed funds and subordinated debentures | | 2,303 |
| | 2,540 |
| | | (237 | ) | | (9.3 | ) | |
| Total interest expense | | 18,055 |
| | 13,516 |
| | | 4,539 |
| | 33.6 |
| |
| Net interest income | | 57,593 |
| | 53,747 |
| | | 3,846 |
| | 7.2 |
| |
| Provision for loan losses | | 2,100 |
| | 2,050 |
| | | 50 |
| | 2.4 |
| |
| Net interest income after provision for loan losses | | 55,493 |
| | 51,697 |
| | | 3,796 |
| | 7.3 |
| |
| NONINTEREST INCOME | | | | | | | | | | |
| Branch fee income | | 1,502 |
| | 1,519 |
| | | (17 | ) | | (1.1 | ) | |
| Service and loan fee income | | 1,965 |
| | 2,130 |
| | | (165 | ) | | (7.7 | ) | |
| Gain on sale of SBA loans held for sale, net | | 909 |
| | 1,680 |
| | | (771 | ) | | (45.9 | ) | |
| Gain on sale of mortgage loans, net | | 2,090 |
| | 1,719 |
| | | 371 |
| | 21.6 |
| |
| BOLI income | | 588 |
| | 975 |
| | | (387 | ) | | (39.7 | ) | |
| Net security gains (losses) | | 373 |
| | (199 | ) | | | 572 |
| | 287.4 |
| |
| Other income | | 2,112 |
| | 1,207 |
| | | 905 |
| | 75.0 |
| |
| Total noninterest income | | 9,539 |
| | 9,031 |
| | | 508 |
| | 5.6 |
| |
| NONINTEREST EXPENSE | | | | | | | | | | |
| Compensation and benefits | | 20,666 |
| | 20,119 |
| | | 547 |
| | 2.7 |
| |
| Occupancy | | 2,650 |
| | 2,739 |
| | | (89 | ) | | (3.2 | ) | |
| Processing and communications | | 2,924 |
| | 2,788 |
| | | 136 |
| | 4.9 |
| |
| Furniture and equipment | | 2,894 |
| | 2,348 |
| | | 546 |
| | 23.3 |
| |
| Professional services | | 1,061 |
| | 934 |
| | | 127 |
| | 13.6 |
| |
| Loan collection & OREO expenses (recoveries) | | 41 |
| | (361 | ) | | | 402 |
| | 111.4 |
| |
| Other loan expenses | | 272 |
| | 208 |
| | | 64 |
| | 30.8 |
| |
| Deposit insurance | | 301 |
| | 782 |
| | | (481 | ) | | (61.5 | ) | |
| Advertising | | 1,358 |
| | 1,411 |
| | | (53 | ) | | (3.8 | ) | |
| Director fees | | 673 |
| | 671 |
| | | 2 |
| | 0.3 |
| |
| Other expenses | | 1,877 |
| | 1,782 |
| | | 95 |
| | 5.3 |
| |
| Total noninterest expense | | 34,717 |
| | 33,421 |
| | | 1,296 |
| | 3.9 |
| |
| Income before provision for income taxes | | 30,315 |
| | 27,307 |
| | | 3,008 |
| | 11.0 |
| |
| Provision for income taxes | | 6,662 |
| | 5,388 |
| | | 1,274 |
| | 23.6 |
| |
| Net income | | $ | 23,653 |
| | $ | 21,919 |
| | | $ | 1,734 |
| | 7.9 | % | |
| | | | | | | | | | | |
|
| | | | | | | | | | | | | | | | | |
| Effective tax rate | | 22.0 | % | | 19.7 | % | | | | | | |
| | | | | | | | | | | |
| Net income per common share - Basic | | $ | 2.18 |
| | $ | 2.04 |
| | | | | | |
| Net income per common share - Diluted | | $ | 2.14 |
| | $ | 2.01 |
| | | | | | |
| | | | | | | | | | | |
| Weighted average common shares outstanding - Basic | | 10,845 |
| | 10,726 |
| | | | | | |
| Weighted average common shares outstanding - Diluted | | 11,029 |
| | 10,916 |
| | | | | | |
UNITY BANCORP, INC.
QUARTER TO DATE NET INTEREST MARGIN
December 31, 2019
|
| | | | | | | | | | | | | | | | | | | | | | |
| (Dollar amounts in thousands, interest amounts and interest rates/yields on a fully tax-equivalent basis) |
| | | For the three months ended |
| | | December 31, 2019 | | December 31, 2018 |
| | | Average Balance | | Interest | | Rate/Yield | | Average Balance | | Interest | | Rate/Yield |
| ASSETS | | | | | | | | | | | | |
| Interest-earning assets: | | | | | | | | | | | | |
| Federal funds sold, interest-bearing deposits and repos | | $ | 44,147 |
| | $ | 182 |
| | 1.64 | % | | $ | 34,551 |
| | $ | 210 |
| | 2.41 | % |
| FHLB stock | | 6,949 |
| | 110 |
| | 6.28 |
| | 5,762 |
| | 104 |
| | 7.16 |
|
| Securities: | | | | | | | | | | | | |
| Taxable | | 62,986 |
| | 527 |
| | 3.32 |
| | 58,350 |
| | 466 |
| | 3.17 |
|
| Tax-exempt | | 4,106 |
| | 27 |
| | 2.61 |
| | 4,776 |
| | 35 |
| | 2.91 |
|
| Total securities (A) | | 67,092 |
| | 554 |
| | 3.28 |
| | 63,126 |
| | 501 |
| | 3.15 |
|
| Loans: | | | | | | | | | | | | |
| SBA loans | | 50,016 |
| | 900 |
| | 7.14 |
| | 53,803 |
| | 974 |
| | 7.18 |
|
| Commercial loans | | 742,071 |
| | 9,684 |
| | 5.18 |
| | 698,609 |
| | 9,167 |
| | 5.21 |
|
| Residential mortgage loans | | 460,450 |
| | 5,782 |
| | 4.98 |
| | 423,674 |
| | 5,172 |
| | 4.84 |
|
| Consumer loans | | 140,458 |
| | 2,105 |
| | 5.95 |
| | 121,214 |
| | 1,939 |
| | 6.35 |
|
| Total loans (B) | | 1,392,995 |
| | 18,471 |
| | 5.26 |
| | 1,297,300 |
| | 17,252 |
| | 5.28 |
|
| Total interest-earning assets | | $ | 1,511,183 |
| | $ | 19,317 |
| | 5.07 | % | | $ | 1,400,739 |
| | $ | 18,067 |
| | 5.12 | % |
| | | | | | | | | | | | | |
| Noninterest-earning assets: | | | | | | | | | | | | |
| Cash and due from banks | | 27,964 |
| | | | | | 25,410 |
| | | | |
| Allowance for loan losses | | (16,293 | ) | | | | | | (15,266 | ) | | | | |
| Other assets | | 69,226 |
| | | | | | 66,925 |
| | | | |
| Total noninterest-earning assets | | 80,897 |
| | | | | | 77,069 |
| | | | |
| Total assets | | $ | 1,592,080 |
| | | | | | $ | 1,477,808 |
| | | | |
| | | | | | | | | | | | | |
| LIABILITIES AND SHAREHOLDERS' EQUITY | | | | | | | | |
| Interest-bearing liabilities: | | | | | | | | | | | | |
| Total interest-bearing demand deposits | | $ | 196,638 |
| | $ | 506 |
| | 1.02 | % | | $ | 187,827 |
| | $ | 389 |
| | 0.82 | % |
| Total savings deposits | | 397,401 |
| | 996 |
| | 0.99 |
| | 406,681 |
| | 1,103 |
| | 1.08 |
|
| Total time deposits | | 411,445 |
| | 2,439 |
| | 2.35 |
| | 356,520 |
| | 1,861 |
| | 2.07 |
|
| Total interest-bearing deposits | | 1,005,484 |
| | 3,941 |
| | 1.56 |
| | 951,028 |
| | 3,353 |
| | 1.40 |
|
| Borrowed funds and subordinated debentures | | 132,533 |
| | 608 |
| | 1.82 |
| | 108,465 |
| | 543 |
| | 1.99 |
|
| Total interest-bearing liabilities | | $ | 1,138,017 |
| | $ | 4,549 |
| | 1.59 | % | | $ | 1,059,493 |
| | $ | 3,896 |
| | 1.46 | % |
| | | | | | | | | | | | | |
| Noninterest-bearing liabilities: | | | | | | | | | | | | |
| Noninterest-bearing demand deposits | | 279,925 |
| | | | | | 271,440 |
| | | | |
| Other liabilities | | 16,611 |
| | | | | | 11,454 |
| | | | |
| Total noninterest-bearing liabilities | | 296,536 |
| | | | | | 282,894 |
| | | | |
| Total shareholders' equity | | 157,527 |
| | | | | | 135,421 |
| | | | |
| Total liabilities and shareholders' equity | | $ | 1,592,080 |
| | | | | | $ | 1,477,808 |
| | | | |
| | | | | | | | | | | | | |
| Net interest spread | | | | $ | 14,768 |
| | 3.48 | % | | | | $ | 14,171 |
| | 3.66 | % |
| Tax-equivalent basis adjustment | | | | (5 | ) | | | | | | (7 | ) | | |
| Net interest income | | | | $ | 14,763 |
| | | | | | $ | 14,164 |
| | |
| Net interest margin | | | | | | 3.88 | % | | | | | | 4.01 | % |
| |
| (A) | Yields related to securities exempt from federal and state income taxes are stated on a fully tax-equivalent basis. They are reduced by the nondeductable portion of interest expense, assuming a federal tax rate of 21 percent and applicable state rates. |
| |
| (B) | The loan averages are stated net of unearned income, and the averages include loans on which the accrual of interest has been discontinued. |
UNITY BANCORP, INC.
QUARTER TO DATE NET INTEREST MARGIN
December 31, 2019
|
| | | | | | | | | | | | | | | | | | | | | | |
| (Dollar amounts in thousands, interest amounts and interest rates/yields on a fully tax-equivalent basis) |
| | | For the three months ended |
| | | December 31, 2019 | | September 30, 2019 |
| | | Average Balance | | Interest | | Rate/Yield | | Average Balance | | Interest | | Rate/Yield |
| ASSETS | | | | | | | | | | | | |
| Interest-earning assets: | | | | | | | | | | | | |
| Federal funds sold, interest-bearing deposits and repos | | $ | 44,147 |
| | $ | 182 |
| | 1.64 | % | | $ | 51,744 |
| | $ | 271 |
| | 2.08 | % |
| FHLB stock | | 6,949 |
| | 110 |
| | 6.28 |
| | 5,138 |
| | 82 |
| | 6.33 |
|
| Securities: | | | | | | | | | | | | |
| Taxable | | 62,986 |
| | 527 |
| | 3.32 |
| | 58,144 |
| | 463 |
| | 3.16 |
|
| Tax-exempt | | 4,106 |
| | 27 |
| | 2.61 |
| | 4,418 |
| | 32 |
| | 2.87 |
|
| Total securities (A) | | 67,092 |
| | 554 |
| | 3.28 |
| | 62,562 |
| | 495 |
| | 3.14 |
|
| Loans: | | | | | | | | | | | | |
| SBA loans | | 50,016 |
| | 900 |
| | 7.14 |
| | 47,187 |
| | 943 |
| | 7.93 |
|
| Commercial loans | | 742,071 |
| | 9,684 |
| | 5.18 |
| | 713,785 |
| | 9,467 |
| | 5.26 |
|
| Residential mortgage loans | | 460,450 |
| | 5,782 |
| | 4.98 |
| | 450,105 |
| | 5,606 |
| | 4.94 |
|
| Consumer loans | | 140,458 |
| | 2,105 |
| | 5.95 |
| | 136,239 |
| | 2,197 |
| | 6.40 |
|
| Total loans (B) | | 1,392,995 |
| | 18,471 |
| | 5.26 |
| | 1,347,316 |
| | 18,213 |
| | 5.36 |
|
| Total interest-earning assets | | $ | 1,511,183 |
| | $ | 19,317 |
| | 5.07 | % | | $ | 1,466,760 |
| | $ | 19,061 |
| | 5.16 | % |
| | | | | | | | | | | | | |
| Noninterest-earning assets: | | | | | | | | | | | | |
| Cash and due from banks | | 27,964 |
| | | | | | 24,345 |
| | | | |
| Allowance for loan losses | | (16,293 | ) | | | | | | (16,224 | ) | | | | |
| Other assets | | 69,226 |
| | | | | | 70,484 |
| | | | |
| Total noninterest-earning assets | | 80,897 |
| | | | | | 78,605 |
| | | | |
| Total assets | | $ | 1,592,080 |
| | | | | | $ | 1,545,365 |
| | | | |
| | | | | | | | | | | | | |
| LIABILITIES AND SHAREHOLDERS' EQUITY | | | | | | | | |
| Interest-bearing liabilities: | | | | | | | | | | | | |
| Total interest-bearing demand deposits | | $ | 196,638 |
| | $ | 506 |
| | 1.02 | % | | $ | 176,953 |
| | $ | 438 |
| | 0.98 | % |
| Total savings deposits | | 397,401 |
| | 996 |
| | 0.99 |
| | 398,676 |
| | 1,194 |
| | 1.19 |
|
| Total time deposits | | 411,445 |
| | 2,439 |
| | 2.35 |
| | 432,035 |
| | 2,577 |
| | 2.37 |
|
| Total interest-bearing deposits | | 1,005,484 |
| | 3,941 |
| | 1.56 |
| | 1,007,664 |
| | 4,209 |
| | 1.66 |
|
| Borrowed funds and subordinated debentures | | 132,533 |
| | 608 |
| | 1.82 |
| | 92,326 |
| | 442 |
| | 1.90 |
|
| Total interest-bearing liabilities | | $ | 1,138,017 |
| | $ | 4,549 |
| | 1.59 | % | | $ | 1,099,990 |
| | $ | 4,651 |
| | 1.68 | % |
| | | | | | | | | | | | | |
| Noninterest-bearing liabilities: | | | | | | | | | | | | |
| Noninterest-bearing demand deposits | | 279,925 |
| | | | | | 279,150 |
| | | | |
| Other liabilities | | 16,611 |
| | | | | | 14,364 |
| | | | |
| Total noninterest-bearing liabilities | | 296,536 |
| | | | | | 293,514 |
| | | | |
| Total shareholders' equity | | 157,527 |
| | | | | | 151,861 |
| | | | |
| Total liabilities and shareholders' equity | | $ | 1,592,080 |
| | | | | | $ | 1,545,365 |
| | | | |
| | | | | | | | | | | | | |
| Net interest spread | | | | $ | 14,768 |
| | 3.48 | % | | | | $ | 14,410 |
| | 3.48 | % |
| Tax-equivalent basis adjustment | | | | (5 | ) | | | | | | (6 | ) | | |
| Net interest income | | | | $ | 14,763 |
| | | | | | $ | 14,404 |
| | |
| Net interest margin | | | | | | 3.88 | % | | | | | | 3.90 | % |
| |
| (A) | Yields related to securities exempt from federal and state income taxes are stated on a fully tax-equivalent basis. They are reduced by the nondeductable portion of interest expense, assuming a federal tax rate of 21 percent and applicable state rates. |
| |
| (B) | The loan averages are stated net of unearned income, and the averages include loans on which the accrual of interest has been discontinued. |
UNITY BANCORP, INC.
YEAR TO DATE NET INTEREST MARGIN
December 31, 2019
|
| | | | | | | | | | | | | | | | | | | | | | |
| (Dollar amounts in thousands, interest amounts and interest rates/yields on a fully tax-equivalent basis) |
| | | For the twelve months ended |
| | | December 31, 2019 | | December 31, 2018 |
| | | Average Balance | | Interest | | Rate/Yield | | Average Balance | | Interest | | Rate/Yield |
| ASSETS | | | | | | | | | | | | |
| Interest-earning assets: | | | | | | | | | | | | |
| Federal funds sold, interest-bearing deposits and repos | | $ | 43,305 |
| | $ | 906 |
| | 2.09 | % | | $ | 40,700 |
| | $ | 773 |
| | 1.90 | % |
| FHLB stock | | 6,066 |
| | 385 |
| | 6.35 |
| | 6,786 |
| | 462 |
| | 6.81 |
|
| Securities: | | | | | | | | | | | | |
| Taxable | | 59,459 |
| | 1,926 |
| | 3.24 |
| | 60,734 |
| | 1,907 |
| | 3.14 |
|
| Tax-exempt | | 4,394 |
| | 129 |
| | 2.94 |
| | 5,104 |
| | 145 |
| | 2.84 |
|
| Total securities (A) | | 63,853 |
| | 2,055 |
| | 3.22 |
| | 65,838 |
| | 2,052 |
| | 3.12 |
|
| Loans: | | | | | | | | | | | | |
| SBA loans | | 48,686 |
| | 3,780 |
| | 7.76 |
| | 60,321 |
| | 4,338 |
| | 7.19 |
|
| Commercial loans | | 715,301 |
| | 37,577 |
| | 5.25 |
| | 668,144 |
| | 33,886 |
| | 5.07 |
|
| Residential mortgage loans | | 449,003 |
| | 22,483 |
| | 5.01 |
| | 396,731 |
| | 18,837 |
| | 4.75 |
|
| Consumer loans | | 133,918 |
| | 8,487 |
| | 6.34 |
| | 116,311 |
| | 6,943 |
| | 5.97 |
|
| Total loans (B) | | 1,346,908 |
| | 72,327 |
| | 5.37 |
| | 1,241,507 |
| | 64,004 |
| | 5.16 |
|
| Total interest-earning assets | | $ | 1,460,132 |
| | $ | 75,673 |
| | 5.18 | % | | $ | 1,354,831 |
| | $ | 67,291 |
| | 4.97 | % |
| | | | | | | | | | | | | |
| Noninterest-earning assets: | | | | | | | | | | | | |
| Cash and due from banks | | 25,761 |
| | | | | | 24,598 |
| | | | |
| Allowance for loan losses | | (16,058 | ) | | | | | | (14,640 | ) | | | | |
| Other assets | | 69,987 |
| | | | | | 65,770 |
| | | | |
| Total noninterest-earning assets | | 79,690 |
| | | | | | 75,728 |
| | | | |
| Total assets | | $ | 1,539,822 |
| | | | | | $ | 1,430,559 |
| | | | |
| | | | | | | | | | | | | |
| LIABILITIES AND SHAREHOLDERS' EQUITY | | | | | | | | |
| Interest-bearing liabilities: | | | | | | | | | | | | |
| Total interest-bearing demand deposits | | $ | 182,540 |
| | $ | 1,795 |
| | 0.98 | % | | $ | 177,022 |
| | $ | 1,202 |
| | 0.68 | % |
| Total savings deposits | | 397,122 |
| | 4,497 |
| | 1.13 |
| | 404,613 |
| | 3,871 |
| | 0.96 |
|
| Total time deposits | | 409,406 |
| | 9,460 |
| | 2.31 |
| | 314,224 |
| | 5,903 |
| | 1.88 |
|
| Total interest-bearing deposits | | 989,068 |
| | 15,752 |
| | 1.59 |
| | 895,859 |
| | 10,976 |
| | 1.23 |
|
| Borrowed funds and subordinated debentures | | 113,511 |
| | 2,303 |
| | 2.03 |
| | 134,664 |
| | 2,540 |
| | 1.89 |
|
| Total interest-bearing liabilities | | $ | 1,102,579 |
| | $ | 18,055 |
| | 1.64 | % | | $ | 1,030,523 |
| | $ | 13,516 |
| | 1.32 | % |
| | | | | | | | | | | | | |
| Noninterest-bearing liabilities: | | | | | | | | | | | | |
| Noninterest-bearing demand deposits | | 273,338 |
| | | | | | 261,976 |
| | | | |
| Other liabilities | | 14,755 |
| | | | | | 9,903 |
| | | | |
| Total noninterest-bearing liabilities | | 288,093 |
| | | | | | 271,879 |
| | | | |
| Total shareholders' equity | | 149,150 |
| | | | | | 128,157 |
| | | | |
| Total liabilities and shareholders' equity | | $ | 1,539,822 |
| | | | | | $ | 1,430,559 |
| | | | |
| | | | | | | | | | | | | |
| Net interest spread | | | | $ | 57,618 |
| | 3.54 | % | | | | $ | 53,775 |
| | 3.65 | % |
| Tax-equivalent basis adjustment | | | | (25 | ) | | | | | | (28 | ) | | |
| Net interest income | | | | $ | 57,593 |
| | | | | | $ | 53,747 |
| | |
| Net interest margin | | | | | | 3.95 | % | | | | | | 3.97 | % |
| |
| (A) | Yields related to securities exempt from federal and state income taxes are stated on a fully tax-equivalent basis. They are reduced by the nondeductable portion of interest expense, assuming a federal tax rate of 21 percent and applicable state rates. |
| |
| (B) | The loan averages are stated net of unearned income, and the averages include loans on which the accrual of interest has been discontinued. |
UNITY BANCORP, INC.
QUARTERLY ALLOWANCE FOR LOAN LOSSES AND LOAN QUALITY SCHEDULES
December 31, 2019
|
| | | | | | | | | | | | | | | | | | | | |
| Amounts in thousands, except percentages | | Dec 31, 2019 | | Sep 30, 2019 | | Jun 30, 2019 | | Mar 31, 2019 | | Dec 31, 2018 |
| ALLOWANCE FOR LOAN LOSSES: | | | | | | | | | | |
| Balance, beginning of period | | $ | 16,002 |
| | $ | 15,965 |
| | $ | 15,684 |
| | $ | 15,488 |
| | $ | 14,988 |
|
| Provision for loan losses charged to expense | | 500 |
| | 750 |
| | 350 |
| | 500 |
| | 500 |
|
| | | 16,502 |
| | 16,715 |
| | 16,034 |
| | 15,988 |
| | 15,488 |
|
| Less: Chargeoffs | | | | | | | | | | |
| SBA loans | | 43 |
| | 98 |
| | 85 |
| | 308 |
| | — |
|
| Commercial loans | | — |
| | 500 |
| | — |
| | 1 |
| | 10 |
|
| Residential mortgage loans | | 75 |
| | 130 |
| | — |
| | — |
| | — |
|
| Consumer loans | | — |
| | — |
| | — |
| | 1 |
| | — |
|
| Total chargeoffs | | 118 |
| | 728 |
| | 85 |
| | 310 |
| | 10 |
|
| Add: Recoveries | | | | | | | | | | |
| SBA loans | | 7 |
| | 12 |
| | 2 |
| | 1 |
| | 4 |
|
| Commercial loans | | 4 |
| | 3 |
| | 4 |
| | 5 |
| | 5 |
|
| Residential mortgage loans | | — |
| | — |
| | — |
| | — |
| | — |
|
| Consumer loans | | — |
| | — |
| | 10 |
| | — |
| | 1 |
|
| Total recoveries | | 11 |
| | 15 |
| | 16 |
| | 6 |
| | 10 |
|
| Net chargeoffs | | 107 |
| | 713 |
| | 69 |
| | 304 |
| | — |
|
| Balance, end of period | | $ | 16,395 |
| | $ | 16,002 |
| | $ | 15,965 |
| | $ | 15,684 |
| | $ | 15,488 |
|
| | | | | | | | | | | |
| LOAN QUALITY INFORMATION: | | | | | | | | | | |
| Nonperforming loans: | | | | | | | | | | |
| SBA loans | | $ | 1,164 |
| | $ | 503 |
| | $ | 437 |
| | $ | 814 |
| | $ | 1,560 |
|
| Commercial loans | | 529 |
| | 629 |
| | 54 |
| | 1,046 |
| | 1,076 |
|
| Residential mortgage loans | | 3,936 |
| | 4,427 |
| | 3,924 |
| | 5,243 |
| | 4,211 |
|
| Consumer loans | | 20 |
| | 23 |
| | — |
| | 171 |
| | 26 |
|
| Total nonperforming loans (1) | | 5,649 |
| | 5,582 |
| | 4,415 |
| | 7,274 |
| | 6,873 |
|
| Other real estate owned ("OREO") | | 1,723 |
| | 1,723 |
| | 921 |
| | 273 |
| | 56 |
|
| Nonperforming assets | | 7,372 |
| | 7,305 |
| | 5,336 |
| | 7,547 |
| | 6,929 |
|
| Less: Amount guaranteed by SBA | | 59 |
| | 63 |
| | 68 |
| | 68 |
| | 89 |
|
| Net nonperforming assets | | $ | 7,313 |
| | $ | 7,242 |
| | $ | 5,268 |
| | $ | 7,479 |
| | $ | 6,840 |
|
| | | | | | | | | | | |
| Loans 90 days past due & still accruing | | $ | 930 |
| | $ | 140 |
| | $ | — |
| | $ | 39 |
| | $ | 98 |
|
| | | | | | | | | | | |
| Performing Troubled Debt Restructurings (TDRs) | | $ | 705 |
| | $ | 718 |
| | $ | 728 |
| | $ | 738 |
| | $ | 745 |
|
| (1) Nonperforming TDRs included in nonperforming loans | | — |
| | — |
| | — |
| | — |
| | — |
|
| Total TDRs | | $ | 705 |
| | $ | 718 |
| | $ | 728 |
| | $ | 738 |
| | $ | 745 |
|
| | | | | | | | | | | |
| Allowance for loan losses to: | | | | | | | | | | |
| Total loans at quarter end | | 1.15 | % | | 1.17 | % | | 1.19 | % | | 1.19 | % | | 1.19 | % |
| Nonperforming loans (1) | | 290.43 |
| | 286.67 |
| | 361.61 |
| | 215.62 |
| | 225.35 |
|
| Nonperforming assets | | 222.40 |
| | 219.06 |
| | 299.19 |
| | 207.82 |
| | 223.52 |
|
| Net nonperforming assets | | 224.19 |
| | 220.96 |
| | 303.06 |
| | 209.71 |
| | 226.43 |
|
| | | | | | | | | | | |
| QTD net chargeoffs (recoveries) (annualized) to QTD average loans: | | | | | | | | | | |
| SBA loans | | 0.29 | % | | 0.72 | % | | 0.70 | % | | 2.49 | % | | (0.03 | )% |
| Commercial loans | | — |
| | 0.28 |
| | — |
| | — |
| | — |
|
| Residential mortgage loans | | 0.06 |
| | 0.11 |
| | — |
| | — |
| | — |
|
| Consumer loans | | — |
| | — |
| | (0.03 | ) | | — |
| | — |
|
| Total loans | | 0.03 | % | | 0.21 | % | | 0.02 | % | | 0.09 | % | | — | % |
| | | | | | | | | | | |
| Nonperforming loans to total loans | | 0.40 | % | | 0.41 | % | | 0.33 | % | | 0.55 | % | | 0.53 | % |
| Nonperforming loans and TDRs to total loans | | 0.45 |
| | 0.46 |
| | 0.38 |
| | 0.61 |
| | 0.58 |
|
| Nonperforming assets to total loans and OREO | | 0.52 |
| | 0.53 |
| | 0.40 |
| | 0.57 |
| | 0.53 |
|
| Nonperforming assets to total assets | | 0.43 |
| | 0.44 |
| | 0.33 |
| | 0.47 |
| | 0.44 |
|
UNITY BANCORP, INC.
QUARTERLY FINANCIAL DATA
December 31, 2019
|
| | | | | | | | | | | | | | | | | | | | |
| (In thousands, except percentages and per share amounts) | | Dec 31, 2019 | | Sep 30, 2019 | | Jun 30, 2019 | | Mar 31, 2019 | | Dec 31, 2018 |
| SUMMARY OF INCOME: | | | | | | | | | | |
| Total interest income | | $ | 19,312 |
| | $ | 19,055 |
| | $ | 18,781 |
| | $ | 18,500 |
| | $ | 18,060 |
|
| Total interest expense | | 4,549 |
| | 4,651 |
| | 4,571 |
| | 4,284 |
| | 3,896 |
|
| Net interest income | | 14,763 |
| | 14,404 |
| | 14,210 |
| | 14,216 |
| | 14,164 |
|
| Provision for loan losses | | 500 |
| | 750 |
| | 350 |
| | 500 |
| | 500 |
|
| Net interest income after provision for loan losses | | 14,263 |
| | 13,654 |
| | 13,860 |
| | 13,716 |
| | 13,664 |
|
| Total noninterest income | | 2,396 |
| | 2,710 |
| | 2,411 |
| | 2,022 |
| | 1,954 |
|
| Total noninterest expense | | 8,719 |
| | 8,729 |
| | 8,791 |
| | 8,478 |
| | 8,268 |
|
| Income before provision for income taxes | | 7,940 |
| | 7,635 |
| | 7,480 |
| | 7,260 |
| | 7,350 |
|
| Provision for income taxes | | 1,820 |
| | 1,676 |
| | 1,646 |
| | 1,520 |
| | 1,547 |
|
| Net income | | $ | 6,120 |
| | $ | 5,959 |
| | $ | 5,834 |
| | $ | 5,740 |
| | $ | 5,803 |
|
| | | | | | | | | | | |
| Net income per common share - Basic | | $ | 0.56 |
| | $ | 0.55 |
| | $ | 0.54 |
| | $ | 0.53 |
| | $ | 0.54 |
|
| Net income per common share - Diluted | | $ | 0.55 |
| | $ | 0.54 |
| | $ | 0.53 |
| | $ | 0.52 |
| | $ | 0.53 |
|
| | | | | | | | | | | |
| COMMON SHARE DATA: | | | | | | | | | | |
| Market price per share | | $ | 22.57 |
| | $ | 22.15 |
| | $ | 22.70 |
| | $ | 18.88 |
| | $ | 20.76 |
|
| Dividends paid | | $ | 0.08 |
| | $ | 0.08 |
| | $ | 0.08 |
| | $ | 0.07 |
| | $ | 0.07 |
|
| Book value per common share | | $ | 14.77 |
| | $ | 14.25 |
| | $ | 13.76 |
| | $ | 13.28 |
| | $ | 12.85 |
|
| | | | | | | | | | | |
| Weighted average common shares outstanding - Basic | | 10,872 |
| | 10,863 |
| | 10,843 |
| | 10,801 |
| | 10,765 |
|
| Weighted average common shares outstanding - Diluted | | 11,057 |
| | 11,036 |
| | 11,026 |
| | 10,955 |
| | 10,935 |
|
| Issued and outstanding common shares | | 10,881 |
| | 10,869 |
| | 10,856 |
| | 10,822 |
| | 10,780 |
|
| | | | | | | | | | | |
| PERFORMANCE RATIOS (Annualized): | | | | | | | | | | |
| Return on average assets | | 1.53 | % | | 1.53 | % | | 1.54 | % | | 1.55 | % | | 1.56 | % |
| Return on average equity | | 15.41 |
| | 15.57 |
| | 16.01 |
| | 16.52 |
| | 17.00 |
|
| Efficiency ratio | | 51.29 |
| | 51.06 |
| | 53.20 |
| | 52.53 |
| | 50.69 |
|
| Noninterest expense to average assets | | 2.17 |
| | 2.24 |
| | 2.32 |
| | 2.29 |
| | 2.22 |
|
| | | | | | | | | | | |
| BALANCE SHEET DATA: | | | | | | | | | | |
| Total assets | | 1,718,942 |
| | 1,664,308 |
| | 1,626,737 |
| | 1,590,046 |
| | 1,579,157 |
|
| Total deposits | | 1,250,114 |
| | 1,273,362 |
| | 1,264,353 |
| | 1,226,586 |
| | 1,207,687 |
|
| Total loans | | 1,425,558 |
| | 1,368,474 |
| | 1,344,757 |
| | 1,312,994 |
| | 1,304,566 |
|
| Total securities | | 66,564 |
| | 63,991 |
| | 62,122 |
| | 62,962 |
| | 63,732 |
|
| Total shareholders' equity | | 160,709 |
| | 154,884 |
| | 149,383 |
| | 143,717 |
| | 138,488 |
|
| Allowance for loan losses | | (16,395 | ) | | (16,002 | ) | | (15,965 | ) | | (15,684 | ) | | (15,488 | ) |
| | | | | | | | | | | |
| TAX EQUIVALENT YIELDS AND RATES: | | | | | | | | | | |
| Interest-earning assets | | 5.07 | % | | 5.16 | % | | 5.24 | % | | 5.28 | % | | 5.12 | % |
| Interest-bearing liabilities | | 1.59 |
| | 1.68 |
| | 1.69 |
| | 1.60 |
| | 1.46 |
|
| Net interest spread | | 3.48 |
| | 3.48 |
| | 3.55 |
| | 3.68 |
| | 3.66 |
|
| Net interest margin | | 3.88 |
| | 3.90 |
| | 3.96 |
| | 4.06 |
| | 4.01 |
|
| | | | | | | | | | | |
| CREDIT QUALITY: | | | | | | | | | | |
| Nonperforming assets | | 7,372 |
| | 7,305 |
| | 5,336 |
| | 7,547 |
| | 6,929 |
|
| QTD net chargeoffs (annualized) to QTD average loans | | 0.03 | % | | 0.21 | % | | 0.02 | % | | 0.09 | % | | — | % |
| Allowance for loan losses to total loans | | 1.15 |
| | 1.17 |
| | 1.19 |
| | 1.19 |
| | 1.19 |
|
| Nonperforming assets to total loans and OREO | | 0.52 |
| | 0.53 |
| | 0.40 |
| | 0.57 |
| | 0.53 |
|
| Nonperforming assets to total assets | | 0.43 |
| | 0.44 |
| | 0.33 |
| | 0.47 |
| | 0.44 |
|
| | | | | | | | | | | |
| | | | | | | | | | | |
|
| | | | | | | | | | | | | | | | | | | | |
| (In thousands, except percentages and per share amounts) | | Dec 31, 2019 | | Sep 30, 2019 | | Jun 30, 2019 | | Mar 31, 2019 | | Dec 31, 2018 |
| CAPITAL RATIOS AND OTHER: | | | | | | | | | | |
| Total equity to total assets | | 9.35 | % | | 9.31 | % | | 9.18 | % | | 9.04 | % | | 8.77 | % |
| Leverage ratio | | 10.59 |
| | 10.54 |
| | 10.36 |
| | 10.09 |
| | 9.90 |
|
| Common equity tier 1 risk-based capital ratio | | 11.97 |
| | 12.24 |
| | 11.99 |
| | 11.78 |
| | 11.40 |
|
| Tier 1 risk-based capital ratio | | 12.73 |
| | 13.04 |
| | 12.81 |
| | 12.62 |
| | 12.24 |
|
| Total risk-based capital ratio | | 13.49 |
| | 14.28 |
| | 14.06 |
| | 13.87 |
| | 13.49 |
|
| Number of banking offices | | 19 |
| | 19 |
| | 19 |
| | 19 |
| | 19 |
|
| Number of ATMs | | 20 |
| | 20 |
| | 20 |
| | 20 |
| | 20 |
|
| Number of employees | | 203 |
| | 194 |
| | 185 |
| | 190 |
| | 198 |
|