Exhibit 99.1
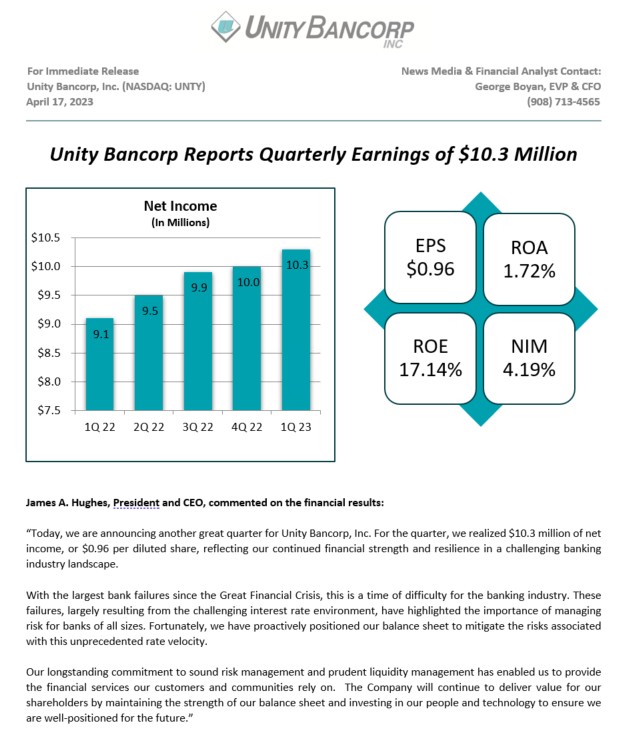
Clinton, NJ -- Unity Bancorp, Inc. (NASDAQ: UNTY), parent company of Unity Bank, reported net income of $10.3 million, or $0.96 per diluted share, for the quarter ended March 31, 2023, compared to net income of $10.0 million, or $0.93 per diluted share for the quarter ended December 31, 2022. This represents a 3.0% increase in net income and a 3.2% increase in net income per diluted share.
First Quarter Earnings Highlights
| ● | The provision for loan losses for loans was $0.1 million for the quarter ended March 31, 2023, compared to $1.6 million for the quarter ended December 31, 2022. The decrease was largely due to lower loan growth. Refer to the Balance Sheet Highlights section for further considerations regarding the adoption of the Current Expected Credit Loss (“CECL”) accounting standard. |
| ● | Non-interest income was $1.4 million for the quarter ended March 31, 2023 compared to $1.9 million for the quarter ended December 31, 2022. The $0.5 million decrease was primarily driven by mark-to-market decreases on the Company’s equity portfolio, which is primarily comprised of bank stocks. The decrease was complemented by lower servicing and loan fee income resulting from less prepayment penalties. The decrease was partially offset by increased realized gains on the sale of Small Business Administration (“SBA”) loans. |
| ● | The effective tax rate was 25.4% for the quarter ended March 31, 2023 compared to 27.0% for the quarter ending December 31, 2022. |
Balance Sheet Highlights
| ● | Total gross loans modestly increased $24.4 million, or 1.2%, from December 31, 2022 primarily due to increases in commercial loans and residential mortgage loans. In Q1 2023, the Company sold $7.1 million of portfolio residential mortgage loans and $3.5 million of SBA held for sale loans, realizing gains of $0.1 million and $0.3 million, respectively. |
| ● | The Company adopted the CECL accounting standard effective January 1, 2023. As a result, the adoption increased the Allowance for Credit Losses (“ACL”) by $0.8 million, as well as increased the reserve for unfunded credit commitments by $0.1 million. Further associated with CECL adoption, there was a decrease to retained earnings of $0.6 million, net of tax. As of March 31, 2023, the ACL as a percentage of gross loans was 1.23%. |
| ● | Total deposits increased $36.4 million, or 2.0%, from December 31, 2022 to $1.8 billion as of March 31, 2023. As of March 31, 2023, 18% of total deposits were uninsured and the average deposit account size was approximately $38,000. Further, the Bank’s deposit base was 44.8% retail, 27.1 % business, 17.3% municipal, and 10.8% Brokered CDs. |
| ● | As of March 31, 2023, the loan to deposit ratio was approximately 116.8%, which is above the Company’s target threshold of 110%. During the quarter ended March 31, 2023, the Bank opened a new branch in Fort Lee, New Jersey to expand its footprint in Bergen County, New Jersey. Additionally, Unity plans to open its first Morris County, New Jersey location in the summer of 2023. Further, the Company is reducing transactional-based lending and focusing on lending to owner-occupied businesses that will result in full banking relationships including primary deposit accounts. |
| ● | Borrowed funds decreased $9.0 million from year-end 2022 due to net deposit inflows during the quarter. Borrowed funds were entirely comprised of borrowings from the FHLB. |
| ● | Shareholders’ equity was $240.5 million at March 31, 2023, compared to $239.2 million at year-end 2022. The $1.3 million increase was primarily driven by first quarter 2023 earnings and equity-based compensation share issuance, partially offset by share repurchase activities in the first quarter of 2023. Throughout the first quarter of 2023, Unity Bancorp repurchased 337,945 shares for approximately $8.2 million, or a weighted average price of $24.29 per share. |
| ● | Book value per common share was $23.34 as of March 31, 2023, compared to $22.60 as of December 31, 2022. |
| ● | At March 31, 2023, the Community Bank Leverage Ratio was 10.38%, compared to 10.88% at December 31, 2022. The decrease was primarily driven by share repurchases, as well as, a higher average asset base for the quarter ended March 31, 2023. |
| ● | At March 31, 2023, the Company held $127.1 million of cash on hand. Further, the Company maintained approximately $316.9 million of funding available from various funding sources, including the FHLB, FRB Discount Window, and other lines of credit. Total available funding plus cash on hand represented 132.6% of uninsured deposits. |
| ❖ | Unity Bank offers savings, checking, and CD products that offer 100% insurance for deposits above the standard FDIC insurance limits. |
| ❖ | In February 2023, Unity Bancorp announced a 9% increase in its Q1 2023 dividend to $0.12 per common share. The Company does not anticipate that this increase will adversely impact its liquidity or capital positioning. |
| ❖ | In February 2023, Unity Bank opened a branch in Fort Lee, NJ, enhancing its Bergen County presence. Unity Bank has also received regulatory approval to open a branch in Lake Hiawatha, NJ. Lake Hiawatha will be the Bank’s first Morris County, New Jersey location and is expected to open over the coming months. |
| ❖ | After over 25 years with the organization, John Kauchak, Executive Vice President Chief Operating Officer, announced his retirement, effective June 30, 2023. During his tenure, he has made countless contributions to the organization. Further, after over 20 years with the organization, Janice Bolomey, Executive Vice President Director of Sales and Chief Administrative Officer, announced her resignation effective June 30, 2023. Management is currently evaluating the open executive management positions. |
Unity Bancorp, Inc. is a financial services organization headquartered in Clinton, New Jersey, with approximately $2.5 billion in assets and $1.8 billion in deposits. Unity Bank, the Company’s wholly owned subsidiary, provides financial services to retail, corporate and small business customers through its robust branch network located in Bergen, Hunterdon, Middlesex, Ocean, Somerset, Union and Warren Counties in New Jersey and Northampton County in Pennsylvania. For additional information about Unity, visit our website at www.unitybank.com , or call 800-618-BANK.
This news release contains certain forward-looking statements, either expressed or implied, which are provided to assist the reader in understanding anticipated future financial performance. These statements may be identified by use of the words “believe”, “expect”, “intend”, “anticipate”, “estimate”, “project” or similar expressions. These statements involve certain risks, uncertainties, estimates and assumptions made by management, which are subject to factors beyond the Company’s control and could impede its ability to achieve these goals. These factors include those items included in our Annual Report on Form 10-K under the heading “Item IA-Risk Factors” as amended or supplemented by our subsequent filings with the SEC, as well as general economic conditions, trends in interest rates, the ability of our borrowers to repay their loans, our ability to manage and reduce the level of our nonperforming assets, results of regulatory exams, and the impact of COVID-19 on the Bank, its employees and customers, among other factors.
UNITY BANCORP, INC.
SUMMARY FINANCIAL HIGHLIGHTS
March 31, 2023
| | | | | | | | | | | | | | | |
| | | | | | | | | | | | March 31, 2023 vs. | | ||
| | | | | | | | | | | | December 31, 2022 | | March 31, 2022 | |
(In thousands, except percentages and per share amounts) | | March 31, 2023 | | December 31, 2022 | | March 31, 2022 | | | % | | % | | |||
BALANCE SHEET DATA | | | | | | | | | | | | | | | |
Total assets | | $ | 2,475,851 | | $ | 2,444,948 | | $ | 2,067,692 | | | 1.3 | % | 19.7 | % |
Total deposits | | | 1,823,921 | | | 1,787,528 | | | 1,771,168 | | | 2.0 | | 3.0 | |
Total gross loans | | | 2,130,919 | | | 2,106,559 | | | 1,701,384 | | | 1.2 | | 25.2 | |
Total securities | | | 138,264 | | | 140,946 | | | 116,254 | | | (1.9) | | 18.9 | |
Total shareholders' equity | | | 240,459 | | | 239,227 | | | 214,928 | | | 0.5 | | 11.9 | |
Allowance for credit losses | | | 26,201 | | | 25,196 | | | 22,168 | | | 4.0 | | 18.2 | |
| | | | | | | | | | | | | | | |
FINANCIAL DATA - QUARTER TO DATE | | | | | | | | | | | | | | | |
Income before provision for income taxes | | $ | 13,791 | | $ | 13,634 | | $ | 11,911 | | | 1.2 | | 15.8 | |
Provision for income taxes | | | 3,504 | | | 3,678 | | | 2,803 | | | (4.7) | | 25.0 | |
Net income | | $ | 10,287 | | $ | 9,956 | | $ | 9,108 | | | 3.3 | | 12.9 | |
| | | | | | | | | | | | | | | |
Net income per common share - Basic | | $ | 0.98 | | $ | 0.94 | | $ | 0.87 | | | 4.3 | | 12.6 | |
Net income per common share - Diluted | | | 0.96 | | | 0.93 | | | 0.85 | | | 3.2 | | 12.9 | |
| | | | | | | | | | | | | | | |
PERFORMANCE RATIOS - QUARTER TO DATE | | | | | | | | | | | | | | | |
Return on average assets | | | 1.72 | % | | 1.72 | % | | 1.80 | % | | | | | |
Return on average equity | | | 17.14 | | | 16.82 | | | 17.64 | | | | | | |
Efficiency ratio | | | 44.56 | | | 43.24 | | | 45.86 | | | | | | |
Net interest margin | | | 4.19 | | | 4.47 | | | 4.11 | | | | | | |
Noninterest expense to average assets | | | 1.91 | | | 1.96 | | | 2.06 | | | | | | |
| | | | | | | | | | | | | | | |
SHARE INFORMATION | | | | | | | | | | | | | | | |
Market price per share | | $ | 22.81 | | $ | 27.33 | | $ | 27.98 | | | (16.5) | | (18.5) | |
Dividends paid | | | 0.12 | | | 0.11 | | | 0.10 | | | 9.1 | | 20.0 | |
Book value per common share | | | 23.34 | | | 22.60 | | | 20.48 | | | 3.3 | | 14.0 | |
Average diluted shares outstanding (QTD) | | | 10,686 | | | 10,740 | | | 10,664 | | | (0.5) | | 0.2 | |
| | | | | | | | | | | | | | | |
CAPITAL RATIOS | | | | | | | | | | | | | | | |
Total equity to total assets | | | 9.71 | % | | 9.78 | % | | 10.39 | % | | | | | |
Community bank leverage ratio | | | 10.38 | | | 10.88 | | | 10.87 | | | | | | |
| | | | | | | | | | | | | | | |
CREDIT QUALITY AND RATIOS | | | | | | | | | | | | | | | |
Nonperforming assets | | $ | 14,683 | | $ | 9,065 | | $ | 9,301 | | | 62.0 | | 57.9 | |
QTD annualized net chargeoffs/(recoveries) to QTD average loans | | | (0.01) | % | | 0.06 | % | | (0.01) | % | | | | | |
Allowance for credit losses to total loans | | | 1.23 | | | 1.20 | | | 1.30 | | | | | | |
Nonperforming loans (gross SBA guarantee) to total loans | | | 0.69 | | | 0.43 | | | 0.55 | | | | | | |
Nonperforming assets (gross SBA guarantee) to total assets | | | 0.59 | | | 0.37 | | | 0.45 | | | | | | |
UNITY BANCORP, INC.
CONSOLIDATED BALANCE SHEETS
March 31, 2023
| | | | | | | | | | | | | | | |
| | | | | | | | | | | | March 31, 2023 vs. | | ||
| | | | | | | | | | | | December 31, 2022 | | March 31, 2022 | |
(In thousands, except percentages) | | March 31, 2023 | | December 31, 2022 | | March 31, 2022 | | | % | | % | | |||
ASSETS | | | | | | | | | | | | | | | |
Cash and due from banks | | $ | 23,893 | | $ | 19,699 | | $ | 26,728 | | | 21.3 | % | (10.6) | % |
Interest-bearing deposits | | | 103,194 | | | 95,094 | | | 160,998 | | | 8.5 | | (35.9) | |
Cash and cash equivalents | | | 127,087 | | | 114,793 | | | 187,726 | | | 10.7 | | (32.3) | |
Securities: | | | | | | | | | | | | | | | |
Debt securities available for sale | | | 94,113 | | | 95,393 | | | 77,878 | | | (1.3) | | 20.8 | |
Debt securities held to maturity | | | 35,824 | | | 35,760 | | | 30,367 | | | 0.2 | | 18.0 | |
Equity securities with readily determinable fair values | | | 8,327 | | | 9,793 | | | 8,009 | | | (15.0) | | 4.0 | |
Total securities | | | 138,264 | | | 140,946 | | | 116,254 | | | (1.9) | | 18.9 | |
Loans: | | | | | | | | | | | | | | | |
SBA loans held for sale | | | 23,314 | | | 27,928 | | | 25,282 | | | (16.5) | | (7.8) | |
SBA loans held for investment | | | 39,370 | | | 38,468 | | | 33,048 | | | 2.3 | | 19.1 | |
SBA PPP loans | | | 2,545 | | | 5,908 | | | 28,618 | | | (56.9) | | (91.1) | |
Commercial loans | | | 1,205,642 | | | 1,187,543 | | | 979,911 | | | 1.5 | | 23.0 | |
Residential mortgage loans | | | 619,140 | | | 605,091 | | | 427,165 | | | 2.3 | | 44.9 | |
Consumer loans | | | 76,784 | | | 78,164 | | | 77,702 | | | (1.8) | | (1.2) | |
Residential construction loans | | | 164,124 | | | 163,457 | | | 129,658 | | | 0.4 | | 26.6 | |
Total loans | | | 2,130,919 | | | 2,106,559 | | | 1,701,384 | | | 1.2 | | 25.2 | |
Allowance for credit losses | | | (26,201) | | | (25,196) | | | (22,168) | | | 4.0 | | 18.2 | |
Net loans | | | 2,104,718 | | | 2,081,363 | | | 1,679,216 | | | 1.1 | | 25.3 | |
Premises and equipment, net | | | 19,868 | | | 20,002 | | | 19,593 | | | (0.7) | | 1.4 | |
Bank owned life insurance ("BOLI") | | | 26,856 | | | 26,776 | | | 26,652 | | | 0.3 | | 0.8 | |
Deferred tax assets | | | 12,360 | | | 12,345 | | | 9,928 | | | 0.1 | | 24.5 | |
Federal Home Loan Bank ("FHLB") stock | | | 18,688 | | | 19,064 | | | 3,541 | | | (2.0) | | 427.8 | |
Accrued interest receivable | | | 14,314 | | | 13,403 | | | 9,568 | | | 6.8 | | 49.6 | |
Goodwill | | | 1,516 | | | 1,516 | | | 1,516 | | | - | | - | |
Prepaid expenses and other assets | | | 12,180 | | | 14,740 | | | 13,698 | | | (17.4) | | (11.1) | |
Total assets | | $ | 2,475,851 | | $ | 2,444,948 | | $ | 2,067,692 | | | 1.3 | % | 19.7 | % |
LIABILITIES AND SHAREHOLDERS' EQUITY | | | | | | | | | | | | | |||
Liabilities: | | | | | | | | | | | | | | | |
Deposits: | | | | | | | | | | | | | | | |
Noninterest-bearing demand | | $ | 450,058 | | $ | 494,184 | | $ | 541,990 | | | (8.9) | % | (17.0) | % |
Interest-bearing demand | | | 289,451 | | | 276,218 | | | 240,757 | | | 4.8 | | 20.2 | |
Savings | | | 560,711 | | | 591,826 | | | 707,498 | | | (5.3) | | (20.7) | |
Brokered time deposits | | | 197,792 | | | 189,644 | | | 113,368 | | | 4.3 | | 74.5 | |
Time deposits | | | 325,909 | | | 235,656 | | | 167,555 | | | 38.3 | | 94.5 | |
Total deposits | | | 1,823,921 | | | 1,787,528 | | | 1,771,168 | | | 2.0 | | 3.0 | |
Borrowed funds | | | 374,000 | | | 383,000 | | | 40,000 | | | (2.3) | | 835.0 | |
Subordinated debentures | | | 10,310 | | | 10,310 | | | 10,310 | | | - | | - | |
Accrued interest payable | | | 932 | | | 691 | | | 132 | | | 34.9 | | 606.1 | |
Accrued expenses and other liabilities | | | 26,229 | | | 24,192 | | | 31,154 | | | 8.4 | | (15.8) | |
Total liabilities | | | 2,235,392 | | | 2,205,721 | | | 1,852,764 | | | 1.3 | | 20.7 | |
Shareholders' equity: | | | | | | | | | | | | | | | |
Common stock | | | 98,197 | | | 97,204 | | | 94,853 | | | 1.0 | | 3.5 | |
Retained earnings | | | 165,335 | | | 156,958 | | | 131,100 | | | 5.3 | | 26.1 | |
Treasury stock, at cost | | | (19,894) | | | (11,675) | | | (11,633) | | | (70.4) | | (71.0) | |
Accumulated other comprehensive (loss) income | | | (3,179) | | | (3,260) | | | 608 | | | 2.5 | | 2.5 | |
Total shareholders' equity | | | 240,459 | | | 239,227 | | | 214,928 | | | 0.5 | | 11.9 | |
Total liabilities and shareholders' equity | | $ | 2,475,851 | | $ | 2,444,948 | | $ | 2,067,692 | | | 1.3 | % | 19.7 | % |
COMMON SHARES AT PERIOD END: | | | | | | | | | | | | | |||
Shares issued | | | 11,335 | | | 11,289 | | | 11,196 | | | | | | |
Shares outstanding | | | 10,292 | | | 10,584 | | | 10,493 | | | | | | |
Treasury shares | | | 1,043 | | | 705 | | | 703 | | | | | | |
| | | | | | | | | | | | | | | |
*NM=Not meaningful | | | | | | | | | | | | | | | |
UNITY BANCORP, INC.
QTD CONSOLIDATED STATEMENTS OF INCOME
March 31, 2023
| | | | | | | | | | | | | | | | | | | | | | | |
| | | | | | | | | | | | March 31, 2023 vs. | | ||||||||||
| | For the three months ended | | | December 31, 2022 | | March 31, 2022 | | |||||||||||||||
(In thousands, except percentages and per share amounts) | | March 31, 2023 | | December 31, 2022 | | March 31, 2022 | | | $ | | % | | $ | | % | | |||||||
INTEREST INCOME | | | | | | | | | | | | | | | | | | | | | | | |
Interest-bearing deposits | | $ | 333 | | $ | 319 | | $ | 96 | | | $ | 14 | | | 4.4 | % | $ | 237 | | | 246.9 | % |
FHLB stock | | | 331 | | | 220 | | | 33 | | | | 111 | | | 50.5 | | | 298 | | | 903.0 | |
Securities: | | | | | | | | | | | | | | | | | | | | | | | |
Taxable | | | 1,739 | | | 1,589 | | | 652 | | | | 150 | | | 9.4 | | | 1,087 | | | 166.7 | |
Tax-exempt | | | 19 | | | 19 | | | 6 | | | | - | | | - | | | 13 | | | 216.7 | |
Total securities | | | 1,758 | | | 1,608 | | | 658 | | | | 150 | | | 9.3 | | | 1,100 | | | 167.2 | |
Loans: | | | | | | | | | | | | | | | | | | | | | | | |
SBA loans | | | 1,404 | | | 1,370 | | | 923 | | | | 34 | | | 2.5 | | | 481 | | | 52.1 | |
SBA PPP loans | | | 77 | | | 50 | | | 777 | | | | 27 | | | 54.0 | | | (700) | | | (90.1) | |
Commercial loans | | | 17,401 | | | 15,894 | | | 11,497 | | | | 1,507 | | | 9.5 | | | 5,904 | | | 51.4 | |
Residential mortgage loans | | | 8,109 | | | 7,111 | | | 4,390 | | | | 998 | | | 14.0 | | | 3,719 | | | 84.7 | |
Consumer loans | | | 1,354 | | | 1,217 | | | 921 | | | | 137 | | | 11.3 | | | 433 | | | 47.0 | |
Residential construction loans | | | 2,586 | | | 2,536 | | | 1,824 | | | | 50 | | | 2.0 | | | 762 | | | 41.8 | |
Total loans | | | 30,931 | | | 28,178 | | | 20,332 | | | | 2,753 | | | 9.8 | | | 10,599 | | | 52.1 | |
Total interest income | | | 33,353 | | | 30,325 | | | 21,119 | | | | 3,028 | | | 10.0 | | | 12,234 | | | 57.9 | |
INTEREST EXPENSE | | | | | | | | | | | | | | | | | | | | | | | |
Interest-bearing demand deposits | | | 982 | | | 703 | | | 164 | | | | 279 | | | 39.7 | | | 818 | | | 498.8 | |
Savings deposits | | | 1,953 | | | 1,475 | | | 345 | | | | 478 | | | 32.4 | | | 1,608 | | | 466.1 | |
Time deposits | | | 2,709 | | | 1,258 | | | 480 | | | | 1,451 | | | 115.3 | | | 2,229 | | | 464.4 | |
Borrowed funds and subordinated debentures | | | 3,799 | | | 2,180 | | | 226 | | | | 1,619 | | | 74.3 | | | 3,573 | | | 1,581.0 | |
Total interest expense | | | 9,443 | | | 5,616 | | | 1,215 | | | | 3,827 | | | 68.1 | | | 8,228 | | | 677.2 | |
Net interest income | | | 23,910 | | | 24,709 | | | 19,904 | | | | (799) | | | (3.2) | | | 4,006 | | | 20.1 | |
Provision (benefit) for credit losses | | | 108 | | | 1,632 | | | (178) | | | | (1,524) | | | (93.4) | | | 286 | | | NM* | |
Net interest income after provision for credit losses | | | 23,802 | | | 23,077 | | | 20,082 | | | | 725 | | | 3.1 | | | 3,720 | | | 18.5 | |
NONINTEREST INCOME | | | | | | | | | | | | | | | | | | | | | | | |
Branch fee income | | | 235 | | | 224 | | | 275 | | | | 11 | | | 4.9 | | | (40) | | | (14.5) | |
Service and loan fee income | | | 503 | | | 618 | | | 584 | | | | (115) | | | (18.6) | | | (81) | | | (13.9) | |
Gain on sale of SBA loans held for sale, net | | | 309 | | | 103 | | | 852 | | | | 206 | | | 200.0 | | | (543) | | | (63.7) | |
Gain on sale of mortgage loans, net | | | 244 | | | 167 | | | 521 | | | | 77 | | | 46.1 | | | (277) | | | (53.2) | |
BOLI income | | | 80 | | | 142 | | | 163 | | | | (62) | | | (43.7) | | | (83) | | | (50.9) | |
Net securities (losses) gains | | | (322) | | | 319 | | | (557) | | | | (641) | | | NM* | | | 235 | | | NM* | |
Other income | | | 368 | | | 373 | | | 401 | | | | (5) | | | (1.3) | | | (33) | | | (8.2) | |
Total noninterest income | | | 1,417 | | | 1,946 | | | 2,239 | | | | (529) | | | (27.2) | | | (822) | | | (36.7) | |
NONINTEREST EXPENSE | | | | | | | | | | | | | | | | | | | | | | | |
Compensation and benefits | | | 7,090 | | | 7,160 | | | 6,508 | | | | (70) | | | (1.0) | | | 582 | | | 8.9 | |
Processing and communications | | | 804 | | | 682 | | | 752 | | | | 122 | | | 17.9 | | | 52 | | | 6.9 | |
Occupancy | | | 770 | | | 758 | | | 775 | | | | 12 | | | 1.6 | | | (5) | | | (0.6) | |
Furniture and equipment | | | 689 | | | 683 | | | 576 | | | | 6 | | | 0.9 | | | 113 | | | 19.6 | |
Professional services | | | 427 | | | 341 | | | 447 | | | | 86 | | | 25.2 | | | (20) | | | (4.5) | |
Advertising | | | 260 | | | 339 | | | 225 | | | | (79) | | | (23.3) | | | 35 | | | 15.6 | |
Other loan expenses | | | 128 | | | 1 | | | 135 | | | | 127 | | | 12,700.0 | | | (7) | | | (5.2) | |
Deposit insurance | | | 348 | | | 270 | | | 269 | | | | 78 | | | 28.9 | | | 79 | | | 29.4 | |
Director fees | | | 217 | | | 218 | | | 233 | | | | (1) | | | (0.5) | | | (16) | | | (6.9) | |
Loan collection expenses | | | 47 | | | 140 | | | 58 | | | | (93) | | | (66.4) | | | (11) | | | (19.0) | |
Other expenses | | | 648 | | | 797 | | | 432 | | | | (149) | | | (18.7) | | | 216 | | | 50.0 | |
Total noninterest expense | | | 11,428 | | | 11,389 | | | 10,410 | | | | 39 | | | 0.3 | | | 1,018 | | | 9.8 | |
Income before provision for income taxes | | | 13,791 | | | 13,634 | | | 11,911 | | | | 157 | | | 1.2 | | | 1,880 | | | 15.8 | |
Provision for income taxes | | | 3,504 | | | 3,678 | | | 2,803 | | | | (174) | | | (4.7) | | | 701 | | | 25.0 | |
Net income | | $ | 10,287 | | $ | 9,956 | | $ | 9,108 | | | $ | 331 | | | 3.3 | % | $ | 1,179 | | | 12.9 | % |
| | | | | | | | | | | | | | | | | | | | | | | |
Effective tax rate | | | 25.4 | % | | 27.0 | % | | 23.5 | % | | | | | | | | | | | | | |
| | | | | | | | | | | | | | | | | | | | | | | |
Net income per common share - Basic | | $ | 0.98 | | $ | 0.94 | | $ | 0.87 | | | | | | | | | | | | | | |
Net income per common share - Diluted | | | 0.96 | | | 0.93 | | | 0.85 | | | | | | | | | | | | | | |
| | | | | | | | | | | | | | | | | | | | | | | |
Weighted average common shares outstanding - Basic | | | 10,538 | | | 10,557 | | | 10,446 | | | | | | | | | | | | | | |
Weighted average common shares outstanding - Diluted | | | 10,686 | | | 10,740 | | | 10,664 | | | | | | | | | | | | | | |
*NM=Not meaningful | | | | | | | | | | | | | | | | | | | | | | | |
UNITY BANCORP, INC.
QUARTER TO DATE NET INTEREST MARGIN
March 31, 2023
| | | | | | | | | | | | | | | | | | | |
| | For the three months ended | | ||||||||||||||||
(Dollar amounts in thousands, interest amounts and | | March 31, 2023 | | March 31, 2022 | | ||||||||||||||
interest rates/yields on a fully tax-equivalent basis) | | Average Balance | | Interest | | Rate/Yield | | Average Balance | | Interest | | Rate/Yield | | ||||||
ASSETS | | | | | | | | | | | | | | | | | | | |
Interest-earning assets: | | | | | | | | | | | | | | | | | | | |
Interest-bearing deposits | | $ | 32,778 | | $ | 333 | | | 4.12 | % | $ | 210,601 | | $ | 96 | | | 0.18 | % |
FHLB stock | | | 16,776 | | | 331 | | | 7.99 | | | 3,550 | | | 33 | | | 3.81 | |
Securities: | | | | | | | | | | | | | | | | | | | |
Taxable | | | 138,379 | | | 1,739 | | | 5.03 | | | 84,739 | | | 652 | | | 3.12 | |
Tax-exempt | | | 1,753 | | | 20 | | | 4.49 | | | 990 | | | 8 | | | 3.07 | |
Total securities (A) | | | 140,132 | | | 1,759 | | | 5.02 | | | 85,729 | | | 660 | | | 3.12 | |
Loans: | | | | | | | | | | | | | | | | | | | |
SBA loans | | | 66,625 | | | 1,404 | | | 8.43 | | | 63,543 | | | 923 | | | 5.89 | |
SBA PPP loans | | | 4,243 | | | 77 | | | 7.26 | | | 36,989 | | | 777 | | | 8.52 | |
Commercial loans | | | 1,199,577 | | | 17,401 | | | 5.80 | | | 949,948 | | | 11,497 | | | 4.91 | |
Residential mortgage loans | | | 614,936 | | | 8,109 | | | 5.27 | | | 413,308 | | | 4,390 | | | 4.31 | |
Consumer loans | | | 77,121 | | | 1,354 | | | 7.02 | | | 78,989 | | | 921 | | | 4.73 | |
Residential construction loans | | | 163,821 | | | 2,586 | | | 6.31 | | | 122,993 | | | 1,824 | | | 6.01 | |
Total loans (B) | | | 2,126,323 | | | 30,931 | | | 5.82 | | | 1,665,770 | | | 20,332 | | | 4.95 | |
Total interest-earning assets | | $ | 2,316,009 | | $ | 33,354 | | | 5.84 | % | $ | 1,965,650 | | $ | 21,121 | | | 4.36 | % |
| | | | | | | | | | | | | | | | | | | |
Noninterest-earning assets: | | | | | | | | | | | | | | | | | | | |
Cash and due from banks | | | 22,738 | | | | | | | | | 23,679 | | | | | | | |
Allowance for credit losses | | | (25,778) | | | | | | | | | (22,331) | | | | | | | |
Other assets | | | 111,104 | | | | | | | | | 79,631 | | | | | | | |
Total noninterest-earning assets | | | 108,064 | | | | | | | | | 80,979 | | | | | | | |
Total assets | | $ | 2,424,073 | | | | | | | | $ | 2,046,629 | | | | | | | |
| | | | | | | | | | | | | | | | | | | |
LIABILITIES AND SHAREHOLDERS' EQUITY | | | | | | | | | | | | | | | | | | | |
Interest-bearing liabilities: | | | | | | | | | | | | | | | | | | | |
Total interest-bearing demand deposits | | $ | 287,749 | | $ | 982 | | | 1.38 | % | $ | 249,329 | | $ | 164 | | | 0.27 | % |
Total savings deposits | | | 571,843 | | | 1,953 | | | 1.39 | | | 701,281 | | | 345 | | | 0.20 | |
Total time deposits | | | 485,679 | | | 2,709 | | | 2.26 | | | 288,155 | | | 480 | | | 0.68 | |
Total interest-bearing deposits | | | 1,345,271 | | | 5,644 | | | 1.70 | | | 1,238,765 | | | 989 | | | 0.32 | |
Borrowed funds and subordinated debentures | | | 342,398 | | | 3,799 | | | 4.44 | | | 50,310 | | | 226 | | | 1.82 | |
Total interest-bearing liabilities | | $ | 1,687,669 | | $ | 9,443 | | | 2.27 | % | $ | 1,289,075 | | $ | 1,215 | | | 0.38 | % |
| | | | | | | | | | | | | | | | | | | |
Noninterest-bearing liabilities: | | | | | | | | | | | | | | | | | | | |
Noninterest-bearing demand deposits | | | 468,407 | | | | | | | | | 526,931 | | | | | | | |
Other liabilities | | | 24,541 | | | | | | | | | 21,217 | | | | | | | |
Total noninterest-bearing liabilities | | | 492,948 | | | | | | | | | 548,148 | | | | | | | |
Total shareholders' equity | | | 243,456 | | | | | | | | | 209,406 | | | | | | | |
Total liabilities and shareholders' equity | | $ | 2,424,073 | | | | | | | | $ | 2,046,629 | | | | | | | |
| | | | | | | | | | | | | | | | | | | |
Net interest spread | | | | | $ | 23,911 | | | 3.57 | % | | | | $ | 19,906 | | | 3.98 | % |
Tax-equivalent basis adjustment | | | | | | (1) | | | | | | | | | (2) | | | | |
Net interest income | | | | | $ | 23,910 | | | | | | | | $ | 19,904 | | | | |
Net interest margin | | | | | | | | | 4.19 | % | | | | | | | | 4.11 | % |
| | | | | | | | | | | | | | | | | | | |
| (A) | Yields related to securities exempt from federal and state income taxes are stated on a fully tax-equivalent basis. They are reduced by the nondeductable portion of interest expense, assuming a federal tax rate of 21 percent and applicable state rates. |
| (B) | The loan averages are stated net of unearned income, and the averages include loans on which the accrual of interest has been discontinued. |
UNITY BANCORP, INC.
QUARTER TO DATE NET INTEREST MARGIN
March 31, 2023
| | | | | | | | | | | | | | | | | | | |
| | For the three months ended | | ||||||||||||||||
(Dollar amounts in thousands, interest amounts and | | March 31, 2023 | | December 31, 2022 | | ||||||||||||||
interest rates/yields on a fully tax-equivalent basis) | | Average Balance | | Interest | | Rate/Yield | | Average Balance | | Interest | | Rate/Yield | | ||||||
ASSETS | | | | | | | | | | | | | | | | | | | |
Interest-earning assets: | | | | | | | | | | | | | | | | | | | |
Interest-bearing deposits | | $ | 32,778 | | $ | 333 | | | 4.12 | % | $ | 37,640 | | $ | 319 | | | 3.37 | % |
FHLB stock | | | 16,776 | | | 331 | | | 7.99 | | | 11,785 | | | 220 | | | 7.39 | |
Securities: | | | | | | | | | | | | | | | | | | | |
Taxable | | | 138,379 | | | 1,739 | | | 5.03 | | | 134,661 | | | 1,589 | | | 4.72 | |
Tax-exempt | | | 1,753 | | | 20 | | | 4.49 | | | 1,741 | | | 20 | | | 4.47 | |
Total securities (A) | | | 140,132 | | | 1,759 | | | 5.02 | | | 136,402 | | | 1,609 | | | 4.72 | |
Loans: | | | | | | | | | | | | | | | | | | | |
SBA loans | | | 66,625 | | | 1,404 | | | 8.43 | | | 67,448 | | | 1,370 | | | 8.13 | |
SBA PPP loans | | | 4,243 | | | 77 | | | 7.26 | | | 6,355 | | | 50 | | | 3.17 | |
Commercial loans | | | 1,199,577 | | | 17,401 | | | 5.80 | | | 1,134,102 | | | 15,894 | | | 5.48 | |
Residential mortgage loans | | | 614,936 | | | 8,109 | | | 5.27 | | | 569,698 | | | 7,111 | | | 4.99 | |
Consumer loans | | | 77,121 | | | 1,354 | | | 7.02 | | | 75,229 | | | 1,217 | | | 6.33 | |
Residential construction loans | | | 163,821 | | | 2,586 | | | 6.31 | | | 156,282 | | | 2,536 | | | 6.35 | |
Total loans (B) | | | 2,126,323 | | | 30,931 | | | 5.82 | | | 2,009,114 | | | 28,178 | | | 5.49 | |
Total interest-earning assets | | $ | 2,316,009 | | $ | 33,354 | | | 5.84 | % | $ | 2,194,941 | | $ | 30,326 | | | 5.48 | % |
| | | | | | | | | | | | | | | | | | | |
Noninterest-earning assets: | | | | | | | | | | | | | | | | | | | |
Cash and due from banks | | | 22,738 | | | | | | | | | 20,352 | | | | | | | |
Allowance for credit losses | | | (25,778) | | | | | | | | | (24,301) | | | | | | | |
Other assets | | | 111,104 | | | | | | | | | 109,515 | | | | | | | |
Total noninterest-earning assets | | | 108,064 | | | | | | | | | 105,566 | | | | | | | |
Total assets | | $ | 2,424,073 | | | | | | | | $ | 2,300,507 | | | | | | | |
| | | | | | | | | | | | | | | | | | | |
LIABILITIES AND SHAREHOLDERS' EQUITY | | | | | | | | | | | | | | | | | | | |
Interest-bearing liabilities: | | | | | | | | | | | | | | | | | | | |
Total interest-bearing demand deposits | | $ | 287,749 | | $ | 982 | | | 1.38 | % | $ | 289,524 | | $ | 703 | | | 0.96 | % |
Total savings deposits | | | 571,843 | | | 1,953 | | | 1.39 | | | 636,230 | | | 1,475 | | | 0.92 | |
Total time deposits | | | 485,679 | | | 2,709 | | | 2.26 | | | 385,423 | | | 1,258 | | | 1.29 | |
Total interest-bearing deposits | | | 1,345,271 | | | 5,644 | | | 1.70 | | | 1,311,177 | | | 3,436 | | | 1.04 | |
Borrowed funds and subordinated debentures | | | 342,398 | | | 3,799 | | | 4.44 | | | 231,720 | | | 2,180 | | | 3.68 | |
Total interest-bearing liabilities | | $ | 1,687,669 | | $ | 9,443 | | | 2.27 | % | $ | 1,542,897 | | $ | 5,616 | | | 1.44 | % |
| | | | | | | | | | | | | | | | | | | |
Noninterest-bearing liabilities: | | | | | | | | | | | | | | | | | | | |
Noninterest-bearing demand deposits | | | 468,407 | | | | | | | | | 496,993 | | | | | | | |
Other liabilities | | | 24,541 | | | | | | | | | 25,820 | | | | | | | |
Total noninterest-bearing liabilities | | | 492,948 | | | | | | | | | 522,813 | | | | | | | |
Total shareholders' equity | | | 243,456 | | | | | | | | | 234,797 | | | | | | | |
Total liabilities and shareholders' equity | | $ | 2,424,073 | | | | | | | | $ | 2,300,507 | | | | | | | |
| | | | | | | | | | | | | | | | | | | |
Net interest spread | | | | | $ | 23,911 | | | 3.57 | % | | | | $ | 24,710 | | | 4.04 | % |
Tax-equivalent basis adjustment | | | | | | (1) | | | | | | | | | (1) | | | | |
Net interest income | | | | | $ | 23,910 | | | | | | | | $ | 24,709 | | | | |
Net interest margin | | | | | | | | | 4.19 | % | | | | | | | | 4.47 | % |
| | | | | | | | | | | | | | | | | | | |
| (A) | Yields related to securities exempt from federal and state income taxes are stated on a fully tax-equivalent basis. They are reduced by the nondeductable portion of interest expense, assuming a federal tax rate of 21 percent and applicable state rates. |
| (B) | The loan averages are stated net of unearned income, and the averages include loans on which the accrual of interest has been discontinued. |
UNITY BANCORP, INC.
QUARTERLY ALLOWANCE FOR LOAN LOSSES AND LOAN QUALITY SCHEDULES
March 31, 2023
| | | | | | | | | | | | | | | |
Amounts in thousands, except percentages | | March 31, 2023 | | December 31, 2022 | | September 30, 2022 | | June 30, 2022 | | March 31, 2022 | |||||
ALLOWANCE FOR LOAN LOSSES: | | | | | | | | | | | | | | | |
Balance, beginning of period | | $ | 25,196 | | $ | 23,861 | | $ | 22,858 | | $ | 22,168 | | $ | 22,302 |
Impact of the adoption of ASU 2016-13 ("CECL") | | | 847 | | | | | | | | | | | | |
Provision (benefit) for loan losses charged to expense | | | 108 | | | 1,632 | | | 1,517 | | | 1,188 | | | (178) |
| | | 26,151 | | | 25,493 | | | 24,375 | | | 23,356 | | | 22,124 |
Less: Chargeoffs | | | | | | | | | | | | | | | |
SBA loans | | | 113 | | | 59 | | | - | | | - | | | - |
Commercial loans | | | - | | | - | | | 501 | | | 501 | | | - |
Residential mortgage loans | | | - | | | - | | | - | | | - | | | - |
Consumer loans | | | 120 | | | 300 | | | 50 | | | 40 | | | 6 |
Residential construction loans | | | - | | | - | | | - | | | - | | | - |
Total chargeoffs | | | 233 | | | 359 | | | 551 | | | 541 | | | 6 |
Add: Recoveries | | | | | | | | | | | | | | | |
SBA loans | | | - | | | - | | | 5 | | | 6 | | | 22 |
Commercial loans | | | 271 | | | 26 | | | 23 | | | 32 | | | 28 |
Residential mortgage loans | | | - | | | 2 | | | - | | | 1 | | | - |
Consumer loans | | | 12 | | | 34 | | | 9 | | | 4 | | | - |
Residential construction loans | | | - | | | - | | | - | | | - | | | - |
Total recoveries | | | 283 | | | 62 | | | 37 | | | 43 | | | 50 |
Net (chargeoffs)/recoveries | | | 50 | | | (297) | | | (514) | | | (498) | | | 44 |
Balance, end of period | | $ | 26,201 | | $ | 25,196 | | $ | 23,861 | | $ | 22,858 | | $ | 22,168 |
| | | | | | | | | | | | | | | |
LOAN QUALITY INFORMATION: | | | | | | | | | | | | | | | |
| | | | | | | | | | | | | | | |
Nonperforming loans: | | | | | | | | | | | | | | | |
SBA loans | | $ | 4,325 | | $ | 690 | | $ | 1,491 | | $ | 604 | | $ | 537 |
Commercial loans | | | 1,144 | | | 1,582 | | | 1,147 | | | 1,717 | | | 2,292 |
Residential mortgage loans | | | 5,565 | | | 3,361 | | | 3,404 | | | 2,668 | | | 2,999 |
Consumer loans | | | - | | | - | | | - | | | - | | | 200 |
Residential construction loans | | | 3,473 | | | 3,432 | | | 1,991 | | | 2,691 | | | 3,273 |
Total nonperforming loans | | | 14,507 | | | 9,065 | | | 8,033 | | | 7,680 | | | 9,301 |
OREO | | | 176 | | | - | | | - | | | - | | | - |
Nonperforming assets | | | 14,683 | | | 9,065 | | | 8,033 | | | 7,680 | | | 9,301 |
Less: Amount guaranteed by Small Business Administration | | | 3,625 | | | - | | | - | | | 15 | | | 1,102 |
Nonperforming assets, net of SBA guarantee | | | 11,058 | | | 9,065 | | | 8,033 | | | 7,665 | | | 8,199 |
| | | | | | | | | | | | | | | |
Loans 90 days past due & still accruing | | $ | - | | $ | - | | $ | 75 | | $ | 43 | | $ | 488 |
| | | | | | | | | | | | | | | |
Allowance for loan losses to: | | | | | | | | | | | | | | | |
Total loans at quarter end | | | 1.23 | % | | 1.20 | % | | 1.23 | % | | 1.27 | % | | 1.30 |
Total nonperforming loans | | | 178.44 | | | 277.95 | | | 297.04 | | | 297.63 | | | 238.34 |
Total nonperforming assets, net of SBA guarantee | | | 236.94 | | | 277.95 | | | 297.04 | | | 298.21 | | | 270.37 |
UNITY BANCORP, INC.
QUARTERLY FINANCIAL DATA
March 31, 2023
| | | | | | | | | | | | | | | | |
(In thousands, except percentages and per share amounts) | | March 31, 2023 | | December 31, 2022 | | September 30, 2022 | | June 30, 2022 | | March 31, 2022 | | |||||
SUMMARY OF INCOME: | | | | | | | | | | | | | | | | |
Total interest income | | $ | 33,353 | | $ | 30,325 | | $ | 26,224 | | $ | 23,071 | | $ | 21,119 | |
Total interest expense | | | 9,443 | | | 5,616 | | | 2,486 | | | 1,314 | | | 1,215 | |
Net interest income | | | 23,910 | | | 24,709 | | | 23,738 | | | 21,757 | | | 19,904 | |
Provision (benefit) for credit losses | | | 108 | | | 1,632 | | | 1,517 | | | 1,188 | | | (178) | |
Net interest income after provision for credit losses | | | 23,802 | | | 23,077 | | | 22,221 | | | 20,569 | | | 20,082 | |
Total noninterest income | | | 1,417 | | | 1,946 | | | 1,110 | | | 2,750 | | | 2,239 | |
Total noninterest expense | | | 11,428 | | | 11,389 | | | 10,064 | | | 10,710 | | | 10,410 | |
Income before provision for income taxes | | | 13,791 | | | 13,634 | | | 13,267 | | | 12,609 | | | 11,911 | |
Provision for income taxes | | | 3,504 | | | 3,678 | | | 3,325 | | | 3,158 | | | 2,803 | |
Net income | | $ | 10,287 | | $ | 9,956 | | $ | 9,942 | | $ | 9,451 | | $ | 9,108 | |
| | | | | | | | | | | | | | | | |
Net income per common share - Basic | | $ | 0.98 | | $ | 0.94 | | $ | 0.94 | | $ | 0.90 | | $ | 0.87 | |
Net income per common share - Diluted | | | 0.96 | | | 0.93 | | | 0.93 | | | 0.88 | | | 0.85 | |
| | | | | | | | | | | | | | | | |
COMMON SHARE DATA: | | | | | | | | | | | | | | | | |
Market price per share | | $ | 22.81 | | $ | 27.33 | | $ | 25.11 | | $ | 26.48 | | $ | 27.98 | |
Dividends paid | | | 0.12 | | | 0.11 | | | 0.11 | | | 0.11 | | | 0.10 | |
Book value per common share | | | 23.34 | | | 22.60 | | | 21.86 | | | 21.01 | | | 20.48 | |
| | | | | | | | | | | | | | | | |
Weighted average common shares outstanding - Basic | | | 10,538 | | | 10,557 | | | 10,522 | | | 10,504 | | | 10,446 | |
Weighted average common shares outstanding - Diluted | | | 10,686 | | | 10,740 | | | 10,714 | | | 10,706 | | | 10,664 | |
Issued common shares | | | 11,335 | | | 11,289 | | | 11,236 | | | 11,214 | | | 11,196 | |
Outstanding common shares | | | 10,292 | | | 10,584 | | | 10,533 | | | 10,511 | | | 10,493 | |
Treasury shares | | | 1,043 | | | 705 | | | 703 | | | 703 | | | 703 | |
| | | | | | | | | | | | | | | | |
PERFORMANCE RATIOS (Annualized): | | | | | | | | | | | | | | | | |
Return on average assets | | | 1.72 | % | | 1.72 | % | | 1.85 | % | | 1.83 | % | | 1.80 | % |
Return on average equity | | | 17.14 | | | 16.82 | | | 17.39 | | | 17.32 | | | 17.64 | |
Efficiency ratio | | | 44.56 | | | 43.24 | | | 39.59 | | | 42.84 | | | 45.86 | |
Noninterest expense to average assets | | | 1.91 | | | 1.96 | | | 1.87 | | | 2.08 | | | 2.06 | |
| | | | | | | | | | | | | | | | |
BALANCE SHEET DATA: | | | | | | | | | | | | | | | | |
Total assets | | $ | 2,475,851 | | $ | 2,444,948 | | $ | 2,339,537 | | $ | 2,117,156 | | $ | 2,067,692 | |
Total securities | | | 138,264 | | | 140,946 | | | 136,871 | | | 139,835 | | | 116,254 | |
Total loans | | | 2,130,919 | | | 2,106,559 | | | 1,942,414 | | | 1,801,593 | | | 1,701,384 | |
Allowance for credit losses | | | 26,201 | | | 25,196 | | | 23,861 | | | 22,858 | | | 22,168 | |
Total deposits | | | 1,823,921 | | | 1,787,528 | | | 1,796,597 | | | 1,697,967 | | | 1,771,168 | |
Total shareholders' equity | | | 240,459 | | | 239,227 | | | 230,234 | | | 220,789 | | | 214,928 | |
| | | | | | | | | | | | | | | | |
TAX EQUIVALENT YIELDS AND RATES: | | | | | | | | | | | | | | | | |
Interest-earning assets | | | 5.84 | % | | 5.48 | % | | 5.09 | % | | 4.66 | % | | 4.36 | % |
Interest-bearing liabilities | | | 2.27 | | | 1.44 | | | 0.72 | | | 0.41 | | | 0.38 | |
Net interest spread | | | 3.57 | | | 4.04 | | | 4.37 | | | 4.25 | | | 3.98 | |
Net interest margin | | | 4.19 | | | 4.47 | | | 4.61 | | | 4.39 | | | 4.11 | |
| | | | | | | | | | | | | | | | |
CREDIT QUALITY: | | | | | | | | | | | | | | | | |
Nonperforming assets | | $ | 14,683 | | $ | 9,065 | | $ | 8,033 | | $ | 7,680 | | $ | 9,301 | |
QTD annualized net (chargeoffs)/recoveries to QTD average loans | | | 0.01 | % | | (0.06) | % | | (0.11) | % | | (0.11) | % | | 0.01 | % |
Allowance for credit losses to total loans | | | 1.23 | | | 1.20 | | | 1.23 | | | 1.27 | | | 1.30 | |
Nonperforming loans to total loans | | | 0.69 | | | 0.43 | | | 0.41 | | | 0.43 | | | 0.55 | |
Nonperforming assets to total assets | | | 0.59 | | | 0.37 | | | 0.34 | | | 0.36 | | | 0.45 | |
| | | | | | | | | | | | | | | | |
CAPITAL RATIOS AND OTHER: | | | | | | | | | | | | | | | | |
Total equity to total assets | | | 9.71 | % | | 9.78 | % | | 9.84 | % | | 10.43 | % | | 10.39 | % |
Community bank leverage ratio | | | 10.38 | | | 10.88 | | | 10.85 | | | 11.20 | | | 10.87 | |
| | | | | | | | | | | | | | | | |
Number of banking offices | | | 20 | | | 19 | | | 18 | | | 19 | | | 19 | |
Number of employees | | | 228 | | | 231 | | | 222 | | | 213 | | | 209 | |