Exhibit 99.1
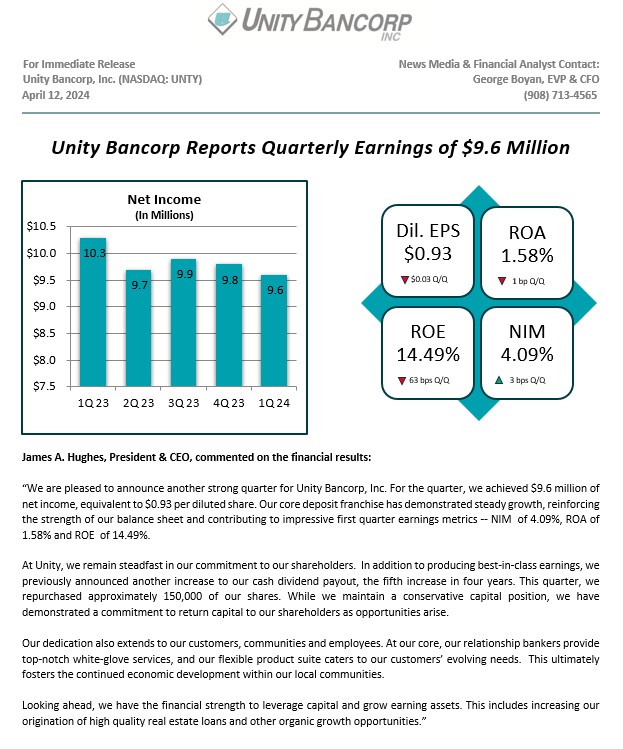
Clinton, NJ -- Unity Bancorp, Inc. (NASDAQ: UNTY), parent company of Unity Bank, reported net income of $9.6 million, or $0.93 per diluted share, for the quarter ended March 31, 2024, compared to net income of $9.8 million, or $0.96 per diluted share for the quarter ended December 31, 2023. This represents a 1.9% decrease in net income and a 3.1% decrease in net income per diluted share.
First Quarter Earnings Highlights
| ● | The provision for credit losses on loans was $0.6 million for the quarter ended March 31, 2024, compared to $0.4 million for the quarter ended December 31, 2023. The increase was primarily driven by increases in the general and specific reserve calculations. |
| ● | Noninterest income was $1.7 million for the quarter ended March 31, 2024, compared to $2.6 million for the quarter ended December 31, 2023. The $0.9 million decrease was primarily due to smaller mark-to-market increases in the Company’s equity portfolio, lower SBA sale gains and lower service and loan fee income. The Bank sold $2.4 million of SBA loans during the quarter ended March 31, 2024, compared to $4.7 million during the quarter ended December 31, 2023. |
| ● | The effective tax rate was 25.0% for the quarter ended March 31, 2024, compared to 25.1% for the quarter ending December 31, 2023. |
Balance Sheet Highlights
| ● | Total gross loans increased $2.4 million, or 0.1%, from December 31, 2023, primarily due to increases in commercial loans. These increases were partially offset by decreases in the residential mortgage and residential construction loan categories. |
| ● | As of March 31, 2024, the allowance for credit losses as a percentage of gross loans was 1.20%. |
| ● | Total deposits increased $37.1 million, or 1.9%, from December 31, 2023. As of March 31, 2024, 17.2% of total deposits were uninsured or uncollateralized. The Company’s deposit composition as of March 31, 2024, consisted of 20.2% in noninterest bearing demand deposits, 16.6% in interest-bearing demand deposits, 28.8% in savings deposits, and 34.4% in time deposits. |
| ● | As of March 31, 2024, the loan to deposit ratio was approximately 110.9%, representing a continued reduction from 112.9% as of December 31, 2023. As the Company continues to operate closer to 110%, management will re-evaluate lending initiatives. |
| ● | Borrowed funds decreased $57.0 million from December 31, 2023. Borrowed funds were entirely comprised of borrowings from the FHLB. |
| ● | Shareholders’ equity was $266.8 million as of March 31, 2024, compared to $261.4 million as of December 31, 2023. The $5.3 million increase was primarily driven by first quarter earnings, partially offset by share repurchases and dividend payments. In the first quarter of 2024, Unity Bancorp repurchased 150,000 shares for approximately $4.1 million, or a weighted average price of $27.17 per share. |
| ● | Book value per common share was $26.56 as of March 31, 2024, compared to $25.98 as of December 31, 2023 primarily reflecting earnings, dividend payouts and share repurchases. |
| ● | Below is a summary of the Company’s regulatory capital ratios: |
| o | Leverage Ratio increased 25 basis points to 11.39% at March 31, 2024, compared to 11.14% at December 31, 2023. |
| o | Common Equity Tier 1 Capital Ratio increased 20 basis points to 12.90% at March 31, 2024, compared to 12.70% at December 31, 2023. |
| o | Tier 1 Capital Ratio increased 20 basis points to 13.38% at March 31, 2024, compared to 13.18% at December 31, 2023. |
| o | Total Capital Ratio increased 20 basis points, to 14.63% at March 31, 2024, compared to 14.43% at December 31, 2023. |
| ● | At March 31, 2024, the Company held $183.0 million of cash and cash equivalents. Further, the Company maintained approximately $546.0 million of funding available from various funding sources, including the FHLB, FRB Discount Window |
| and other lines of credit. Additionally, the Company can pledge securities for further borrowing capacity. Total available funding plus cash on hand represented 215.6% of uninsured or uncollateralized deposits. |
| ❖ | In February 2024, Unity Bancorp Inc. announced an 8% increase in its first quarter dividend, to $0.13 per common share compared to $0.12 per common share in the prior quarter. This represents the fifth increase in the last four years. |
| ❖ | In March 2024, Unity Bank qualified for the FHLBNY’s 0% Development Advance Program (ZDA). Under this program, Unity Bank was approved for a $4.4 million zero percent advance because the Bank originated small business community development loans that qualified under the FHLBNY’s program guidelines. Unity Bank has also participated in this program in 2023 when it similarly qualified for a $4.4 million advance. |
| ❖ | On April 25, 2024, Unity Bancorp Inc. will hold its annual shareholder meeting. Investors are encouraged to submit their proxy votes at: meetnow.global/M52SR5Z |
Unity Bancorp, Inc. is a financial services organization headquartered in Clinton, New Jersey, with approximately $2.6 billion in assets and $2.0 billion in deposits. Unity Bank, the Company’s wholly owned subsidiary, provides financial services to retail, corporate and small business customers through its robust branch network located in Bergen, Hunterdon, Middlesex, Morris, Ocean, Somerset, Union and Warren Counties in New Jersey and Northampton County in Pennsylvania. For additional information about Unity, visit our website at www.unitybank.com , or call 800-618-BANK.
This news release contains certain forward-looking statements, either expressed or implied, which are provided to assist the reader in understanding anticipated future financial performance. These statements may be identified by use of the words “believe”, “expect”, “intend”, “anticipate”, “estimate”, “project” or similar expressions. These statements involve certain risks, uncertainties, estimates and assumptions made by management, which are subject to factors beyond the Company’s control and could impede its ability to achieve these goals. These factors include those items included in our Annual Report on Form 10-K under the heading “Item IA-Risk Factors” as amended or supplemented by our subsequent filings with the SEC, as well as general economic conditions, trends in interest rates, the ability of our borrowers to repay their loans, our ability to manage and reduce the level of our nonperforming assets, results of regulatory exams, and the impact of COVID-19 on the Bank, its employees and customers, among other factors.
UNITY BANCORP, INC.
SUMMARY FINANCIAL HIGHLIGHTS
March 31, 2024
| | | | | | | | | | | | | | | | |
| | | | | | | | | | | | March 31, 2024 vs. | | |||
| | | | | | | | | | | | December 31, 2023 | | March 31, 2023 | | |
(In thousands, except percentages and per share amounts) | | March 31, 2024 | | December 31, 2023 | | March 31, 2023 | | | % | | % | | ||||
BALANCE SHEET DATA | | | | | | | | | | | | | | | | |
Total assets | | $ | 2,568,088 | | $ | 2,578,507 | | $ | 2,475,851 | | | (0.4) | % | 3.7 | % | |
Total deposits | | | 1,961,270 | | | 1,924,140 | | | 1,823,921 | | | 1.9 | | 7.5 | | |
Total gross loans | | | 2,174,457 | | | 2,172,063 | | | 2,130,919 | | | 0.1 | | 2.0 | | |
Total securities | | | 138,702 | | | 135,689 | | | 138,264 | | | 2.2 | | 0.3 | | |
Total shareholders' equity | | | 266,761 | | | 261,430 | | | 240,459 | | | 2.0 | | 10.9 | | |
Allowance for credit losses | | | 26,080 | | | 25,854 | | | 26,201 | | | 0.9 | | (0.5) | | |
| | | | | | | | | | | | | | | | |
FINANCIAL DATA - QUARTER TO DATE | | | | | | | | | | | | | | | | |
Income before provision for income taxes | | $ | 12,784 | | $ | 13,048 | | $ | 13,791 | | | (2.0) | | (7.3) | | |
Provision for income taxes | | | 3,198 | | | 3,278 | | | 3,504 | | | (2.4) | | (8.7) | | |
Net income | | $ | 9,586 | | $ | 9,770 | | $ | 10,287 | | | (1.9) | | (6.8) | | |
| | | | | | | | | | | | | | | | |
Net income per common share - Basic | | $ | 0.95 | | $ | 0.97 | | $ | 0.98 | | | (2.1) | | (3.1) | | |
Net income per common share - Diluted | | | 0.93 | | | 0.96 | | | 0.96 | | | (3.1) | | (3.1) | | |
| | | | | | | | | | | | | | | | |
PERFORMANCE RATIOS - QUARTER TO DATE (annualized) | | | | | | | | | | | | | | | | |
Return on average assets | | | 1.58 | % | | 1.59 | % | | 1.72 | % | | | | | | |
Return on average equity | | | 14.49 | | | 15.12 | | | 17.14 | | | | | | | |
Efficiency ratio ** | | | 47.57 | | | 43.06 | | | 44.56 | | | | | | | |
Net interest margin | | | 4.09 | | | 4.06 | | | 4.19 | | | | | | | |
| | | | | | | | | | | | | | | | |
SHARE INFORMATION | | | | | | | | | | | | | | | | |
Market price per share | | $ | 27.60 | | $ | 29.59 | | $ | 22.81 | | | (6.7) | | 21.0 | | |
Dividends paid | | | 0.13 | | | 0.12 | | | 0.12 | | | 8.3 | | 8.3 | | |
Book value per common share | | | 26.56 | | | 25.98 | | | 23.34 | | | 2.2 | | 13.8 | | |
Average diluted shares outstanding (QTD) | | | 10,276 | | | 10,209 | | | 10,686 | | | 0.7 | | (3.8) | | |
| | | | | | | | | | | | | | | | |
CAPITAL RATIOS*** | | | | | | | | | | | | | | | | |
Total equity to total assets | | | 10.39 | % | | 10.14 | % | | 9.71 | % | | 2.5 | | 7.0 | | |
Leverage ratio | | | 11.39 | | | 11.14 | | | 10.38 | | | 2.2 | | 9.7 | | |
Common Equity Tier 1 Capital Ratio | | | 12.90 | | | 12.70 | | | 11.76 | | | 1.6 | | 9.7 | | |
Risk-based Tier 1 Capital Ratio | | | 13.38 | | | 13.18 | | | 12.25 | | | 1.5 | | 9.2 | | |
Risk-based Total Capital Ratio | | | 14.63 | | | 14.43 | | | 13.50 | | | 1.4 | | 8.4 | | |
| | | | | | | | | | | | | | | | |
CREDIT QUALITY AND RATIOS | | | | | | | | | | | | | | | | |
Nonperforming assets | | $ | 16,890 | | $ | 19,186 | | $ | 14,683 | | | (12.0) | | 15.0 | | |
QTD annualized net (chargeoffs)/recoveries to QTD average loans | | | (0.08) | % | | (0.09) | % | | 0.01 | % | | | | | | |
Allowance for credit losses to total loans | | | 1.20 | | | 1.19 | | | 1.23 | | | | | | | |
Nonperforming loans to total loans | | | 0.78 | | | 0.88 | | | 0.69 | | | | | | | |
Nonperforming assets to total assets | | | 0.66 | | | 0.74 | | | 0.59 | | | | | | | |
** The efficiency ratio is a non-GAAP measure, calculated based on the noninterest expense divided by the sum of net interest income plus non interest income, excluding net gains and losses on securities and provision for impairment losses, AFS securities. | ||||||||||||||||
*** Represents Bancorp consolidated capital ratios. | | | | | | | | | | | | | | | | |
UNITY BANCORP, INC.
CONSOLIDATED BALANCE SHEETS
March 31, 2024
| | | | | | | | | | | | | | | |
| | | | | | | | | | | | March 31, 2024 vs. | | ||
| | | | | | | | | | | | December 31, 2023 | | March 31, 2023 | |
(In thousands, except percentages) | | March 31, 2024 | | December 31, 2023 | | March 31, 2023 | | | % | | % | | |||
| | | | | | | | | | | | | | | |
ASSETS | | | | | | | | | | | | | | | |
Cash and due from banks | | $ | 20,619 | | $ | 20,668 | | $ | 23,893 | | | (0.2) | % | (13.7) | % |
Interest-bearing deposits | | | 162,367 | | | 174,108 | | | 103,194 | | | (6.7) | | 57.3 | |
Cash and cash equivalents | | | 182,986 | | | 194,776 | | | 127,087 | | | (6.1) | | 44.0 | |
Securities: | | | | | | | | | | | | | | | |
Debt securities available for sale, at market value | | | 94,682 | | | 91,765 | | | 94,113 | | | 3.2 | | 0.6 | |
Debt securities held to maturity, at book value | | | 36,089 | | | 36,122 | | | 35,824 | | | (0.1) | | 0.7 | |
Equity securities, at market value | | | 7,931 | | | 7,802 | | | 8,327 | | | 1.7 | | (4.8) | |
Total securities | | | 138,702 | | | 135,689 | | | 138,264 | | | 2.2 | | 0.3 | |
Loans: | | | | | | | | | | | | | | | |
SBA loans held for sale | | | 18,439 | | | 18,242 | | | 23,314 | | | 1.1 | | (20.9) | |
SBA loans held for investment | | | 39,009 | | | 38,584 | | | 39,370 | | | 1.1 | | (0.9) | |
SBA PPP loans | | | 2,168 | | | 2,318 | | | 2,545 | | | (6.5) | | (14.8) | |
Commercial loans | | | 1,291,319 | | | 1,277,460 | | | 1,205,642 | | | 1.1 | | 7.1 | |
Residential mortgage loans | | | 627,464 | | | 631,506 | | | 619,140 | | | (0.6) | | 1.3 | |
Consumer loans | | | 72,275 | | | 72,676 | | | 76,784 | | | (0.6) | | (5.9) | |
Residential construction loans | | | 123,783 | | | 131,277 | | | 164,124 | | | (5.7) | | (24.6) | |
Total loans | | | 2,174,457 | | | 2,172,063 | | | 2,130,919 | | | 0.1 | | 2.0 | |
Allowance for credit losses | | | (26,080) | | | (25,854) | | | (26,201) | | | 0.9 | | (0.5) | |
Net loans | | | 2,148,377 | | | 2,146,209 | | | 2,104,718 | | | 0.1 | | 2.1 | |
Premises and equipment, net | | | 19,281 | | | 19,567 | | | 19,868 | | | (1.5) | | (3.0) | |
Bank owned life insurance ("BOLI") | | | 25,295 | | | 25,230 | | | 26,856 | | | 0.3 | | (5.8) | |
Deferred tax assets | | | 12,681 | | | 12,552 | | | 12,360 | | | 1.0 | | 2.6 | |
Federal Home Loan Bank ("FHLB") stock | | | 15,896 | | | 18,435 | | | 18,688 | | | (13.8) | | (14.9) | |
Accrued interest receivable | | | 13,165 | | | 13,582 | | | 14,314 | | | (3.1) | | (8.0) | |
Goodwill | | | 1,516 | | | 1,516 | | | 1,516 | | | - | | - | |
Prepaid expenses and other assets | | | 10,189 | | | 10,951 | | | 12,180 | | | (7.0) | | (16.3) | |
Total assets | | $ | 2,568,088 | | $ | 2,578,507 | | $ | 2,475,851 | | | (0.4) | % | 3.7 | % |
| | | | | | | | | | | | | | | |
LIABILITIES AND SHAREHOLDERS' EQUITY | | | | | | | | | | | | | |||
Liabilities: | | | | | | | | | | | | | | | |
Deposits: | | | | | | | | | | | | | | | |
Noninterest-bearing demand | | $ | 395,520 | | $ | 419,636 | | $ | 450,058 | | | (5.7) | % | (12.1) | % |
Interest-bearing demand | | | 325,174 | | | 312,208 | | | 288,217 | | | 4.2 | | 12.8 | |
Savings | | | 504,210 | | | 497,491 | | | 515,365 | | | 1.4 | | (2.2) | |
Brokered deposits | | | 235,755 | | | 268,408 | | | 244,372 | | | (12.2) | | (3.5) | |
Time deposits | | | 500,611 | | | 426,397 | | | 325,909 | | | 17.4 | | 53.6 | |
Total deposits | | | 1,961,270 | | | 1,924,140 | | | 1,823,921 | | | 1.9 | | 7.5 | |
Borrowed funds | | | 299,397 | | | 356,438 | | | 374,000 | | | (16.0) | | (19.9) | |
Subordinated debentures | | | 10,310 | | | 10,310 | | | 10,310 | | | - | | - | |
Accrued interest payable | | | 1,551 | | | 1,924 | | | 932 | | | (19.4) | | 66.4 | |
Accrued expenses and other liabilities | | | 28,799 | | | 24,265 | | | 26,229 | | | 18.7 | | 9.8 | |
Total liabilities | | | 2,301,327 | | | 2,317,077 | | | 2,235,392 | | | (0.7) | | 2.9 | |
Shareholders' equity: | | | | | | | | | | | | | | | |
Common stock | | | 101,676 | | | 100,426 | | | 98,197 | | | 1.2 | | 3.5 | |
Retained earnings | | | 199,380 | | | 191,108 | | | 165,335 | | | 4.3 | | 20.6 | |
Treasury stock, at cost | | | (31,443) | | | (27,367) | | | (19,894) | | | 14.9 | | 58.1 | |
Accumulated other comprehensive loss | | | (2,852) | | | (2,737) | | | (3,179) | | | 4.2 | | (10.3) | |
Total shareholders' equity | | | 266,761 | | | 261,430 | | | 240,459 | | | 2.0 | | 10.9 | |
Total liabilities and shareholders' equity | | $ | 2,568,088 | | $ | 2,578,507 | | $ | 2,475,851 | | | (0.4) | % | 3.7 | % |
| | | | | | | | | | | | | | | |
Shares issued | | | 11,555 | | | 11,424 | | | 11,335 | | | | | | |
Shares outstanding | | | 10,044 | | | 10,063 | | | 10,292 | | | | | | |
Treasury shares | | | 1,511 | | | 1,361 | | | 1,043 | | | | | | |
| | | | | | | | | | | | | | | |
*NM=Not meaningful | | | | | | | | | | | | | | | |
UNITY BANCORP, INC.
QTD CONSOLIDATED STATEMENTS OF INCOME
March 31, 2024
| | | | | | | | | | | | | | | | | | | | | | | |
| | | | | | | | | | | | March 31, 2024 vs. | | ||||||||||
| | For the three months ended | | | December 31, 2023 | | March 31, 2023 | | |||||||||||||||
(In thousands, except percentages and per share amounts) | | March 31, 2024 | | December 31, 2023 | | March 31, 2023 | | | $ | | % | | $ | | % | | |||||||
INTEREST INCOME | | | | | | | | | | | | | | | | | | | | | | | |
Interest-bearing deposits | | $ | 420 | | $ | 466 | | $ | 333 | | | $ | (46) | | | (9.9) | % | $ | 87 | | | 26.1 | % |
FHLB stock | | | 280 | | | 331 | | | 331 | | | | (51) | | | (15.4) | | | (51) | | | (15.4) | |
Securities: | | | | | | | | | | | | | | | | | | | | | | | |
Taxable | | | 1,849 | | | 1,886 | | | 1,739 | | | | (37) | | | (2.0) | | | 110 | | | 6.3 | |
Tax-exempt | | | 18 | | | 17 | | | 19 | | | | 1 | | | 5.9 | | | (1) | | | (5.3) | |
Total securities | | | 1,867 | | | 1,903 | | | 1,758 | | | | (36) | | | (1.9) | | | 109 | | | 6.2 | |
Loans: | | | | | | | | | | | | | | | | | | | | | | | |
SBA loans | | | 1,333 | | | 1,303 | | | 1,404 | | | | 30 | | | 2.3 | | | (71) | | | (5.1) | |
SBA PPP loans | | | 8 | | | 8 | | | 77 | | | | - | | | - | | | (69) | | | (89.6) | |
Commercial loans | | | 20,830 | | | 20,646 | | | 17,401 | | | | 184 | | | 0.9 | | | 3,429 | | | 19.7 | |
Residential mortgage loans | | | 9,219 | | | 9,091 | | | 8,109 | | | | 128 | | | 1.4 | | | 1,110 | | | 13.7 | |
Consumer loans | | | 1,402 | | | 1,391 | | | 1,354 | | | | 11 | | | 0.8 | | | 48 | | | 3.5 | |
Residential construction loans | | | 2,578 | | | 2,619 | | | 2,586 | | | | (41) | | | (1.6) | | | (8) | | | (0.3) | |
Total loans | | | 35,370 | | | 35,058 | | | 30,931 | | | | 312 | | | 0.9 | | | 4,439 | | | 14.4 | |
Total interest income | | | 37,937 | | | 37,758 | | | 33,353 | | | | 179 | | | 0.5 | | | 4,584 | | | 13.7 | |
INTEREST EXPENSE | | | | | | | | | | | | | | | | | | | | | | | |
Interest-bearing demand deposits | | | 1,710 | | | 1,523 | | | 965 | | | | 187 | | | 12.3 | | | 745 | | | 77.2 | |
Savings deposits | | | 3,144 | | | 3,037 | | | 1,554 | | | | 107 | | | 3.5 | | | 1,590 | | | 102.3 | |
Brokered deposits | | | 2,295 | | | 2,285 | | | 1,562 | | | | 10 | | | 0.4 | | | 733 | | | 46.9 | |
Time deposits | | | 4,699 | | | 4,011 | | | 1,563 | | | | 688 | | | 17.2 | | | 3,136 | | | 200.6 | |
Borrowed funds and subordinated debentures | | | 2,248 | | | 2,871 | | | 3,799 | | | | (623) | | | (21.7) | | | (1,551) | | | (40.8) | |
Total interest expense | | | 14,096 | | | 13,727 | | | 9,443 | | | | 369 | | | 2.7 | | | 4,653 | | | 49.3 | |
Net interest income | | | 23,841 | | | 24,031 | | | 23,910 | | | | (190) | | | (0.8) | | | (69) | | | (0.3) | |
Provision for credit losses, loans | | | 641 | | | 413 | | | 108 | | | | 228 | | | 55.2 | | | 533 | | | 493.5 | |
Provision for credit losses, off-balance sheet | | | 2 | | | 115 | | | - | | | | (113) | | | (98.3) | | | 2 | | | *NM | |
Provision for impairment losses, AFS securities | | | - | | | 1,283 | | | - | | | | (1,283) | | | (100.0) | | | - | | | - | |
Net interest income after provision for credit losses | | | 23,198 | | | 22,220 | | | 23,802 | | | | 978 | | | 4.4 | | | (604) | | | (2.5) | |
NONINTEREST INCOME | | | | | | | | | | | | | | | | | | | | | | | |
Branch fee income | | | 243 | | | 256 | | | 235 | | | | (13) | | | (5.1) | | | 8 | | | 3.4 | |
Service and loan fee income | | | 457 | | | 550 | | | 503 | | | | (93) | | | (16.9) | | | (46) | | | (9.1) | |
Gain on sale of SBA loans held for sale, net | | | 238 | | | 403 | | | 309 | | | | (165) | | | (40.9) | | | (71) | | | (23.0) | |
Gain on sale of mortgage loans, net | | | 320 | | | 351 | | | 244 | | | | (31) | | | (8.8) | | | 76 | | | 31.1 | |
BOLI income | | | 65 | | | 9 | | | 80 | | | | 56 | | | 622.2 | | | (15) | | | (18.8) | |
Net securities gains (losses) | | | 54 | | | 617 | | | (322) | | | | (563) | | | (91.2) | | | 376 | | | 116.8 | |
Other income | | | 341 | | | 382 | | | 368 | | | | (41) | | | (10.7) | | | (27) | | | (7.3) | |
Total noninterest income | | | 1,718 | | | 2,568 | | | 1,417 | | | | (850) | | | (33.1) | | | 301 | | | 21.2 | |
NONINTEREST EXPENSE | | | | | | | | | | | | | | | | | | | | | | | |
Compensation and benefits | | | 7,357 | | | 7,250 | | | 7,090 | | | | 107 | | | 1.5 | | | 267 | | | 3.8 | |
Processing and communications | | | 906 | | | 822 | | | 804 | | | | 84 | | | 10.2 | | | 102 | | | 12.7 | |
Occupancy | | | 798 | | | 775 | | | 770 | | | | 23 | | | 3.0 | | | 28 | | | 3.6 | |
Furniture and equipment | | | 684 | | | 756 | | | 689 | | | | (72) | | | (9.5) | | | (5) | | | (0.7) | |
Professional services | | | 436 | | | 492 | | | 427 | | | | (56) | | | (11.4) | | | 9 | | | 2.1 | |
Advertising | | | 400 | | | 328 | | | 260 | | | | 72 | | | 22.0 | | | 140 | | | 53.8 | |
Loan related expenses | | | 384 | | | 398 | | | 175 | | | | (14) | | | (3.5) | | | 209 | | | 119.4 | |
Deposit insurance | | | 339 | | | 353 | | | 348 | | | | (14) | | | (4.0) | | | (9) | | | (2.6) | |
Director fees | | | 247 | | | 218 | | | 217 | | | | 29 | | | 13.3 | | | 30 | | | 13.8 | |
Other expenses | | | 581 | | | 348 | | | 648 | | | | 233 | | | 67.0 | | | (67) | | | (10.3) | |
Total noninterest expense | | | 12,132 | | | 11,740 | | | 11,428 | | | | 392 | | | 3.3 | | | 704 | | | 6.2 | |
Income before provision for income taxes | | | 12,784 | | | 13,048 | | | 13,791 | | | | (264) | | | (2.0) | | | (1,007) | | | (7.3) | |
Provision for income taxes | | | 3,198 | | | 3,278 | | | 3,504 | | | | (80) | | | (2.4) | | | (306) | | | (8.7) | |
Net income | | $ | 9,586 | | $ | 9,770 | | $ | 10,287 | | | $ | (184) | | | (1.9) | % | $ | (701) | | | (6.8) | % |
| | | | | | | | | | | | | | | | | | | | | | | |
Effective tax rate | | | 25.0 | % | | 25.1 | % | | 25.4 | % | | | | | | | | | | | | | |
| | | | | | | | | | | | | | | | | | | | | | | |
Net income per common share - Basic | | $ | 0.95 | | $ | 0.97 | | $ | 0.98 | | | | | | | | | | | | | | |
Net income per common share - Diluted | | | 0.93 | | | 0.96 | | | 0.96 | | | | | | | | | | | | | | |
| | | | | | | | | | | | | | | | | | | | | | | |
Weighted average common shares outstanding - Basic | | | 10,127 | | | 10,066 | | | 10,538 | | | | | | | | | | | | | | |
Weighted average common shares outstanding - Diluted | | | 10,276 | | | 10,209 | | | 10,686 | | | | | | | | | | | | | | |
*NM=Not meaningful | | | | | | | | | | | | | | | | | | | | | | | |
UNITY BANCORP, INC.
QUARTER TO DATE NET INTEREST MARGIN
March 31, 2024
| | | | | | | | | | | | | | | | | | | |
| | For the three months ended | | ||||||||||||||||
(Dollar amounts in thousands, interest amounts and | | March 31, 2024 | | March 31, 2023 | | ||||||||||||||
interest rates/yields on a fully tax-equivalent basis) | | Average Balance | | Interest | | Rate/Yield | | Average Balance | | Interest | | Rate/Yield | | ||||||
ASSETS | | | | | | | | | | | | | | | | | | | |
Interest-earning assets: | | | | | | | | | | | | | | | | | | | |
Interest-bearing deposits | | $ | 30,685 | | $ | 420 | | | 5.50 | % | $ | 32,778 | | $ | 333 | | | 4.12 | % |
FHLB stock | | | 11,000 | | | 280 | | | 10.23 | | | 16,776 | | | 331 | | | 7.99 | |
Securities: | | | | | | | | | | | | | | | | | | | |
Taxable | | | 134,874 | | | 1,849 | | | 5.48 | | | 138,379 | | | 1,739 | | | 5.03 | |
Tax-exempt | | | 1,658 | | | 18 | | | 4.47 | | | 1,753 | | | 20 | | | 4.49 | |
Total securities (A) | | | 136,532 | | | 1,867 | | | 5.47 | | | 140,132 | | | 1,759 | | | 5.02 | |
Loans: | | | | | | | | | | | | | | | | | | | |
SBA loans | | | 58,120 | | | 1,333 | | | 9.17 | | | 66,625 | | | 1,404 | | | 8.43 | |
SBA PPP loans | | | 2,215 | | | 8 | | | 1.38 | | | 4,243 | | | 77 | | | 7.26 | |
Commercial loans | | | 1,281,600 | | | 20,830 | | | 6.43 | | | 1,199,577 | | | 17,401 | | | 5.80 | |
Residential mortgage loans | | | 625,451 | | | 9,219 | | | 5.90 | | | 614,936 | | | 8,109 | | | 5.27 | |
Consumer loans | | | 70,250 | | | 1,402 | | | 7.90 | | | 77,121 | | | 1,354 | | | 7.02 | |
Residential construction loans | | | 129,720 | | | 2,578 | | | 7.86 | | | 163,821 | | | 2,586 | | | 6.31 | |
Total loans (B) | | | 2,167,356 | | | 35,370 | | | 6.46 | | | 2,126,323 | | | 30,931 | | | 5.82 | |
Total interest-earning assets | | $ | 2,345,573 | | $ | 37,937 | | | 6.51 | % | $ | 2,316,009 | | $ | 33,354 | | | 5.84 | % |
| | | | | | | | | | | | | | | | | | | |
Noninterest-earning assets: | | | | | | | | | | | | | | | | | | | |
Cash and due from banks | | | 23,220 | | | | | | | | | 22,738 | | | | | | | |
Allowance for credit losses | | | (26,059) | | | | | | | | | (25,778) | | | | | | | |
Other assets | | | 94,001 | | | | | | | | | 111,104 | | | | | | | |
Total noninterest-earning assets | | | 91,162 | | | | | | | | | 108,064 | | | | | | | |
Total assets | | $ | 2,436,735 | | | | | | | | $ | 2,424,073 | | | | | | | |
| | | | | | | | | | | | | | | | | | | |
LIABILITIES AND SHAREHOLDERS' EQUITY | | | | | | | | | | | | | | | | | | | |
Interest-bearing liabilities: | | | | | | | | | | | | | | | | | | | |
Interest-bearing demand deposits | | $ | 324,829 | | $ | 1,710 | | | 2.12 | % | $ | 286,172 | | $ | 965 | | | 1.37 | % |
Savings deposits | | | 503,071 | | | 3,144 | | | 2.51 | | | 536,021 | | | 1,554 | | | 1.18 | |
Brokered deposits | | | 243,592 | | | 2,295 | | | 3.79 | | | 236,724 | | | 1,562 | | | 2.68 | |
Time deposits | | | 465,166 | | | 4,699 | | | 4.06 | | | 286,354 | | | 1,563 | | | 2.21 | |
Total interest-bearing deposits | | | 1,536,658 | | | 11,848 | | | 3.10 | | | 1,345,271 | | | 5,644 | | | 1.70 | |
Borrowed funds and subordinated debentures | | | 201,335 | | | 2,248 | | | 4.41 | | | 342,398 | | | 3,799 | | | 4.44 | |
Total interest-bearing liabilities | | $ | 1,737,993 | | $ | 14,096 | | | 3.26 | % | $ | 1,687,669 | | $ | 9,443 | | | 2.27 | % |
| | | | | | | | | | | | | | | | | | | |
Noninterest-bearing liabilities: | | | | | | | | | | | | | | | | | | | |
Noninterest-bearing demand deposits | | | 403,847 | | | | | | | | | 468,407 | | | | | | | |
Other liabilities | | | 28,747 | | | | | | | | | 24,541 | | | | | | | |
Total noninterest-bearing liabilities | | | 432,594 | | | | | | | | | 492,948 | | | | | | | |
Total shareholders' equity | | | 266,148 | | | | | | | | | 243,456 | | | | | | | |
Total liabilities and shareholders' equity | | $ | 2,436,735 | | | | | | | | $ | 2,424,073 | | | | | | | |
| | | | | | | | | | | | | | | | | | | |
Net interest spread | | | | | $ | 23,841 | | | 3.25 | % | | | | $ | 23,911 | | | 3.57 | % |
Tax-equivalent basis adjustment | | | | | | - | | | | | | | | | (1) | | | | |
Net interest income | | | | | $ | 23,841 | | | | | | | | $ | 23,910 | | | | |
Net interest margin | | | | | | | | | 4.09 | % | | | | | | | | 4.19 | % |
| | | | | | | | | | | | | | | | | | | |
| (A) | Yields related to securities exempt from federal and state income taxes are stated on a fully tax-equivalent basis. They are reduced by the nondeductible portion of interest expense, assuming a federal tax rate of 21 percent and applicable state rates. |
| (B) | The loan averages are stated net of unearned income, and the averages include loans on which the accrual of interest has been discontinued. |
UNITY BANCORP, INC.
QUARTER TO DATE NET INTEREST MARGIN
March 31, 2024
| | | | | | | | | | | | | | | | | | | |
| | For the three months ended | | ||||||||||||||||
(Dollar amounts in thousands, interest amounts and | | March 31, 2024 | | December 31, 2023 | | ||||||||||||||
interest rates/yields on a fully tax-equivalent basis) | | Average Balance | | Interest | | Rate/Yield | | Average Balance | | Interest | | Rate/Yield | | ||||||
ASSETS | | | | | | | | | | | | | | | | | | | |
Interest-earning assets: | | | | | | | | | | | | | | | | | | | |
Interest-bearing deposits | | $ | 30,685 | | $ | 420 | | | 5.50 | % | $ | 34,725 | | $ | 466 | | | 5.33 | % |
FHLB stock | | | 11,000 | | | 280 | | | 10.23 | | | 12,563 | | | 331 | | | 10.46 | |
Securities: | | | | | | | | | | | | | | | | | | | |
Taxable | | | 134,874 | | | 1,849 | | | 5.48 | | | 133,827 | | | 1,886 | | | 5.64 | |
Tax-exempt | | | 1,658 | | | 18 | | | 4.47 | | | 1,583 | | | 18 | | | 4.13 | |
Total securities (A) | | | 136,532 | | | 1,867 | | | 5.47 | | | 135,410 | | | 1,904 | | | 5.62 | |
Loans: | | | | | | | | | | | | | | | | | | | |
SBA loans | | | 58,120 | | | 1,333 | | | 9.17 | | | 58,962 | | | 1,303 | | | 8.84 | |
SBA PPP loans | | | 2,215 | | | 8 | | | 1.38 | | | 2,376 | | | 8 | | | 1.36 | |
Commercial loans | | | 1,281,600 | | | 20,830 | | | 6.43 | | | 1,270,550 | | | 20,646 | | | 6.36 | |
Residential mortgage loans | | | 625,451 | | | 9,219 | | | 5.90 | | | 630,598 | | | 9,091 | | | 5.77 | |
Consumer loans | | | 70,250 | | | 1,402 | | | 7.90 | | | 71,026 | | | 1,391 | | | 7.66 | |
Residential construction loans | | | 129,720 | | | 2,578 | | | 7.86 | | | 133,485 | | | 2,619 | | | 7.68 | |
Total loans (B) | | | 2,167,356 | | | 35,370 | | | 6.46 | | | 2,166,997 | | | 35,058 | | | 6.33 | |
Total interest-earning assets | | $ | 2,345,573 | | $ | 37,937 | | | 6.51 | % | $ | 2,349,695 | | $ | 37,759 | | | 6.38 | % |
| | | | | | | | | | | | | | | | | | | |
Noninterest-earning assets: | | | | | | | | | | | | | | | | | | | |
Cash and due from banks | | | 23,220 | | | | | | | | | 22,367 | | | | | | | |
Allowance for credit losses | | | (26,059) | | | | | | | | | (26,064) | | | | | | | |
Other assets | | | 94,001 | | | | | | | | | 94,253 | | | | | | | |
Total noninterest-earning assets | | | 91,162 | | | | | | | | | 90,556 | | | | | | | |
Total assets | | $ | 2,436,735 | | | | | | | | $ | 2,440,251 | | | | | | | |
| | | | | | | | | | | | | | | | | | | |
LIABILITIES AND SHAREHOLDERS' EQUITY | | | | | | | | | | | | | | | | | | | |
Interest-bearing liabilities: | | | | | | | | | | | | | | | | | | | |
Interest-bearing demand deposits | | $ | 324,829 | | $ | 1,710 | | | 2.12 | % | $ | 321,015 | | $ | 1,523 | | | 1.88 | % |
Savings deposits | | | 503,071 | | | 3,144 | | | 2.51 | | | 506,741 | | | 3,037 | | | 2.38 | |
Brokered deposits | | | 243,592 | | | 2,295 | | | 3.79 | | | 246,190 | | | 2,285 | | | 3.68 | |
Time deposits | | | 465,166 | | | 4,699 | | | 4.06 | | | 423,439 | | | 4,011 | | | 3.76 | |
Total interest-bearing deposits | | | 1,536,658 | | | 11,848 | | | 3.10 | | | 1,497,385 | | | 10,856 | | | 2.88 | |
Borrowed funds and subordinated debentures | | | 201,335 | | | 2,248 | | | 4.41 | | | 236,278 | | | 2,871 | | | 4.75 | |
Total interest-bearing liabilities | | $ | 1,737,993 | | $ | 14,096 | | | 3.26 | % | $ | 1,733,663 | | $ | 13,727 | | | 3.14 | % |
| | | | | | | | | | | | | | | | | | | |
Noninterest-bearing liabilities: | | | | | | | | | | | | | | | | | | | |
Noninterest-bearing demand deposits | | | 403,847 | | | | | | | | | 421,229 | | | | | | | |
Other liabilities | | | 28,747 | | | | | | | | | 29,047 | | | | | | | |
Total noninterest-bearing liabilities | | | 432,594 | | | | | | | | | 450,278 | | | | | | | |
Total shareholders' equity | | | 266,148 | | | | | | | | | 256,312 | | | | | | | |
Total liabilities and shareholders' equity | | $ | 2,436,735 | | | | | | | | $ | 2,440,251 | | | | | | | |
| | | | | | | | | | | | | | | | | | | |
Net interest spread | | | | | $ | 23,841 | | | 3.25 | % | | | | $ | 24,032 | | | 3.24 | % |
Tax-equivalent basis adjustment | | | | | | - | | | | | | | | | (1) | | | | |
Net interest income | | | | | $ | 23,841 | | | | | | | | $ | 24,031 | | | | |
Net interest margin | | | | | | | | | 4.09 | % | | | | | | | | 4.06 | % |
| | | | | | | | | | | | | | | | | | | |
| (A) | Yields related to securities exempt from federal and state income taxes are stated on a fully tax-equivalent basis. They are reduced by the nondeductible portion of interest expense, assuming a federal tax rate of 21 percent and applicable state rates. |
| (B) | The loan averages are stated net of unearned income, and the averages include loans on which the accrual of interest has been discontinued. |
UNITY BANCORP, INC.
QUARTERLY ALLOWANCE FOR CREDIT LOSSES AND LOAN QUALITY SCHEDULES
March 31, 2024
| | | | | | | | | | | | | | | |
Amounts in thousands, except percentages | | March 31, 2024 | | December 31, 2023 | | September 30, 2023 | | June 30, 2023 | | March 31, 2023 | |||||
ALLOWANCE FOR CREDIT LOSSES: | | | | | | | | | | | | | | | |
Balance, beginning of period | | $ | 25,854 | | $ | 25,918 | | $ | 25,988 | | $ | 26,201 | | $ | 25,196 |
Impact of the adoption of ASU 2016-13 ("CECL") | | | - | | | - | | | - | | | - | | | 847 |
Provision for credit losses on loans charged to expense | | | 641 | | | 413 | | | 534 | | | 777 | | | 108 |
| | | 26,495 | | | 26,331 | | | 26,522 | | | 26,978 | | | 26,151 |
Less: Chargeoffs | | | | | | | | | | | | | | | |
SBA loans | | | - | | | - | | | 100 | | | - | | | 113 |
Commercial loans | | | 98 | | | 252 | | | 500 | | | - | | | - |
Residential mortgage loans | | | - | | | - | | | - | | | - | | | - |
Consumer loans | | | 70 | | | 274 | | | 52 | | | 225 | | | 120 |
Residential construction loans | | | 277 | | | 100 | | | - | | | 900 | | | - |
Total chargeoffs | | | 445 | | | 626 | | | 652 | | | 1,125 | | | 233 |
Add: Recoveries | | | | | | | | | | | | | | | |
SBA loans | | | 8 | | | - | | | 1 | | | 15 | | | - |
Commercial loans | | | 12 | | | 23 | | | 10 | | | 96 | | | 271 |
Residential mortgage loans | | | - | | | 4 | | | - | | | - | | | - |
Consumer loans | | | 10 | | | 11 | | | 37 | | | 24 | | | 12 |
Residential construction loans | | | - | | | 111 | | | - | | | - | | | - |
Total recoveries | | | 30 | | | 149 | | | 48 | | | 135 | | | 283 |
Net (chargeoffs)/recoveries | | | (415) | | | (477) | | | (604) | | | (990) | | | 50 |
Balance, end of period | | $ | 26,080 | | $ | 25,854 | | $ | 25,918 | | $ | 25,988 | | $ | 26,201 |
| | | | | | | | | | | | | | | |
LOAN QUALITY INFORMATION: | | | | | | | | | | | | | | | |
| | | | | | | | | | | | | | | |
Nonperforming loans: | | | | | | | | | | | | | | | |
SBA loans | | $ | 3,542 | | $ | 3,444 | | $ | 3,445 | | $ | 3,591 | | $ | 4,325 |
Commercial loans | | | 2,415 | | | 1,948 | | | 750 | | | 835 | | | 1,144 |
Residential mortgage loans | | | 7,440 | | | 11,272 | | | 10,530 | | | 8,607 | | | 5,565 |
Consumer loans | | | 366 | | | 381 | | | 130 | | | - | | | - |
Residential construction loans | | | 3,127 | | | 2,141 | | | 3,201 | | | 3,182 | | | 3,473 |
Total nonperforming loans | | | 16,890 | | | 19,186 | | | 18,056 | | | 16,215 | | | 14,507 |
OREO | | | - | | | - | | | 251 | | | 251 | | | 176 |
Nonperforming assets | | | 16,890 | | | 19,186 | | | 18,307 | | | 16,466 | | | 14,683 |
| | | | | | | | | | | | | | | |
Loans 90 days past due & still accruing | | $ | 138 | | $ | 946 | | $ | 265 | | $ | - | | $ | - |
| | | | | | | | | | | | | | | |
Nonperforming loans to total loans | | | 0.78 | % | | 0.88 | % | | 0.84 | % | | 0.76 | % | | 0.69 |
Nonperforming assets to total assets | | | 0.66 | | | 0.74 | | | 0.71 | | | 0.65 | | | 0.59 |
| | | | | | | | | | | | | | | |
Allowance for loan losses to: | | | | | | | | | | | | | | | |
Total loans at quarter end | | | 1.20 | % | | 1.19 | % | | 1.19 | % | | 1.20 | % | | 1.23 |
Total nonperforming loans | | | 154.41 | | | 134.75 | | | 141.57 | | | 157.83 | | | 178.44 |
UNITY BANCORP, INC.
QUARTERLY FINANCIAL DATA
March 31, 2024
| | | | | | | | | | | | | | | | | |
(In thousands, except %'s, employee, office and per share amounts) | | March 31, 2024 | | December 31, 2023 | | September 30, 2023 | | June 30, 2023 | | March 31, 2023 | | ||||||
SUMMARY OF INCOME: | | | | | | | | | | | | | | | | | |
Total interest income | | $ | 37,937 | | $ | 37,758 | | $ | 36,990 | | $ | 35,392 | | $ | 33,353 | | |
Total interest expense | | | 14,096 | | | 13,727 | | | 13,457 | | | 11,870 | | | 9,443 | | |
Net interest income | | | 23,841 | | | 24,031 | | | 23,533 | | | 23,522 | | | 23,910 | | |
Provision for credit losses | | | 643 | | | 1,811 | | | 556 | | | 693 | | | 108 | | |
Net interest income after provision for credit losses | | | 23,198 | | | 22,220 | | | 22,977 | | | 22,829 | | | 23,802 | | |
Total noninterest income | | | 1,718 | | | 2,568 | | | 2,043 | | | 2,115 | | | 1,417 | | |
Total noninterest expense | | | 12,132 | | | 11,740 | | | 11,973 | | | 11,835 | | | 11,428 | | |
Income before provision for income taxes | | | 12,784 | | | 13,048 | | | 13,047 | | | 13,109 | | | 13,791 | | |
Provision for income taxes | | | 3,198 | | | 3,278 | | | 3,097 | | | 3,409 | | | 3,504 | | |
Net income | | $ | 9,586 | | $ | 9,770 | | $ | 9,950 | | $ | 9,700 | | $ | 10,287 | | |
| | | | | | | | | | | | | | | | | |
Net income per common share - Basic | | $ | 0.95 | | $ | 0.97 | | $ | 0.98 | | $ | 0.96 | | $ | 0.98 | | |
Net income per common share - Diluted | | | 0.93 | | | 0.96 | | | 0.97 | | | 0.95 | | | 0.96 | | |
| | | | | | | | | | | | | | | | | |
COMMON SHARE DATA: | | | | | | | | | | | | | | | | | |
Market price per share | | $ | 27.60 | | $ | 29.59 | | $ | 23.43 | | $ | 23.59 | | $ | 22.81 | | |
Dividends paid | | | 0.13 | | | 0.12 | | | 0.12 | | | 0.12 | | | 0.12 | | |
Book value per common share | | | 26.56 | | | 25.98 | | | 24.95 | | | 24.12 | | | 23.34 | | |
| | | | | | | | | | | | | | | | | |
Weighted average common shares outstanding - Basic | | | 10,127 | | | 10,066 | | | 10,128 | | | 10,103 | | | 10,538 | | |
Weighted average common shares outstanding - Diluted | | | 10,276 | | | 10,209 | | | 10,258 | | | 10,203 | | | 10,686 | | |
Issued common shares | | | 11,555 | | | 11,424 | | | 11,411 | | | 11,387 | | | 11,335 | | |
Outstanding common shares | | | 10,044 | | | 10,063 | | | 10,115 | | | 10,119 | | | 10,292 | | |
Treasury shares | | | 1,511 | | | 1,361 | | | 1,296 | | | 1,268 | | | 1,043 | | |
| | | | | | | | | | | | | | | | | |
PERFORMANCE RATIOS (Annualized): | | | | | | | | | | | | | | | | | |
Return on average assets | | | 1.58 | % | | 1.59 | % | | 1.61 | % | | 1.60 | % | | 1.72 | % | |
Return on average equity | | | 14.49 | | | 15.12 | | | 15.84 | | | 16.19 | | | 17.14 | | |
Efficiency ratio** | | | 47.57 | | | 43.06 | | | 46.59 | | | 45.54 | | | 44.56 | | |
| | | | | | | | | | | | | | | | | |
BALANCE SHEET DATA: | | | | | | | | | | | | | | | | | |
Total assets | | $ | 2,568,088 | | $ | 2,578,507 | | $ | 2,563,006 | | $ | 2,552,301 | | $ | 2,475,851 | | |
Total securities | | | 138,702 | | | 135,689 | | | 136,091 | | | 137,061 | | | 138,264 | | |
Total loans | | | 2,174,457 | | | 2,172,063 | | | 2,173,190 | | | 2,167,367 | | | 2,130,919 | | |
Allowance for credit losses | | | 26,080 | | | 25,854 | | | 25,918 | | | 25,988 | | | 26,201 | | |
Total deposits | | | 1,961,270 | | | 1,924,140 | | | 1,884,910 | | | 1,849,528 | | | 1,823,921 | | |
Total shareholders' equity | | | 266,761 | | | 261,430 | | | 252,384 | | | 244,073 | | | 240,459 | | |
| | | | | | | | | | | | | | | | | |
TAX EQUIVALENT YIELDS AND RATES: | | | | | | | | | | | | | | | | | |
Interest-earning assets | | | 6.51 | % | | 6.38 | % | | 6.22 | % | | 6.07 | % | | 5.84 | % | |
Interest-bearing liabilities | | | 3.26 | | | 3.14 | | | 3.05 | | | 2.75 | | | 2.27 | | |
Net interest spread | | | 3.25 | | | 3.24 | | | 3.17 | | | 3.32 | | | 3.57 | | |
Net interest margin | | | 4.09 | | | 4.06 | | | 3.96 | | | 4.04 | | | 4.19 | | |
| | | | | | | | | | | | | | | | | |
CREDIT QUALITY: | | | | | | | | | | | | | | | | | |
Nonperforming assets | | $ | 16,890 | | $ | 19,186 | | $ | 18,307 | | $ | 16,466 | | $ | 14,683 | | |
QTD annualized net (chargeoffs)/recoveries to QTD average loans | | | (0.08) | % | | (0.09) | % | | (0.11) | % | | (0.18) | % | | 0.01 | % | |
Allowance for credit losses to total loans | | | 1.20 | | | 1.19 | | | 1.19 | | | 1.20 | | | 1.23 | | |
Nonperforming loans to total loans | | | 0.78 | | | 0.88 | | | 0.84 | | | 0.76 | | | 0.68 | | |
Nonperforming assets to total assets | | | 0.66 | | | 0.74 | | | 0.71 | | | 0.65 | | | 0.59 | | |
| | | | | | | | | | | | | | | | | |
CAPITAL RATIOS*** AND OTHER: | | | | | | | | | | | | | | | | | |
Total equity to total assets | | | 10.39 | % | | 10.14 | % | | 9.85 | % | | 9.56 | % | | 9.71 | % | |
Leverage ratio | | | 11.39 | | | 11.14 | | | 10.76 | | | 10.49 | | | 10.38 | | |
Common Equity Tier 1 Capital Ratio | | | 12.90 | | | 12.70 | | | 12.16 | | | 11.74 | | | 11.76 | | |
Risk-based Tier 1 Capital Ratio | | | 13.38 | | | 13.18 | | | 12.64 | | | 12.21 | | | 12.25 | | |
Risk-based Total Capital Ratio | | | 14.63 | | | 14.43 | | | 13.88 | | | 13.45 | | | 13.50 | | |
| | | | | | | | | | | | | | | | | |
Number of banking offices | | | 21 | | | 21 | | | 21 | | | 20 | | | 20 | | |
Employee Full-Time Equivalent | | | 217 | | | 232 | | | 232 | | | 230 | | | 227 | | |
** The efficiency ratio is a non-GAAP measure, calculated based on the noninterest expense divided by the sum of net interest income plus non interest income, excluding net gains and losses on securities and provision for impairment losses, AFS securities. | | ||||||||||||||||
'*** Represents Bancorp consolidated capital ratios. | | | | | | | | | | | | | | | | | |
| | | | | | | | | | | | |
Unity Bancorp, Inc
Loan Portfolio Composition
March 31, 2024
| | | | | | | | | | |
In thousands, except percentages | | March 31, 2024 | | % | | December 31, 2023 | | % | ||
SBA Loans: | | | | | | | | | | |
SBA loans held for sale | | $ | 18,439 | | 0.8% | | $ | 18,242 | | 0.8% |
SBA loans held for investment | | | 39,009 | | 1.8% | | | 38,584 | | 1.8% |
SBA PPP | | | 2,168 | | 0.1% | | | 2,318 | | 0.1% |
Total SBA Loans | | | 59,616 | | 2.7% | | | 59,144 | | 2.7% |
Commercial Loans | | | | | | | | | | |
Commercial construction | | | 142,345 | | 6.5% | | | 129,159 | | 5.9% |
SBA 504 | | | 38,128 | | 1.8% | | | 33,669 | | 1.6% |
Commercial & Industrial | | | 133,409 | | 6.1% | | | 128,402 | | 5.9% |
Commercial Mortgage - Owner Occupied | | | 512,616 | | 23.6% | | | 502,397 | | 23.1% |
Commercial Mortgage - Nonowner Occupied | | | 412,325 | | 19.0% | | | 424,490 | | 19.5% |
Other | | | 52,496 | | 2.4% | | | 59,342 | | 2.7% |
Total Commercial Loans | | | 1,291,319 | | 59.4% | | | 1,277,459 | | 58.8% |
Residential Mortgage loans | | | 627,464 | | 28.9% | | | 631,506 | | 29.1% |
Consumer Loans | | | | | | | | | | |
Home equity | | | 67,448 | | 3.1% | | | 67,037 | | 3.0% |
Consumer other | | | 4,827 | | 0.2% | | | 5,639 | | 0.3% |
Total Consumer Loans | | | 72,275 | | 3.3% | | | 72,676 | | 3.3% |
Residential Construction | | | 123,783 | | 5.7% | | | 131,277 | | 6.0% |
Total Gross Loans | | $ | 2,174,457 | | 100.0% | | $ | 2,172,063 | | 100.0% |