Exhibit 99.2

Link to searchable text of slide shown above
Link to searchable text of slide shown above
Link to searchable text of slide shown above
Link to searchable text of slide shown above
Link to searchable text of slide shown above
Link to searchable text of slide shown above
Link to searchable text of slide shown above
Link to searchable text of slide shown above
Link to searchable text of slide shown above
Link to searchable text of slide shown above
Link to searchable text of slide shown above

Link to searchable text of slide shown above
Link to searchable text of slide shown above
Link to searchable text of slide shown above
Link to searchable text of slide shown above
Link to searchable text of slide shown above
Link to searchable text of slide shown above

Link to searchable text of slide shown above

Link to searchable text of slide shown above
Link to searchable text of slide shown above
Link to searchable text of slide shown above
Link to searchable text of slide shown above
Link to searchable text of slide shown above
Searchable text section of graphics shown above
[LOGO]
[GRAPHIC] |
| 2004 |
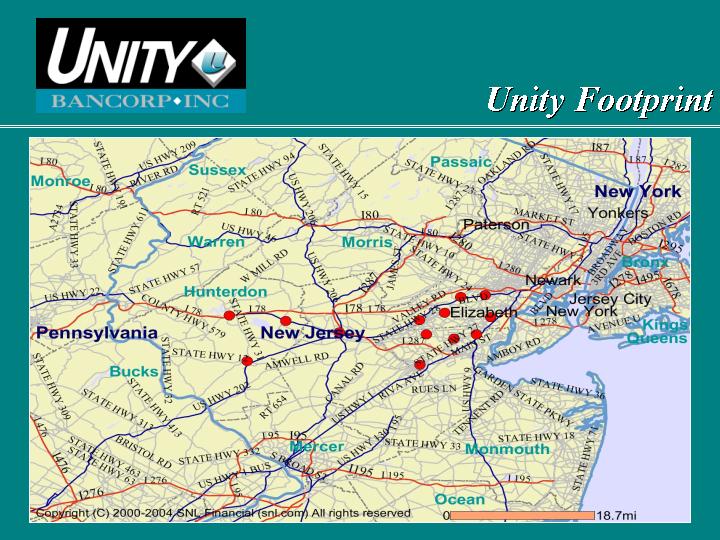
Unity Footprint
[CHART]
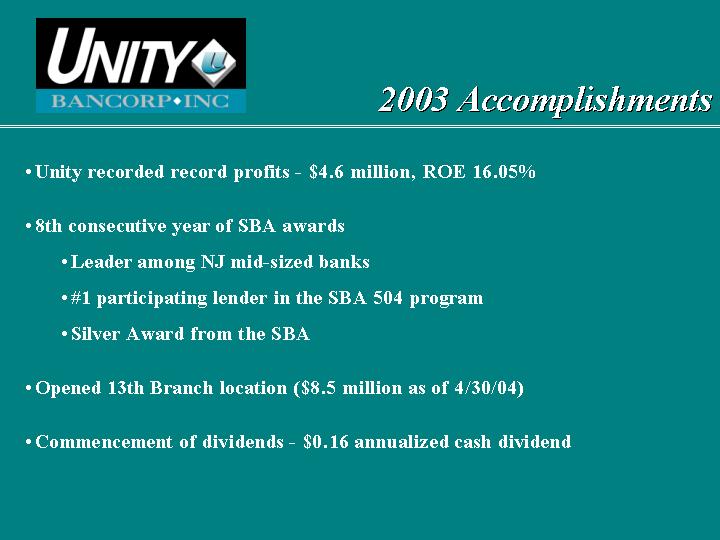
2003 Accomplishments
• Unity recorded record profits - $4.6 million, ROE 16.05%
• 8th consecutive year of SBA awards
• Leader among NJ mid-sized banks
• #1 participating lender in the SBA 504 program
• Silver Award from the SBA
• Opened 13th Branch location ($8.5 million as of 4/30/04)
• Commencement of dividends - $0.16 annualized cash dividend
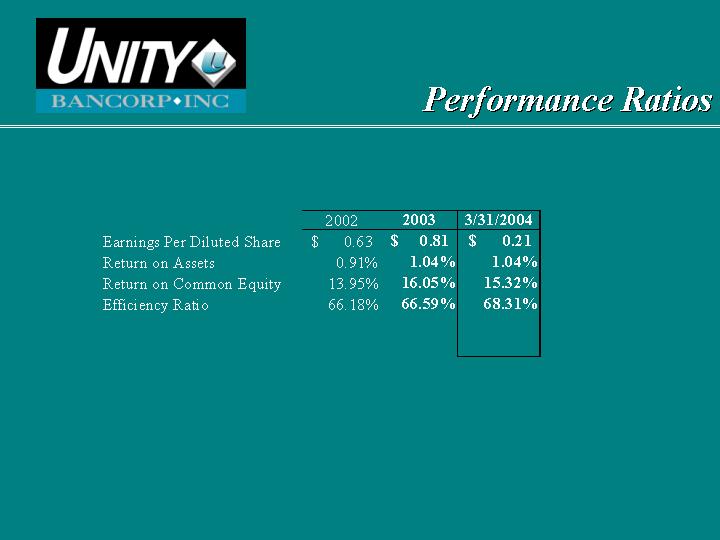
Performance Ratios
|
| 2002 |
| 2003 |
| 3/31/2004 |
| |||
Earnings Per Diluted Share |
| $ | 0.63 |
| $ | 0.81 |
| $ | 0.21 |
|
Return on Assets |
| 0.91 | % | 1.04 | % | 1.04 | % | |||
Return on Common Equity |
| 13.95 | % | 16.05 | % | 15.32 | % | |||
Efficiency Ratio |
| 66.18 | % | 66.59 | % | 68.31 | % | |||
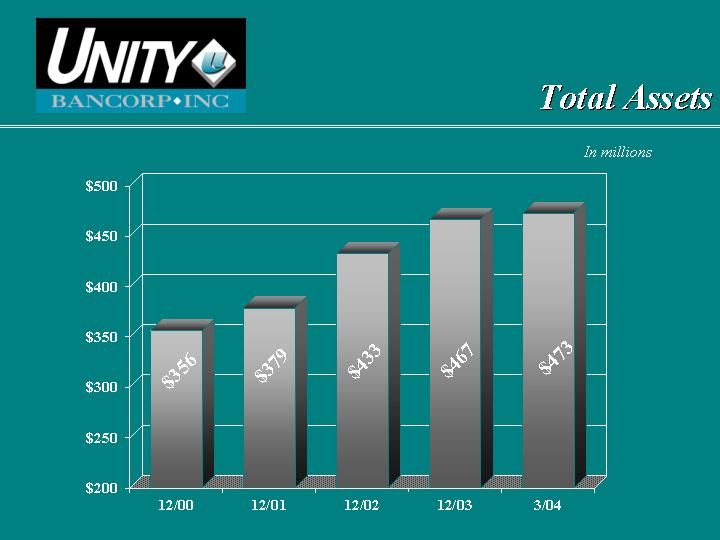
Total Assets
In millions
[CHART]
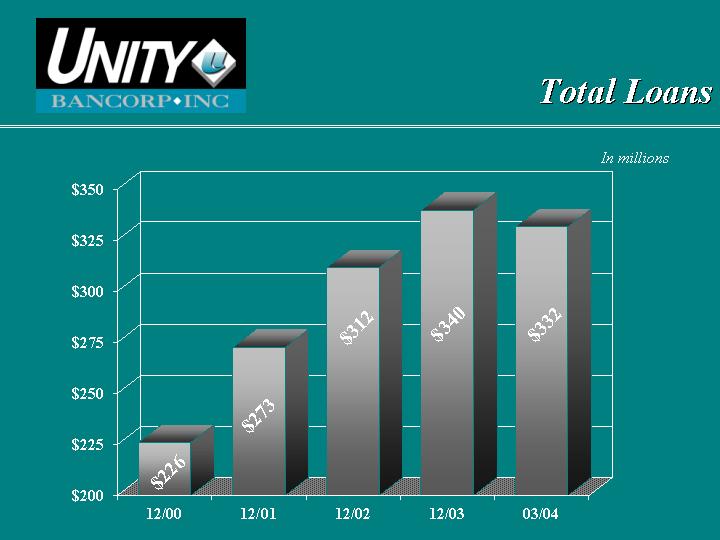
Total Loans
In millions
[CHART]
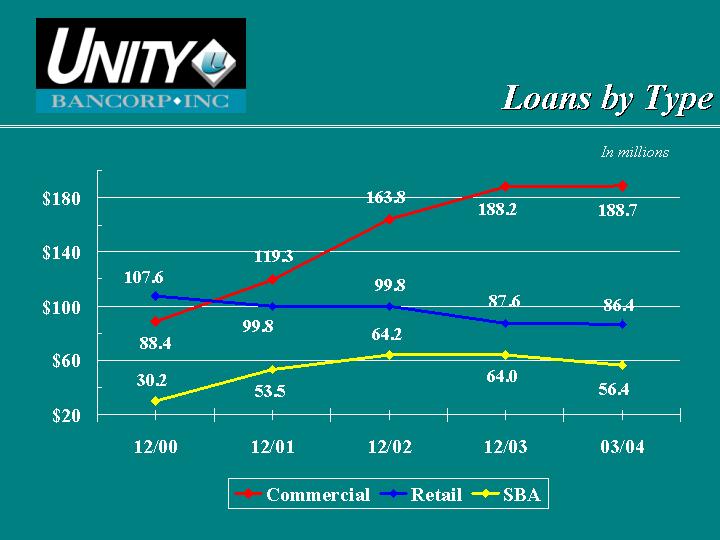
Loans by Type
In millions
[CHART]
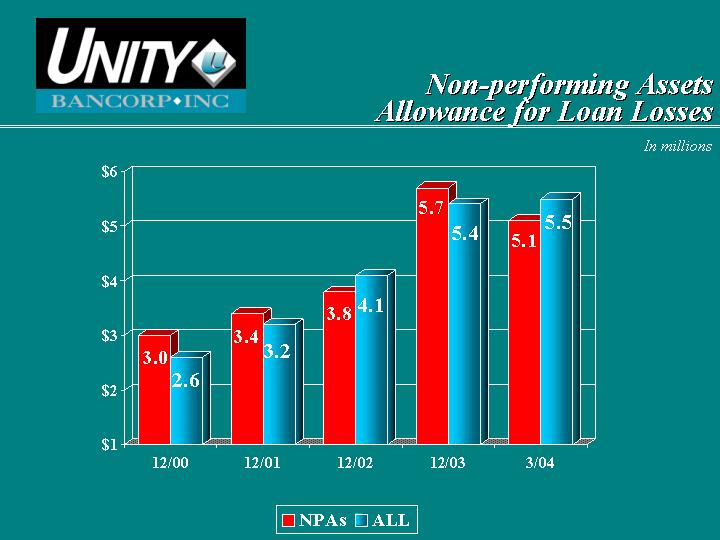
Non-performing Assets
Allowance for Loan Losses
In millions
[CHART]
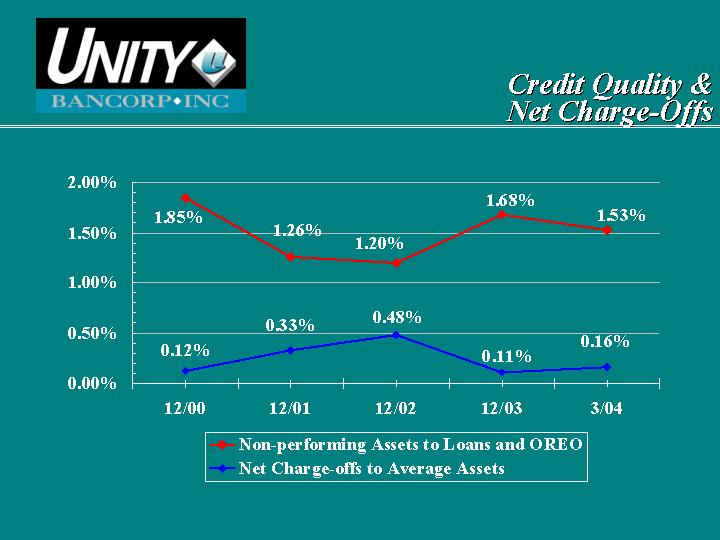
Credit Quality &
Net Charge-Offs
[CHART]
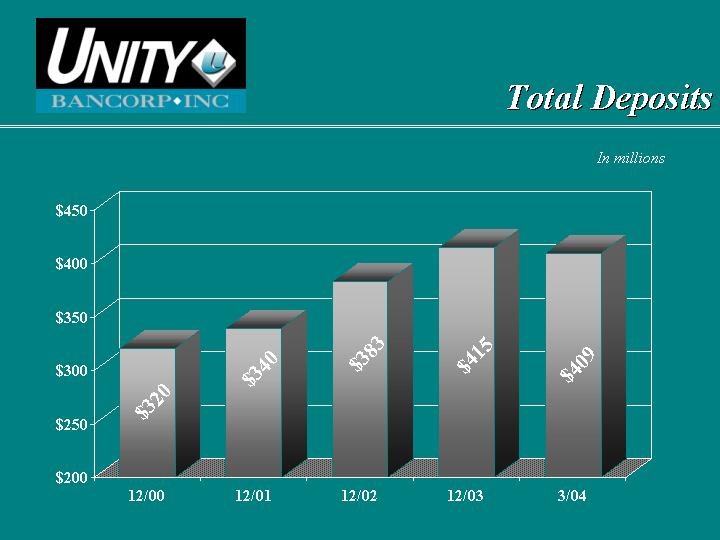
Total Deposits
In millions
[CHART]
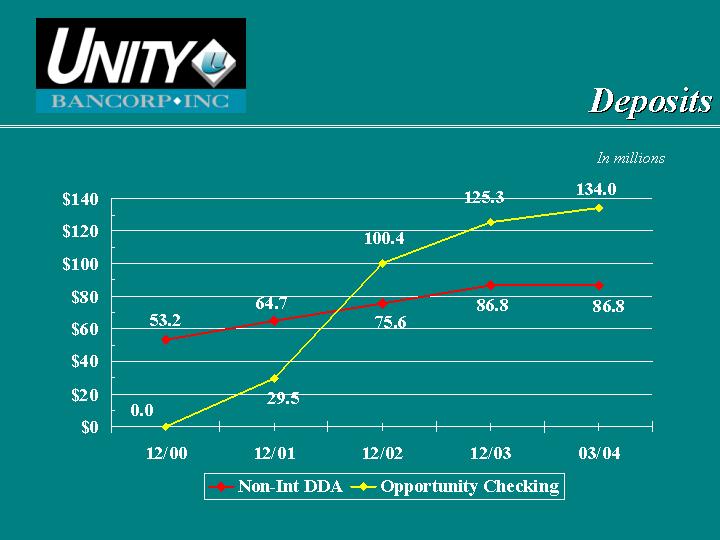
Deposits
In millions
[CHART]
Business of the Month
[GRAPHIC]
Kids Corner
[GRAPHIC]
Café Unity
[GRAPHIC]
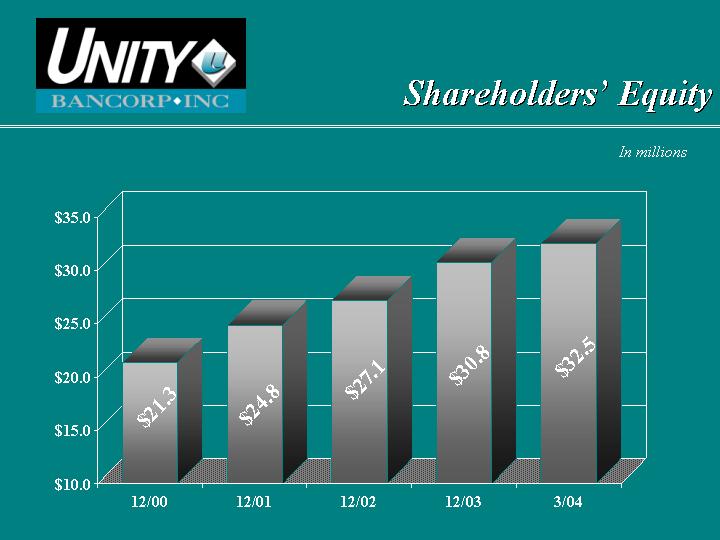
Shareholders’ Equity
In millions
[CHART]
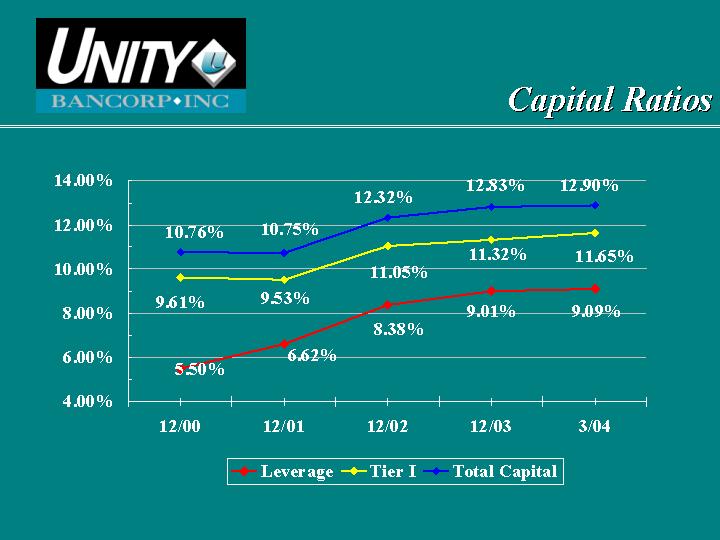
Capital Ratios
In millions
[CHART]
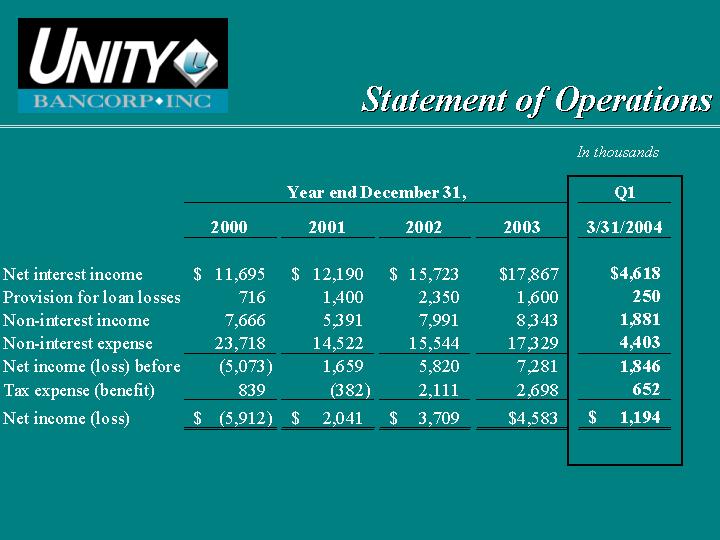
Statement of Operations
In thousands
|
| Year end December 31, |
| Q1 |
| |||||||||||
|
| 2000 |
| 2001 |
| 2002 |
| 2003 |
| 3/31/2004 |
| |||||
|
|
|
|
|
|
|
|
|
|
|
| |||||
Net interest income |
| $ | 11,695 |
| $ | 12,190 |
| $ | 15,723 |
| $ | 17,867 |
| $ | 4,618 |
|
Provision for loan losses |
| 716 |
| 1,400 |
| 2,350 |
| 1,600 |
| 250 |
| |||||
Non-interest income |
| 7,666 |
| 5,391 |
| 7,991 |
| 8,343 |
| 1,881 |
| |||||
Non-interest expense |
| 23,718 |
| 14,522 |
| 15,544 |
| 17,329 |
| 4,403 |
| |||||
Net income (loss) before tax |
| (5,073 | ) | 1,659 |
| 5,820 |
| 7,281 |
| 1,846 |
| |||||
Tax expense (benefit) |
| 839 |
| (382 | ) | 2,111 |
| 2,698 |
| 652 |
| |||||
Net income (loss) |
| $ | (5,912 | ) | $ | 2,041 |
| $ | 3,709 |
| $ | 4,583 |
| $ | 1,194 |
|
Net Interest Income
In millions
[CHART]
Net Interest Margin
[CHART]
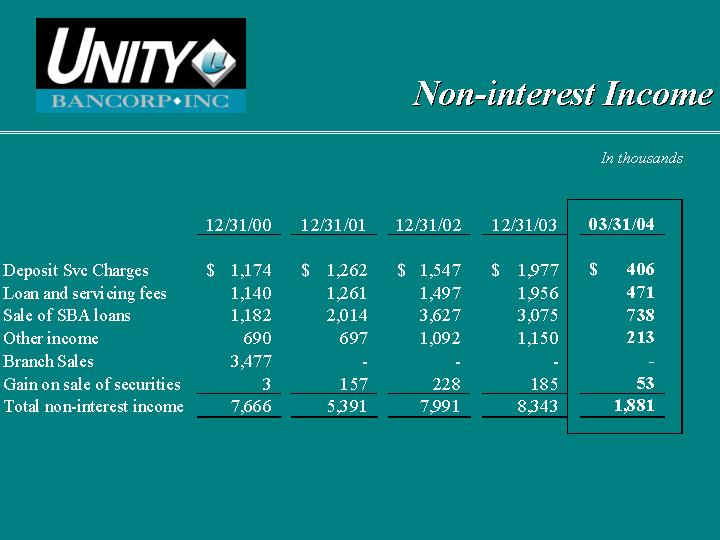
Non-interest Income
In thousands
|
| 12/31/00 |
| 12/31/01 |
| 12/31/02 |
| 12/31/03 |
| 03/31/04 |
| |||||
|
|
|
|
|
|
|
|
|
|
|
| |||||
Deposit Svc Charges |
| $ | 1,174 |
| $ | 1,262 |
| $ | 1,547 |
| $ | 1,977 |
| $ | 406 |
|
Loan and servicing fees |
| 1,140 |
| 1,261 |
| 1,497 |
| 1,956 |
| 471 |
| |||||
Sale of SBA loans |
| 1,182 |
| 2,014 |
| 3,627 |
| 3,075 |
| 738 |
| |||||
Other income |
| 690 |
| 697 |
| 1,092 |
| 1,150 |
| 213 |
| |||||
Branch Sales |
| 3,477 |
| — |
| — |
| — |
| — |
| |||||
Gain on sale of securities |
| 3 |
| 157 |
| 228 |
| 185 |
| 53 |
| |||||
Total non-interest income |
| 7,666 |
| 5,391 |
| 7,991 |
| 8,343 |
| 1,881 |
| |||||
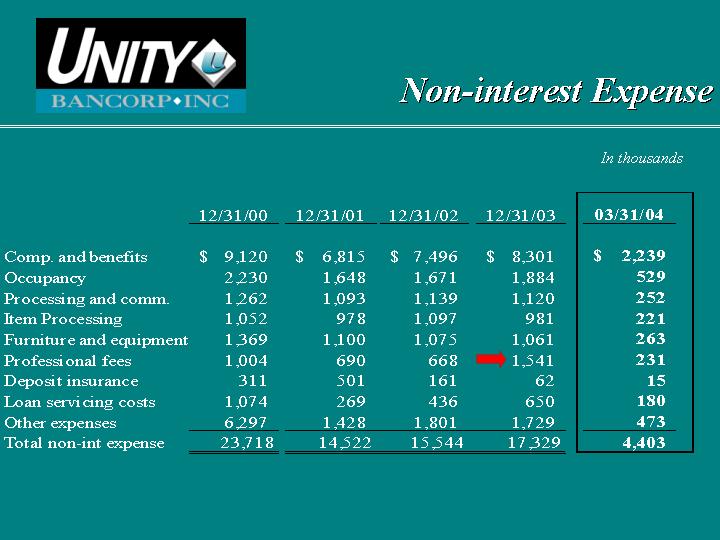
Non-interest Expense
In thousands
|
| 12/31/00 |
| 12/31/01 |
| 12/31/02 |
| 12/31/03 |
| 03/31/04 |
| |||||
|
|
|
|
|
|
|
|
|
|
|
| |||||
Comp. and benefits |
| $ | 9,120 |
| $ | 6,815 |
| $ | 7,496 |
| $ | 8,301 |
| $ | 2,239 |
|
Occupancy |
| 2,230 |
| 1,648 |
| 1,671 |
| 1,884 |
| 529 |
| |||||
Processing and comm. |
| 1,262 |
| 1,093 |
| 1,139 |
| 1,120 |
| 252 |
| |||||
Item Processing |
| 1,052 |
| 978 |
| 1,097 |
| 981 |
| 221 |
| |||||
Furniture and equipment |
| 1,369 |
| 1,100 |
| 1,075 |
| 1,061 |
| 263 |
| |||||
Professional fees |
| 1,004 |
| 690 |
| 668 |
| 1,541 |
| 231 |
| |||||
Deposit insurance |
| 311 |
| 501 |
| 161 |
| 62 |
| 15 |
| |||||
Loan servicing costs |
| 1,074 |
| 269 |
| 436 |
| 650 |
| 180 |
| |||||
Other expenses |
| 6,297 |
| 1,428 |
| 1,801 |
| 1,729 |
| 473 |
| |||||
Total non-int expense |
| 23,718 |
| 14,522 |
| 15,544 |
| 17,329 |
| 4,403 |
| |||||
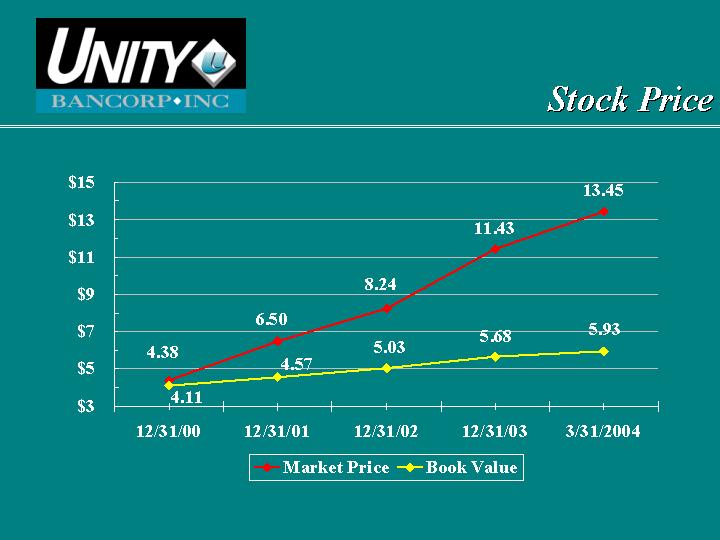
Stock Price
[CHART]
[GRAPHIC]