


Searchable text section of graphics shown above
[LOGO]
[GRAPHIC]
Super
Community
Bank
Conference
Nov 4 - 5
2004
Forward-Looking Statement
This presentation contains certain forward-looking statements, either expressed or implied, which are provided to assist the reader in understanding anticipated future financial performance. These statements involve certain risks, uncertainties, estimates and assumptions made by management, which are subject to factors beyond the company’s control and could impede its ability to achieve these goals. These factors include general economic conditions, trends in interest rates, the ability of our borrowers to repay their loans, and results of regulatory exams, among other factors.
Unity Company Profile
• State Chartered - Opened 1991
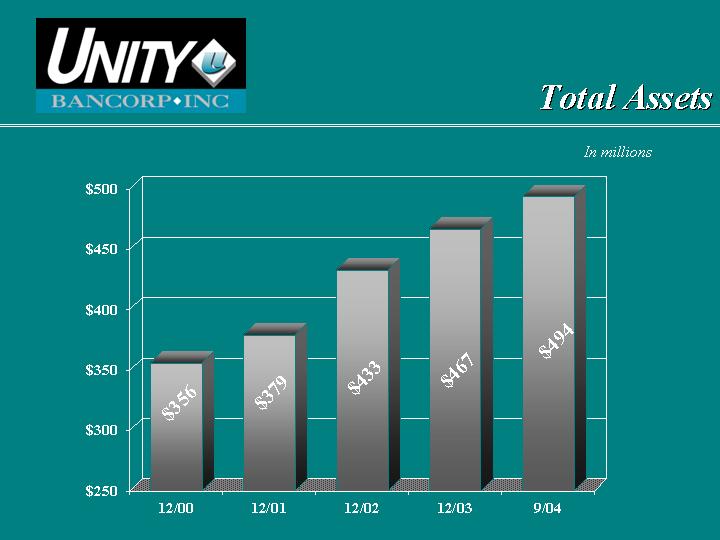
• Assets of $500 million
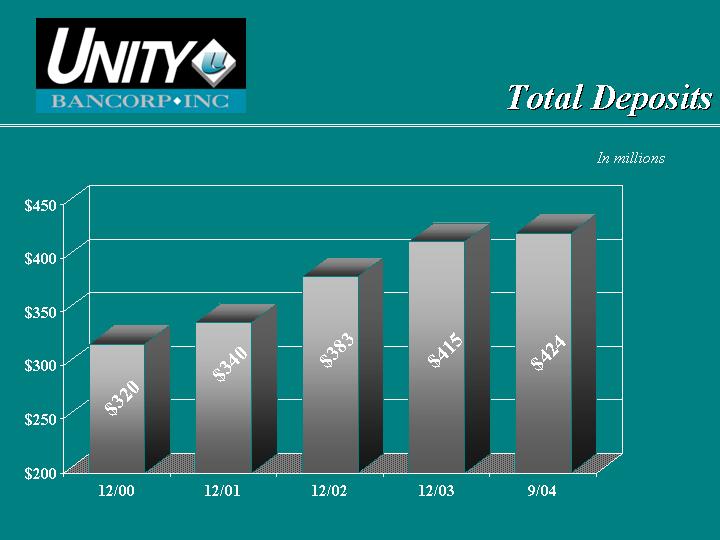
• Deposits of $425 million
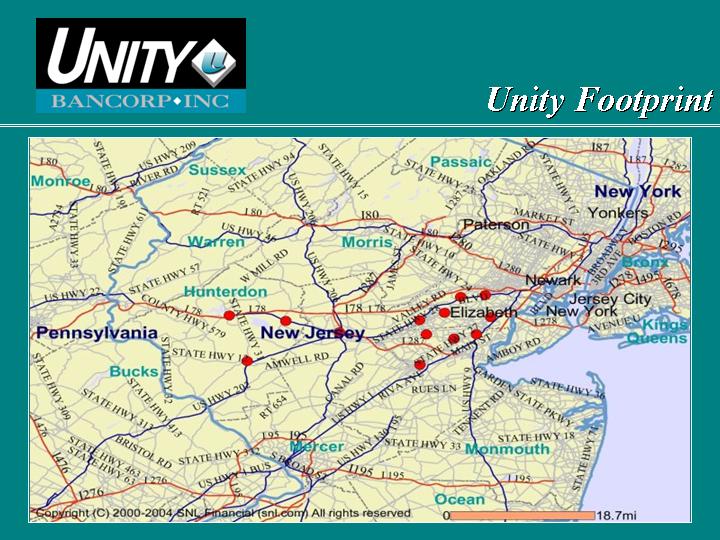
• 13 branches, headquartered in Clinton, NJ
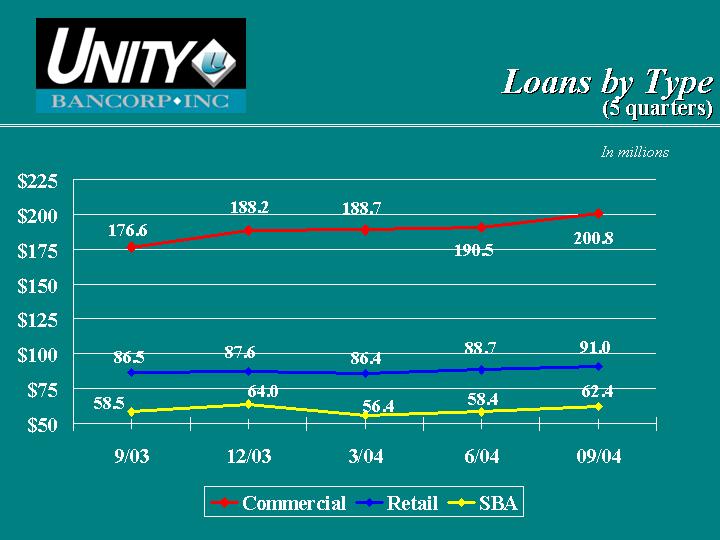
• Strategic commercial lending focus
• Nationally recognized SBA lender
Unity “Commandments”
• Treat all employees and customers with dignity and respect
• Provide the highest level of service for our customers
• Increase the profits of the bank
• Always do the right thing
Experienced Management Team
Name |
| Title |
| Years Banking Experience |
|
|
|
|
|
Jim Hughes, CPA |
| President and CEO |
| 22 |
|
|
|
|
|
Alan Bedner, CPA |
| Executive VP, CFO |
| 11 |
|
|
|
|
|
Mike Bono |
| Executive VP, Retail |
| 36 |
|
|
|
|
|
Mike Downes |
| Executive VP, CLO |
| 19 |
|
|
|
|
|
John Kauchak |
| Executive VP, COO |
| 24 |
|
|
|
|
|
Kelly Stashko |
| Executive VP, |
| 18 |
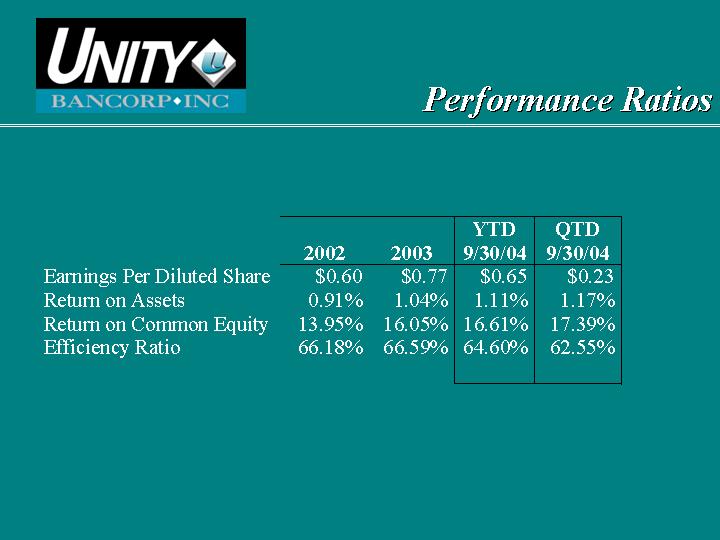
Performance Ratios
|
|
|
|
|
| YTD |
| QTD |
| ||||
|
| 2002 |
| 2003 |
| 9/30/04 |
| 9/30/04 |
| ||||
Earnings Per Diluted Share |
| $ | 0.60 |
| $ | 0.77 |
| $ | 0.65 |
| $ | 0.23 |
|
Return on Assets |
| 0.91 | % | 1.04 | % | 1.11 | % | 1.17 | % | ||||
Return on Common Equity |
| 13.95 | % | 16.05 | % | 16.61 | % | 17.39 | % | ||||
Efficiency Ratio |
| 66.18 | % | 66.59 | % | 64.60 | % | 62.55 | % | ||||
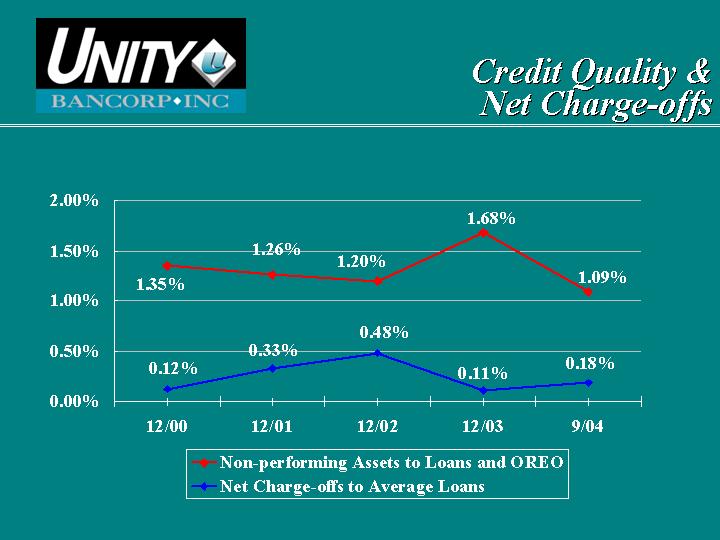
Prudent Credit Culture
• Experienced Lenders
• Comprehensive Approval Process
• Reliance on Cash Flow and Collateral
• External and Internal Loan Review Process
• Experienced Asset Management Process
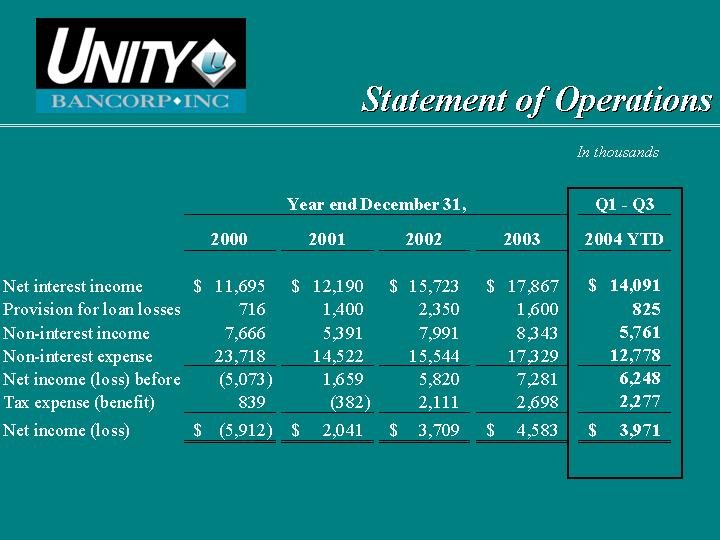
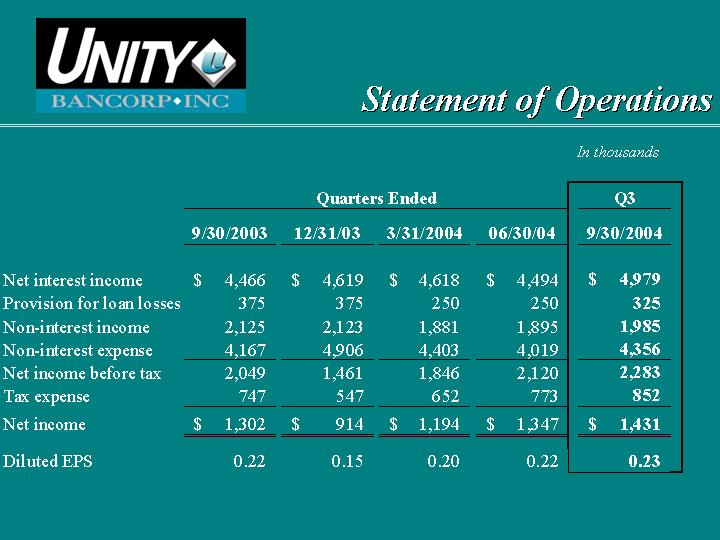
Statement of Operations
In thousands
|
| Year end December 31, |
| Q1 - Q3 |
| |||||||||||
|
| 2000 |
| 2001 |
| 2002 |
| 2003 |
| 2004 YTD |
| |||||
|
|
|
|
|
|
|
|
|
|
|
| |||||
Net interest income |
| $ | 11,695 |
| $ | 12,190 |
| $ | 15,723 |
| $ | 17,867 |
| $ | 14,091 |
|
Provision for loan losses |
| 716 |
| 1,400 |
| 2,350 |
| 1,600 |
| 825 |
| |||||
Non-interest income |
| 7,666 |
| 5,391 |
| 7,991 |
| 8,343 |
| 5,761 |
| |||||
Non-interest expense |
| 23,718 |
| 14,522 |
| 15,544 |
| 17,329 |
| 12,778 |
| |||||
Net income (loss) before |
| (5,073 | ) | 1,659 |
| 5,820 |
| 7,281 |
| 6,248 |
| |||||
Tax expense (benefit) |
| 839 |
| (382 | ) | 2,111 |
| 2,698 |
| 2,277 |
| |||||
Net income (loss) |
| $ | (5,912 | ) | $ | 2,041 |
| $ | 3,709 |
| $ | 4,583 |
| $ | 3,971 |
|
In thousands
|
| Quarters Ended |
| Q3 |
| |||||||||||
|
| 9/30/2003 |
| 12/31/03 |
| 3/31/2004 |
| 06/30/04 |
| 9/30/2004 |
| |||||
|
|
|
|
|
|
|
|
|
|
|
| |||||
Net interest income |
| $ | 4,466 |
| $ | 4,619 |
| $ | 4,618 |
| $ | 4,494 |
| $ | 4,979 |
|
Provision for loan losses |
| 375 |
| 375 |
| 250 |
| 250 |
| 325 |
| |||||
Non-interest income |
| 2,125 |
| 2,123 |
| 1,881 |
| 1,895 |
| 1,985 |
| |||||
Non-interest expense |
| 4,167 |
| 4,906 |
| 4,403 |
| 4,019 |
| 4,356 |
| |||||
Net income before tax |
| 2,049 |
| 1,461 |
| 1,846 |
| 2,120 |
| 2,283 |
| |||||
Tax expense |
| 747 |
| 547 |
| 652 |
| 773 |
| 852 |
| |||||
Net income |
| $ | 1,302 |
| $ | 914 |
| $ | 1,194 |
| $ | 1,347 |
| $ | 1,431 |
|
|
|
|
|
|
|
|
|
|
|
|
| |||||
Diluted EPS |
| 0.22 |
| 0.15 |
| 0.20 |
| 0.22 |
| 0.23 |
| |||||
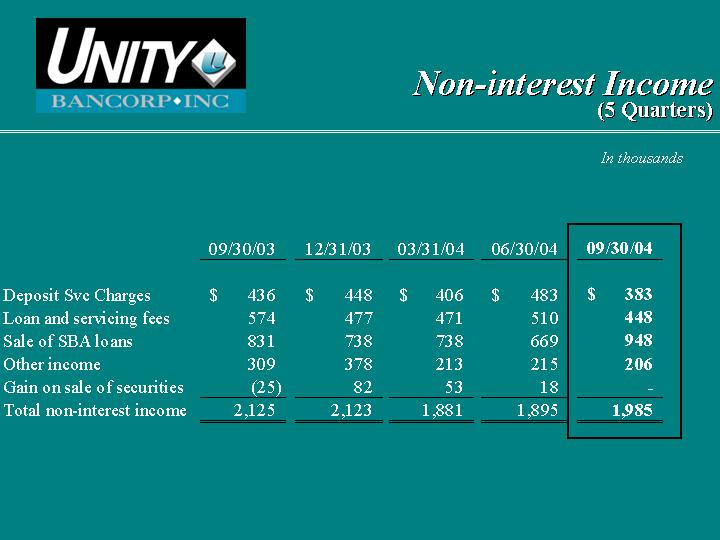
Non-interest Income
(5 Quarters)
In thousands
|
| 09/30/03 |
| 12/31/03 |
| 03/31/04 |
| 06/30/04 |
| 09/30/04 |
| |||||
|
|
|
|
|
|
|
|
|
|
|
| |||||
Deposit Svc Charges |
| $ | 436 |
| $ | 448 |
| $ | 406 |
| $ | 483 |
| $ | 383 |
|
Loan and servicing fees |
| 574 |
| 477 |
| 471 |
| 510 |
| 448 |
| |||||
Sale of SBA loans |
| 831 |
| 738 |
| 738 |
| 669 |
| 948 |
| |||||
Other income |
| 309 |
| 378 |
| 213 |
| 215 |
| 206 |
| |||||
Gain on sale of securities |
| (25 | ) | 82 |
| 53 |
| 18 |
| — |
| |||||
Total non-interest income |
| 2,125 |
| 2,123 |
| 1,881 |
| 1,895 |
| 1,985 |
| |||||
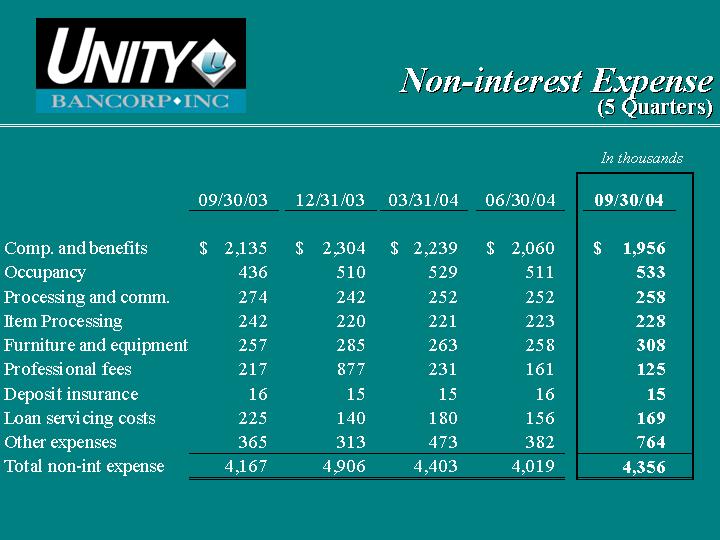
Non-interest Expense
(5 Quarters)
In thousands
|
| 09/30/03 |
| 12/31/03 |
| 03/31/04 |
| 06/30/04 |
| 09/30/04 |
| |||||
|
|
|
|
|
|
|
|
|
|
|
| |||||
Comp. and benefits |
| $ | 2,135 |
| $ | 2,304 |
| $ | 2,239 |
| $ | 2,060 |
| $ | 1,956 |
|
Occupancy |
| 436 |
| 510 |
| 529 |
| 511 |
| 533 |
| |||||
Processing and comm. |
| 274 |
| 242 |
| 252 |
| 252 |
| 258 |
| |||||
Item Processing |
| 242 |
| 220 |
| 221 |
| 223 |
| 228 |
| |||||
Furniture and equipment |
| 257 |
| 285 |
| 263 |
| 258 |
| 308 |
| |||||
Professional fees |
| 217 |
| 877 |
| 231 |
| 161 |
| 125 |
| |||||
Deposit insurance |
| 16 |
| 15 |
| 15 |
| 16 |
| 15 |
| |||||
Loan servicing costs |
| 225 |
| 140 |
| 180 |
| 156 |
| 169 |
| |||||
Other expenses |
| 365 |
| 313 |
| 473 |
| 382 |
| 764 |
| |||||
Total non-int expense |
| 4,167 |
| 4,906 |
| 4,403 |
| 4,019 |
| 4,356 |
| |||||
Key Investment Appeals
• Top Quartile Performance Ratios
• Continued Earnings Momentum
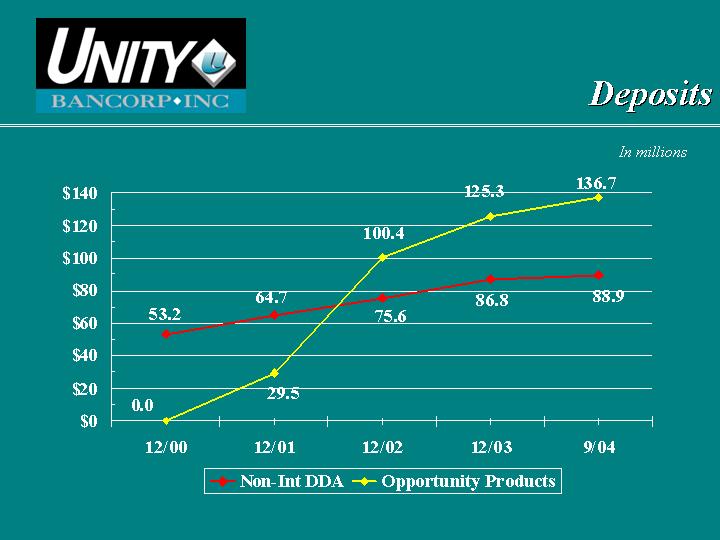
• Focus on Deposit and Loan Growth
• Leader in SBA Lending
• Insider Ownership
• Attractive Valuation
Ratios
|
| Unity |
| Peer Avg |
|
Performance Ratios (%): |
|
|
|
|
|
ROAA |
| 1.17 |
| 0.90 |
|
ROAE |
| 17.39 |
| 11.30 |
|
Net Interest Margin |
| 4.30 |
| 3.99 |
|
Efficiency Ratio |
| 62.55 |
| 67.00 |
|
Loans / Deposits |
| 81.12 |
| 69.34 |
|
|
|
|
|
|
|
Market Ratios: |
|
|
|
|
|
Price/Earnings (x) |
| 13.36 |
| 18.14 |
|
Price/Book (%) |
| 206.19 |
| 199.23 |
|
Dividend Yield (%) |
| 1.30 |
| 1.33 |
|