Searchable text section of graphics shown above
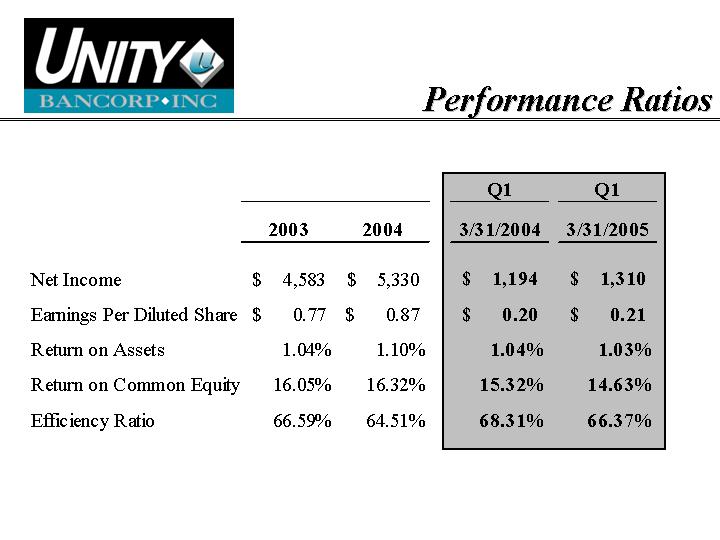
| | | | | | Q1 | | Q1 | |
| | 2003 | | 2004 | | 3/31/2004 | | 3/31/2005 | |
| | | | | | | | | |
Net Income | | $ | 4,583 | | $ | 5,330 | | $ | 1,194 | | $ | 1,310 | |
Earnings Per Diluted Share | | $ | 0.77 | | $ | 0.87 | | $ | 0.20 | | $ | 0.21 | |
Return on Assets | | 1.04 | % | 1.10 | % | 1.04 | % | 1.03 | % |
Return on Common Equity | | 16.05 | % | 16.32 | % | 15.32 | % | 14.63 | % |
Efficiency Ratio | | 66.59 | % | 64.51 | % | 68.31 | % | 66.37 | % |
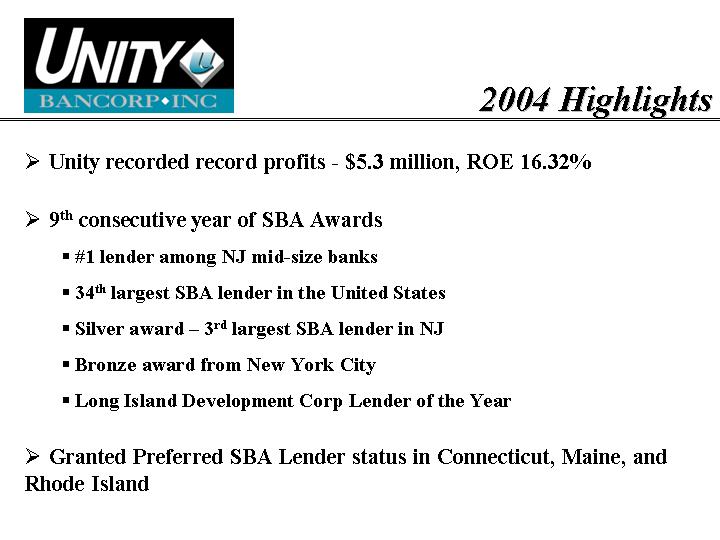
• Unity recorded record profits - $5.3 million, ROE 16.32%
• 9th consecutive year of SBA Awards
• #1 lender among NJ mid-size banks
• 34th largest SBA lender in the United States
• Silver award – 3rd largest SBA lender in NJ
• Bronze award from New York City
• Long Island Development Corp Lender of the Year
• Granted Preferred SBA Lender status in Connecticut, Maine, and Rhode Island
Strategic Objectives
• Consistently outperform our peers Return on Equity
• Focus on Deposit & Loan Growth / Margin Management
• Continue to be a leader in SBA lending
• Grow our branch network at 1 to 3 branches per year
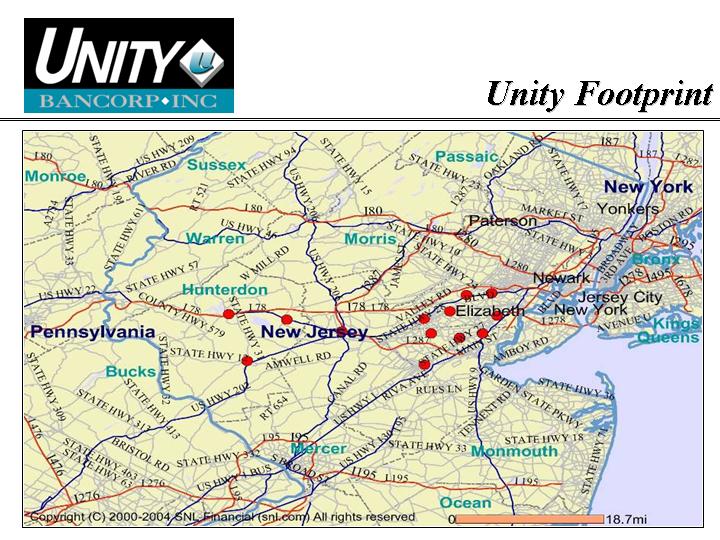
Unity Footprint
[GRAPHIC]
Total Assets
In millions
[CHART]
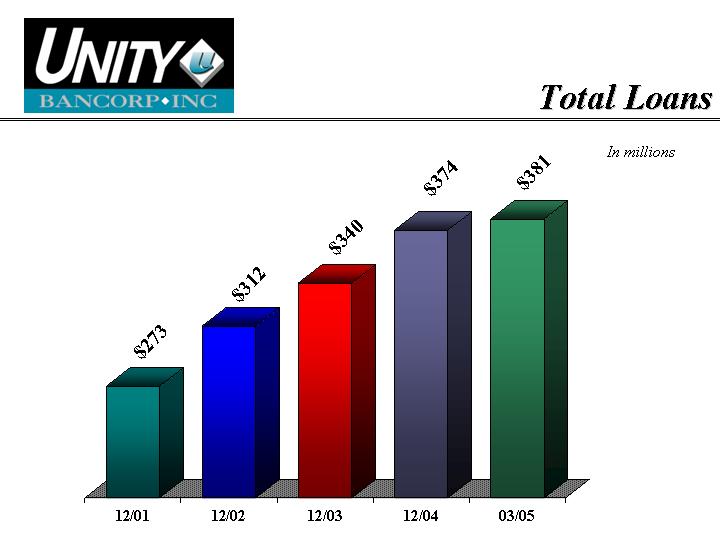
Total Loans
In millions
[CHART]
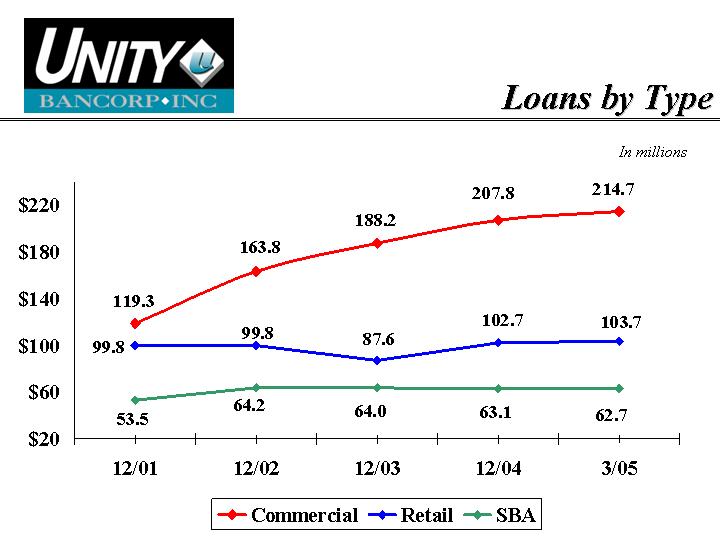
Loans by Type
In millions
[CHART]
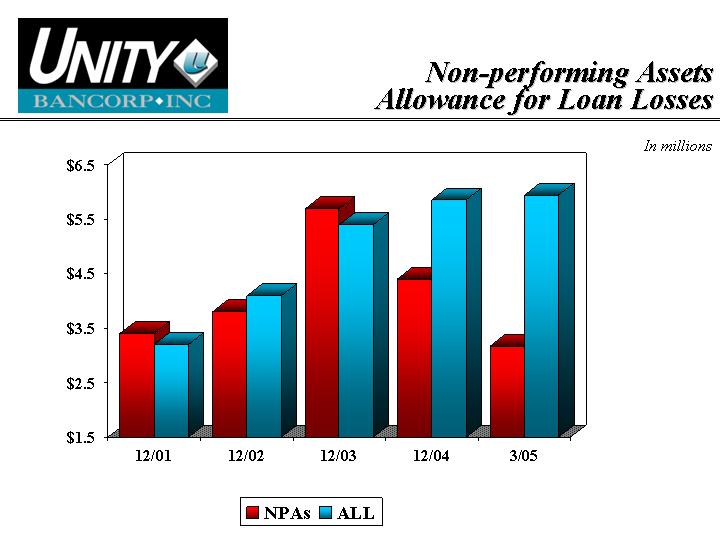
Non-performing Assets
Allowance for Loan Losses
In millions
[CHART]
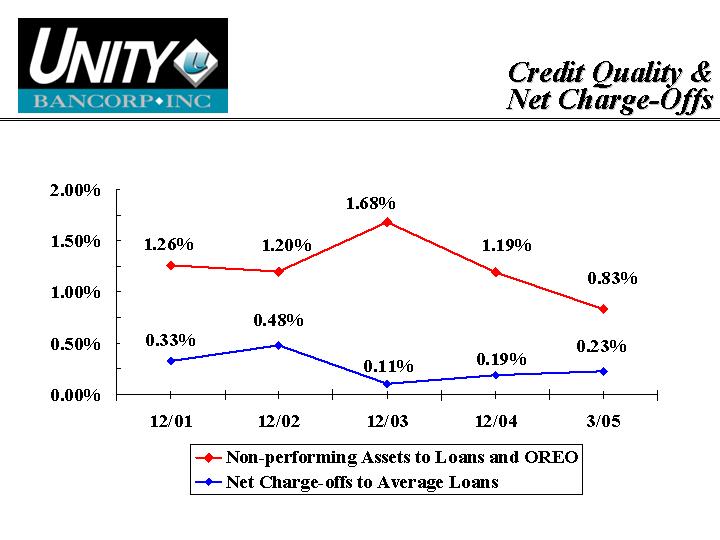
Credit Quality &
Net Charge-Offs
[CHART]
Total Deposits
In millions
[CHART]
Deposits
In millions
[CHART]
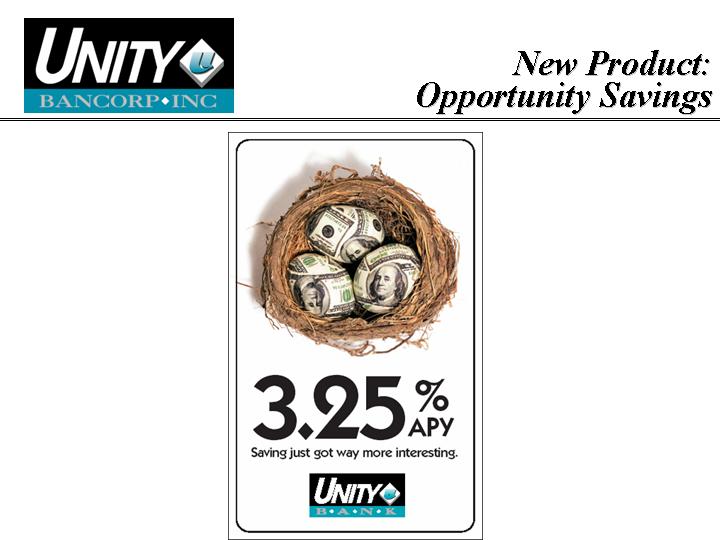
New Product:
Opportunity Savings
[GRAPHIC]
Shareholders’ Equity
In millions
[CHART]
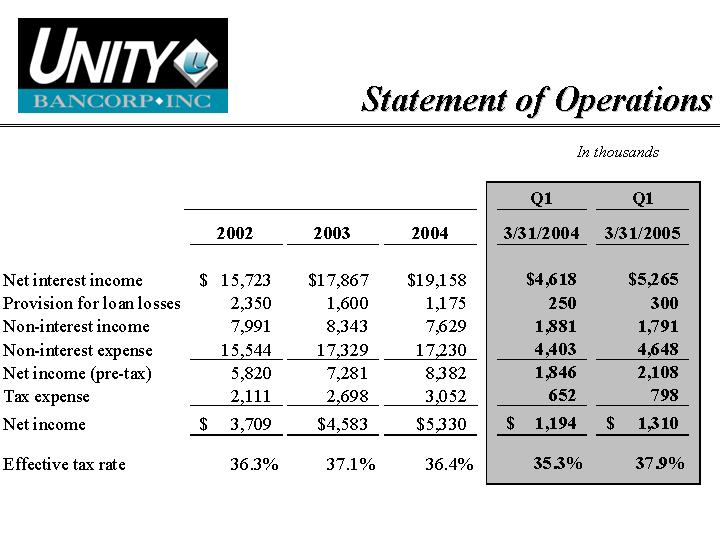
Statement of Operations
In thousands
| | | | | | | | Q1 | | Q1 | |
| | 2002 | | 2003 | | 2004 | | 3/31/2004 | | 3/31/2005 | |
| | | | | | | | | | | |
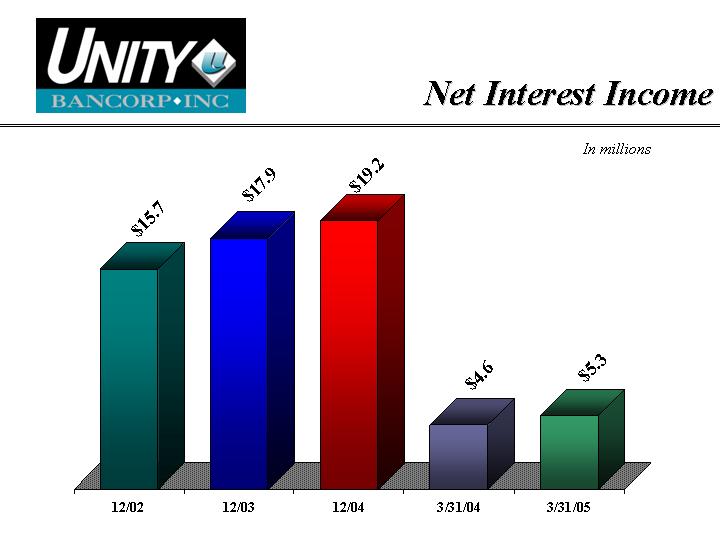
Net interest income | | $ | 15,723 | | $ | 17,867 | | $ | 19,158 | | $ | 4,618 | | $ | 5,265 | |
Provision for loan losses | | 2,350 | | 1,600 | | 1,175 | | 250 | | 300 | |
Non-interest income | | 7,991 | | 8,343 | | 7,629 | | 1,881 | | 1,791 | |
Non-interest expense | | 15,544 | | 17,329 | | 17,230 | | 4,403 | | 4,648 | |
Net income (pre-tax) | | 5,820 | | 7,281 | | 8,382 | | 1,846 | | 2,108 | |
Tax expense | | 2,111 | | 2,698 | | 3,052 | | 652 | | 798 | |
Net income | | $ | 3,709 | | $ | 4,583 | | $ | 5,330 | | $ | 1,194 | | $ | 1,310 | |
| | | | | | | | | | | |
Effective tax rate | | 36.3 | % | 37.1 | % | 36.4 | % | 35.3 | % | 37.9 | % |
Net Interest Income
In millions
[CHART]
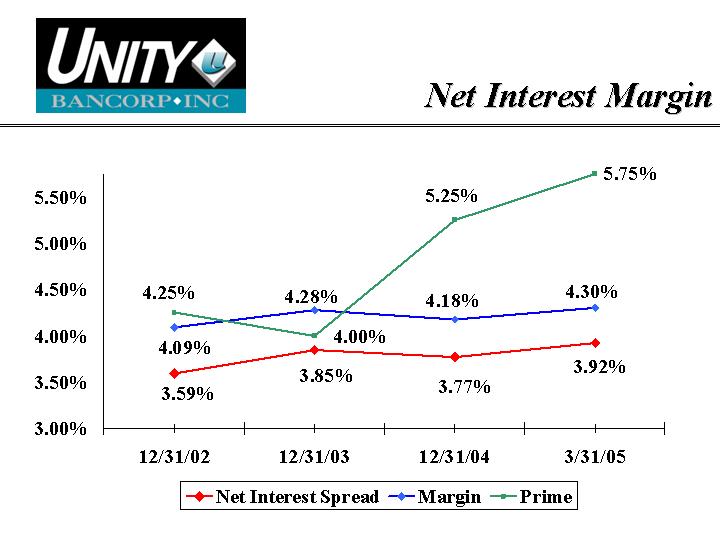
Net Interest Margin
[CHART]
Non-interest Income
In thousands
| | | | | | | | Q1 | | Q1 | |
| | 12/31/02 | | 12/31/03 | | 12/31/04 | | 03/31/04 | | 03/31/05 | |
| | | | | | | | | | | |
Deposit Svc Charges | | $ | 1,547 | | $ | 1,977 | | $ | 1,618 | | $ | 406 | | $ | 430 | |
Loan and servicing fees | | 1,497 | | 1,956 | | 1,831 | | 471 | | 536 | |
Sale of SBA loans | | 3,627 | | 3,075 | | 3,217 | | 738 | | 460 | |
Other income | | 1,092 | | 1,150 | | 887 | | 213 | | 312 | |
Gain on sale of securities | | 228 | | 185 | | 76 | | 53 | | 53 | |
Total non-interest income | | 7,991 | | 8,343 | | 7,629 | | 1,881 | | 1,791 | |
| | | | | | | | | | | | | | | | |
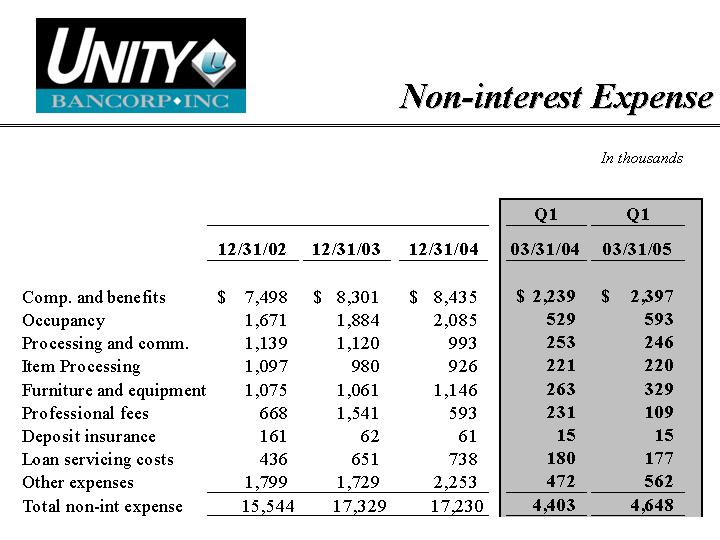
Non-interest Expense
In thousands
| | | | | | | | Q1 | | Q1 | |
| | 12/31/02 | | 12/31/03 | | 12/31/04 | | 03/31/04 | | 03/31/05 | |
| | | | | | | | | | | |
Comp. and benefits | | $ | 7,498 | | $ | 8,301 | | $ | 8,435 | | $ | 2,239 | | $ | 2,397 | |
Occupancy | | 1,671 | | 1,884 | | 2,085 | | 529 | | 593 | |
Processing and comm. | | 1,139 | | 1,120 | | 993 | | 253 | | 246 | |
Item Processing | | 1,097 | | 980 | | 926 | | 221 | | 220 | |
Furniture and equipment | | 1,075 | | 1,061 | | 1,146 | | 263 | | 329 | |
Professional fees | | 668 | | 1,541 | | 593 | | 231 | | 109 | |
Deposit insurance | | 161 | | 62 | | 61 | | 15 | | 15 | |
Loan servicing costs | | 436 | | 651 | | 738 | | 180 | | 177 | |
Other expenses | | 1,799 | | 1,729 | | 2,253 | | 472 | | 562 | |
Total non-int expense | | 15,544 | | 17,329 | | 17,230 | | 4,403 | | 4,648 | |
| | | | | | | | | | | | | | | | |