Exhibit 13
MANAGEMENT’S DISCUSSION & ANALYSIS OF FINANCIAL CONDITION & RESULTS OF OPERATIONS
The following discussion and analysis should be read in conjunction with the consolidated financial statements and the notes relating thereto included herein. When necessary, reclassifications have been made to prior period’s data for purposes of comparability with current period presentation.
Critical Accounting Policies and Estimates
“Management’s Discussion and Analysis of Financial Condition and Results of Operations” is based upon the Company’s consolidated financial statements, which have been prepared in accordance with U.S. generally accepted accounting principles. The preparation of these financial statements requires the Company to make estimates and judgments that affect the reported amounts of assets, liabilities, revenues and expenses. Note 1 to the Company’s Audited Consolidated Financial Statements for the year ended December 31, 2007, contains a summary of the Company’s significant accounting policies. Management believes the Company’s policy with respect to the methodology for the determination of the allowance for loan losses involves a higher degree of complexity and requires management to make difficult and subjective judgments, which often require assumptions or estimates about highly uncertain matters. Changes in these judgments, assumptions or estimates could materially impact results of operations. This critical policy and its application is periodically reviewed with the Audit Committee and the Board of Directors.
The provision for loan losses is based upon management’s evaluation of the adequacy of the allowance, including an assessment of known and inherent risks in the portfolio, giving consideration to the size and composition of the loan portfolio, actual loan loss experience, level of delinquencies, detailed analysis of individual loans for which full collectibility may not be assured, the existence and estimated net realizable value of any underlying collateral and guarantees securing the loans, and current economic and market conditions. Although management uses the best information available, the level of the allowance for loan losses remains an estimate, which is subject to significant judgment and short-term change. Various regulatory agencies, as an integral part of their examination process, periodically review the Company’s allowance for loan losses. Such agencies may require the Company to make additional provisions for loan losses based upon information available to them at the time of their examination. Furthermore, the majority of the Company’s loans are secured by real estate. Accordingly, the ability to collect a substantial portion of the carrying value of the Company’s loan portfolio is susceptible to changes in local real estate market conditions and may be adversely affected should real estate values decline. Future adjustments to the allowance for loan losses may be necessary due to economic, operating, regulatory and other conditions beyond the Company’s control.
Overview
Unity Bancorp, Inc. (the “Parent Company”) is a bank holding company incorporated in New Jersey and registered under the Bank Holding Company Act of 1956, as amended. Its wholly-owned subsidiary, Unity Bank (the “Bank,” or when consolidated with the Parent Company, the “Company”) is chartered by the New Jersey Department of Banking and Insurance. The Bank provides a full range of commercial and retail banking services through the Internet and its seventeen branch offices located in Hunterdon, Middlesex, Somerset, Union and Warren counties in New Jersey and Northampton County in Pennsylvania. These services include the acceptance of demand, savings and time deposits and the extension of consumer, real estate, Small Business Administration (“SBA”) and other commercial credits.
Results of Operations
Fiscal year 2007 was a challenging year for financial institutions. During much of the year, a flat and at times inverted Treasury yield curve reduced Bank spreads and net interest margins. There was some relief, beginning in September, as the Federal Reserve Board began lowering rates with a 50 basis point decrease in the target federal funds rate. This was the first of three rate drops in 2007 that reduced the Fed Funds target rate 100 basis points to 4.25 percent by year end and the Prime lending rate to 7.25 percent. Throughout 2007, deposit gathering remained extremely competitive and highly priced throughout the New Jersey and Eastern Pennsylvania marketplaces. In addition, disruptions in the credit markets spurred by the subprime mortgage crisis contributed to a challenging operating environment for financial institutions.
1
Despite this challenging operating environment, our performance in 2007 included the following accomplishments:
· Adding full-service branches in Palmer Township, Pennsylvania and Middlesex, New Jersey,
· Expanding our SBA lending offices as far south as Florida and west to Illinois,
· Growing our loan portfolio 16.2 percent,
· Growing deposits by 6.1 percent,
· Reducing our level of nonperforming loans $3.4 million, and
· Introducing new products such as third party annuity and alternative investments and remote deposit capture.
Net income for the year ended December 31, 2007 was $4.7 million, a 19.2 percent decrease compared to $5.8 million for 2006.
| | 2007 | | 2006 | |
Earnings per basic share | | $ | 0.68 | | $ | 0.85 | |
Earnings per diluted share | | $ | 0.66 | | $ | 0.81 | |
Return on average assets | | 0.66 | % | 0.90 | % |
Return on average equity | | 10.11 | % | 13.56 | % |
Efficiency ratio | | 71.48 | % | 67.21 | % |
Drivers of reduced earnings include:
· A higher cost of funds and reduced net interest margin,
· A lower level of net gains on SBA loan sales as a result of the Company’s strategic decision during the third quarter 2007 to begin retaining a significant portion of its SBA 7(a) program loans in its portfolio, rather than selling them to the secondary market. In prior periods, the Company had sold the majority of its production to the secondary market and consequently realized significant gains on these sales as noninterest income. However, the current market spread on these transactions has narrowed and provided the opportunity for the Company to hold these loans in its portfolio and enhance interest income, rather than sell these loans.
· An impairment charge of $607 thousand on FHLMC preferred stock during the fourth quarter, and
· Higher operating expenses related to the expansion of our retail and lending networks.
2006 vs. 2005
Net income for the year ended December 31, 2006 was $5.8 million, a 5.9% decrease compared to net income of $6.2 million for 2005. Earnings per basic and diluted share for the year ended December 31, 2006 were $0.85 and $0.81, respectively compared to $0.92 and $0.87 for the prior year. These declines were the result of increased net interest income driven by a higher volume of earning assets and a lower provision for loan losses, offset by higher operating expenses and lower noninterest income.
Net Interest Income
The primary source of income for the Company is net interest income, the difference between the interest earned on earning assets such as investments and loans, and the interest paid on deposits and borrowings. Factors that impact the Company’s net interest income include the interest rate environment, the volume and mix of earning assets and interest-bearing liabilities, and the competitive nature of the Company’s marketplace.
For the majority of 2007, the Company faced a flat, and at times, inverted Treasury yield curve in which deposit and borrowing costs have risen faster than the yields on earning assets. In September 2007, the Federal Reserve Board began to lower rates. Rates were reduced three times by year-end for a total of 100 basis points resulting in a Prime lending rate of 7.25 percent and a Fed Funds target rate of 4.25 percent. However, despite these rate reductions, the costs of funding asset growth remained high and margins remained tight, due to the lack of liquidity in the marketplace.
During 2007, tax equivalent interest income increased $5.8 million or 13.4 percent to $49.1 million. Of the $5.8 million increase in interest income on a tax equivalent basis, $4.5 million can be attributed to the increase in average interest-earning assets while $1.3 million may be attributed to an increase in the yield on interest-earning assets. The average volume of interest-earning assets increased $62.8 million to $678.5 million in 2007 compared to $615.7 million in 2006. This was due to a $62.8 million increase in average loans and a $684 thousand increase in average federal funds sold and interest-bearing deposits with banks, partially offset by a $717 thousand decrease in average securities. The yield on interest-earning assets increased 21 basis points to 7.23 percent in 2007 due to the impact of a higher overall interest rate environment during the first nine months of 2007 compared to 2006. Interest income on variable rate instruments, such as SBA loans, commercial loans, and consumer home equity lines of credit, increased due to these higher market rates. In addition, the average interest rate
2
earned on residential mortgage loans increased 33 basis points to 5.84 percent in 2007, compared to 5.51 percent in 2006.
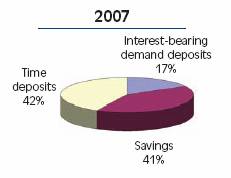
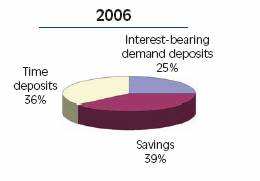
The higher interest rate environment and competitive New Jersey and Eastern Pennsylvania marketplaces in 2007 also increased interest expense and the cost of funds. Total interest expense was $24.5 million in 2007, an increase of $5.0 million or 25.9 percent compared to 2006. Of the $5.0 million increase in interest expense in 2007, $3.5 million was attributed to an increase in interest-bearing liabilities while $1.5 million was due to an increase in the rates paid on these liabilities. Interest-bearing liabilities averaged $588.3 million in 2007, an increase of $61.5 million, or 11.7 percent, compared to 2006. The increase in interest-bearing liabilities was a result of increases in the savings, time deposits, and borrowed funds and subordinated debentures categories, offset in part by a decline in interest-bearing demand deposits. Average interest-bearing deposits increased $32.3 million, as average savings deposits increased $20.4 million and average time deposits increased $43.8 million while average interest-bearing demand deposits declined $32.0 million. Average borrowed funds and subordinated debentures increased $29.2 million to $85.0 million in 2007 compared to $55.8 million in 2006 due to the addition of $30 million in FHLB borrowings. The average cost of interest-bearing liabilities increased 47 basis points to 4.16 percent, primarily due to the repricing of deposits and borrowings in a higher interest rate environment. The cost of interest-bearing deposits increased 47 basis points to 4.01 percent in 2007 and the cost of borrowed funds and subordinated debentures increased 12 basis points to 5.03 percent. The high cost of deposits in our marketplace combined with a shift in our deposit mix from interest-bearing demand deposits into higher cost savings and time deposits as illustrated below contributed to this higher cost of funding.
Tax-equivalent net interest income amounted to $24.6 million in 2007, an increase of $761 thousand, or 3.2 percent, compared to 2006. Net interest margin decreased 25 basis points to 3.62 percent for 2007, compared to 3.87 percent in 2006. The tighter net interest margin was primarily the result of the higher cost of deposits to fund asset growth. The net interest spread was 3.07 percent, a 26 basis point decrease from 3.33 percent in 2006.
For 2006, tax-equivalent net interest income totaled $23.8 million, an increase of $1.5 million or 6.9 percent from the $22.3 million earned in 2005. This increase was the result of a larger volume of interest-earning assets offset in part by a 41 basis point decrease in net interest spread, which averaged 3.33 percent in 2006. Net interest margin was 3.87 percent for 2006 compared to 4.17 percent in 2005.
The table on the following page reflects the components of net interest income, setting forth for the periods presented herein: (1) average assets, liabilities and shareholders’ equity, (2) interest income earned on interest-earning assets and interest expense paid on interest-bearing liabilities, (3) average yields earned on interest-earning assets and average rates paid on interest-bearing liabilities, (4) net interest spread (which is the average yield on interest-earning assets less the average rate on interest-bearing liabilities), and (5) net interest income/margin on average earning assets. Rates/Yields are computed on a fully tax-equivalent basis, assuming a federal income tax rate of 34 percent.
3
Consolidated Average Balance Sheets
(Dollar amounts in thousands – Interest amounts and interest rates/yields on a fully tax-equivalent basis.)
| | 2007 | | 2006 | |
| | Average | | | | Rate/ | | Average | | | | Rate/ | |
Years ended December 31, | | Balance | | Interest | | Yield | | Balance | | Interest | | Yield | |
ASSETS | | | | | | | | | | | | | |
Interest-earning assets: | | | | | | | | | | | | | |
Federal funds sold and interest-bearing deposits with banks | | $ | 22,290 | | $ | 1,068 | | 4.79 | % | $ | 21,606 | | $ | 1,042 | | 4.82 | % |
Securities: | | | | | | | | | | | | | |
Available for sale | | 69,189 | | 3,511 | | 5.07 | | 66,474 | | 3,103 | | 4.67 | |
Held to maturity | | 37,724 | | 1,986 | | 5.26 | | 41,156 | | 2,069 | | 5.03 | |
Total securities (A) | | 106,913 | | 5,497 | | 5.14 | | 107,630 | | 5,172 | | 4.81 | |
Loans, net of unearned discount: | | | | | | | | | | | | | |
SBA | | 84,185 | | 9,039 | | 10.74 | | 84,113 | | 8,615 | | 10.24 | |
Commercial | | 341,841 | | 25,738 | | 7.53 | | 294,773 | | 21,914 | | 7.43 | |
Residential mortgage | | 68,443 | | 3,995 | | 5.84 | | 59,933 | | 3,305 | | 5.51 | |
Consumer | | 54,789 | | 3,722 | | 6.79 | | 47,652 | | 3,208 | | 6.73 | |
Total loans (A), (B) | | 549,258 | | 42,494 | | 7.74 | | 486,471 | | 37,042 | | 7.61 | |
Total interest-earning assets | | $ | 678,461 | | $ | 49,059 | | 7.23 | % | $ | 615,707 | | $ | 43,256 | | 7.02 | % |
Noninterest-earning assets: | | | | | | | | | | | | | |
Cash and due from banks | | 13,467 | | | | | | 12,439 | | | | | |
Allowance for loan losses | | (8,184 | ) | | | | | (7,493 | ) | | | | |
Other assets | | 29,304 | | | | | | 29,302 | | | | | |
Total noninterest-earning assets | | 34,587 | | | | | | 34,248 | | | | | |
Total Assets | | $ | 713,048 | | | | | | $ | 649,955 | | | | | |
| | | | | | | | | | | | | |
LIABILITIES AND SHAREHOLDERS’ EQUITY | | | | | | | | | | | | | |
Interest-bearing liabilities: | | | | | | | | | | | | | |
Interest-bearing demand deposits | | $ | 85,750 | | $ | 1,928 | | 2.25 | % | $ | 117,730 | | $ | 2,648 | | 2.25 | % |
Savings deposits | | 204,214 | | 8,064 | | 3.95 | | 183,815 | | 6,948 | | 3.78 | |
Time deposits | | 213,407 | | 10,206 | | 4.78 | | 169,572 | | 7,101 | | 4.19 | |
Total interest-bearing deposits | | 503,371 | | 20,198 | | 4.01 | | 471,117 | | 16,697 | | 3.54 | |
Borrowed funds and subordinated debentures | | 84,962 | | 4,276 | | 5.03 | | 55,756 | | 2,735 | | 4.91 | |
Total interest-bearing liabilities | | $ | 588,333 | | $ | 24,474 | | 4.16 | % | $ | 526,873 | | $ | 19,432 | | 3.69 | % |
Noninterest-bearing liabilities: | | | | | | | | | | | | | |
Demand deposits | | 75,581 | | | | | | 77,747 | | | | | |
Other liabilities | | 2,416 | | | | | | 2,218 | | | | | |
Total noninterest-bearing liabilities | | 77,997 | | | | | | 79,965 | | | | | |
Shareholders’ equity | | 46,718 | | | | | | 43,117 | | | | | |
Total Liabilities and Shareholders’ Equity | | $ | 713,048 | | | | | | $ | 649,955 | | | | | |
Net interest spread | | | | $ | 24,585 | | 3.07 | % | | | $ | 23,824 | | 3.33 | % |
Tax-equivalent basis adjustment | | | | (159 | ) | | | | | (79 | ) | | |
Net interest income | | | | $ | 24,426 | | | | | | $ | 23,745 | | | |
Net interest margin | | | | | | 3.62 | % | | | | | 3.87 | % |
|
(A) | Yields related to securities and loans exempt from federal and state income taxes are stated on a fully tax-equivalent basis. They are reduced by the nondeductible portion of interest expense, assuming a federal tax rate of 34 percent and applicable state tax rates. |
(B) | The loan averages are stated net of unearned income, and the averages include loans on which the accrual of interest has been discontinued. |
4
| | 2005 | | 2004 | | 2003 | |
Years ended December 31, | | Average
Balance | | Interest | | Rate/
Yield | | Average
Balance | | Interest | | Rate/
Yield | | Average
Balance | | Interest | | Rate/
Yield | |
ASSETS | | | | | | | | | | | | | | | | | | | |
Interest-earning assets: | | | | | | | | | | | | | | | | | | | |
Federal funds sold and interest-bearing deposits with banks | | $ | 17,160 | | $ | 572 | | 3.33 | % | $ | 15,039 | | $ | 193 | | 1.28 | % | $ | 10,846 | | $ | 138 | | 1.27 | % |
Securities: | | | | | | | | | | | | | | | | | | | |
Available for sale | | 74,208 | | 3,152 | | 4.25 | | 83,291 | | 3,374 | | 4.05 | | 63,102 | | 2,403 | | 3.81 | |
Held to maturity | | 31,139 | | 1,477 | | 4.74 | | 17,395 | | 867 | | 4.98 | | 19,633 | | 998 | | 5.08 | |
Total securities (A) | | 105,347 | | 4,629 | | 4.39 | | 100,686 | | 4,241 | | 4.21 | | 82,735 | | 3,401 | | 4.11 | |
Loans, net of unearned discount: | | | | | | | | | | | | | | | | | | | |
SBA | | 74,369 | | 6,558 | | 8.82 | | 62,853 | | 4,296 | | 6.83 | | 65,555 | | 4,115 | | 6.28 | |
Commercial | | 230,039 | | 16,164 | | 7.03 | | 192,435 | | 12,934 | | 6.72 | | 175,685 | | 12,495 | | 7.11 | |
Residential mortgage | | 62,103 | | 3,318 | | 5.34 | | 50,242 | | 2,712 | | 5.40 | | 52,014 | | 3,126 | | 6.01 | |
Consumer | | 45,707 | | 2,648 | | 5.79 | | 38,979 | | 1,860 | | 4.77 | | 32,323 | | 1,676 | | 5.19 | |
Total loans (A), (B) | | 412,218 | | 28,688 | | 6.96 | | 344,509 | | 21,802 | | 6.33 | | 325,577 | | 21,412 | | 6.58 | |
Total interest-earning assets | | $ | 534,725 | | $ | 33,889 | | 6.34 | % | $ | 460,234 | | $ | 26,236 | | 5.70 | % | $ | 419,158 | | $ | 24,951 | | 5.96 | % |
Noninterest-earning assets: | | | | | | | | | | | | | | | | | | | |
Cash and due from banks | | 12,661 | | | | | | 13,304 | | | | | | 14,216 | | | | | |
Allowance for loan losses | | (6,398 | ) | | | | | (5,724 | ) | | | | | (4,783 | ) | | | | |
Other assets | | 24,399 | | | | | | 15,603 | | | | | | 13,764 | | | | | |
Total noninterest-earning assets | | 30,662 | | | | | | 23,183 | | | | | | 23,197 | | | | | |
Total Assets | | $ | 565,387 | | | | | | $ | 483,417 | | | | | | $ | 442,355 | | | | | |
| | | | | | | | | | | | | | | | | | | |
LIABILITIES AND SHAREHOLDERS’ EQUITY | | | | | | | | | | | | | | | | | | | |
Interest-bearing liabilities: | | | | | | | | | | | | | | | | | | | |
Interest-bearing demand deposits | | $ | 150,420 | | $ | 2,605 | | 1.73 | % | $ | 188,840 | | $ | 2,656 | | 1.41 | % | $ | 184,220 | | $ | 2,703 | | 1.47 | % |
Savings deposits | | 130,911 | | 3,164 | | 2.42 | | 49,330 | | 620 | | 1.26 | | 36,976 | | 423 | | 1.14 | |
Time deposits | | 118,174 | | 3,820 | | 3.23 | | 96,686 | | 2,507 | | 2.59 | | 90,814 | | 2,733 | | 3.01 | |
Total interest-bearing deposits | | 399,505 | | 9,589 | | 2.40 | | 334,856 | | 5,783 | | 1.73 | | 312,010 | | 5,859 | | 1.88 | |
Borrowed funds and subordinated debentures | | 46,604 | | 2,014 | | 4.32 | | 29,169 | | 1,225 | | 4.20 | | 21,532 | | 1,169 | | 5.43 | |
Total interest-bearing liabilities | | $ | 446,109 | | $ | 11,603 | | 2.60 | % | $ | 364,025 | | $ | 7,008 | | 1.93 | % | $ | 333,542 | | $ | 7,028 | | 2.11 | % |
Noninterest-bearing liabilities: | | | | | | | | | | | | | | | | | | | |
Demand deposits | | 78,519 | | | | | | 85,283 | | | | | | 79,102 | | | | | |
Other liabilities | | 2,634 | | | | | | 1,445 | | | | | | 1,152 | | | | | |
Total noninterest-bearing liabilities | | 81,153 | | | | | | 86,728 | | | | | | 80,254 | | | | | |
Shareholders’ equity | | 38,125 | | | | | | 32,664 | | | | | | 28,559 | | | | | |
Total Liabilities and Shareholders’ Equity | | $ | 565,387 | | | | | | $ | 483,417 | | | | | | $ | 442,355 | | | | | |
Net interest spread | | | | $ | 22,286 | | 3.74 | % | | | $ | 19,228 | | 3.77 | % | | | $ | 17,923 | | 3.85 | % |
Tax-equivalent basis adjustment | | | | (52 | ) | | | | | (70 | ) | | | | | (56 | ) | | |
Net interest income | | | | $ | 22,234 | | | | | | $ | 19,158 | | | | | | $ | 17,867 | | | |
Net interest margin | | | | | | 4.17 | % | | | | | 4.18 | % | | | | | 4.28 | % |
5
The rate volume table below presents an analysis of the impact on interest income and expense resulting from changes in average volume and rates over the periods presented. Changes that are not due to volume or rate variances have been allocated proportionally to both, based on their relative absolute values. Amounts have been computed on a tax-equivalent basis, assuming a federal income tax rate of 34 percent.
| | 2007 versus 2006 | | 2006 versus 2005 | |
Year ended December 31,
(Dollar amounts in thousands | | Increase (Decrease)
Due to change in | | Increase (Decrease)
Due to change in | |
on a tax equivalent basis) | | Volume | | Rate | | Net | | Volume | | Rate | | Net | |
Interest Income: | | | | | | | | | | | | | |
Federal funds sold and interest-bearing deposits | | $ | 32 | | $ | (6 | ) | $ | 26 | | $ | 172 | | $ | 298 | | $ | 470 | |
Investment securities | | (44 | ) | 369 | | 325 | | 153 | | 390 | | 543 | |
Net loans | | 4,504 | | 948 | | 5,452 | | 5,705 | | 2,649 | | 8,354 | |
Total interest income | | $ | 4,492 | | $ | 1,311 | | $ | 5,803 | | $ | 6,030 | | $ | 3,337 | | $ | 9,367 | |
| | | | | | | | | | | | | |
Interest Expense: | | | | | | | | | | | | | |
Interest-bearing demand deposits | | $ | (720 | ) | $ | — | | $ | (720 | ) | $ | (639 | ) | $ | 682 | | $ | 43 | |
Savings deposits | | 794 | | 322 | | 1,116 | | 1,583 | | 2,201 | | 3,784 | |
Time deposits | | 2,011 | | 1,094 | | 3,105 | | 1,949 | | 1,332 | | 3,281 | |
Total deposits | | $ | 2,085 | | $ | 1,416 | | $ | 3,501 | | $ | 2,893 | | $ | 4,215 | | $ | 7,108 | |
Other debt | | 1,472 | | 69 | | 1,541 | | 425 | | 296 | | 721 | |
Total interest expense | | $ | 3,557 | | $ | 1,485 | | $ | 5,042 | | $ | 3,318 | | $ | 4,511 | | $ | 7,829 | |
Net interest income – fully tax-equivalent (FTE) | | $ | 935 | | $ | (174 | ) | $ | 761 | | $ | 2,712 | | $ | (1,174 | ) | $ | 1,538 | |
Increase in tax-equivalent adjustment | | | | | | 80 | | | | | | 27 | |
Net interest income | | | | | | $ | 681 | | | | | | $ | 1,511 | |
Provision for Loan Losses
The provision for loan losses totaled $1.6 million for 2007 and 2006. The provision for loan losses is comprised of the specific and general reserve factors used to determine reserve levels on certain types of loans. In 2006, the provision for loan losses decreased $300 thousand from $1.9 million in 2005 due to the change and composition of the loan portfolio, the results of the analysis of the estimated probable losses inherent in the loan portfolio, the credit worthiness of particular borrowers, and general economic conditions.
The provision for loan losses is determined based on management’s evaluation of the adequacy of the allowance for loan losses which is maintained at a level that is sufficient to absorb estimated probable losses in the loan portfolio as of the balance sheet date. (For additional information, see the section titled Allowance for Loan Losses). Management believes the current provision is appropriate based on its assessment of the adequacy of the allowance for loan losses.
Noninterest Income
Noninterest income was $5.9 million for 2007, a $1.7 million, or 22.2 percent decrease compared to $7.6 million for 2006. The decrease in noninterest income was due primarily to the net loss on securities, a decrease in gains on sales of SBA 7(a) loans, lower gains on the sale of mortgage loans and decreased service charges on deposits accounts.
The following table shows the components of noninterest income for 2007, 2006 and 2005:
(In thousands) | | 2007 | | 2006 | | 2005 | |
Service charges on deposit accounts | | $ | 1,383 | | $ | 1,602 | | $ | 1,766 | |
Service and loan fee income | | 1,607 | | 1,637 | | 2,111 | |
Gain on SBA loan sales, net | | 2,399 | | 2,972 | | 2,956 | |
Gain on mortgage loan sales | | 52 | | 363 | | 382 | |
Bank owned life insurance | | 198 | | 187 | | 185 | |
Gains on sales of other loans | | — | | 82 | | — | |
Net security (losses) gains | | (571 | ) | 69 | | 69 | |
Other income | | 872 | | 726 | | 721 | |
Total noninterest income | | $ | 5,940 | | $ | 7,638 | | $ | 8,190 | |
Service charges on deposits decreased $219 thousand or 13.7 percent to equal $1.4 million in 2007 compared to $1.6 million in 2006. These decreases were a result of lower levels of uncollected fees due to faster clearing times upon the implementation of the federal “Check 21” law and its increase in electronic check processing, in addition to
6
reduced holding times on checks from 5 days to 4 days. This was consistent with 2006 when service charges on deposit accounts decreased $164 thousand, or 9.3 percent, from 2005 as a result of the lower volume of uncollected and overdraft fees collected on deposit accounts.
Service and loan fee income remained relatively flat at $1.6 million for 2007 and 2006. Compared to 2005, service and loan fee income decreased as a result of a decline in SBA servicing income due to payoffs in the SBA serviced portfolio and lower prepayment penalties on commercial loans due to the higher interest rate environment.
Gains on SBA loan sales reflect the Company’s participation in the SBA’s guaranteed loan program. Under the SBA 7(a) program, the SBA guarantees up to 85 percent of the principal of a qualifying loan. The Company usually sells the guaranteed portion of the loan into the secondary market and retains the unguaranteed portion.
The Company expects to sell approximately half of its volume of newly generated SBA loans in 2008. Future sales will be determined on a loan by loan basis on whether it is more profitable to portfolio SBA loans and earn the interest income or to sell the loan and record the gain on sale and future servicing income.
Gains on the sale of SBA loans decreased $573 thousand or 19.3 percent to $2.4 million in 2007 compared to $3.0 million in 2006 on a comparable sales volume. Gains on the sale of SBA loans remained consistent at $3.0 million during 2006 and 2005 despite a higher volume of loan sales in 2006. The sales of guaranteed SBA loans totaled $41.6 million, $41.2 million, and $37.5 million for 2007, 2006 and 2005, respectively. The decrease in gains on these sales during both periods was the result of lower premiums.
Gains on the sale of mortgage loans decreased $311 thousand in 2007 to $52 thousand due to a lower volume. Gains on the sale of mortgage loans decreased $19 thousand in 2006 to $363 thousand due to a lower volume of mortgage loans being sold. Sales of mortgage loans totaled $3.0 million, $20.9 million, and $25.2 million for 2007, 2006 and 2005, respectively. Sales decreased significantly during 2007 as the Company chose to hold these loans in its portfolio in response to volatility within the market.
In December 2004, the Company purchased $5 million of bank-owned life insurance (“BOLI”) to offset the rising costs of employee benefits. In 2007, the cash surrender value of the BOLI increased $198 thousand compared to $187 thousand the prior year.
During 2007, the Company realized $571 thousand in net security losses compared to gains of $69 thousand in 2006 and 2005. This loss was due to a $607 thousand write-down on three Federal Home Loan Mortgage Corporation (“FHLMC”) investment grade, perpetual callable preferred securities, which the Company classified as impaired due to the recent decline in market value and the uncertainty that it will recover their $3.9 million book value within a reasonable period.
Other income equaled $872 thousand, $726 thousand, and $721 thousand in 2007, 2006 and 2005, respectively.
Noninterest Expense
Total noninterest expense was $22.1 million for 2007, an increase of $1.1 million or 5.1 percent over 2006. Branch expansion, growth of our SBA lending franchise, and technological investments during the year contributed to the increase in operational expense. During the year, the Company opened branches in Palmer Township, Pennsylvania and Middlesex, New Jersey.
The following table presents a breakdown of noninterest expense for the years 2007, 2006 and 2005:
(In thousands) | | 2007 | | 2006 | | 2005 | |
Compensation and benefits | | $ | 11,446 | | $ | 11,028 | | $ | 9,639 | |
Occupancy, net | | 2,777 | | 2,580 | | 2,256 | |
Processing & communications | | 2,433 | | 2,220 | | 2,010 | |
Furniture & equipment | | 1,675 | | 1,538 | | 1,350 | |
Loan servicing | | 604 | | 542 | | 482 | |
Professional services | | 598 | | 636 | | 547 | |
Advertising | | 457 | | 575 | | 697 | |
Deposit insurance | | 67 | | 67 | | 61 | |
Other expenses | | 2,056 | | 1,859 | | 1,634 | |
Total noninterest expense | | $ | 22,113 | | $ | 21,045 | | $ | 18,676 | |
Compensation and benefits expense, the largest component of noninterest expense, totaled $11.4 million in 2007, an increase of $418 thousand or 3.8 percent compared to 2006. This increase was due to increased head count as the Company added retail and lending staff, increased merit and incentive based payments and an increase in medical benefits premiums. Compensation and benefits expense was $11.0 million for 2006, an increase of $1.4 million or 14.4 percent, compared to 2005. The increase in compensation and benefits expense for the year was related to increased head count during the year, merit increases and increased health care costs. At December 31, 2007, 2006 and 2005 there were 201, 185 and 190 full-time equivalent employees, respectively.
Occupancy expense increased $197 thousand or 7.6 percent to $2.8 million in 2007. The increase was due to leasehold improvements and utilities expenses related to the expansion of our retail branch and SBA loan office locations, partially offset by lower maintenance related expenses at our existing locations. Occupancy expense was $2.6 million for 2006, a 14.4 percent increase over the prior year. The increase in occupancy expense was
7
related to the opening of a branch location in Forks Township, Pennsylvania in 2006 and higher branch maintenance costs, as well as annual lease increases and increased utility and property tax expenses.
Processing and communications expenses increased $213 thousand or 9.6 percent to $2.4 million in 2007 compared to the prior year. These increases were the result of higher phone and data line expenses. Processing and communications expense increased to $2.2 million in 2006, a $210 thousand or 10.4 percent increase compared to 2005. The increase was due to higher data processing costs due to increased loan and deposit transactional volume.
Furniture and equipment expense increased $137 thousand or 8.9 percent to $1.7 million in 2007 compared to the prior year. These increases were due primarily to higher software and network maintenance, equipment lease and depreciation expenses as we continue to invest in the technology necessary to efficiently service our customers. Furniture and equipment expense increased 13.9 percent to $1.5 million for 2006. The increases in 2006 were due to branch expansion and refurbishment related costs.
Loan servicing costs increased $62 thousand or 11.4 percent to $604 thousand in 2007 compared to 2006. Loan servicing expense amounted to $542 thousand for 2006, an increase of $60 thousand, or 12.4 percent compared to 2005. The increases during both periods were due to higher collection costs on delinquent loans.
Professional service fees decreased $38 thousand to $598 thousand in 2007 compared to 2006 due to lower legal, accounting and audit related fees, partially offset by increased consultant and loan review fees. Professional services fees totaled $636 thousand for 2006, an $89 thousand, or 16.3 percent increase, compared to 2005. This included increased legal, accounting and audit related fees.
Advertising expense decreased $118 thousand to $457 thousand in 2007. The decrease was due to the use of less expensive delivery channels during 2007. Advertising expense was $575 thousand for 2006, a decrease of $122 thousand or 17.5 percent, compared to 2005. The decrease was due to reduced advertising.
Deposit insurance expense was $67 thousand for 2007 and 2006, and $61 thousand for 2005.
Other expenses increased $197 thousand or 10.6 percent to $2.1 million compared to the prior year. This increase was due primarily to increased employee recruiting and director fees. Other expenses amounted to $1.9 million for 2006, an increase of $225 thousand or 13.8 percent from the prior year. This increase was related to the establishment of a reserve for loan commitments, higher director fees and increased office supply expenses.
Income Tax Expense
For 2007, the Company reported income tax expense of $2.0 million for a 29.5 percent effective tax rate compared to $2.9 million or a 33.5 percent effective tax rate in 2006. The decrease in the tax provision was the result of lower pre-tax earnings and a lower effective tax rate. The lower effective tax rate for 2007 is related to a higher proportion of revenue being generated at a subsidiary with a lower effective tax, in addition to a higher balance of tax-free securities. The Company anticipates a 33.5 percent effective income tax rate in 2008.
For 2006, the Company reported income tax expense of $2.9 million for a 33.5 percent effective tax rate compared to $3.7 million or a 37.3 percent effective tax rate in 2005. The decrease in the tax provision was the result of lower pre-tax earnings and a lower effective tax rate. The reduction in the effective tax rate in 2006 was related to a higher proportion of revenue being generated at a subsidiary with a lower effective tax rate.
Financial Condition
Total assets increased $58.1 million, or 8.4 percent, to $752.2 million at December 31, 2007, compared to $694.1 million at December 31, 2006. This increase was due to an $82.4 million increase in loans, offset by an $18.7 million decrease in federal funds sold and interest-bearing deposits and a $6.9 million decrease in total securities.
Average total assets for 2007 were $713.0 million, a $63.1 million increase from the prior year’s $650.0 million average balance. The increase in average assets was due primarily to growth in the loan portfolio funded by savings, time deposits and borrowed funds.
Investment Securities Portfolio
The Company’s securities portfolio consists of available for sale and held to maturity investments. The investment securities portfolio is maintained for asset-liability management purposes, as an additional source of liquidity, and as an additional source of earnings.
Securities available for sale are investments carried at fair value that may be sold in response to changing market and interest rate conditions or for other business purposes. Activity in this portfolio is undertaken primarily to manage liquidity and interest rate risk, to take advantage of market conditions that create economically attractive returns and as an additional source of earnings. Securities available for sale consist primarily of U.S. Government sponsored agencies, obligations of state and political subdivisions, mortgage-backed securities, corporate bonds and equity securities.
8
Securities available for sale were $64.9 million and $62.6 million at December 31, 2007 and 2006, respectively. During 2007, there were $18.6 million of purchases, $11.0 million of maturities and pay downs, $5.3 million in sales and $563 thousand in appreciation in the market value of the portfolio. Securities purchases and sales consisted primarily of agency bonds and mortgage-backed securities. At December 31, 2007, the portfolio had a net unrealized loss of $767 thousand compared to a net unrealized loss of $1.3 million at the end of the prior year. These unrealized gains and losses are reflected net of tax in shareholders’ equity as accumulated other comprehensive loss.
The average balance of securities available for sale amounted to $69.2 million in 2007 compared to $66.5 million in 2006. The average yield earned on the available for sale portfolio increased 40 basis points, to 5.07 percent in 2007 from 4.67 percent in 2006. The weighted average repricing of securities available for sale, adjusted for prepayments, amounted to 2.8 years at December 31, 2007, compared to 3.1 years in 2006.
Included in available for sale securities at December 31, 2007 were three Federal Home Loan Mortgage Corporation (“FHLMC”) investment grade, perpetual callable preferred securities which the Company classified as impaired due to the decline in market value and the uncertainty that they will recover their $3.9 million book value within a reasonable period. The FHLMC securities were investment grade at the time of purchase and remain investment grade with ratings of AA- from S&P and Aa3 from Moody’s. At December 31, 2007, the Company had recognized an impairment charge of $607 thousand related to these securities. The securities continue to perform according to their contractual terms and all dividend payments are current.
Securities held to maturity, which are carried at amortized cost, are investments for which there is the positive intent and ability to hold to maturity. The portfolio is comprised of mortgage-backed securities, obligations of U.S. Government and government sponsored agencies, obligations of state and local subdivisions, and corporate securities. Management determines the appropriate security classification of available for sale or held to maturity at the time of purchase.
Securities held to maturity were $33.7 million at December 31, 2007, a decrease of $9.1 million or 21.2 percent, from year-end 2006. As of December 31, 2007 and 2006, the market value of held to maturity securities was $33.6 million and $42.4 million, respectively. The average balance of securities held to maturity amounted to $37.7 million in 2007 compared to $41.2 million in 2006. The average yield earned on held to maturity securities increased 23 basis points, from 5.03 percent in 2006 to 5.26 percent in 2007. The weighted average repricing of held to maturity securities, adjusted for prepayments, amounted to 3.0 years at December 31, 2007 and December 31, 2006.
Approximately 83 percent of the total investment portfolio had a fixed rate of interest.
Securities with a carrying value of $54.9 million and $47.6 million at December 31, 2007 and 2006, respectively, were pledged to secure government deposits, secured other borrowings and for other purposes required or permitted by law.
Loan Portfolio
The loan portfolio, which represents the Company’s largest asset group, is a significant source of both interest and fee income. The portfolio consists of commercial, SBA, residential mortgage and consumer loans. Elements of the loan portfolio are subject to differing levels of credit and interest rate risk.
Total loans increased $82.4 million, or 16.2 percent to $590.1 million at December 31, 2007, from $507.7 million at year-end 2006. Growth in the loan portfolio was generated by increases of $53.6 million in commercial loans, $14.4 million in SBA loans, $10.2 million in residential mortgages, and $4.2 million in consumer loans.
Average loans increased $62.8 million or 12.9 percent from $486.5 million in 2006, to $549.3 million in 2007. The increase in average loans was due primarily to growth in the commercial, residential mortgage and consumer loan portfolios. The yield on the loan portfolio was 7.74 percent in 2007 compared to 7.61 percent in 2006. The increase in the yield on the loan portfolio was due to a higher interest rate environment in 2007.
The SBA provides guarantees of up to 85 percent of the principal amount of SBA 7(a) loans. SBA 7(a) loans available for sale are generally sold in the secondary market with the unguaranteed portion held in the portfolio. However during the third quarter of 2007 the Company announced a strategic decision to begin retaining a portion of its SBA 7(a) program loans in its portfolio, rather than selling them into the secondary market. Although the decision impacted earnings in the short-term, management believes it will benefit the Company over the long-term. SBA 7(a) loans held to maturity amounted to $68.9 million at December 31, 2007, an increase of $2.1 million from December 31, 2006. SBA 7(a) loans held for sale, carried at the lower of cost or market, amounted to $24.6 million at December 31, 2007, an increase of $12.4 million from December 31, 2006. SBA 7(a) loans are often originated outside of the Company’s marketplace.
Commercial loans are generally made in the Company’s marketplace for the purpose of providing working capital, financing the purchase of equipment, inventory or commercial real estate and for other business purposes. These loans amounted to $365.8 million at December 31, 2007,
9
an increase of $53.6 million from year-end 2006. The commercial portfolio is expected to continue to increase in 2008. Included in commercial loans at December 31, 2007 are $72.1 million of SBA 504 loans. The SBA 504 program consists of real estate backed commercial mortgages where generally the Company has the first mortgage and the SBA has the second mortgage on the property. The Company generally has a 50 percent loan to value ratio on SBA 504 program loans.
Residential mortgage loans consist of loans secured by 1-4 family residential properties. These loans amounted to $73.7 million at December 31, 2007, an increase of $10.2 million from December 31, 2006. During 2007, the Company held the majority of originated mortgages in its portfolio compared to prior years when it sold these loans into the secondary market.
Consumer loans consist of home equity loans and loans for the purpose of financing the purchase of consumer goods, home improvements, and other personal needs, and are generally secured by the personal property being purchased. These loans amounted to $57.1 million at December 31, 2007, an increase of $4.2 million or 7.9 percent from $52.9 million at December 31, 2006. The growth in consumer loans is related to the growth in home equity loans and lines.
The following table sets forth the classification of loans by major category, including unearned, deferred costs and excluding the allowance for loan losses for the past five years at December 31:
| | 2007 | | 2006 | | 2005 | | 2004 | | 2003 | |
| | | | % of | | | | % of | | | | % of | | | | % of | | | | % of | |
(In thousands) | | Amount | | Total | | Amount | | Total | | Amount | | Total | | Amount | | Total | | Amount | | Total | |
SBA held for sale | | $ | 24,640 | | 4.2 | % | $ | 12,273 | | 2.4 | % | $ | 14,001 | | 3.1 | % | $ | 7,574 | | 2.0 | % | $ | 14,014 | | 4.1 | % |
SBA held to maturity | | 68,875 | | 11.7 | % | 66,802 | | 13.2 | % | 64,660 | | 14.4 | % | 55,576 | | 14.9 | % | 49,983 | | 14.7 | % |
Commercial | | 365,786 | | 61.9 | % | 312,195 | | 61.5 | % | 260,581 | | 58.1 | % | 207,771 | | 55.6 | % | 188,197 | | 55.4 | % |
Residential mortgage | | 73,697 | | 12.5 | % | 63,493 | | 12.5 | % | 62,039 | | 13.8 | % | 60,240 | | 16.1 | % | 51,176 | | 15.1 | % |
Consumer | | 57,134 | | 9.7 | % | 52,927 | | 10.4 | % | 47,286 | | 10.6 | % | 42,419 | | 11.4 | % | 36,385 | | 10.7 | % |
Total Loans | | $ | 590,132 | | 100.0 | % | $ | 507,690 | | 100.0 | % | $ | 448,567 | | 100.0 | % | $ | 373,580 | | 100.0 | % | $ | 339,755 | | 100.0 | % |
The Company has a concentration to a group of borrowers in the Hotel/Motel industry of approximately 13 percent of the total loan portfolio. There are no other concentrations of loans to any borrowers or group of borrowers exceeding 10 percent of the total loan portfolio. There are no foreign loans in the portfolio. As a preferred SBA lender, a portion of the SBA portfolio is outside of the Company’s lending area.
The following table shows the maturity distribution or repricing of the loan portfolio and the allocation of floating and fixed interest rates at December 31, 2007.
| | Within | | 1-5 | | After | | | |
(In thousands) | | 1 Year | | Years | | 5 Years | | Total | |
SBA | | $ | 67,518 | | $ | 25,627 | | $ | 370 | | $ | 93,515 | |
Commercial | | 111,273 | | 215,337 | | 39,176 | | 365,786 | |
Residential mortgage | | 13,965 | | 31,756 | | 27,976 | | 73,697 | |
Consumer | | 22,336 | | 9,953 | | 24,845 | | 57,134 | |
Total | | $ | 215,092 | | $ | 282,673 | | $ | 92,367 | | $ | 590,132 | |
Amount of loans with maturities or repricing dates greater than one year: | | | |
Fixed interest rates | | $ | 159,624 | |
Floating or adjustable interest rates | | 215,416 | |
Total | | $ | 375,040 | |
Asset Quality
Inherent in the lending function is the possibility that a customer may not perform in accordance with the contractual terms of the loan. A borrower’s inability to pay its obligations according to the contractual terms can create the risk of past due loans and ultimately credit losses, especially on collateral deficient loans.
Nonperforming loans generally consist of loans that are not accruing interest (nonaccrual loans) as a result of principal or interest being in default for a period of 90 days or more or when the ability to collect principal and interest according to the contractual terms is in doubt. When a loan is classified as nonaccrual, interest accruals discontinue and all past due interest previously recognized as income is reversed and charged against current period income. Unless the ability to collect principal and interest is reasonably assured, any payments received from the borrower are applied to outstanding principal until such time as management determines that the financial condition of the borrower and other factors merit recognition of a portion of such payments as interest income.
Credit risk is minimized by loan diversification and adhering to credit administration policies and procedures. Due diligence on loans begins upon the application for a
10
loan by a prospective borrower. Documentation, including a borrower’s credit history, materials establishing the value of potential collateral, the source of funds for repayment of the loan and other factors are analyzed before a loan is submitted for approval. The loan portfolio is then subject to ongoing internal reviews for credit quality. In addition, an outside firm is used to conduct independent credit reviews.
The following table sets forth information concerning nonperforming loans and nonperforming assets at December 31 for the past five years:
(In thousands) | | 2007 | | 2006 | | 2005 | | 2004 | | 2003 | |
Nonperforming by category | | | | | | | | | | | |
Commercial | | $ | 1,630 | | $ | 3,172 | | $ | 1,250 | | $ | 1,534 | | $ | 1,568 | |
SBA(1) | | 2,110 | | 5,212 | | 1,391 | | 2,013 | | 3,175 | |
Residential mortgage | | 1,192 | | 322 | | 1,510 | | 288 | | 458 | |
Consumer | | 529 | | 203 | | 210 | | 256 | | 194 | |
Total nonperforming loans | | $ | 5,461 | | $ | 8,909 | | $ | 4,361 | | $ | 4,091 | | $ | 5,395 | |
OREO | | 106 | | 211 | | 178 | | 345 | | 327 | |
Total nonperforming assets | | $ | 5,567 | | $ | 9,120 | | $ | 4,539 | | $ | 4,436 | | $ | 5,722 | |
Past due 90 days or more and still accruing interest | | | | | | | | | | | |
Commercial | | $ | 41 | | $ | — | | $ | — | | $ | — | | $ | 1,842 | |
SBA | | 114 | | — | | — | | — | | 34 | |
Residential mortgage | | — | | 78 | | — | | — | | — | |
Consumer | | — | | — | | — | | — | | — | |
Total | | $ | 155 | | $ | 78 | | $ | — | | $ | — | | $ | 1,876 | |
Nonperforming loans to total loans | | 0.93 | % | 1.75 | % | 0.97 | % | 1.10 | % | 1.59 | % |
Nonperforming assets to total loans and OREO | | 0.94 | % | 1.80 | % | 1.01 | % | 1.19 | % | 1.68 | % |
Allowance for loan losses as a percentage of nonperforming loans | | 153.49 | % | 85.58 | % | 158.04 | % | 143.14 | % | 99.20 | % |
(1) SBA Loans Guaranteed | | $ | 714 | | $ | 2,953 | | $ | 758 | | $ | 1,240 | | $ | 1,904 | |
Nonperforming loans were $5.5 million at December 31, 2007, a $3.4 million decrease from $8.9 million at year-end 2006. During 2007, there was approximately $8.0 million in loans transferred into nonaccrual status, offset by $11.4 million in payoffs, charge-offs or principal pay downs. Included in nonperforming loans at December 31, 2007 are approximately $714 thousand of loans that are guaranteed by the SBA.
There were $155 thousand of loans past due 90 days or more and still accruing at December 31, 2007, compared to $78 thousand at December 31, 2006 and no such loans at December 31, 2005.
Other real estate owned (“OREO”) properties totaled $106 thousand at year-end 2007, a decrease of $105 thousand from $211 thousand at December 31, 2006.
Potential problem loans are those where information about possible credit problems of borrowers causes management to have doubts as to the ability of such borrowers to comply with loan repayment terms. These loans are not included in nonperforming loans as they continue to perform. Potential problem loans, which consist primarily of commercial and SBA products, were $2.6 million at December 31, 2007 and $4.3 million at December 31, 2006.
Allowance for Loan Losses and Unfunded Commitments
We maintain an allowance for loan losses at a level that the Company believes is sufficient to absorb probable and estimated credit losses in the loan portfolio as of the balance sheet date. While we make allocations to specific loans, the total reserve is available for all loan losses.
Management utilizes a standardized methodology to assess the adequacy of the allowance for loan losses. This process includes the allocation of specific and general reserves. Specific reserves are made to significant individual impaired loans and are determined in accordance with SFAS 114, Accounting by Creditors for Impairment of a Loan. We have defined impaired loans to include all nonaccrual loans. All other “non-impaired” loans are allocated a general reserve. This general reserve is set based upon the historical net charge-off rate adjusted for certain environmental factors such as: delinquency and impairment trends, charge-off and recovery trends, volume and loan term trends, risk and underwriting policy trends, staffing and experience changes, national
11
and local economic trends, industry conditions and credit concentration changes.
Additions to the allowance for loan losses are made by provisions charged to expense whereas the allowance is reduced by net charge-offs (i.e., loans judged to be not collectable are charged against the reserve, less any recoveries on such loans). Although management attempts to maintain the allowance at a level deemed adequate to provide for probable losses, future additions to the allowance may be necessary based upon certain factors including obtaining updated financial information about the borrower’s financial condition and changes in market conditions and underlying collateral values. In addition, various regulatory agencies periodically review the adequacy of the allowance for loan losses. These agencies have in the past and may in the future require the Company to make additional adjustments based on their judgments about information available to them at the time of their examination.
The allowance for loan losses amounted to $8.4 million at December 31, 2007, compared to $7.6 million at year-end 2006. The increase in the allowance for loan losses was due to the provision for loan losses of $1.6 million exceeding $791 thousand of net charge-offs. In addition, the increase in the allowance for loan losses was attributable to the specific and general reserve factors used to determine reserve levels on certain types of loans, the analysis of the estimated probable losses inherent in the loan portfolio based upon the review of particular loans, the credit worthiness of particular borrowers, and general economic conditions, offset by decreased levels of nonperforming loans.
The following is a summary of the allowance for loan losses for the past five years:
(In thousands) | | 2007 | | 2006 | | 2005 | | 2004 | | 2003 | |
Balance at beginning of year | | $ | 7,624 | | $ | 6,892 | | $ | 5,856 | | $ | 5,352 | | $ | 4,094 | |
Charge-offs: | | | | | | | | | | | |
Commercial | | 155 | | 298 | | 300 | | 601 | | 294 | |
SBA | | 770 | | 573 | | 301 | | 320 | | 486 | |
Residential mortgage | | — | | — | | 49 | | 18 | | — | |
Consumer | | 50 | | 62 | | 523 | | 29 | | 93 | |
Total charge-offs | | 975 | | 933 | | 1,173 | | 968 | | 873 | |
Recoveries: | | | | | | | | | | | |
Commercial | | 18 | | 75 | | 84 | | 181 | | 419 | |
SBA | | 147 | | 20 | | 204 | | 99 | | 78 | |
Residential mortgage | | — | | — | | — | | — | | — | |
Consumer | | 19 | | 20 | | 71 | | 17 | | 34 | |
Total recoveries | | 184 | | 115 | | 359 | | 297 | | 531 | |
Total net charge-offs | | $ | 791 | | $ | 818 | | $ | 814 | | $ | 671 | | $ | 342 | |
Provision charged to expense | | $ | 1,550 | | $ | 1,550 | | $ | 1,850 | | $ | 1,175 | | $ | 1,600 | |
Balance at end-of-year | | $ | 8,383 | | $ | 7,624 | | $ | 6,892 | | $ | 5,856 | | $ | 5,352 | |
Net charge-offs to average loans | | 0.14 | % | 0.17 | % | 0.20 | % | 0.19 | % | 0.11 | % |
Allowance to total loans | | 1.42 | % | 1.50 | % | 1.54 | % | 1.57 | % | 1.58 | % |
In addition to the allowance for loan losses, we maintain an allowance for unfunded loan commitments. This commitment reserve is reported on our balance sheet as an other liability. We determine this amount using estimates of future loan funding and losses related to those credit exposures. The commitment reserve totaled $102 thousand and $127 thousand at December 31, 2007 and 2006, respectively.
12
The following table sets forth, for each of the major lending categories, the amount of the allowance for loan losses allocated to each category and the percentage of total loans represented by such category, as of December 31st of each year. The allocated allowance is the total of identified specific and general reserves by loan category. The allocation is made for analytical purposes and is not necessarily indicative of the categories in which future losses may occur. The total allowance is available to absorb losses from any segment of the portfolio.
| | 2007 | | 2006 | | 2005 | | 2004 | | 2003 | |
| | | | % of | | | | % of | | | | % of | | | | % of | | | | % of | |
(In thousands) | | Amount | | Loans | | Amount | | Loans | | Amount | | Loans | | Amount | | Loans | | Amount | | Loans | |
Balance applicable to: | | | | | | | | | | | | | | | | | | | | | |
SBA | | $ | 2,188 | | 15.9 | % | $ | 2,066 | | 15.6 | % | $ | 1,712 | | 17.5 | % | $ | 1,724 | | 16.9 | % | $ | 1,296 | | 18.8 | % |
Commercial | | 5,115 | | 61.9 | % | 4,865 | | 61.5 | % | 4,417 | | 58.1 | % | 3,436 | | 55.6 | % | 3,526 | | 55.4 | % |
Residential mortgage | | 570 | | 12.5 | % | 305 | | 12.5 | % | 444 | | 13.8 | % | 375 | | 16.1 | % | 270 | | 15.1 | % |
Consumer | | 510 | | 9.7 | % | 388 | | 10.4 | % | 319 | | 10.6 | % | 321 | | 11.4 | % | 260 | | 10.7 | % |
Total | | $ | 8,383 | | 100.0 | % | $ | 7,624 | | 100.0 | % | $ | 6,892 | | 100.0 | % | $ | 5,856 | | 100.0 | % | $ | 5,352 | | 100.0 | % |
Deposits
Deposits, which include noninterest-bearing demand deposits and interest-bearing demand, savings and time deposits, are the primary source of the Company’s funds. The Company offers a variety of products designed to attract and retain customers, with primary focus on building and expanding relationships. For 2007, the Company realized continued growth in deposits. This growth was achieved through the emphasis on customer service, competitive rate structures and selective marketing through the Company’s branch network. The Company continues to focus on establishing a comprehensive relationship with business borrowers, seeking deposits as well as lending relationships.
The following are period-end deposit balances for each of the last three years.
At December 31, | | 2007 | | 2006 | | 2005 | |
(In thousands) | | Amount | | % | | Amount | | % | | Amount | | % | |
Interest-bearing demand deposits | | $ | 78,019 | | 13.0 | % | $ | 105,382 | | 18.6 | % | $ | 139,076 | | 26.7 | % |
Savings deposits | | 196,390 | | 32.7 | % | 205,919 | | 36.4 | % | 141,935 | | 27.2 | % |
Time deposits | | 256,259 | | 42.6 | % | 175,392 | | 30.9 | % | 161,302 | | 30.9 | % |
Noninterest-bearing demand deposits | | 70,600 | | 11.7 | % | 79,772 | | 14.1 | % | 79,547 | | 15.2 | % |
Total deposits | | $ | 601,268 | | 100.0 | % | $ | 566,465 | | 100.0 | % | $ | 521,860 | | 100.0 | % |
Total deposits increased $34.8 million to $601.3 million at December 31, 2007 from $566.5 million at December 31, 2006. The increase in deposits was the result of an $80.9 million increase in time deposits, partially offset by declines in interest-bearing demand deposits, demand deposits and savings deposits.
The mix of deposits shifted during 2007 as the concentration of demand deposits and interest-bearing demand deposits fell and the concentration of higher-cost savings and time deposits increased.
The average cost of interest-bearing deposits in 2007 was 4.01 percent compared to 3.54 percent for 2006. The increase in the cost of deposits can be attributed to the high cost of deposits in the New Jersey and Eastern Pennsylvania marketplaces, the lack of liquidity in these marketplaces, and the shift in the mix of deposits. The Company expects the trend of growth in the deposit base to continue in 2008.
13
The following are average deposits for each of the last three years.
| | 2007 | | 2006 | | 2005 | |
(In thousands) | | Amount | | % | | Amount | | % | | Amount | | % | |
Interest-bearing demand deposits | | $ | 85,750 | | 14.8 | % | $ | 117,730 | | 21.4 | % | $ | 150,420 | | 31.5 | % |
Savings deposits | | 204,214 | | 35.3 | % | 183,815 | | 33.5 | % | 130,911 | | 27.4 | % |
Time deposits | | 213,407 | | 36.8 | % | 169,572 | | 30.9 | % | 118,174 | | 24.7 | % |
Noninterest-bearing demand deposits | | 75,581 | | 13.1 | % | 77,747 | | 14.2 | % | 78,519 | | 16.4 | % |
Total deposits | | $ | 578,952 | | 100.0 | % | $ | 548,864 | | 100.0 | % | $ | 478,024 | | 100.0 | % |
Borrowed Funds and Subordinated Debentures
Borrowed funds consist primarily of fixed rate advances from the Federal Home Loan Bank (“FHLB”) of New York and repurchase agreements. These borrowings are used as a source of liquidity or to fund asset growth not supported by deposit generation. Residential mortgages and investment securities collateralize the borrowings from the FHLB, while investment securities are pledged against the repurchase agreements.
As of December 31, 2007, borrowed funds totaled $85.0 million, an increase of $30.0 million from the prior year-end, as available pricing presented a favorable alternative to the high cost of deposits in the New Jersey and Eastern Pennsylvania marketplaces. The change since December 31, 2006 was due to the addition of a $10.0 million FHLB advance in April 2007, a $10.0 million FHLB repo-advance in August 2007, and a $10.0 million FHLB repo-advance in December 2007.
Due to the current interest rate environment, the Company chose to redeem $9.0 million in subordinated debentures issued by Unity (NJ) Statutory Trust I on September 26, 2007, which were issued on September 26, 2002 at a floating rate of 3-month Libor plus 340 basis points.
As of December 31, 2007 and 2006, the Company was a party to the following transactions:
(In thousands) | | 2007 | | 2006 | |
FHLB Borrowings: | | | | | |
Overnight line of credit | | $ | 5,000 | | $ | 5,000 | |
Fixed rate advances | | 40,000 | | 30,000 | |
Repurchase agreements | | 30,000 | | 10,000 | |
Other repurchase agreements | | 10,000 | | 10,000 | |
Subordinated debentures | | 15,465 | | 24,744 | |
| | | | | | | |
At December 31, 2007, the Company had $11.3 million of additional availability at the FHLB. Pledging additional collateral in the form of 1-4 family residential mortgages or investment securities can increase the line with the FHLB. The maximum borrowing line available if additional collateral was pledged as of December 31, 2007 amounted to approximately $62.0 million.
For additional information see Note 10 to the Consolidated Financial Statements.
Market Risk
Based on the Company’s business, the two largest risks facing the Company are market risk and credit risk. Market risk, for the Company, is primarily limited to interest rate risk, which is the impact that changes in interest rates would have on future earnings. The Company’s Asset/Liability Committee (“ALCO”) manages this risk. The principal objectives of ALCO are to establish prudent risk management guidelines, evaluate and control the level of interest rate risk in balance sheet accounts, determine the level of appropriate risk given the business focus, operating environment, capital, and liquidity requirements, and actively manage risk within Board approved guidelines. ALCO reviews the maturities and repricing of loans, investments, deposits and borrowings, cash flow needs, current market conditions, and interest rate levels.
The Company uses various techniques to evaluate risk levels on both a short and long-term basis. One of the monitoring tools is the “gap” ratio. A gap ratio, as a percentage of assets, is calculated to determine the maturity and repricing mismatch between interest rate-sensitive assets and interest rate-sensitive liabilities. A gap is considered positive when the amount of interest rate-sensitive assets repricing exceeds the amount of interest rate-sensitive liabilities repricing in a designated time period. A positive gap should result in higher net interest income with rising interest rates, as the amount of the assets repricing exceed the amount of liabilities repricing. Conversely, a gap is considered negative when the amount of interest rate-sensitive liabilities exceeds interest rate-sensitive assets, and lower rates should result in higher net interest income.
Repricing of mortgage-related investments are shown by contractual amortization and estimated prepayments based on the most recent 3-month constant prepayment rate. Callable agency securities are shown based upon their option-adjusted spread modified duration date (“OAS”), rather than the next call date or maturity date. The OAS date considers the coupon on the security, the time to the next call date, the maturity date, market volatility and current rate levels. Fixed rate loans are allocated based on expected amortization.
14
The following table sets forth the gap ratio at December 31, 2007. Assumptions regarding the repricing characteristics of certain assets and liabilities are critical in determining the projected level of rate sensitivity. Certain savings and interest checking accounts are less sensitive to market interest rate changes than other interest-bearing sources of funds. Core deposits such as demand interest, savings and money market deposits are allocated based on their expected repricing in relation to changes in market interest rates.
(In thousands) | | Under six
months | | Six months
through
one year | | More than
one year
through
two years | | More than
two years
through
five years | | More than
five years
through
ten years | | More than
ten years
and not
repricing | | Total | |
Assets | | | | | | | | | | | | | | | |
Cash & due from banks | | $ | — | | $ | — | | $ | — | | $ | — | | $ | — | | $ | 14,336 | | $ | 14,336 | |
Federal funds sold | | 21,976 | | — | | — | | — | | — | | — | | 21,976 | |
Investment securities | | 16,568 | | 12,249 | | 14,952 | | 25,851 | | 20,237 | | 8,734 | | 98,591 | |
Loans | | 180,505 | | 34,587 | | 70,053 | | 212,620 | | 62,468 | | 29,899 | | 590,132 | |
Other assets | | — | | — | | — | | — | | — | | 27,161 | | 27,161 | |
Total Assets | | $ | 219,049 | | $ | 46,836 | | $ | 85,005 | | $ | 238,471 | | $ | 82,705 | | $ | 80,130 | | $ | 752,196 | |
Liabilities and Shareholders’ Equity | | | | | | | | | | | | | | | |
Noninterest-bearing demand deposits | | $ | — | | $ | — | | $ | — | | $ | — | | $ | — | | $ | 70,600 | | $ | 70,600 | |
Savings and interest–bearing demand deposits | | 177,944 | | 878 | | 6,769 | | 69,304 | | 19,514 | | — | | 274,409 | |
Time deposits | | 138,829 | | 60,466 | | 39,197 | | 17,416 | | 351 | | — | | 256,259 | |
Borrowed funds and subordinated debentures | | 20,465 | | — | | 10,000 | | 20,000 | | 50,000 | | — | | 100,465 | |
Other liabilities | | — | | — | | — | | — | | — | | 3,203 | | 3,203 | |
Shareholders’ equity | | — | | — | | — | | — | | — | | 47,260 | | 47,260 | |
Liabilities and Shareholders’ Equity | | $ | 337,238 | | $ | 61,344 | | $ | 55,966 | | $ | 106,720 | | $ | 69,865 | | $ | 121,063 | | $ | 752,196 | |
Interest Rate Swap | | $ | 10,000 | | — | | — | | $ | (10,000 | ) | — | | — | | — | |
Gap | | $ | (128,189 | ) | $ | (14,508 | ) | $ | 29,039 | | $ | 141,751 | | $ | 12,840 | | $ | (40,933 | ) | — | |
Cumulative Gap | | $ | (128,189 | ) | $ | (142,697 | ) | $ | (113,658 | ) | $ | 28,093 | | $ | 40,933 | | — | | — | |
Cumulative Gap to Total Assets | | (17.0 | )% | (19.0 | )% | (15.1 | )% | 3.7 | % | 5.4 | % | — | | — | |
At December 31, 2007, there was a six-month liability-sensitive gap of $118.2 million and a one-year liability-sensitive gap of $132.7 million, as compared to liability-sensitivity gaps of $124.4 million and $133.7 million at December 31, 2006. The six-month and one-year cumulative gap to total assets ratios were within the board-approved guidelines of +/- 20 percent.
Other models are also used in conjunction with the static gap table, which is not able to capture the risk of changing spread relationships over time, the effects of projected growth in the balance sheet or dynamic decisions such as the modification of investment maturities as a rate environment unfolds. For these reasons, a simulation model is used, where numerous interest rate scenarios and balance sheets are combined to produce a range of potential income results. Net interest income is managed within guideline ranges for interest rates rising or falling by 200 basis points. Results outside of guidelines require action by ALCO to correct the imbalance. Simulations are typically created over a 12-24 month time horizon. At December 31, 2007, these simulations show that with a 200 basis point immediate increase in interest rates, net interest income would decrease by approximately $1.1 million or 4.2 percent. An immediate decline of 200 basis points in interest rates would increase net interest income by approximately $1.2 million or 4.4 percent. These variances in net interest income are within the board-approved guidelines of +/- 7 percent.
Finally, to measure the impact of longer-term asset and liability mismatches beyond two years, the Company utilizes Modified Duration of Equity and Economic Value of Portfolio Equity (“EVPE”) models. The modified duration of equity measures the potential price risk of equity to changes in interest rates. A longer modified duration of equity indicates a greater degree of risk to rising interest rates. Because of balance sheet optionality, an EVPE analysis is also
15
used to dynamically model the present value of asset and liability cash flows, with rate shocks of 200 basis points. The economic value of equity is likely to be different as interest rates change. Like the simulation model, results falling outside prescribed ranges require action by ALCO. The Company’s variance in the economic value of equity with rate shocks of 200 basis points is a decline of 26.84 percent in a rising rate environment and an increase of 4.49 percent in a falling rate environment. The variance in the EVPE at December 31, 2007 is within board-approved guidelines of +/- 35 percent.
Financial Derivatives
In order to manage interest rate risk, the Company may enter into financial derivative contracts such as interest rate swaps. At December 31, 2007, the Company was a party to one interest rate swap transaction with the following characteristics:
· Pay fixed, receive variable – Libor,
· Notional/contract amount = $10 million,
· Fair value = ($23) thousand,
· Maturity date = 9/23/2011,
· Weighted average interest rate paid = 4.10%, and
· Weighted average interest rate received = 4.88%.
The Company was not a party to any financial derivative transactions at December 31, 2006.
For additional information see Note 12 to the Consolidated Financial Statements.
Operating, Investing and Financing
The Consolidated Statements of Cash Flows present the changes in cash from operating, investing and financing activities. At December 31, 2007, the balance of cash and cash equivalents was $36.3 million, a decrease of $19.1 million from December 31, 2006.
Net cash used in operating activities totaled $3.8 million at December 31, 2007, as compared to providing $7.6 million at December 31, 2006. The primary source of funds was net income from operations adjusted for: provision for loan losses, depreciation expenses, proceeds from SBA loans held for sale and mortgage loans held for sale, offset by originations of SBA and mortgage loans held for sale.
Net cash used in investing activities amounted to $66.9 million in 2007, increasing from a year ago. The cash used in investing activities was primarily a result of funding of the loan and securities portfolios, offset by sales, maturities and pay-downs in the investment portfolio.
Net cash provided by financing activities amounted to $51.6 million for 2007, compared to $74.1 million in 2006. The increase in cash provided by financing activities was due to growth in the Company’s deposit base and an increase in the Company’s borrowings.
Liquidity
The Company’s liquidity is a measure of its ability to fund loans, withdrawals or maturities of deposits and other cash outflows in a cost-effective manner.
Parent Company
Generally, the Parent Company’s cash is used for the payment of operating expenses and cash dividends. The principal sources of funds for the Parent Company are dividends paid by the Bank. The Parent Company only pays expenses that are specifically for the benefit of the Parent Company. Other than its investment in the Bank, Unity Statutory Trust II and Unity Statutory Trust III, the Parent Company does not actively engage in other transactions or business. The majority of expenses paid by the Parent Company are related to Unity Statutory Trust II and Unity Statutory Trust III.
At December 31, 2007, the Parent Company had $433 thousand in cash and $216 thousand in marketable securities, valued at fair market value compared to $6.9 million in cash and $270 thousand in marketable securities at December 31, 2006. The decrease in cash at the Parent Company was due primarily to the redemption of $9.0 million in subordinated debentures issued through its subsidiary Unity (NJ) Statutory Trust I, the repurchase of approximately 380 thousand shares of Unity Bancorp stock at a total cost of $3.9 million, and the quarterly payment of cash dividends.
Consolidated Bank
The principal sources of funds for the Bank are deposits, scheduled amortization and prepayments of loan and investment principal, sales and maturities of investment securities and funds provided by operations. While scheduled loan payments and maturing investments are relatively predictable sources of funds, deposit flows and loan prepayments are greatly influenced by general interest rates, economic conditions and competition.
Total FHLB borrowings amounted to $75.0 million and third party repurchase agreements totaled $10.0 million, as of December 31, 2007. At December 31, 2007, $11.3 million was available for additional borrowings from the FHLB. Pledging additional collateral in the form of 1-4 family residential mortgages or investment securities can increase the line with the FHLB. Additional sources of liquidity are the securities available for sale portfolio and SBA loans held for sale portfolio, which amounted to $64.9 million and $24.6 million respectively, at December 31, 2007.
16
As of December 31, 2007, deposits included $30.5 million of Government deposits, as compared to $40.1 million at year-end 2006. These deposits are generally short in duration and are very sensitive to price competition. The Company believes that the current level of these types of deposits is appropriate. Included in the portfolio were $23.3 million of deposits from three municipalities. The withdrawal of these deposits, in whole or in part, would not create a liquidity shortfall for the Company.
At December 31, 2007, the Bank had approximately $132.0 million of loan commitments, which will either expire or be funded, generally within one year. The Company believes it has the necessary liquidity to honor all commitments. Many of these commitments will expire and never be funded. In addition, approximately 25 percent of these commitments are for SBA Loans, which may be sold into the secondary market.
Off-Balance Sheet Arrangements and Contractual Obligations
The following table shows the amounts and expected maturities of off–balance sheet arrangements as of December 31, 2007. Further discussion of these commitments is included in Note 11 to the Consolidated Financial Statements.
(In thousands) | | One Year
or Less | | One to
Three
Years | | Three to
Five
Years | | Over Five
Years | | Total | |
Standby letters of credit | | $ | 994 | | $ | 2,951 | | $ | — | | $ | — | | $ | 3,945 | |
| | | | | | | | | | | | | | | | |
The following table shows the contractual obligations of the Company by expected payment period, as of December 31, 2007. Further discussion of these commitments is included in Notes 10-11 to the Consolidated Financial Statements.
(In thousands) | | One Year
or Less | | One to
Three
Years | | Three to
Five
Years | | Over Five
Years | | Total | |
Borrowed funds and subordinated debentures | | $ | 5,000 | | $ | 20,000 | | $ | — | | $ | 75,465 | | $ | 100,465 | |
Operating lease obligations | | 1,165 | | 577 | | 217 | | 160 | | 2,119 | |
Purchase obligations – Fiserv | | 1,397 | | 2,012 | | 1,051 | | — | | 4,460 | |
Total | | $ | 7,562 | | $ | 22,589 | | $ | 1,268 | | $ | 75,625 | | $ | 107,044 | |
Long-term debt obligations include fixed term borrowings from the Federal Home Loan Bank, repurchase agreements and subordinated debentures. The borrowings have defined terms and under certain circumstances are callable at the option of the lender.
Operating leases represent obligations entered into by the Company for the use of land, premise and equipment. The leases generally have escalation terms based upon certain defined indexes.
Purchase obligations represent legally binding and enforceable agreements to purchase goods and services from third parties and consist primarily of contractual obligations under data processing service agreements.
17
Capital
A significant measure of the strength of a financial institution is its capital base. Federal regulators have classified and defined capital into the following components: (1) tier 1 capital, which includes tangible shareholders’ equity for common stock, qualifying preferred stock and other qualifying hybrid instruments, and (2) tier 2 capital, which includes a portion of the allowance for loan losses, certain qualifying long-term debt and preferred stock which does not qualify for tier 1 capital. Minimum capital levels are regulated by risk-based capital adequacy guidelines, which require a bank to maintain certain capital as a percent of assets and certain off-balance sheet items adjusted for predefined credit risk factors (risk-adjusted assets). A bank is required to maintain, at a minimum, tier 1 capital as a percentage of risk-adjusted assets of 4.0 percent and combined tier 1 and tier 2 capital as a percentage of risk-adjusted assets of 8.0 percent.
The following table summarizes the Company’s and the Bank’s risk-based and leveraged capital ratios at December 31, 2007 and 2006, as well as the required minimum regulatory capital ratios.
Company | | Dec. 2007 | | Dec. 2006 | | Adequately
Capitalized
Requirements | | Well
Capitalized
Requirements | |
Leverage ratio | | 8.25 | % | 9.08 | % | 4.00 | % | N/A | |
Tier 1 risk-based capital ratio | | 9.81 | % | 10.80 | % | 4.00 | % | N/A | |
Total risk-based capital ratio | | 11.06 | % | 13.60 | % | 8.00 | % | N/A | |
Bank | | Dec. 2007 | | Dec. 2006 | | Adequately
Capitalized
Requirements | | Well
Capitalized
Requirements | |
Leverage ratio | | 7.06 | % | 7.20 | % | 4.00 | % | 5.00 | % |
Tier 1 risk-based capital ratio | | 8.39 | % | 8.55 | % | 4.00 | % | 6.00 | % |
Total risk-based capital ratio | | 11.00 | % | 12.38 | % | 8.00 | % | 10.00 | % |
At December 31, 2007, shareholders’ equity was $47.3 million, a $1.0 million increase from year-end 2006. The increase in shareholders’ equity was a result of $4.7 million in net income and $1.3 million from the exercise of stock options, partially offset by $1.4 million of common stock cash dividends and $3.9 million in Treasury stock purchased. The ratio of total equity to assets at December 31, 2007 and 2006 was 6.26 percent and 6.66 percent, respectively.
During 2006, the Company enhanced its regulatory capital by issuing $10.0 million of floating rate capital securities through its subsidiary Unity (NJ) Statutory Trust II and the issuance of $5 million in floating rate capital securities through its subsidiary Unity (NJ) Statutory Trust III. These securities qualify as Tier I Capital.
On October 21, 2002, the Company authorized the repurchase of up to 10 percent of its outstanding common stock. The amount and timing of purchases will be dependent on a number of factors, including the price and availability of the Company’s shares, general market conditions and competing alternate uses of funds. During 2007, the Company repurchased 380 thousand shares at an average price of $10.35. As of December 31, 2007 the Company had repurchased a total of 528 thousand shares of which 125 thousand shares have been retired, leaving 127 thousand shares remaining to be repurchased under the plan.
Forward-Looking Statements
This report contains certain forward-looking statements, either expressed or implied, which are provided to assist the reader in understanding anticipated future financial performance. These statements involve certain risks, uncertainties, estimates and assumptions by management. Factors that may cause actual results to differ from those results expressed or implied, include, but are not limited to, the overall economy and the interest rate environment; the ability of the customers to repay their obligations; the adequacy of the allowance for loan losses; competition; significant changes in tax, accounting or regulatory practices and requirements, and technological changes. Although management has taken certain steps to mitigate the negative effect of the aforementioned items, significant unfavorable changes could severely impact the assumptions used and have an adverse effect on future profitability.
18
MANAGEMENT’S REPORT ON INTERNAL CONTROL OVER FINANCIAL REPORTING
Management is responsible for establishing and maintaining adequate internal control over financial reporting, as such term is defined in Exchange Act Rule 13a-15(f) under the Securities Exchange Act of 1934. Under the supervision and with the participation of the President and Chief Executive Officer and the Chief Financial Officer, we conducted an evaluation of the effectiveness of our control over financial reporting based on the framework in Internal Control-Integrated Framework issued by the Committee of Sponsoring Organizations of the Treadway Commission (“COSO”). Based on our evaluation under the framework, management has concluded that our internal control over financial reporting was effective as of December 31, 2007.
Management’s assessment of the effectiveness of our internal control over financial reporting as of December 31, 2007 has not been attested to by McGladrey & Pullen, LLP, the independent registered public accounting firm that audited the Company’s consolidated financial statements for the year ended December 31, 2007 as stated in their report which is included herein.

James A. Hughes
President and Chief Executive Officer

Alan J. Bedner
Executive Vice President and Chief Financial Officer
19
REPORT OF INDEPENDENT REGISTERED PUBLIC ACCOUNTING FIRM
To the Board of Directors and Stockholders
Unity Bancorp, Inc.
We have audited the consolidated balance sheet of Unity Bancorp, Inc. and subsidiaries (“the Company”) as of December 31, 2007, and the related consolidated statements of income, changes in shareholders’ equity and cash flows for the year ended December 31, 2007. These consolidated financial statements are the responsibility of the Company’s management. Our responsibility is to express an opinion on these financial statements based on our audit. The consolidated financial statements of the Company for the year ended December 31, 2006 and 2005 were audited by other auditors whose reports, dated March 15, 2007 and February 17, 2006, respectively, expressed an unqualified opinion on those statements.
We conducted our audit in accordance with the standards of the Public Company Accounting Oversight Board (United States). Those standards require that we plan and perform the audit to obtain reasonable assurance about whether the financial statements are free of material misstatement. An audit includes examining, on a test basis, evidence supporting the amounts and disclosures in the financial statements. An audit also includes assessing the accounting principles used and significant estimates made by management, as well as evaluating the overall financial statement presentation. We believe that our audit provides a reasonable basis for our opinion.
In our opinion, the consolidated financial statements referred to above present fairly, in all material respects, the financial position of Unity Bancorp, Inc. and subsidiaries as of December 31, 2007, and the results of their operations and their cash flows for the year ended December 31, 2007, in conformity with U.S. generally accepted accounting principles.
We were not engaged to examine management’s assertion about the effectiveness of Unity Bancorp, Inc. and subsidiaries’ internal control over financial reporting as of December 31, 2007 included in the accompanying “Management’s Report on Internal Control Over Financial Reporting” and, accordingly, we do not express an opinion thereon.

McGladrey & Pullen,LLP
Blue Bell, Pennsylvania
March 20, 2008
20
REPORT OF INDEPENDENT REGISTERED PUBLIC ACCOUNTING FIRM
To the Shareholders and Board of Directors of
Unity Bancorp, Inc.:
We have audited the accompanying consolidated balance sheet of Unity Bancorp, Inc. and subsidiaries (the Company) as of December 31, 2006, and the related consolidated statements of income, changes in shareholders’ equity, and cash flows for each of the years in the two-year period ended December 31, 2006. These consolidated financial statements are the responsibility of the Company’s management. Our responsibility is to express an opinion on these consolidated financial statements based on our audits.
We conducted our audits in accordance with the standards of the Public Company Accounting Oversight Board (United States). Those standards require that we plan and perform the audit to obtain reasonable assurance about whether the financial statements are free of material misstatement. An audit includes examining, on a test basis, evidence supporting the amounts and disclosures in the financial statements. An audit also includes assessing the accounting principles used and significant estimates made by management, as well as evaluating the overall financial statement presentation. We believe that our audits provide a reasonable basis for our opinion.
In our opinion, the consolidated financial statements referred to above present fairly, in all material respects, the financial position of Unity Bancorp, Inc. and subsidiaries as of December 31, 2006, and the results of their operations and their cash flows for each of the years in the two-year period ended December 31, 2006, in conformity with U.S. generally accepted accounting principles.
As discussed in Note 18 to the consolidated financial statements, effective January 1, 2006, the Company adopted SEC Staff Accounting Bulletin No. 108, “Considering the Effects of Prior Year Misstatements when Quantifying Misstatements in Current Year Financial Statements.”
KPMG LLP
Short Hills, New Jersey
March 15, 2007
21
CONSOLIDATED BALANCE SHEETS
(In thousands)
December 31, | | 2007 | | 2006 | |
Assets | | | | | |
Cash and due from banks | | $ | 14,336 | | $ | 14,727 | |
Federal funds sold and interest-bearing deposits | | 21,976 | | 40,709 | |
Securities: | | | | | |
Available for sale | | 64,855 | | 62,642 | |
Held to maturity (fair value of $33,639 and $42,449 in 2007 and 2006, respectively) | | 33,736 | | 42,815 | |
Total securities | | 98,591 | | 105,457 | |
| | | | | |
Loans: | | | | | |
SBA held for sale | | 24,640 | | 12,273 | |
SBA held to maturity | | 68,875 | | 66,802 | |
Commercial | | 365,786 | | 312,195 | |
Residential mortgage | | 73,697 | | 63,493 | |
Consumer | | 57,134 | | 52,927 | |
Total loans | | 590,132 | | 507,690 | |
Less: Allowance for loan losses | | 8,383 | | 7,624 | |
Net loans | | 581,749 | | 500,066 | |
| | | | | |
Premises and equipment, net | | 12,102 | | 11,610 | |
Bank owned life insurance | | 5,570 | | 5,372 | |
Accrued interest receivable | | 3,994 | | 3,926 | |
Loan servicing asset | | 2,056 | | 2,294 | |
Goodwill and other intangibles | | 1,588 | | 1,603 | |
Other assets | | 10,234 | | 8,342 | |
Total Assets | | $ | 752,196 | | $ | 694,106 | |
| | | | | | | |
Liabilities and Shareholders’ Equity | | | | | |
Liabilities | | | | | |
Deposits: | | | | | |
Noninterest-bearing demand deposits | | $ | 70,600 | | $ | 79,772 | |
Interest-bearing demand deposits | | 78,019 | | 105,382 | |
Savings deposits | | 196,390 | | 205,919 | |
Time deposits, under $100,000 | | 168,244 | | 111,070 | |
Time deposits, $100,000 and over | | 88,015 | | 64,322 | |
Total deposits | | 601,268 | | 566,465 | |
| | | | | |
Borrowed funds | | 85,000 | | 55,000 | |
Subordinated debentures | | 15,465 | | 24,744 | |
Accrued interest payable | | 635 | | 475 | |
Accrued expenses and other liabilities | | 2,568 | | 1,194 | |
Total Liabilities | | 704,936 | | 647,878 | |
Commitments and contingencies (Note 11) | | — | | — | |
Shareholders’ equity: | | | | | |
Common stock, no par value, 12,500 shares authorized, 7,131 shares issued and 6,727 outstanding in 2007; 6,973 shares issued and 6,949 outstanding in 2006 | | 49,447 | | 44,343 | |
Retained earnings | | 2,472 | | 2,951 | |
Treasury stock at cost (404 shares in 2007 and 24 shares in 2006) | | (4,169 | ) | (242 | ) |
Accumulated other comprehensive loss | | (490 | ) | (824 | ) |
Total Shareholders’ Equity | | 47,260 | | 46,228 | |
Total Liabilities and Shareholders’ Equity | | $ | 752,196 | | $ | 694,106 | |
The accompanying notes to the consolidated financial statements are an integral part of these statements.
22
CONSOLIDATED STATEMENTS OF INCOME
(In thousands, except per share amounts)
For the years ended December 31, | | 2007 | | 2006 | | 2005 | |
Interest income | | | | | | | |
Federal funds sold and interest on deposits | | $ | 1,068 | | $ | 1,042 | | $ | 572 | |
Securities: | | | | | | | |
Available for sale | | 3,425 | | 3,051 | | 3,100 | |
Held to maturity | | 1,913 | | 2,042 | | 1,477 | |
Total securities | | 5,338 | | 5,093 | | 4,577 | |
Loans: | | | | | | | |
SBA loans | | 9,039 | | 8,615 | | 6,558 | |
Commercial loans | | 25,738 | | 21,914 | | 16,164 | |
Residential mortgage loans | | 3,995 | | 3,305 | | 3,318 | |
Consumer loans | | 3,722 | | 3,208 | | 2,648 | |
Total loan interest income | | 42,494 | | 37,042 | | 28,688 | |
Total interest income | | 48,900 | | 43,177 | | 33,837 | |
Interest expense | | | | | | | |
Interest-bearing demand deposits | | 1,928 | | 2,648 | | 2,605 | |
Savings deposits | | 8,064 | | 6,948 | | 3,164 | |
Time deposits | | 10,206 | | 7,101 | | 3,820 | |
Borrowed funds and subordinated debentures | | 4,276 | | 2,735 | | 2,014 | |
Total interest expense | | 24,474 | | 19,432 | | 11,603 | |
Net interest income | | 24,426 | | 23,745 | | 22,234 | |
Provision for loan losses | | 1,550 | | 1,550 | | 1,850 | |
Net interest income after provision for loan losses | | 22,876 | | 22,195 | | 20,384 | |
Noninterest Income | | | | | | | |
Service charges on deposit accounts | | 1,383 | | 1,602 | | 1,766 | |
Service and loan fee income | | 1,607 | | 1,637 | | 2,111 | |
Gain on sale of SBA loans held for sale, net | | 2,399 | | 2,972 | | 2,956 | |
Gain on sale of mortgage loans | | 52 | | 363 | | 382 | |
Gain on sale of other loans | | — | | 82 | | — | |
Bank owned life insurance | | 198 | | 187 | | 185 | |
Net security (losses) gains | | (571 | ) | 69 | | 69 | |
Other income | | 872 | | 726 | | 721 | |
Total noninterest income | | 5,940 | | 7,638 | | 8,190 | |
Noninterest expense | | | | | | | |
Compensation and benefits | | 11,446 | | 11,028 | | 9,639 | |
Occupancy | | 2,777 | | 2,580 | | 2,256 | |
Processing and communications | | 2,433 | | 2,220 | | 2,010 | |
Furniture and equipment | | 1,675 | | 1,538 | | 1,350 | |
Professional services | | 598 | | 636 | | 547 | |
Loan servicing | | 604 | | 542 | | 482 | |
Advertising | | 457 | | 575 | | 697 | |
Deposit insurance | | 67 | | 67 | | 61 | |
Other expenses | | 2,056 | | 1,859 | | 1,634 | |
Total noninterest expense | | 22,113 | | 21,045 | | 18,676 | |
Income before provision for income taxes | | 6,703 | | 8,788 | | 9,898 | |
Provision for income taxes | | 1,978 | | 2,943 | | 3,688 | |
Net income | | $ | 4,725 | | $ | 5,845 | | $ | 6,210 | |
Net income per share – | Basic | | $ | 0.68 | | $ | 0.85 | | $ | 0.92 | |
| Diluted | | $ | 0.66 | | $ | 0.81 | | $ | 0.87 | |
Weighted average common shares outstanding – | Basic | | 6,900 | | 6,912 | | 6,748 | |
| Diluted | | 7,169 | | 7,257 | | 7,099 | |
| | | | | | | | | | | | |
The accompanying notes to the consolidated financial statements are an integral part of these statements.
23
CONSOLIDATED STATEMENTS OF CHANGES IN SHAREHOLDERS’ EQUITY
(In thousands)
| | Common
Shares | | Common
Stock | | Retained
Earnings | | Treasury
Stock | | Accumulated
Other
Comprehensive
Loss | | Total
Shareholders’
Equity | |
Balance, December 31, 2004 | | 6,689 | | $ | 34,025 | | $ | 2,327 | | $ | — | | $ | (484) | | $ | 35,868 | |
Comprehensive income: | | | | | | | | | | | | | |
Net Income | | | | | | 6,210 | | | | | | 6,210 | |
Net unrealized holding loss on securities | | | | | | | | | | (665 | ) | (665 | ) |
Total comprehensive income | | | | | | | | | | | | 5,545 | |
Dividends on common stock ($0.17 per share) | | | | | | (1,155 | ) | | | | | (1,155 | ) |
5% Stock Dividend, including cash-in-lieu of fractional shares | | | | 3,481 | | (3,485 | ) | | | | | (4 | ) |
Common stock purchased | | (24 | ) | | | | | (242 | ) | | | (242 | ) |
Issuance of common stock: | | | | | | | | | | | | | |
Employee benefit plans | | 198 | | 917 | | | | | | | | 917 | |
Balance, December 31, 2005 | | 6,863 | | $ | 38,423 | | $ | 3,897 | | $ | (242 | ) | $ | (1,149 | ) | $ | 40,929 | |
Cumulative effect of adjustments resulting from the adoption of SAB No. 108, net of tax | | | | | | (492 | ) | | | | | (492 | ) |
Adjusted Balance at December 31, 2005 | | 6,863 | | $ | 38,423 | | $ | 3,405 | | $ | (242 | ) | $ | (1,149 | ) | $ | 40,437 | |
Comprehensive income: | | | | | | | | | | | | | |
Net Income | | | | | | 5,845 | | | | | | 5,845 | |
Net unrealized security gains | | | | | | | | | | 325 | | 325 | |
Total comprehensive income | | | | | | | | | | | | 6,170 | |
Dividends on common stock ($0.19 per share) | | | | | | (1,307 | ) | | | | | (1,307 | ) |
5% Stock Dividend, including cash-in-lieu of fractional shares | | | | 4,987 | | (4,992 | ) | | | | | (5 | ) |
Issuance of common stock: | | | | | | | | | | | | | |
Employee benefit plans | | 86 | | 933 | | | | | | | | 933 | |
Balance, December 31, 2006 | | 6,949 | | $ | 44,343 | | $ | 2,951 | | $ | (242 | ) | $ | (824 | ) | $ | 46,228 | |
Comprehensive income: | | | | | | | | | | | | | |
Net Income | | | | | | 4,725 | | | | | | 4,725 | |
Net unrealized securities gains | | | | | | | | | | 348 | | 348 | |
Net unrealized loss on cash flow hedge derivative | | | | | | | | | | (14 | ) | (14 | ) |
Total comprehensive income | | | | | | | | | | | | 5,059 | |
Dividends on common stock ($.20 per share) | | | | | | (1,381 | ) | | | | | (1,381 | ) |
5% Stock Dividend, including cash-in-lieu of fractional shares | | | | 3,820 | | (3,823 | ) | | | | | (3 | ) |
Common stock purchased | | (380 | ) | | | | | (3,927 | ) | | | (3,927 | ) |
Issuance of common stock: | | | | | | | | | | | | | |
Employee benefit plans | | 158 | | 1,284 | | | | | | | | 1,284 | |
Balance, December 31, 2007 | | 6,727 | | $ | 49,447 | | $ | 2,472 | | $ | (4,169 | ) | $ | (490 | ) | $ | 47,260 | |
The accompanying notes to the consolidated financial statements are an integral part of these statements.
24
CONSOLIDATED STATEMENTS OF CASH FLOWS
(In thousands)
For the years ended December 31, | | 2007 | | 2006 | | 2005 | |
| | | | | | | |
Operating activities: | | | | | | | |
Net income | | $ | 4,725 | | $ | 5,845 | | $ | 6,210 | |
Adjustments to reconcile net income to net cash (used in) provided by operating activities | | | | | | | |
Provision for loan losses | | 1,550 | | 1,550 | | 1,850 | |
Depreciation and amortization | | 1,076 | | 835 | | 1,033 | |
Deferred income tax benefit | | (693 | ) | (541 | ) | (16 | ) |
Net security gains | | (36 | ) | (69 | ) | (69 | ) |
Gain on sale of SBA loans held for sale, net | | (2,399 | ) | (2,972 | ) | (2,956 | ) |
Gain on sale of Mortgage loans | | (52 | ) | (363 | ) | (382 | ) |
Gain on sale of other loans | | — | | (82 | ) | — | |
Origination of Mortgage loans held for sale | | (2,963 | ) | (20,897 | ) | (25,238 | ) |
Origination of SBA loans held for sale | | (53,948 | ) | (39,483 | ) | (43,884 | ) |
Proceeds from the sale of Mortgage loans held for sale, net | | 3,016 | | 21,260 | | 25,620 | |
Proceeds from the sale of SBA loans held for sale, net | | 43,980 | | 44,183 | | 40,413 | |
Net change in other assets and liabilities | | 1,932 | | (1,689 | ) | (168 | ) |
Net cash (used in) provided by operating activities | | (3,812 | ) | 7,577 | | 2,413 | |
Investing activities: | | | | | | | |
Purchases of securities held to maturity | | — | | (8,780 | ) | (25,434 | ) |
Purchases of securities available for sale | | (18,630 | ) | (13,628 | ) | (7,134 | ) |
Purchases of FHLB stock, at cost | | (1,442 | ) | (782 | ) | (935 | ) |
Maturities and principal payments on securities held to maturity | | 9,034 | | 6,603 | | 8,155 | |
Maturities and principal payments on securities available for sale | | 11,032 | | 14,695 | | 14,014 | |
Proceeds from sale of securities available for sale | | 5,346 | | 251 | | 5,362 | |
Purchases of loans | | — | | (8,026 | ) | — | |
Net cash received from branch acquisition | | — | | — | | 4,379 | |
Proceeds from the sale of other real estate owned | | 645 | | 369 | | 345 | |
Net increase in loans | | (71,328 | ) | (53,648 | ) | (54,444 | ) |
Purchases of premises and equipment | | (1,587 | ) | (2,049 | ) | (2,819 | ) |
Net cash used in investing activities | | (66,930 | ) | (64,995 | ) | (58,511 | ) |
Financing activities: | | | | | | | |
Net increase in deposits | | 34,803 | | 44,605 | | 66,919 | |
Proceeds from new borrowings | | 40,000 | | 25,000 | | 10,000 | |
Repayments of borrowings | | (10,000 | ) | (10,000 | ) | (5,000 | ) |
Issuance of Trust Preferred Securities | | — | | 15,000 | | — | |
Redemption of Trust Preferred Securities | | (9,000 | ) | — | | — | |
Proceeds from the issuance of common stock | | 1,119 | | 781 | | 853 | |
Purchase of common stock | | (3,927 | ) | — | | (242 | ) |
Cash dividends paid on common stock | | (1,377 | ) | (1,291 | ) | (1,079 | ) |
Net cash provided by financing activities | | 51,618 | | 74,095 | | 71,451 | |
(Decrease) increase in cash and cash equivalents | | (19,124 | ) | 16,677 | | 15,353 | |
Cash and cash equivalents at beginning of year | | 55,436 | | 38,759 | | 23,406 | |
Cash and cash equivalents at end-of-year | | $ | 36,312 | | $ | 55,436 | | $ | 38,759 | |
| | | | | | | |
Supplemental disclosures: | | | | | | | |
Cash: | | | | | | | |
Interest paid | | $ | 24,314 | | $ | 19,231 | | $ | 11,505 | |
Income taxes paid | | 3,358 | | 4,459 | | 2,671 | |
Noncash investing activities: | | | | | | | |
Transfer of loans to other real estate owned | | 540 | | 402 | | 178 | |
Transfer of loans from held to maturity to available for sale | | — | | 7,219 | | — | |
The accompanying notes to the consolidated financial statements are an integral part of these statements.
25
NOTES TO CONSOLIDATED FINANCIAL STATEMENTS
1. Summary of Significant Accounting Policies
Overview
The accompanying consolidated financial statements include the accounts of Unity Bancorp, Inc. (the “Parent Company”) and its wholly-owned subsidiary, Unity Bank (or when consolidated with the Parent Company, the “Company”). All significant intercompany balances and transactions have been eliminated in consolidation.
Unity Bancorp, Inc. is a bank holding company incorporated in New Jersey and registered under the Bank Holding Company Act of 1956, as amended. Its wholly- owned subsidiary, Unity Bank (the “Bank”, or when consolidated with the Parent Company, the “Company”) is chartered by the New Jersey Department of Banking and Insurance. The Bank provides a full range of commercial and retail banking services through 17 branch offices located in Hunterdon, Middlesex, Somerset, Union and Warren counties in New Jersey and Northampton County in Pennsylvania. These services include the acceptance of demand, savings, and time deposits and the extension of consumer, real estate, Small Business Administration (“SBA”) and other commercial credits. Unity Investment Services, Inc., a wholly-owned subsidiary of the Bank, is used to hold part of the Bank’s investment portfolio.
The Company has two statutory trust subsidiaries that are wholly-owned by Unity Bancorp, Inc.
See details in Note 10 to the Consolidated Financial Statements.
Use of Estimates in the Preparation of Financial Statements
The preparation of financial statements in conformity with U.S. generally accepted accounting principles requires management to make estimates and assumptions that affect the reported amounts of assets and liabilities and disclosure of contingent assets and liabilities at the date of the financial statements and the reported amounts of revenues and expenses during the reporting period. Amounts requiring the use of significant estimates include the allowance for loan losses, valuation of deferred tax assets, the carrying value of loans held for sale and other real estate owned and the fair value disclosures of financial instruments. Actual results could differ from those estimates.
Reclassifications
Certain reclassifications have been made to prior years to conform with the current year presentation.
Cash and Cash Equivalents
Cash and cash equivalents include cash on hand, amounts due from banks, federal funds sold, and interest-bearing deposits.
Securities
The Company classifies its securities into two categories, held to maturity and available for sale. Securities are classified as securities held to maturity based on management’s intent and ability to hold them to maturity. Such securities are stated at cost, adjusted for unamortized purchase premiums and discounts on the level yield method. Securities not classified as securities held to maturity are classified as securities available for sale and are stated at fair value. Unrealized gains and losses on securities available for sale are excluded from results of operations and are reported as a separate component of shareholders’ equity, net of taxes. Securities classified as available for sale include securities that may be sold in response to changes in interest rates, changes in prepayment risks or for asset/liability management purposes. The cost of securities sold is determined on a specific identification basis. Gains and losses on sales of securities are recognized in the statements of income on the date of sale. Management evaluates securities for other-than-temporary impairment at least on a quarterly basis, and more frequently when economic or market concern warrants such evaluation.
Federal Home Loan Bank Stock
Federal law requires a member institution of the Federal Home Loan Bank (“FHLB”) system to hold stock of its district FHLB according to a predetermined formula. The stock is carried at cost. As of December 31, 2007 and 2006, the Company held $4.3 million and $2.9 million in FHLB stock, respectively.
Loans Held To Maturity and Loans Held For Sale
Loans held to maturity are stated at the unpaid principal balance, net of unearned discounts and net of deferred loan origination fees and costs. Loan origination fees, net of direct loan origination costs, are deferred and are recognized over the estimated life of the related loans as an adjustment to the loan yield utilizing the level yield method.
Interest is credited to operations primarily based upon the principal amount outstanding. When management believes there is sufficient doubt as to the ultimate collectibility of interest on any loan, interest accruals are discontinued and all past due interest, previously recognized as income, is reversed and charged against current period earnings. Payments received on nonaccrual loans are applied as principal. Loans are returned to an accrual status when collectibility is reasonably assured and when the loan is brought current as to principal and interest.
Loans and leases are reported as past due when either interest or principal is unpaid in the following circumstances: fixed payment loans when the borrower is in arrears for two or more monthly payments; open end credit for two or more billing cycles; and single payment notes if interest or principal remains unpaid for 30 days or more.
Loans are charged off when collection is sufficiently questionable and when the Bank can no longer justify maintaining the loan as an asset on the balance sheet. Loans qualify for charge off when, after thorough analysis, all possible sources of repayment are insufficient. These include: 1) potential future cash flow, 2) value of collateral, and/or 3) strength of co-makers and guarantors. All unsecured loans are charged off upon the establishment
26
of the loan’s nonaccrual status. Additionally, all loans classified as a loss or that portion of the loan classified as a loss, are charged off. All loan charge-offs are approved by the Board of Directors.
Nonperforming loans consist of loans that are not accruing interest (nonaccrual loans) as a result of principal or interest being in default for a period of 90 days or more or when the collectibility of principal and interest according to the contractual terms is in doubt. When a loan is classified as nonaccrual, interest accruals discontinue and all past due interest previously recognized as income is reversed and charged against current period income. Generally, until the loan becomes current, any payments received from the borrower are applied to outstanding principal until such time as management determines that the financial condition of the borrower and other factors merit recognition of a portion of such payments as interest income.
The Company evaluates its loans for impairment. A loan is considered impaired when, based on current information and events, it is probable that the Company will be unable to collect all amounts due according to the contractual terms of the loan agreement. The Company has defined impaired loans to be all nonaccrual loans. Impairment of a loan is measured based on the present value of expected future cash flows, net of estimated costs to sell, discounted at the loan’s effective interest rate. Impairment can also be measured based on a loan’s observable market price or the fair value of collateral, net of estimated costs to sell, if the loan is collateral dependent. If the measure of the impaired loan is less than the recorded investment in the loan, the Company establishes a valuation allowance, or adjusts existing valuation allowances, with a corresponding charge or credit to the provision for loan losses.
Loans held for sale are SBA loans and are reflected at the lower of aggregate cost or market value.
The Company originates loans to customers under an SBA program that generally provides for SBA guarantees up to 85 percent of each loan. The Company generally sells the guaranteed portion of each loan to a third party and retains the servicing. The premium received on the sale of the guaranteed portion of SBA loans and the present value of future cash flows of the servicing asset are recognized in income. The unguaranteed portion is generally held in the portfolio. During the third quarter of 2007, the Company announced its strategy to retain more SBA loans in its portfolio due to lower premiums on sales.
Serviced loans sold to others are not included in the accompanying consolidated balance sheets. Income and fees collected for loan servicing are credited to noninterest income when earned, net of amortization on the related servicing asset.
Transfers of Financial Assets
Transfers of financial assets are accounted for as sales, when control over the assets has been surrendered. Control over transferred assets is deemed to be surrendered when (1) the assets have been isolated from the Company, (2) the transferee obtains the right (free of conditions that constrain it from taking advantage of that right) to pledge or exchange the transferred assets, and (3) the Company does not maintain effective control over the transferred assets through an agreement to repurchase them before their maturity.
Allowance for Loan Losses
The allowance for loan losses is maintained at a level management considers adequate to provide for probable loan losses as of the balance sheet date. The allowance is increased by provisions charged to expense and is reduced by net charge-offs. The level of the allowance is based on management’s evaluation of probable losses in the loan portfolio, after consideration of prevailing economic conditions in the Company’s market area. Credit reviews of the loan portfolio, designed to identify potential charges to the allowance, are made during the year by management and a loan review consultant. A risk rating system, consisting of multiple grading categories, is utilized as an analytical tool to assess risk and the appropriate level of loss reserves. Along with the risk system, management further evaluates risk characteristics of the loan portfolio under current economic conditions and considers such factors as the financial condition of the borrowers, past and expected loan loss experience, and other factors management feels deserve recognition in establishing an adequate reserve. This risk assessment process is performed at least quarterly, and, as adjustments become necessary, they are realized in the periods in which they become known. Although management attempts to maintain the allowance at a level deemed adequate to provide for probable losses, future additions to the allowance may be necessary based upon certain factors including changes in market conditions and underlying collateral values. In addition, various regulatory agencies periodically review the adequacy of the Company’s allowance for loan losses. These agencies may require the Company to make additional provisions based on their judgments about information available to them at the time of their examination.
Allowance for Unfunded Loan Commitments
The Company maintains an allowance for unfunded loan commitments that is maintained at a level that management believes is adequate to absorb estimated probable losses. Adjustments to the allowance are made through other expense and applied to the allowance which is maintained in other liabilities.
Premises and Equipment
Land is carried at cost. Buildings and equipment are stated at cost less accumulated depreciation. Depreciation is computed on the straight-line method over the estimated useful lives of the assets, not to exceed 30 years.
Other Real Estate Owned
Other real estate owned is recorded at the fair value at the date of acquisition, with a charge to the allowance for loan losses for any excess over fair value. Subsequently, other real estate owned is carried at the lower of cost or fair value, as determined by current appraisals, less estimated selling costs. Certain costs incurred in preparing properties
27
for sale are capitalized to the extent that the appraisal amount exceeds the carry value, and expenses of holding foreclosed properties are charged to operations as incurred.
Income Taxes
The Company accounts for income taxes according to the asset and liability method. Under this method, deferred tax assets and liabilities are recognized for the future tax consequences attributable to differences between the financial statement carrying amounts of existing assets and liabilities and their respective tax basis. Deferred tax assets and liabilities are measured using the enacted tax rates applicable to taxable income for the years in which those temporary differences are expected to be recovered or settled. The effect on deferred tax assets and liabilities of a change in tax rates is recognized in income in the period that includes the enactment date. Valuation reserves are established against certain deferred tax assets when it is more likely than not that the deferred tax assets will not be realized. Increases or decreases in the valuation reserve are charged or credited to the income tax provision.
When tax returns are filed, it is highly certain that some positions taken would be sustained upon examination by the taxing authorities, while others are subject to uncertainty about the merits of the position taken or the amount of the position that ultimately would be sustained. The benefit of a tax position is recognized in the financial statements in the period during which, based on all available evidence, management believes it is more likely that the position will be sustained upon examination, including the resolution of appeals or litigation processes, if any. The evaluation of a tax position taken is considered by itself and not offset or aggregated with other positions. Tax positions that meet the more likely recognition threshold are measured as the largest amount of tax benefit that is more than 50 percent likely of being realized upon settlement with the applicable taxing authority. The portion of benefits associated with tax positions taken that exceeds the amount measured as described above is reflected as a liability for unrecognized tax benefits in the accompanying balance sheet along with any associated interest and penalties that would be payable to the taxing authorities upon examination.
Interest and penalties associated with unrecognized tax benefits are recognized in income tax expense on the income statement.
Income Per Share
Basic net income per share is computed by dividing the net income for the period by the weighted average number of common shares outstanding for the period. Diluted net income per share is computed by dividing net income for the period by the weighted average number of common shares outstanding for the period presented adjusted for the effect of the stock options, under the treasury stock method. The amounts reported reflect the impact of the 5 percent stock distribution paid on June 29, 2007. See Note 17 for further detail on Income per Common Share.
Other Comprehensive Income
Other comprehensive income consists of the change in unrealized (loss) gain on securities available for sale and derivatives designated as cash flow hedges that were reported as a component of shareholders’ equity, net of tax. For additional information see Note 23.
Derivative Instruments and Hedging Activities
The Company uses derivative instruments, such as interest rate swaps, to manage our interest rate risk. The Company recognizes all derivative instruments at fair value as either assets or liabilities in other assets or other liabilities. The accounting for changes in the fair value of a derivative instrument depends on whether it has been designated and qualifies as part of a hedging relationship. For derivatives not designated as an accounting hedge, the gain or loss is recognized in trading noninterest income.
For those derivative instruments that are designated and qualify as hedging instruments, the Company must designate the hedging instrument, based on the exposure being hedged, as a fair value hedge, a cash flow hedge or a hedge of a net investment in a foreign operation. The Company does not have any fair value hedges or hedges of foreign operations.
The Company formally documents the relationship between the hedging instruments and hedged item, as well as the risk management objective and strategy before undertaking a hedge. For hedging relationships in which effectiveness is measured, the Company formally assesses, both at inception and on an ongoing basis, if the derivatives are highly effective in offsetting changes in fair values or cash flows of the hedged item. If it is determined that the derivative instrument is not highly effective as a hedge, hedge accounting is discontinued.
For derivatives that are designated as cash flow hedges, the effective portion of the gain or loss on derivatives is reported as a component of other comprehensive income or loss and subsequently reclassified in interest income in the same period during which the hedged transaction affects earnings. As a result, the change in fair value of any ineffective portion of the hedging derivative is recognized immediately in earnings.
The Company will discontinue hedge accounting when it is determined that the derivative is no longer qualifying as an effective hedge; the derivative expires or is sold, terminated or exercised; or the derivative no longer qualifies as a fair value or cash flow hedge or it is no longer probable that the forecasted transaction will occur by the end of the originally specified time period. If the Company determines that the derivative no longer qualifies as a cash flow or fair value hedge and therefore hedge accounting is discontinued, the derivative will continue to be recorded on the balance sheet at its fair value with changes in fair value included in current earnings.
Stock-Based Compensation
As of January 1, 2006, the Company adopted Statement of Financial Accounting Standards No. 123R, Share-Based Payment (“Statement 123R”) using the “modified
28
prospective application.” Statement 123R requires public companies to recognize compensation expense related to stock-based compensation awards over the period during which an employee is required to provide service for the award. The provisions apply to all awards granted after the required effective date including existing awards not vested, modified, repurchased or canceled. Prior to January 1, 2006, the Company applied Accounting Principles Board Opinion 25 and related interpretations in accounting for its option plans. No stock-based compensation cost was reflected in net income, as all options granted under those plans had an exercise price equal to the market value of their underlying common stock on the date of grant.
Compensation expense related to stock-based compensation awards totaled $112 thousand and $25 thousand in 2007 and 2006. The following tables represent the impact of the adoption of SFAS 123R on the Company’s financial statements in 2007 and 2006.
December 31, 2007 | | Under SFAS 123 R | |
Net income before provision for income taxes | | $ | 6,703 | |
Net income | | $ | 4,725 | |
Net income per common share – Basic | | $ | 0.68 | |
Net income per common share – Diluted | | $ | 0.66 | |
December 31, 2006 | | Under SFAS 123 R | |
Net income before provision for income taxes | | $ | 8,788 | |
Net income | | $ | 5,845 | |
Net income per common share – Basic | | $ | 0.85 | |
Net income per common share – Diluted | | $ | 0.81 | |
The following table illustrates the effect on net income and earnings per share for 2005 if the Company had applied the fair value recognition provisions of FASB Statement No. 123, Accounting for Stock-Based Compensation as amended, to stock-based compensation.
Proforma
(In thousands, except per share data) | | 2005 | |
Net income to common shareholders as reported: | | $ | 6,210 | |
Proforma | | 6,143 | |
Income per share: | | | |
Basic as reported | | $ | 0.92 | |
Basic Proforma | | 0.91 | |
Diluted as reported | | 0.87 | |
Diluted Proforma | | 0.87 | |
For additional information on our stock-based compensation see Note 20 to the Consolidated Financial Statements.
Treasury Stock
Treasury stock is accounted for under the cost method and accordingly is presented as a reduction in shareholders’ equity.
Bank Owned Life Insurance
The Company purchased life insurance policies on certain members of management. Bank owned life insurance (“BOLI”) is recorded at its cash surrender value or the amount that can be realized.
Advertising
The Company expenses the costs of advertising in the period incurred.
Dividend Restrictions
Banking regulations require maintaining certain capital levels that may limit the dividends paid by our bank to our holding company or by our holding company to our shareholders.
Operating Segments
While management monitors the revenue streams of the various products and services, operating results and financial performance is evaluated on a company-wide basis. Operating segments are aggregated into one, as operating results for all segments are similar. Accordingly, all financial service operations are aggregated in one reportable operating segment.
Servicing Assets
Servicing assets represent the allocated value of retained servicing rights on loans sold. Servicing assets are expensed in proportion to, and over the period of, estimated net servicing revenues. Impairment is evaluated based on stratifying the underlying financial assets by date of origination and term. Fair value is determined using prices for similar assets with similar characteristics, when available, or based upon discounted cash flows using market-based assumptions. Any impairment, if temporary, would be reported as a valuation allowance.
Recent Accounting Pronouncements
In December 2007, the Financial Accounting Standards Board (“FASB”) issued Statements of Financial Accounting Standards (“SFAS”) No. 141 (R), Business Combinations, and SFAS No. 160, Noncontrolling Interests in Consolidated Financial Statements. SFAS No. 141 revises the previous statement on business combinations and requires the acquiring entity in a business combination to recognize all (and only) the assets acquired and liabilities assumed in the transaction; establishes the acquisition date fair value as the measurement objective for all assets acquired and liabilities assumed; and requires the acquirer to disclose to investors and other users all of the financial effect of the business combination. As this Statement applies prospectively to business combinations for which the acquisition date is on or after the beginning of the first annual reporting period beginning on or after December 15, 2008, this Statement is not currently applicable to the
29
Company. SFAS No. 160 requires all entities to report noncontrolling (minority) interests in subsidiaries in the same way, as equity in the consolidated financial statements. This Statement is effective for annual periods beginning after December 15, 2008 and is not currently applicable to the Company, as it does not have any minority interests in its subsidiaries.
Also in December 2007, the SEC released Staff Accounting Bulletin (SAB) No. 110, Use of a “Simplified” Estimate of Expected Term under SFAS 123R, Share Based Payment, which expresses the views of the staff regarding the use of a “simplified” method, as discussed in SAB No. 107 (“SAB 107”), in developing an estimate of expected term of “plain vanilla” share options in accordance with Statement of Financial Accounting Standards No. 123 (revised 2004), Share-Based Payment. In particular, the staff indicated in SAB 107 that it will accept a company’s election to use the simplified method, regardless of whether the company has sufficient information to make a more refined estimate of expected term. At the time SAB 107 was issued, the SEC believed that more detailed external information about employee exercise behavior would, over time, become readily available to companies. Therefore, the staff stated in SAB 107 that it would not expect a company to use the simplified method for share option grants after December 31, 2007. Under certain circumstances, the use of the simplified method beyond December 31, 2007 will continue to be acceptable.
In November 2007, the SEC released SAB No. 109, Written Loan Commitments Recorded at Fair Value Through Earnings, which expresses the current view of the staff that the expected net future cash flows related to the associated servicing of the loan should be included in the measurement of all written loan commitments that are accounted for at fair value through earnings.
In February 2007, the FASB issued SFAS No. 159, The Fair Value Option for Financial Assets and Financial Liabilities, which allows an entity the irrevocable option to elect fair value for the initial and subsequent measurement for certain financial assets and liabilities on a contract-by contract basis. Subsequent changes in fair value of these financial assets and liabilities would be recognized in earnings when they occur. SFAS 159 further establishes certain additional disclosure requirements. SFAS 159 is effective for the Company’s financial statements for the year beginning on January 1, 2008, with earlier adoption permitted. Management is currently evaluating the impact adoption of SFAS 159 will have on the Company’s financial condition and results of operations.
In September 2006, the FASB issued SFAS No. 157, Fair Value Measurements. This Statement defines fair value, establishes a framework for measuring fair value in generally accepted accounting principles, and expands disclosures about fair value measurements. This Statement applies under other accounting pronouncements that require or permit fair value measurements, the FASB having previously concluded in those accounting pronouncements that fair value is the relevant measurement attribute. Accordingly, this Statement does not require any new fair value measurements. The Statement is effective for fiscal years beginning after November 15, 2007 and interim periods within those fiscal years. The Company does not expect the adoption of Statement No. 157 to have a material impact on its financial statements.
In June 2006, the FASB issued FASB Interpretation No. 48, Accounting for Uncertainty in Income Taxes. The Interpretation clarifies the accounting for uncertainty in income taxes recognized in an enterprise’s financial statements in accordance with FASB Statement No. 109, Accounting for Income Taxes. This Interpretation presents a recognition threshold and measurement attribute for the financial statement recognition and measurement of a tax position taken or expected to be taken in a tax return. The Interpretation is effective for fiscal years beginning after December 15, 2006. The adoption of Interpretation No. 48 did not have a material impact on the Company’s financial statements.
In March 2006, the FASB issued SFAS No. 156, Accounting for Servicing of Financial Assets. SFAS No. 156 amends Statement 140 to require that all separately recognized servicing assets and servicing liabilities be initially measured at fair value, if practicable. This Statement permits, but does not require, the subsequent measurement of separately recognized servicing assets and servicing liabilities at fair value. An entity that uses derivative instruments to mitigate the risks inherent in servicing assets and servicing liabilities is required to account for those derivative instruments at fair value. Under this Statement, an entity can elect subsequent fair value measurement to account for its separately recognized servicing assets and servicing liabilities. By electing that option, an entity may simplify its accounting because this Statement permits income statement recognition of the potential offsetting changes in fair value of those servicing assets and servicing liabilities and derivative instruments in the same accounting period. The Statement is effective in the first fiscal year beginning after September 15, 2006 with earlier adoption permitted. The adoption of Statement No. 156 did not have a material impact on the Company’s financial statements.
2. Goodwill
The Company accounts for goodwill and other intangible assets in accordance with SFAS No. 142, Goodwill and Intangible Assets, which includes requirements to test goodwill and indefinite-lived intangible assets on an annual basis for impairment, rather than amortize them. Management believes that the Company’s recorded goodwill totaling $1.5 million, which resulted from the 2005 acquisition of its Phillipsburg, New Jersey branch, is not impaired as of December 31, 2007.
30
3. Restrictions on Cash
Federal law requires depository institutions to maintain a prescribed amount of cash or noninterest-bearing balances with the Federal Reserve Bank. As of December 31, 2007 and 2006, the Company was required to maintain reserve balances of $80 thousand.
4. Securities
This table provides the major components of securities available for sale and held to maturity at amortized cost and estimated fair value at December 31,
| | 2007 | | 2006 | |
(In thousands) | | Amortized
Cost | | Gross
Unrealized
Gains | | Gross
Unrealized
Losses | | Estimated
Fair
Value | | Amortized
Cost | | Gross
Unrealized
Gains | | Gross
Unrealized
Losses | | Estimated
Fair
Value | |
Securities available for sale: | | | | | | | | | | | | | | | | | |
US Government sponsored entities | | $ | 7,473 | | $ | 61 | | $ | (18 | ) | $ | 7,516 | | $ | 11,057 | | $ | 24 | | $ | (210 | ) | $ | 10,871 | |
State and political subdivisions | | 2,945 | | — | | (34 | ) | 2,911 | | 2,945 | | — | | (31 | ) | 2,914 | |
Mortgage-backed securities | | 47,242 | | 157 | | (510 | ) | 46,889 | | 48,267 | | 98 | | (1,216 | ) | 47,149 | |
Corporate debt securities | | 3,973 | | — | | (416 | ) | 3,557 | | 972 | | — | | (12 | ) | 960 | |
Other equities | | 3,989 | | 29 | | (36 | ) | 3,982 | | 730 | | 42 | | (24 | ) | 748 | |
Total securities available for sale | | $ | 65,622 | | $ | 247 | | $ | (1,014 | ) | $ | 64,855 | | $ | 63,971 | | $ | 164 | | $ | (1,493 | ) | $ | 62,642 | |
| | | | | | | | | | | | | | | | | |
Securities held to maturity: | | | | | | | | | | | | | | | | | |
US Government sponsored entities | | $ | 7,189 | | $ | 93 | | $ | — | | $ | 7,282 | | $ | 8,187 | | $ | 32 | | $ | (34 | ) | $ | 8,185 | |
State and political subdivisions | | 3,159 | | 13 | | (93 | ) | 3,079 | | 3,160 | | 41 | | — | | 3,201 | |
Mortgage-backed securities | | 22,383 | | 95 | | (208 | ) | 22,270 | | 26,801 | | 54 | | (458 | ) | 26,397 | |
Corporate debt securities | | 1,005 | | 3 | | — | | 1,008 | | 4,667 | | 11 | | (12 | ) | 4,666 | |
Total securities held to maturity | | $ | 33,736 | | $ | 204 | | $ | (301 | ) | $ | 33,639 | | $ | 42,815 | | $ | 138 | | $ | (504 | ) | $ | 42,449 | |
The table below provides the remaining contractual maturities and yields of securities within the investment portfolios. The carrying value of securities at December 31, 2007 is primarily distributed by contractual maturity. Mortgage-backed securities and other securities, which may have principal prepayment provisions, are distributed based on contractual maturity. Expected maturities will differ materially from contractual maturities as a result of early prepayments and calls. The total weighted average yield excludes equity securities.
| | Within one year | | After one year
through five years | | After five years
through ten years | | After ten years | | Total carrying | |
(In thousands) | | Amount | | Yield | | Amount | | Yield | | Amount | | Yield | | Amount | | Yield | | Amount | | Yield | |
Available for sale at fair value: | | | | | | | | | | | | | | | | | | | | | |
US Government sponsored entities | | $ | — | | — | % | $ | 993 | | 4.02 | % | $ | 5,134 | | 4.97 | % | $ | 1,389 | | 6.08 | % | $ | 7,516 | | 5.04 | % |
State and political subdivisions | | — | | — | | — | | — | | — | | — | | 2,911 | | 3.91 | | 2,911 | | 3.91 | |
Mortgage-backed securities | | 110 | | 4.26 | | 866 | | 3.63 | | 6,213 | | 4.30 | | 39,700 | | 4.79 | | 46,889 | | 4.71 | |
Corporate debt securities | | — | | — | | — | | — | | — | | — | | 3,557 | | 6.26 | | 3,557 | | 6.26 | |
Other equities | | 698 | | — | | — | | — | | — | | — | | 3,284 | | 5.89 | | 3,982 | | 2.31 | |
Total securities available for sale | | $ | 808 | | 4.26 | % | $ | 1,859 | | 3.84 | % | $ | 11,347 | | 4.60 | % | $ | 50,841 | | 4.95 | % | $ | 64,855 | | 4.86 | % |
Held to maturity at cost: | | | | | | | | | | | | | | | | | | | | | |
US Government sponsored entities | | $ | 1,250 | | 4.42 | % | $ | 3,126 | | 5.03 | % | $ | 1,325 | | 5.97 | % | $ | 1,488 | | 6.34 | % | $ | 7,189 | | 5.37 | % |
State and political subdivisions | | — | | — | | — | | — | | — | | — | | 3,159 | | 4.46 | | 3,159 | | 4.46 | |
Mortgage-backed securities | | — | | — | | 31 | | 3.57 | | 5,912 | | 4.74 | | 16,440 | | 5.24 | | 22,383 | | 5.11 | |
Corporate debt securities | | 1,005 | | 4.45 | | — | | — | | — | | — | | — | | — | | 1,005 | | 4.45 | |
Total securities held to maturity | | $ | 2,255 | | 4.43 | % | $ | 3,157 | | 5.02 | % | $ | 7,237 | | 4.96 | % | $ | 21,087 | | 5.20 | % | $ | 33,736 | | 5.08 | % |
31
Gross realized gains on securities available for sale amounted to $50 thousand, $69 thousand and $81 thousand, while gross realized losses amounted to $621 thousand, $0 and $12 thousand for the years 2007, 2006 and 2005, respectively. These net amounts are included in noninterest income as securities gains in the Consolidated Statements of Income. Included in gross realized losses for 2007 was an other-than-temporary impairment charge of $607 thousand which was recorded on three Federal Home Loan Mortgage Corporation (“FHLMC or Freddie Mac”) investment grade, perpetual callable preferred securities. These securities are classified as available for sale and due to the recent decline in market value and the uncertainty that they will recover their $3.9 million book value within a reasonable period, the Company recorded the unrealized loss of $607 thousand as other-than-temporarily impaired as of December 31, 2007. The FHLMC securities were investment grade at the time of purchase and remain investment grade with ratings of AA- by S&P and Aa3 by Moody’s. The securities continue to perform according to their contractual terms and all dividend payments are current.
Securities with a carrying value of $54.9 million and $47.6 million at December 31, 2007 and 2006, respectively, were pledged to secure government deposits, secured other borrowings and for other purposes required or permitted by law. Included in these figures was $2.9 million and $10.7 million pledged against government deposits at December 31, 2007 and 2006, respectively.
The fair value of securities with unrealized losses by length of time that the individual securities have been in a continuous unrealized loss position at December 31, 2007 and 2006 are as follows:
| | Less than 12 months | | Greater than 12 months | | Total | |
(In thousands) | | Estimated
Fair Value | | Unrealized
Loss | | Estimated
Fair Value | | Unrealized
Loss | | Estimated
Fair Value | | Unrealized
Loss | |
2007 | | | | | | | | | | | | | |
US Government sponsored entities | | $ | 112 | | $ | — | | $ | 5,094 | | $ | (18 | ) | $ | 5,206 | | $ | (18 | ) |
State and political subdivisions | | 3,035 | | (107 | ) | 1,270 | | (20 | ) | 4,305 | | (127 | ) |
Mortgage-backed securities | | 9,569 | | (77 | ) | 35,827 | | (641 | ) | 45,396 | | (718 | ) |
Corporate debt securities | | 3,558 | | (416 | ) | — | | — | | 3,558 | | (416 | ) |
Other equities | | — | | — | | 559 | | (36 | ) | 559 | | (36 | ) |
Total temporarily impaired investments | | $ | 16,274 | | $ | (600 | ) | $ | 42,750 | | $ | (715 | ) | $ | 59,024 | | $ | (1,315 | ) |
| | | | | | | | | | | | | |
2006 | | | | | | | | | | | | | |
US Government sponsored entities | | $ | 1,743 | | $ | (6 | ) | $ | 10,791 | | $ | (238 | ) | $ | 12,534 | | $ | (244 | ) |
State and political subdivisions | | 1,067 | | (1 | ) | 2,330 | | (30 | ) | 3,397 | | (31 | ) |
Mortgage-backed securities | | 4,694 | | (73 | ) | 58,123 | | (1,601 | ) | 62,817 | | (1,674 | ) |
Corporate debt securities | | — | | — | | 4,068 | | (24 | ) | 4,068 | | (24 | ) |
Other equities | | — | | — | | 586 | | (24 | ) | 586 | | (24 | ) |
Total temporarily impaired investments | | $ | 7,504 | | $ | (80 | ) | $ | 75,898 | | $ | (1,917 | ) | $ | 83,402 | | $ | (1,997 | ) |
Management evaluates securities for other-than-temporary impairment at least on a quarterly basis, and more frequently when economic or market concern warrants such evaluation. Consideration is given to: (1) the length of time and the extent to which the fair value has been less than cost, (2) the financial condition and near-term prospects of the issuer, and (3) the intent and ability of the Company to retain its investment in the issuer for a period of time sufficient to allow for any anticipated recovery in fair value.
As of December 31, 2007, the number of securities in an unrealized loss position in each category was as follows: six securities of U.S. Government sponsored entities, fourteen state and political subdivision securities, seventy-six mortgage-backed securities, three corporate debt securities, and eight other equity securities. The unrealized losses in each of these categories are discussed in the paragraphs that follow.
32
U.S. Government sponsored entities and state and political subdivision securities: The unrealized losses on investments in securities were caused by interest rate increases. The contractual terms of these investments do not permit the issuer to settle the securities at a price less than the par value of the investment. Because the Company has the ability and intent to hold these investments until a market price recovery or maturity, these investments are not considered other-than-temporarily impaired.
Mortgage-backed securities: The unrealized losses on investments in mortgage-backed securities were caused by interest rate increases. The contractual cash flows of these securities are guaranteed by Fannie Mae, Ginnie Mae and the Federal Home Loan Mortgage Corporation. It is expected that the securities would not be settled at a price significantly less than the par value of the investment. Because the decline in fair value is attributable to changes in interest rates and not credit quality, and because the Company has the ability and intent to hold these investments until a market price recovery or maturity, these investments are not considered other-than temporarily impaired.
Corporate debt securities: The unrealized losses on corporate debt securities were caused by interest rate increases. The contractual terms of the bonds do not allow the securities to be settled at a price less than the par value of the investments. The credit ratings on these bonds have not decreased during the period. The decline in face value is attributed to changes in interest rates and not credit quality, and because the Company has the ability and intent to hold these investments until a market price recovery or maturity, these investments are not considered other-than temporarily impaired.
Other equity securities: Included in this category is stock of other financial institutions. The unrealized losses on other equity securities are caused by decreases in the market prices of the shares. The Company has the ability and intent to hold these shares until a market price recovery; therefore these investments are not considered other-than temporarily impaired.
5. Loans
The composition of the loan portfolio, net of unearned discount and deferred loan origination fees and costs, at December 31 was as follows:
(In thousands) | | 2007 | | 2006 | |
SBA held for sale | | $ | 24,640 | | $ | 12,273 | |
SBA held to maturity | | 68,875 | | 66,802 | |
Commercial | | 365,786 | | 312,195 | |
Residential mortgage | | 73,697 | | 63,493 | |
Consumer | | 57,134 | | 52,927 | |
Total loans | | $ | 590,132 | | $ | 507,690 | |
SBA loans sold to others and serviced by the Company are not included in the accompanying consolidated balance sheets. The total amount of such loans serviced, but owned by outside investors, amounted to approximately $140.4 million and $145.3 million at December 31, 2007 and 2006, respectively. At December 31, 2007 and 2006, the fair value of servicing rights was $2.1 million and $2.3 million, respectively. The fair value of servicing rights was determined using a discount rate of 15 percent, constant prepayment rate speeds ranging from 15 to 18, and interest strip multiples ranging from 2.85 to 3.25, depending on each individual credit. A summary of the changes in the related servicing asset for the past three years follows:
| | Years ending December 31, | |
(In thousands) | | 2007 | | 2006 | | 2005 | |
Balance at beginning of year | | $ | 2,294 | | $ | 2,438 | | $ | 2,017 | |
SBA servicing rights capitalized | | 797 | | 755 | | 1,081 | |
SBA servicing rights amortized | | (1,035 | ) | (899 | ) | (660 | ) |
Provision for loss in fair value | | — | | — | | — | |
Balance at end-of-year | | $ | 2,056 | | $ | 2,294 | | $ | 2,438 | |
The Company had an offsetting balance of $2.2 million and $2.3 million related to the retained portion of the unsold SBA loans at December 31, 2007 and 2006, respectively.
As of December 31, 2007 and 2006, the Bank’s recorded investment in impaired loans, defined as nonaccrual loans, was $5.5 million and $8.9 million, respectively, and the related valuation allowance was $372 thousand and $1.8 million at December 31, 2007 and 2006. This valuation allowance is included in the allowance for loan losses in the accompanying balance sheets. Interest income that would have been recorded had these impaired loans performed under the original contract terms was $475 thousand and $850 thousand for 2007 and 2006 respectively. Average impaired loans for 2007 and 2006 were $5.7 million and $4.6 million respectively. There were no loans restructured during 2007.
As of December 31, 2007, there were $41 thousand in loans past due 90 or more days and still accruing interest. In December 2006 and 2005, there were $78 thousand and no loans past due 90 or more days and still accruing interest, respectively.
As of December 31, 2007, approximately 95 percent of the Company’s loans were secured by real estate. A portion of the Company’s SBA loans are located outside the Company’s lending area. The Company has approximately 13 percent of the total loan portfolio to various unrelated and unaffiliated borrowers in the Hotel/Motel industry. Such loans are collateralized by the underlying real property financed and/or partially guaranteed by the SBA.
As of December 31, 2007, residential mortgages provided $37.0 million in borrowing capacity at the Federal Home Loan Bank compared to $29.0 million at December 31, 2006.
33
In the ordinary course of business, the Company may extend credit to officers, directors or their associates. These loans are subject to the Company’s normal lending policy. An analysis of such loans, all of which are current as to principal and interest payments, is as follows:
(In thousands) | | 2007 | |
Loans to officers, directors or their associates at December 31, 2006 | | $ | 17,456 | |
New loans | | 340 | |
Repayments | | 1,063 | |
Loans to officers, directors or their associates at December 31, 2007 | | $ | 16,733 | |
6. Allowance for Loan Losses & Unfunded Loan Commitments
The allowance for loan losses is based on estimates. Ultimate losses may vary from current estimates. These estimates are reviewed periodically and, as adjustments become known, they are reflected in operations in the periods in which they become known.
An analysis of the change in the allowance for loan losses during years 2005 through 2007 is as follows:
(In thousands) | | 2007 | | 2006 | | 2005 | |
Balance at beginning of year | | $ | 7,624 | | $ | 6,892 | | $ | 5,856 | |
Provision charged to expense | | 1,550 | | 1,550 | | 1,850 | |
| | 9,174 | | 8,442 | | 7,706 | |
Charge-offs | | 975 | | 933 | | 1,173 | |
Recoveries | | 184 | | 115 | | 359 | |
Net charge-offs | | 791 | | 818 | | 814 | |
Balance at end-of-year | | $ | 8,383 | | $ | 7,624 | | $ | 6,892 | |
The Company maintains an allowance for unfunded loan commitments that is maintained at a level that management believes is adequate to absorb estimated probable losses. Adjustments to the allowance are made through other expense and applied to the allowancce which is maintained in other liabilities. The commitment reserve was $102 thousand and $127 thousand at December 31, 2007 and December 31, 2006, respectively.
7. Premises and Equipment
The detail of premises and equipment as of December 31, 2007 and 2006 is as follows:
(In thousands) | | 2007 | | 2006 | |
Land and buildings | | $ | 9,658 | | $ | 9,088 | |
Furniture, fixtures and equipment | | 5,192 | | 4,316 | |
Leasehold improvements | | 2,628 | | 2,518 | |
Gross premises and equipment | | 17,478 | | 15,922 | |
Less: Accumulated depreciation | | (5,376 | ) | (4,312 | ) |
Net premises and equipment | | $ | 12,102 | | $ | 11,610 | |
Amounts charged to noninterest expense for depreciation of premises and equipment amounted to $1.1 million in 2007, $980 thousand in 2006, and $867 thousand in 2005.
The Company currently accounts for all of its leases as operating leases. In addition, the Company has one lease with a related party. The Company leases its Clinton, New Jersey headquarters from a partnership in which two board members, Messrs. D. Dallas and R. Dallas are partners. Under the lease for the facility, the partnership received aggregate rental payments of $553 thousand, in 2007 and 2006 and $483 thousand in 2005, respectively. The Company believes that these rent payments reflect market rents and that the lease reflects terms that are comparable to those, which could have been obtained in a lease with an unaffiliated third party. The annual base rent under the lease is fixed until 2009.
8. Other Assets
The detail of other assets as of December 31, 2007 and 2006 is as follows:
(In thousands) | | 2007 | | 2006 | |
FHLB stock | | $ | 4,395 | | $ | 2,953 | |
Deferred tax asset | | 3,939 | | 3,460 | |
Prepaid expenses | | 586 | | 648 | |
Net receivable due from SBA | | 388 | | 350 | |
Other real estate owned | | 106 | | 211 | |
Other | | 820 | | 720 | |
Total other assets | | $ | 10,234 | | $ | 8,342 | |
34
9. Deposits
The following schedule details the maturity distribution of time deposits:
| | | | More than 3 | | More than 6 | | | | | |
| | 3 months | | through | | through | | More than | | | |
(In thousands) | | or less | | 6 months | | 12 months | | 12 months | | Total | |
At December 31, 2007 | | | | | | | | | | | |
$100,000 or more | | $ | 27,150 | | $ | 25,956 | | $ | 19,474 | | $ | 15,435 | | $ | 88,015 | |
Less than $100,000 | | $ | 44,533 | | $ | 41,190 | | $ | 40,992 | | $ | 41,529 | | $ | 168,244 | |
| | | | | | | | | | | | | | | | |
At December 31, 2006 | | | | | | | | | | | |
$100,000 or more | | $ | 34,846 | | $ | 6,667 | | $ | 13,119 | | $ | 9,690 | | $ | 64,322 | |
Less than $100,000 | | $ | 43,238 | | $ | 16,878 | | $ | 22,807 | | $ | 28,147 | | $ | 111,070 | |
10. Borrowed Funds and Subordinated Debentures
The following tables present the period-end and average balances of borrowed funds and subordinated debentures for the last two years with resultant rates; as well as the expected maturities over the next five years:
| | 2007 | | 2006 | |
(In thousands) | | Amount | | Rate | | Amount | | Rate | |
FHLB borrowings and Repurchase agreements: | | | | | | | | | |
At December 31, | | $ | 75,000 | | 4.39 | % | $ | 45,000 | | 4.32 | % |
Year-to-date average | | $ | 51,889 | | 4.29 | % | $ | 31,774 | | 3.93 | % |
Maximum outstanding | | $ | 75,000 | | | | $ | 45,000 | | | |
| | | | | | | | | |
Repurchase agreements: | | | | | | | | | |
At December 31, | | $ | 10,000 | | 2.91 | % | $ | 10,000 | | 2.78 | % |
Year-to-date average | | $ | 10,795 | | 3.01 | % | $ | 10,000 | | 2.78 | % |
Maximum outstanding | | $ | 20,000 | | | | $ | 10,000 | | | |
| | | | | | | | | |
Subordinate debentures: | | | | | | | | | |
At December 31, | | $ | 15,465 | | 6.63 | % | $ | 24,744 | | 7.66 | % |
Year-to-date average | | $ | 22,278 | | 7.74 | % | $ | 13,982 | | 8.63 | % |
Maximum outstanding | | $ | 24,744 | | | | $ | 24,744 | | | |
(In thousands) | | 2008 | | 2009 | | 2010 | | 2011 | | 2012 | | Thereafter | |
FHLB borrowings and repurchase agreements | | $ | 5,000 | | $ | — | | $ | 10,000 | | $ | — | | $ | — | | $ | 60,000 | |
Repurchase agreements | | — | | $ | 10,000 | | — | | — | | — | | — | |
Subordinated debentures | | — | | — | | — | | — | | — | | $ | 15,465 | |
Total | | $ | 5,000 | | $ | 10,000 | | $ | 10,000 | | $ | — | | $ | — | | $ | 75,465 | |
35
FHLB Borrowings
The FHLB borrowings at December 31, 2007 consisted of four $10 million advances, three $10 million repurchase agreements and a $5 million overnight line of credit advance. The terms of these transactions are as follows:
· The FHLB Overnight Line of Credit Advance was issued on December 29, 2007 at a rate of 3.61 percent and was repaid on January 2, 2008.
· The FHLB advance that was issued on December 19, 2000 has a fixed rate of interest at 4.92 percent, matures on December 20, 2010 and is callable quarterly on the 19th of March, June, September and December.
· The FHLB advance that was issued on April 27, 2005 has a fixed rate of 3.70 percent, matures on April 27, 2015 and is callable on April 27, 2008 and quarterly thereafter on the 27th of July, October, January and April.
· The FHLB advance that was issued on November 2, 2006 has a fixed rate of 4.025 percent, matures on November 2, 2016 and is callable on November 2, 2007 and quarterly thereafter on the 2nd of February, May, August and November.
· The FHLB advance that was issued on August 10, 2007 has a fixed rate of 4.234%, matures on August 10, 2017 and is callable on August 10, 2009 and quarterly thereafter on the 10th of November, February, May and August.
· The FHLB repo-advance that was issued on December 15, 2006 has a fixed rate of 4.13 percent, matures on December 15, 2016 and is callable on December 15, 2008 and quarterly thereafter on the 15th of March, June, September and December.
· The FHLB repo-advance that was issued on April 5, 2007 has a fixed rate of 4.208%, matures on April 5, 2017 and is callable on April 5, 2009 and quarterly thereafter on the 5th of July, October, January and April.
· The FHLB repo-advance that was issued on December 20, 2007 has a fixed rate of 3.337%, matures on December 20, 2017 and is callable on December 20, 2010 and quarterly thereafter on the 20th of March, June, September and December.
Due to the call provisions of these advances, the expected maturity could differ from the contractual maturity.
Repurchase Agreements
At December 31, 2007, the Company was a party in a $10 million repurchase agreement that was entered into in March 2004, has a term of 5 years expiring on March 11, 2009, and a rate of 2.78 percent. The borrowing may be called by the issuer if the 3-month London Inter-bank overnight rate (“LIBOR”) is greater than or equal to 7 percent.
Subordinated Debentures
On September 26, 2007, the Company chose to redeem $9.0 million of subordinated debentures that were issued by Unity (NJ) Statutory Trust I on September 26, 2002 at a floating rate of 3-month Libor plus 340 basis points. At December 31, 2007, the Company was a party in the following subordinated debenture transactions:
· On July 24, 2006, Unity (NJ) Statutory Trust II, a statutory business trust and wholly-owned subsidiary of Unity Bancorp Inc., issued $10.0 million of floating rate capital trust pass through securities to investors due on July 24, 2036. The subordinated debentures are redeemable in whole or part, prior to maturity but after July 24, 2011. The floating interest rate on the subordinated debentures is the three-month LIBOR plus 159 basis points and re-prices quarterly. The floating interest rate at December 31, 2007 was 6.47 percent.
· On December 19, 2006, Unity (NJ) Statutory Trust III, a statutory business trust and wholly-owned subsidiary of Unity Bancorp Inc., issued $5.0 million of floating rate capital trust pass through securities to investors due on December 19, 2036. The subordinated debentures are redeemable in whole or part, prior to maturity but after December 19, 2011. The floating interest rate on the subordinated debentures is the three-month LIBOR plus 165 basis points and re-prices quarterly. The floating interest rate at December 31, 2007 was 6.77 percent.
The capital securities in each of the above transactions have preference over the common securities with respect to liquidation and other distributions and qualify as Tier I capital. In accordance with Financial Accounting Interpretation N o.46, Consolidation of Variable Interest Entities, as revised December 2003, the Company does not consolidate the accounts and related activity of Unity (NJ) Statutory Trust II and Unity (NJ) Statutory Trust III. The additional capital from each of these transactions was used to bolster the Company’s capital ratios and for general corporate purposes, including among other things, capital contributions to Unity Bank and to fund stock repurchases.
11. Commitments and Contingencies
Facility Lease Obligations
The Company operates seventeen branches, eleven branches under operating leases, including its headquarters, and six branches are owned. In addition, the Company has a lease on one other location, which is subleased to a third party, with the third party paying rent in equal amounts as per the lease agreement between the Company and the lessor. The leases’ contractual expiration range is between the years 2008 and 2012. The following schedule summarizes the contractual rent payments for the future years.
(In thousands) | | Operating Lease
Rental Payments | | Rent from
Sublet
Locations | | Net Rent Obligation | |
2008 | | $ | 1,245 | | $ | 80 | | $ | 1,165 | |
2009 | | 516 | | 87 | | 429 | |
2010 | | 222 | | 74 | | 148 | |
2011 | | 129 | | — | | 129 | |
2012 | | 88 | | — | | 88 | |
Thereafter | | 160 | | — | | 160 | |
| | | | | | | | | | |
36
Total rent expense totaled $1.2 million, $1.1 million, and $952 thousand for 2007, 2006, and 2005, respectively.
The Company currently accounts for all of its leases as operating leases.
Litigation
The Company may, in the ordinary course of business, become a party to litigation involving collection matters, contract claims and other legal proceedings relating to the conduct of its business. In the best judgment of management, based upon consultation with counsel, the consolidated financial position and results of operations of the Company will not be affected materially by the final outcome of any pending legal proceedings or other contingent liabilities and commitments.
Commitments to Borrowers
Commitments to extend credit are legally binding loan commitments with set expiration dates. They are intended to be disbursed, subject to certain conditions, upon the request of the borrower. The Company was committed to advance approximately $132.0 million to its borrowers as of December 31, 2007, compared to $159.5 million at December 31, 2006. At December 31, 2007, $31.4 million of these commitments expire after one year, compared to $61.2 million a year earlier. At December 31, 2007, the Company had $3.9 million in standby letters of credit compared to $1.6 million in 2006. The estimated fair value of these guarantees is not significant. The Company believes it has the necessary liquidity to honor all commitments. Many of these commitments will expire and never be funded. In addition, approximately 25 percent of these commitments are for SBA loans, which may be sold in the secondary market.
12. Derivative Instruments and Hedging Activities
Derivative Financial Instruments
The Company has stand alone derivative financial instruments in the form of interest rate swap agreements, which derive their value from underlying interest rates. These transactions involve both credit and market risk. The notional amounts are amounts on which calculations, payments, and the value of the derivatives are based. Notional amounts do not represent direct credit exposures. Direct credit exposure is limited to the net difference between the calculated amounts to be received and paid, if any. Such difference, which represents the fair value of the derivative instruments, is reflected on the Company’s balance sheet as other assets and other liabilities.
The Company is exposed to credit-related losses in the event of nonperformance by the counterparties to these agreements. The Company controls the credit risk of its financial contracts through credit approvals, limits and monitoring procedures, and does not expect any counterparties to fail their obligations. The Company deals only with primary dealers.
Derivative instruments are generally either negotiated over the counter (“OTC”) contracts or standardized contracts executed on a recognized exchange. Negotiated OTC derivative contracts are generally entered into between two counterparties that negotiate specific agreement terms, including the underlying instrument, amount, exercise prices and maturity.
Risk Management Policies – Hedging Instruments
The primary focus of the Company’s asset/liability management program is to monitor the sensitivity of the Company’s net portfolio value and net income under varying interest rate scenarios to take steps to control its risks. On a quarterly basis, the Company evaluates the effectiveness of entering into any derivative agreement by measuring the cost of such an agreement in relation to the reduction in net portfolio value and net income volatility within an assumed range of interest rates.
Interest Rate Risk Management – Cash Flow Hedging Instruments
The Company has long-term variable rate debt as a source of funds for use in the Company’s lending and investment activities and for other general business purposes. These debt obligations expose the Company to variability in interest payments due to changes in interest rates. If interest rates increase, interest expense increases. Conversely, if interest rates decrease, interest expense decreases. Management believes it is prudent to limit the variability of a portion of its interest payments and, therefore, hedged a portion of its variable-rate interest payments. To meet this objective, management entered into interest rate swap agreements whereby the Company receives variable interest rate payments and makes fixed interest rate payments during the contract period.
At December 31, 2007 and 2006 the information pertaining to outstanding interest rate swap agreements used to hedge variable rate debt is as follows:
(Dollars in thousands) | | 2007 | | 2006 | |
Notional amount | | $ | 10,000 | | $ | — | |
Weighted average pay rate | | 4.10 | % | — | |
Weighted average receive rate | | 4.88 | | — | |
Maturity date | | 9/23/2011 | | — | |
Unrealized loss relating to interest rate swaps | | (23 | ) | — | |
| | | | | | | |
These agreements provided for the Company to receive payments at a variable rate determined by a specific index (three month Libor) in exchange for making payments at a fixed rate.
At December 31, 2007 the unrealized loss relating to interest rate swaps was recorded as a derivative liability. Changes in the fair value of interest rate swaps designated as hedging instruments of the variability of cash flows associated with long-term debt are reported in other comprehensive income. These amounts subsequently are reclassified into interest expense as a yield adjustment in the same period in which the related interest on the long-term debt affects earnings. There were no amounts of other comprehensive income reclassified into interest expense during the year ended December 31, 2007.
37
13. Shareholders’ Equity
Shareholders’ equity increased $1.1 million to $47.3 million at December 31, 2007 due to $4.7 million in net income, $1.3 million from the issuance of common stock under employee benefit plans and a $348 thousand appreciation in the market value of the available for sale securities portfolio, partially offset by $3.9 million in common stock purchases and $1.4 million of cash dividends declared during 2007. In 2007, the Company declared four dividends totaling $0.20 for the year. The issuance of common stock under employee benefit plans includes nonqualified stock options and restricted stock expense, related entries, employee option exercises and the tax benefit of options exercised.
On October 21, 2002, the Company authorized the repurchase of up to 10 percent of its outstanding common stock. The amount and timing of purchases will be dependent on a number of factors, including the price and availability of the Company’s shares, general market conditions and competing alternate uses of funds. During 2007, the Company purchased 380 thousand shares at an average price of $10.35. As of December 31, 2007, the Company had purchased a total of 528 thousand shares of which 125 thousand shares have been retired, leaving 127 thousand shares remaining to be purchased under the plan.
On April 26, 2007, the Company announced a 5 percent stock distribution payable on June 29, 2007 to shareholders of record as of June 15, 2007, and accordingly, all share amounts have been restated to include the effect of the distribution.
14. Other Income
The other income components for the years ended December 31, 2005 through 2007 are as follows:
(In thousands) | | 2007 | | 2006 | | 2005 | |
Loan referral fees | | $ | 233 | | $ | 224 | | $ | 210 | |
ATM/Check card fees | | 224 | | 209 | | 200 | |
Other | | 415 | | 293 | | 311 | |
Total other income | | $ | 872 | | $ | 726 | | $ | 721 | |
15. Other Expenses
The other expenses components for the years ended December 31, 2005 through 2007 are as follows:
(In thousands) | | 2007 | | 2006 | | 2005 | |
Travel, entertainment, training & recruiting | | $ | 772 | | $ | 572 | | $ | 577 | |
Insurance | | 359 | | 336 | | 443 | |
Stationery & supplies | | 319 | | 321 | | 254 | |
Director fees | | 302 | | 225 | | 142 | |
Reserve for commitments | | (25 | ) | 127 | | — | |
Other | | 329 | | 278 | | 218 | |
Total other expenses | | $ | 2,056 | | $ | 1,859 | | $ | 1,634 | |
16. Income Taxes
The components of the provision for income taxes are as follows:
(In thousands) | | 2007 | | 2006 | | 2005 | |
Income Taxes | | | | | | | |
Federal – Current provision | | $ | 2,545 | | $ | 3,325 | | $ | 2,950 | |
Federal – Deferred (benefit) provision | | (587 | ) | (629 | ) | (12 | ) |
Total Federal provision | | $ | 1,958 | | $ | 2,696 | | $ | 2,938 | |
State – Current provision | | 126 | | 159 | | 754 | |
State – Deferred (benefit) provision | | (106 | ) | 88 | | (4 | ) |
Total State provision | | 20 | | 247 | | 750 | |
Total provision for income taxes | | $ | 1,978 | | $ | 2,943 | | $ | 3,688 | |
A reconciliation between the reported income taxes and the amount computed by multiplying income before taxes by the statutory Federal income tax rate is as follows:
(In thousands) | | 2007 | | 2006 | | 2005 | |
Federal income taxes at statutory rate | | $ | 2,279 | | $ | 2,988 | | $ | 3,365 | |
(Decreases) Increases resulting from: | | | | | | | |
Tax-exempt interest | | (114 | ) | (58 | ) | (43 | ) |
Bank owned life insurance | | (67 | ) | (64 | ) | (64 | ) |
Meals and entertainment | | 21 | | 18 | | 14 | |
State income taxes, net of Federal income tax effect | | 13 | | 164 | | 256 | |
Other, net | | (154 | ) | (105 | ) | 160 | |
Provision for income taxes | | $ | 1,978 | | $ | 2,943 | | $ | 3,688 | |
Effective tax rate | | 29.5 | % | 33.5 | % | 37.3 | % |
Deferred income taxes are provided for the temporary differences between the financial reporting basis and the tax basis of the Company’s assets and liabilities. The components of the net deferred tax asset at December 31, 2007 and 2006 are as follows:
38
(In thousands) | | 2007 | | 2006 | |
Deferred tax assets: | | | | | |
Allowance for loan losses | | $ | 3,240 | | $ | 3,044 | |
Unrealized loss on securities available for sale | | 291 | | 505 | |
Lost interest on nonaccrual loans | | 289 | | 476 | |
Write-down of available for sale securities | | 243 | | — | |
Other | | 459 | | 33 | |
Total deferred tax assets | | 4,522 | | 4,058 | |
Deferred tax liabilities: | | | | | |
Deferred loan costs | | 351 | | 315 | |
Bond accretion | | 89 | | 85 | |
Goodwill | | 84 | | 44 | |
Other | | 59 | | 154 | |
Total deferred tax liabilities | | 583 | | 598 | |
Net deferred tax asset | | $ | 3,939 | | $ | 3,460 | |
The Company computes deferred income taxes under the asset and liability method. Deferred income taxes are recognized for tax consequences of “temporary differences” by applying enacted statutory tax rates to differences between the financial reporting and the tax basis of existing assets and liabilities. A deferred tax liability is recognized for all temporary differences that will result in future taxable income. A deferred tax asset is recognized for all temporary differences that will result in future tax deductions subject to reduction of the asset by a valuation allowance.
Included as a component of shareholders’ equity is an income tax expense (benefit) related to unrealized losses on securities available for sale of $(476) thousand, $(199) thousand and ($408) thousand in 2007, 2006, and 2005, respectively.
17. Income per Common Share
The following is a reconciliation of the calculation of basic and dilutive income per share. All share amounts have been restated to include the effects of the 5 percent stock distribution paid on June 29, 2007.
(In thousands,
except per share amounts) | | 2007 | | 2006 | | 2005 | |
Net income | | $ | 4,725 | | $ | 5,845 | | $ | 6,210 | |
Weighted average common shares outstanding | | 6,900 | | 6,912 | | 6,748 | |
Plus: Potential dilutive common stock | | 269 | | 345 | | 351 | |
Diluted average common shares outstanding | | 7,169 | | 7,257 | | 7,099 | |
Net Income per common share – | | | | | | | |
Basic | | $ | 0.68 | | $ | 0.85 | | $ | 0.92 | |
Diluted | | $ | 0.66 | | $ | 0.81 | | $ | 0.87 | |
Stock options for 137 thousand, 4 thousand and 7 thousand shares were not considered in computing diluted earnings per common share for 2007, 2006 and 2005, respectively, because they were antidilutive.
18. SEC Staff Accounting Bulletin No. 108
In September 2006, the SEC released SAB 108. The transition provisions of SAB 108 permit the Company to adjust for the cumulative effect on retained earnings of immaterial errors relating to prior years. SAB 108 also requires the adjustment of any prior quarterly financial statements within the fiscal year of adoption for the effects of such errors on the quarters when the information is next presented. Such adjustments do not require previously filed reports with the SEC to be amended. In accordance with SAB 108, the Company has adjusted the beginning retained earnings for fiscal year 2006 in the accompanying consolidated financial statements for the items described below. The Company considers these adjustments to be immaterial to prior periods.
The Company adjusted its beginning retained earnings for 2006 related to the accounting for operating leases. This adjustment resulted in a $492 thousand reduction in retained earnings resulting from the understatement of lease expense.
19. Regulatory Capital
A significant measure of the strength of a financial institution is its capital base. Federal regulators have classified and defined capital into the following components: (1) tier 1 capital, which includes tangible shareholders’ equity for common stock, qualifying preferred stock and certain qualifying hybrid instruments, and (2) tier 2 capital, which includes a portion of the allowance for loan losses, subject to limitations, certain qualifying long-term debt and preferred stock which does not qualify for tier 1 capital. Minimum capital levels are regulated by risk-based capital adequacy guidelines, which require a bank to maintain certain capital as a percentage of assets and certain off-balance sheet items adjusted for predefined credit risk factors (risk-adjusted assets). A bank is required to maintain, at a minimum, tier 1 capital as a percentage of risk-adjusted assets of 4 percent and combined tier 1 and tier 2 capital as a percentage of risk- adjusted assets of 8 percent. In addition to the risk-based guidelines, regulators require that a bank, which meets the regulator’s highest performance and operation standards, maintain a minimum leverage ratio (tier 1 capital as a percentage of tangible assets) of 3 percent. For those banks with higher levels of risk or that are experiencing or anticipating significant growth, the minimum leverage ratio will be proportionately increased.
39
The Company’s capital amounts and ratios for each of the last two years are presented in the following table.
| | | | | | | | | | To be well | |
| | | | | | | | | | Capitalized Under | |
| | | | | | For Capital Adequacy | | Prompt Corrective | |
| | Actual | | Purposes | | Action Provisions | |
(In thousands) | | Amount | | Ratio | | Amount | | Ratio | | Amount | | Ratio | |
As of December 31, 2007 | | | | | | | | | | | | | |
Leverage ratio | | $ | 61,157 | | 8.25 | % | >$29,654 | | 4.00 | % | >$37,067 | | N/A | |
Tier I risk-based ratio | | $ | 61,157 | | 9.81 | % | >$24,947 | | 4.00 | % | >$37,421 | | N/A | |
Total risk-based capital ratio | | $ | 68,962 | | 11.06 | % | >$49,895 | | 8.00 | % | >$62,369 | | N/A | |
| | | | | | | | | | | | | | |
As of December 31, 2006 | | | | | | | | | | | | | |
Leverage ratio | | $ | 60,774 | | 9.08 | % | >$26,784 | | 4.00 | % | >$33,481 | | N/A | |
Tier I risk-based ratio | | $ | 60,774 | | 10.80 | % | >$22,499 | | 4.00 | % | >$33,749 | | N/A | |
Total risk-based capital ratio | | $ | 76,473 | | 13.60 | % | >$44,999 | | 8.00 | % | >$56,248 | | N/A | |
| | | | | | | | | | | | | | | |
The Bank’s capital amounts and ratios for the last two years are presented in the following table.
| | | | | | | | | | To be well | |
| | | | | | | | | | Capitalized Under | |
| | | | | | For Capital Adequacy | | Prompt Corrective | |
| | Actual | | Purposes | | Action Provisions | |
(In thousands) | | Amount | | Ratio | | Amount | | Ratio | | Amount | | Ratio | |
As of December 31, 2007 | | | | | | | | | | | | | |
Leverage ratio | | $ | 52,249 | | 7.06 | % | >$29,617 | | 4.00 | % | >$37,021 | | 5.00 | % |
Tier I risk-based ratio | | $ | 52,249 | | 8.39 | % | >$24,919 | | 4.00 | % | >$37,378 | | 6.00 | % |
Total risk-based capital ratio | | $ | 68,545 | | 11.00 | % | >$49,837 | | 8.00 | % | >$62,297 | | 10.00 | % |
| | | | | | | | | | | | | |
As of December 31, 2006 | | | | | | | | | | | | | |
Leverage ratio | | $ | 48,125 | | 7.20 | % | >$26,723 | | 4.00 | % | >$33,404 | | 5.00 | % |
Tier I risk-based ratio | | $ | 48,125 | | 8.55 | % | >$22,518 | | 4.00 | % | >$33,777 | | 6.00 | % |
Total risk-based capital ratio | | $ | 69,670 | | 12.38 | % | >$45,036 | | 8.00 | % | >$56,295 | | 10.00 | % |
20. Employee Benefit Plans
The Bank has a 401(k) savings plan covering substantially all employees. Under the Plan, an employee can contribute up to 80 percent of their salary on a tax deferred basis. The Bank may also make discretionary contributions to the Plan. The Bank contributed $185 thousand, $171 thousand and $125 thousand to the Plan in 2007, 2006 and 2005, respectively. The Bank does not currently provide any other post retirement or post employment benefits to its employees other than the 401(k) plan.
The Company has incentive and nonqualified option plans, which allow for the grant of options to officers, employees and members of the Board of Directors. In addition, restricted stock is issued under the stock bonus program to reward employees and directors and to retain them by distributing stock over a period of time.
Stock Option Plans
The Company’s incentive and nonqualified option plans, generally vest over 3 years and must be exercised within 10 years of the date of the grant. The exercise price of each option is the market price on the date of grant.
As of December 31, 2007, 1,448,123 shares have been reserved for issuance upon the exercise of options, 730,058 option grants are outstanding, 544,510 option grants have been exercised, forfeited or expired, leaving 173,555 shares available for grant.
The Company granted 103,788, 30,713* and 8,545* options in 2007, 2006 and 2005, respectively. The fair value of the options granted during each period was estimated on the date of grant using the Black-Scholes option pricing model with the following weighted average assumptions:
*Considers 5 percent dividend declared in 2007.
| | 2007 | | 2006 | | 2005 | |
Number of options granted | | 103,788 | | 30,713 | | 8,545 | |
Weighted average exercise price | | $ | 10.98 | | $ | 13.45 | | $ | 10.68 | |
Weighted average fair value of options | | $ | 3.22 | | $ | 3.33 | | $ | 2.39 | |
Expected life (years) | | 5.15 | | 4.07 | | 4.19 | |
Expected volatility | | 33.34 | % | 26.6 | % | 23.5 | % |
Risk-free interest rate | | 4.41 | % | 4.31 | % | 3.99 | % |
Dividend yield | | 1.92 | % | 1.34 | % | 1.36 | % |
40
The expected life of the options was estimated based on historical employee behavior and represents the period of time that options granted are expected to be outstanding. Expected volatility of the Company’s stock price was based on the historical volatility over the period commensurate with the expected life of the options. The risk-free interest rate is the U.S. Treasury rate commensurate with the expected life of the options on the date of grant. The expected dividend yield is the projected annual yield based on the grant date stock price.
Transactions under the Company’s stock options plans for the last three years are summarized as follows:
| | Number of
Shares | | Exercise Price
per Share | | Weighted
Average
Exercise
Price | | Weighted Average
Remaining
Contractual
Life (in years) | | Aggregate
Intrinsic
Value | |
Outstanding at December 31, 2004 | | 973,927 | | $ 2.20 | – | 12.04 | | $ | 5.46 | | 7.2 | | $ | 5,456,765 | |
Options Granted | | 8,545 | | 10.37 | – | 11.31 | | 10.68 | | | | | |
Options Exercised | | (171,046 | ) | 2.20 | – | 10.32 | | 5.03 | | | | | |
Options Expired | | (19,509 | ) | 5.30 | – | 10.41 | | 8.60 | | | | | |
Outstanding at December 31, 2005 | | 791,917 | | $ 2.20 | – | 12.04 | | $ | 5.53 | | 6.2 | | $ | 5,673,323 | |
Options Granted | | 30,713 | | 12.70 | – | 14.71 | | 13.45 | | | | | |
Options Exercised | | (51,659 | ) | 2.84 | – | 9.30 | | 5.89 | | | | | |
Options Expired | | (4,325 | ) | 8.77 | – | 11.31 | | 10.64 | | | | | |
Outstanding at December 31, 2006 | | 766,646 | | $ 2.20 | – | 14.71 | | $ | 5.80 | | 5.3 | | $ | 6,305,517 | |
Options Granted | | 103,788 | | 7.46 | – | 13.25 | | 10.98 | | | | | |
Options Exercised | | (128,841 | ) | 2.20 | – | 9.30 | | 4.86 | | | | | |
Options Expired | | (11,535 | ) | 10.79 | – | 13.25 | | 12.57 | | | | | |
Outstanding at December 31, 2007 | | 730,058 | | $ 2.84 | – | 14.71 | | $ | 6.59 | | 5.2 | | $ | 1,981,939 | |
Exercisable at December 31, 2007 | | 612,528 | | $ 2.84 | – | 14.71 | | $ | 5.69 | | 4.4 | | $ | 1,940,339 | |
The following table summarizes information about stock options outstanding at December 31, 2007:
| | Options Outstanding | | Options Exercisable | |
| | | | Weighted Average | | | | | | | |
Range of | | | | Remaining | | Weighted | | | | Weighted | |
Exercise | | Options | | Contractual Life | | Average | | Shares | | Average | |
Prices | | Outstanding | | (in years) | | Exercise Price | | Exercisable | | Exercise Price | |
$ | 0.00 - 4.00 | | | 274,795 | | 3.4 | | $ | 3.20 | | 274,795 | | $ | 3.20 | |
| 4.01 - 8.00 | | | 198,861 | | 5.7 | | 5.86 | | 158,861 | | 5.46 | |
| 8.01 - 12.00 | | | 168,056 | | 5.7 | | 9.48 | | 165,601 | | 9.47 | |
| 12.01 - 16.00 | | | 88,346 | | 8.8 | | 13.29 | | 13,271 | | 12.99 | |
| | | 730,058 | | 5.2 | | $ | 6.59 | | 612,528 | | $ | 5.69 | |
Compensation expense related to stock options totaled $112 thousand, $25 thousand and $0 in 2007, 2006 and 2005, respectively. As of December 31, 2007, there was approximately $280 thousand of unrecognized compensation cost related to nonvested share-based compensation arrangements granted under the Company’s stock incentive plans. That cost is expected to be recognized over a weighted average period of 1.3 years.
The total intrinsic value (spread between the market value and exercise price) of the stock options exercised during 2007, 2006 and 2005 was $835 thousand, $398 thousand and $1.04 million, respectively.
Restricted Stock Awards
Restricted stock awards vest over a period of 4 years and are recognized as compensation to the employees over the vesting period. Restricted stock awards granted during the past three years include:
41
Grant Year | | Shares | | Average Grant Date Fair Value | |
2007 | | 18,613 | | $ | 13.17 | |
2006 | | 11,805 | | $ | 13.59 | |
2005 | | 21,230 | | $ | 12.33 | |
Expense related to the restricted stock awards totaled $180 thousand, $112 thousand and $19 thousand for 2007, 2006 and 2005, respectively. As of December 31, 2007, there was approximately $385 thousand of unrecognized compensation cost related to nonvested restricted stock awards granted under the Company’s stock incentive plans. That cost is expected to be recognized over a weighted average period of 1.4 years.
As of December 31, 2007, 115,763 shares of restricted stock were reserved for issuance, of which 53,258 shares are outstanding, 1,337 shares were issued and 61,168 shares are available for grant.
Transactions under the Company’s restricted stock award plans during the last three years include:
| | | | | | | | Weighted Average | |
| | Number of | | Exercise Price | | Weighted Average | | Remaining Contractual | |
| | Shares | | per Share | | Exercise Price | | Life (in years) | |
Outstanding at December 31, 2004 | | 6,948 | | $ | 11.13 – 11.13 | | $ | 11.13 | | 10.0 | |
Granted | | 21,230 | | 12.33 – 12.33 | | 12.33 | | | |
Issued | | — | | — | | — | | | |
Canceled | | — | | — | | — | | | |
Outstanding at December 31, 2005 | | 28,178 | | $ | 11.13 – 12.33 | | $ | 12.04 | | 9.8 | |
Granted | | 11,805 | | 13.25 – 14.71 | | 13.59 | | | |
Issued | | — | | — | | — | | | |
Canceled | | (2,510 | ) | 11.33 – 12.33 | | 12.06 | | | |
Outstanding at December 31, 2006 | | 37,473 | | $ | 11.13 – 14.71 | | $ | 12.53 | | 8.8 | |
Granted | | 18,613 | | 11.63 – 13.52 | | 13.17 | | | |
Issued | | (1,337 | ) | 11.13 – 13.45 | | 12.04 | | | |
Canceled | | (1,491 | ) | 11.13 – 13.45 | | 11.94 | | | |
Outstanding at December 31, 2007 | | 53,258 | | $ | 11.13 - 14.71 | | $ | 12.78 | | 8.3 | |
Exercisable at December 31, 2007 | | 10,771 | | $ | 11.13 - 14.71 | | $ | 12.23 | | 7.7 | |
The following table summarizes nonvested restricted stock activity for the twelve months ended December 31, 2007:
| | Shares | | Average Grant Date Fair Value | |
Nonvested restricted stock at December 31, 2006 | | 34,000 | | $ | 12.67 | |
Granted | | 18,613 | | 13.17 | |
Vested | | (9,626 | ) | 12.59 | |
Forfeited | | (500 | ) | 11.66 | |
Nonvested restricted stock at December 31, 2007 | | 42,487 | | $ | 12.92 | |
21. Fair Value of Financial Instruments
The fair value estimates for financial instruments are made at a discrete point in time based upon relevant market information and information about the underlying instruments.
Because no market exists for a portion of the Company’s financial instruments, fair value estimates are based on judgment regarding a number of factors. These estimates are subjective in nature and involve some uncertainties. Changes in assumptions and methodologies may have a material effect on these estimated fair values. In addition, reasonable comparability between financial institutions may not be likely due to a wide range of permitted valuation techniques and numerous estimates, which must be made. This lack of uniform valuation methodologies also introduces a greater degree of subjectivity to these estimated fair values.
The following methods and assumptions were used to estimate the fair value of each class of financial instruments for which it is practicable to estimate that value.
Cash and Federal Funds Sold –
For these short-term instruments, the carrying value is a reasonable estimate of fair value.
42
Securities –
For the held to maturity and available for sale portfolios, fair values are based on quoted market prices or dealer quotes. If a quoted market price is not available, fair value is estimated using quoted market prices for similar securities.
Loans –
The fair value of loans is estimated by discounting the future cash flows using current market rates that reflect the credit, collateral and interest rate risk inherent in the loan.
FHLB Stock –
FHLB stock is carried at cost.
SBA Servicing Rights –
The fair value of servicing rights is determined using a discount rate of 15 percent, constant prepayment rate speeds ranging from 15 to 18, and interest strip multiples ranging from 2.85 to 3.25, depending on each individual credit.
Deposit Liabilities –
The fair value of demand deposits and savings accounts is the amount payable on demand at the reporting date. The fair value of fixed-maturity certificates of deposit is estimated by discounting the future cash flows using current market rates.
Borrowings and Subordinated Debentures –
The fair value of borrowings and subordinated debentures is estimated by discounting the projected future cash flows using current market rates.
Accrued Interest –
The carrying amounts of accrued interest approximate fair value.
Unrecognized Financial Instruments –
At December 31, 2007, the Bank had standby letters of credit outstanding of $3.9 million, as compared to $1.6 million at December 31, 2006. The fair value of these commitments is nominal.
Interest Rate Swap Agreements –
Fair values for interest rate swap agreements are based upon the amounts required to settle the contracts. At December 31, 2007, the Company had one interest rate swap agreement with a notional amount of $10.0 million and an unrealized loss relating to the swap of $23 thousand. No interest rate swap agreements existed at December 31, 2006.
Below are the Company’s estimated financial instruments fair values as of December 31, 2007 and 2006:
| | 2007 | | 2006 | |
| | Carrying | | Estimated | | Carrying | | Estimated | |
(In thousands) | | Amount | | Fair Value | | Amount | | Fair Value | |
Financial assets - | | | | | | | | | |
Cash and federal funds sold | | $ | 36,312 | | $ | 36,312 | | $ | 55,436 | | $ | 55,436 | |
Securities held to maturity | | 33,736 | | 33,639 | | 42,815 | | 42,449 | |
Securities available for sale | | 64,855 | | 64,855 | | 62,642 | | 62,642 | |
Loans, net of allowance for loan losses | | 581,749 | | 581,502 | | 500,066 | | 498,022 | |
Accrued interest receivable | | 3,994 | | 3,994 | | 3,926 | | 3,926 | |
FHLB stock | | 4,395 | | 4,395 | | 2,953 | | 2,953 | |
SBA servicing assets | | 2,056 | | 2,056 | | 2,294 | | 2,294 | |
Financial liabilities – | | | | | | | | | |
Total deposits | | 601,268 | | 589,607 | | 566,465 | | 546,009 | |
Total borrowings and subordinated debentures | | 100,465 | | 101,898 | | 79,744 | | 79,156 | |
Accrued interest payable | | 635 | | 635 | | 475 | | 475 | |
| | | | | | | | | | | | | |
43
22. Condensed Financial Statements of Unity Bancorp, Inc. (Parent Company Only)
Balance Sheets
| | December 31, | |
(In thousands) | | 2007 | | 2006 | |
Assets: | | | | | |
Cash | | $ | 433 | | $ | 6,872 | |
Securities available for sale | | 216 | | 270 | |
Capital note due from Bank | | 8,500 | | 14,500 | |
Investment in subsidiaries | | 53,366 | | 48,892 | |
Other assets | | 469 | | 811 | |
Total Assets | | $ | 62,984 | | $ | 71,345 | |
Liabilities and Shareholders’ Equity: | | | | | |
Other liabilities | | $ | 259 | | $ | 373 | |
Other borrowings | | 15,465 | | 24,744 | |
Shareholders’ Equity | | 47,260 | | 46,228 | |
Total Liabilities and Shareholders’ Equity | | $ | 62,984 | | $ | 71,345 | |
Statements of Income
| | December 31, | |
(In thousands) | | 2007 | | 2006 | | 2005 | |
Interest income | | $ | 1,321 | | $ | 859 | | $ | 505 | |
Interest expense | | 1,724 | | 1,206 | | 678 | |
Net interest expense | | (403 | ) | (347 | ) | (173 | ) |
Net security gains | | 22 | | 69 | | 53 | |
Total expense | | (381 | ) | (278 | ) | (120 | ) |
Other expenses | | 39 | | 43 | | 58 | |
Loss before income tax benefit and equity in undistributed income of subsidiary | | (420 | ) | (321 | ) | (178 | ) |
Income tax benefit | | (143 | ) | (113 | ) | (75 | ) |
Loss before equity in undistributed income of subsidiary | | (277 | ) | (208 | ) | (103 | ) |
Equity in undistributed net income of subsidiary | | 5,002 | | 6,053 | | 6,313 | |
Net income | | $ | 4,725 | | $ | 5,845 | | $ | 6,210 | |
Statements of Cash Flows
| | December 31, | |
(In thousands) | | 2007 | | 2006 | | 2005 | |
Operating Activities: | | | | | | | |
| | | | | | | |
Net Income | | $ | 4,725 | | $ | 5,845 | | $ | 6,210 | |
Adjustments to reconcile net income to net cash used in operating activities: | | | | | | | |
Equity in undistributed earnings of subsidiary | | (5,002 | ) | (6,053 | ) | (6,313 | ) |
Gain on sale of securities available for sale | | (22 | ) | (69 | ) | (53 | ) |
Decrease (increase) in other assets | | 62 | | (49 | ) | 51 | |
(Decrease) increase in other liabilities | | (421 | ) | 23 | | 2 | |
Net cash used in operating activities | | (658 | ) | (303 | ) | (103 | ) |
Investing Activities: | | | | | | | |
Sales and maturities of securities available for sale | | 108 | | 252 | | 148 | |
Purchases of securities available for sale | | (59 | ) | — | | (136 | ) |
Dividend from Bank | | 1,000 | | — | | — | |
Repayment (advance) of Capital Note to Bank | | 6,000 | | (8,500 | ) | — | |
Net cash provided by (used in) investing activities | | 7,049 | | (8,248 | ) | 12 | |
Financing Activities: | | | | | | | |
(Redemption) issuance of subordinated debentures | | (9,000 | ) | 15,000 | | — | |
Proceeds from issuance of common stock, net | | 1,119 | | 781 | | 853 | |
Purchase common stock, net | | (3,927 | ) | — | | (242 | ) |
Cash dividends on common stock | | (1,022 | ) | (1,291 | ) | (1,079 | ) |
Net Cash (used in) provided by financing activities | | (12,830 | ) | 14,490 | | (468 | ) |
Net (decrease) increase in cash and cash equivalents | | (6,439 | ) | 5,939 | | (559 | ) |
Cash, beginning of year | | 6,872 | | 933 | | 1,492 | |
Cash, end-of-year | | $ | 433 | | $ | 6,872 | | $ | 933 | |
Supplemental disclosures: Interest paid | | $ | 1,690 | | $ | 1,179 | | $ | 667 | |
44
23. Other Comprehensive Income (Loss)
(In thousands)
Net unrealized security gains (losses) | | Pre-tax | | Tax | | After-tax | |
Balance at January 1, 2005 | | | | | | $ | (484 | ) |
Unrealized holding loss on securities arising during the period | | (1,004 | ) | (382 | ) | (622 | ) |
Less: Reclassification adjustment for gains included in net income | | 69 | | 26 | | 43 | |
Net unrealized loss on securities arising during the period | | (1,073 | ) | (408 | ) | (665 | ) |
Balance at December 31, 2005 | | | | | | $ | (1,149 | ) |
Unrealized holding gains on securities arising during the period | | 593 | | 222 | | 371 | |
Less: Reclassification adjustment for gains included in net income | | 69 | | 23 | | 46 | |
Net unrealized gains on securities arising during the period | | 524 | | 199 | | 325 | |
Balance at December 31, 2006 | | | | | | $ | (824 | ) |
Unrealized holding gains on securities arising during the period | | 183 | | 215 | | (32 | ) |
Less: Reclassification adjustment for gains included in net income | | (357 | ) | 23 | | (380 | ) |
Net unrealized gains on securities arising during the period | | 540 | | 192 | | 348 | |
Balance at December 31, 2007 | | | | | | $ | (476 | ) |
Net unrealized losses on cash flow hedges | | Pre-tax | | Tax | | After-tax | |
Balance at January 1, 2007 | | — | | — | | $ | — | |
Unrealized holding loss arising during the period | | (23 | ) | (9 | ) | (14 | ) |
Net unrealized loss on cash flow hedge | | | | | | (14 | ) |
Balance at December 31, 2007 | | | | | | $ | (14 | ) |
45
Quarterly Financial Information (Unaudited)
The following quarterly financial information for the years ended December 31, 2007 and 2006 is unaudited. However, in the opinion of management, all adjustments, which include normal recurring adjustments necessary to present fairly the results of operations for the periods, are reflected. Results of operations for the periods are not necessarily indicative of the results of the entire year or any other interim period.
(In thousands, except per share data)
| | | | | | | | | |
2007 | | March 31 | | June 30 | | September 30 | | December 31 | |
Total interest income | | $ | 11,702 | | $ | 11,975 | | $ | 12,566 | | $ | 12,657 | |
Total interest expense | | 5,683 | | 5,888 | | 6,593 | | 6,310 | |
Net interest income | | 6,019 | | 6,087 | | 5,973 | | 6,347 | |
Provision for loan losses | | 200 | | 350 | | 450 | | 550 | |
Net interest income after provision for loan losses | | 5,819 | | 5,737 | | 5,523 | | 5,797 | |
Total noninterest income | | 1,679 | | 1,748 | | 1,460 | | 1,053 | |
Total noninterest expense | | 5,417 | | 5,267 | | 5,501 | | 5,928 | |
Net income before tax | | 2,081 | | 2,218 | | 1,482 | | 922 | |
Income tax provision | | 630 | | 676 | | 430 | | 242 | |
Net income | | 1,451 | | 1,542 | | 1,052 | | 680 | |
Basic income per common share | | $ | 0.21 | | $ | 0.22 | | $ | 0.15 | | $ | 0.10 | |
Diluted income per common share | | $ | 0.20 | | $ | 0.21 | | $ | 0.15 | | $ | 0.10 | |
(In thousands, except per share data)
| | | | | | | | | |
2006 | | March 31 | | June 30 | | September 30 | | December 31 | |
Total interest income | | $ | 10,000 | | $ | 10,644 | | $ | 11,258 | | $ | 11,275 | |
Total interest expense | | 3,947 | | 4,611 | | 5,314 | | 5,560 | |
Net interest income | | 6,053 | | 6,033 | | 5,944 | | 5,715 | |
Provision for loan losses | | 300 | | 250 | | 400 | | 600 | |
Net interest income after provision for loan losses | | 5,753 | | 5,783 | | 5,544 | | 5,115 | |
Total noninterest income | | 2,002 | | 1,647 | | 2,243 | | 1,746 | |
Total noninterest expense | | 5,256 | | 5,001 | | 5,316 | | 5,472 | |
Net income before tax | | 2,499 | | 2,429 | | 2,471 | | 1,389 | |
Income tax provision | | 842 | | 792 | | 844 | | 465 | |
Net income | | 1,657 | | 1,637 | | 1,627 | | 924 | |
Basic income per common share | | $ | 0.24 | | $ | 0.24 | | $ | 0.24 | | $ | 0.13 | |
Diluted income per common share | | $ | 0.23 | | $ | 0.23 | | $ | 0.22 | | $ | 0.13 | |
46
SELECTED CONSOLIDATED FINANCIAL DATA
| | At or for the Years Ended December 31st | |
(In thousands, except per share data) | | 2007 | | 2006 | | 2005 | | 2004 | | 2003 | |
Selected Results of Operations | | | | | | | | | | | |
Interest income | | $ | 48,900 | | $ | 43,177 | | $ | 33,837 | | $ | 26,166 | | $ | 24,895 | |
Interest expense | | 24,474 | | 19,432 | | 11,603 | | 7,008 | | 7,028 | |
Net interest income | | 24,426 | | 23,745 | | 22,234 | | 19,158 | | 17,867 | |
Provision for loan losses | | 1,550 | | 1,550 | | 1,850 | | 1,175 | | 1,600 | |
Noninterest income | | 5,940 | | 7,638 | | 8,190 | | 7,629 | | 8,343 | |
Noninterest expense | | 22,113 | | 21,045 | | 18,676 | | 17,230 | | 17,329 | |
Provision for income taxes | | 1,978 | | 2,943 | | 3,688 | | 3,052 | | 2,698 | |
Net income | | 4,725 | | 5,845 | | 6,210 | | 5,330 | | 4,583 | |
Per Share Data | | | | | | | | | | | |
Net income per common share (basic) | | $ | 0.68 | | $ | 0.85 | | $ | 0.92 | | $ | 0.80 | | $ | 0.70 | |
Net income per common share (diluted) | | 0.66 | | 0.81 | | 0.87 | | 0.75 | | 0.67 | |
Book value per common share | | 7.03 | | 6.66 | | 5.96 | | 5.36 | | 4.67 | |
Market value per common share | | 8.50 | | 14.01 | | 12.70 | | 11.06 | | 9.40 | |
Cash dividends declared on common shares | | 0.20 | | 0.19 | | 0.17 | | 0.13 | | 0.05 | |
Selected Balance Sheet Data | | | | | | | | | | | |
Total assets | | $ | 752,196 | | $ | 694,106 | | $ | 614,172 | | $ | 515,417 | | $ | 467,419 | |
Loans | | 590,132 | | 507,690 | | 448,567 | | 373,580 | | 339,755 | |
Allowance for loan losses | | 8,383 | | 7,624 | | 6,892 | | 5,856 | | 5,352 | |
Securities | | 98,591 | | 105,457 | | 104,160 | | 100,357 | | 91,279 | |
Deposits | | 601,268 | | 566,465 | | 521,860 | | 433,898 | | 414,982 | |
Borrowings | | 100,465 | | 79,744 | | 49,279 | | 44,279 | | 19,279 | |
Shareholders’ equity | | 47,260 | | 46,228 | | 40,929 | | 35,868 | | 30,762 | |
Common shares outstanding | | 6,727 | | 6,949 | | 6,863 | | 6,689 | | 6,582 | |
Performance Ratios | | | | | | | | | | | |
Return on average assets | | 0.66 | % | 0.90 | % | 1.10 | % | 1.10 | % | 1.04 | % |
Return on average equity | | 10.11 | | 13.56 | | 16.29 | | 16.32 | | 16.05 | |
Efficiency ratio | | 71.48 | | 67.21 | | 61.53 | | 64.51 | | 66.59 | |
Net interest spread | | 3.07 | | 3.33 | | 3.74 | | 3.77 | | 3.85 | |
Net interest margin | | 3.62 | | 3.87 | | 4.17 | | 4.18 | | 4.28 | |
Asset Quality Ratios | | | | | | | | | | | |
Allowance for loan losses to loans | | 1.42 | % | 1.50 | % | 1.54 | % | 1.57 | % | 1.58 | % |
Allowance for loan losses to nonperforming loans | | 153.49 | | 85.58 | | 158.04 | | 143.14 | | 99.20 | |
Nonperforming loans to total loans | | 0.93 | | 1.75 | | 0.97 | | 1.10 | | 1.59 | |
Nonperforming assets to total loans and OREO | | 0.94 | | 1.80 | | 1.01 | | 1.19 | | 1.68 | |
Net charge-offs to average loans | | 0.14 | | 0.17 | | 0.20 | | 0.19 | | 0.11 | |
Capital Ratios – Company | | | | | | | | | | | |
Leverage ratio | | 8.25 | % | 9.08 | % | 8.27 | % | 9.09 | % | 9.02 | % |
Tier I risk-based capital ratio | | 9.81 | | 10.80 | | 9.98 | | 11.14 | | 11.28 | |
Total risk-based capital ratio | | 11.06 | | 13.60 | | 11.23 | | 12.39 | | 12.53 | |
Capital Ratios – Bank | | | | | | | | | | | |
Leverage ratio | | 7.06 | % | 7.20 | % | 7.01 | % | 7.53 | % | 7.22 | % |
Tier I risk-based capital ratio | | 8.39 | | 8.55 | | 8.51 | | 9.22 | | 9.05 | |
Total risk-based capital ratio | | 11.00 | | 12.38 | | 10.97 | | 11.95 | | 11.98 | |
All share amounts have been restated to include the effect of the 5% stock distributions paid on June 29, 2007, June 30, 2006, June 30, 2005, June 30, 2004 and March 12, 2003.
47
CORPORATE INFORMATION
Unity Bancorp, Inc.
Company Headquarters
Unity Bancorp, Inc.
64 Old Highway 22
Clinton, New Jersey 08809
Counsel
Windels Marx Lane & Mittendorf, LLP
New Brunswick, New Jersey
Independent Registered Public Accounting Firm
McGladrey & Pullen, LLP
Blue Bell, Pennsylvania
Registrar & Transfer Agent
Shareholder address changes or inquiries regarding shareholder accounts and stock transfers should be directed to:
Registrar and Transfer Company
10 Commerce Drive
Cranford, New Jersey 07016-3572
800.866.1340
Investor and Media Inquiries
Analysts, institutional investors, individual shareholders and media representatives should contact:
Alan J. Bedner
Unity Bancorp, Inc.
64 Old Highway
22 Clinton, New Jersey 08809
908.713.4308
alan.bedner@unitybank.com
Web Information
Information on financial results, products and services, and branch locations is available on the internet at:
unitybank.com or email us at:
info@unitybank.com.
Financial Information
Copies of the Company’s annual report on Form 10-K filed with the Securities and Exchange Commission may be obtained:
· by writing to Alan J. Bedner, CFO at Company headquarters or email alan.bedner@unitybank.com.
· electronically at the SEC’s home page at www.sec.gov.
Annual Meeting of Shareholders
Shareholders are cordially invited to the Annual Meeting of Shareholders. The Meeting will convene at 3:00 pm, Thursday, April 24, 2008, at The Grand Colonial, Hampton, NJ.
Stock Listing
Unity Bancorp, Inc. common stock is traded on the NASDAQ under the symbol “UNTY”.
Common Stock Prices
The table below sets forth by quarter the range of high, low and quarter-end closing sale prices for Unity Bancorp, Inc’s common stock.
| | | | | | | | Cash | |
| | | | | | | | Dividend | |
Quarter | | High | | Low | | Close | | Declared | |
| | | | | | | | | |
2007 | | | | | | | | | |
Fourth | | $ | 11.32 | | $ | 7.30 | | $ | 8.50 | | $ | 0.05 | |
Third | | 11.79 | | 9.74 | | 11.08 | | 0.05 | |
Second | | 12.00 | | 11.28 | | 11.45 | | 0.05 | |
First | | 14.54 | | 11.53 | | 11.86 | | 0.05 | |
| | | | | | | | | |
2006 | | | | | | | | | |
Fourth | | $ | 15.14 | | $ | 13.10 | | $ | 14.01 | | $ | 0.05 | |
Third | | 16.35 | | 14.29 | | 14.55 | | 0.05 | |
Second | | 16.78 | | 13.95 | | 14.75 | | 0.05 | |
First | | 15.41 | | 12.52 | | 14.56 | | 0.04 | |
Numbers have been restated for 5% Stock Dividend
As of March 1, 2008 there were 515 holders of Unity Bancorp, Inc.’s common stock.
48