Exhibit 99.2
Fourth Quarter 2009
Supplemental Financial Information
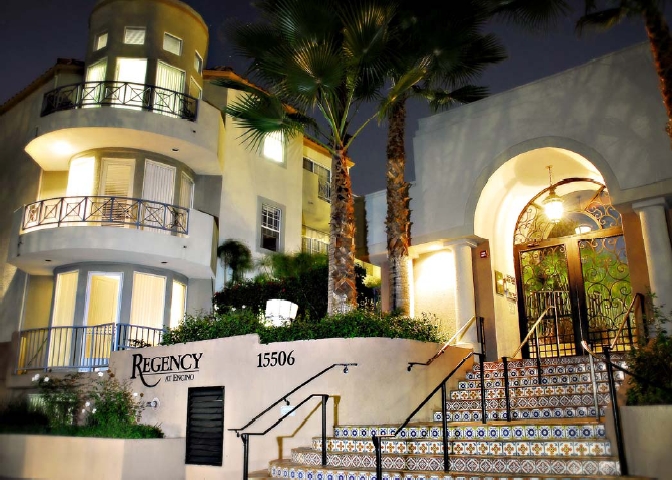
In the fourth quarter, the Company acquired Regency at Encino, a 75-unit community located in Encino, California for $16 million. The property features several units with upgraded appliances, countertops, cabinets, crown molding, and flooring. Community amenities include a pool and spa and secure access for residents. Additionally, the property is conveniently located close to multiple job centers and local shopping and dining.
| | |
Consolidated Operating Results | |
Consolidated Funds From Operations | |
Consolidated Balance Sheets | |
| |
| |
Property Operating Results – Quarter ended December 31, 2009 and 2008 | |
Property Operating Results –Year ended December 31, 2009 and 2008 | |
Revenue by County – Quarters ended December 31, 2009, December 31, 2008 and September 30, 2009 | |
Revenue by County –Year ended December 31, 2009 and 2008 | |
| |
| |
| |
Summary of Consolidated Co-Investments and Noncontrolling Interest | |
Income from Discontinued Operations and Selected Financial Data | |
New Residential Supply Data | |
Market Forecast (Supply, Jobs and Apartment Market Conditions) | |
Exhibit A - Property List by Region | |
E S S E X P R O P E R T Y T R U S T, I N C.
| Consolidated Operating Results | | Three Months Ended | | | Twelve Months Ended | |
| (Dollars in thousands, except per share amounts) | | December 31, | | | December 31, | |
| | | 2009 | | | 2008 | | | 2009 | | | 2008 | |
| | | | | | | | | | | | | |
| Revenues: | | | | | | | | | | | | |
| Rental and other property | | $ | 100,004 | | | $ | 103,711 | | | $ | 407,064 | | | $ | 403,268 | |
| Management and other fees from affiliates | | | 948 | | | | 1,201 | | | | 4,325 | | | | 5,166 | |
| | | | 100,952 | | | | 104,912 | | | | 411,389 | | | | 408,434 | |
| | | | | | | | | | | | | | | | | |
| Expenses: | | | | | | | | | | | | | | | | |
| Property operating | | | 36,645 | | | | 34,090 | | | | 139,711 | | | | 132,417 | |
| Depreciation and amortization | | | 30,315 | | | | 28,000 | | | | 118,027 | | | | 109,701 | |
| Interest | | | 22,336 | | | | 22,046 | | | | 86,016 | | | | 85,063 | |
| General and administrative | | | 5,569 | | | | 7,324 | | | | 23,704 | | | | 26,984 | |
| Impairment and other charges | | | 550 | | | | 1,350 | | | | 17,442 | | | | 1,350 | |
| | | | 95,415 | | | | 92,810 | | | | 384,900 | | | | 355,515 | |
| Earnings from operations | | | 5,537 | | | | 12,102 | | | | 26,489 | | | | 52,919 | |
| | | | | | | | | | | | | | | | | |
| Interest and other income | | | 3,519 | | | | 3,295 | | | | 13,040 | | | | 11,337 | |
| Equity income in co-investments | | | 5 | | | | 495 | | | | 670 | | | | 7,820 | |
| Gain (loss) on early retirement of debt | | | (1,374 | ) | | | 3,997 | | | | 4,750 | | | | 3,997 | |
| Gain on sale of real estate | | | - | | | | 2,132 | | | | 103 | | | | 4,578 | |
| Income before discontinued operations | | | 7,687 | | | | 22,021 | | | | 45,052 | | | | 80,651 | |
| Income from discontinued operations | | | 2,913 | | | | 3,943 | | | | 8,687 | | | | 3,744 | |
| Net income | | | 10,600 | | | | 25,964 | | | | 53,739 | | | | 84,395 | |
| Net income attributable to noncontrolling interest | | | (3,647 | ) | | | (5,700 | ) | | | (16,631 | ) | | | (22,255 | ) |
| Net income attributable to controlling interest | | | 6,953 | | | | 20,264 | | | | 37,108 | | | | 62,140 | |
| Dividends to preferred stockholders | | | (549 | ) | | | (2,310 | ) | | | (4,860 | ) | | | (9,241 | ) |
| Excess of the carrying amount of preferred stock redeemed over the cash paid to redeem preferred stock | | | 377 | | | | - | | | | 49,952 | | | | - | |
| Net income available to common stockholders | | $ | 6,781 | | | $ | 17,954 | | | $ | 82,200 | | | $ | 52,899 | |
| | | | | | | | | | | | | | | | | |
| Net income per share - basic | | $ | 0.24 | | | $ | 0.69 | | | $ | 3.01 | | | $ | 2.10 | |
| | | | | | | | | | | | | | | | | |
| Net income per share - diluted | | $ | 0.24 | | | $ | 0.68 | | | $ | 2.91 | | | $ | 2.09 | |
See Company's 10-K and 10-Q for additional disclosures
S-1
E S S E X P R O P E R T Y T R U S T, I N C.
| Consolidated Operating Results | | Three Months Ended | | | Twelve Months Ended | |
| Selected Line Item Detail | | December 31, | | | December 31, | |
| (Dollars in thousands) | | 2009 | | | 2008 | | | 2009 | | | 2008 | |
| | | | | | | | | | | | | |
| Rental and other property | | | | | | | | | | | | |
| Rental | | $ | 93,276 | | | $ | 97,479 | | | $ | 380,285 | | | $ | 380,003 | |
| Other property | | | 6,728 | | | | 6,232 | | | | 26,779 | | | | 23,265 | |
| Rental and other property | | $ | 100,004 | | | $ | 103,711 | | | $ | 407,064 | | | $ | 403,268 | |
| | | | | | | | | | | | | | | | | |
| Management and other fees from affiliates | | | | | | | | | | | | | | | | |
| Management | | $ | 882 | | | $ | 822 | | | $ | 3,505 | | | $ | 3,217 | |
| Development and redevelopment | | | 66 | | | | 379 | | | | 820 | | | | 1,949 | |
| Management and other fees from affiliates | | $ | 948 | | | $ | 1,201 | | | $ | 4,325 | | | $ | 5,166 | |
| | | | | | | | | | | | | | | | | |
| Property operating expenses | | | | | | | | | | | | | | | | |
| Maintenance and repairs | | $ | 8,390 | | | $ | 7,628 | | | $ | 30,543 | | | $ | 28,862 | |
| Real estate taxes | | | 9,524 | | | | 8,496 | | | | 36,772 | | | | 33,107 | |
| Utilities | | | 6,828 | | | | 6,556 | | | | 26,673 | | | | 26,173 | |
| Administrative | | | 8,918 | | | | 8,548 | | | | 33,591 | | | | 33,378 | |
| Management fees and insurance | | | 2,985 | | | | 2,862 | | | | 12,132 | | | | 10,897 | |
| Property operating expenses | | $ | 36,645 | | | $ | 34,090 | | | $ | 139,711 | | | $ | 132,417 | |
| | | | | | | | | | | | | | | | | |
| General and administrative | | | | | | | | | | | | | | | | |
| General and administrative | | $ | 8,925 | | | $ | 10,932 | | | $ | 37,319 | | | $ | 41,403 | |
| Allocated to property operating expenses - administrative | | | (2,462 | ) | | | (2,238 | ) | | | (9,817 | ) | | | (9,014 | ) |
| Capitalized to real estate | | | (894 | ) | | | (1,370 | ) | | | (3,798 | ) | | | (5,405 | ) |
| Net general and administrative | | $ | 5,569 | | | $ | 7,324 | | | $ | 23,704 | | | $ | 26,984 | |
| | | | | | | | | | | | | | | | | |
| Interest and other income | | | | | | | | | | | | | | | | |
| Interest and other income, net | | $ | 3,519 | | | $ | 1,469 | | | $ | 11,841 | | | $ | 4,811 | |
| Lease income, net | | | - | | | | 1,826 | | | | 185 | | | | 6,526 | |
| Gain from sale of marketable securities | | | - | | | | - | | | | 1,014 | | | | - | |
| Interest and other income | | $ | 3,519 | | | $ | 3,295 | | | $ | 13,040 | | | $ | 11,337 | |
| | | | | | | | | | | | | | | | | |
| Noncontrolling interest | | | | | | | | | | | | | | | | |
| Limited partners of Essex Portfolio, L.P. | | $ | 585 | | | $ | 1,919 | | | $ | 4,225 | | | $ | 6,404 | |
| DownREIT limited partners' distributions | | | 1,099 | | | | 1,108 | | | | 4,431 | | | | 4,484 | |
| Perpetual preferred distributions | | | 1,575 | | | | 2,231 | | | | 6,300 | | | | 9,909 | |
| Third-party ownership interest | | | 388 | | | | 442 | | | | 1,675 | | | | 1,458 | |
| Noncontrolling interest | | $ | 3,647 | | | $ | 5,700 | | | $ | 16,631 | | | $ | 22,255 | |
See Company's 10-K and 10-Q for additional disclosures
S-2
E S S E X P R O P E R T Y T R U S T, I N C.
| Consolidated Funds From Operations | | Three Months Ended | | | | | | Twelve Months Ended | | | | |
| (Dollars in thousands, except share and per share amounts) | | December 31, | | | | | | December 31, | | | | |
| | | 2009 | | | 2008 | | | % Change | | | 2009 | | | 2008 | | | % Change | |
| | | | | | | | | | | | | | | | | | | |
| Funds from operations | | | | | | | | | | | | | | | | | | |
| Net income available to common stockholders | | $ | 6,781 | | | $ | 17,954 | | | | | | $ | 82,200 | | | $ | 52,899 | | | | |
| Adjustments: | | | | | | | | | | | | | | | | | | | | | | |
| Depreciation and amortization | | | 30,349 | | | | 28,296 | | | | | | | 118,522 | | | | 113,294 | | | | |
| Gains not included in FFO, net of disposition costs (1) | | | (2,852 | ) | | | (5,356 | ) | | | | | | (7,943 | ) | | | (7,849 | ) | | | |
| Noncontrolling interest and co-investments (2) | | | 1,510 | | | | 2,733 | | | | | | | 7,607 | | | | 9,181 | | | | |
| Funds from operations | | $ | 35,788 | | | $ | 43,627 | | | | | | $ | 200,386 | | | $ | 167,525 | | | | |
| FFO per share-diluted | | $ | 1.16 | | | $ | 1.52 | | | | -23.9 | % | | $ | 6.74 | | | $ | 6.02 | | | | 11.8 | % |
| | | | | | | | | | | | | | | | | | | | | | | | | |
| Components of the change in FFO | | | | | | | | | | | | | | | | | | | | | | | | |
| Non-recurring items: | | | | | | | | | | | | | | | | | | | | | | | | |
| (Gain) loss on early retirement of debt | | | 1,374 | | | | (3,997 | ) | | | | | | | (4,750 | ) | | | (3,997 | ) | | | | |
| Severance payments | | | 550 | | | | 700 | | | | | | | | 550 | | | | 700 | | | | | |
| Redemption of Series G preferred stock at a discount | | | (377 | ) | | | - | | | | | | | | (49,952 | ) | | | - | | | | | |
| Impairment of development projects | | | - | | | | - | | | | | | | | 12,428 | | | | - | | | | | |
| Cancellation of Outperformance Plan | | | - | | | | | | | | | | | | 3,808 | | | | - | | | | | |
| Loan loss reserves | | | - | | | | 650 | | | | | | | | 620 | | | | 650 | | | | | |
| Write-off of deferred charges | | | - | | | | - | | | | | | | | - | | | | 245 | | | | | |
| Gain on sales of marketable securities | | | - | | | | - | | | | | | | | (1,014 | ) | | | - | | | | | |
| Income generated from TRS activities | | | - | | | | (147 | ) | | | | | | | (588 | ) | | | (147 | ) | | | | |
| Joint venture - preferred interest | | | - | | | | - | | | | | | | | - | | | | (6,318 | ) | | | | |
| Funds from operations excluding non-recurring items | | | 37,335 | | | | 40,833 | | | | | | | | 161,488 | | | | 158,658 | | | | | |
| FFO excluding non-recurring items per share-diluted | | $ | 1.21 | | | $ | 1.42 | | | | -15.2 | % | | $ | 5.43 | | | $ | 5.71 | | | | -4.8 | % |
| | | | | | | | | | | | | | | | | | | | | | | | | |
| Changes in recurring items: | | | | | | | | | | | | | | | | | | | | | | | | |
| Same-property NOI | | $ | (6,874 | ) | | | | | | | | | | $ | (11,491 | ) | | | | | | | | |
| Non-same property NOI | | | 612 | | | | | | | | | | | | 7,993 | | | | | | | | | |
| Management and other fees from affiliates | | | (253 | ) | | | | | | | | | | | (841 | ) | | | | | | | | |
| Interest and other income | | | 224 | | | | | | | | | | | | 101 | | | | | | | | | |
| Interest expense | | | (290 | ) | | | | | | | | | | | (953 | ) | | | | | | | | |
| Dividends to preferred stockholders | | | 1,761 | | | | | | | | | | | | 4,381 | | | | | | | | | |
| General and administrative | | | 1,755 | | | | | | | | | | | | 3,280 | | | | | | | | | |
| Other items, net | | | (433 | ) | | | | | | | | | | | 360 | | | | | | | | | |
| | | $ | (3,498 | ) | | | | | | | | | | $ | 2,830 | | | | | | | | | |
| | | | | | | | | | | | | | | | | | | | | | | | | |
| Weighted average number of shares outstanding diluted (3) | | | 30,893,169 | | | | 28,663,993 | | | | | | | | 29,746,614 | | | | 27,807,946 | | | | | |
| (1) | Internal disposition costs relate to a disposition incentive program established to pay incremental bonuses for the sale of certain of the Company's communities that are part of the program. |
| (2) | Amount includes the following adjustments for the three and twelve months ended December 31, 2009: (i) noncontrolling interest related to Operating Partnership units totaling $0.6 million and $4.2 million, respectively, (ii) add back depreciation from unconsolidated co-investments and less depreciation attributable to third party ownership of consolidated co-investments totaling $0.9 million and $3.4 million, respectively. |
| (3) | Assumes conversion of the weighted average operating partnership interests in the Operating Partnership into shares of the Company's common stock. |
See Company's 10-K and 10-Q for additional disclosures
S-3
E S S E X P R O P E R T Y T R U S T, I N C.
| Consolidated Balance Sheets | | | | | | |
| (Dollars in thousands) | | | | | | |
| | | December 31, 2009 | | | December 31, 2008 | |
| | | | | | | |
| Real Estate: | | | | | | |
| Land and land improvements | | $ | 684,955 | | | $ | 683,876 | |
| Buildings and improvements | | | 2,727,975 | | | | 2,595,912 | |
| | | | 3,412,930 | | | | 3,279,788 | |
| Less: accumulated depreciation | | | (749,464 | ) | | | (640,026 | ) |
| | | | 2,663,466 | | | | 2,639,762 | |
| Real estate under development | | | 274,965 | | | | 272,273 | |
| Co-investments | | | 70,783 | | | | 76,346 | |
| | | | 3,009,214 | | | | 2,988,381 | |
| Cash and cash equivalents | | | 37,934 | | | | 54,719 | |
| Marketable securities | | | 134,844 | | | | 23,886 | |
| Funds held by 1031 exchange facilitator | | | - | | | | 21,424 | |
| Notes and other receivables | | | 36,305 | | | | 47,637 | |
| Other assets | | | 36,340 | | | | 28,776 | |
| Total assets | | $ | 3,254,637 | | | $ | 3,164,823 | |
| | | | | | | | | |
| Mortgage notes payable | | $ | 1,603,549 | | | $ | 1,468,931 | |
| Lines of credit | | | 239,000 | | | | 120,000 | |
| Exchangeable bonds | | | 4,893 | | | | 165,457 | |
| Cash flow hedge liabilities | | | 30,156 | | | | 73,129 | |
| Other liabilities | | | 99,149 | | | | 105,396 | |
| Total liabilities | | | 1,976,747 | | | | 1,932,913 | |
| | | | | | | | | |
| Series G cumulative convertible preferred stock, carrying value | | | 4,349 | | | | 145,912 | |
| | | | | | | | | |
| Stockholders' equity and noncontrolling interest: | | | | | | | | |
| Common stock | | | 3 | | | | 3 | |
| Series F cumulative redeemable preferred stock, liquidation value | | | 25,000 | | | | 25,000 | |
| Additional paid-in-capital | | | 1,275,251 | | | | 1,043,984 | |
| Distributions in excess of accumulated earnings | | | (222,952 | ) | | | (141,336 | ) |
| Accumulated other comprehensive (loss) income | | | (24,206 | ) | | | (75,424 | ) |
| Total stockholders' equity | | | 1,053,096 | | | | 852,227 | |
| Noncontrolling interest | | | 220,445 | | | | 233,771 | |
| Total stockholders' equity and noncontrolling interest | | | 1,273,541 | | | | 1,085,998 | |
| Total liabilities and equity | | $ | 3,254,637 | | | $ | 3,164,823 | |
See Company's 10-K and 10-Q for additional disclosures
S-4
E S S E X P R O P E R T Y T R U S T, I N C.
Debt Summary - December 31, 2009
| | | | | | | | | | | | | | | | |
| | | | | | | | | | | | | | | | |
| | | Percentage of Total Debt | | | Balance Outstanding | | | | Weighted Average Interest Rate | | | | Weighted Average Maturity In Years | |
| Mortgage notes payable | | | | | | | | | | | | | | | |
| Fixed rate - secured | | 73 | % | | $ | 1,351,953 | | | | 6.1 | % | | | 5.6 | |
| Variable rate - secured (1) | | 14 | % | | | 251,596 | | | | 2.1 | % | | | 19.5 | |
| Total mortgage notes payable | | 87 | % | | | 1,603,549 | | | | 5.5 | % | | | 7.8 | |
| | | | | | | | | | | | | | | | |
| Exchangeable bonds - unsecured (2) | | 0 | % | | | 4,893 | | | | 5.8 | % | | | | |
| | | | | | | | | | | | | | | | |
| Line of credit - secured (3) | | 12 | % | | | 229,000 | | | | 1.6 | % | | | | |
| Line of credit - unsecured (4) | | 1 | % | | | 10,000 | | | | 3.4 | % | | | | |
| Total lines of credit | | 13 | % | | | 239,000 | | | | 1.7 | % | | | | |
| | | | | | | | | | | | | | | | |
| Total debt | | 100 | % | | $ | 1,847,442 | | | | 5.0 | % | | | | |
| | | | | | | | | | | | | | | | |
| | | | | | | | | | | Weighted | | | | | |
| Scheduled principal payments (excludes lines of credit) | | | | | | | | Average | | | | | |
| | | | | | | | | | | Interest Rate | | | | | |
| | | 2010 | (2) | | $ | 160,762 | | | | 7.6 | % | | | | |
| | | 2011 | | | | 174,107 | | | | 5.7 | % | | | | |
| | | 2012 | | | | 31,303 | | | | 5.4 | % | | | | |
| | | 2013 | | | | 188,882 | | | | 5.8 | % | | | | |
| | | 2014 | | | | 62,272 | | | | 7.3 | % | | | | |
| Thereafter | | | | 991,116 | | | | 4.8 | % | | | | |
| Total | | | $ | 1,608,442 | | | | 5.4 | % | | | | |
Capitalized interest for the three and twelve months ended December 31, 2009 was approximately $2.1 million and $10.5 million, respectively.
| | (1) | $214.1 million of the variable rate debt is tax exempt to the note holders, and $197.1 million of the tax exempt debt is subject to interest rate protection agreements. |
| | (2) | Exchangeable bonds mature in November 2025, but the bonds are subject to a repurchase for cash at the option of the holder on November 1, 2010. The pay rate on the bonds is 3.625%, and effective January 2009 in accordance with the accounting pronouncement for convertible debt, the bonds have been discounted to yield 5.75%. This is an unsecured obligation of the operating partnership, and is fully and unconditionally guaranteed by the Company. |
| | (3) | Secured line of credit facility is $250 million and matures in December 2013. This line is secured by eleven of the Company's apartment communities and the underlying interest rate is currently the Freddie Mac Reference Rate plus .99% to 1.50%. |
| | (4) | Unsecured line of credit facility is $200 million and matures in December 2010 with two one-year extensions, exercisable at the Company's option. The underlying interest rate on this line is based on a tiered rate structure tied to the Company's corporate ratings and is currently at LIBOR plus 3.00%. |
See Company's 10-K and 10-Q for additional disclosures
S-5
E S S E X P R O P E R T Y T R U S T, I N C.
| Capitalization - December 31, 2009 | | | | |
| (Dollars and shares in thousands, except per share amounts) | | | | |
| | | | | |
| | | | | |
| | | | | |
| Total debt | | $ | 1,847,442 | | |
| | | | | | |
| | | | | | |
| Common stock and potentially dilutive securities | | | | | |
| Common stock outstanding | | | 28,850 | | |
| Limited partnership units (1) | | | 2,398 | | |
| Options-treasury method | | | 51 | | |
| Total common stock and potentially dilutive securities | | | 31,299 | | shares |
| | | | | | |
| Common stock price per share as of December 31, 2009 | | $ | 83.65 | | |
| | | | | | |
| Market value of common stock and potentially dilutive securities | | $ | 2,618,161 | | |
| | | | | | |
| Preferred units/stock | | $ | 111,514 | | |
| | | | | | |
| Total equity capitalization | | $ | 2,729,675 | | |
| | | | | | |
| Total market capitalization | | $ | 4,577,117 | | |
| | | | | | |
| Ratio of debt to total market capitalization | | | 40.4 | % | |
| (1) | Assumes conversion of all outstanding operating partnership interests in the Operating Partnership into shares of the Company's common stock. |
See Company's 10-K and 10-Q for additional disclosures
S-6
E S S E X P R O P E R T Y T R U S T, I N C.
| Property Operating Results - Quarter ended December 31, 2009 and 2008 | | | | | | | | | | | | | | | | | | | | | | | | | |
| (Dollars in thousands) | | | | | | | | | | | | | | | | | | | | | | | | | | | | | | | | | | | | | | | | | | |
| | | Southern California | | | Northern California | | | Seattle Metro | | | Other real estate assets (1) | | | Total | |
| | | 2009 | | | 2008 | | | % Change | | | 2009 | | | 2008 | | | % Change | | | 2009 | | | 2008 | | | % Change | | | 2009 | | | 2008 | | | 2009 | | | 2008 | | | % Change | |
| | | | | | | | | | | | | | | | | | | | | | | | | | | | | | | | | | | | | | | | | | | |
| Revenues: | | | | | | | | | | | | | | | | | | | | | | | | | | | | | | | | | | | | | | | | | | |
| Same-property revenue | | $ | 45,054 | | | $ | 47,196 | | | | -4.5 | % | | $ | 25,250 | | | $ | 27,264 | | | | -7.4 | % | | $ | 13,787 | | | $ | 15,485 | | | | -11.0 | % | | $ | - | | | $ | - | | | $ | 84,091 | | | $ | 89,945 | | | | -6.5 | % |
| Non-same property revenue (2) | | | 6,064 | | | | 5,078 | | | | | | | | 4,887 | | | | 3,840 | | | | | | | | 3,174 | | | | 3,498 | | | | | | | | 1,788 | | | | 1,350 | | | | 15,913 | | | | 13,766 | | | | | |
| Total Revenues | | $ | 51,118 | | | $ | 52,274 | | | | | | | $ | 30,137 | | | $ | 31,104 | | | | | | | $ | 16,961 | | | $ | 18,983 | | | | | | | $ | 1,788 | | | $ | 1,350 | | | $ | 100,004 | | | $ | 103,711 | | | | | |
| | | | | | | | | | | | | | | | | | | | | | | | | | | | | | | | | | | | | | | | | | | | | | | | | | | | | | | | | |
| Property operating expenses: | | | | | | | | | | | | | | | | | | | | | | | | | | | | | | | | | | | | | | | | | | | | | | | | | | | | | | | | |
| Same-property operating expenses | | $ | 16,068 | | | $ | 14,977 | | | | 7.3 | % | | $ | 8,876 | | | $ | 9,087 | | | | -2.3 | % | | $ | 5,389 | | | $ | 5,249 | | | | 2.7 | % | | $ | - | | | $ | - | | | $ | 30,333 | | | $ | 29,313 | | | | 3.5 | % |
| Non-same property operating expenses (2) | | | 2,127 | | | | 1,790 | | | | | | | | 1,949 | | | | 1,253 | | | | | | | | 1,383 | | | | 1,218 | | | | | | | | 853 | | | | 516 | | | | 6,312 | | | | 4,777 | | | | | |
| Total property operating expenses | | $ | 18,195 | | | $ | 16,767 | | | | | | | $ | 10,825 | | | $ | 10,340 | | | | | | | $ | 6,772 | | | $ | 6,467 | | | | | | | $ | 853 | | | $ | 516 | | | $ | 36,645 | | | $ | 34,090 | | | | | |
| | | | | | | | | | | | | | | | | | | | | | | | | | | | | | | | | | | | | | | | | | | | | | | | | | | | | | | | | |
| Net operating income (NOI): | | | | | | | | | | | | | | | | | | | | | | | | | | | | | | | | | | | | | | | | | | | | | | | | | | | | | | | | |
| Same-property NOI | | $ | 28,986 | | | $ | 32,219 | | | | -10.0 | % | | $ | 16,374 | | | $ | 18,177 | | | | -9.9 | % | | $ | 8,398 | | | $ | 10,236 | | | | -18.0 | % | | $ | - | | | $ | - | | | $ | 53,758 | | | $ | 60,632 | | | | -11.3 | % |
| Non-same property NOI (2) | | | | | | | | | | | | | | | | | | | | | | | | | | | | | | | | | | | | | | | | | | | | | | | | | | | | | | | | |
| Redevelopment communities | | | 3,000 | | | | 3,233 | | | | | | | | 2,021 | | | | 2,335 | | | | | | | | 1,088 | | | | 1,365 | | | | | | | | - | | | | - | | | | 6,109 | | | | 6,933 | | | | | |
| Acquired communities | | | 180 | | | | 54 | | | | | | | | 312 | | | | 320 | | | | | | | | 703 | | | | 915 | | | | | | | | - | | | | - | | | | 1,195 | | | | 1,289 | | | | | |
| Development communities | | | 757 | | | | 1 | | | | | | | | 605 | | | | (68 | ) | | | | | | | - | | | | - | | | | | | | | - | | | | - | | | | 1,362 | | | | (67 | ) | | | | |
| Other real estate assets (1) | | | - | | | | - | | | | | | | | - | | | | - | | | | | | | | - | | | | - | | | | | | | | 935 | | | | 834 | | | | 935 | | | | 834 | | | | | |
| Total non-same property NOI | | | 3,937 | | | | 3,288 | | | | | | | | 2,938 | | | | 2,587 | | | | | | | | 1,791 | | | | 2,280 | | | | | | | | 935 | | | | 834 | | | | 9,601 | | | | 8,989 | | | | | |
| Total NOI | | $ | 32,923 | | | $ | 35,507 | | | | | | | $ | 19,312 | | | $ | 20,764 | | | | | | | $ | 10,189 | | | $ | 12,516 | | | | | | | $ | 935 | | | $ | 834 | | | $ | 63,359 | | | $ | 69,621 | | | | | |
| | | | | | | | | | | | | | | | | | | | | | | | | | | | | | | | | | | | | | | | | | | | | | | | | | | | | | | | | |
| Same-property operating margin | | | 64 | % | | | 68 | % | | | | | | | 65 | % | | | 67 | % | | | | | | | 61 | % | | | 66 | % | | | | | | | | | | | | | | | 64 | % | | | 67 | % | | | | |
| | | | | | | | | | | | | | | | | | | | | | | | | | | | | | | | | | | | | | | | | | | | | | | | | | | | | | | | | |
| Same-property turnover percentage | | | 50 | % | | | 49 | % | | | | | | | 42 | % | | | 47 | % | | | | | | | 39 | % | | | 47 | % | | | | | | | | | | | | | | | 45 | % | | | 48 | % | | | | |
| | | | | | | | | | | | | | | | | | | | | | | | | | | | | | | | | | | | | | | | | | | | | | | | | | | | | | | | | |
| Same-property concessions | | $ | 307 | | | $ | 292 | | | | | | | $ | 172 | | | $ | 112 | | | | | | | $ | 80 | | | $ | 78 | | | | | | | | | | | | | | | $ | 559 | | | $ | 482 | | | | | |
| | | | | | | | | | | | | | | | | | | | | | | | | | | | | | | | | | | | | | | | | | | | | | | | | | | | | | | | | |
| Average same-property concessions per turn (3) | | $ | 234 | | | $ | 219 | | | | | | | $ | 295 | | | $ | 170 | | | | | | | $ | 193 | | | $ | 155 | | | | | | | | | | | | | | | $ | 242 | | | $ | 193 | | | | | |
| | | | | | | | | | | | | | | | | | | | | | | | | | | | | | | | | | | | | | | | | | | | | | | | | | | | | | | | | |
| | | | | | | | | | | | | | | | | | | | | | | | | | | | | | | | | | | | | | | | | | | | | | | | | | | | | | | | | |
| Reconciliation of apartment units at end of period | | | | | | | | | | | | | | | | | | | | | | | | | | | | | | | | | | | | | | | | | | | | | | | | | | | | | | | | |
| | | | | | | | | | | | | | | | | | | | | | | | | | | | | | | | | | | | | | | | | | | | | | | | | | | | | | | | | |
| Same-property apartment units | | | 10,953 | | | | | | | | | | | | 5,615 | | | | | | | | | | | | 4,292 | | | | | | | | | | | | | | | | | | | | 20,860 | | | | | | | | | |
| | | | | | | | | | | | | | | | | | | | | | | | | | | | | | | | | | | | | | | | | | | | | | | | | | | | | | | | | |
| Consolidated apartment units | | | 12,339 | | | | 12,500 | | | | | | | | 6,695 | | | | 6,457 | | | | | | | | 5,249 | | | | 5,338 | | | | | | | | | | | | | | | | 24,283 | | | | 24,295 | | | | | |
| Joint venture | | | 748 | | | | 480 | | | | | | | | 1,575 | | | | 1,575 | | | | | | | | 642 | | | | 642 | | | | | | | | | | | | | | | | 2,965 | | | | 2,697 | | | | | |
| Under development | | | 115 | | | | 268 | | | | | | | | 171 | | | | 693 | | | | | | | | 295 | | | | 295 | | | | | | | | | | | | | | | | 581 | | | | 1,256 | | | | | |
| Total apartment units at end of period | | | 13,202 | | | | 13,248 | | | | | | | | 8,441 | | | | 8,725 | | | | | | | | 6,186 | | | | 6,275 | | | | | | | | | | | | | | | | 27,829 | | | | 28,248 | | | | | |
| | | | | | | | | | | | | | | | | | | | | | | | | | | | | | | | | | | | | | | | | | | | | | | | | | | | | | | | | |
| Percentage of total | | | 48 | % | | | 47 | % | | | | | | | 30 | % | | | 31 | % | | | | | | | 22 | % | | | 22 | % | | | | | | | | | | | | | | | 100 | % | | | 100 | % | | | | |
| | | | | | | | | | | | | | | | | | | | | | | | | | | | | | | | | | | | | | | | | | | | | | | | | | | | | | | | | |
| | | | | | | | | | | | | | | | | | | | | | | | | | | | | | | | | | | | | | | | | | | | | | | | | | | | | | | | | |
| Average same-property financial occupancy | | | 97.1 | % | | | 95.9 | % | | | | | | | 97.8 | % | | | 97.6 | % | | | | | | | 97.6 | % | | | 97.1 | % | | | | | | | | | | | | | | | 97.4 | % | | | 96.6 | % | | | | |
| (1) | Other real estate assets consists mainly of retail space, commercial properties, and boat slips and their operating results are classified in non-same property results. The Hollywood commercial property's operations are classified in other real assets for 2009 due to the extension of a three year lease with the tenant, operations for 2008 are classified in interest and other income. |
| (2) | Includes properties which subsequent to October 1, 2008 were either acquired or in a stage of development or redevelopment without stabilized operations. |
| (3) | Average same-property concessions per turn is the dollar amount per unit resulting from the same-property concessions divided by the product of the same property turnover percentage times the same-property apartment units. |
See Company's 10-K and 10-Q for additional disclosures
S-7
E S S E X P R O P E R T Y T R U S T, I N C
| Property Operating Results - Year ended December 31, 2009 and 2008 | | | | | | | | | | | | | | | | | | | | | | |
| (Dollars in thousands) | | | | | | | | | | | | | | | | | | | | | | | | | | | | | | | | | | | | | |
| | | | | | | | | | | | | | | | | | | | | | | | | | | | | | | | | | | | | | | | | | | |
| | | Southern California | | | Northern California | | | Seattle Metro | | | Other real estate assets (1) | | | Total | |
| | | 2009 | | | 2008 | | | % Change | | | 2009 | | | 2008 | | | % Change | | | 2009 | | | 2008 | | | % Change | | | 2009 | | | 2008 | | | 2009 | | | 2008 | | | % Change | |
| | | | | | | | | | | | | | | | | | | | | | | | | | | | | | | | | | | | | | | | | | | |
| Revenues: | | | | | | | | | | | | | | | | | | | | | | | | | | | | | | | | | | | | | | | | | | |
| Same-property revenue | | $ | 183,246 | | | $ | 188,807 | | | | -2.9 | % | | $ | 104,316 | | | $ | 106,301 | | | | -1.9 | % | | $ | 58,041 | | | $ | 60,430 | | | | -4.0 | % | | $ | - | | | $ | - | | | $ | 345,603 | | | $ | 355,538 | | | | -2.8 | % |
| Non-same property revenue (2) | | | 23,588 | | | | 18,887 | | | | | | | | 17,344 | | | | 13,585 | | | | | | | | 13,229 | | | | 9,918 | | | | | | | | 7,300 | | | | 5,340 | | | | 61,461 | | | | 47,730 | | | | | |
| Total Revenues | | $ | 206,834 | | | $ | 207,694 | | | | | | | $ | 121,660 | | | $ | 119,886 | | | | | | | $ | 71,270 | | | $ | 70,348 | | | | | | | $ | 7,300 | | | $ | 5,340 | | | $ | 407,064 | | | $ | 403,268 | | | | | |
| | | | | | | | | | | | | | | | | | | | | | | | | | | | | | | | | | | | | | | | | | | | | | | | | | | | | | | | | |
| Property operating expenses: | | | | | | | | | | | | | | | | | | | | | | | | | | | | | | | | | | | | | | | | | | | | | | | | | | | | | | | | |
| Same-property operating expenses | | $ | 61,172 | | | $ | 59,255 | | | | 3.2 | % | | $ | 35,219 | | | $ | 36,319 | | | | -3.0 | % | | $ | 21,362 | | | $ | 20,623 | | | | 3.6 | % | | $ | - | | | $ | - | | | $ | 117,753 | | | $ | 116,197 | | | | 1.3 | % |
| Non-same property operating expenses (2) | | | 7,863 | | | | 6,305 | | | | | | | | 6,089 | | | | 5,039 | | | | | | | | 5,094 | | | | 3,111 | | | | | | | | 2,912 | | | | 1,765 | | | | 21,958 | | | | 16,220 | | | | | |
| Total property operating expenses | | $ | 69,035 | | | $ | 65,560 | | | | | | | $ | 41,308 | | | $ | 41,358 | | | | | | | $ | 26,456 | | | $ | 23,734 | | | | | | | $ | 2,912 | | | $ | 1,765 | | | $ | 139,711 | | | $ | 132,417 | | | | | |
| | | | | | | | | | | | | | | | | | | | | | | | | | | | | | | | | | | | | | | | | | | | | | | | | | | | | | | | | |
| Net operating income (NOI): | | | | | | | | | | | | | | | | | | | | | | | | | | | | | | | | | | | | | | | | | | | | | | | | | | | | | | | | |
| Same-property NOI | | $ | 122,074 | | | $ | 129,552 | | | | -5.8 | % | | $ | 69,097 | | | $ | 69,982 | | | | -1.3 | % | | $ | 36,679 | | | $ | 39,807 | | | | -7.9 | % | | $ | - | | | $ | - | | | $ | 227,850 | | | $ | 239,341 | | | | -4.8 | % |
| Non-same property NOI (2) | | | | | | | | | | | | | | | | | | | | | | | | | | | | | | | | | | | | | | | | | | | | | | | | | | | | | | | | |
| Redevelopment communities | | | 12,368 | | | | 12,675 | | | | | | | | 8,969 | | | | 8,067 | | | | | | | | 4,575 | | | | 5,398 | | | | | | | | - | | | | - | | | | 25,912 | | | | 26,140 | | | | | |
| Acquired communities | | | 438 | | | | 90 | | | | | | | | 1,263 | | | | 547 | | | | | | | | 3,560 | | | | 1,409 | | | | | | | | - | | | | - | | | | 5,261 | | | | 2,046 | | | | | |
| Development communities | | | 2,919 | | | | (183 | ) | | | | | | | 1,023 | | | | (68 | ) | | | | | | | - | | | | - | | | | | | | | - | | | | - | | | | 3,942 | | | | (251 | ) | | | | |
| Other real estate assets (1) | | | - | | | | - | | | | | | | | - | | | | - | | | | | | | | - | | | | - | | | | | | | | 4,388 | | | | 3,575 | | | | 4,388 | | | | 3,575 | | | | | |
| Total non-same property NOI | | | 15,725 | | | | 12,582 | | | | | | | | 11,255 | | | | 8,546 | | | | | | | | 8,135 | | | | 6,807 | | | | | | | | 4,388 | | | | 3,575 | | | | 39,503 | | | | 31,510 | | | | | |
| Total NOI | | $ | 137,799 | | | $ | 142,134 | | | | | | | $ | 80,352 | | | $ | 78,528 | | | | | | | $ | 44,814 | | | $ | 46,614 | | | | | | | $ | 4,388 | | | $ | 3,575 | | | $ | 267,353 | | | $ | 270,851 | | | | | |
| | | | | | | | | | | | | | | | | | | | | | | | | | | | | | | | | | | | | | | | | | | | | | | | | | | | | | | | | |
| | | | | | | | | | | | | | | | | | | | | | | | | | | | | | | | | | | | | | | | | | | | | | | | | | | | | | | | | |
| | | | | | | | | | | | | | | | | | | | | | | | | | | | | | | | | | | | | | | | | | | | | | | | | | | | | | | | | |
| Same-property operating margin | | | 67 | % | | | 69 | % | | | | | | | 66 | % | | | 66 | % | | | | | | | 63 | % | | | 66 | % | | | | | | | | | | | | | | | 66 | % | | | 67 | % | | | | |
| | | | | | | | | | | | | | | | | | | | | | | | | | | | | | | | | | | | | | | | | | | | | | | | | | | | | | | | | |
| Same-property turnover percentage | | | 59 | % | | | 53 | % | | | | | | | 54 | % | | | 53 | % | | | | | | | 55 | % | | | 58 | % | | | | | | | | | | | | | | | 57 | % | | | 54 | % | | | | |
| | | | | | | | | | | | | | | | | | | | | | | | | | | | | | | | | | | | | | | | | | | | | | | | | | | | | | | | | |
| Same-property concessions | | $ | 1,316 | | | $ | 1,336 | | | | | | | $ | 605 | | | $ | 662 | | | | | | | $ | 349 | | | $ | 302 | | | | | | | | | | | | | | | $ | 2,270 | | | $ | 2,300 | | | | | |
| | | | | | | | | | | | | | | | | | | | | | | | | | | | | | | | | | | | | | | | | | | | | | | | | | | | | | | | | |
| Average same-property concessions per turn (3) | | $ | 212 | | | $ | 228 | | | | | | | $ | 202 | | | $ | 223 | | | | | | | $ | 147 | | | $ | 121 | | | | | | | | | | | | | | | $ | 196 | | | $ | 203 | | | | | |
| | | | | | | | | | | | | | | | | | | | | | | | | | | | | | | | | | | | | | | | | | | | | | | | | | | | | | | | | |
| Average same-property financial occupancy | | | 96.6 | % | | | 95.6 | % | | | | | | | 97.7 | % | | | 97.4 | % | | | | | | | 97.2 | % | | | 96.7 | % | | | | | | | | | | | | | | | 97.0 | % | | | 96.3 | % | | | | |
| (1) | Other real estate assets consists mainly of retail space, commercial properties, and boat slips and their operating results are classified in non-same property results. The Hollywood commercial property's operations are classified in other real assets for 2009 due to the extension of a three year lease with the tenant, operations for 2008 are classified in interest and other income. |
| (2) | Includes properties which subsequent to January 1, 2008 were either acquired or in a stage of development or redevelopment without stabilized operations. |
| (3) | Average same-property concessions per turn is the dollar amount per unit resulting from the same-property concessions divided by the product of the same property turnover percentage times the same-property apartment units. |
See Company's 10-K and 10-Q for additional disclosures
S-7.1
E S S E X P R O P E R T Y T R U S T, I N C.
| Revenue by County - Quarters ended December 31, 2009, December 31, 2008 and September 30, 2009 | |
| (Dollars in thousands) | | | | | | | | | | | | | | | | | | | | | | | | | | | | | | | |
| | | | | | | | | | | | | | | | | | | | | | | | | | | | | | | | | | |
| | | | | | | | | | | | | | | | | | | | | | | | | | | | | | | | | | |
| | | | | | Average Property Rental Rates | | | December 31, 2009 | | | December 31, 2008 | | | | | | | | | | |
| Region | | Units | | | QTD 2009 | | | QTD 2008 | | | % Change | | | Property Revenue | | | Financial Occupancy | | | Property Revenue | | | Financial Occupancy | | | Property Revenue % Change | | | Property Revenue Q3 2009 | | | Sequential % Change | |
| | | | | | | | | | | | | | | | | | | | | | | | | | | | | | | | | | |
| Southern California | | | | | | | | | | | | | | | | | | | | | | | | | | | | | | | | | |
| Ventura County | | | 2,898 | | | $ | 1,284 | | | $ | 1,366 | | | | -6.0 | % | | $ | 11,470 | | | | 97.2 | % | | $ | 12,126 | | | | 96.8 | % | | | -5.4 | % | | $ | 11,530 | | | | -0.5 | % |
| Los Angeles County | | | 2,754 | | | | 1,602 | | | | 1,732 | | | | -7.5 | % | | | 13,471 | | | | 96.8 | % | | | 14,065 | | | | 94.2 | % | | | -4.2 | % | | | 13,679 | | | | -1.5 | % |
| Orange County | | | 2,037 | | | | 1,427 | | | | 1,533 | | | | -6.9 | % | | | 8,842 | | | | 97.0 | % | | | 9,527 | | | | 97.1 | % | | | -7.2 | % | | | 8,963 | | | | -1.3 | % |
| San Diego County | | | 2,641 | | | | 1,100 | | | | 1,132 | | | | -2.8 | % | | | 8,933 | | | | 97.3 | % | | | 9,255 | | | | 97.7 | % | | | -3.5 | % | | | 8,912 | | | | 0.2 | % |
| Santa Barbara County | | | 347 | | | | 1,624 | | | | 1,649 | | | | -1.5 | % | | | 1,725 | | | | 99.2 | % | | | 1,569 | | | | 89.0 | % | | | 9.9 | % | | | 1,662 | | | | 3.8 | % |
| Riverside County | | | 276 | | | | 724 | | | | 791 | | | | -8.5 | % | | | 613 | | | | 94.9 | % | | | 654 | | | | 89.7 | % | | | -6.3 | % | | | 616 | | | | -0.5 | % |
| Total same-property | | | 10,953 | | | | 1,343 | | | | 1,427 | | | | -5.9 | % | | | 45,054 | | | | 97.1 | % | | | 47,196 | | | | 95.9 | % | | | -4.5 | % | | | 45,362 | | | | -0.7 | % |
| Non-same property | | | 1,386 | | | | 1,423 | | | | | | | | | | | | 6,064 | | | | | | | | 5,078 | | | | | | | | | | | | | | | | | |
| | | | | | | | | | | | | | | | | | | | | | | | | | | | | | | | | | | | | | | | | | | | | |
| Northern California | | | | | | | | | | | | | | | | | | | | | | | | | | | | | | | | | | | | | | | | | | | | |
| San Francisco MSA | | | 175 | | | | 1,826 | | | | 1,864 | | | | -2.0 | % | | | 969 | | | | 98.0 | % | | | 959 | | | | 94.6 | % | | | 1.0 | % | | | 949 | | | | 2.1 | % |
| Santa Clara County | | | 2,058 | | | | 1,525 | | | | 1,686 | | | | -9.5 | % | | | 9,577 | | | | 98.0 | % | | | 10,640 | | | | 98.1 | % | | | -10.0 | % | | | 9,845 | | | | -2.7 | % |
| Alameda County | | | 760 | | | | 1,205 | | | | 1,298 | | | | -7.2 | % | | | 2,903 | | | | 97.9 | % | | | 3,104 | | | | 97.0 | % | | | -6.5 | % | | | 2,915 | | | | -0.4 | % |
| San Mateo County | | | 768 | | | | 1,568 | | | | 1,682 | | | | -6.8 | % | | | 3,702 | | | | 97.3 | % | | | 3,968 | | | | 97.6 | % | | | -6.7 | % | | | 3,790 | | | | -2.3 | % |
| Contra Costa County | | | 1,720 | | | | 1,433 | | | | 1,521 | | | | -5.8 | % | | | 7,573 | | | | 97.7 | % | | | 8,036 | | | | 97.6 | % | | | -5.8 | % | | | 7,630 | | | | -0.7 | % |
| Other | | | 134 | | | | 1,309 | | | | 1,387 | | | | -5.6 | % | | | 526 | | | | 96.8 | % | | | 557 | | | | 97.2 | % | | | -5.6 | % | | | 528 | | | | -0.4 | % |
| Total same-property | | | 5,615 | | | | 1,464 | | | | 1,581 | | | | -7.4 | % | | | 25,250 | | | | 97.8 | % | | | 27,264 | | | | 97.6 | % | | | -7.4 | % | | | 25,657 | | | | -1.6 | % |
| Santa Clara County | | | 390 | | | | 1,334 | | | | | | | | | | | | 1,614 | | | | | | | | 1,864 | | | | | | | | | | | | | | | | | |
| Alameda County | | | 594 | | | | 1,520 | | | | | | | | | | | | 2,783 | | | | | | | | 1,492 | | | | | | | | | | | | | | | | | |
| Other | | | 96 | | | | 1,698 | | | | | | | | | | | | 490 | | | | | | | | 484 | | | | | | | | | | | | | | | | | |
| Non-same property | | | 1,080 | | | | 1,468 | | | | | | | | | | | | 4,887 | | | | | | | | 3,840 | | | | | | | | | | | | | | | | | |
| | | | | | | | | | | | | | | | | | | | | | | | | | | | | | | | | | | | | | | | | | | | | |
| Seattle Metro | | | | | | | | | | | | | | | | | | | | | | | | | | | | | | | | | | | | | | | | | | | | |
| Total same-property | | | 4,292 | | | | 998 | | | | 1,139 | | | | -12.4 | % | | | 13,787 | | | | 97.6 | % | | | 15,485 | | | | 97.1 | % | | | -11.0 | % | | | 14,178 | | | | -2.8 | % |
| Non-same property | | | 957 | | | | 1,048 | | | | | | | | | | | | 3,174 | | | | | | | | 3,498 | | | | | | | | | | | | | | | | | |
| | | | | | | | | | | | | | | | | | | | | | | | | | | | | | | | | | | | | | | | | | | | | |
| Other real estate assets | | | | | | | | | | | | | | | | | | | 1,788 | | | | | | | | 1,350 | | | | | | | | | | | | | | | | | |
| | | | | | | | | | | | | | | | | | | | | | | | | | | | | | | | | | | | | | | | | | | | | |
| Total same-property revenue | | | 20,860 | | | $ | 1,304 | | | $ | 1,409 | | | | -7.5 | % | | $ | 84,091 | | | | 97.4 | % | | $ | 89,945 | | | | 96.6 | % | | | -6.5 | % | | $ | 85,197 | | | | -1.3 | % |
| | | | | | | | | | | | | | | | | | | | | | | | | | | | | | | | | | | | | | | | | | | | | |
| Total non-same property revenue | | | 3,423 | | | $ | 1,333 | | | | | | | | | | | $ | 15,913 | | | | | | | $ | 13,766 | | | | | | | | | | | | | | | | | |
See Company's 10-K and 10-Q for additional disclosures
S-8
E S S E X P R O P E R T Y T R U S T, I N C.
| Revenue by County - Year ended December 31, 2009 and 2008 | | | | | | | | | | | | | | | | |
| (Dollars in thousands) | | | | | | | | | | | | | | | | | | | | | |
| | | | | | | | | | | | | | | | | | | | | | | | | | | | |
| | | | | | | | | | | | | | | | | | | | | | | | | | | | |
| | | | | | Average Property Rental Rates | | | Year to Date 2009 | | | Year to Date 2008 | | | | |
| Region | | Units | | | YTD 2009 | | | YTD 2008 | | | % Change | | | Property Revenue | | | Financial Occupancy | | | Property Revenue | | | Financial Occupancy | | | Property Revenue % Change | |
| | | | | | | | | | | | | | | | | | | | | | | | | | | | |
| Southern California | | | | | | | | | | | | | | | | | | | | | | | | | | | |
| Ventura County | | | 2,898 | | | $ | 1,316 | | | $ | 1,381 | | | | -4.7 | % | | $ | 46,819 | | | | 96.9 | % | | $ | 48,182 | | | | 95.8 | % | | | -2.8 | % |
| Los Angeles County | | | 2,754 | | | | 1,652 | | | | 1,749 | | | | -5.5 | % | | | 54,988 | | | | 96.2 | % | | | 57,055 | | | | 94.3 | % | | | -3.6 | % |
| Orange County | | | 2,037 | | | | 1,470 | | | | 1,543 | | | | -4.7 | % | | | 36,320 | | | | 97.0 | % | | | 38,057 | | | | 96.7 | % | | | -4.6 | % |
| San Diego County | | | 2,641 | | | | 1,116 | | | | 1,129 | | | | -1.2 | % | | | 35,966 | | | | 97.1 | % | | | 36,291 | | | | 97.1 | % | | | -0.9 | % |
| Santa Barbara County | | | 347 | | | | 1,623 | | | | 1,666 | | | | -2.6 | % | | | 6,665 | | | | 94.8 | % | | | 6,614 | | | | 92.4 | % | | | 0.8 | % |
| Riverside County | | | 276 | | | | 743 | | | | 812 | | | | -8.5 | % | | | 2,488 | | | | 94.2 | % | | | 2,608 | | | | 89.3 | % | | | -4.6 | % |
| | | | | | | | | | | | | | | | | | | | | | | | | | | | | | | | | | | | | |
| Total same-property | | | 10,953 | | | | 1,376 | | | | 1,438 | | | | -4.3 | % | | | 183,246 | | | | 96.6 | % | | | 188,807 | | | | 95.6 | % | | | -2.9 | % |
| | | | | | | | | | | | | | | | | | | | | | | | | | | | | | | | | | | | | |
| Non-same property | | | 1,386 | | | | 1,453 | | | | | | | | | | | | 23,588 | | | | | | | | 18,887 | | | | | | | | | |
| | | | | | | | | | | | | | | | | | | | | | | | | | | | | | | | | | | | | |
| Northern California | | | | | | | | | | | | | | | | | | | | | | | | | | | | | | | | | | | | |
| San Francisco MSA | | | 175 | | | | 1,830 | | | | 1,815 | | | | 0.8 | % | | | 3,866 | | | | 97.2 | % | | | 3,812 | | | | 96.5 | % | | | 1.4 | % |
| Santa Clara County | | | 2,058 | | | | 1,597 | | | | 1,643 | | | | -2.8 | % | | | 40,253 | | | | 98.2 | % | | | 41,207 | | | | 98.0 | % | | | -2.3 | % |
| Alameda County | | | 760 | | | | 1,252 | | | | 1,271 | | | | -1.5 | % | | | 11,948 | | | | 97.5 | % | | | 12,028 | | | | 96.6 | % | | | -0.7 | % |
| San Mateo County | | | 768 | | | | 1,621 | | | | 1,632 | | | | -0.7 | % | | | 15,307 | | | | 97.4 | % | | | 15,284 | | | | 97.5 | % | | | 0.2 | % |
| Contra Costa County | | | 1,720 | | | | 1,467 | | | | 1,526 | | | | -3.9 | % | | | 30,799 | | | | 97.3 | % | | | 31,790 | | | | 96.9 | % | | | -3.1 | % |
| Other | | | 134 | | | | 1,333 | | | | 1,378 | | | | -3.3 | % | | | 2,143 | | | | 96.9 | % | | | 2,180 | | | | 96.7 | % | | | -1.7 | % |
| | | | | | | | | | | | | | | | | | | | | | | | | | | | | | | | | | | | | |
| Total same-property | | | 5,615 | | | | 1,515 | | | | 1,554 | | | | -2.5 | % | | | 104,316 | | | | 97.7 | % | | | 106,301 | | | | 97.4 | % | | | -1.9 | % |
| | | | | | | | | | | | | | | | | | | | | | | | | | | | | | | | | | | | | |
| Santa Clara County | | | 390 | | | | 1,415 | | | | | | | | | | | | 6,830 | | | | | | | | 6,862 | | | | | | | | | |
| Alameda County | | | 594 | | | | 1,505 | | | | | | | | | | | | 8,584 | | | | | | | | 5,485 | | | | | | | | | |
| Other | | | 96 | | | | 1,706 | | | | | | | | | | | | 1,930 | | | | | | | | 1,238 | | | | | | | | | |
| | | | | | | | | | | | | | | | | | | | | | | | | | | | | | | | | | | | | |
| Non-same property | | | 1,080 | | | | 1,491 | | | | | | | | | | | | 17,344 | | | | | | | | 13,585 | | | | | | | | | |
| | | | | | | | | | | | | | | | | | | | | | | | | | | | | | | | | | | | | |
| Seattle Metro | | | | | | | | | | | | | | | | | | | | | | | | | | | | | | | | | | | | |
| Total same-property | | | 4,292 | | | | 1,062 | | | | 1,124 | | | | -5.5 | % | | | 58,041 | | | | 97.2 | % | | | 60,430 | | | | 96.7 | % | | | -4.0 | % |
| | | | | | | | | | | | | | | | | | | | | | | | | | | | | | | | | | | | | |
| Non-same property | | | 957 | | | | 1,108 | | | | | | | | | | | | 13,229 | | | | | | | | 9,918 | | | | | | | | | |
| | | | | | | | | | | | | | | | | | | | | | | | | | | | | | | | | | | | | |
| Other real estate assets | | | | | | | | | | | | | | | | | | | 7,300 | | | | | | | | 5,340 | | | | | | | | | |
| | | | | | | | | | | | | | | | | | | | | | | | | | | | | | | | | | | | | |
| Total same-property revenue | | | 20,860 | | | $ | 1,349 | | | $ | 1,404 | | | | -3.9 | % | | $ | 345,603 | | | | 97.0 | % | | $ | 355,538 | | | | 96.3 | % | | | -2.8 | % |
| | | | | | | | | | | | | | | | | | | | | | | | | | | | | | | | | | | | | |
| Total non-same property revenue | | | 3,423 | | | $ | 1,368 | | | | | | | | | | | $ | 61,461 | | | | | | | $ | 47,730 | | | | | | | | | |
See Company's 10-K and 10-Q for additional disclosures
S-8.1
| E S S E X P R O P E R T Y T R U S T, I N C. | | | | | | | | | | | | | |
| | | | | | | | | | | | | | | | | | | | | | |
| Development Pipeline - December 31, 2009 | | | | | | | | | | |
| (Dollars in millions) | | | | | | | | | | | | | | | | | |
| | | | | | | | | | | | | | | | | | | | | | |
| | | | | Estimated Units | | | Estimated retail sq. feet (1) | | | Incurred to Date | | | Remaining Costs | | | Estimated Total Cost | | Construction Start | Construction Complete | Initial Occupancy | Stabilized Operations |
| | | | | | | | | | | | | | | | | | | | | | |
| Development Projects | | | | | | | | | | | | | | |
| Project Name | | Location | | | | | | | | | | | | | | | | | | | |
| | | | | | | | | | | | | | | | | | | | | | |
| Fourth & U | | Berkeley, CA | | | 171 | | | | 15,500 | | | $ | 49.5 | | | $ | 13.8 | | | $ | 63.3 | | Apr-08 | Jun-10 | Apr-10 | Oct-10 |
| Joule Broadway (2) | | Seattle, WA | | | 295 | | | | 29,100 | | | | 68.1 | | | | 26.7 | | | | 94.8 | | May-08 | Jun-10 | Apr-10 | Feb-11 |
| Tasman Retail Pad and Garage | | Sunnyvale, CA | | | - | | | | 14,100 | | | | 5.4 | | | | 16.3 | | | | 21.7 | | Jul-09 | Jun-10 | Jun-10 | Jun-10 |
| DuPont Lofts | | Irvine, CA | | | 115 | | | | - | | | | 27.2 | | | | 9.1 | | | | 36.3 | | Feb-10 | Jun-10 | Jun-10 | Jan-11 |
| Total- Development Projects | | | 581 | | | | 58,700 | | | | 150.2 | | | | 65.9 | | | | 216.1 | | | | | |
| | | | | | | | | | | | | | | | | | | | | | | | | | | |
| Predevelopment Projects | | | | | | | | | | | | | | | | | | | | |
| | | | | | | | | | | | | | | | | | | | | | | | | | | |
| Project Name | | Location | | | | | | | | | | | | | | | | | | | | | | | | |
| Main Street (3) | | Walnut Creek, CA | | | - | | | | - | | | | - | | | | - | | | | - | | | | | |
| Tasman Apts/Retail | | Sunnyvale, CA | | | - | | | | - | | | | - | | | | - | | | | - | | | | | |
| Total- Predevelopment Projects | | | 332 | | | | 62,000 | | | | 53.7 | | | | 89.3 | | | | 143.0 | | | | | |
| | | | | | | | | | | | | | | | | | | | | | | | | | | |
| Land Held for Future Development or Sale (4) | | | | | | | | | | | | | | | | | | | |
| | | | | | | | | | | | | | | | | | | | | | | | | | | |
| Project Name | | Location | | | | | | | | | | | | | | | | | | | | | | | | |
| Cadence Campus | | San Jose, CA | | | 769 | | | | - | | | | - | | | | - | | | | - | | | | | |
| West Dublin | | Dublin, CA | | | 309 | | | | - | | | | - | | | | - | | | | - | | | | | |
| City Centre | | Moorpark, CA | | | 200 | | | | - | | | | - | | | | - | | | | - | | | | | |
| Park Boulevard | | Palo Alto, CA | | | 27 | | | | - | | | | - | | | | - | | | | - | | | | | |
| View Pointe | | Newcastle, WA | | | 24 | | | | - | | | | - | | | | - | | | | - | | | | | |
| | | | | | | | | | | | | | | | | | | | | | | | | | | |
| | | | | | | | | | | | | | | | | | | | | | | | | | | |
| Total - Land Held for Future Development or Sale | | | 1,329 | | | | - | | | | 71.1 | | | | - | | | | 71.1 | | | | | |
| Grand Total - Development Pipeline | | | 2,242 | | | | 120,700 | | | $ | 275.0 | | | $ | 155.2 | | | $ | 430.2 | | | | | |
| (1) | Certain apartment community developments include retail space, and the Company has included the total estimated retail square footage for each development project. |
| (2) | There is a construction loan in place for this development project that provides financing for the majority of the estimated remaining cost to be incurred. |
| (3) | The Company has entered into a joint venture development agreement with a third-party to develop this property. The Company has a 50% interest in this project. |
| (4) | The Company owns land in various stages of entitlement that is being held for future development or sale. |
See Company's 10-K and 10-Q for additional disclosures
S-9
E S S E X P R O P E R T Y T R U S T, I N C.
| Redevelopment Pipeline - December 31, 2009 | | | | | | | | | |
| (Dollars in thousands) | | | | | | | | | | | | | | | | | | | | |
| | | | | | | | | | | | | | | | | | | | | | | |
| | | | | | | | | | | | | | | | | | | | | | | |
| | | | | | Total | | | Estimated | | | Estimated | | | | NOI | | | | |
| | | | | | Incurred | | | Remaining | | | Total | | Redevelopment | | For the year ended | | | Units | |
| Region/Project Name | | Units | | | To Date | | | Cost | | | Cost | | Start Date | | 2009 | | | 2008 | | | completed | |
| | | | | | | | | | | | | | | | | | | | | | | |
| Approved - Redevelopment Projects (1) | | | | | | | | | | | | | | | | | | | | | | |
| Marina Cove, Santa Clara, CA | | | 292 | | | $ | 4,410 | | | $ | 5,448 | | | $ | 9,858 | | Jun-07 | | | | | | | | | |
| | | | | | | | | | | | | | | | | | | | | | | | | | | |
| Active - Redevelopment Projects | | | | | | | | | | | | | | | | | | | | | | | | | | |
| Southern California (2) | | | | | | | | | | | | | | | | | | | | | | | | | | |
| Avondale at Warner Center, Woodland Hills, CA | | | 446 | | | $ | 11,550 | | | $ | 2,520 | | | $ | 14,070 | | Oct-04 | | $ | 4,671 | | | $ | 5,254 | | | | 198 | |
| Pathways, Long Beach, CA | | | 296 | | | | 9,703 | | | | 1,057 | | | | 10,760 | | Jun-06 | | | 3,804 | | | | 3,576 | | | | 247 | |
| Highridge, Rancho Palos Verdes, CA | | | 255 | | | | 7,386 | | | | 9,177 | | | | 16,563 | | Jan-07 | | | 3,893 | | | | 3,845 | | | | 13 | |
| | | | 997 | | | | 28,639 | | | | 12,754 | | | | 41,393 | | | | | 12,368 | | | | 12,675 | | | | 458 | |
| Northern California (2) | | | | | | | | | | | | | | | | | | | | | | | | | | | | | |
| The Montclaire - Phase I - III, Sunnyvale, CA | | | 390 | | | | 14,691 | | | | 441 | | | | 15,132 | | Aug-06 | | | 4,958 | | | | 4,665 | | | | 390 | |
| Boulevard, Fremont, CA | | | 172 | | | | 8,938 | | | | - | | | | 8,938 | | Sep-06 | | | 1,874 | | | | 1,470 | | | | 137 | |
| Bridgeport, Newark, CA | | | 184 | | | | 4,373 | | | | 213 | | | | 4,586 | | Oct-06 | | | 2,137 | | | | 1,932 | | | | 12 | |
| | | | 746 | | | | 28,002 | | | | 654 | | | | 28,656 | | | | | 8,969 | | | | 8,067 | | | | 539 | |
| Seattle Metro | | | | | | | | | | | | | | | | | | | | | | | | | | | | | |
| Foothill Commons, Bellevue, WA | | | 388 | | | | 20,650 | | | | 15,688 | | | | 36,338 | | Jun-07 | | | 2,883 | | | | 3,333 | | | | 39 | |
| Woodland Commons, Bellevue, WA | | | 236 | | | | 4,677 | | | | 7,102 | | | | 11,779 | | Jun-07 | | | 1,692 | | | | 2,066 | | | | - | |
| | | | 624 | | | | 25,327 | | | | 22,790 | | | | 48,117 | | | | | 4,575 | | | | 5,399 | | | | 39 | |
| | | | | | | | | | | | | | | | | | | | | | | | | | | | | | |
| Total Active - Redevelopment Projects | | | 2,367 | | | $ | 81,968 | | | $ | 36,198 | | | $ | 118,166 | | | | $ | 25,912 | | | $ | 26,141 | | | | 1,036 | |
| (1) | This project is approved and redevelopment activity has commenced but as of Q4 2009 the community has stabilized operations, and therefore is classified in same-property operations. |
| (2) | All redevelopment projects located in Southern and Northern California will be classified in same-property operations starting Q1 2010. |
See Company's 10-K and 10-Q for additional disclosures
S-10
E S S E X P R O P E R T Y T R U S T, I N C.
| Co-investments - December 31, 2009 | Essex | | | | Total Fund | | | | | | | | | | Property Revenue for | | | | | | NOI for the | | | | |
| (Dollars in thousands) | Book | | | | Original | | | | | Debt | | Maturity | | | the year ended | | | | | | year ended | | | | |
| | | | Value | | | | Cost | | Units | | | Amount | | Date | | | 2009 | | | 2008 | | | % Change | | | 2009 | | | 2008 | | | % Change | |
| | | | | | | | | | | | | | | | | | | | | | | | | | | | | | | | | | |
| Joint Ventures | | | | | | | | | | | | | | | | | | | | | | | | | | | | | | | | | |
| | | | | | | | | | | | | | | | | | | | | | | | | | | | | | | | | | |
| Essex Apartment Value Fund II, L.P. (Fund II) (1) | | | | | | | | | | | | | | | | | | | | | | | | | | | | | | |
| Southern California | | | | | | | | | | | | | | | | | | | | | | | | | | | | | | |
| Parcwood, Corona, CA | | | | | | | 312 | | | $ | 24,449 | | Dec-2013 | | | | | | | | | | | | | | | | | | | |
| Renaissance, Los Angeles, CA | | | | | | | 168 | | | | 22,641 | | May-2011 | | | | | | | | | | | | | | | | | | | |
| Total Southern California | | | | | | | 480 | | | | 47,090 | | | | | $ | 8,038 | | | $ | 8,377 | | | | -4.0 | % | | $ | 4,785 | | | $ | 5,239 | | | | -8.7 | % |
| Northern California | | | | | | | | | | | | | | | | | | | | | | | | | | | | | | | | | | | | | | |
| Alderwood Park, Newark, CA | | | | | | | 96 | | | | 6,846 | | Jun-2015 | | | | | | | | | | | | | | | | | | | | | | | | | |
| Carlmont Woods, Belmont, CA | | | | | | | 195 | | | | 12,453 | | Dec-2013 | | | | | | | | | | | | | | | | | | | | | | | | | |
| Davey Glen, Belmont, CA | | | | | | | 69 | | | | 6,654 | | Aug-2016 | | | | | | | | | | | | | | | | | | | | | | | | | |
| Enclave, San Jose, CA | | | | | | | 637 | | | | 17,653 | | Jan-2018 | | | | | | | | | | | | | | | | | | | | | | | | | |
| Enclave, San Jose, CA | | | | | | | | | | | 60,000 | | Dec-2029 | | | | | | | | | | | | | | | | | | | | | | | | | |
| Harbor Cove, Foster City, CA | | | | | | | 400 | | | | 33,580 | | Dec-2013 | | | | | | | | | | | | | | | | | | | | | | | | | |
| Regency Tower, Oakland, CA | | | | | | | 178 | | | | 10,683 | | Mar-2014 | | | | | | | | | | | | | | | | | | | | | | | | | |
| Total Northern California | | | | | | | 1,575 | | | | 147,869 | | | | | | 27,678 | | | | 28,418 | | | | -2.6 | % | | | 17,547 | | | | 17,771 | | | | -1.3 | % |
| Seattle Metro | | | | | | | | | | | | | | | | | | | | | | | | | | | | | | | | | | | | | | |
| Echo Ridge, Snoqualmie, WA | | | | | | | 120 | | | | 12,813 | | Sep-2014 | | | | | | | | | | | | | | | | | | | | | | | | | |
| Morning Run, Monroe, WA | | | | | | | 222 | | | | 13,258 | | Oct-2014 | | | | | | | | | | | | | | | | | | | | | | | | | |
| Tower @ 801, Seattle, WA | | | | | | | 173 | | | | 18,654 | | Aug-2014 | | | | | | | | | | | | | | | | | | | | | | | | | |
| Total Seattle Metro | | | | | | | 515 | | | | 44,725 | | | | | | 7,746 | | | | 8,186 | | | | -5.4 | % | | | 4,527 | | | | 5,003 | | | | -9.5 | % |
| | | | | | | | | | | | | | | | | | | | | | | | | | | | | | | | | | | | | | | | | | |
| Total - Operating Communities | | | | | | | 2,570 | | | | 239,684 | | | | | $ | 43,462 | | | $ | 44,981 | | | | -3.4 | % | | $ | 26,859 | | | $ | 28,013 | | | | -4.1 | % |
| | | | | | | | | | | | | | | | | | | | | | | | | | | | | | | | | | | | | | | | | | |
| Fund II - New Development | | | | | | | | | | | | | | | | | | | | | | | | | | | | | | | | | | | | | | |
| Eastlake 2851, Seattle, WA (initial occupancy May 2008) | | | 127 | | | | 17,520 | | Jan-2011 | (2) | | | | | | | | | | | | | | | | | | | | | | | | |
| Studio 40-41, Studio City, CA (initial occupancy April 2009) | | | 149 | | | | 35,923 | | Apr-2010 | (3) | | | | | | | | | | | | | | | | | | | | | | | | |
| Cielo, Chatsworth, CA (initial occupancy July 2009) | | | 119 | | | | 19,732 | | Jun-2010 | (3) | | | | | | | | | | | | | | | | | | | | | | | | |
| | | | | | | | | | | 395 | | | | 73,175 | | | | | $ | 3,739 | | | $ | 1,106 | | | | | | | $ | 1,892 | | | $ | 722 | | | | | |
| | | | | | | | | | | | | | | | | | | | | | | | | | | | | | | | | | | | | | | | | | |
| | | | | | | | | | | | | | | | | | | | | | | | | | | | | | | | | | | | | | | | | | |
| | | | | | | | | | | | | | | | | | | | | | | | | | | | | | | | | | | | | | | | | | |
| Total - Fund II | | $ | 69,563 | | | $ | 588,404 | | | 2,965 | | | $ | 312,859 | | | | | | | | | | | | | | | | | | | | | | | | | | | |
| | | | | | | | | | | | | | | | | | | | | | | | | | | | | | | | | | | | | | | | | | |
| Capitalized costs | | | 720 | | | | | | | | | | | | | | | | | | | | | | | | | | | | | | | | | | | | | | |
| | | | 70,283 | | | | | | | | | | | | | | | | | | | | | | | | | | | | | | | | | | | | | | |
| Other (4) | | | 500 | | | | | | | | | | | | | | | | | | | | | | | | | | | | | | | | | | | | | | |
| | | $ | 70,783 | | | | | | | | | | | | | | | | | | | | | | | | | | | | | | | | | | | | | | |
| (1) | The Company has a 28.2% interest as a general partner and limited partner in Fund II, and may earn promote income if Fund II exceeds certain financial return benchmarks. |
| (2) | The construction loan has a one-year extension, exercisable at Fund II's option. |
| (3) | The construction loan has two one-year extensions, exercisable at Fund II's option. |
| (4) | The other co-investment relates to a real estate technology investment. |
See Company's 10-K and 10-Q for additional disclosures
S-11
E S S E X P R O P E R T Y T R U S T, I N C.
Summary of Consolidated Co-Investments and Noncontrolling Interest - December 31, 2009
(Dollars in thousands)
The Company enters into co-investment transactions with third party developers, owners and investors of apartment communities. In accordance with GAAP, the Company consolidates certain of these co-investment transactions, resulting in noncontrolling interests corresponding to the ownership interest of the third-party developer, owner or investor.
The following table summarizes the consolidated co-investments and noncontrolling interest:
| | | | | | | | | | | | | | | Operations for the year ended | |
| | | Balance as of December 31, 2009 | | | December 31, 2009 | |
| | | Investment in | | | Related | | | Noncontrolling | | | DownREIT | | | | | | Operating | | | | |
| | | Real Estate | | | Debt | | | Interest | | | Units (1) | | | Revenue | | | Expenses | | | NOI | |
| | | | | | | | | | | | | | | | | | | | | | |
| Noncontrolling Interest - DownREIT: | | | | | | | | | | | | | | | | | | | | | |
| Anchor Village | | $ | 13,656 | | | $ | 10,750 | | | $ | 2,404 | | | | 110,133 | | | $ | 3,074 | | | $ | 1,260 | | | $ | 1,814 | |
| Barkley Apartments | | | 8,946 | | | | 17,442 | | | | 2,322 | | | | 79,205 | | | | 2,523 | | | | 917 | | | | 1,606 | |
| Brentwood | | | 14,731 | | | | 20,197 | | | | 2,568 | | | | 58,884 | | | | 2,340 | | | | 725 | | | | 1,615 | |
| Brookside Oaks | | | 33,895 | | | | 13,651 | | | | 3,805 | | | | 96,255 | | | | 3,042 | | | | 835 | | | | 2,207 | |
| Capri at Sunny Hills | | | 17,525 | | | | 18,673 | | | | 3,930 | | | | 167,365 | | | | 2,338 | | | | 631 | | | | 1,707 | |
| Hidden Valley (2) | | | 38,977 | | | | 32,240 | | | | 6,089 | | | | 62,647 | | | | 5,183 | | | | 1,493 | | | | 3,690 | |
| Highridge Apartments | | | 26,384 | | | | 44,807 | | | | 5,831 | | | | 293,733 | | | | 5,443 | | | | 1,550 | | | | 3,893 | |
| Montejo Apartments | | | 8,753 | | | | 5,618 | | | | 1,216 | | | | 29,319 | | | | 1,838 | | | | 491 | | | | 1,347 | |
| Thomas Jefferson | | | 26,496 | | | | 19,351 | | | | 7,067 | | | | 62,873 | | | | 2,907 | | | | 891 | | | | 2,016 | |
| Treehouse Apartments | | | 11,756 | | | | 7,564 | | | | 2,951 | | | | 67,728 | | | | 2,385 | | | | 763 | | | | 1,622 | |
| Valley Park Apartments | | | 15,245 | | | | 9,582 | | | | 306 | | | | 43,354 | | | | 2,830 | | | | 627 | | | | 2,203 | |
| Villa Angelina Apartments | | | 19,735 | | | | 12,958 | | | | 3,003 | | | | 57,709 | | | | 3,672 | | | | 990 | | | | 2,682 | |
| | | | | | | | | | | | | | | | | | | | | | | | | | | | | |
| | | $ | 236,099 | | | $ | 212,833 | | | | 41,492 | | | | 1,129,205 | | | $ | 37,575 | | | $ | 11,173 | | | $ | 26,402 | |
| | | | | | | | | | | | | | | | | | | | | | | | | | | | | |
| Other Components of Noncontrolling Interest: | | | | | | | | | | | | | | | | | | | | | | | | | | | | |
| Hillsdale Garden Apartments (3) | | $ | 112,409 | | | | - | | | | 22,805 | | | | | | | $ | 13,807 | | | $ | 5,608 | | | $ | 8,199 | |
| Joint Ventures - Development (4) | | $ | 93,400 | | | $ | 37,485 | | | | 4,229 | | | | | | | | | | | | | | | | | |
| Operating Limited Partnership Units | | | | | | | | | | | 71,919 | | | | | | | | | | | | | | | | | |
| Perpetual Preferred Units (5) | | | | | | | | | | | 80,000 | | | | | | | | | | | | | | | | | |
| | | | | | | | | | | | | | | | | | | | | | | | | | | | | |
| Total Noncontrolling Interest | | | | | | | | | | $ | 220,445 | | | | | | | | | | | | | | | | | |
| (1) | Represents the number of DownREIT units that are currently outstanding. Generally, DownREIT units can be redeemed at the holder's election for cash equal to the current price of Essex's common stock. |
| (2) | The Company has a 75% interest in this community and a joint venture partner has a 25% interest. |
| (3) | The Company has an 81.5% interest in this community and the joint venture partner has an 18.5% interest. |
| (4) | The Company consolidates two joint venture developments in which the Company has a 50% and 99% interest, respectively. |
| (5) | Includes Series B Cumulative Redeemable Preferred Units with an existing distribution rate of 7.875% and can be redeemed at the Company's option. |
See Company's 10-K and 10-Q for additional disclosures
S-12
E S S E X P R O P E R T Y T R U S T, I N C.
Income From Discontinued Operations and Selected Financial Data - December 31, 2009
(Dollars in thousands)
Income from Discontinued Operations
For the quarter ended December 31, 2009, the Company sold Maple Leaf and for the year ended December 31, 2009, the Company sold Maple Leaf, Carlton Heights, Grand Regency, Mountain View and Spring Lakes apartment communities. For the quarter ended December 31, 2008, the Company sold Coral Gardens, and for year ended December 31, 2008, the Company sold Coral Gardens, Cardiff by the Sea, and St. Cloud apartment communities.
| | | Three Months Ended | | | Twelve Months Ended | |
| | | December 31, | | | December 31, | |
| | | 2009 | | | 2008 | | | 2009 | | | 2008 | |
| Rental revenues | | $ | 120 | | | $ | 1,651 | | | $ | 1,991 | | | $ | 11,526 | |
| Property operating expenses | | | (25 | ) | | | (660 | ) | | | (752 | ) | | | (5,396 | ) |
| Interest expense | | | - | | | | (123 | ) | | | - | | | | (2,210 | ) |
| Depreciation and amortization | | | (34 | ) | | | (296 | ) | | | (495 | ) | | | (3,593 | ) |
| Income from real estate sold | | | 61 | | | | 572 | | | | 744 | | | | 327 | |
| Gain on sale | | | 2,917 | | | | 3,371 | | | | 8,626 | | | | 3,417 | |
| Internal disposition costs | | | (65 | ) | | | - | | | | (683 | ) | | | - | |
| Income from discontinued operations | | $ | 2,913 | | | $ | 3,943 | | | $ | 8,687 | | | $ | 3,744 | |
Shares Outstanding and Potentially Dilutive Securities
| | | Q4 2009 | | | Actual | | | YTD 2009 | |
| | | Weighted Avg. | | | As of 12/31/09 | | | Weighted Avg. | |
| Common Shares | | | 28,403,122 | | | | 28,849,779 | | | | 27,269,547 | |
| Stock Options | | | 43,539 | | | | 50,609 | | | | 29,317 | |
| Weighted Avg. Shares Diluted - EPS | | | 28,446,661 | | | | 28,900,388 | | | | 27,298,864 | |
| Operating Limited Partnership Units | | | 2,446,508 | | | | 2,398,479 | | | | 2,447,750 | |
| Weighted Avg. Shares Diluted - FFO | | | 30,893,169 | | | | 31,298,867 | | | | 29,746,614 | |
See Company's 10-K and 10-Q for additional disclosures
S-13
| E S S E X P R O P E R T Y T R U S T, I N C | | | | | | | | | | |
| | | | | | | | | | | | | | | | | | | | | | | | | |
| MSA Level Forecasts 2010: Supply, Jobs and Apartment Market Conditions (DRAFT) | |
| | | | | | | | | | | | | | | | | | | | | | | | | |
| | | Residential Supply* | | | Job Forecast** | | | Forecast Market Conditions*** | |
| Market | | New MF Supply | | | % of Total Stock | | | New SF Supply | | | % of Total Stock | | | Est.New Jobs Dec-Dec | | | % Growth | | | Estimated Y-o-Y Rent Growth | | | Estimated Year End Occupancy | |
| | | | | | | | | | | | | | | | | | | | | | | | | |
| Seattle | | | 3,500 | | | | 0.9 | % | | | 2,500 | | | | 0.6 | % | | | 7,500 | | | | 0.5 | % | | | -2.5 | % | | | 94.00 | % |
| | | | | | | | | | | | | | | | | | | | | | | | | | | | | | | | | |
| San Francisco | | | 1,900 | | | | 0.5 | % | | | 200 | | | | 0.1 | % | | | 4,000 | | | | 0.4 | % | | | 2.00 | % | | | 95.50 | % |
| Oakland | | | 900 | | | | 0.3 | % | | | 1,000 | | | | 0.2 | % | | | 2,000 | | | | 0.2 | % | | | -2.00 | % | | | 94.50 | % |
| San Jose | | | 700 | | | | 0.3 | % | | | 400 | | | | 0.1 | % | | | 4,000 | | | | 0.5 | % | | | 0.00 | % | | | 95.00 | % |
| No. Cal. | | | 3,500 | | | | 0.4 | % | | | 1,600 | | | | 0.1 | % | | | 10,000 | | | | 0.4 | % | | | 0.2 | % | | | 95.0 | % |
| | | | | | | | | | | | | | | | | | | | | | | | | | | | | | | | | |
| Ventura | | | 250 | | | | 0.5 | % | | | 200 | | | | 0.1 | % | | | 1,500 | | | | 0.5 | % | | | 2.00 | % | | | 94.50 | % |
| Los Angeles | | | 2,600 | | | | 0.2 | % | | | 1,500 | | | | 0.1 | % | | | 15,000 | | | | 0.4 | % | | | 0.00 | % | | | 94.50 | % |
| Orange | | | 1,100 | | | | 0.3 | % | | | 500 | | | | 0.1 | % | | | 7,000 | | | | 0.5 | % | | | 2.50 | % | | | 94.50 | % |
| San Diego | | | 1,100 | | | | 0.3 | % | | | 1,100 | | | | 0.2 | % | | | 5,000 | | | | 0.4 | % | | | 2.00 | % | | | 95.00 | % |
| So. Cal. | | | 5,050 | | | | 0.2 | % | | | 3,300 | | | | 0.1 | % | | | 28,500 | | | | 0.4 | % | | | 1.1 | % | | | 94.6 | % |
| | | | | | | | | | | | | | | | | | | | | | | | | | | | | | | | | |
| Weighted Average**** | | | 12,050 | | | | 0.3 | % | | | 7,400 | | | | 0.1 | % | | | 46,000 | | | | 0.4 | % | | | 0.0 | % | | | 94.5 | % |
All data is an Essex Forecast
U.S. Economic Assumptions: G.D.P.: 2010 vs 2009: 2.5% , Q4 '10 vs Q4 '09: 2.0%, Jobs: Q4 '10 vs Q4 '09 0.4%
* New Residential Supply represents Essex's internal estimate of actual deliveries during the year, which are related to but can differ from the 12 month trailing permit Levels reported on the new residential supply schedule.
** Job Forecast/Performance refers to the difference between Total Non-Farm Industry Employment (not seasonally adjusted) projected through Q4 2010 over the comparable actual figures for Q4 2009. The first column represents the current Essex forecast of the increase in Total Non-Farm Industry Employment. The second column represents these forecasted new jobs as a percent of the Q4 2009 base.
***The Forecast Market Conditions represents Essex's estimates of the change in rents/occupancy rates for the fourth quarter of 2010. The estimated year-over-year rent growth represents the forecast change in effective market rents for Q4 2010 vs.Q4 2009 (where Market refers to the entire MSA apartment market, not the Essex portfolio). The estimated year-end occupancy represents Essex's forecast of market occupancy rates for the fourth quarter of 2010.
****Weighted Average: Markets weighted by Units in Essex Portfolio
See Company's 10-K and 10-Q for additional disclosures
S-14
| E S S E X P R O P E R T Y T R U S T, I N C. | | | | | | | | | | | | | |
New Residential Supply: Permits as % of Current Stock (12 Month Permit Period: Trailing 12 Months December 2009) | |
| | | | | | | | | | | | | | | | | | | | | | | | | | | | | | | |
| | | Single Family Data | | | Multi-Family Data | | | All Residential Data | |
| Market | | Median SF Price (Q3 2009 est**) | | | Q2 2009 SF Affordability* | | | SF Stock 2000 | | | SF Permits Last 12 Months | | | % of Stock | | | MF Stock 2000 | | | MF Permits Last 12 months | | | % of Stock | | | Total Residential Permits Last 12 Months | | | % of Stock | |
| New York PMSA | | $ | 385,400 | | | | 66 | % | | | 760,000 | | | | 613 | | | | 0.1 | % | | | 2,920,000 | | | | 4,839 | | | | 0.2 | % | | | 5,452 | | | | 0.1 | % |
| Chicago | | $ | 210,100 | | | | 140 | % | | | 1,700,000 | | | | 4,442 | | | | 0.3 | % | | | 1,404,900 | | | | 1,452 | | | | 0.1 | % | | | 5,894 | | | | 0.2 | % |
| Miami/Ft. Lauderdale | | $ | 217,000 | | | | 105 | % | | | 717,000 | | | | 2,272 | | | | 0.3 | % | | | 876,000 | | | | 1,131 | | | | 0.1 | % | | | 3,403 | | | | 0.2 | % |
| Nassau-Suffolk | | $ | 385,400 | | | | 66 | % | | | 740,000 | | | | 974 | | | | 0.2 | % | | | 240,000 | | | | 1,416 | | | | 0.3 | % | | | 2,390 | | | | 0.3 | % |
| Boston | | $ | 348,000 | | | | 99 | % | | | 1,530,000 | | | | 3,054 | | | | 0.2 | % | | | 670,800 | | | | 2,053 | | | | 0.6 | % | | | 5,107 | | | | 0.3 | % |
| Philadelphia | | $ | 227,500 | | | | 122 | % | | | 1,532,000 | | | | 4,857 | | | | 0.3 | % | | | 515,100 | | | | 1,786 | | | | 0.3 | % | | | 6,643 | | | | 0.3 | % |
| Minneapolis | | $ | 184,800 | | | | 170 | % | | | 818,000 | | | | 3,631 | | | | 0.4 | % | | | 351,800 | | | | 970 | | | | 0.3 | % | | | 4,601 | | | | 0.4 | % |
| Atlanta | | $ | 129,400 | | | | 234 | % | | | 1,122,000 | | | | 5,397 | | | | 0.5 | % | | | 467,800 | | | | 994 | | | | 0.2 | % | | | 6,391 | | | | 0.4 | % |
| Denver | | $ | 229,100 | | | | 134 | % | | | 582,000 | | | | 2,709 | | | | 0.5 | % | | | 274,900 | | | | 1,279 | | | | 0.5 | % | | | 3,988 | | | | 0.5 | % |
| Baltimore | | $ | 261,100 | | | | 120 | % | | | 797,000 | | | | 3,110 | | | | 0.4 | % | | | 268,000 | | | | 1,909 | | | | 0.7 | % | | | 5,019 | | | | 0.5 | % |
| Portland | | $ | 244,501 | | | | 215 | % | | | 561,000 | | | | 3,028 | | | | 0.5 | % | | | 225,335 | | | | 794 | | | | 0.4 | % | | | 3,822 | | | | 0.5 | % |
| Wash. D.C. PMSA | | $ | 324,700 | | | | 122 | % | | | 1,299,000 | | | | 9,014 | | | | 0.7 | % | | | 644,300 | | | | 2,851 | | | | 0.4 | % | | | 11,865 | | | | 0.6 | % |
| Orlando | | $ | 157,900 | | | | 156 | % | | | 482,000 | | | | 3,707 | | | | 0.8 | % | | | 201,500 | | | | 719 | | | | 0.4 | % | | | 4,426 | | | | 0.6 | % |
| Phoenix | | $ | 142,700 | | | | 174 | % | | | 970,000 | | | | 8,657 | | | | 0.9 | % | | | 360,500 | | | | 642 | | | | 0.2 | % | | | 9,299 | | | | 0.7 | % |
| Las Vegas | | $ | 138,500 | | | | 171 | % | | | 440,000 | | | | 3,791 | | | | 0.9 | % | | | 215,700 | | | | 1,622 | | | | 0.8 | % | | | 5,413 | | | | 0.8 | % |
| Dallas-Ft. Worth | | $ | 150,500 | | | | 181 | % | | | 1,381,000 | | | | 14,130 | | | | 1.0 | % | | | 650,000 | | | | 5,773 | | | | 0.9 | % | | | 19,903 | | | | 1.0 | % |
| Houston | | $ | 160,600 | | | | 165 | % | | | 1,027,000 | | | | 22,360 | | | | 2.2 | % | | | 547,700 | | | | 4,709 | | | | 0.9 | % | | | 27,069 | | | | 1.7 | % |
| Austin | | $ | 189,101 | | | | 253 | % | | | 326,000 | | | | 6,669 | | | | 2.0 | % | | | 169,900 | | | | 2,049 | | | | 1.2 | % | | | 8,718 | | | | 1.8 | % |
| Totals | | $ | 242,040 | | | | 151 | % | | | 16,024,000 | | | | 101,802 | | | | 0.6 | % | | | 8,084,235 | | | | 32,149 | | | | 0.4 | % | | | 133,951 | | | | 0.6 | % |
| | | | | | | | | | | | | | | | | | | | | | | | | | | | | | | | | | | | | | | | | |
| Seattle | | $ | 347,700 | | | | 89 | % | | | 656,000 | | | | 3,684 | | | | 0.6 | % | | | 354,487 | | | | 1,121 | | | | 0.3 | % | | | 4,805 | | | | 0.5 | % |
| | | | | | | | | | | | | | | | | | | | | | | | | | | | | | | | | | | | | | | | | |
| San Francisco | | $ | 636,100 | | | | 58 | % | | | 368,000 | | | | 396 | | | | 0.1 | % | | | 344,000 | | | | 532 | | | | 0.2 | % | | | 928 | | | | 0.1 | % |
| Oakland | | $ | 385,100 | | | | 96 | % | | | 625,000 | | | | 1,881 | | | | 0.3 | % | | | 270,000 | | | | 603 | | | | 0.2 | % | | | 2,484 | | | | 0.3 | % |
| San Jose | | $ | 566,000 | | | | 73 | % | | | 388,000 | | | | 622 | | | | 0.2 | % | | | 192,000 | | | | 426 | | | | 0.2 | % | | | 1,048 | | | | 0.2 | % |
| | | | | | | | | | | | | | | | | | | | | | | | | | | | | | | | | | | | | | | | | |
| Los Angeles | | $ | 299,600 | | | | 84 | % | | | 1,877,000 | | | | 2,088 | | | | 0.1 | % | | | 1,392,963 | | | | 2,449 | | | | 0.2 | % | | | 4,537 | | | | 0.1 | % |
| Ventura | | $ | 366,400 | | | | 99 | % | | | 199,000 | | | | 207 | | | | 0.1 | % | | | 53,295 | | | | 83 | | | | 0.2 | % | | | 290 | | | | 0.1 | % |
| Orange | | $ | 452,700 | | | | 78 | % | | | 628,000 | | | | 1,300 | | | | 0.2 | % | | | 340,800 | | | | 673 | | | | 0.2 | % | | | 1,973 | | | | 0.2 | % |
| San Diego | | $ | 378,100 | | | | 73 | % | | | 664,000 | | | | 1,777 | | | | 0.3 | % | | | 375,664 | | | | 1,057 | | | | 0.3 | % | | | 2,834 | | | | 0.3 | % |
| | | | | | | | | | | | | | | | | | | | | | | | | | | | | | | | | | | | | | | | | |
| No Cal | | $ | 502,810 | | | | 79 | % | | | 1,381,000 | | | | 2,899 | | | | 0.2 | % | | | 806,000 | | | | 1,561 | | | | 0.2 | % | | | 4,460 | | | | 0.2 | % |
| | | | | | | | | | | | | | | | | | | | | | | | | | | | | | | | | | | | | | | | | |
| So Cal | | $ | 347,570 | | | | 82 | % | | | 3,368,000 | | | | 5,372 | | | | 0.2 | % | | | 2,162,722 | | | | 4,262 | | | | 0.2 | % | | | 9,634 | | | | 0.2 | % |
| | | | | | | | | | | | | | | | | | | | | | | | | | | | | | | | | | | | | | | | | |
| ESSEX | | $ | 387,250 | | | | 82 | % | | | 5,405,000 | | | | 11,955 | | | | 0.2 | % | | | 3,323,208 | | | | 6,944 | | | | 0.2 | % | | | 18,899 | | | | 0.2 | % |
Permits: single family equals 1 Unit, multi-family equals 5 or more units
Sources: SF Prices; Economy.com: Permits; Total Residential Stock: U.S. Census, Axiometrics; Mortgage Rates: Freddie Mac; Single Family and multi-family breakdown of total residences: Rosen Consulting Group, US Census, EASI, Essex
*Single Family Affordability - Equals the ratio of the actual median household income to the income required to purchase the median priced home.
**Median Home Prices - Q3 2009 National Association of Realtors, DataQuick, Essex
The required Income is defined such that the mortgage payment is 35% of said Income, assuming a 10% down payment and a 30-year fixed mortgage rate (6.03%).
Median Household Income is estimated from US Census 2004 data and income growth from BEA and population growth from the US Census.
See Company's 10-K and 10-Q for additional disclosures
S-15
| | ESSEX PROPERTY TRUST, INC. |
| | Real Estate Information as of December 31, 2009 |
| | | | | | | Square | Year | Year | Property | Age of |
| | Property Name | Address | City | State | Units | Footage | Acquired | Built | Ownership | Property |
| | | | | | | | | | | |
| | APARTMENT COMMUNITIES | |
| | | | | | | | | | | |
| | NORTHERN CALIFORNIA | | | | | | | | |
| | Santa Clara County | | | | | | | | | |
| 1 | Pointe at Cupertino | 19920 Olivewood Street | Cupertino | CA | 116 | 135,200 | 1998 | 1963 | EPLP | 46 |
| 1 | Carlyle, The | 2909 Nieman Boulevard | San Jose | CA | 132 | 129,200 | 2000 | 2000 | EPLP | 9 |
| 1 | Enclave, The | 4355 Renaissance Drive | San Jose | CA | 637 | 525,463 | 2005 | 1998 | Fund II | 11 |
| 1 | Esplanade | 350 East Taylor St. | San Jose | CA | 278 | 279,000 | 2004 | 2002 | EPLP | 7 |
| 1 | Waterford, The | 1700 N. First Street | San Jose | CA | 238 | 219,600 | 2000 | 2000 | EPLP | 9 |
| 1 | Le Parc | 440 N. Winchester Avenue | Santa Clara | CA | 140 | 113,200 | 1994 | 1975 | EPLP | 34 |
| 1 | Marina Cove | 3480 Granada Avenue | Santa Clara | CA | 292 | 250,200 | 1994 | 1974 | EPLP | 35 |
| 1 | Bristol Commons | 732 E. Evelyn Avenue | Sunnyvale | CA | 188 | 142,600 | 1995 | 1989 | EPLP | 20 |
| 1 | Brookside Oaks | 1651 Belleville Way | Sunnyvale | CA | 170 | 119,900 | 2000 | 1973 | DownREIT | 36 |
| 1 | Magnolia Lane | 113 South Mary Avenue | Sunnyvale | CA | 32 | 31,541 | 2007 | 2001 | EPLP | 8 |
| 1 | Montclaire | 450 N. Mathilda Avenue | Sunnyvale | CA | 390 | 294,100 | 1988 | 1973 | EPLP | 36 |
| 1 | Summerhill Park | 972 Corte Madera Avenue | Sunnyvale | CA | 100 | 78,500 | 1988 | 1988 | EPLP | 21 |
| | Tasman Place Retail Pad | 315 Tasman Drive | Sunnyvale | CA | - | 14,100 | | | EPLP | |
| 1 | Thomas Jefferson | 107 South Mary Avenue | Sunnyvale | CA | 156 | 110,824 | 2007 | 1969 | DownREIT | 40 |
| 1 | Windsor Ridge | 825 E. Evelyn Avenue | Sunnyvale | CA | 216 | 161,800 | 1989 | 1989 | EPLP | 20 |
| | | | | 11% | 3,085 | 2,591,128 | | | | |
| | Alameda County | | | | | | | | | |
| | Fourth & U | 700 University Avenue | Berkeley | CA | 171 | 184,099 | | | EPLP | |
| 1 | Stevenson Place | 4141 Stevenson Blvd. | Fremont | CA | 200 | 146,200 | 2000 | 1975 | EPLP | 34 |
| 1 | Boulevard | 40001 Fremont Blvd. | Fremont | CA | 172 | 131,200 | 1996 | 1978 | EPLP | 31 |
| 1 | City View | 25200 Carlos Bee Blvd. | Hayward | CA | 560 | 462,400 | 1998 | 1975 | EPLP | 34 |
| 1 | Regency Tower | 1130 Third Ave. | Oakland | CA | 178 | 140,900 | 2005 | 1975 | Fund II | 34 |
| 1 | The Grand | 100 Grand Avenue | Oakland | CA | 238 | 205,026 | 2009 | 2009 | EPLP | - |
| 1 | Bridgeport | 36826 Cherry Street | Newark | CA | 184 | 139,000 | 1987 | 1987 | EPLP | 22 |
| 1 | Alderwood Park Apartments | 37057 Magnolia Street | Newark | CA | 96 | 74,624 | 2006 | 1987 | Fund II | 22 |
| | | | | 6% | 1,628 | 1,094,324 | | | | |
| | Contra Costa County | | | | | | | | | |
| 1 | San Marcos | 2601 Hilltop Drive | Richmond | CA | 432 | 407,600 | 2003 | 2003 | EPLP | 6 |
| 1 | Bel Air | 2000 Shoreline Drive | San Ramon | CA | 462 | 391,000 | 1995 | 1988 | EPLP | 21 |
| 1 | Foothill Gardens | 1110 Harness Drive | San Ramon | CA | 132 | 155,100 | 1997 | 1985 | EPLP | 24 |
| 1 | Twin Creeks | 2711-2731 Morgan Drive | San Ramon | CA | 44 | 51,700 | 1997 | 1985 | EPLP | 24 |
| 1 | Canyon Oaks | 1 Amberstone Lane | San Ramon | CA | 250 | 237,894 | 2007 | 2005 | EPLP | 4 |
| 1 | Mill Creek at Windermere | 2100 Waterstone Place | San Ramon | CA | 400 | 381,060 | 2007 | 2005 | EPLP | 4 |
| | | | | 6% | 1,720 | 1,624,354 | | | | |
| | San Mateo County | | | | | | | | | |
| 1 | Carlmont Woods | 2515 Carlmont Drive | Belmont | CA | 195 | 107,200 | 2004 | 1971 | Fund II | 38 |
| 1 | Harbor Cove | 900 E. Hillsdale Blvd. | Foster City | CA | 400 | 306,600 | 2004 | 1971 | Fund II | 38 |
| 1 | Davey Glen | 200 Davey Glen Road | Belmont | CA | 69 | 65,974 | 2006 | 1962 | Fund II | 47 |
| 1 | Hillsdale Garden | 3421 Edison Avenue | San Mateo | CA | 697 | 611,505 | 2006 | 1948 | JV - 81.5% | 61 |
| 1 | Belmont Terrace | 1606 Continetals Way | Belmont | CA | 71 | 72,951 | 2006 | 1974 | EPLP | 35 |
| | | | | 6% | 1,432 | 1,164,230 | | | | |
| | | | | | | | | | | |
| | San Francisco and Marin Counties | | | | | | | | | |
| 1 | Mt. Sutro Terrace Apartments | 480 Warren Drive | San Francisco | CA | 99 | 64,000 | 1999 | 1973 | EPLP | 36 |
| 1 | Vista Belvedere | 15 Red Hill Circle | Tiburon | CA | 76 | 78,300 | 2004 | 1963 | EPLP | 46 |
| | | | | 1% | 175 | 142,300 | | | | |
| | | | | | | | | | | |
| | Other | | | | | | | | | |
| 1 | Tuscana | 315 Mt. Oso | Tracy | CA | 30 | 29,088 | 2007 | 2007 | EPLP | 2 |
| 1 | Harvest Park | 2327 Summercreek Drive | Santa Rosa | CA | 104 | 116,628 | 2007 | 2004 | EPLP | 5 |
| 1 | Chestnut Street Apartments | 143 Chestnut Avenue | Santa Cruz | CA | 96 | 87,640 | 2008 | 2002 | EPLP | 7 |
| | | | | 1% | 230 | 233,356 | | | | |
| | | | | | | | | | | |
| 37 | Total Northern California | | | 30% | 8,270 | 6,849,692 | | | | 25 |
| | | | | | | | | | | |
| | SOUTHERN CALIFORNIA | | | | | | | | |
| | Los Angeles County | | | | | | | | | |
| 1 | Hampton Court | 1136 N. Columbus Avenue | Glendale | CA | 83 | 71,500 | 1999 | 1974 | EPLP | 35 |
| 1 | Hampton Place | 245 W. Loraine Street | Glendale | CA | 132 | 141,500 | 1999 | 1970 | EPLP | 39 |
| 1 | Marbrisa | 1809 Termino Ave. | Long Beach | CA | 202 | 122,800 | 2002 | 1987 | EPLP | 22 |
| 1 | Pathways | 5945 E. Pacific Coast Hwy. | Long Beach | CA | 296 | 197,700 | 1991 | 1975 | EPLP | 34 |
| 1 | Bunker Hill | 222 and 234 S. Figueroa St. | Los Angeles | CA | 456 | 346,600 | 1998 | 1968 | EPLP | 41 |
| 1 | Cochran Apartments | 612 South Cochran | Los Angeles | CA | 58 | 51,400 | 1998 | 1989 | EPLP | 20 |
| 1 | Kings Road | 733 North Kings Road | Los Angeles | CA | 196 | 132,100 | 1997 | 1979 | EPLP | 30 |
| 1 | Marbella | 600 South Detroit Street | Los Angeles | CA | 60 | 50,108 | 2005 | 1991 | EPLP | 18 |
| 1 | Belmont Station | 1302 West 2nd St. | Los Angeles | CA | 275 | 225,000 | 2009 | 2009 | EPLP | - |
| 1 | Park Place | 400 S. Detroit Street | Los Angeles | CA | 60 | 48,000 | 1997 | 1988 | EPLP | 21 |
| 1 | Windsor Court | 401 S. Detroit Street | Los Angeles | CA | 58 | 46,600 | 1997 | 1988 | EPLP | 21 |
| 1 | Renaissance | 630 South Masselin Avenue | Los Angeles | CA | 168 | 154,268 | 2006 | 1990 | Fund II | 19 |
| 1 | Marina City Club | 4333 Admiralty Way | Marina Del Rey | CA | 101 | 127,200 | 2004 | 1971 | EPLP | 38 |
| 1 | Mirabella | 13701 Marina Point Drive | Marina Del Rey | CA | 188 | 176,800 | 2000 | 2000 | EPLP | 9 |
| 1 | Monterra del Mar | 280 E. Del Mar Boulevard | Pasadena | CA | 123 | 74,400 | 1997 | 1972 | EPLP | 37 |
| 1 | Monterra del Rey | 350 Madison | Pasadena | CA | 84 | 73,100 | 1999 | 1972 | EPLP | 37 |
| 1 | Monterra del Sol | 280 South Euclid | Pasadena | CA | 85 | 69,200 | 1999 | 1972 | EPLP | 37 |
| 1 | Fountain Park | 13141 Fountain Park Drive | Playa Vista | CA | 705 | 608,900 | 2004 | 2002 | EPLP | 7 |
| 1 | Highridge | 28125 Peacock Ridge Drive | Rancho Palos Verde | CA | 255 | 290,200 | 1997 | 1972 | DownREIT | 37 |
| 1 | Studio 40-41 | 4043 Radford Avenue | Studio City | CA | 149 | 127,238 | 2009 | 2009 | Fund II | - |
| 1 | Coldwater Canyon | 4250 Codlwater Canyon | Studio City | CA | 39 | 34,125 | 2007 | 1979 | EPLP | 30 |
| 1 | Walnut Heights | 20700 San Jose Hills Road | Walnut | CA | 163 | 146,700 | 2003 | 1964 | EPLP | 45 |
| 1 | Avondale at Warner Center | 22222 Victory Blvd. | Woodland Hills | CA | 446 | 331,000 | 1999 | 1970 | EPLP | 39 |
| | | | | 16% | 4,382 | 3,646,439 | | | | |
| | Ventura County | | | | | | | | | |
| 1 | Camarillo Oaks | 921 Paseo Camarillo | Camarillo | CA | 564 | 459,000 | 1996 | 1985 | EPLP | 24 |
| 1 | Camino Ruiz Square | 105 Camino Ruiz | Camarillo | CA | 160 | 105,448 | 2006 | 1990 | EPLP | 19 |
| 1 | Cielo | 9733 Topanga Canyon Blvd | Chatsworth | CA | 119 | 125,400 | 2009 | 2009 | Fund II | - |
| 1 | Regency at Encino | 15506 Moorpark Street | Encino | CA | 75 | 78,487 | 2009 | 1989 | EPLP | 20 |
| 1 | Mariner's Place | 711 South B Street | Oxnard | CA | 105 | 77,200 | 2000 | 1987 | EPLP | 22 |
| 1 | Tierra Vista | 1750 Montevina Circle | Oxnard | CA | 404 | 387,100 | 2001 | 2001 | EPLP | 8 |
| 1 | Monterey Villas | 1040 Kelp Lane | Oxnard | CA | 122 | 122,100 | 1997 | 1974 | EPLP | 35 |
| 1 | Meadowood | 1733 Cochran Street | Simi Valley | CA | 320 | 264,500 | 1996 | 1986 | EPLP | 23 |
| 1 | Hidden Valley | 5065 Hidden Park Court | Simi Valley | CA | 324 | 310,900 | 2004 | 2004 | DownREIT | 5 |
| 1 | Lofts at Pinehurst,The | 1021 Scandia Avenue | Ventura | CA | 118 | 71,100 | 1997 | 1971 | EPLP | 38 |
| 1 | Hillcrest Park | 1800 West Hillcrest Drive | Newbury Park | CA | 608 | 521,900 | 1998 | 1973 | EPLP | 36 |
| 1 | Pinehurst | 3980 Telegraph Road | Ventura | CA | 28 | 21,200 | 2004 | 1973 | EPLP | 36 |
| 1 | Woodside Village | 675 Providence Ave. | Ventura | CA | 145 | 136,500 | 2004 | 1987 | EPLP | 22 |
| | | | | 11% | 3,092 | 2,680,835 | | | | |
| | SOUTHERN CALIFORNIA (cont'd) | | | | | | | | | |
| | | | | | | | | | | | |
| | Santa Barbara County | | | | | | | | | | |
| 1 | Chimney Sweep | 775 Camino Del Sur Drive | Goleta | CA | | 91 | | 2006 | 1967 | EPLP | 42 |
| 1 | CBC | 6721 El Colegio Drive | Goleta | CA | | 148 | | 2006 | 1962 | EPLP | 47 |
| 1 | Hope Ranch (Continental Apartments) | 3968-3974 & 3999 Via Lucero | Santa Barbara | CA | | 108 | | 2007 | 1965 | EPLP | 44 |
| | Hope Ranch (Lucero Village) | 3968-3974 & 3999 Via Lucero | Santa Barbara | CA | | | | 2007 | 1973 | EPLP | 36 |
| | | | | 1% | | 347 | 306,608 | | | | |
| | Orange County | | | | | | | | | | |
| 1 | Barkley Apartments | 2400 E. Lincoln Ave. | Anahiem | CA | | 161 | 139,800 | 2000 | 1984 | DownREIT | 25 |
| 1 | Valley Park Apartments | 17300 Euclid Ave. | Fountain Valley | CA | | 160 | 169,700 | 2001 | 1969 | DownREIT | 40 |
| 1 | Capri at Sunny Hills | 2341 Daphne Place | Fullerton | CA | | 100 | 128,100 | 2001 | 1961 | DownREIT | 48 |
| 1 | Wilshire Promenade | 141 West Wilshire Avenue | Fullerton | CA | | 149 | 128,000 | 1997 | 1992 | EPLP | 17 |
| 1 | Montejo Apartments | 12911 Dale St. | Garden Grove | CA | | 124 | 103,200 | 2001 | 1974 | DownREIT | 35 |
| 1 | Huntington Breakers | 21270 Beach Boulevard | Huntington Beach | CA | | 342 | 241,700 | 1997 | 1984 | EPLP | 25 |
| | DuPont Lofts | 2300 DuPont Drive | Irvine | CA | | 115 | 170,714 | | | EPLP | |
| 1 | Hillsborough Park | 1501 South Beach Boulevard | La Habra | CA | | 235 | 215,500 | 1999 | 1999 | EPLP | 10 |
| 1 | Trabuco Villas | 25362 Mosswood Way | Lake Forest | CA | | 132 | 131,000 | 1997 | 1985 | EPLP | 24 |
| 1 | Fairways Apartments | 2 Pine Valley Lane | Newport Beach | CA | | 74 | 107,100 | 1999 | 1972 | EPLP | 37 |
| 1 | Villa Angelina | 201 E. Chapman Ave. | Placentia | CA | | 256 | 217,600 | 2001 | 1970 | DownREIT | 39 |
| 1 | Brentwood Apartment Homes | 2301 E. Santa Clara Ave. | Santa Ana | CA | | 140 | 154,800 | 2001 | 1970 | DownREIT | 39 |
| 1 | Treehouse Apartments | 2601 N. Grand Ave. | Santa Ana | CA | | 164 | 135,700 | 2001 | 1970 | DownREIT | 39 |
| | | | | 7% | | 2,037 | 1,872,200 | | | | |
| | San Diego County | | | | | | | | | | |
| 1 | Alpine Country | 2660 Alpine Blvd. | Alpine | CA | | 108 | 81,900 | 2002 | 1986 | EPLP | 23 |
| 1 | Alpine Village | 2055 Arnold Way | Alpine | CA | | 306 | 254,400 | 2002 | 1971 | EPLP | 38 |
| 1 | Bonita Cedars | 5155 Cedarwood Rd. | Bonita | CA | | 120 | 120,800 | 2002 | 1983 | EPLP | 26 |
| 1 | Cambridge | 660 F. St. | Chula Vista | CA | | 40 | 22,100 | 2002 | 1965 | EPLP | 44 |
| 1 | Woodlawn Colonial | 245-255 Woodlawn Ave. | Chula Vista | CA | | 159 | 104,500 | 2002 | 1974 | EPLP | 35 |
| 1 | Mesa Village | 5265 Clairemont Mesa Blvd. | Clairemont | CA | | 133 | 43,600 | 2002 | 1963 | EPLP | 46 |
| 1 | Tierra del Sol/Norte | 989 Peach Ave. | El Cajon | CA | | 156 | 117,000 | 2002 | 1969 | EPLP | 40 |
| 1 | Mira Monte | 10360 Maya Linda Rd. | Mira Mesa | CA | | 355 | 262,600 | 2002 | 1982 | EPLP | 27 |
| 1 | Country Villas | 283 Douglas Drive | Oceanside | CA | | 180 | 179,700 | 2002 | 1976 | EPLP | 33 |
| 1 | Mission Hills | 218 Rancho Del Oro | Oceanside | CA | | 282 | 244,000 | 2005 | 1984 | EPLP | 25 |
| 1 | Bluffs II, The | 6466 Friars Road | San Diego | CA | | 224 | 126,700 | 1997 | 1974 | EPLP | 35 |
| 1 | Summit Park | 8563 Lake Murray Blvd. | San Diego | CA | | 300 | 229,400 | 2002 | 1972 | EPLP | 37 |
| 1 | Vista Capri - North | 3277 Berger Ave. | San Diego | CA | | 106 | 51,800 | 2002 | 1975 | EPLP | 34 |
| 1 | Shadow Point | 9830 Dale Ave. | Spring Valley | CA | | 172 | 131,200 | 2002 | 1983 | EPLP | 26 |
| | | | | 10% | | 2,641 | 1,969,700 | | | | |
| | Riverside County | | | | | | | | | | |
| 1 | Parcwood | 1700 Via Pacifica | Corona | CA | | 312 | 270,000 | 2004 | 1989 | Fund II | 20 |
| 1 | Devonshire Apartments | 2770 West Devonshire Ave. | Hemet | CA | | 276 | 207,200 | 2002 | 1988 | EPLP | 21 |
| | | | | 2% | | 588 | 477,200 | | | | |
| | | | | | | | | | | | |
| 67 | Total Southern California | | | 48% | | 13,087 | 10,952,982 | | | | 29 |
| | | | | | | | | | | | |
| | SEATTLE METROPOLITAN AREA | | | | | | | | | |
| 1 | Cedar Terrace | 3205 115th Ave. NE | Bellevue | WA | | 180 | 174,200 | 2005 | 1984 | EPLP | 25 |
| 1 | Emerald Ridge | 3010 118th Avenue SE | Bellevue | WA | | 180 | 144,000 | 1994 | 1987 | EPLP | 22 |
| 1 | Foothill Commons | 13800 NE 9th Place | Bellevue | WA | | 388 | 288,300 | 1990 | 1978 | EPLP | 31 |
| 1 | Palisades, The | 13808 NE 12th | Bellevue | WA | | 192 | 159,700 | 1990 | 1977 | EPLP | 32 |
| 1 | Sammamish View | 16160 SE Eastgate Way | Bellevue | WA | | 153 | 133,500 | 1994 | 1986 | EPLP | 23 |
| 1 | Woodland Commons | 13700 NE 10th Place | Bellevue | WA | | 236 | 172,300 | 1990 | 1978 | EPLP | 31 |
| 1 | Canyon Pointe | 1630 228th St. SE | Bothell | WA | | 250 | 210,400 | 2003 | 1990 | EPLP | 19 |
| 1 | Inglenook Court | 14220 Juanita Drive, NE | Bothell | WA | | 224 | 183,600 | 1994 | 1985 | EPLP | 24 |
| 1 | Salmon Run at Perry Creek | 2109 228th Street SE | Bothell | WA | | 132 | 117,100 | 2000 | 2000 | EPLP | 9 |
| 1 | Stonehedge Village | 14690 143rd Blvd., NE | Bothell | WA | | 196 | 214,800 | 1997 | 1986 | EPLP | 23 |
| 1 | Park Hill at Issaquah | 22516 SE 56th Street | Issaquah | WA | | 245 | 277,700 | 1999 | 1999 | EPLP | 10 |
| 1 | Highlands at Wynhaven | 1460 NE Hawthorne Street | Issaquah | WA | | 333 | 424,674 | 2008 | 2000 | EPLP | 9 |
| 1 | Wandering Creek | 12910 SE 240th | Kent | WA | | 156 | 124,300 | 1995 | 1986 | EPLP | 23 |
| 1 | Bridle Trails | 6600 130th Avenue, NE | Kirkland | WA | | 108 | 99,700 | 1997 | 1986 | EPLP | 23 |
| 1 | Evergreen Heights | 12233 NE 131st Way | Kirkland | WA | | 200 | 188,300 | 1997 | 1990 | EPLP | 19 |
| 1 | Morning Run | 18463 Blueberry Lane | Monroe | WA | | 222 | 221,786 | 2005 | 1991 | Fund II | 18 |
| 1 | Laurels at Mill Creek | 1110 164th Street SE | Mill Creek | WA | | 164 | 134,300 | 1996 | 1981 | EPLP | 28 |
| 1 | Anchor Village | 9507 49th Avenue West | Mukilteo | WA | | 301 | 245,900 | 1997 | 1981 | DownREIT | 28 |
| 1 | Castle Creek | 7000 132nd Place, SE | Newcastle | WA | | 216 | 191,900 | 1998 | 1998 | EPLP | 11 |
| 1 | Brighton Ridge | 2307 NE 4th Street | Renton | WA | | 264 | 201,300 | 1996 | 1986 | EPLP | 23 |
| 1 | Fairwood Pond | 14700 SE Petrovitsky Rd. | Renton | WA | | 194 | 189,200 | 2004 | 1997 | EPLP | 12 |
| 1 | Forest View | 650 Duvall Ave. NE | Renton | WA | | 192 | 182,500 | 2003 | 1998 | EPLP | 11 |
| | Joule Broadway | 523 Broadway Avenue, East | Seattle | WA | | 295 | 297,146 | | | JV - 99% | |
| 1 | The Cairns | 420 Yale Avenue | Seattle | WA | | 100 | 70,806 | 2007 | 2006 | EPLP | 3 |
| 1 | Fountain Court | 2400 4th Street | Seattle | WA | | 320 | 207,000 | 2000 | 2000 | EPLP | 9 |
| 1 | Linden Square | 13530 Linden Avenue North | Seattle | WA | | 183 | 142,200 | 2000 | 1994 | EPLP | 15 |
| 1 | Eastlake 2851 | 2833 - 2851 Eastlake Avenue | Seattle | WA | | 127 | 234,086 | 2008 | 2008 | Fund II | 1 |
| 1 | Wharfside Pointe | 3811 14th Avenue West | Seattle | WA | | 142 | 119,200 | 1994 | 1990 | EPLP | 19 |
| 1 | Tower @ 801 | 801 Pine Street | Seattle | WA | | 173 | 118,500 | 2005 | 1970 | Fund II | 39 |
| 1 | Echo Ridge | 34907 SE Kinsey Street | Snoqualmie | WA | | 120 | 124,359 | 2005 | 2000 | Fund II | 9 |
| 29 | Total Seattle Metropolitan Area | | | 22% | | 5,891 | 5,295,611 | | | | 19 |
| | | | | | | | | | | | |
| | | | | | | | | | | | |
| | 133 | Apartment Communities | | 100% | | 27,248 | 23,098,285 | | | | |
| | | Apartment Communities Under Construction | | | | 581 | 666,059 | | | | |
| | | | | | | | | | | | |
| | Avg. square footage | 848 | | Definitions for Property Ownership | | | | |
| | Avg. units per property | 205 | | EPLP | | The Company has a 100% ownership in the community. |
| | Avg. age of property | 26 | | Fund II | | The community is owned by Fund II. The Company has a 28.2% interest in Fund II which is accounted for using the equity method of accounting. |
| | (1) Includes 44,318 square feet of retail or commercial space | DownREIT | | The Company holds a 1% special limited partner interest in the partnerships which owns the community. In accordance with GAAP, the Company consolidates this community. |
| | (2) Includes 58,700 square feet of estimated retail or commercial space | | | |
| | | | | JV - 81.5% | | The Company has a 81.5% ownership in this community and is consolidated. |
| | OTHER REAL ESTATE ASSETS | | JV - 99% | | The Company has a 99% ownership in this development and is consolidated. |
| | Office Buildings | | | | | | | | | | |
| | Essex Corporate Headquarter Bldg. | 925 / 935 E. Meadow Dr. | Palo Alto | CA | | | 31,900 | 1997 / 2007 | 1988 / 1962 | EPLP | |
| | Derian Office Building | 17461 Derian Av. | Irvine | CA | | | 110,000 | 2000 | 1983 | EPLP | |
| | Essex Southern Cal. Office Building | 22110-22120 Clarendon St. | Woodland Hills | CA | | | 38,940 | 2001 | 1982 | EPLP | |
| | Hollywood | 6230 Sunset Blvd. | Los Angeles | CA | | | 35,000 | 2006 | 1938 | EPLP | |
| | | | | | | | 215,840 | | | | |