Exhibit 99.1
![](https://capedge.com/proxy/8-K/0001140361-11-038007/ex99_11.jpg)
ESSEX PROPERTY TRUST
Millennium- Los Angeles, CA (438 units)
Acquired 2011
![](https://capedge.com/proxy/8-K/0001140361-11-038007/ex99_12.jpg)
CREATING OPPORTUNITIES for GROWTH
Santee Court - Los Angeles, CA
416 on Broadway - Glendale, CA
Arbors at Parc Rose - Oxnard, CA
Muse - Los Angeles, CA
101 San Fernando - San Jose, CA
Essex Skyline, - Irvine, CA
![](https://capedge.com/proxy/8-K/0001140361-11-038007/ex99_13.jpg)
EXTERNAL GROWTH
Since January 2010, Essex has acquired or developed over $1.2 billion in new investments
1 | Corbella (169 units) |
2 | Elevation (157 units) |
3 | Courtyard off Main (109 units) |
4 | Joule (295 units) |
5 | Fourth & U (171 units) |
6 | Via (284 units) |
7 | Family Tree (121 units) |
8 | 101 San Fernando (323 units) |
9 | The Commons (264 units) |
10 | Bella Villagio (231 units) |
11 | Arbors at Parc Rose (373 units) |
12 | Millennium (438 units) |
13 | Bellerive (63 units) |
14 | Allegro (96 units) |
15 | Muse (152 units) |
16 | 416 on Broadway (115 units) |
17 | Orsini I & II (862 units) |
18 | Piero (225 units) |
19 | Reserve Lofts (79 units) |
20 | Santee Court (165 units) |
20 | Santee Village (73 units) |
21 | Anavia (250 units) |
22 | Madison Anaheim (768 units) |
23 | Skyline (349 units) |
Seattle Area
Northern California
Southern California
3
4
5
6
1
2
3
7
8
9
10
11
12
13
15
14
16
23
17
19
Acquisitions ($884 mn)
Completed Development ($265 mn)
Preferred Equity Investments ($52 mn)
22
![](https://capedge.com/proxy/8-K/0001140361-11-038007/ex99_14.jpg)
1971 George Marcus forms Essex Property Corporation
1988 Essex delivers 8 development communities under the name Summerhill Development
1994 Prices IPO at $19.50 per share (6.3 million shares). Essex has ownership in 16 apartment
communities in the West Coast
1997 Increases portfolio by 60%, acquiring 27 communities. Reaches $1 billion market
capitalization
capitalization
2001 Creates Essex Apartment Value Fund L.P. with approximately $700 million in investment
capability
capability
2002 Acquires John M. Sachs, Inc. through a merger and adds 18 communities to portfolio
2004 Sells remaining Essex Fund I assets for $756 million, generating a 41% gross partnership IRR
and forms Essex Apartment Value Fund II with $750 million investment capacity
2010 Michael Schall appointed new CEO. Company acquires 12 communities for $584 million
and achieves 42% one-year total shareholder return
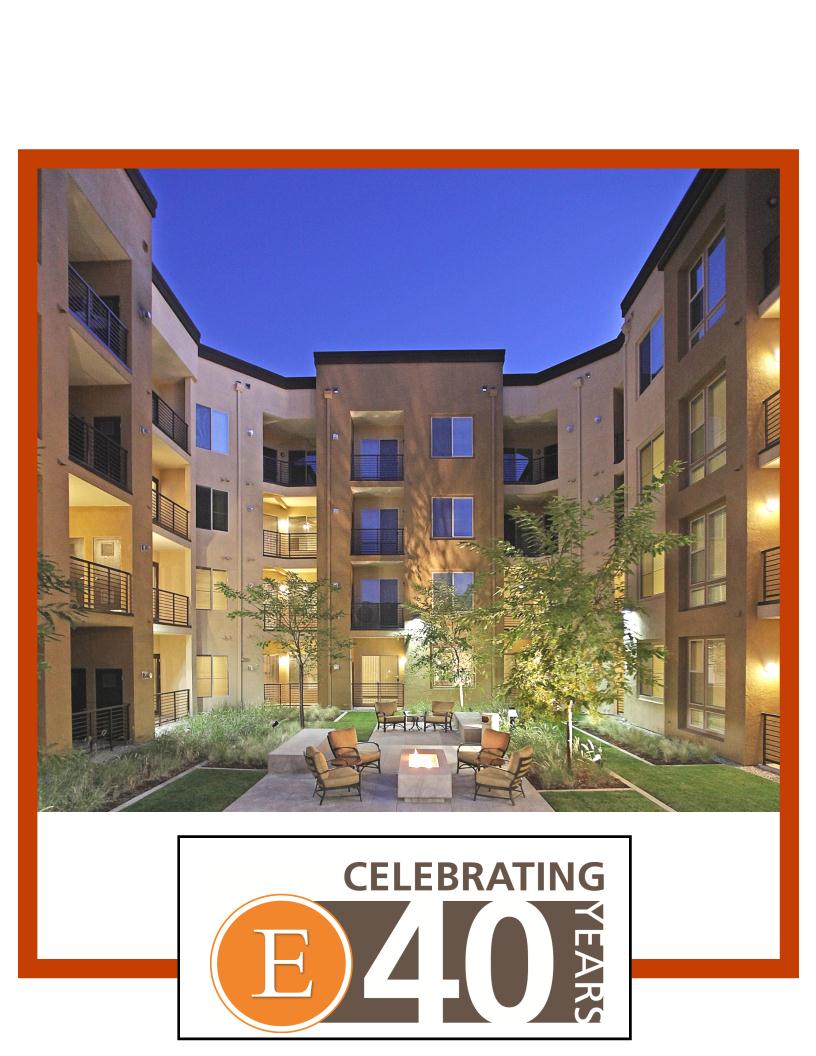
CELEBRATING 40 YEARS of EXCELLENCE
ACCOMPLISHMENTS
§ Highest total return of any REIT since IPO - 1,882% (Source: SNL Financial)
§ Cumulative Dividend paid in excess of $50 per share since IPO
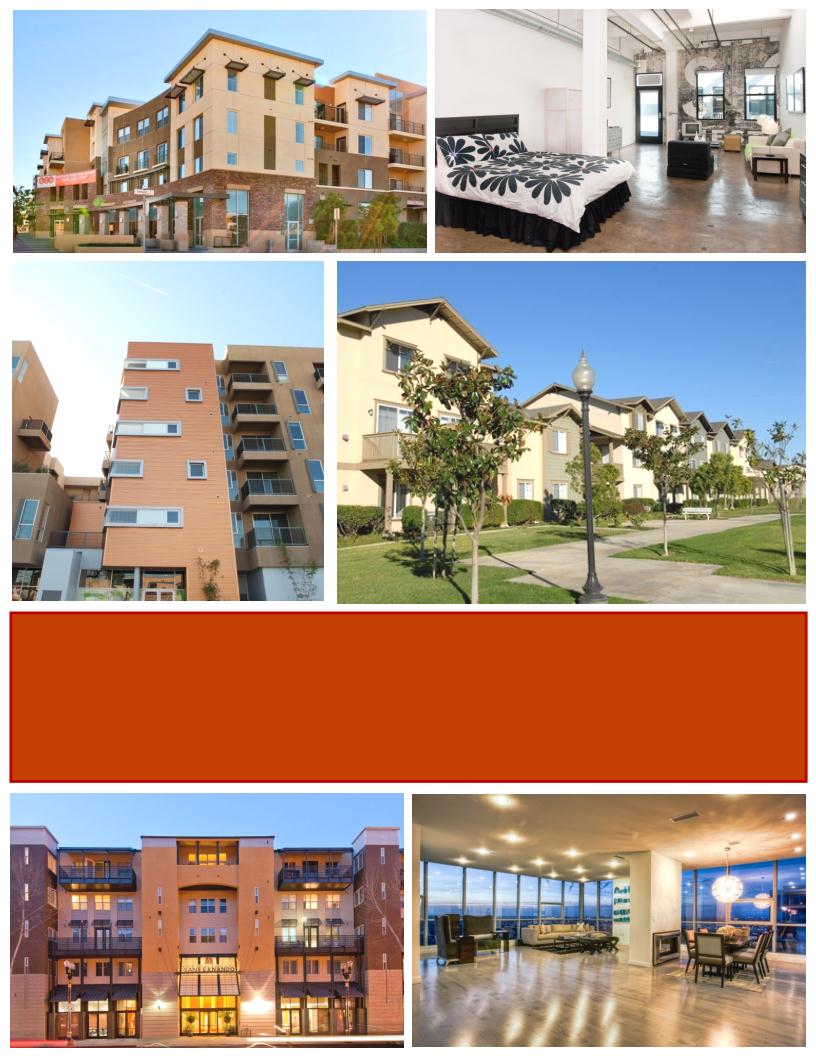
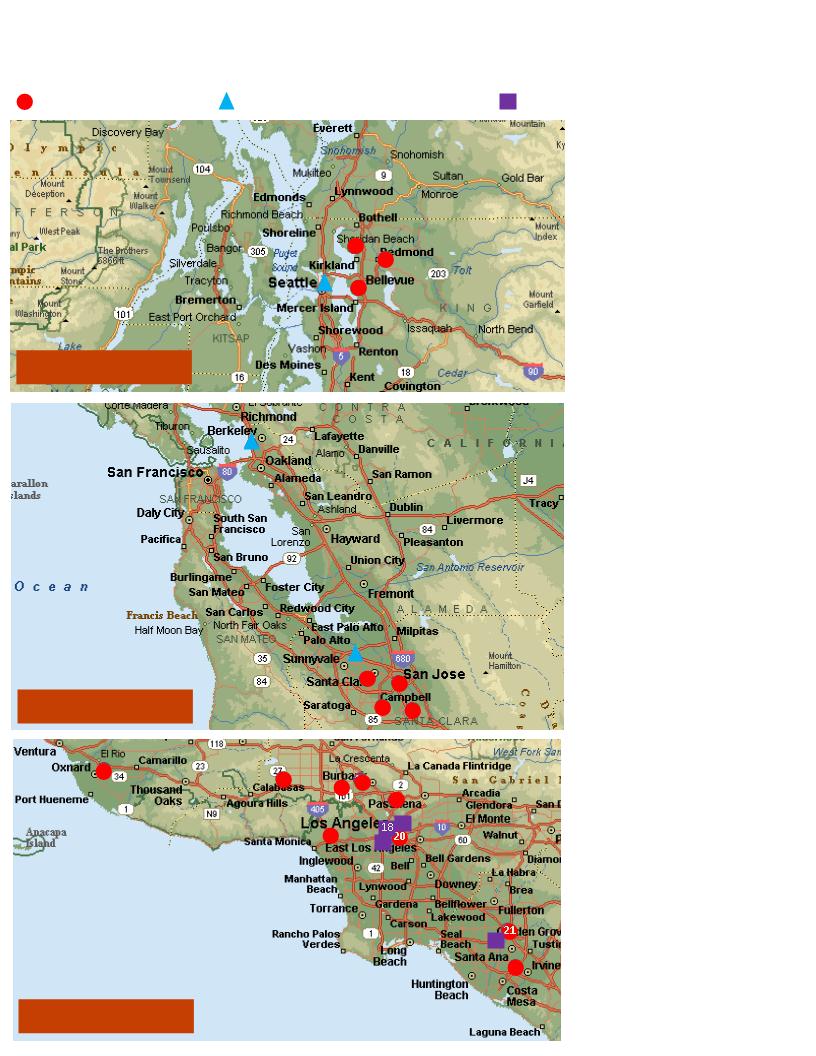
§ At IPO, Essex owned 16 multifamily properties (4,410 units); currently, Essex has ownership in
150 apartment communities (30,716 units)
§ Total capitalization at IPO was $250 million; as of March 31, 2010, total capitalization was $6.7
billion
§ IPO stock price was $19.50 a share, today the stock trades around $135 per share
4
![](https://capedge.com/proxy/8-K/0001140361-11-038007/ex99_15.jpg)
2011 Guidance (updated May 5, 2011)
FFO Per Share Guidance | ||||||
$5.50- $5.70 | ||||||
Earnings Per Share Guidance | ||||||
$0.85 - $1.15 | ||||||
Same Property Revenue Growth (Midpoint) | ||||||
4.2% | ||||||
Same Property NOI Growth (Midpoint) | ||||||
5.4% | ||||||
Market Expectations | 2011 | 2011 | 2011 | |||
Market | Market | Market | ||||
Job Growth | Rent Growth | Occupancy | ||||
Southern California | 1.2% | 4.9% | 95.2% | |||
Northern California | 1.2% | 4.9% | 95.8% | |||
Seattle Metro | 1.7% | 5.25% | 95.25% | |||
Weighted Average | 1.3% | 5.0% | 95.5% | |||
US Economic Assumptions | ||||||
GDP Growth of 2.5% to 3.0% | ||||||
Job Growth of 1.3% | ||||||
Targeted Acquisitions | ||||||
$300 million - $500 million | ||||||
Targeted Development Investment | ||||||
$150 million related to finishing Via, starting Queen Anne and the Cadence Campus |
5
![](https://capedge.com/proxy/8-K/0001140361-11-038007/ex99_16.jpg)
ESSEX MARKET DYNAMICS
6
![](https://capedge.com/proxy/8-K/0001140361-11-038007/ex99_17.jpg)
Anavia - Anaheim, CA
7
![](https://capedge.com/proxy/8-K/0001140361-11-038007/ex99_18.jpg)
DEVELOPMENT TRACK RECORD
Over the past 25-years, we have delivered over 8,500 units through our development program
RECENT DEVELOPMENT AWARDS | ||
2011 | Fourth and U, Berkeley, CA | Gold Nugget, Award of Merit - Best Mixed-Use Project |
2010 | Eastlake 2851, Seattle, WA | Pillars of the Industry, Finalist - Best Garden Apartment Community |
2010 | The Grand, Oakland, CA | Pillars of the Industry, Finalist - Best High Rise Apartments (9+) stories |
2010 | Eastlake 2851, Seattle, WA | Gold Nugget, Award of Merit - Rental Apartments |
2010 | Joule, Seattle, WA | Gold Nugget, Award of Merit - Best Multifamily Project (4-6 stories) |
2010 | Belmont Station, Los Angeles, CA | Gold Nugget, Award of Merit - Best Multifamily Project over 6 stories |
2010 | Via, Sunnyvale, CA | Gold Nugget, Award of Merit - Best on the Boards Multifamily Projects (Best Plan) |
2010 | Belmont Station, Los Angeles, CA | Gold Nugget, Award of Merit - Best Affordable Project |
ACTIVE DEVELOPMENT COMMUNITIES (Starting in 2011)
Fourth & U - Berkeley, CA
8
Northern California
Seattle
2
3
1) West Dublin - 309 units ($94.5 million)
2) Cadence Phase 1 - 280 units ($98.6 million)
3) Queen Anne - 275 units ($79.1 million)
1
![](https://capedge.com/proxy/8-K/0001140361-11-038007/ex99_19.jpg)
REDEVELOPMENT
28 units added at Foothill Commons - Bellevue, WA
Before/After at Highridge - Rancho Palos Verdes, CA
Before/After at Elevation (Eagle Rim) - Redmond, WA
![](https://capedge.com/proxy/8-K/0001140361-11-038007/ex99_110.jpg)
SAN JOSE
Via - Sunnyvale, CA
Family Tree - Santa Clara, CA
Bella Villagio - San Jose, CA
Cadence Campus - San Jose, CA
10
![](https://capedge.com/proxy/8-K/0001140361-11-038007/ex99_111.jpg)
San Jose vs. U.S. Average Earnings Comparison | ||||
SJ MSA | U.S. | |||
Average Wage | % of Total Jobs | Average Wage | % of Total Jobs | |
Construction | $73,144 | 4% | $50,268 | 4% |
Manufacturing | $145,811 | 17%* | $68,393 | 9% |
T.T.U | $68,868 | 15% | $45,227 | 19% |
Information | $183,894 | 5% | $86,949 | 2% |
Financial | $37,193 | 4% | $48,585 | 6% |
Prof/Bus. Services | $92,283 | 19% | $57,552 | 13% |
Other Services | $52,873 | 25% | $36,955 | 29% |
Government | $84,500 | 11% | $62,914 | 18% |
Weighted Average | $89,752 | $50,784 | ||
Economy.com, 2011, Earnings for 2009 * Predominately technology related |
Gap = 11% of
current rents
current rents
11
![](https://capedge.com/proxy/8-K/0001140361-11-038007/ex99_112.jpg)
SEATTLE
Joule - Seattle, WA
Queen Anne - Seattle, WA
Courtyard off Main - Bellevue, WA
Elevation (Eagle Rim) - Redmond, WA
![](https://capedge.com/proxy/8-K/0001140361-11-038007/ex99_113.jpg)
Seattle vs. U.S. Average Earnings Comparison | ||||
SEA MSA | U.S. | |||
Average Wage | % of Total Jobs | Average Wage | % of Total Jobs | |
Construction | $68,400 | 5% | $50,268 | 4% |
Manufacturing | $92,793 | 11% | $68,393 | 9% |
T.T.U | $56,441 | 18% | $45,227 | 19% |
Information | $147,010 | 6% | $86,949 | 2% |
Financial | $50,203 | 6% | $48,585 | 6% |
Prof/Bus. Services | $68,726 | 14% | $57,552 | 13% |
Other Services | $40,137 | 25% | $36,955 | 29% |
Government | $68,678 | 15% | $62,914 | 18% |
Weighted Average | $65,876 | $50,784 | ||
*Economy.com, 2011, Earnings for 2009 |
Gap = 10% of
current rents
current rents
13
![](https://capedge.com/proxy/8-K/0001140361-11-038007/ex99_114.jpg)
LOS ANGELES
416 on Broadway - Glendale, CA
Millennium, Los Angeles, CA
Bellerive, Los Angeles, CA
![](https://capedge.com/proxy/8-K/0001140361-11-038007/ex99_115.jpg)
Los Angeles vs. U.S. Average Earnings Comparison | ||||
LA MSA | U.S. | |||
Average Wage | % of Total Jobs | Average Wage | % of Total Jobs | |
Construction | $58,565 | 3% | $50,268 | 4% |
Manufacturing | $73,593 | 10% | $68,393 | 9% |
T.T.U | $50,381 | 20% | $45,227 | 19% |
Information | $111,157 | 5% | $86,949 | 2% |
Financial | $42,135 | 5% | $48,585 | 6% |
Prof/Bus. Services | $64,705 | 14% | $57,552 | 13% |
Other Services | $44,148 | 28% | $36,955 | 29% |
Government | $75,353 | 15% | $62,914 | 18% |
Weighted Average | $59,645 | $50,784 | ||
*Economy.com, 2011, Earnings for 2009 |
Gap = 10% of
current rents
current rents
15
![](https://capedge.com/proxy/8-K/0001140361-11-038007/ex99_116.jpg)
ORANGE COUNTY
Axis 2300 - Irvine, CA
Essex Skyline - Santa Ana, CA
Anavia - Anaheim, CA
![](https://capedge.com/proxy/8-K/0001140361-11-038007/ex99_117.jpg)
Orange Co. vs. U.S. Average Earnings Comparison | ||||
ORG MSA | U.S. | |||
Average Wage | % of Total Jobs | Average Wage | % of Total Jobs | |
Construction | $81,817 | 5% | $50,268 | 4% |
Manufacturing | $80,612 | 11% | $68,393 | 9% |
T.T.U | $59,061 | 18% | $45,227 | 19% |
Information | $81,716 | 2% | $86,949 | 2% |
Financial | $50,573 | 8% | $48,585 | 6% |
Prof/Bus. Services | $64,251 | 18% | $57,552 | 13% |
Other Services | $40,692 | 27% | $36,955 | 29% |
Government | $74,187 | 11% | $62,914 | 18% |
Weighted Average | $60,005 | $50,784 | ||
*Economy.com, 2011, Earnings for 2009 |
Gap = 6% of
current rents
current rents
17
![](https://capedge.com/proxy/8-K/0001140361-11-038007/ex99_118.jpg)
NOTES
______________________________
______________________________
______________________________
______________________________
______________________________
______________________________
______________________________
______________________________
______________________________
______________________________
______________________________
______________________________
______________________________
______________________________
18