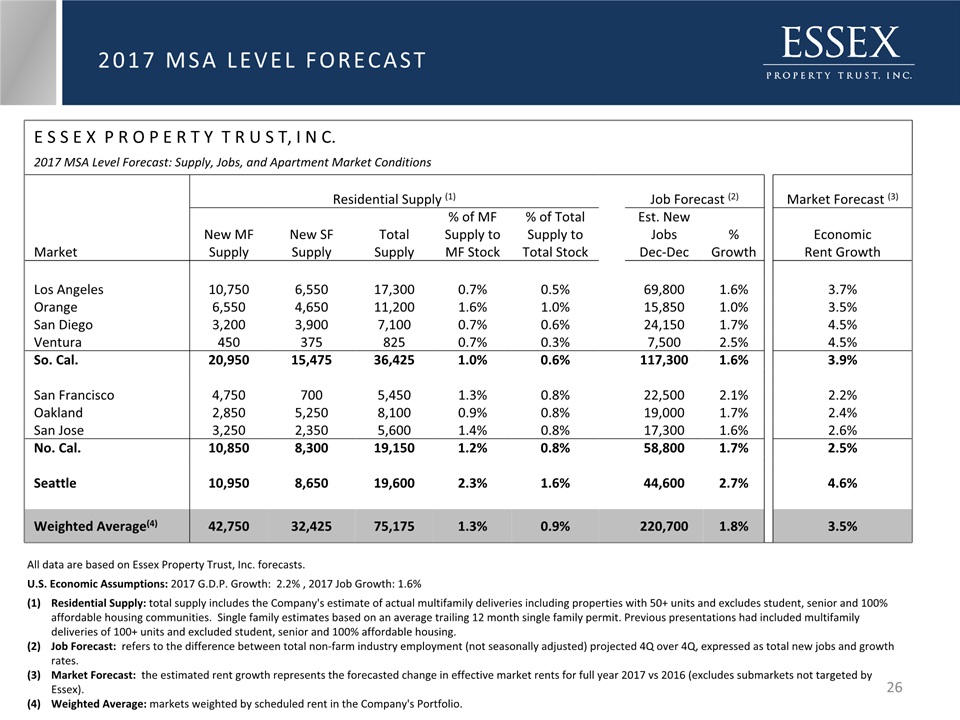
E S S E X P R O P E R T Y T R U S T, I N C. 2017 MSA Level Forecast: Supply, Jobs, and Apartment Market Conditions Residential Supply (1) Job Forecast (2) Market Forecast (3) Market New MF Supply New SF Supply Total Supply % of MF Supply to MF Stock % of Total Supply to Total Stock Est. New Jobs Dec-Dec % Growth Economic Rent Growth Los Angeles 10,750 6,550 17,300 0.7% 0.5% 69,800 1.6% 3.7% Orange 6,550 4,650 11,200 1.6% 1.0% 15,850 1.0% 3.5% San Diego 3,200 3,900 7,100 0.7% 0.6% 24,150 1.7% 4.5% Ventura 450 375 825 0.7% 0.3% 7,500 2.5% 4.5% So. Cal. 20,950 15,475 36,425 1.0% 0.6% 117,300 1.6% 3.9% San Francisco 4,750 700 5,450 1.3% 0.8% 22,500 2.1% 2.2% Oakland 2,850 5,250 8,100 0.9% 0.8% 19,000 1.7% 2.4% San Jose 3,250 2,350 5,600 1.4% 0.8% 17,300 1.6% 2.6% No. Cal. 10,850 8,300 19,150 1.2% 0.8% 58,800 1.7% 2.5% Seattle 10,950 8,650 19,600 2.3% 1.6% 44,600 2.7% 4.6% Weighted Average(4) 42,750 32,425 75,175 1.3% 0.9% 220,700 1.8% 3.5% All data are based on Essex Property Trust, Inc. forecasts.U.S. Economic Assumptions: 2017 G.D.P. Growth: 2.2% , 2017 Job Growth: 1.6%Residential Supply: total supply includes the Company's estimate of actual multifamily deliveries including properties with 50+ units and excludes student, senior and 100% affordable housing communities. Single family estimates based on an average trailing 12 month single family permit. Previous presentations had included multifamily deliveries of 100+ units and excluded student, senior and 100% affordable housing.Job Forecast: refers to the difference between total non-farm industry employment (not seasonally adjusted) projected 4Q over 4Q, expressed as total new jobs and growth rates.Market Forecast: the estimated rent growth represents the forecasted change in effective market rents for full year 2017 vs 2016 (excludes submarkets not targeted by Essex).Weighted Average: markets weighted by scheduled rent in the Company's Portfolio. 2017 MSA LEVEL FORECAST 26