Exhibit 99.1

Improving health care in America through Innovative Solutions
Nasdaq:PSSI
David Smith President and Chief Executive Officer
PSS World Medical, Inc.
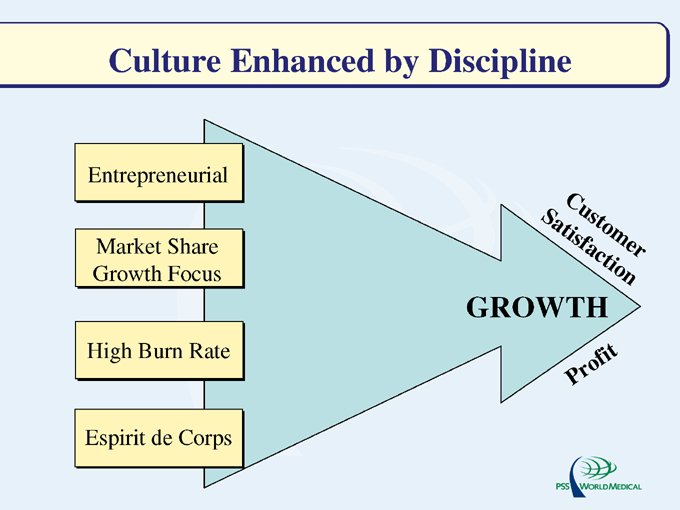
Culture Enhanced by Discipline
Entrepreneurial
Market Share Growth Focus
High Burn Rate
Espirit de Corps
GROWTH
Profit
Customer Satisfaction
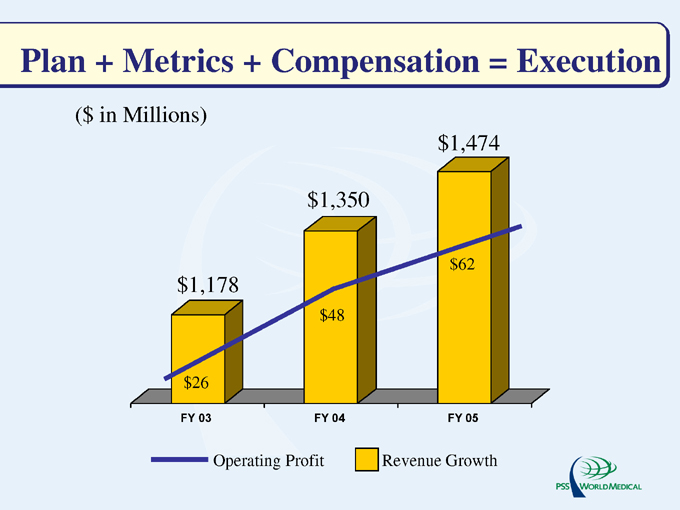
Plan + Metrics + Compensation = Execution
($ in Millions) $1,178 $1,350 $1,474 $26 $48 $62
FY 03 FY 04 FY 05
Operating Profit Revenue Growth
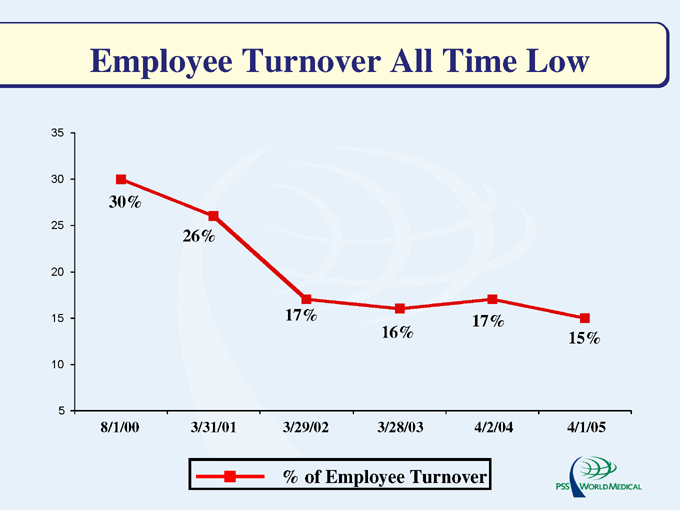
Employee Turnover All Time Low
35 30 25 20 15 10 5
30%
26%
17% 17%
16% 15%
8/1/00 3/31/01 3/29/02 3/28/03 4/2/04 4/1/05
% of Employee Turnover
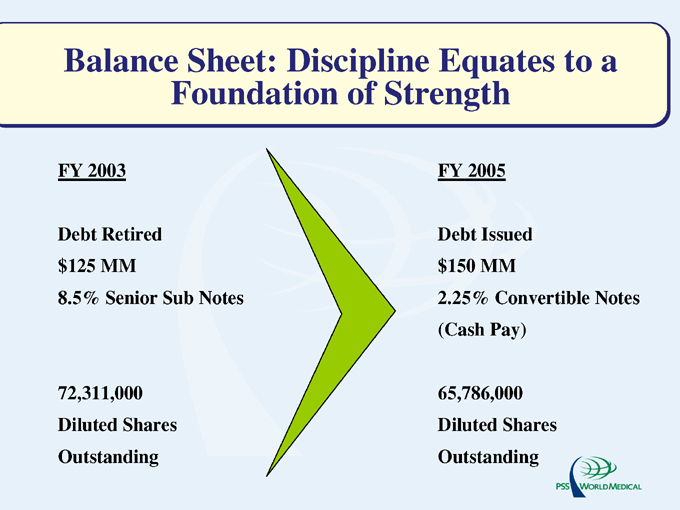
Balance Sheet: Discipline Equates to a Foundation of Strength
FY 2003 FY 2005
Debt Retired Debt Issued
$125 MM $150 MM
8.5% Senior Sub Notes 2.25% Convertible Notes (Cash Pay)
72,311,000 65,786,000
Diluted Shares Diluted Shares
Outstanding Outstanding
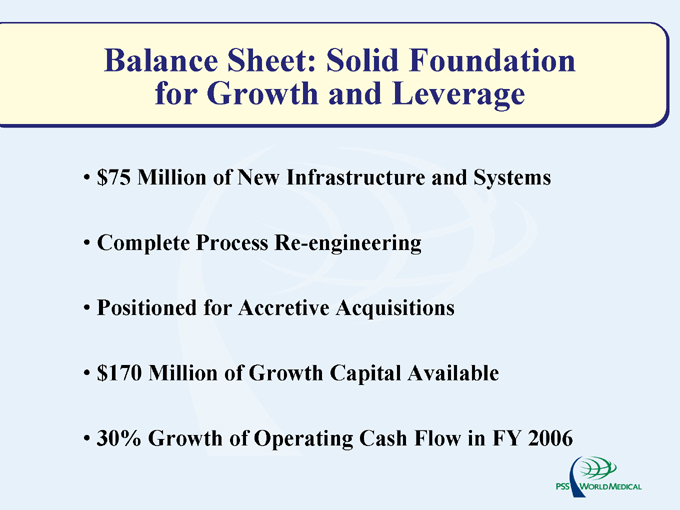
Balance Sheet: Solid Foundation for Growth and Leverage $75 Million of New Infrastructure and Systems Complete Process Re-engineering Positioned for Accretive Acquisitions $170 Million of Growth Capital Available 30% Growth of Operating Cash Flow in FY 2006
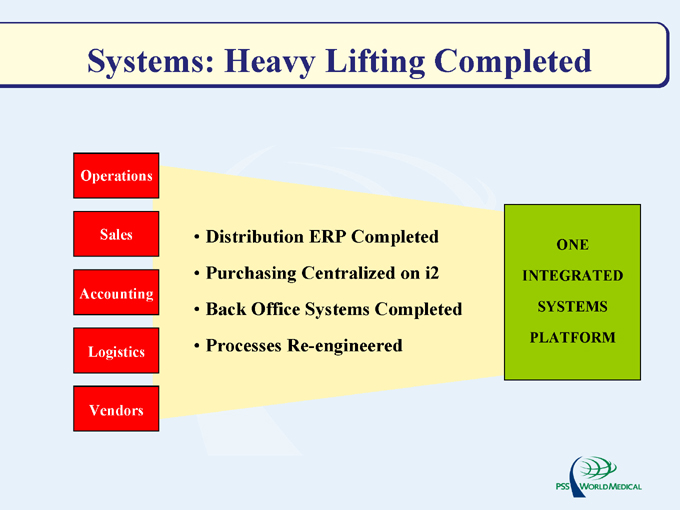
Systems: Heavy Lifting Completed
Operations Sales Accounting Logistics Vendors
Distribution ERP Completed Purchasing Centralized on i2 Back Office Systems Completed Processes Re-engineered
ONE
INTEGRATED
SYSTEMS
PLATFORM
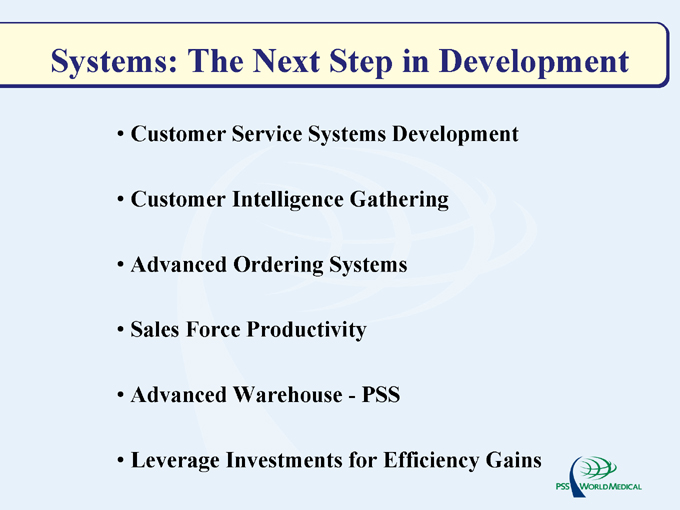
Systems: The Next Step in Development
Customer Service Systems Development Customer Intelligence Gathering Advanced Ordering Systems Sales Force Productivity Advanced Warehouse—PSS
Leverage Investments for Efficiency Gains
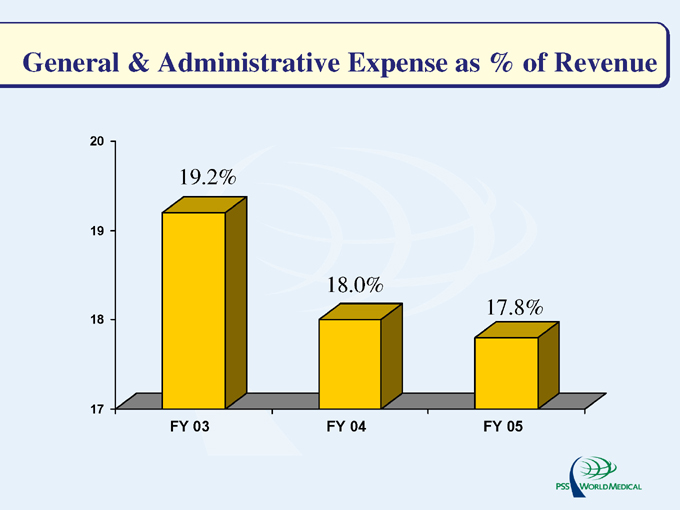
General & Administrative Expense as % of Revenue
20 19 18 17
19.2%
18.0%
17.8%
FY 03 FY 04 FY 05
20 19 18 17
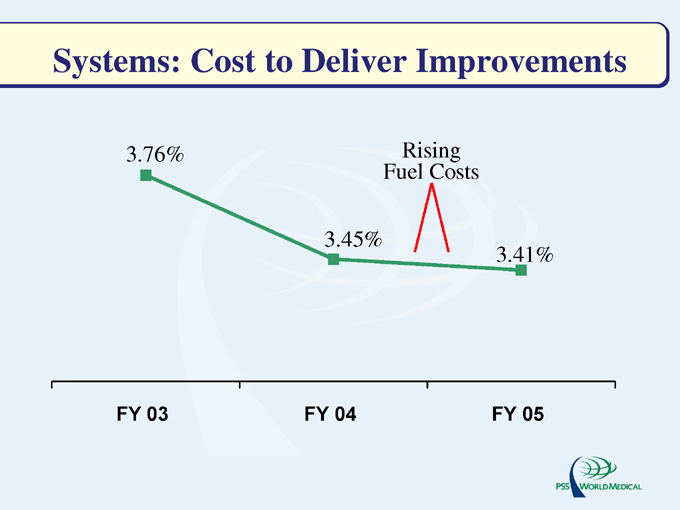
Systems: Cost to Deliver Improvements
3.76% Rising Fuel Costs
3.45%
3.41%
FY 03 FY 04 FY 05
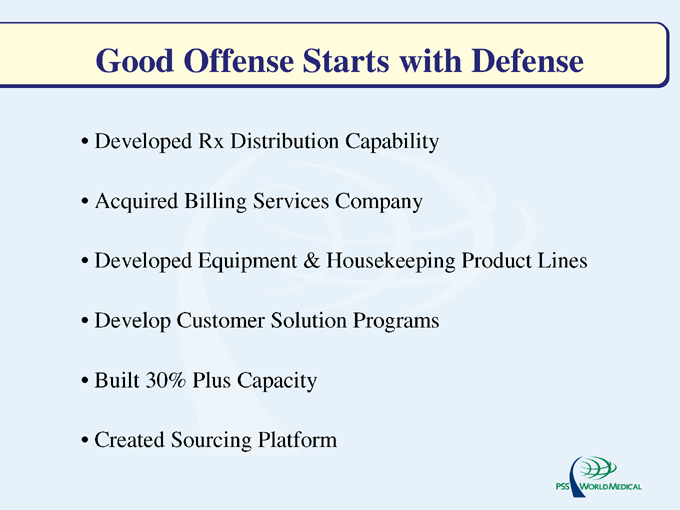
Good Offense Starts with Defense
Developed Rx Distribution Capability
Acquired Billing Services Company
Developed Equipment & Housekeeping Product Lines Develop Customer Solution Programs Built 30% Plus Capacity Created Sourcing Platform
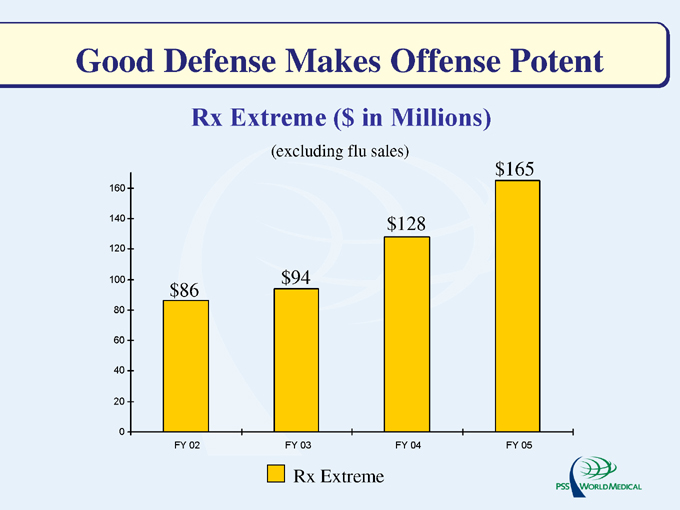
Good Defense Makes Offense Potent
Rx Extreme ($ in Millions)
(excluding flu sales)
160 140 120 100 80 60 40 20 0 $86 $94 $128 $165
FY 02 FY 03 FY 04 FY 05
Rx Extreme
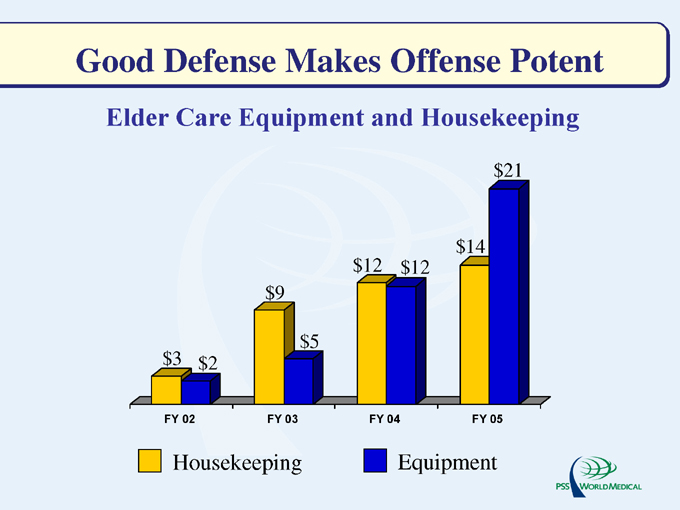
Good Defense Makes Offense Potent
Elder Care Equipment and Housekeeping
$3
$2
$9
$5
$12
$12
$14
$21
FY 02 FY 03 FY 04 FY 05
Housekeeping Equipment
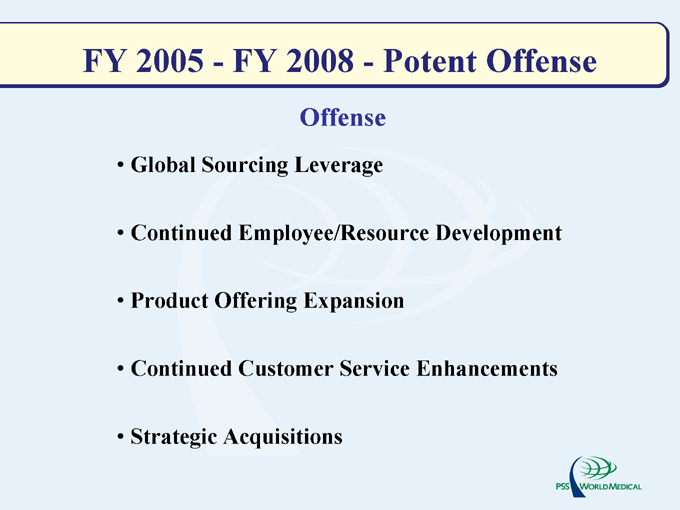
FY 2005—FY 2008—Potent Offense
Offense
Global Sourcing Leverage
Continued Employee/Resource Development Product Offering Expansion Continued Customer Service Enhancements Strategic Acquisitions
FINANCIAL
COMPETITION
TECHNOLOGY & INNOVATION
HEALTH CARE
SPENDING
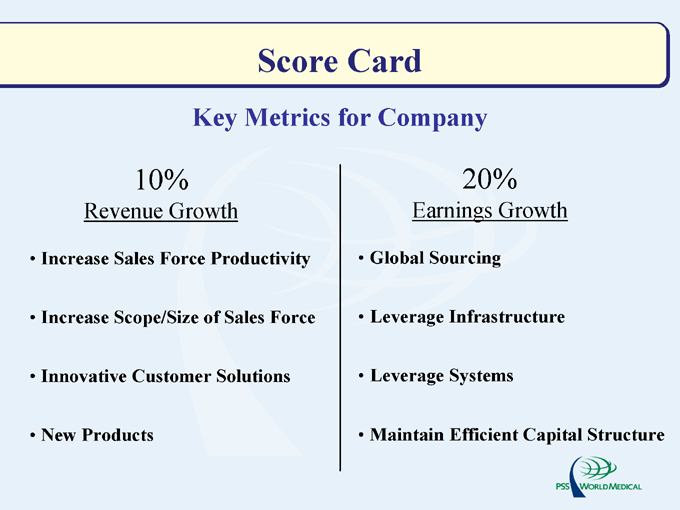
Score Card
Key Metrics for Company
10%
Revenue Growth
Increase Sales Force Productivity Increase Scope/Size of Sales Force Innovative Customer Solutions New Products
20%
Earnings Growth
Global Sourcing Leverage Infrastructure Leverage Systems
Maintain Efficient Capital Structure
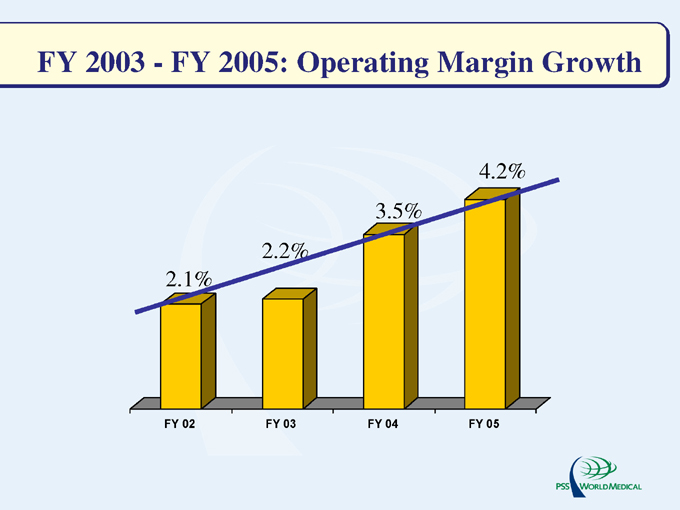
FY 2003—FY 2005: Operating Margin Growth
4.2% 3.5% 2.2% 2.1%
FY 02 FY 03 FY 04 FY 05
David Bronson Executive Vice President and Chief Financial Officer
PSS World Medical, Inc.
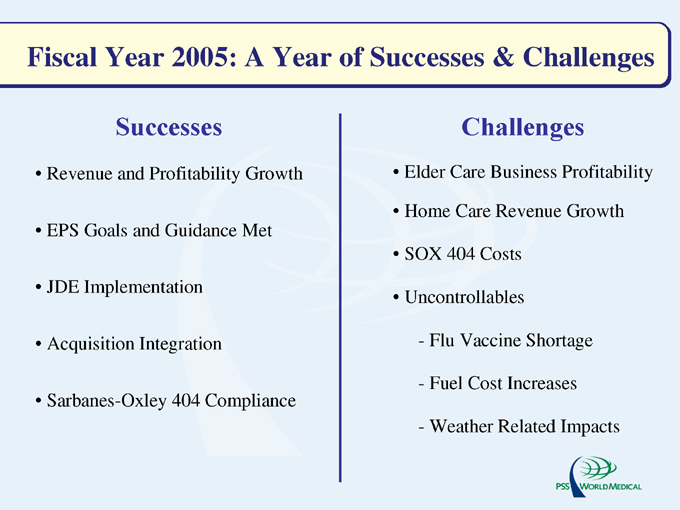
Fiscal Year 2005: A Year of Successes & Challenges
Successes
Revenue and Profitability Growth EPS Goals and Guidance Met JDE Implementation Acquisition Integration Sarbanes-Oxley 404 Compliance
Challenges
Elder Care Business Profitability Home Care Revenue Growth SOX 404 Costs Uncontrollables
Flu Vaccine Shortage Fuel Cost Increases Weather Related Impacts
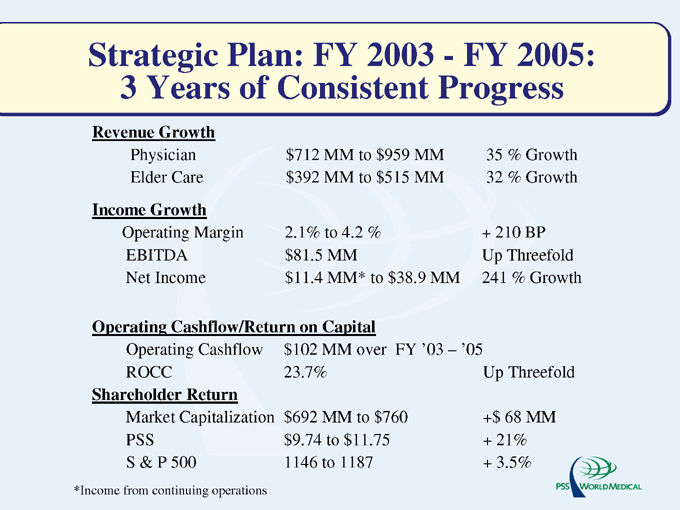
Strategic Plan: FY 2003—FY 2005: 3 Years of Consistent Progress
Revenue Growth
Physician $712 MM to $959 MM 35% Growth
Elder Care $392 MM to $515 MM 32% Growth
Income Growth
Operating Margin 2.1% to 4.2% + 210 BP
EBITDA $81.5 MM Up Threefold
Net Income $11.4 MM* to $38.9 MM 241% Growth
Operating Cashflow/Return on Capital
Operating Cashflow $102 MM over FY ’03 – ’05
ROCC 23.7% Up Threefold
Shareholder Return
Market Capitalizatio $692 MM to $760 +$68 MM
PSS $9.74 to $11.75 + 21%
S & P 500 1146 to 1187 + 3.5%
*Income from continuing operations
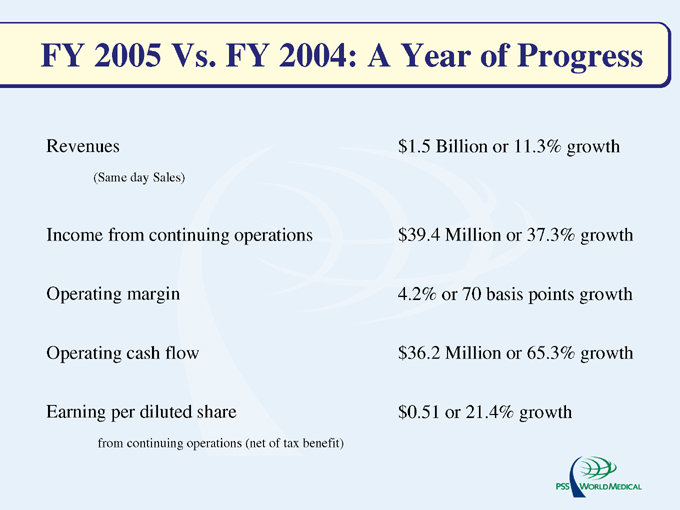
FY 2005 Vs. FY 2004: A Year of Progress
Revenues
(Same day Sales)
Income from continuing operations Operating margin Operating cash flow
Earning per diluted share from continuing operations (net of tax benefit) $1.5 Billion or 11.3% growth
$39.4 Million or 37.3% growth 4.2% or 70 basis points growth $36.2 Million or 65.3% growth $0.51 or 21.4% growth
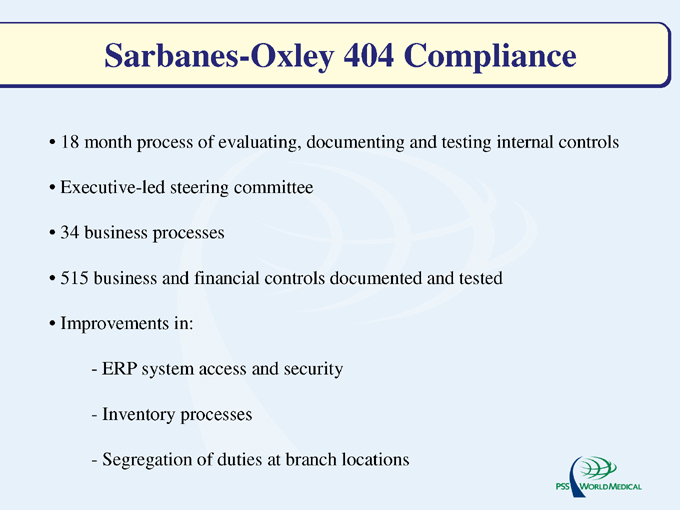
Sarbanes-Oxley 404 Compliance
18 month process of evaluating, documenting and testing internal controls Executive-led steering committee 34 business processes 515 business and financial controls documented and tested Improvements in:
ERP system access and security Inventory processes Segregation of duties at branch locations
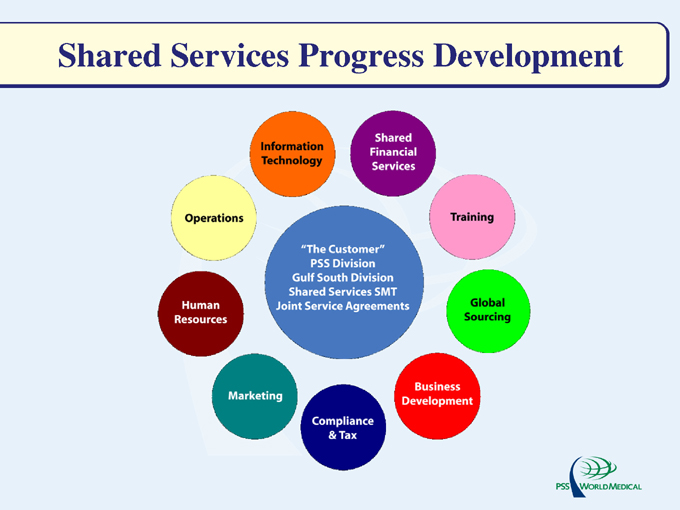
Shared Services Progress Development
Information Technology
Shared Financial Services
Training
Global Sourcing
Business Development
Compliance & Tax
Marketing
Human Resources
Operations
“The Customer” PSS Division Gulf South Division Shared Services SMT Joint Service Agreements
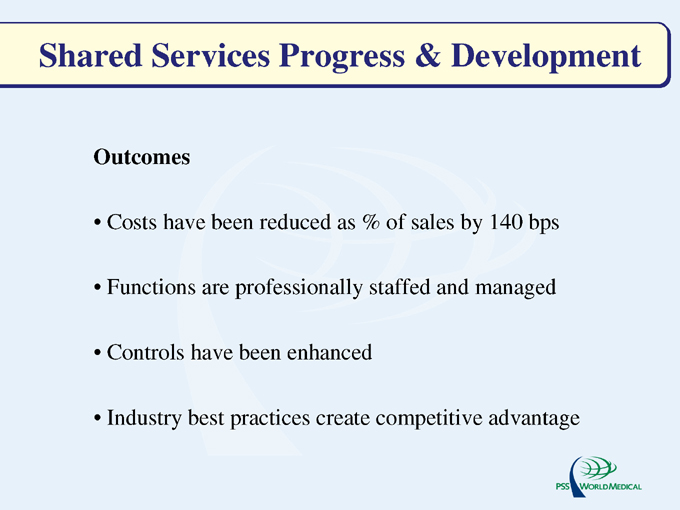
Shared Services Progress & Development
Outcomes
Costs have been reduced as % of sales by 140 bps Functions are professionally staffed and managed Controls have been enhanced Industry best practices create competitive advantage
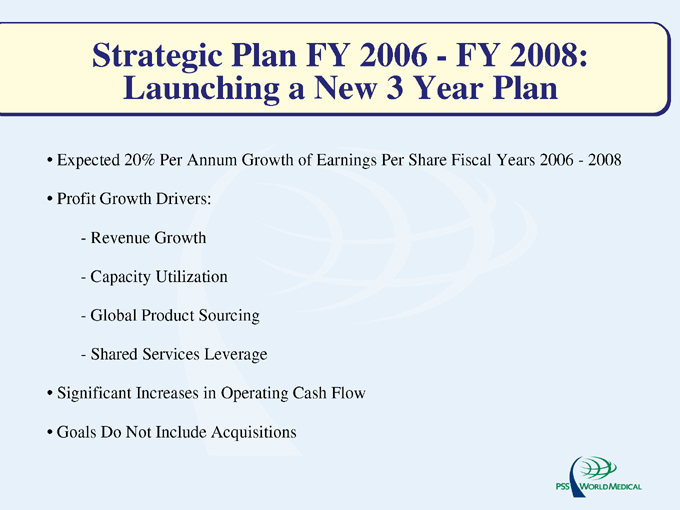
Strategic Plan FY 2006—FY 2008: Launching a New 3 Year Plan
Expected 20% Per Annum Growth of Earnings Per Share Fiscal Years 2006—2008
Profit Growth Drivers:
Revenue Growth Capacity Utilization Global Product Sourcing Shared Services Leverage
Significant Increases in Operating Cash Flow
Goals Do Not Include Acquisitions
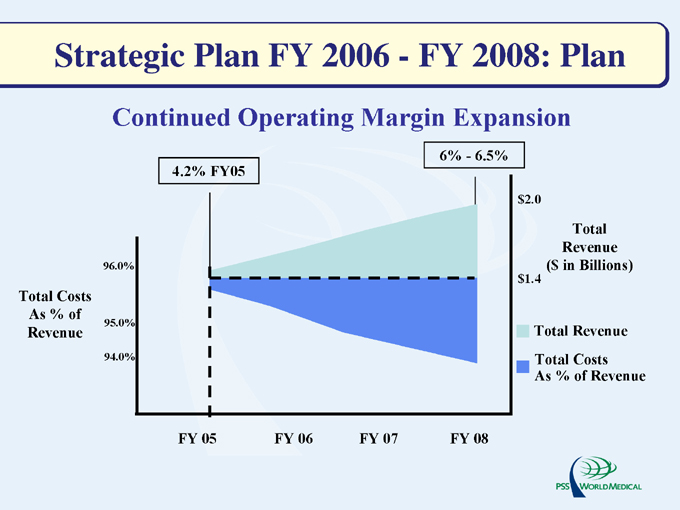
Strategic Plan FY 2006—FY 2008: Plan
Continued Operating Margin Expansion
4.2% FY05
Total Costs As % of Revenue
96.0%
95.0%
94.0%
6%—6.5% $2.0
$1.4
Total Revenue ($ in Billions)
Total Revenue Total Costs As % of Revenue
FY 05 FY 06 FY 07 FY 08
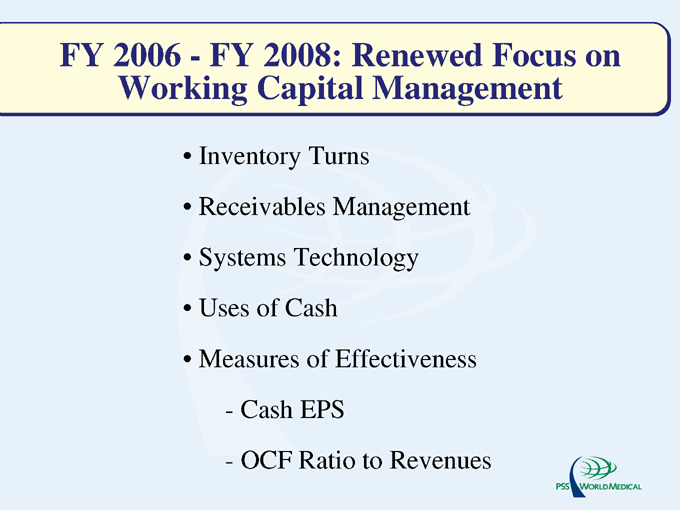
FY 2006—FY 2008: Renewed Focus on Working Capital Management
Inventory Turns
Receivables Management Systems Technology Uses of Cash Measures of Effectiveness
Cash EPS
OCF Ratio to Revenues
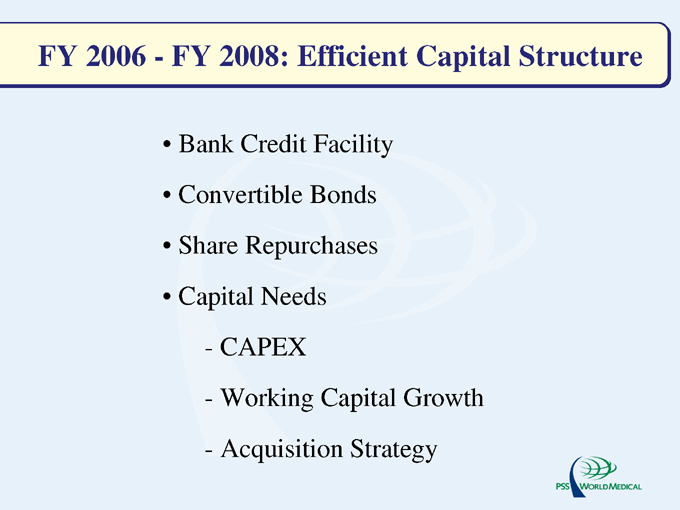
FY 2006—FY 2008: Efficient Capital Structure
Bank Credit Facility Convertible Bonds Share Repurchases Capital Needs
CAPEX
Working Capital Growth Acquisition Strategy
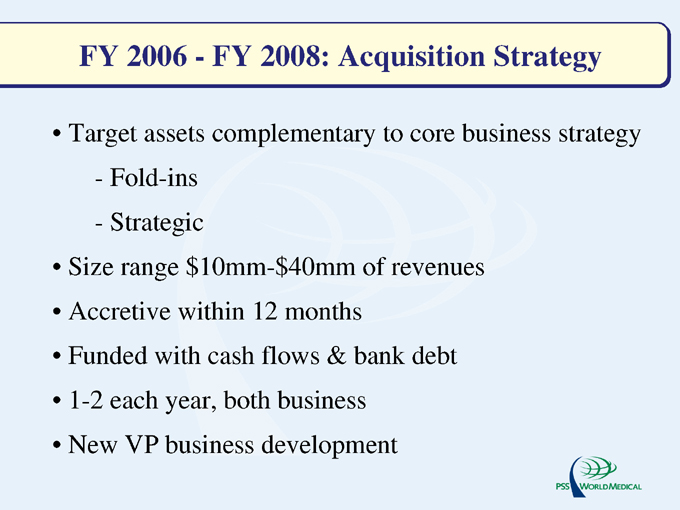
FY 2006—FY 2008: Acquisition Strategy
Target assets complementary to core business strategy
Fold-ins Strategic
Size range $10mm - $40mm of revenues Accretive within 12 months Funded with cash flows & bank debt 1-2 each year, both business New VP business development
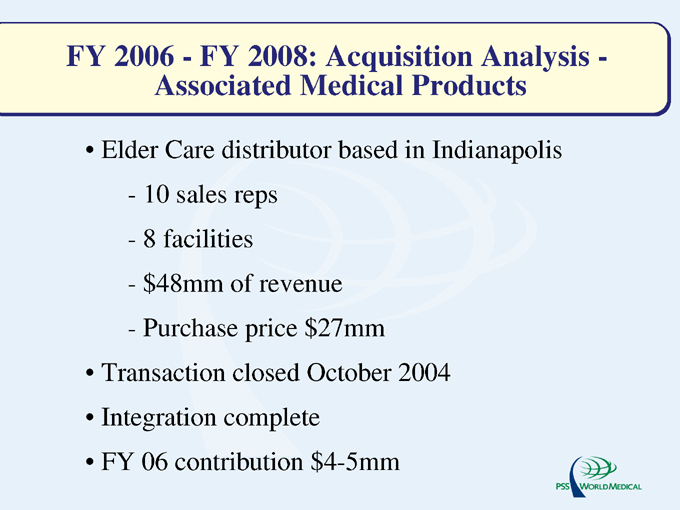
FY 2006—FY 2008: Acquisition Analysis -Associated Medical Products
Elder Care distributor based in Indianapolis
10 sales reps 8 facilities $48mm of revenue Purchase price $27mm
Transaction closed October 2004 Integration complete FY 06 contribution $4-5mm
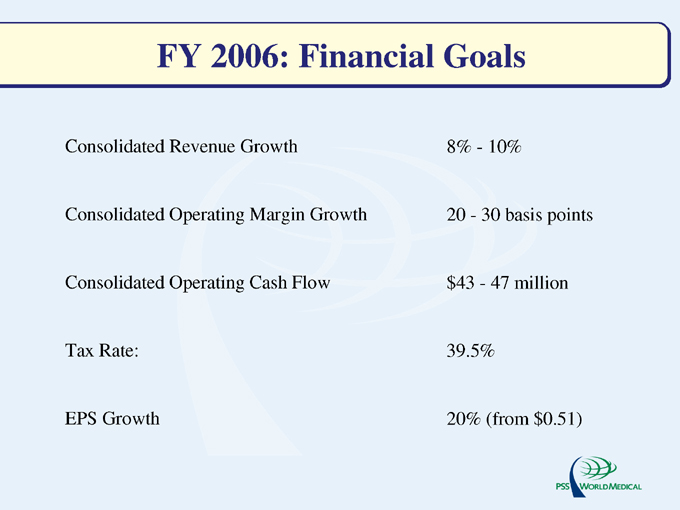
FY 2006: Financial Goals
Consolidated Revenue Growth 8%—10%
Consolidated Operating Margin Growth 20 - 30 basis points
Consolidated Operating Cash Flow $43 - 47 million
Tax Rate: 39.5%
EPS Growth 20% (from $0.51)
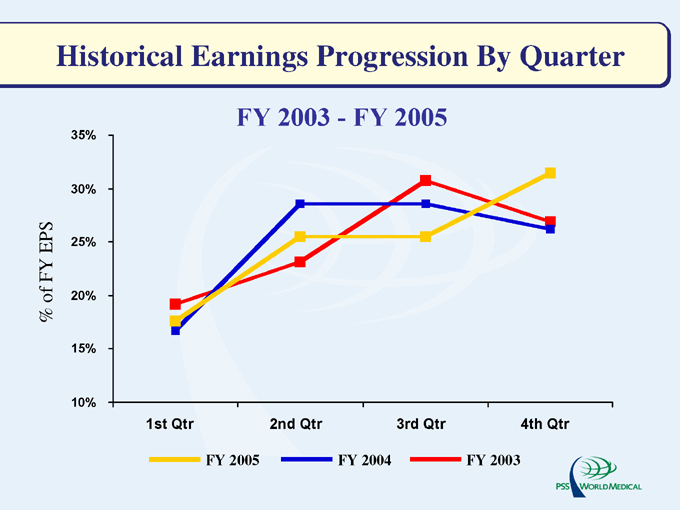
Historical Earnings Progression By Quarter
FY 2003—FY 2005
% of FY EPS
35% 30% 25% 20% 15% 10%
1st Qtr 2nd Qtr 3rd Qtr 4th Qtr
FY 2005 FY 2004 FY 2003
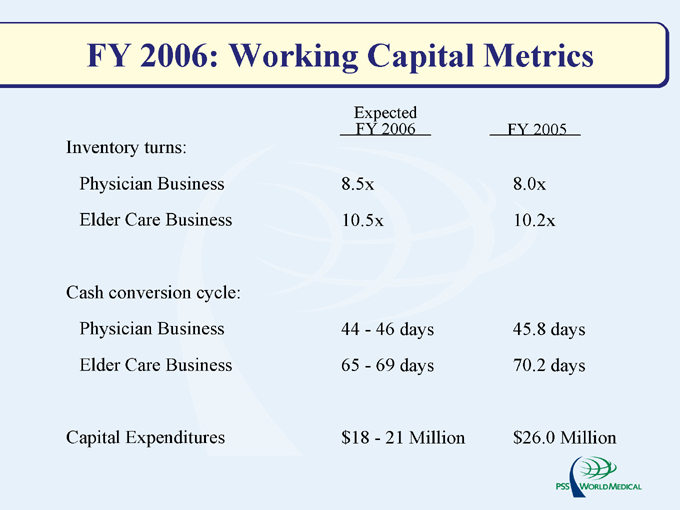
FY 2006: Working Capital Metrics
Expected FY 2006 FY 2005
Inventory turns:
Physician Business 8.5x 8.0x
Elder Care Business 10.5x 10.2x
Cash conversion cycle:
Physician Business 44—46 days 45.8 days
Elder Care Business 65—69 days 70.2 days
Capital Expenditures $18—21 Million $26.0 Million
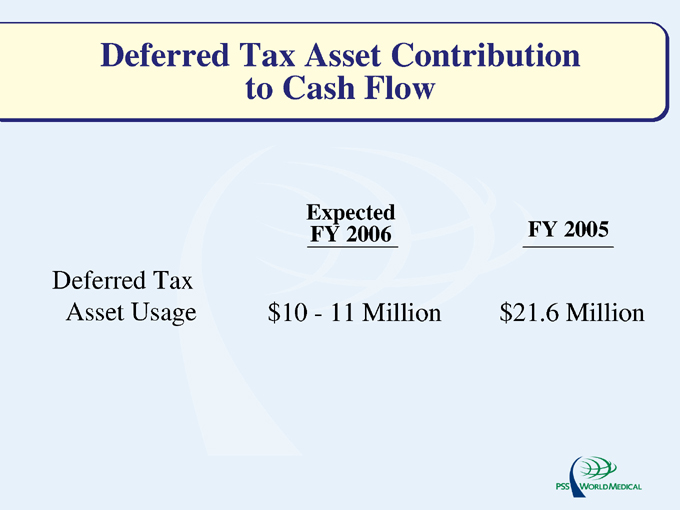
Deferred Tax Asset Contribution to Cash Flow
Expected FY 2006 FY 2005
Deferred Tax Asset Usage $10—11 Million $21.6 Million
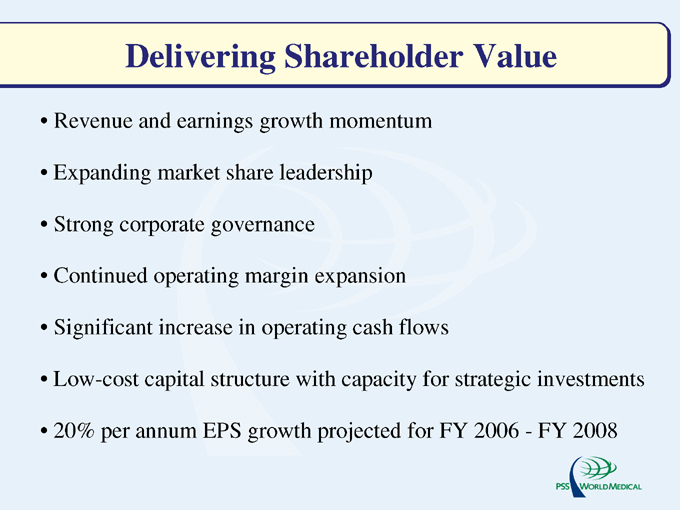
Delivering Shareholder Value
Revenue and earnings growth momentum Expanding market share leadership Strong corporate governance Continued operating margin expansion Significant increase in operating cash flows
Low-cost capital structure with capacity for strategic investments
20% per annum EPS growth projected for FY 2006—FY 2008
John Sasen Chief Marketing Officer
PSS World Medical, Inc.
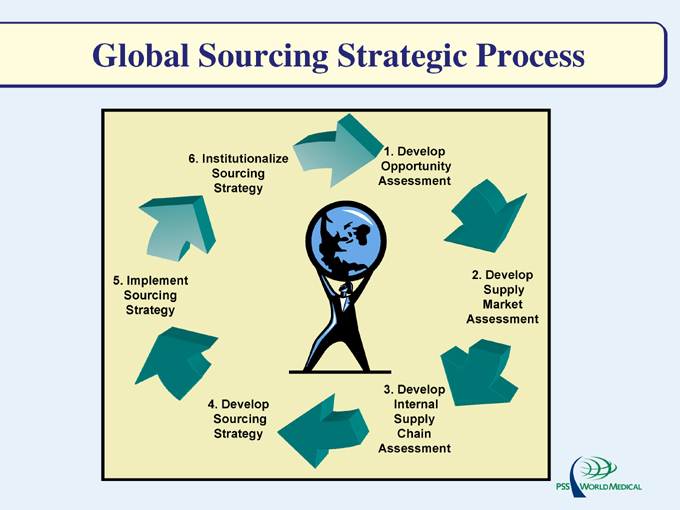
Global Sourcing Strategic Process
1. Develop Opportunity Assessment
2. Develop Supply Market Assessment
3. Develop Internal Supply Chain Assessment
4. Develop Sourcing Strategy
5. Implement Sourcing Strategy
6. Institutionalize Sourcing Strategy
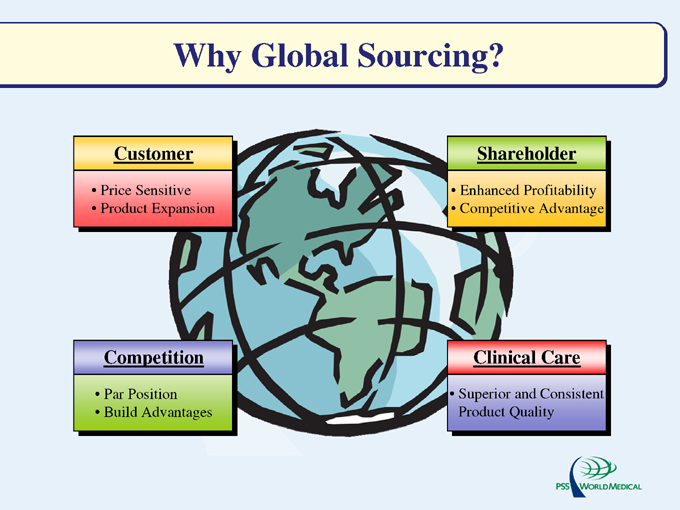
Why Global Sourcing?
Customer
Price Sensitive Product Expansion
Shareholder
Enhanced Profitability Competitive Advantage
Competition
Par Position Build Advantages
Clinical Care
Superior and Consistent Product Quality
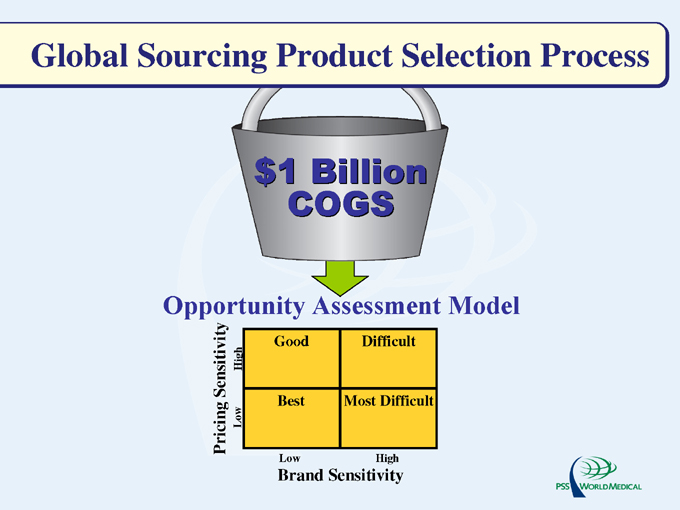
Global Sourcing Product Selection Process $1 Billion COGS
Opportunity Assessment Model
Pricing Sensitivity
Low High
Good Difficult
Best Most Difficult
Low High
Brand Sensitivity
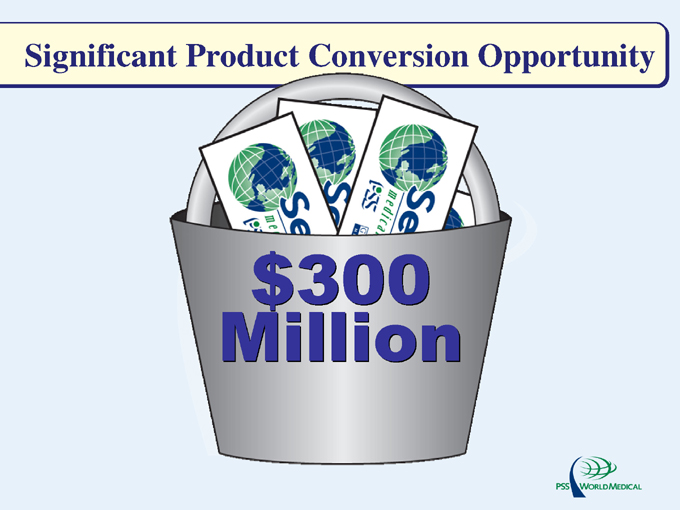
Significant Product Conversion Opportunity $300 Million
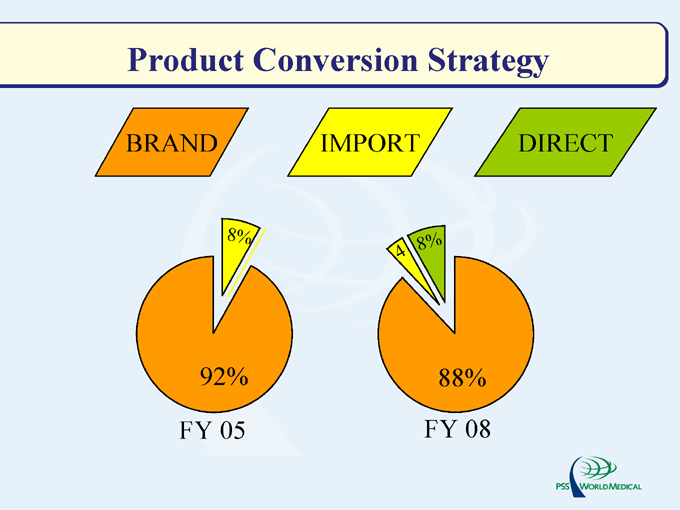
Product Conversion Strategy
BRAND IMPORT DIRECT
8%
92%
FY 05
4
8%
88%
FY 08
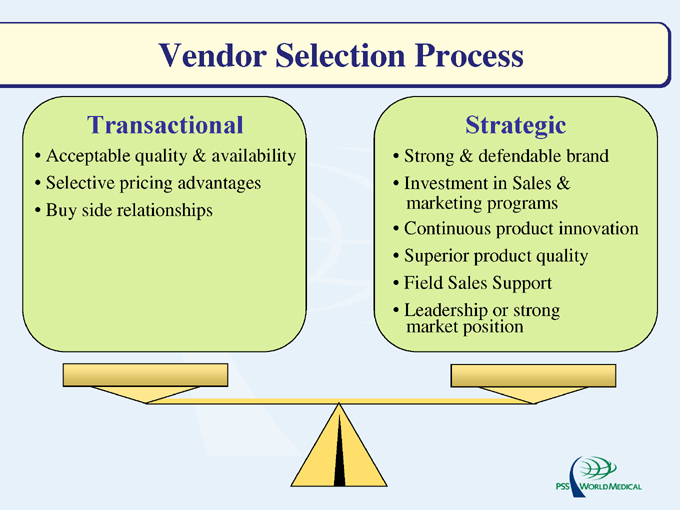
Vendor Selection Process
Transactional
Acceptable quality & availability Selective pricing advantages Buy side relationships
Strategic
Strong & defendable brand Investment in Sales & marketing programs Continuous product innovation Superior product quality Field Sales Support
Leadership or strong market position

Strengthening Our Brand
Today a $135+ Million Product Line
Building on Customer Trust Through Enhanced Quality and Product Expansion
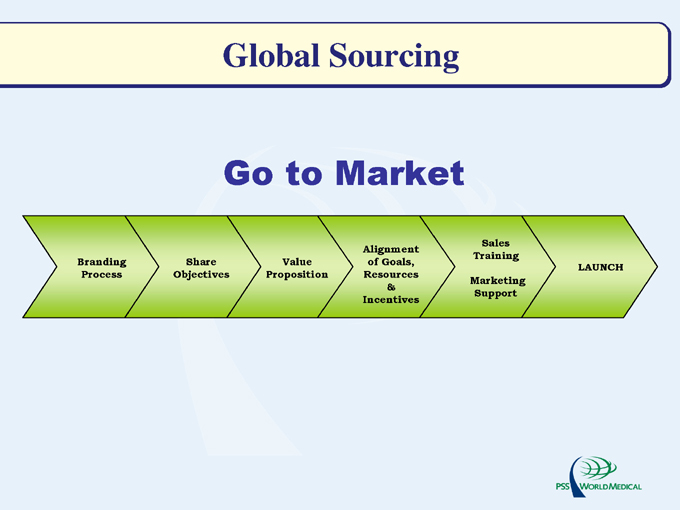
Global Sourcing
Go to Market
Branding Process
Share Objectives
Value Proposition
Alignment of Goals, Resources & Incentives
Sales Training Marketing Support
LAUNCH
Kevin English Senior Vice President Shared Financial Services
PSS World Medical, Inc.
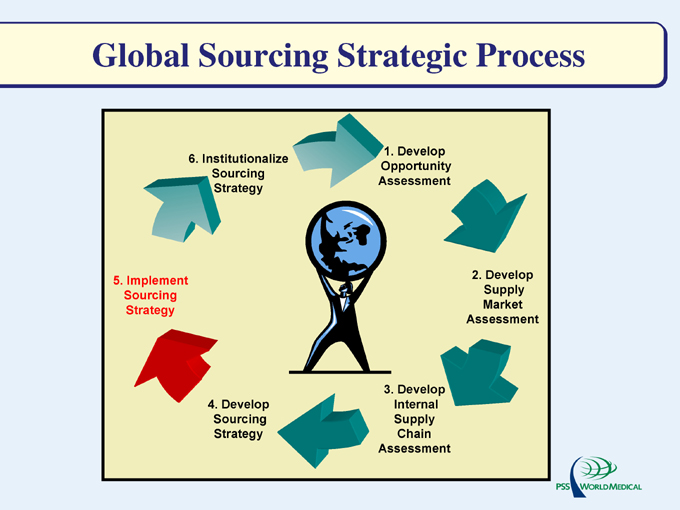
Global Sourcing Strategic Process
1. Develop Opportunity Assessment
2. Develop Supply Market Assessment
3. Develop Internal Supply Chain Assessment
4. Develop Sourcing Strategy
5. Implement Sourcing Strategy
6. Institutionalize Sourcing Strategy
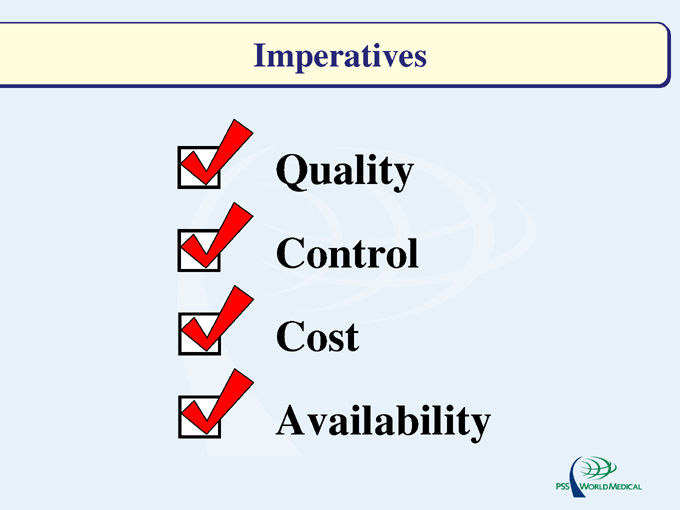
Imperatives
Quality Control Cost Availability
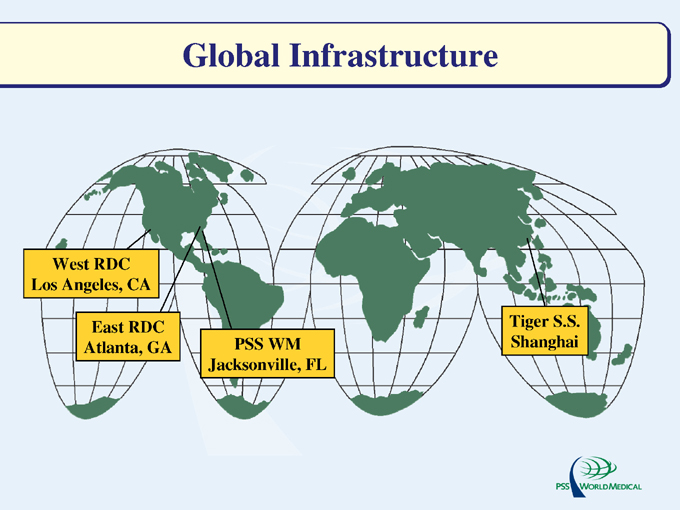
Global Infrastructure
West RDC Los Angeles, CA
East RDC Atlanta, GA
PSS WM Jacksonville, FL
Tiger S.S. Shanghai
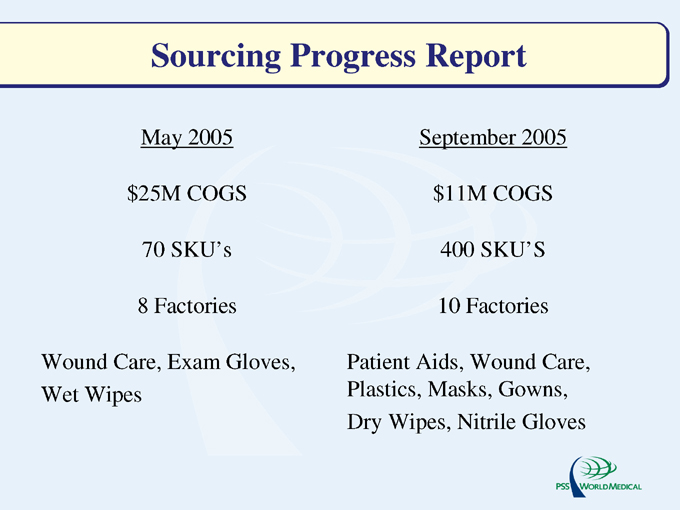
Sourcing Progress Report
May 2005 September 2005
$25M COGS $11M COGS
70 SKU’s 400 SKU’S
8 Factories 10 Factories
Wound Care, Exam Gloves, Wet Wipes
Patient Aids, Wound Care, Plastics, Masks, Gowns, Dry Wipes, Nitrile Gloves
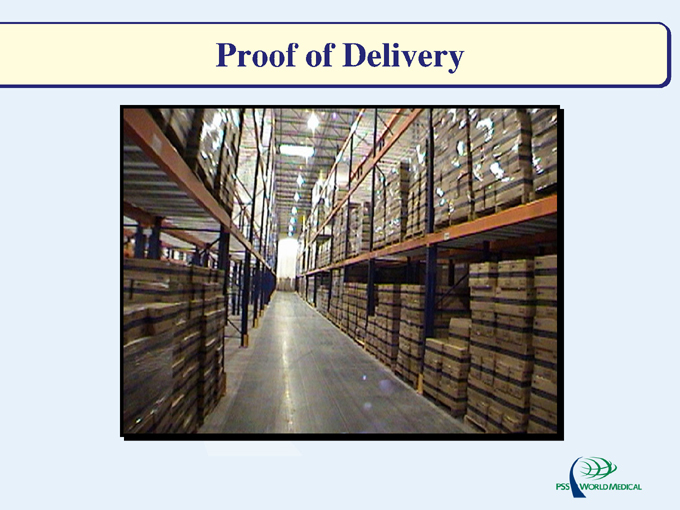
Proof of Delivery
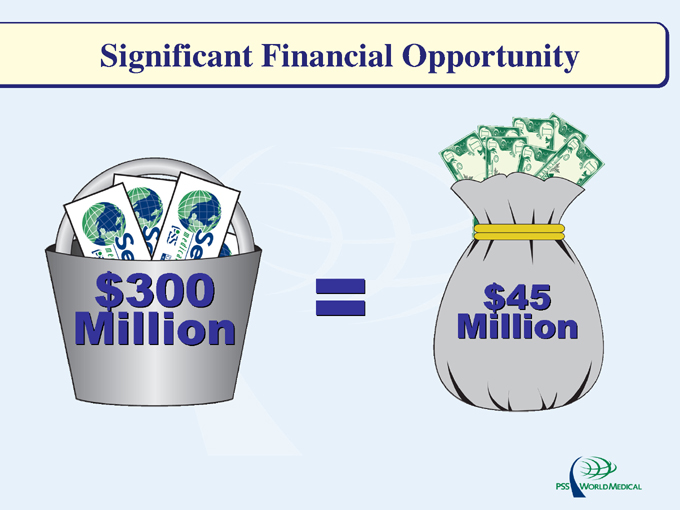
Significant Financial Opportunity $300 Million
$45 Million
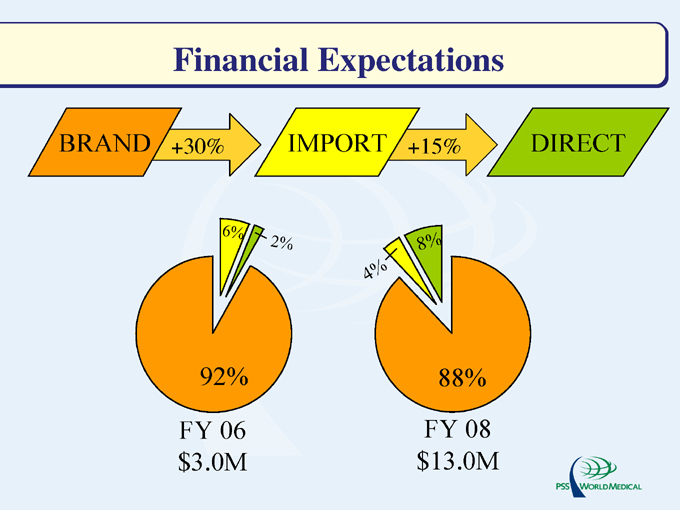
Financial Expectations
BRAND
+30%
IMPORT
+15%
DIRECT
6%
2%
92%
FY 06 $3.0M
4%
8%
88%
FY 08 $13.0M
Gary Nutter President
Gulf South Medical Supply, Inc.
Eldercare Business
GULF SOUTH
MEDICAL SUPPLY
Investor Day
Current Trends
FY05 – Year of Growth & Investment Strategic Customer Segment Growth Key Product Category Growth
FY05 Year of Growth & Investment
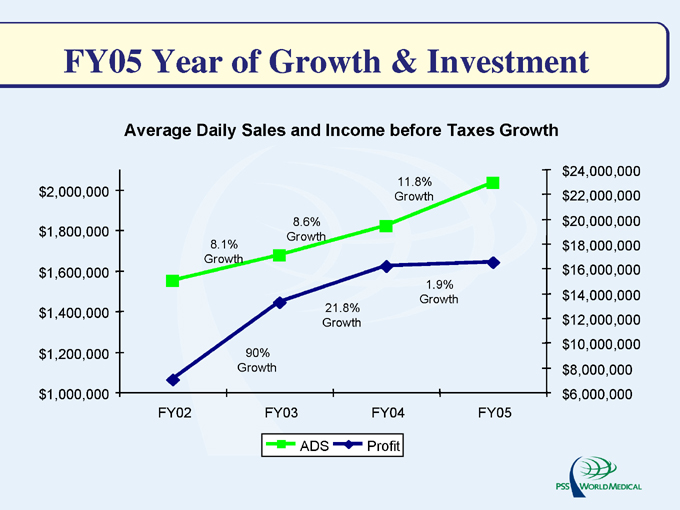
Average Daily Sales and Income before Taxes Growth $2,000,000 $1,800,000 $1,600,000 $1,400,000 $1,200,000 $1,000,000
FY02
FY03
FY04
FY05 $24,000,000 $22,000,000 $20,000,000 $18,000,000 $16,000,000 $14,000,000 $12,000,000 $10,000,000 $8,000,000 $6,000,000
8.1% Growth
8.6% Growth
11.8% Growth
90% Growth
21.8% Growth
1.9% Growth
ADS
Profit
Culture Enhanced by Discipline
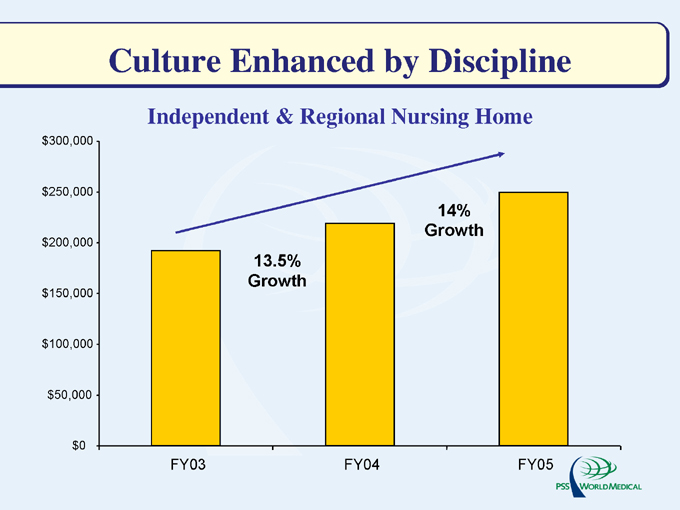
Independent & Regional Nursing Home $300,000 $250,000 $200,000 $150,000 $100,000 $50,000 $0
FY03 FY04 FY05
13.5% Growth
14% Growth
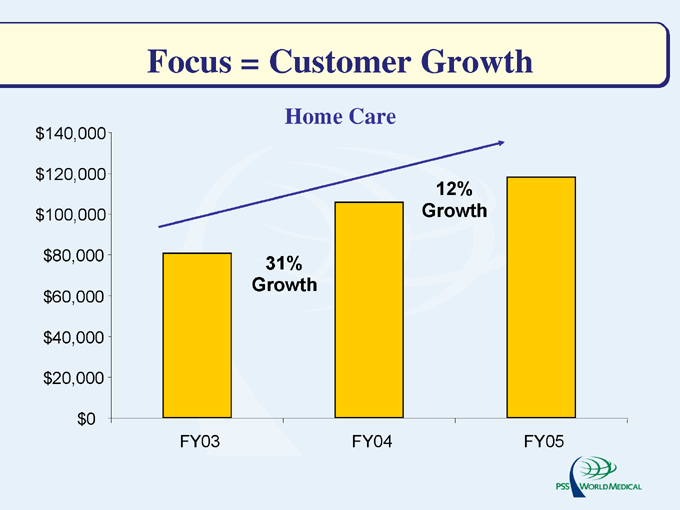
Focus = Customer Growth
Home Care $140,000 $120,000 $100,000 $80,000 $60,000 $40,000 $20,000 $0
FY03 FY04 FY05
31% Growth
12% Growth
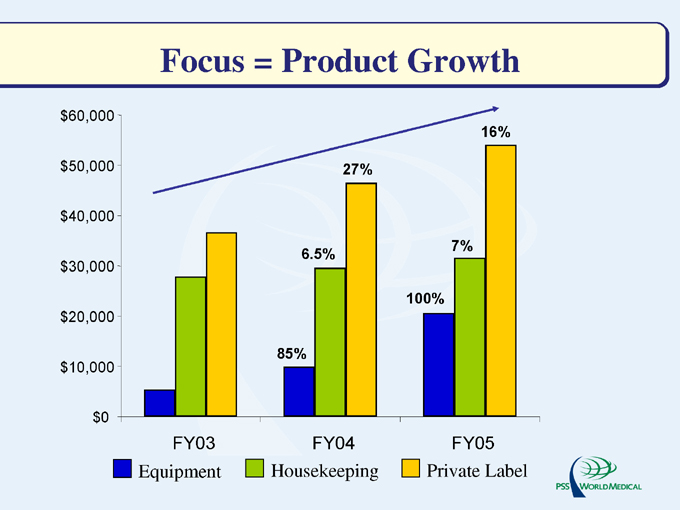
Focus = Product Growth $60,000 $50,000 $40,000 $30,000 $20,000 $10,000 $0
FY03 FY04 FY05
85%
6.5%
27%
100%
7%
16%
Equipment
Housekeeping
Private Label
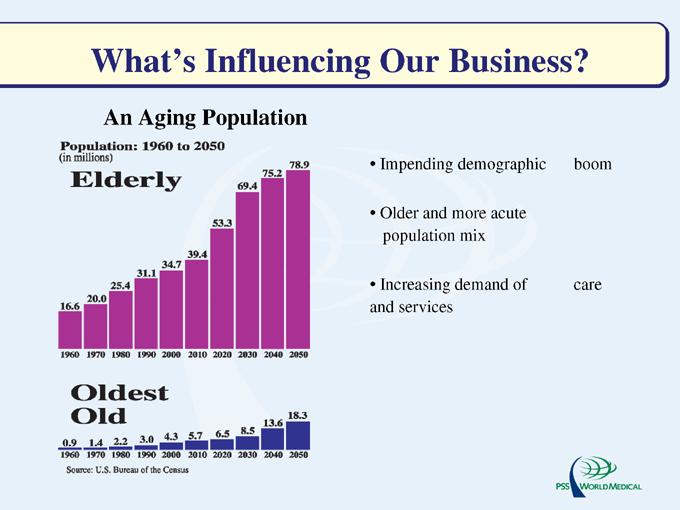
What’s Influencing Our Business?
An Aging Population
Population: 1960 to 2050 (in millions)
Elderly
16.6 20.0 25.4 31.1 34.7 39.4 53.3 69.4 75.2 78.9
1960 1970 1980 1990 2000 2010 2020 2030 2040 2050
Oldest old
0.9 1.4 2.2 3.0 4.3 5.7 6.5 8.5 13.6 18.3
1960 1970 1980 1990 2000 2010 2020 2030 2040 2050
Source: U.S. Bureau of the Census
Impending demographic boom
Older and more acute population mix
Increasing demand of care and services
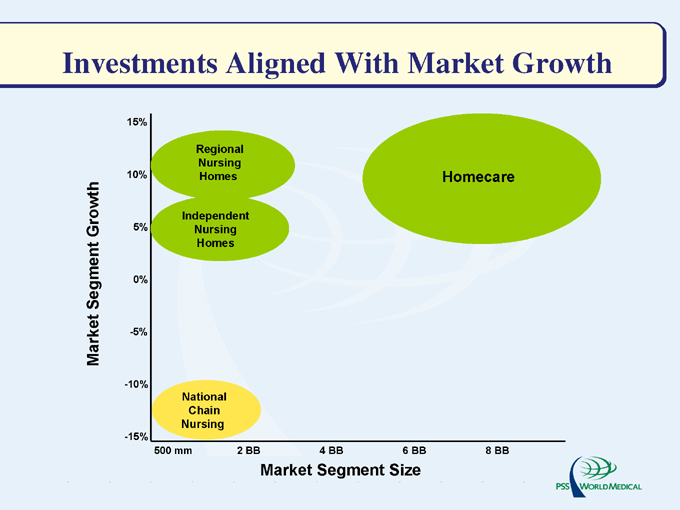
Investments Aligned With Market Growth
Market Segment Growth
-15% -10% 5% 0% -5% 10% 15%
Regional Nursing Homes
Independent Nursing Homes
Homecare
National Chain Nursing
500 mm 2 BB 4 BB 6 BB 8 BB
Market Segment Size
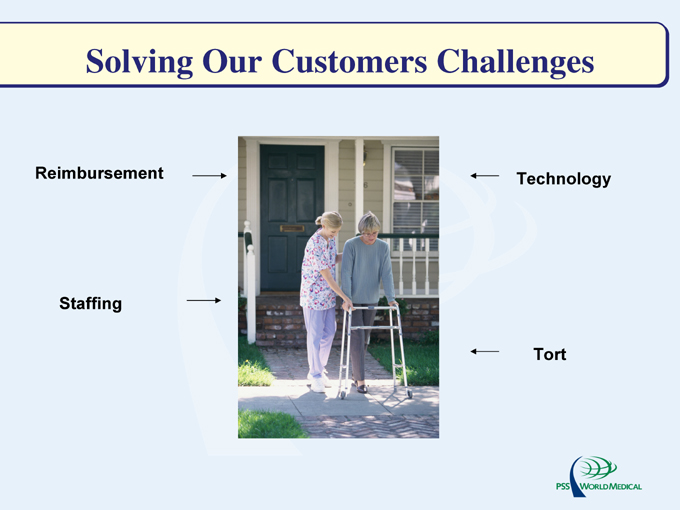
Solving Our Customers Challenges
Reimbursement
Staffing
Tort
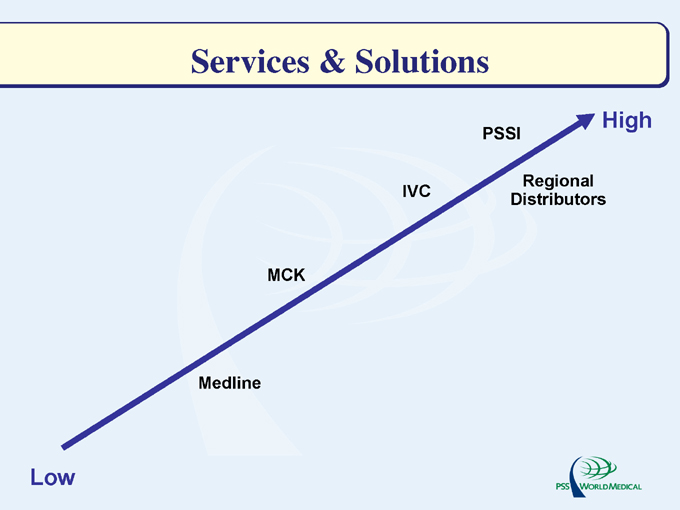
Services & Solutions
MCK
IVC
PSSI
High
Regional Distributors
Medline
Low

FY06 Sales Growth Initiatives
Focused targeting approach
Leverage professional billing services Realign corporate account team Field quotas Product line extensions SFS training Innovative Business Solutions
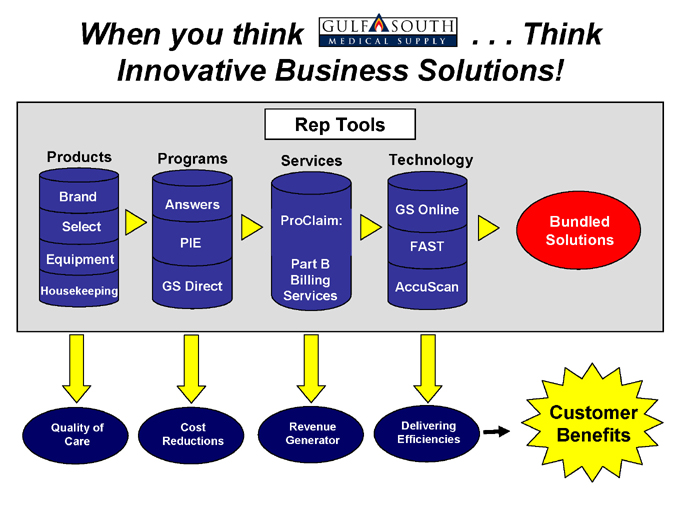
When you think
. . . Think
Innovative Business Solutions!
Rep Tools
Products
Brand
Select
Equipment
Housekeeping
Programs
Answers PIE GS Direct
Services
ProClaim:
Part B Billing Services
Technology
GS Online FAST AccuScan
Bundled Solutions
Quality of Care Cost Reductions Revenue Generator Delivering Efficiencies
Customer Benefits

answer plus
When you think
. . . Think
Innovative Business Solutions!
Rep Tools
Products
Brand
Select
Equipment
Housekeeping
Programs
Answers PIE GS Direct
Services
ProClaim:
Part B Billing Services
Technology
GS Online FAST AccuScan
Bundled Solutions
Quality of Care Cost Reductions Revenue Generator Delivering Efficiencies
Customer Benefits

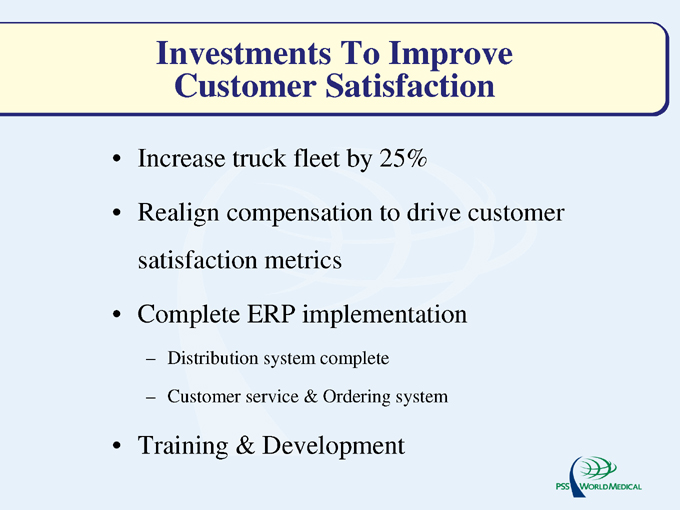
Investments To Improve Customer Satisfaction
Increase truck fleet by 25%
Realign compensation to drive customer satisfaction metrics
Complete ERP implementation
Distribution system complete
Customer service & Ordering system
Training & Development
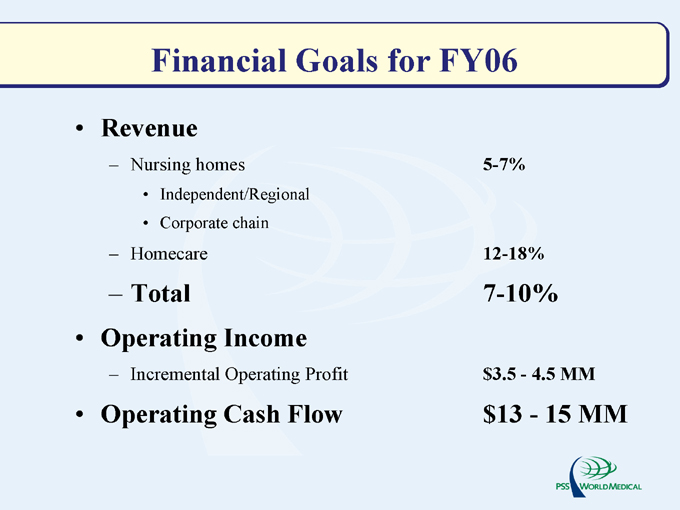
Financial Goals for FY06
Revenue
Nursing homes 5-7%
Independent/Regional Corporate chain
Homecare 12-18%
Total 7-10%
Operating Income
Incremental Operating Profit $3.5—4.5 MM
Operating Cash Flow $13—15 MM

Gary Corless President
Physician Sales & Service, Inc.

Physician Business
Investor Day
Today
Important Trends Market Factors Business Plan The Score Card
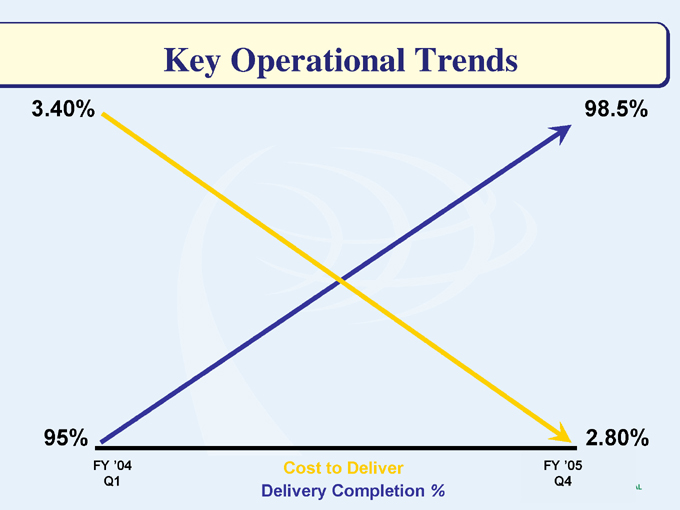
Key Operational Trends
3.40%
98.5%
95%
FY ‘04 Q1
2.80%
FY ‘05 Q4
Cost to Deliver Delivery Completion %
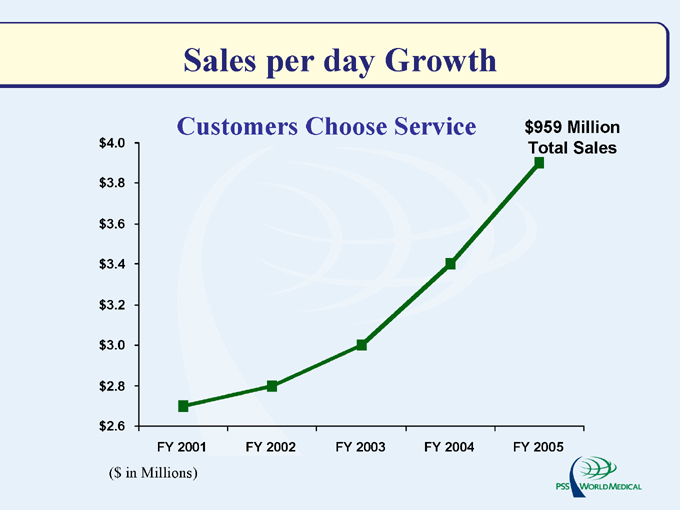
Sales per day Growth
Customers Choose Service $959 Million Total Sales $4.0 $3.8 $3.6 $3.4 $3.2 $3.0 $2.8 $2.6
FY 2001 FY 2002 FY 2003 FY 2004 FY 2005
($ in Millions)
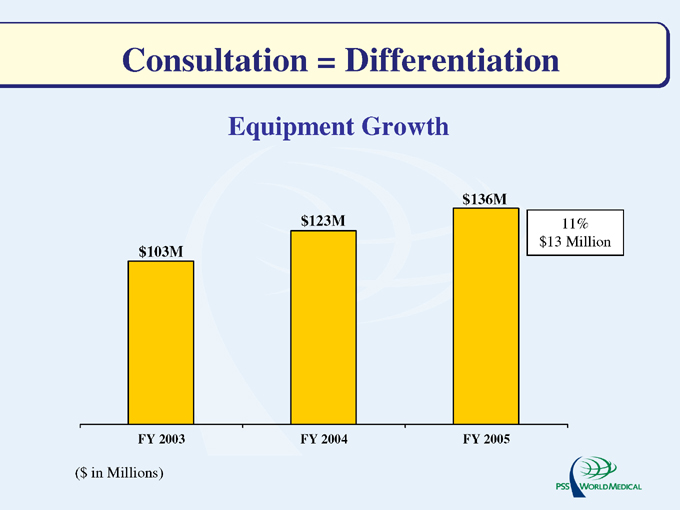
Consultation = Differentiation
Equipment Growth $103M $123M $136M
11% $13 Million
FY 2003 FY 2004 FY 2005
($ in Millions)
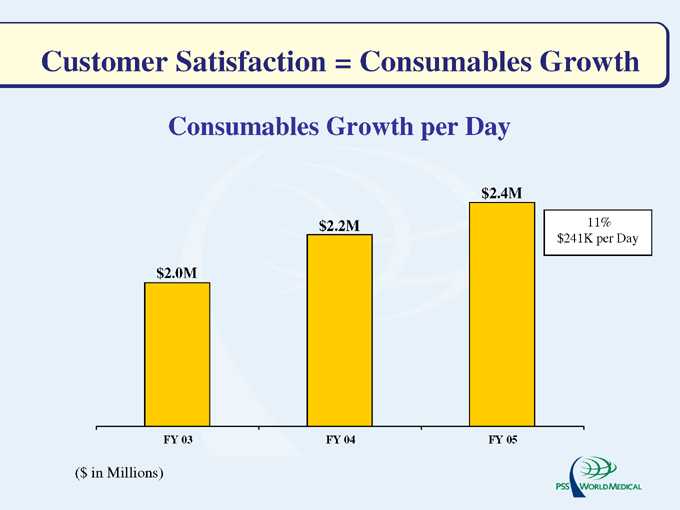
Customer Satisfaction = Consumables Growth
Consumables Growth per Day $2.0M $2.2M $2.4M
11% $241K per Day
FY 03
FY 04
FY 05
($ in Millions)
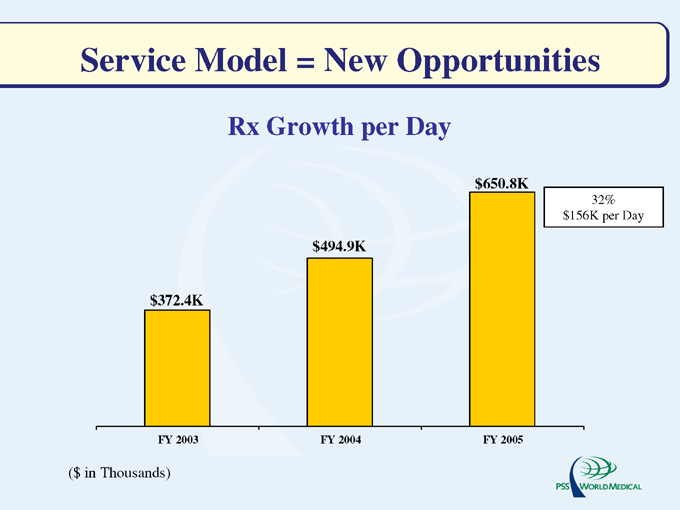
Service Model = New Opportunities
Rx Growth per Day $372.4K $494.9K $650.8K
32% $156K per Day
FY 2003
FY 2004
FY 2005
($ in Thousands)

Customer Satisfaction & Profitability
Operating Income $17M
2.51% $18M
2.49% $23M
3.03% $46M
5.17% $62M
6.46%
FY 2001 FY 2002 FY 2003 FY 2004 FY 2005
($ in Millions)
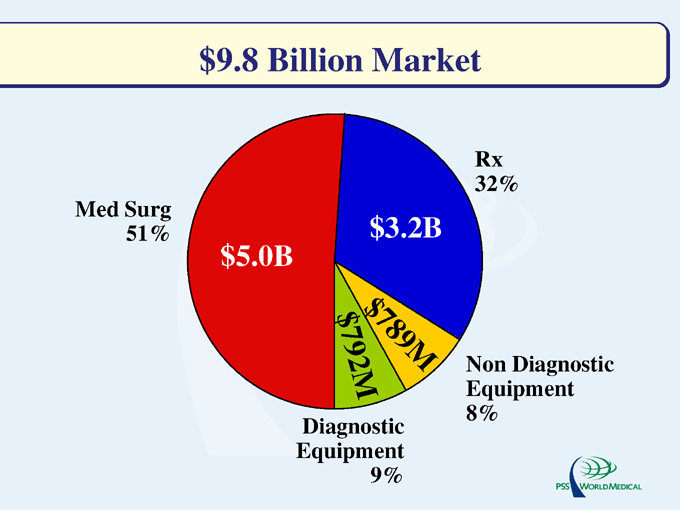
$9.8 Billion Market
Med Surg 51% $5.0B $3.2B
M
8 9
$72M
$79
Rx 32%
Diagnostic Equipment 9%
Non Diagnostic Equipment 8%
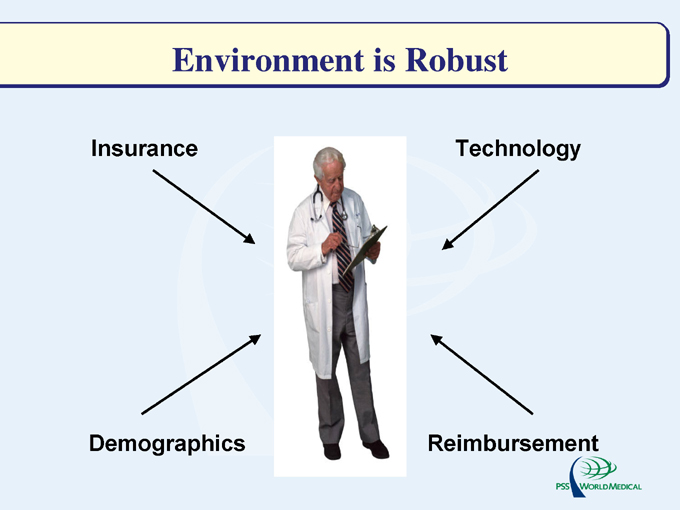
Environment is Robust
Insurance
Demographics
Technology
Reimbursement
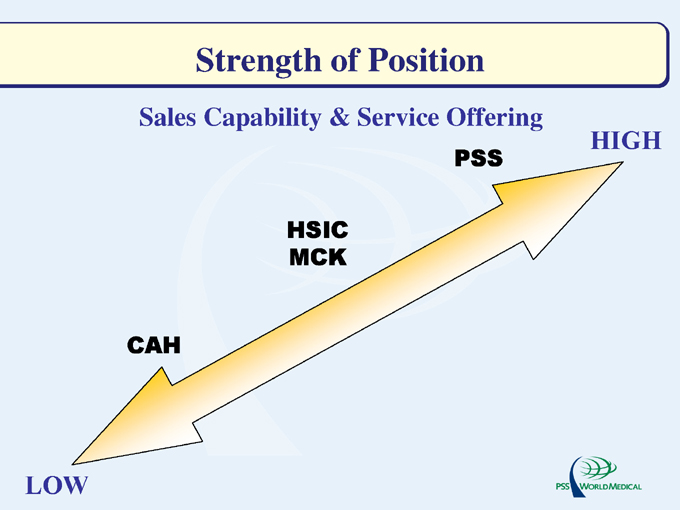
Strength of Position
Sales Capability & Service Offering
LOW
CAH
HSIC MCK
PSS
HIGH
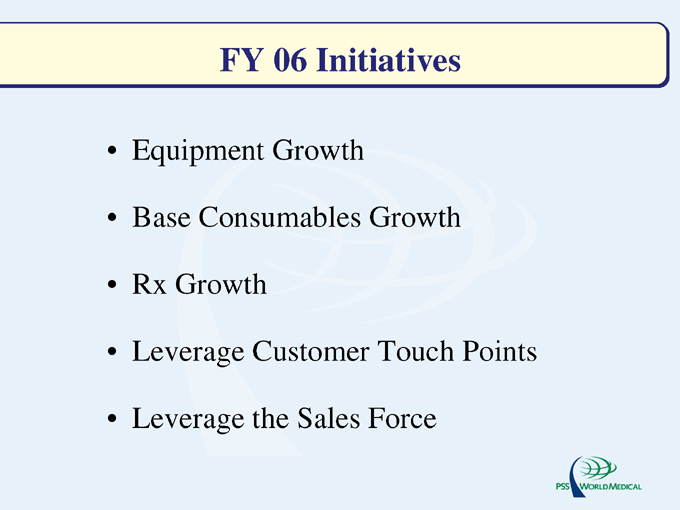
FY 06 Initiatives
Equipment Growth Base Consumables Growth Rx Growth Leverage Customer Touch Points Leverage the Sales Force
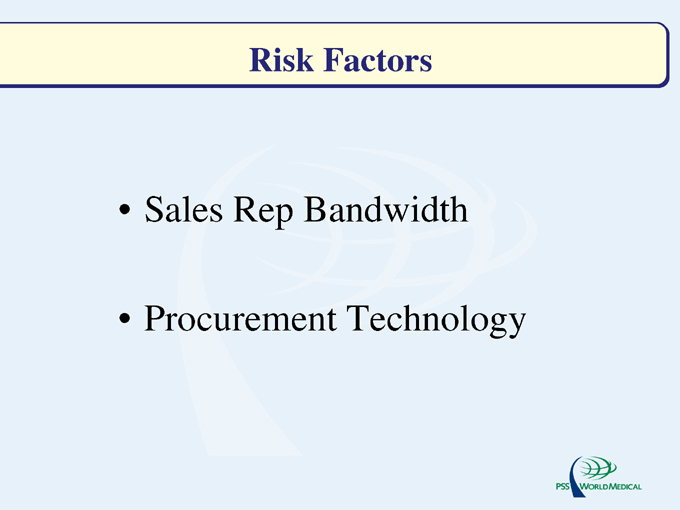
Risk Factors
Sales Rep Bandwidth
Procurement Technology
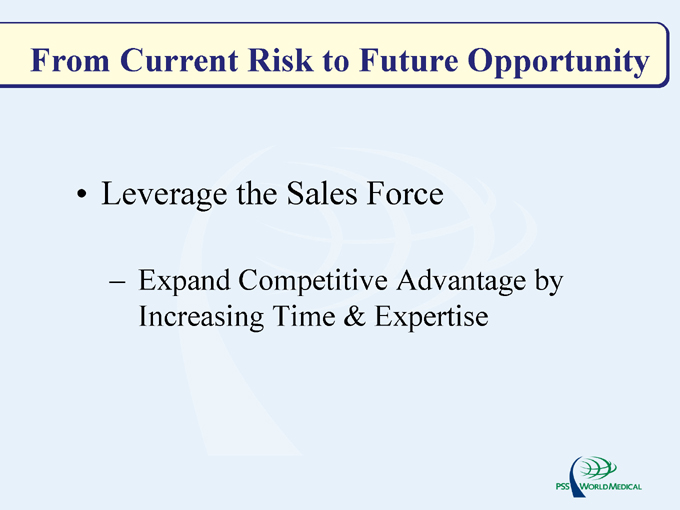
From Current Risk to Future Opportunity
Leverage the Sales Force
- Expand Competitive Advantage by Increasing Time & Expertise
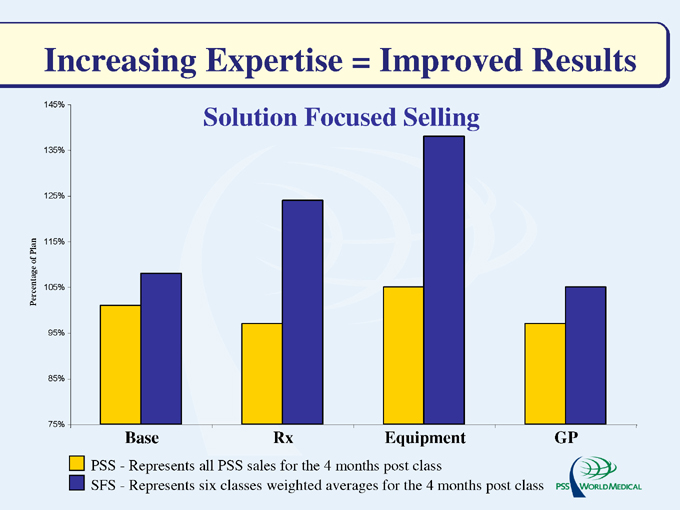
Increasing Expertise = Improved Results
Solution Focused Selling
145%
135%
125%
115%
105%
95%
85%
75%
Percentage of Plan
PSS—Represents all PSS sales for the 4 months post class
SFS—Represents six classes weighted averages for the 4 months post class
Base
Rx
Equipment
GP
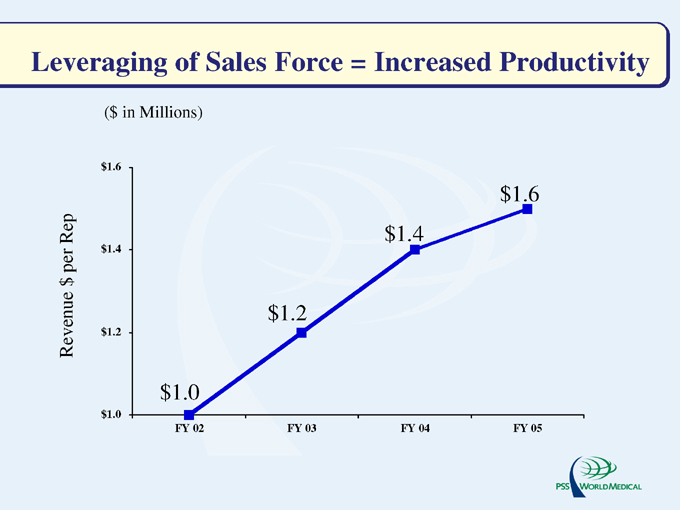
Leveraging of Sales Force = Increased Productivity
($ in Millions) $1.6 $1.4 $1.2 $1.0
Revenue $ per Rep $1.0 $1.2 $1.4 $1.6
FY 02 FY 03 FY 04 FY 05
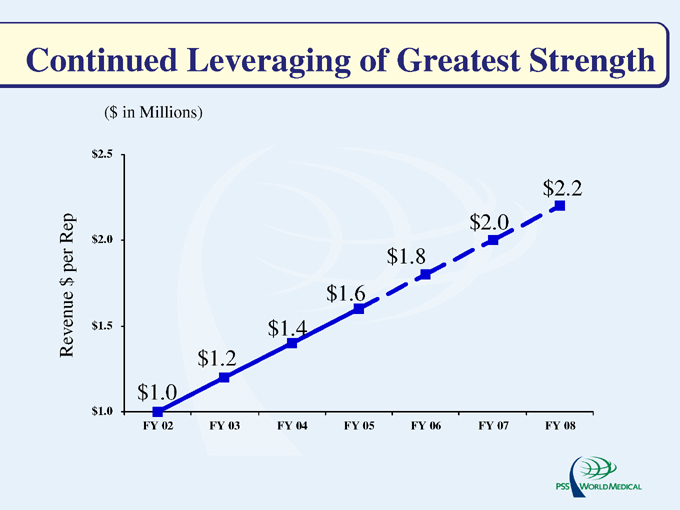
Continued Leveraging of Greatest Strength
($ in Millions)
Revenue $ per Rep $2.5 $2.0 $1.5 $1.0 $1.0 $1.2 $1.4 $1.6 $1.8 $2.0 $2.2
FY 02
FY 03
FY 04
FY 05
FY 06
FY 07
FY 08
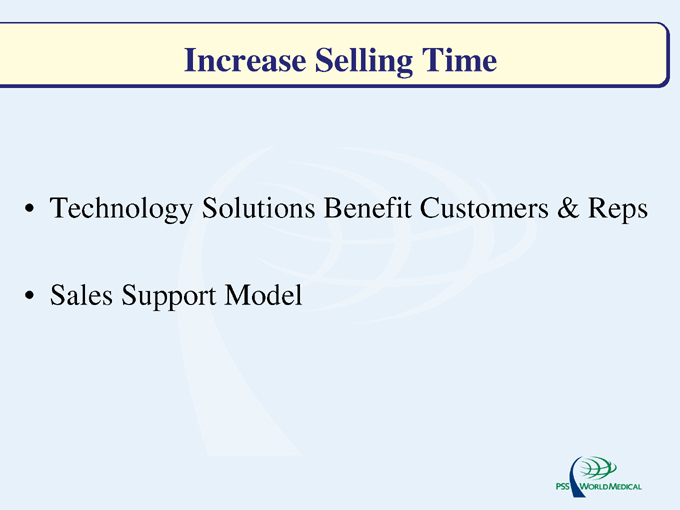
Increase Selling Time
Technology Solutions Benefit Customers & Reps
Sales Support Model
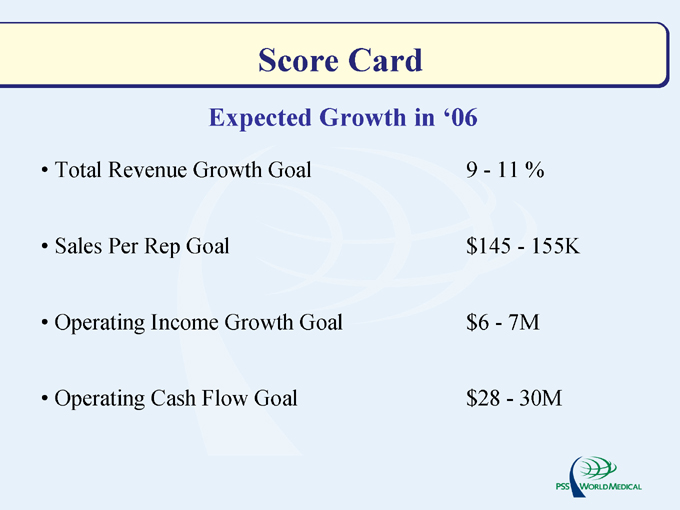
Score Card
Expected Growth in ‘06
Total Revenue Growth Goal 9—11 %
Sales Per Rep Goal $145—155K
Operating Income Growth Goal $6—7M
Operating Cash Flow Goal $28—30M

Improving health care in America through Innovative Solutions
Nasdaq:PSSI