 PSS World Medical Annual Investor Day May 22, 2008 Boston, Ma. |
 Robert Weiner Vice President, Investor Relations |
 Forward-Looking Statements Certain statements in this presentation are "forward-looking statements" made pursuant to the Private Securities Litigation Reform Act of 1995 and other federal securities laws. These forward-looking statements are identified by the use of words such as "expect," "may," "will," "should," "believe," "plan," "anticipate," and "estimate" among others. Specifically, forward-looking statements in this presentation include, without limitation, the Company's expected results in GAAP EPS in fiscal years 2009, 2010 and 2011. These statements involve a number of risks and uncertainties, many of which are outside the control of the Company. Actual results may differ materially from those identified in the forward-looking statements. Among the factors that could cause results to differ materially are the following: fluctuating demand for our products and services; the introduction of new products and services offered by us and our competitors; proper functioning of our data processing systems; our ability to carry out our global sourcing strategy; pricing pressures on large national and regional accounts and GPOs; customer credit quality and our ability to collect our accounts receivable; our ability to compete with other medical supply companies and direct manufacturers; multi- tiered cost structures where certain institutions can obtain more favorable prices for medical products than us; our ability to maintain relationships with our suppliers and customers; our ability to retain sales reps and key management; our ability to execute our growth strategy; increased operating costs, including fuel prices; risks involved in maintaining a large amount of inventory; we may not successfully execute our acquisition strategy; our indebtedness may limit our ability to obtain additional financing or react to market conditions; we face litigation and product liability exposure; we may be deemed to infringe other persons intellectual property; our business is subject to numerous federal, state and foreign laws and regulations, including state pedigree laws and regulations; general business, competitive and economic factors and conditions; and other factors described from time to time in the Company's reports filed with the Securities and Exchange Commission. The Company assumes no obligation to update the information in this release except as otherwise required by law. Readers are cautioned not to place undue reliance on these forward-looking statements that speak only as of the date hereof. |
 Today’s Agenda • David Smith - Chairman and Chief Executive Officer • Brad Hilton - Senior Vice President, Operations • John Sasen - Chief Marketing Officer • Kevin English - Senior Vice President, Supplier Operations • Gary Corless - Chief Operating Officer • David Bronson - Chief Financial Officer |
 David Smith Chairman and CEO |
 |
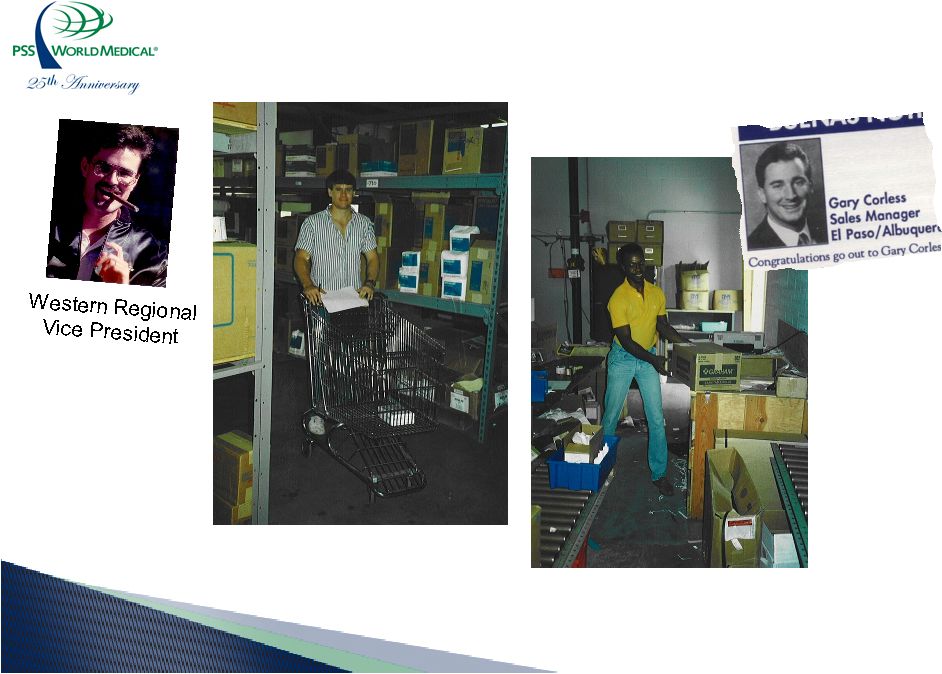 Simple Beginnings Big Dreams Early Warehouse |
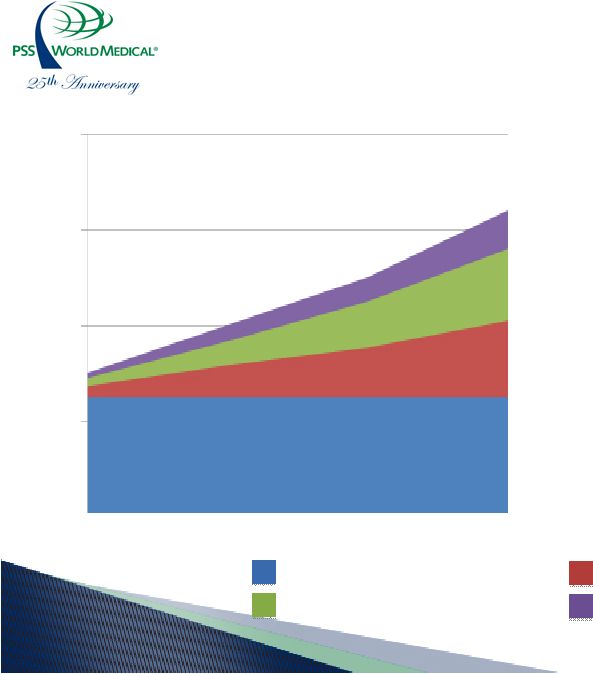
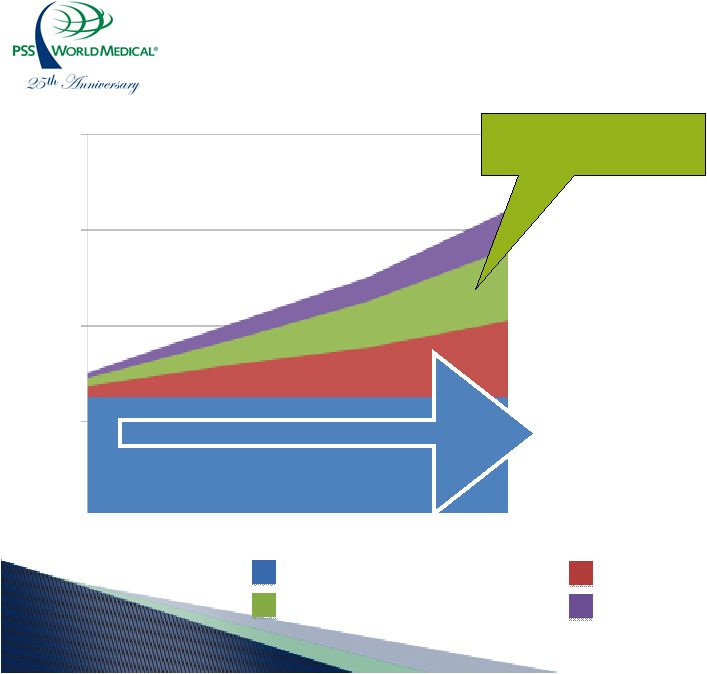
 Driving Growth and Increasing Strategic Advantages |
 25 Years of Lessons Learned • Position us for future success • Continued strategic and competitive advantages |
 Stay close to the Customer |
 Stay Close to the Customer • Real time feedback loops • Improved decision-making • Customer needs – Service model – Product portfolio – Marketing programs • Lead innovation, not follow it • Best returns and better leadership |
 Culture and People Win Battles |
 Culture and People Win Battles • Don’t notice in good times but can’t do without in bad times • Balance, not extremes • A lot of work and investment • Ownership and alignment of compensation • Pay-off: Move rapidly as one |
 Focus and Alignment = Execution |
 Focus and Alignment = Execution • Less dilution of effort and false starts • Better investments and returns • Leverage core competencies and highlight the need for new ones • Strategy, investments, tactics, metrics and compensation • Better acquisitions • More commitment |
 The DNA of PSS World Medical Passion Ethics Strategy Innovation Discipline Service Performance Alignment Compensation |
 Three-Year Strategic Plan 19% EPS Growth |
 Chinese Proverbs • May you live in interesting times • May your work come to the attention of those in power • May you accomplish your dreams |
 Economic Environment Energy costs Global sourcing Housing bubble Health care stability “Mom & Pop” Pressure Technology efficiency Presidential election Drug therapeutics Aging of America Diagnostic development Growth of alternate site Devaluation of the $ Deficit/Reimbursement Credit crunch Uninsured Americans |
 Physician Market Physician incomes Labor shortage New competition Alternate site shift HIT advancements Drug therapeutics Aging population Diagnostic development Competency Insurance complexity Rising costs Regulation |
 Elder Care Market Energy costs Government necessity Fines and penalties Financing availability Competitive bidding Tort Presidential election Drug therapeutics Aging population Provider incomes Huge growth Labor and nursing shortages Reimbursement Credit crunch Lower cost position |
 Strategic Priorities • Sourcing • Sales force bandwidth • Operations simplicity • Innovative programs and core growth • H.I.T. • Fold-in acquisitions • Leadership development |
 Thank you |
 Brad Hilton Senior Vice President, Operations |
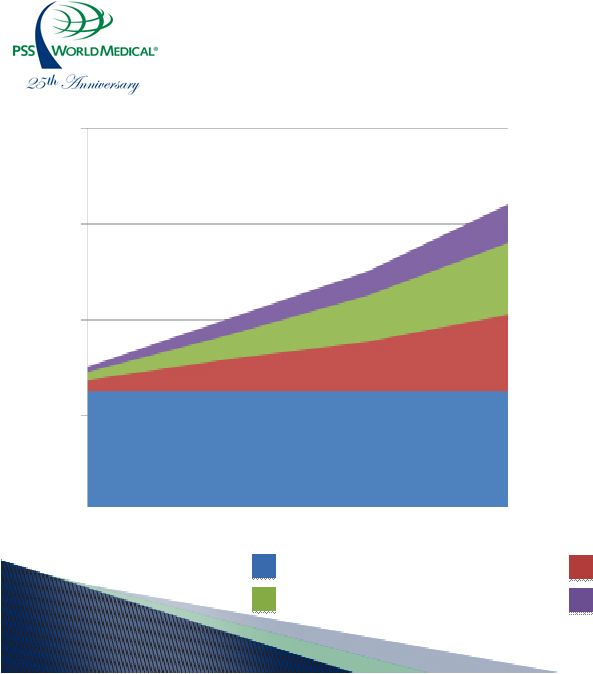
 Operating Margin Expansion Drive customer loyalty Enhance sales and marketing strategies Profitability through simplification Achieve goal of $20 - $25 million in cost savings 8.0% 7.0% 6.0% 5.0% 4.0% FY08 FY09 FY10 Q4 FY11 Base Business Simplification Sourcing Revenue Growth Leverage |
 Past Investments That Drove Results Infrastructure • Branch Consolidations • Facility standardization Processes • Best practices • Targeted centralization Team • Leadership development • Alignment of all team compensation Systems • JDE integration • Performance metrics |
 FY09 - FY11 Profitability Through Simplification |
 Future Investments For Profitable Growth Infrastructure • World Med network optimization Processes • Lean process reengineering • Empowered customer Team • Alignment with pay for performance programs • Leadership development Systems • Advanced warehouse management system • Transportation and logistics |
 8.0% 7.0% 6.0% 5.0% 4.0% Q4 FY08E Q4 FY09 Q4 FY10 Q4 FY11 Base Business Simplification Sourcing Revenue Growth Leverage Operating Margin Contribution •Systems •Team •Processes •Infrastructure $25 million/yr. in margin improvement |
 Our Goal Intelligent Investments To Drive Customer Loyalty and Shareholder Returns |
 Thank You |
 John Sasen Executive Vice President & Chief Marketing Officer |
 Brand Strategy Develop a broad array of competitive products from commodity to innovative that strengthens customer loyalty Our Brands represent our core values with emphasis on quality and value |
 Positioning Our Brand Multi Brand Strategy Select Specialty Brands • Commodity Categories • Consumable Products • Value Priced • Innovative • Complex • Strategic |
 Product Positioning for Quality and Customer Value Select™ Brand Select™ Brand EVOKE™ Brand REPARA ® Brand |
 Branded Supplier Strategy Mitigating Channel Conflict • Access to several consumer promotions • Positioning cost and price • Need for market share • Communications and networking |
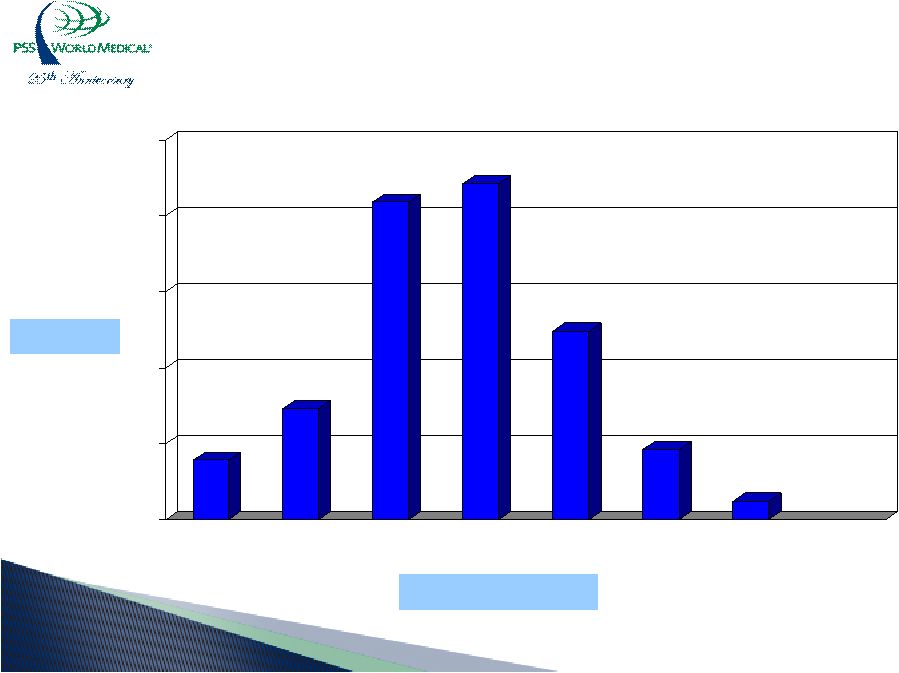 Select™ Mix # of Reps Rep Penetration % 0 50 100 150 200 250 0% - 15% 15% - 20% 20% - 25% 25% - 30% 30% - 35% 35% - 40% 40% + 39 73 209 221 124 46 12 |
 Branding Next Steps • Continue to develop both commodity and specialty products • Deeper penetration of customer base • Continue to build infrastructure • Leverage our investments through new markets and channels |
 Thank You |
 Kevin English Senior Vice President, Supplier Operations |
 Margin Expansion Return on Investment Goals $20 - $25 million P&L improvement $15 - $20 million balance sheet improvement 20 - 30% Improvement in Sales Rep productivity 8.0% 7.0% 6.0% 5.0% 4.0% FY08 FY09 FY10 FY11 Base Business Simplification Sourcing Revenue Growth Leverage |
 Past Investments that Drove Results • Global sourcing capability • Centralized supplier management • Redistribution network • Centralized procurement • Performance metrics |
 Future Investments Drive Profitable Growth • Supplier profitability • Global sourcing expansion • Systems and technology investments • Sales Rep bandwidth improvements |
 New Approach and Investments for Supplier Profitability Transaction GP Buy-side Profit Marketing Income Supply Chain Excess Rebate Costs |
 Global Sourcing Focus o Experienced sourcing partners o Multiple factories o Use of growth for negotiating o Dedicated and experienced quality control/quality assurance o Leverage existing model o Dedicated new product development o Establish local operations o Preferred supplier programs Strategies Investments |
    Systems and Technology Investments $15-$20 Million Over Three Years Systems/Technology Investment EDI Integrated Contracts & Rebates System Sals Rep Productivity Supply Chain Visability |
 Margin Expansion Significant Sourcing Contribution • Profitable supplier relationships • Meaningful investment in systems and technology • Expanded global sourcing capabilities • Improvements in Sales Rep productivity 8.0% 7.0% 6.0% 5.0% 4.0% FY08 FY09 FY10 Q4 FY11 Base Business Simplification Sourcing Revenue Growth Leverage |
 Thank You |
 Gary Corless Chief Operating Officer |
 Business Planning All Things Considered... • Environment • Market • Regulatory • Competition • Suppliers • Products • Technology • Leadership • Sales Force • Customers |
 Why and How We Will Win • Largest, best-trained sales force • Most comprehensive solutions-based offering • High customer loyalty with increasing needs for business partners • Robust product and program pipeline • Competent and seasoned management team |
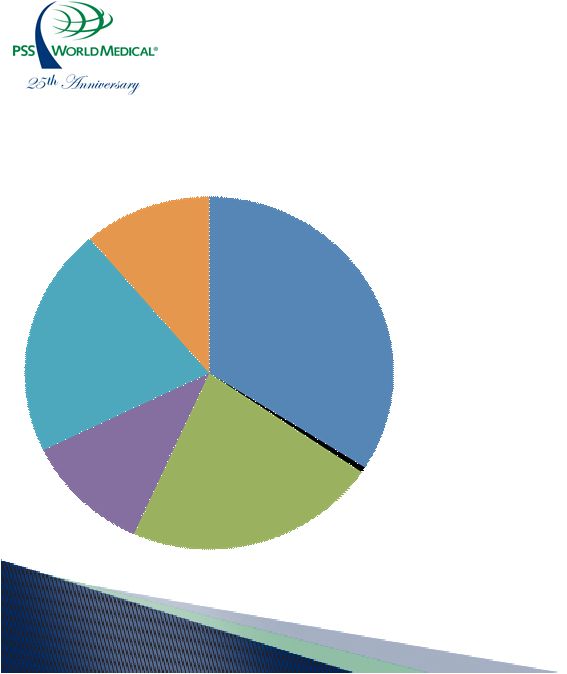
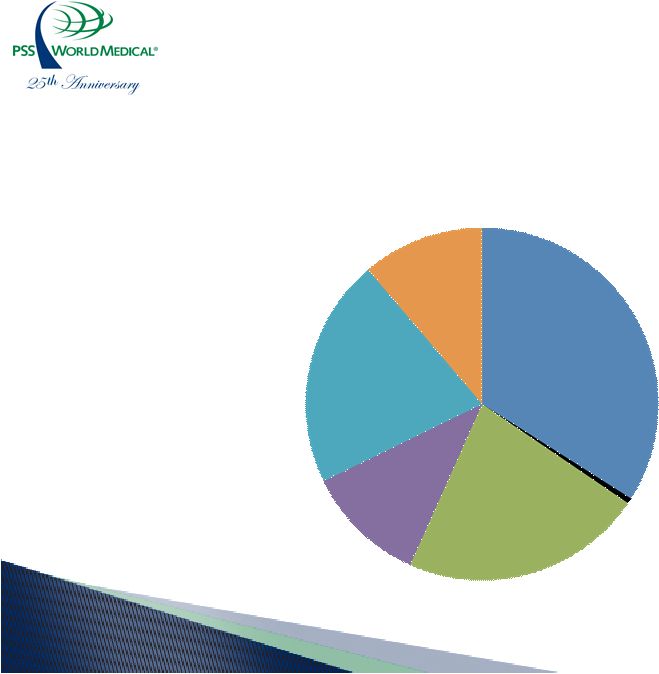 Physician Business Revenue Mix – FY 2008 By Product Segment Branded Consumables 34.4% H.I.T. .1% Rx 22.1% Lab Diagnostics 21.2% Equipment 11.1% Select TM 11.2% |
 Physician Business Select ™ Strategies Goal: 20% growth in FY 2009 Branded Consumables 34.4% H.I.T. .1% Rx 22.1% Lab Diagnostics 21.2% Equipment 11.1% 11.2% Select • Drive penetration of existing customer base • Investments in proprietary promotions • New product launches • Investment in field support, infrastructure and training TM |
 Physician Business Rx Strategies • Focus on adult vaccine products • Leverage preferred supplier contracts • Continued penetration of customer base • Field training and education Goal: 15% - 20% growth in FY 2009 Branded Consumables 34.4% H.I.T. .1% Rx 22.1% Lab Diagnostics 21.2% Equipment 11.1% Select™ 11.2% |
 Physician Business Equipment and Lab Diagnostics Strategies • Leverage sales force competencies and customer relationships • Focus on revenue generating products • Targeted ancillary services campaigns • Introduction of specialty brand diagnostic products Goal: 2% - 3% growth in FY 2009 Branded Consumables 34.4% H.I.T. .1% Rx 22.1% Lab Diagnostics 21.2% Equipment 11.1% Select™ 11.2% |
 Physician Business Health Care Information Technology (HIT) Strategies • Revenue cycle management, EMR, Practice management and eCommerce • Investment in HIT specialists • Increased H.I.T. training • Investment in eCommerce infrastructure Goal: • 800 – 1,000 physicians by end of FY 2009 • 35% of Physician Business revenue eCommerce driven Branded Consumables 34.4% H.I.T. .1% Rx 22.1% Lab Diagnostics 21.2% Equipment 11.1% Select™ 11.2% |
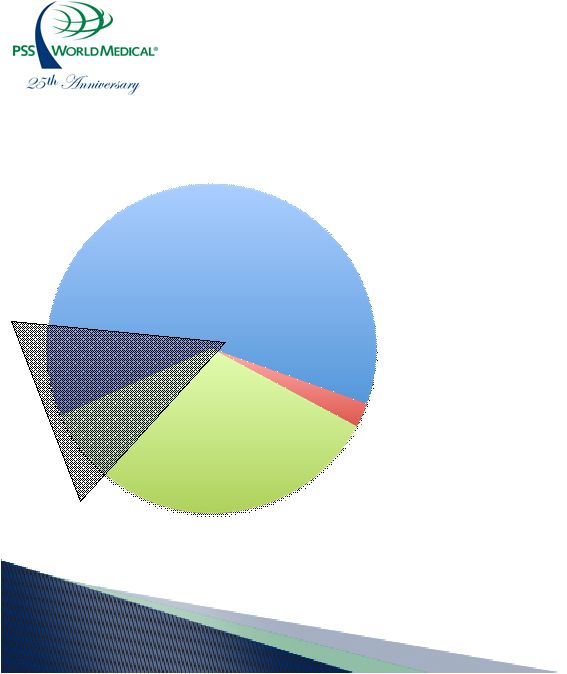
 Elder Care Business Revenue Mix – FY 2008 Billing Services 2.4% Home Care 35.5% Nursing Home & Assisted Living 62.1% |
 Elder Care Business Skilled Nursing & Assisted Living Strategies • Launch of innovative program • Continued Select™ penetration • Focused market blitzes (SNF & Proclaim) • Increased Training & Development Goal: 6% - 8% growth in FY 2009 Nursing Home & Assisted Living 62.1% |
   Elder Care Business Select™ Strategies • Drive penetration of existing customers • Launch new products • Align compensation • Enhanced clinical support • Enhanced sales toolbox Goal: 20%+ growth in FY 2009 Billing Services 2.4% Home Care 35.5% Nursing Home & Assisted Living 62.1% Select ™ 16.2% |
 Elder Care Business Home Care Strategies • Focused blitzes • Enhanced sales toolbox • Investment in sales representatives • Develop specialized hospice program • Invest in home care IT customers Goal: 8% - 11% growth in FY 2009 Home Care 35.5% |
 Elder Care Business Billing Services Strategies • Expanding sales force • Training and education • Market blitzes • New program launch Goal: 20% growth in FY 2009 Billing Services 2.4% Home Care 35.5% Nursing Home & Assisted Living 62.1% |
 Thank You |
 David Bronson Executive Vice President & Chief Financial Officer |
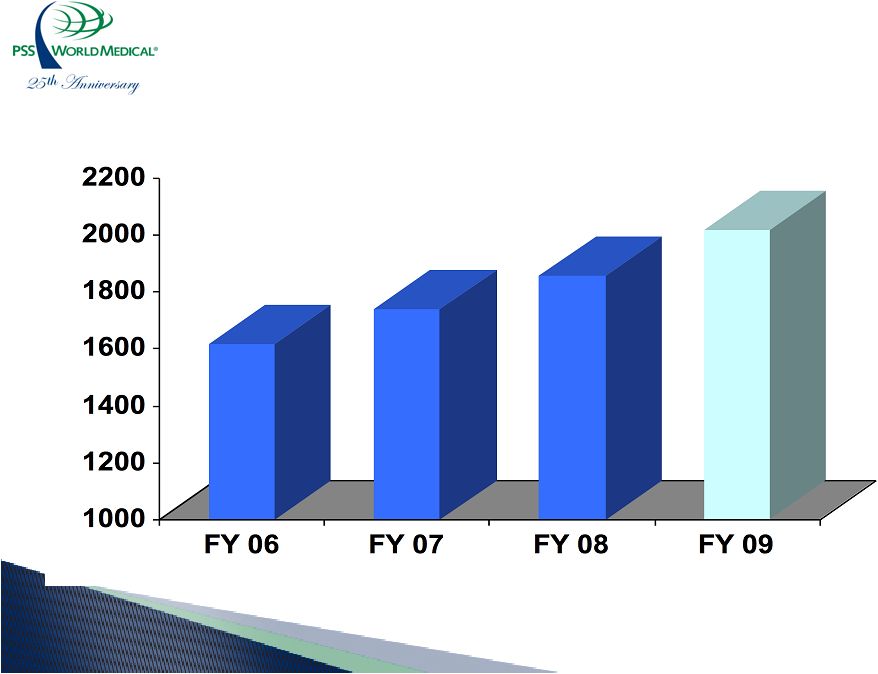 Revenue Growth $1,619 ($ in millions) $1,742 $1,856 $2,020 FY09 Goal 8.5% - 9.5% in FY 2009 |
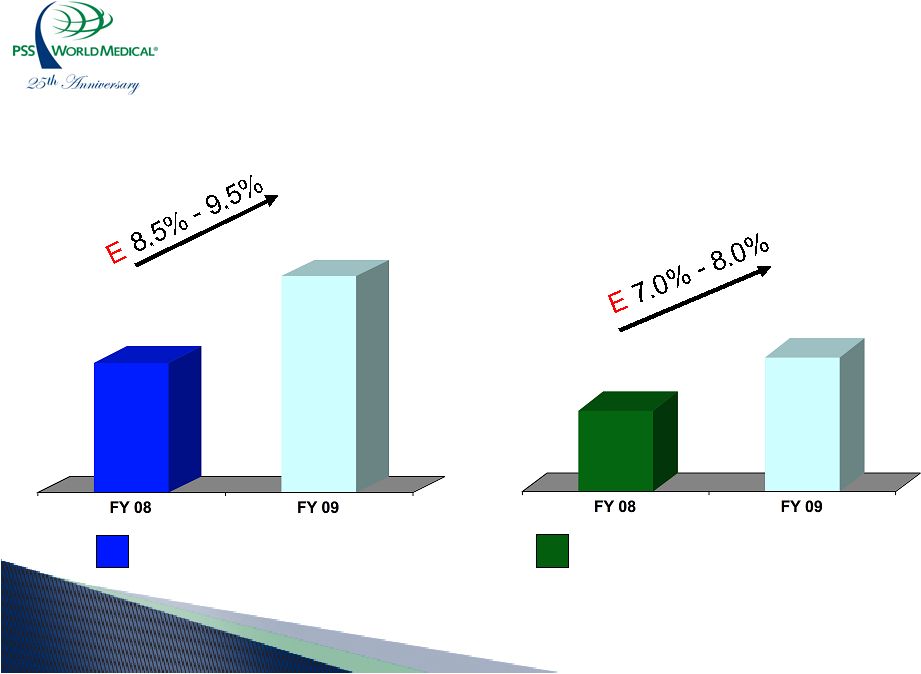 Revenue Growth FY2009 Goals By Business Segment ($ in millions) Elder Care Business Physician Business $1,309 $1,420 - $1,425* $547 $585 - $590* *Mid point of FY 2009 Goals |
 Revenue Growth Drivers Physician • Expansion and growth of Select™ • Leverage Rx program • Continued program growth & market blitzes – Consumables – Equipment • Investments in health care information technology Elder Care • Expansion and growth of Select™ • Home Healthcare revenue growth • Continued program growth and market blitzes – SNF – Billing services |
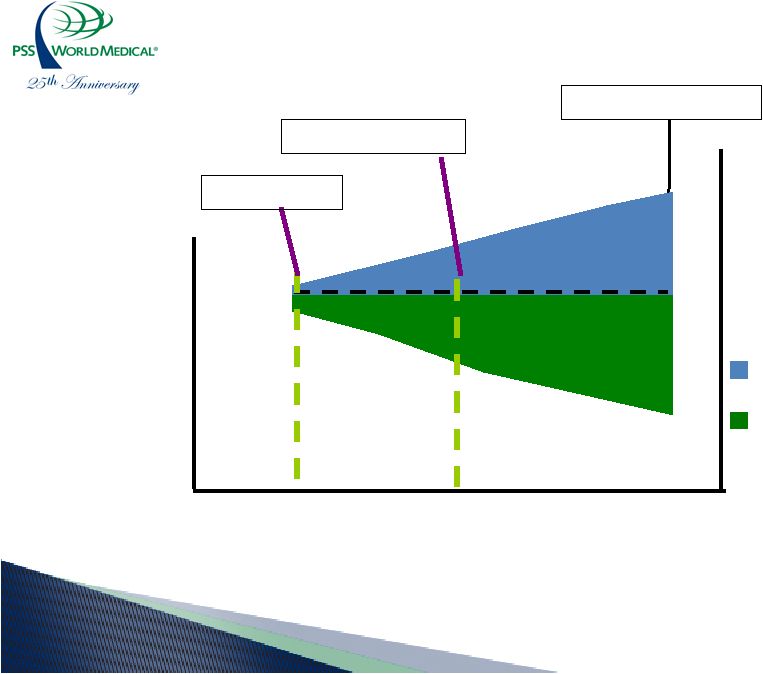 Goal: 6% - 6.5% Operating Margin Expansion FY 06 FY 07 FY 08 Total Costs As % of Revenue Total Revenue ($ in Billions) $1.5 $2.0 Total Revenue Total Costs as % of Revenue 21 4.5% FY06 4.7% FY07 |
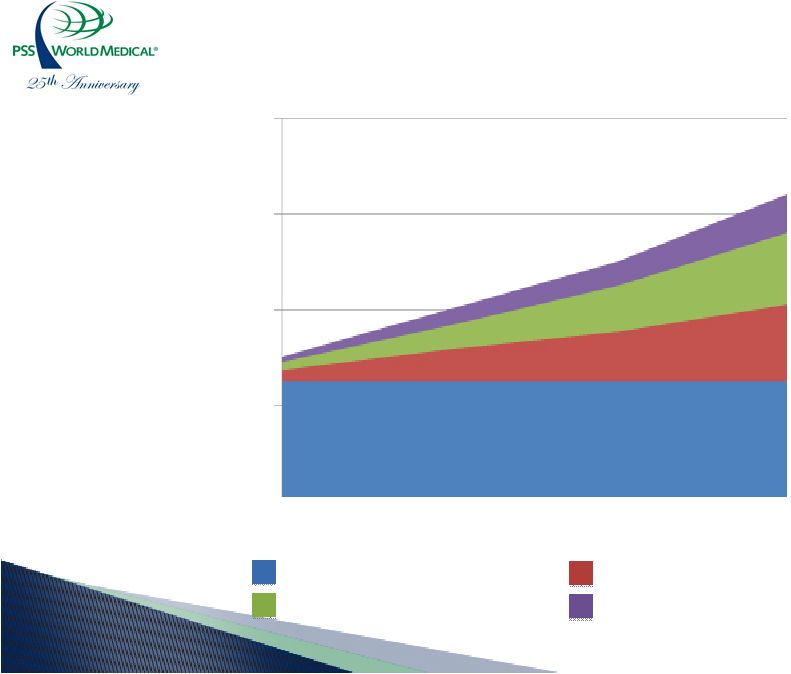 Operating Margin Contribution 8.0% 7.0% 6.0% 5.0% 4.0% FY08 FY09 FY10 Q4 FY11 Base Business Simplification Sourcing Revenue Growth Leverage |
 Revenue Growth Leverage • Distribution infrastructure • Technology platform • Shared services and back office functions Goal: 7.5% – 9% Operating margin drop-through |
 FY 09 – FY 11 Margin Expansion Investments and Return o Operations simplicity o Branding strategy & Sourcing o Revenue leverage o $20 - $25 million in cost to serve Investments Return o $10 - $15 million savings in G & A savings (G&A reduction, as % of sales) o $20 - $25 million in sourcing and private label gross profit |
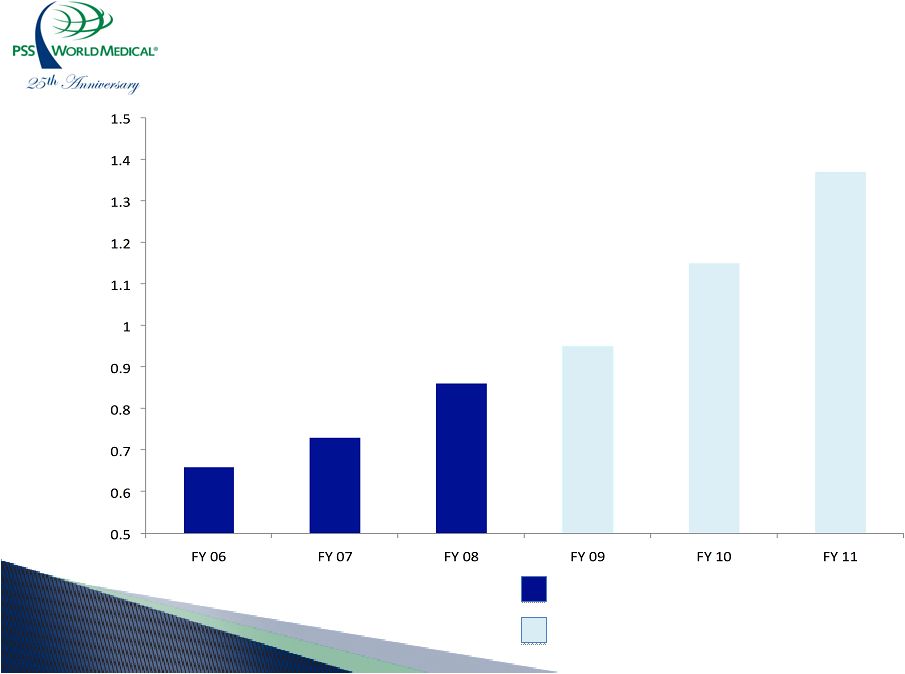 EPS Growth FY 2006 – FY 2011 $0.66 Earning Per Diluted Share $0.73 $0.86 $0.94 - $0.96 $1.13 - $1.17 $1.35 - $1.39 Actual Goal |
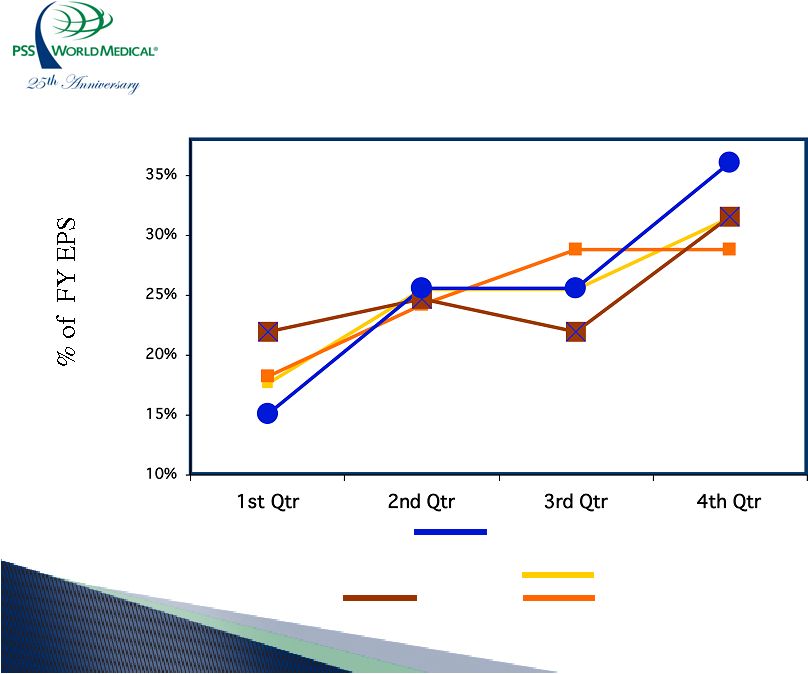 Fiscal Year 2005 - 2008: Historical Earnings Progression By Quarter FY 2006 FY 2005 FY2005 excludes tax benefit of $5.6 million or $0.09 per diluted share FY 2007 FY 2008 |
 Efficient Capital Structure ($ in millions) Q4 FY 2008 Cash $ 21.1 Total Debt: Convertible senior notes & other $221.7 Net debt $200.6 Shareholders’ equity $335.0 Weighted shares outstanding 63.2 (fully diluted) |
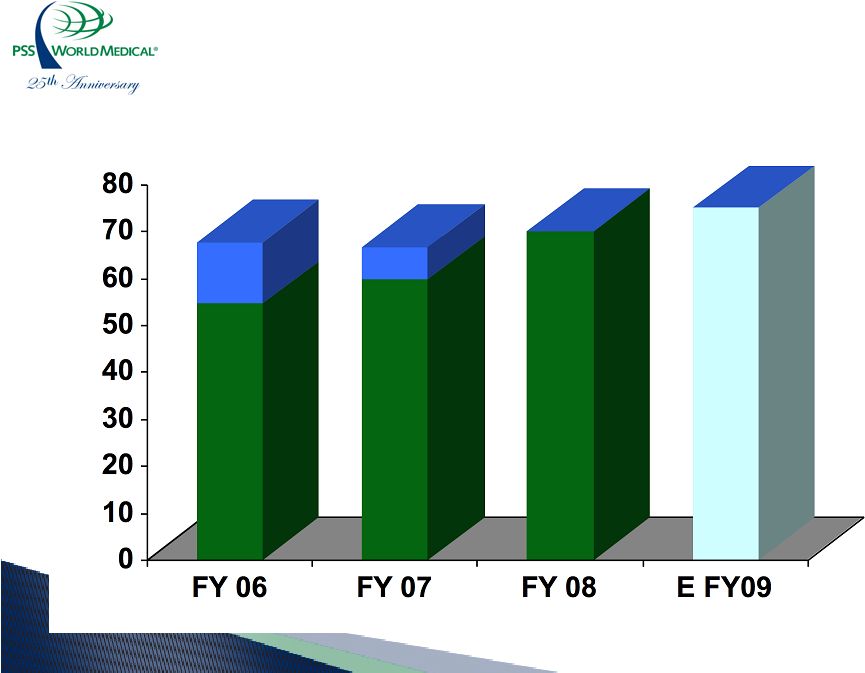 Operating Cash Flow Growth $68.0 ($ in millions) $54.9 $69.8 $59.8 $63.5 $69.8 $73 - $77 (Goal) |
 Fold-in Acquisition Strategy • Pressures on small distributors – Rebates and contracts complexity – Access to private label, globally-sourced products – Access to HIT and other new technologies – Access to capital markets |
 Fold-in Acquisition Strategy • Acquire to: – Leverage infrastructure and capabilities – Gain experienced sales representatives • Targets: – $10mm - $50mm of revenue – Company with similar market approaches |
 Share Repurchase Activity • April 2, 2008: - Board of Directors approved repurchase of 5% • Total availability 3.5 MM shares FY06 FY07 FY08 TOTAL Total Shares - 2.1 6.4 8.5 Total Investment - $42.9 $112.5 $155.4 Total Cost Per Share - $20.17 $17.68 $18.31 |
 Capital Expenditures • Maintenance Capital $4 - $5 Million • Customer interface process improvements $11 - 12 Million • Strategic systems development $12 – 13 Million • Infrastructure & rollover $1 Million $28 - $30 Million |
 FY 2009: Financial Goals • Consolidated revenue growth 8.5% - 9.5% • Operating cash flow (in millions) $73.0 - $77.0 • Earnings per diluted share $0.94 - $0.96 |
 Thank You |