UNITED STATES
SECURITIES AND EXCHANGE COMMISSION
WASHINGTON, D.C. 20549
FORM N-CSR
CERTIFIED SHAREHOLDER REPORT OF REGISTERED MANAGEMENT
INVESTMENT COMPANIES
Investment Company Act file number: 811-08426
ALLIANCEBERNSTEIN INTERNATIONAL GROWTH FUND, INC.
(Exact name of registrant as specified in charter)
1345 Avenue of the Americas, New York, New York 10105
(Address of principal executive offices) (Zip code)
Joseph J. Mantineo
AllianceBernstein L.P.
1345 Avenue of the Americas
New York, New York 10105
(Name and address of agent for service)
Registrant’s telephone number, including area code: (800) 221-5672
Date of fiscal year end: June 30, 2010
Date of reporting period: December 31, 2009
| ITEM 1. | REPORTS TO STOCKHOLDERS. |
SEMI-ANNUAL REPORT
AllianceBernstein International Growth Fund

December 31, 2009
Semi-Annual Report
Investment Products Offered
| • | Are Not FDIC Insured |
| • | May Lose Value |
| • | Are Not Bank Guaranteed |
The investment return and principal value of an investment in the Fund will fluctuate as the prices of the individual securities in which it invests fluctuate, so that your shares, when redeemed, may be worth more or less than their original cost. You should consider the investment objectives, risks, charges and expenses of the Fund carefully before investing. For a free copy of the Fund’s prospectus, which contains this and other information, visit our web site at www.alliancebernstein.com or call your financial advisor or AllianceBernstein® at (800) 227-4618. Please read the prospectus carefully before you invest.
You may obtain performance information current to the most recent month-end by visiting www.alliancebernstein.com.
This shareholder report must be preceded or accompanied by the Fund’s prospectus for individuals who are not current shareholders of the Fund.
You may obtain a description of the Fund’s proxy voting policies and procedures, and information regarding how the Fund voted proxies relating to portfolio securities during the most recent 12-month period ended June 30, without charge. Simply visit AllianceBernstein’s web site at www.alliancebernstein.com, or go to the Securities and Exchange Commission’s (the “Commission”) web site at www.sec.gov, or call AllianceBernstein at (800) 227-4618.
The Fund files its complete schedule of portfolio holdings with the Commission for the first and third quarters of each fiscal year on Form N-Q. The Fund’s Forms N-Q are available on the Commission’s web site at www.sec.gov. The Fund’s Forms N-Q may also be reviewed and copied at the Commission’s Public Reference Room in Washington, DC; information on the operation of the Public Reference Room may be obtained by calling (800) SEC-0330. AllianceBernstein publishes full portfolio holdings for the Fund monthly at www.alliancebernstein.com.
AllianceBernstein Investments, Inc. (ABI) is the distributor of the AllianceBernstein family of mutual funds. ABI is a member of FINRA and is an affiliate of AllianceBernstein L.P., the manager of the funds.
AllianceBernstein® and the AB Logo are registered trademarks and service marks used by permission of the owner, AllianceBernstein L.P.
February 16, 2010
Semi-Annual Report
This report provides management’s discussion of fund performance for AllianceBernstein International Growth Fund (the “Fund”) for the semi-annual reporting period ended December 31, 2009.
Investment Objective and Policies
The Fund’s investment objective is long-term growth of capital. The Fund invests primarily in an international portfolio of equity securities of companies selected by AllianceBernstein L.P. (the “Adviser”) for their growth potential within various market sectors. Examples of the types of market sectors in which the Fund may invest include, but are not limited to, information technology, telecommunications, health care, financial services, infrastructure, energy and natural resources, and consumer growth.
The Fund invests, under normal circumstances, in the equity securities of companies located in at least three countries (and normally substantially more) other than the United States. The Fund invests in securities of companies in both developed and emerging market countries. Geographic distribution of the Fund’s investments among countries or regions also will be a product of the stock selection process rather than a pre-determined allocation. The Fund may also invest in synthetic foreign equity securities. The Adviser expects that normally the Fund’s portfolio will tend to emphasize investments in larger capitalization companies, although the Fund may invest in smaller or medium capitalization
companies. The Fund normally invests in approximately 90-130 companies.
Currencies can have a dramatic impact on equity returns, significantly adding to returns in some years and greatly diminishing them in others. Currency and equity positions are evaluated separately. The Adviser may seek to hedge the currency exposure resulting from securities positions when it finds the currency exposure unattractive. To hedge a position of its currency risk, the Fund may from time to time invest in currency-related derivatives, including forward currency exchange contracts, futures, options on futures, swaps and options. The Adviser may also seek investment opportunities by taking long or short positions in currencies through the use of currency-related derivatives.
Investment Results
The table on page 4 provides the performance results for the Fund and its primary benchmark, the MSCI AC World (ex-US) Index (net). Also included are returns for the Fund’s secondary benchmark, the MSCI World (ex-US) Index (net) for the six-and 12-month periods ended December 31, 2009.
The Fund’s Class A shares without sales charges outperformed the primary benchmark for the six-month period, but underperformed it for the 12-month period ended December 31, 2009. For the six-month period, the Fund’s premium was driven by strong stock selection, notably in the consumer discretionary, materials and energy sectors. Stock selection in
| ALLIANCEBERNSTEIN INTERNATIONAL GROWTH FUND • | 1 |
financials was a drag on relative performance.
For the 12-month period, positive stock selection was offset by negative sector selection, as strength from the Fund’s financial holdings was offset by an underweight in materials and an overweight in healthcare.
Market Review and Investment Strategy
After plunging early in 2009 following the 2008 crash, international equities came roaring back in 2009, with the MSCI AC World (ex-US) Index finishing the year up 41.45%. The global economic recovery gathered steam as evidence emerged that the US and the euro area had returned to positive growth, and much of Asia—including China, India, South Korea and Taiwan—posted near double-digit gains in the third quarter. A resurgence of domestic demand in these countries has added momentum to the economic recoveries of other nations, such as Japan and Australia, by boosting their exports. Global trade flows and consumer and business confidence also rebounded during the year.
In 2009, the first and fourth quarters favored growth, while value stocks rallied in the middle two quarters. This pattern was very much in sync with wholesale shifts in investor attitudes toward risk across styles: at first they shunned it altogether, then signs of economic recovery prompted them to embrace stocks previously considered high-risk and whose prices had plunged most precipitously. By the fourth quarter, however, investors became more discriminating, focusing again on fundamentals.
The Fund’s International Growth Portfolio Oversight Group’s (the “Group’s”) “dynamic gap” investment process uses fundamental research to find disparities between the Group’s expectations for a company and the consensus views that are already reflected in the share price. The Group believes that there are an extraordinary number of these dynamic gap opportunities across the investment landscape as industries, companies and consumers recalibrate after the tumult of the last two years.
| 2 | • ALLIANCEBERNSTEIN INTERNATIONAL GROWTH FUND |
HISTORICAL PERFORMANCE
An Important Note About the Value of Historical Performance
The performance shown on the following pages represents past performance and does not guarantee future results. Current performance may be lower or higher than the performance information shown. You may obtain performance information current to the most recent month-end by visiting www.alliancebernstein.com.
The investment return and principal value of an investment in the Fund will fluctuate, so that your shares, when redeemed, may be worth more or less than their original cost. You should consider the investment objectives, risks, charges and expenses of the Fund carefully before investing. For a free copy of the Fund’s prospectus, which contains this and other information, visit our website at www.alliancebernstein.com or call your financial advisor or AllianceBernstein Investments at 800.227.4618. You should read the prospectus carefully before you invest.
All fees and expenses related to the operation of the Fund have been deducted. NAV returns do not reflect sales charges; if sales charges were reflected, the Fund’s quoted performance would be lower. SEC returns reflect the applicable sales charges for each share class: a 4.25% maximum front-end sales charge for Class A shares; the applicable contingent deferred sales charge for Class B shares (4% year 1, 3% year 2, 2% year 3, 1% year 4); a 1% 1 year contingent deferred sales charge for Class C shares. Returns for the different share classes will vary due to different expenses associated with each class. Performance assumes reinvestment of distributions and does not account for taxes.
Benchmark Disclosure
Neither the unmanaged Morgan Stanley Capital International (MSCI) All Country (AC) World (ex-US) Index (net) nor the unmanaged MSCI World (ex-US) Index (net) reflect fees and expenses associated with the active management of a mutual fund portfolio. The MSCI AC World (ex-US) Index (net) is a free float-adjusted market capitalization index that is designed to measure equity market performance in the global developed and emerging markets, excluding the US. The MSCI World (ex-US) Index is a free float-adjusted market capitalization index that is designed to measure global developed market equity performance in 23 developed market countries, excluding the US. An investor cannot invest directly in an index, and its results are not indicative of the performance for any specific investment, including the Fund.
The MSCI World (ex-US) Index and the MSCI AC World (ex-US) Index values are calculated using net returns. Net returns approximate the minimum possible dividend reinvestment—the dividend reinvested after deduction of withholding tax, applying the rate to non-resident individuals who do not benefit from double taxation treaties.
A Word About Risk
Substantially all of the Fund’s assets will be invested in foreign securities which may magnify fluctuations due to changes in foreign exchange rates and the possibility of substantial volatility due to political and economic uncertainties in foreign countries. The Fund may invest in securities of emerging market nations. These investments have additional risks, such as those presented by illiquid or thinly traded markets, company management risk, heightened political instability and currency volatility. Accounting standards and market regulations in emerging market nations are not the same as those in the US. Growth investing does not guarantee a profit or eliminate risk. The stocks of these companies have relatively high valuations. Because of these high valuations, an investment in a growth stock can be more risky than an investment in a company with more modest growth expectations. If a growth stock company should fail to meet these high earnings expectations, the price of these stocks can be severely negatively affected. When a Fund borrows money or otherwise leverages its portfolio, it may be volatile because leverage tends to exaggerate the effect of any increase or decrease in the value of the Fund’s investments. The Fund may create leverage through the use of reverse repurchase arrangements, forward currency exchange contracts, forward commitments, dollar rolls or futures contracts or by borrowing money. While the Fund invests principally in common stocks and other equity securities, in order to achieve its investment objectives, the Fund may at times use certain types of investment derivatives, such as options, futures, forwards and swaps. These instruments involve risks different from, and in certain cases, greater than, the risks presented by more traditional investments. These risks are fully discussed in the Fund’s prospectus.
(Historical Performance continued on next page)
| ALLIANCEBERNSTEIN INTERNATIONAL GROWTH FUND • | 3 |
Historical Performance
HISTORICAL PERFORMANCE
(continued from previous page)
THE FUND VS. ITS BENCHMARKS PERIODS ENDED DECEMBER 31, 2009 | Returns | |||||
| 6 Months | 12 Months | |||||
AllianceBernstein International Growth Fund | ||||||
Class A | 26.06% | 40.09% | ||||
Class B* | 25.66% | 39.00% | ||||
Class C | 25.59% | 39.17% | ||||
Advisor Class† | 26.30% | 40.59% | ||||
Class R† | 25.95% | 39.82% | ||||
Class K† | 26.15% | 40.24% | ||||
Class I† | 26.42% | 40.80% | ||||
MSCI All Country (AC) World (ex-US) Index (Net) | 24.16% | 41.45% | ||||
MSCI World (ex-US) Index (Net) | 22.27% | 33.67% | ||||
* Effective January 31, 2009, Class B shares are no longer available for purchase to new investors. Please see Note A for more information. | ||||||
† Please note that these share classes are for investors purchasing shares through accounts established under certain fee-based programs sponsored and maintained by certain broker-dealers and financial intermediaries, institutional pension plans and/or investment advisory clients of, and certain other persons associated with, the Adviser and its affiliates or the Funds. | ||||||
Please keep in mind that high, double-digit returns are highly unusual and cannot be sustained. Investors should also be aware that these returns were primarily achieved during favorable market conditions.
| ||||||
See Historical Performance and Benchmark disclosures on previous page.
(Historical Performance continued on next page)
| 4 | • ALLIANCEBERNSTEIN INTERNATIONAL GROWTH FUND |
Historical Performance
HISTORICAL PERFORMANCE
(continued from previous page)
| AVERAGE ANNUAL RETURNS AS OF DECEMBER 31, 2009 | ||||||
| NAV Returns | SEC Returns | |||||
| Class A Shares | ||||||
1 Year | 40.09 | % | 34.12 | % | ||
5 Years | 4.47 | % | 3.56 | % | ||
10 Years | 2.49 | % | 2.05 | % | ||
| Class B Shares | ||||||
1 Year | 39.00 | % | 35.00 | % | ||
5 Years | 3.68 | % | 3.68 | % | ||
10 Years(a) | 1.87 | % | 1.87 | % | ||
| Class C Shares | ||||||
1 Year | 39.17 | % | 38.17 | % | ||
5 Years | 3.73 | % | 3.73 | % | ||
10 Years | 1.74 | % | 1.74 | % | ||
| Advisor Class Shares† | ||||||
1 Year | 40.59 | % | 40.59 | % | ||
5 Years | 4.78 | % | 4.78 | % | ||
10 Years | 2.81 | % | 2.81 | % | ||
| Class R Shares† | ||||||
1 Year | 39.82 | % | 39.82 | % | ||
Since Inception* | 3.35 | % | 3.35 | % | ||
| Class K Shares† | ||||||
1 Year | 40.24 | % | 40.24 | % | ||
Since Inception* | 3.62 | % | 3.62 | % | ||
| Class I Shares† | ||||||
1 Year | 40.80 | % | 40.80 | % | ||
Since Inception* | 4.02 | % | 4.02 | % | ||
The Fund’s current prospectus fee table shows the Fund’s total annual operating expense ratios as 1.34%, 2.12%, 2.07%, 1.05%, 1.56%, 1.28% and 0.86% for Class A, Class B, Class C, Advisor Class, Class R, Class K and Class I shares, respectively. The Financial Highlights section of this report sets forth expense ratio data for the current reporting period; the expense ratios shown above may differ from the expense ratios in the Financial Highlights section since they are based on different time periods.
| (a) | Assumes conversion of Class B shares into Class A shares after eight years. |
| * | Inception Date: 3/1/05 for Class R, Class K and Class I shares. |
| † | These share classes are offered at net asset value (NAV) to eligible investors and their SEC returns are the same as the NAV returns. Please note that these share classes are for investors purchasing shares through accounts established under certain fee-based programs sponsored and maintained by certain broker-dealers and financial intermediaries, institutional pension plans and/or investment advisory clients of, and certain other persons associated with, the Adviser and its affiliates or the Funds. The inception date for Class R, Class K and Class I shares is listed above. |
See Historical Performance disclosures on page 3.
(Historical Performance continued on next page)
| ALLIANCEBERNSTEIN INTERNATIONAL GROWTH FUND • | 5 |
Historical Performance
HISTORICAL PERFORMANCE
(continued from previous page)
SEC AVERAGE ANNUAL RETURNS (WITH ANY APPLICABLE SALES CHARGES) AS OF THE MOST RECENT CALENDAR QUARTER-END (DECEMBER 31, 2009) |
| ||||
| SEC Returns | |||||
| Class A Shares | |||||
1 Year | 34.12 | % | |||
5 Years | 3.56 | % | |||
10 Years | 2.05 | % | |||
| Class B Shares | |||||
1 Year | 35.00 | % | |||
5 Years | 3.68 | % | |||
10 Years(a) | 1.87 | % | |||
| Class C Shares | |||||
1 Year | 38.17 | % | |||
5 Years | 3.73 | % | |||
10 Years | 1.74 | % | |||
| Advisor Class Shares† | |||||
1 Year | 40.59 | % | |||
5 Years | 4.78 | % | |||
10 Years | 2.81 | % | |||
| Class R Shares† | |||||
1 Year | 39.82 | % | |||
Since Inception* | 3.35 | % | |||
| Class K Shares† | |||||
1 Year | 40.24 | % | |||
Since Inception* | 3.62 | % | |||
| Class I Shares† | |||||
1 Year | 40.80 | % | |||
Since Inception* | 4.02 | % | |||
| (a) | Assumes conversion of Class B shares into Class A shares after eight years. |
| * | Inception Date: 3/1/05 for Class R, Class K and Class I shares. |
| † | Please note that these share classes are for investors purchasing shares through accounts established under certain fee-based programs sponsored and maintained by certain broker-dealers and financial intermediaries, institutional pension plans and/or investment advisory clients of, and certain other persons associated with, the Adviser and its affiliates or the Funds. The inception date for Class R, Class K and Class I shares is listed above. |
See Historical Performance disclosures on page 3.
| 6 | • ALLIANCEBERNSTEIN INTERNATIONAL GROWTH FUND |
Historical Performance
FUND EXPENSES
(unaudited)
As a shareholder of the Fund, you incur two types of costs: (1) transaction costs, including sales charges (loads) on purchase payments, contingent deferred sales charges on redemptions and (2) ongoing costs, including management fees; distribution (12b-1) fees; and other Fund expenses. This example is intended to help you understand your ongoing costs (in dollars) of investing in the Fund and to compare these costs with the ongoing costs of investing in other mutual funds.
This Example is based on an investment of $1,000 invested at the beginning of the period and held for the entire period as indicated below.
Actual Expenses
The table below provides information about actual account values and actual expenses. You may use the information, together with the amount you invested, to estimate the expenses that you paid over the period. Simply divide your account value by $1,000 (for example, an $8,600 account value divided by $1,000 = 8.6), then multiply the result by the number under the heading entitled “Expenses Paid During Period” to estimate the expenses you paid on your account during this period.
Hypothetical Example for Comparison Purposes
The table below also provides information about hypothetical account values and hypothetical expenses based on the Fund’s actual expense ratio and an assumed annual rate of return of 5% before expenses, which is not the Fund’s actual return. The hypothetical account values and expenses may not be used to estimate the actual ending account balance or expenses you paid for the period. You may use this information to compare the ongoing costs of investing in the Fund and other funds by comparing this 5% hypothetical example with the 5% hypothetical examples that appear in the shareholder reports of other funds.
Please note that the expenses shown in the table are meant to highlight your ongoing costs only and do not reflect any transactional costs, such as sales charges (loads), or contingent deferred sales charges on redemptions. Therefore, the hypothetical example is useful in comparing ongoing costs only, and will not help you determine the relative total costs of owning different funds. In addition, if these transactional costs were included, your costs would have been higher.
| Beginning Account Value July 1, 2009 | Ending Account Value December 31, 2009 | Expenses Paid During Period* | ||||||||||||||||
| Actual | Hypothetical | Actual | Hypothetical** | Actual | Hypothetical | |||||||||||||
| Class A | $ | 1,000 | $ | 1,000 | $ | 1,260.57 | $ | 1,018.75 | $ | 7.29 | $ | 6.51 | ||||||
| Class B | $ | 1,000 | $ | 1,000 | $ | 1,256.63 | $ | 1,014.82 | $ | 11.72 | $ | 10.46 | ||||||
| Class C | $ | 1,000 | $ | 1,000 | $ | 1,255.89 | $ | 1,015.12 | $ | 11.37 | $ | 10.16 | ||||||
| Advisor Class | $ | 1,000 | $ | 1,000 | $ | 1,263.03 | $ | 1,020.27 | $ | 5.59 | $ | 4.99 | ||||||
| Class R | $ | 1,000 | $ | 1,000 | $ | 1,259.52 | $ | 1,017.29 | $ | 8.94 | $ | 7.98 | ||||||
| Class K | $ | 1,000 | $ | 1,000 | $ | 1,261.54 | $ | 1,018.85 | $ | 7.18 | $ | 6.41 | ||||||
| Class I | $ | 1,000 | $ | 1,000 | $ | 1,264.17 | $ | 1,020.82 | $ | 4.97 | $ | 4.43 | ||||||
| * | Expenses are equal to the classes’ annualized expense ratios of 1.28%, 2.06%, 2.00%, 0.98%, 1.57%, 1.26% and 0.87%, respectively, multiplied by the average account value over the period, multiplied by 184/365 (to reflect the one-half year period). |
| ** | Assumes 5% return before expenses. |
| ALLIANCEBERNSTEIN INTERNATIONAL GROWTH FUND • | 7 |
Fund Expenses
PORTFOLIO SUMMARY
December 31, 2009 (unaudited)
PORTFOLIO STATISTICS
Net Assets ($mil): $2,023.2
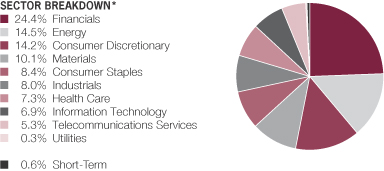
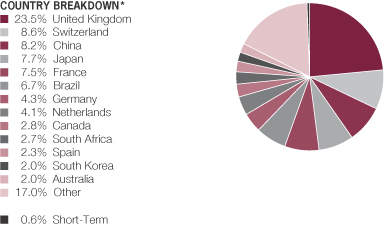
| * | All data are as of December 31, 2009. The Fund’s sector and country breakdowns are expressed as a percentage of total investments and may vary over time. “Other” country weightings represent less than 2.0% weightings in the following countries: Belgium, Denmark, Egypt, India, Ireland, Israel, Italy, Mexico, Norway, Russia, Singapore, Sweden, Taiwan and United States. |
Please note: The sector classifications presented herein are based on the Global Industry Classification Standard (GICS) which was developed by Morgan Stanley Capital International and Standard and Poor’s. The components are divided into sector, industry group, and industry sub-indices as classified by the GICS for each of the market capitalization indices in the Broad Market. These sector classifications are broadly defined. The “Portfolio of Investments” section of the report reflects more specific industry information and is consistent with the investment restrictions discussed in the fund’s prospectus.
| 8 | • ALLIANCEBERNSTEIN INTERNATIONAL GROWTH FUND |
Portfolio Summary
TEN LARGEST HOLDINGS*
December 31, 2009 (unaudited)
| Company | U.S. $ Value | Percent of Net Assets | ||||
Industrial & Commercial Bank of China Ltd. – Class H | $ | 62,676,474 | 3.1 | % | ||
Investimentos Itau SA | 57,163,052 | 2.8 | ||||
Tesco PLC | 43,136,550 | 2.1 | ||||
ArcelorMittal (Euronext Amsterdam) | 41,760,197 | 2.1 | ||||
British American Tobacco PLC | 39,563,937 | 2.0 | ||||
Standard Chartered PLC | 39,182,877 | 1.9 | ||||
Credit Suisse Group AG | 35,952,616 | 1.8 | ||||
Partners Group Holding AG | 35,161,381 | 1.7 | ||||
Tullow Oil PLC | 35,026,894 | 1.7 | ||||
Cia Vale do Rio Doce (Sponsored ADR) – Class B | 30,221,825 | 1.5 | ||||
| $ | 419,845,803 | 20.7 | % | |||
| * | Long-term investments. |
| ALLIANCEBERNSTEIN INTERNATIONAL GROWTH FUND • | 9 |
Ten Largest Holdings
PORTFOLIO OF INVESTMENTS
December 31, 2009 (unaudited)
| Company | Shares | U.S. $ Value | |||
COMMON STOCKS – 98.8% | |||||
Financials – 24.2% | |||||
Capital Markets – 8.1% | |||||
Credit Suisse Group AG | 725,709 | $ | 35,952,616 | ||
Gam Holding Ltd. | 636,478 | 7,707,155 | |||
ICAP PLC | 2,387,524 | 16,466,871 | |||
Julius Baer Group Ltd. | 753,088 | 26,484,935 | |||
Macquarie Group Ltd. | 596,753 | 25,568,656 | |||
Man Group PLC | 3,526,800 | 17,406,010 | |||
Partners Group Holding AG | 278,868 | 35,161,381 | |||
| 164,747,624 | |||||
Commercial Banks – 13.6% | |||||
Banco Santander Central Hispano SA | 1,388,674 | 22,947,387 | |||
BNP Paribas SA | 292,981 | 23,238,688 | |||
Commercial International Bank | 589,775 | 5,846,933 | |||
HSBC Holdings PLC | 2,262,700 | 25,813,676 | |||
ICICI Bank Ltd. | 1,186,576 | 22,312,237 | |||
Industrial & Commercial Bank of China Ltd. – | 76,104,000 | 62,676,474 | |||
Investimentos Itau SA | 8,398,386 | 57,163,052 | |||
Standard Chartered PLC | 1,552,048 | 39,182,877 | |||
United Overseas Bank Ltd. | 1,139,000 | 15,854,600 | |||
| 275,035,924 | |||||
Diversified Financial Services – 1.4% | |||||
Companhia Brasileira de Meios de Pagamento | 374,900 | 3,303,254 | |||
IG Group Holdings PLC | 2,512,739 | 15,374,998 | |||
Singapore Exchange Ltd. | 1,751,000 | 10,310,194 | |||
| 28,988,446 | |||||
Insurance – 1.1% | |||||
China Life Insurance Co. Ltd. – Class H | 4,364,000 | 21,382,088 | |||
| 490,154,082 | |||||
Energy – 14.5% | |||||
Energy Equipment & Services – 5.1% | |||||
Petroleum Geo-Services ASA(a) | 1,937,750 | 22,183,254 | |||
Saipem SpA | 722,041 | 24,917,964 | |||
Schlumberger Ltd. | 457,300 | 29,765,657 | |||
Tenaris SA | 528,503 | 11,389,736 | |||
WorleyParsons Ltd. | 530,866 | 13,784,262 | |||
| 102,040,873 | |||||
Oil, Gas & Consumable Fuels – 9.4% | |||||
Afren PLC(a) | 13,046,482 | 17,860,675 | |||
BG Group PLC | 1,145,527 | 20,683,975 | |||
BP PLC | 2,714,322 | 26,209,993 | |||
China Coal Energy Co. – Class H | 10,854,000 | 19,640,052 | |||
LUKOIL (OTC US) (Sponsored ADR) | 337,144 | 19,014,922 | |||
OGX Petroleo e Gas Participacoes SA | 1,177,200 | 11,562,389 | |||
PetroChina Co. Ltd. – Class H | 15,716,000 | 18,683,959 | |||
Suncor Energy, Inc. (New York) | 353,234 | 12,567,612 | |||
| 10 | • ALLIANCEBERNSTEIN INTERNATIONAL GROWTH FUND |
Portfolio of Investments
| Company | Shares | U.S. $ Value | |||
Suncor Energy, Inc. (Toronto) | 264,800 | $ | 9,350,088 | ||
Tullow Oil PLC | 1,669,502 | 35,026,894 | |||
| 190,600,559 | |||||
| 292,641,432 | |||||
Consumer Discretionary – 14.1% | |||||
Auto Components -1.3% | |||||
Bridgestone Corp. | 788,300 | 13,905,461 | |||
GKN PLC(a) | 6,392,481 | 11,972,944 | |||
| 25,878,405 | |||||
Automobiles – 4.2% | |||||
Bayerische Motoren Werke AG | 252,121 | 11,477,130 | |||
Hyundai Motor Co. | 169,893 | 17,585,901 | |||
Renault SA(a) | 443,176 | 22,734,869 | |||
Suzuki Motor Corp. | 690,000 | 16,992,644 | |||
Volkswagen AG | 173,700 | 16,384,621 | |||
| 85,175,165 | |||||
Distributors – 0.7% | |||||
Imperial Holdings Ltd. | 1,089,700 | 13,002,246 | |||
Hotels, Restaurants & Leisure – 2.1% | |||||
Carnival PLC(a) | 837,507 | 28,532,365 | |||
Compass Group PLC | 646,417 | 4,626,087 | |||
Ctrip.com International Ltd. (ADR)(a) | 128,300 | 9,219,638 | |||
| 42,378,090 | |||||
Household Durables – 1.0% | |||||
Persimmon PLC(a) | 1,486,100 | 11,237,485 | |||
Sony Corp. | 319,600 | 9,291,338 | |||
| 20,528,823 | |||||
Media – 2.8% | |||||
British Sky Broadcasting Group PLC | 308,354 | 2,785,306 | |||
Eutelsat Communications | 719,609 | 23,088,012 | |||
Naspers Ltd. – Class N | 248,300 | 10,048,742 | |||
Pearson PLC | 611,934 | 8,773,899 | |||
SES SA (FDR) | 544,341 | 12,262,536 | |||
| 56,958,495 | |||||
Multiline Retail – 0.2% | |||||
Next PLC | 129,208 | 4,320,211 | |||
Specialty Retail – 1.6% | |||||
Belle International Holdings Ltd. | 3,608,000 | 4,179,764 | |||
Fast Retailing Co. Ltd. | 39,400 | 7,404,813 | |||
Kingfisher PLC | 2,134,950 | 7,859,203 | |||
Nitori Co. Ltd. | 57,000 | 4,242,631 | |||
Yamada Denki Co. Ltd. | 137,600 | 9,282,722 | |||
| 32,969,133 | |||||
Textiles, Apparel & Luxury Goods – 0.2% | |||||
Compagnie Financiere Richemont SA | 128,089 | 4,307,232 | |||
| 285,517,800 | |||||
| ALLIANCEBERNSTEIN INTERNATIONAL GROWTH FUND • | 11 |
Portfolio of Investments
| Company | Shares | U.S. $ Value | |||
Materials – 10.0% | |||||
Chemicals – 0.4% | |||||
Umicore | 280,154 | $ | 9,345,561 | ||
Construction Materials – 1.0% | |||||
CRH PLC (London) | 724,042 | 19,790,571 | |||
Metals & Mining – 8.6% | |||||
ArcelorMittal (Euronext Amsterdam) | 913,664 | 41,760,197 | |||
Cia Vale do Rio Doce (Sponsored ADR) – | 1,217,640 | 30,221,825 | |||
Equinox Minerals Ltd.(a)(b) | 3,280,317 | 12,828,318 | |||
Equinox Minerals Ltd. (Toronto Stock Exchange)(a) | 1,935,755 | 7,570,147 | |||
Evraz Group SA (Sponsored GDR)(a) | 304,848 | 8,611,956 | |||
Gerdau SA | 915,400 | 15,321,514 | |||
Impala Platinum Holdings Ltd. | 395,600 | 10,813,428 | |||
Mmx Mineracao E Metalicos SA(a) | 1,713,200 | 12,152,797 | |||
Rio Tinto PLC(a) | 393,299 | 21,236,895 | |||
Xstrata PLC(a) | 751,180 | 13,398,115 | |||
| 173,915,192 | |||||
| 203,051,324 | |||||
Consumer Staples – 8.4% | |||||
Beverages – 1.5% | |||||
Anheuser-Busch InBev NV | 577,181 | 29,879,034 | |||
Food & Staples Retailing – 2.1% | |||||
Tesco PLC | 6,252,770 | 43,136,550 | |||
Food Products – 2.7% | |||||
China Mengniu Dairy Co. Ltd.(a) | 1,176,000 | 4,203,056 | |||
Groupe Danone | 262,241 | 16,075,868 | |||
Nestle SA | 409,880 | 19,892,966 | |||
Unilever NV | 416,310 | 13,549,565 | |||
| 53,721,455 | |||||
Tobacco – 2.1% | |||||
British American Tobacco PLC | 1,218,726 | 39,563,937 | |||
KT&G Corp.(a) | 65,932 | 3,646,296 | |||
| 43,210,233 | |||||
| 169,947,272 | |||||
Industrials – 8.0% | |||||
Airlines – 0.5% | |||||
British Airways PLC(a) | 1,472,251 | 4,428,005 | |||
Gol Linhas Aereas Inteligentes SA(a) | 297,000 | 4,449,029 | |||
| 8,877,034 | |||||
Construction & Engineering – 0.4% | |||||
Aveng Ltd. | 1,606,373 | 8,654,349 | |||
Electrical Equipment – 1.7% | |||||
ABB Ltd.(a) | 755,224 | 14,552,659 | |||
Vestas Wind Systems A/S(a) | 311,641 | 18,973,576 | |||
| 33,526,235 | |||||
| 12 | • ALLIANCEBERNSTEIN INTERNATIONAL GROWTH FUND |
Portfolio of Investments
| Company | Shares | U.S. $ Value | |||
Industrial Conglomerates – 1.9% | |||||
Cookson Group PLC(a) | 2,660,889 | $ | 18,001,766 | ||
Siemens AG | 221,036 | 20,284,681 | |||
| 38,286,447 | |||||
Machinery – 1.8% | |||||
Komatsu Ltd. | 653,100 | 13,672,108 | |||
NGK Insulators Ltd. | 436,000 | 9,535,059 | |||
SKF AB | 789,249 | 13,609,512 | |||
| 36,816,679 | |||||
Marine – 0.5% | |||||
China Shipping Development Co. Ltd. – | 7,094,000 | 10,586,570 | |||
Trading Companies & Distributors -1.2% | |||||
Mitsubishi Corp. | 980,100 | 24,412,909 | |||
| 161,160,223 | |||||
Health Care – 7.2% | |||||
Health Care Providers & Services – 0.4% | |||||
Fresenius Medical Care AG & Co. KGaA | 155,424 | 8,244,777 | |||
Life Sciences Tools & Services – 0.6% | |||||
QIAGEN N.V.(a) | 501,597 | 11,296,230 | |||
Pharmaceuticals – 6.2% | |||||
Aspen Pharmacare Holdings Ltd.(a) | 469,279 | 4,672,387 | |||
Bayer AG | 265,607 | 21,254,828 | |||
Ipsen SA | 191,817 | 10,636,141 | |||
Novo Nordisk A/S-Class B | 112,812 | 7,202,111 | |||
Roche Holding AG | 173,652 | 29,696,728 | |||
Sanofi-Aventis SA | 303,303 | 23,852,621 | |||
Shire PLC | 715,458 | 13,980,003 | |||
Teva Pharmaceutical Industries Ltd. (Sponsored ADR) | 268,033 | 15,058,094 | |||
| 126,352,913 | |||||
| 145,893,920 | |||||
Information Technology – 6.9% | |||||
Communications Equipment – 0.7% | |||||
Research In Motion Ltd.(a) | 199,915 | 13,577,437 | |||
Computers & Peripherals – 0.7% | |||||
Toshiba Corp.(a) | 2,346,000 | 13,017,720 | |||
Electronic Equipment, Instruments & Components – 1.6% | |||||
HON HAI Precision Industry Co. Ltd. | 4,449,650 | 20,809,483 | |||
Keyence Corp. | 57,500 | 11,933,759 | |||
| 32,743,242 | |||||
IT Services – 0.4% | |||||
Cap Gemini SA | 194,083 | 8,854,104 | |||
| ALLIANCEBERNSTEIN INTERNATIONAL GROWTH FUND • | 13 |
Portfolio of Investments
| Company | Shares | U.S. $ Value | ||||
Office Electronics – 0.6% | ||||||
Canon, Inc. | 305,300 | $ | 12,986,996 | |||
Semiconductors & Semiconductor Equipment – 2.5% | ||||||
ASML Holding NV | 461,328 | 15,750,582 | ||||
Hynix Semiconductor, Inc.(a) | 266,020 | 5,290,137 | ||||
Novatek Microelectronics Corp. Ltd. | 4,303,000 | 14,373,428 | ||||
Samsung Electronics Co. Ltd. | 21,047 | 14,432,559 | ||||
| 49,846,706 | ||||||
Software – 0.4% | ||||||
SAP AG | 172,915 | 8,243,406 | ||||
| 139,269,611 | ||||||
Telecommunication Services – 5.2% | ||||||
Diversified Telecommunication Services – 2.1% | ||||||
Iliad SA | 81,415 | 9,729,423 | ||||
Telefonica SA | 861,802 | 24,121,028 | ||||
Vimpel-Communications (Sponsored ADR) | 437,800 | 8,138,702 | ||||
| 41,989,153 | ||||||
Wireless Telecommunication Services – 3.1% | ||||||
America Movil SAB de CV Series L (ADR) | 262,007 | 12,309,089 | ||||
China Mobile Ltd. | 1,055,000 | 9,816,256 | ||||
Idea Cellular Ltd.(a) | 671,399 | 831,203 | ||||
MTN Group Ltd. | 497,464 | 7,917,809 | ||||
NTT DoCoMo, Inc. | 5,229 | 7,297,008 | ||||
Vodafone Group PLC | 11,160,306 | 25,844,075 | ||||
| 64,015,440 | ||||||
| 106,004,593 | ||||||
Utilities – 0.3% | ||||||
Independent Power Producers & Energy Traders – 0.3% | ||||||
China Longyuan Power Group Corp.(a) | 4,157,000 | 5,382,965 | ||||
Total Common Stocks | 1,999,023,222 | |||||
| Principal Amount (000) | ||||||
SHORT-TERM INVESTMENTS – 0.6% | ||||||
Time Deposit - 0.6% | ||||||
Royal Bank of Canada (Grand Cayman) | $ | 12,900 | 12,900,000 | |||
Total Investments – 99.4% | 2,011,923,222 | |||||
Other assets less liabilities – 0.6% | 11,256,448 | |||||
Net Assets – 100.0% | $ | 2,023,179,670 | ||||
| 14 | • ALLIANCEBERNSTEIN INTERNATIONAL GROWTH FUND |
Portfolio of Investments
FORWARD CURRENCY EXCHANGE CONTRACTS (see Note D)
| Contract Amount (000) | U.S. $ Value on Origination Date | U.S. $ Value at December 31, 2009 | Unrealized Appreciation/ (Depreciation) | |||||||||
Buy Contracts: | ||||||||||||
Australian Dollar settling 2/17/10 | 229,596 | $ | 206,957,834 | $ | 205,332,293 | $ | (1,625,541 | ) | ||||
Canadian Dollar settling 2/17/10 | 28,792 | 27,666,259 | 27,530,155 | (136,104 | ) | |||||||
Euro Dollar settling 2/17/10 | 9,788 | 14,549,177 | 14,030,762 | (518,415 | ) | |||||||
Japanese Yen settling 2/17/10 | 1,682,536 | 19,377,358 | 18,069,497 | (1,307,861 | ) | |||||||
Norwegian Krone settling 2/17/10 | 502,792 | 88,194,733 | 86,674,438 | (1,520,295 | ) | |||||||
Norwegian Krone settling 2/17/10 | 122,656 | 87,870,758 | 88,773,601 | 902,843 | ||||||||
Swedish Krona settling 2/17/10 | 222,845 | 31,923,474 | 31,154,218 | (769,256 | ) | |||||||
Swedish Krona settling 2/17/10 | 160,027 | 23,583,844 | 22,372,124 | (1,211,720 | ) | |||||||
Sale Contracts: | ||||||||||||
British Pound settling 2/17/10 | 139,346 | 230,894,929 | 225,013,282 | 5,881,647 | ||||||||
Euro Dollar settling 2/17/10 | 9,788 | 14,757,074 | 14,030,762 | 726,312 | ||||||||
Euro Dollar settling 2/17/10 | 7,211 | 10,871,808 | 10,336,721 | 535,087 | ||||||||
Japanese Yen settling 2/17/10 | 6,698,798 | 73,940,616 | 71,941,348 | 1,999,268 | ||||||||
Japanese Yen settling 2/17/10 | 3,752,059 | 40,842,294 | 40,295,018 | 547,276 | ||||||||
Japanese Yen settling 2/17/10 | 1,504,316 | 16,620,807 | 16,155,513 | 465,294 | ||||||||
Swiss Francs settling 2/17/10 | 99,239 | 97,813,852 | 95,959,860 | 1,853,992 | ||||||||
| (a) | Non-income producing security. |
| (b) | Security is exempt from registration under Rule 144A of the Securities Act of 1933. This security is considered liquid and may be resold in transactions exempt from registration, normally to qualified institutional buyers. At December 31, 2009, the market value of this security amounted to $12,828,318 or 0.6% of net assets. |
Glossary:
ADR — American Depositary Receipt
FDR — Fiduciary Depositary Receipt
GDR— Global Depositary Receipt
See notes to financial statements.
| ALLIANCEBERNSTEIN INTERNATIONAL GROWTH FUND • | 15 |
Portfolio of Investments
STATEMENT OF ASSETS & LIABILITIES
December 31, 2009 (unaudited)
| Assets | ||||
Investments in securities, at value (cost $1,652,053,043) | $ | 2,011,923,222 | ||
Cash | 12,869 | |||
Foreign currencies, at value (cost $11,933,881) | 11,958,296 | |||
Unrealized appreciation of forward currency exchange contracts | 12,911,719 | |||
Receivable for investment securities sold and foreign currency contracts | 9,359,521 | |||
Dividends and interest receivable | 6,220,299 | |||
Receivable for capital stock sold | 4,087,144 | |||
Total assets | 2,056,473,070 | |||
| Liabilities | ||||
Payable for capital stock redeemed | 14,702,134 | |||
Payable for investment securities purchased and foreign currency contracts | 7,279,670 | |||
Unrealized depreciation of forward currency exchange contracts | 7,089,192 | |||
Payable for India capital gains tax | 1,774,588 | |||
Advisory fee payable | 1,287,098 | |||
Distribution fee payable | 611,821 | |||
Transfer Agent fee payable | 153,413 | |||
Administrative fee payable | 24,249 | |||
Accrued expenses and other liabilities | 371,235 | |||
Total liabilities | 33,293,400 | |||
Net Assets | $ | 2,023,179,670 | ||
| Composition of Net Assets | ||||
Capital stock, at par | $ | 145,565 | ||
Additional paid-in capital | 2,889,807,900 | |||
Distributions in excess of net investment income | (18,846,673 | ) | ||
Accumulated net realized loss on investment | (1,212,073,180 | ) | ||
Net unrealized appreciation of investments | 364,146,058 | |||
| $ | 2,023,179,670 | |||
Net Asset Value Per Share—21 billion shares of capital stock authorized, $.001 par value
| Class | Net Assets | Shares Outstanding | Net Asset Value | ||||||
| Class A | $ | 1,266,768,994 | 89,962,130 | $ | 14.08 | * | |||
| Class B | $ | 60,680,782 | 4,734,442 | $ | 12.82 | ||||
| Class C | $ | 249,800,095 | 19,438,310 | $ | 12.85 | ||||
| Advisor | $ | 346,556,475 | 24,351,028 | $ | 14.23 | ||||
| Class R | $ | 51,859,494 | 3,711,410 | $ | 13.97 | ||||
| Class K | $ | 13,321,604 | 949,306 | $ | 14.03 | ||||
| Class I | $ | 34,192,226 | 2,418,530 | $ | 14.14 | ||||
| * | The maximum offering price per share for Class A shares was $14.70 which reflects a sales charge 4.25%. |
See notes to financial statements.
| 16 | • ALLIANCEBERNSTEIN INTERNATIONAL GROWTH FUND |
Statement of Assets & Liabilities
STATEMENT OF OPERATIONS
Six Months Ended December 31, 2009 (unaudited)
| Investment Income | |||||||
Dividends (net of foreign taxes withheld of $641,942) | $ | 15,069,168 | |||||
Interest | 6,935 | $ | 15,076,103 | ||||
| Expenses | |||||||
Advisory fee (see Note B) | 7,488,781 | ||||||
Distribution fee—Class A | 1,874,738 | ||||||
Distribution fee—Class B | 307,211 | ||||||
Distribution fee—Class C | 1,256,105 | ||||||
Distribution fee—Class R | 120,977 | ||||||
Distribution fee—Class K | 16,296 | ||||||
Transfer agency—Class A | 1,035,723 | ||||||
Transfer agency—Class B | 76,473 | ||||||
Transfer agency—Class C | 242,175 | ||||||
Transfer agency—Advisor Class | 282,701 | ||||||
Transfer agency—Class R | 62,908 | ||||||
Transfer agency—Class K | 13,037 | ||||||
Transfer agency—Class I | 8,780 | ||||||
Custodian | 227,787 | ||||||
Printing | 136,136 | ||||||
Registration fees | 80,335 | ||||||
Administrative | 48,778 | ||||||
Audit | 30,440 | ||||||
Directors’ fees | 25,971 | ||||||
Legal | 24,613 | ||||||
Miscellaneous | 38,563 | ||||||
Total expenses | 13,398,528 | ||||||
Net investment income | 1,677,575 | ||||||
| Realized and Unrealized Gain (Loss) on Investment and Foreign Currency Transactions | |||||||
Net realized gain (loss) on: | |||||||
Investment transactions | (4,398,555 | )(a) | |||||
Foreign currency transactions | 20,499,805 | ||||||
Net change in unrealized appreciation/depreciation of: | |||||||
Investments | 413,611,460 | ||||||
Foreign currency denominated assets and liabilities | 16,885,513 | ||||||
Net gain on investment and foreign currency transactions | 446,598,223 | ||||||
Contributions from Adviser (see Note B) | 4,618 | ||||||
Net Increase in Net Assets from Operations | $ | 448,280,416 | |||||
| (a) | Net of foreign capital gain taxes of $685,994. |
See notes to financial statements.
| ALLIANCEBERNSTEIN INTERNATIONAL GROWTH FUND • | 17 |
Statement of Operations
STATEMENT OF CHANGES IN NET ASSETS
| Six Months Ended December 31, 2009 (unaudited) | Year Ended June 30, 2009 | |||||||
| Increase (Decrease) in Net Assets from Operations | ||||||||
Net investment income | $ | 1,677,575 | $ | 31,064,691 | ||||
Net realized gain (loss) on investment and foreign currency transactions | 16,101,250 | (1,188,012,361 | ) | |||||
Net change in unrealized appreciation/depreciation of investments and foreign currency denominated assets and liabilities | 430,496,973 | (319,926,118 | ) | |||||
Contributions from Adviser (see Note B) | 4,618 | – 0 | – | |||||
Net increase (decrease) in net assets from operations | 448,280,416 | (1,476,873,788 | ) | |||||
| Dividends and Distributions to Shareholders from | ||||||||
Net investment income | ||||||||
Class A | (35,172,897 | ) | (31,031,193 | ) | ||||
Class B | (1,314,107 | ) | (1,246,157 | ) | ||||
Class C | (5,375,791 | ) | (5,865,485 | ) | ||||
Advisor Class | (10,430,217 | ) | (8,973,727 | ) | ||||
Class R | (1,346,084 | ) | (868,294 | ) | ||||
Class K | (388,028 | ) | (218,825 | ) | ||||
Class I | (1,084,276 | ) | (469,533 | ) | ||||
Net realized gain on investment and foreign currency transactions | ||||||||
Class A | – 0 | – | (2,224,458 | ) | ||||
Class B | – 0 | – | (130,488 | ) | ||||
Class C | – 0 | – | (614,186 | ) | ||||
Advisor Class | – 0 | – | (566,166 | ) | ||||
Class R | – 0 | – | (68,640 | ) | ||||
Class K | – 0 | – | (15,686 | ) | ||||
Class I | – 0 | – | (28,456 | ) | ||||
| Capital Stock Transactions | ||||||||
Net decrease | (141,701,906 | ) | (136,254,236 | ) | ||||
Total increase (decrease) | 251,467,110 | (1,665,449,318 | ) | |||||
| Net Assets | ||||||||
Beginning of period | 1,771,712,560 | 3,437,161,878 | ||||||
End of period (including distributions in excess of net investment income and undistributed net investment income of ($18,846,673) and $34,587,152, respectively) | $ | 2,023,179,670 | $ | 1,771,712,560 | ||||
See notes to financial statements.
| 18 | • ALLIANCEBERNSTEIN INTERNATIONAL GROWTH FUND |
Statement of Changes in Net Assets
NOTES TO FINANCIAL STATEMENTS
December 31, 2009 (unaudited)
NOTE A
Significant Accounting Policies
AllianceBernstein International Growth Fund, Inc. (the “Fund”), organized as a Maryland corporation on March 16, 1994, is registered under the Investment Company Act of 1940 as an open-end management investment company. The Fund offers Class A, Class B, Class C, Advisor Class, Class R, Class K and Class I shares. Class A shares are sold with a front-end sales charge of up to 4.25% for purchases not exceeding $1,000,000. With respect to purchases of $1,000,000 or more, Class A shares redeemed within one year of purchase may be subject to a contingent deferred sales charge of 1%. Class B shares are currently sold with a contingent deferred sales charge which declines from 4% to zero depending on the period of time the shares are held. Effective January 31, 2009, sales of Class B shares of the Fund to new investors were suspended. Class B shares will only be issued (i) upon the exchange of Class B shares from another AllianceBernstein Fund, (ii) for purposes of dividend reinvestment, (iii) through the Fund’s Automatic Investment Program (the “Program”) for accounts that established the Program prior to January 31, 2009, and (iv) for purchases of additional shares by Class B shareholders as of January 31, 2009. The ability to establish a new Program for accounts containing Class B shares was suspended as of January 31, 2009. Class B shares will automatically convert to Class A shares eight years after the end of the calendar month of purchase. Class C shares are subject to a contingent deferred sales charge of 1% on redemptions made within the first year after purchase. Class R and Class K shares are sold without an initial or contingent deferred sales charge. Advisor Class and Class I shares are sold without an initial or contingent deferred sales charge and are not subject to ongoing distribution expenses. All seven classes of shares have identical voting, dividend, liquidation and other rights, and the same terms and conditions, except that the classes bear different distribution and transfer agency expenses. Each class has exclusive voting rights with respect to its distribution plan. The financial statements have been prepared in conformity with U.S. generally accepted accounting principles (“U.S. GAAP”), which require management to make certain estimates and assumptions that affect the reported amounts of assets and liabilities in the financial statements and amounts of income and expenses during the reporting period. Actual results could differ from those estimates. The following is a summary of significant accounting policies followed by the Fund.
1. Security Valuation
Portfolio securities are valued at their current market value determined on the basis of market quotations or, if market quotations are not readily available or are deemed unreliable, at “fair value” as determined in accordance with procedures established by and under the general supervision of the Fund’s Board of Directors.
In general, the market value of securities which are readily available and deemed reliable are determined as follows. Securities listed on a national securities
| ALLIANCEBERNSTEIN INTERNATIONAL GROWTH FUND • | 19 |
Notes to Financial Statements
exchange (other than securities listed on The NASDAQ Stock Market, Inc. (“NASDAQ”)) or on a foreign securities exchange are valued at the last sale price at the close of the exchange or foreign securities exchange. If there has been no sale on such day, the securities are valued at the mean of the closing bid and asked prices on such day. Securities listed on more than one exchange are valued by reference to the principal exchange on which the securities are traded; securities listed only on NASDAQ are valued in accordance with the NASDAQ Official Closing Price; listed put or call options are valued at the last sale price. If there has been no sale on that day, such securities will be valued at the closing bid prices on that day; open futures contracts and options thereon are valued using the closing settlement price or, in the absence of such a price, the most recent quoted bid price. If there are no quotations available for the day of valuation, the last available closing settlement price is used; securities traded in the over-the-counter market (“OTC”) are valued at the mean of the current bid and asked prices as reported by the National Quotation Bureau or other comparable sources; U.S. government securities and other debt instruments having 60 days or less remaining until maturity are valued at amortized cost if their original maturity was 60 days or less; or by amortizing their fair value as of the 61st day prior to maturity if their original term to maturity exceeded 60 days; fixed-income securities, including mortgage backed and asset backed securities, may be valued on the basis of prices provided by a pricing service or at a price obtained from one or more of the major broker/dealers. In cases where broker/dealer quotes are obtained, AllianceBernstein L.P. (the “Adviser”) may establish procedures whereby changes in market yields or spreads are used to adjust, on a daily basis, a recently obtained quoted price on a security; and OTC and other derivatives are valued on the basis of a quoted bid price or spread from a major broker/dealer in such security. Investments in money market funds are valued at their net asset value each day.
Securities for which market quotations are not readily available (including restricted securities) or are deemed unreliable are valued at fair value. Factors considered in making this determination may include, but are not limited to, information obtained by contacting the issuer, analysts, analysis of the issuer’s financial statements or other available documents. In addition, the Fund may use fair value pricing for securities primarily traded in non-U.S. markets because most foreign markets close well before the Fund values its securities at 4:00 p.m., Eastern Time (see Note A.2).
2. Fair Value Measurements
In accordance with U.S. GAAP regarding fair value measurements, fair value is defined as the price that the Fund would receive to sell an asset or pay to transfer a liability in an orderly transaction between market participants at the measurement date. The disclosure requirements establish a framework for measuring fair value, and a three-level hierarchy for fair value measurements based upon the transparency of inputs to the valuation of an asset or liability. Inputs may be observable or unobservable and refer broadly to the assumptions that market
| 20 | • ALLIANCEBERNSTEIN INTERNATIONAL GROWTH FUND |
Notes to Financial Statements
participants would use in pricing the asset or liability. Observable inputs reflect the assumptions market participants would use in pricing the asset or liability based on market data obtained from sources independent of the Fund.
Unobservable inputs reflect the Fund’s own assumptions about the assumptions that market participants would use in pricing the asset or liability based on the best information available in the circumstances. Each investment is assigned a level based upon the observability of the inputs which are significant to the overall valuation. The three-tier hierarchy of inputs is summarized below.
| • | Level 1—quoted prices in active markets for identical investments |
| • | Level 2—other significant observable inputs (including quoted prices for similar investments, interest rates, prepayment speeds, credit risk, etc.) |
| • | Level 3—significant unobservable inputs (including the Fund’s own assumptions in determining the fair value of investments) |
The following table summarizes the valuation of the Fund’s investments by the above fair value hierarchy levels as of December 31, 2009:
Investments in Securities | Level 1 | Level 2 | Level 3 | Total | ||||||||||||
Common Stocks: | ||||||||||||||||
Financials | $ | 86,951,242 | $ | 403,202,840 | $ | – 0 | – | $ | 490,154,082 | |||||||
Energy | 63,245,747 | 229,395,685 | – 0 | – | 292,641,432 | |||||||||||
Consumer Discretionary | 9,219,638 | 276,298,162 | – 0 | – | 285,517,800 | |||||||||||
Materials | 86,706,557 | 116,344,767 | – 0 | – | 203,051,324 | |||||||||||
Consumer Staples | 3,646,296 | 166,300,976 | – 0 | – | 169,947,272 | |||||||||||
Industrials | 4,449,029 | 156,711,194 | – 0 | – | 161,160,223 | |||||||||||
Health Care | 15,058,094 | 130,835,826 | – 0 | – | 145,893,920 | |||||||||||
Information Technology | 13,577,437 | 125,692,174 | – 0 | – | 139,269,611 | |||||||||||
Telecommunication Services | 20,447,791 | 85,556,802 | – 0 | – | 106,004,593 | |||||||||||
Utilities | 5,382,965 | – 0 | – | – 0 | – | 5,382,965 | ||||||||||
Short-Term Investments | 12,900,000 | – 0 | – | – 0 | – | 12,900,000 | ||||||||||
Total Investments in Securities | 321,584,796 | 1,690,338,426 | † | – 0 | – | 2,011,923,222 | ||||||||||
Other Financial Instruments* | ||||||||||||||||
Assets | – 0 | – | 12,911,719 | – 0 | – | 12,911,719 | ||||||||||
Liabilities | – 0 | – | (7,089,192 | ) | – 0 | – | (7,089,192 | ) | ||||||||
Total | $ | 321,584,796 | $ | 1,696,160,953 | $ | – 0 | – | $ | 2,017,745,749 | |||||||
| * | Other financial instruments are derivative instruments, such as futures, forwards and swap contracts, which are valued at the unrealized appreciation/depreciation on the instrument. |
| † | The earlier close of the foreign markets gives rise to the possibility that significant events, including broad market moves, may have occurred between the close of the foreign markets and the time at which the Fund values its securities which may materially affect the value of those securities trading in such markets. To account for this, the Fund may frequently value many of its foreign equity securities using fair value prices based on third party vendor modeling tools to the extent available. Accordingly, a significant portion of the Fund’s investments are categorized as Level 2 investments. |
| ALLIANCEBERNSTEIN INTERNATIONAL GROWTH FUND • | 21 |
Notes to Financial Statements
Following is a reconciliation of investments in which significant unobservable inputs (Level 3) were used in determining value:
| Common Stock | ||||
Balance as of 6/30/09 | $ | 26,578,882 | ||
Accrued discounts /premiums | – 0 | – | ||
Realized gain (loss) | (8,126,368 | ) | ||
Change in unrealized appreciation/depreciation | 9,815,046 | |||
Net purchases (sales) | (28,267,560 | ) | ||
Net transfers in and/or out of Level 3 | – 0 | – | ||
Balance as of 12/31/09 | $ | – 0 | – | |
Net change in unrealized appreciation/ depreciation from Investments held as of 12/31/09 | $ | – 0 | –** | |
| ** | The unrealized appreciation/depreciation is included in net change in unrealized appreciation/depreciation of investments and other financial instruments in the accompanying statement of operations. |
3. Currency Translation
Assets and liabilities denominated in foreign currencies and commitments under forward currency exchange contracts are translated into U.S. dollars at the mean of the quoted bid and asked prices of such currencies against the U.S. dollar. Purchases and sales of portfolio securities are translated into U.S. dollars at the rates of exchange prevailing when such securities were acquired or sold. Income and expenses are translated into U.S. dollars at rates of exchange prevailing when accrued.
Net realized gain or loss on foreign currency transactions represents foreign exchange gains and losses from sales and maturities of foreign fixed income investments, foreign currency exchange contracts, holding of foreign currencies, currency gains or losses realized between the trade and settlement dates on foreign investment transactions, and the difference between the amounts of dividends, interest and foreign withholding taxes recorded on the Fund’s books and the U.S. dollar equivalent amounts actually received or paid. Net unrealized currency gains and losses from valuing foreign currency denominated assets and liabilities at period end exchange rates are reflected as a component of unrealized appreciation and depreciation of investments and foreign currency denominated assets and liabilities.
4. Taxes
It is the Fund’s policy to meet the requirements of the Internal Revenue Code applicable to regulated investment companies and to distribute all of its investment company taxable income and net realized gains, if any, to shareholders. Therefore, no provisions for federal income or excise taxes are required. The Fund may be subject to taxes imposed by countries in which it invests. Such taxes are generally based on income and/or capital gains earned or repatriated. Taxes are accrued and applied to net investment income, net realized gains and net unrealized appreciation/depreciation as such income and/or gains are earned.
| 22 | • ALLIANCEBERNSTEIN INTERNATIONAL GROWTH FUND |
Notes to Financial Statements
In accordance with U.S. GAAP requirements regarding accounting for uncertainties in income taxes, management has analyzed the Fund’s tax positions taken on federal and state income tax returns for all open tax years (the current and the prior three tax years) and has concluded that no provision for income tax is required in the Funds’ financial statements.
5. Investment Income and Investment Transactions
Dividend income is recorded on the ex-dividend date or as soon as the Fund is informed of the dividend. Interest income is accrued daily. Investment transactions are accounted for on the date securities are purchased or sold. Investment gains and losses are determined on the identified cost basis. The Fund amortizes premiums and accretes discounts as adjustments to interest income.
6. Class Allocations
All income earned and expenses incurred by the Fund are borne on a pro-rata basis by each settled class of shares, based on the proportionate interest in the Fund represented by the net assets of such class, except for class specific expenses which are allocated to the respective class. Realized and unrealized gains and losses are allocated among the various share classes based on their respective net assets.
7. Dividends and Distributions
Dividends and distributions to shareholders, if any, are recorded on the ex-dividend date. Income dividends and capital gains distributions are determined in accordance with federal tax regulations and may differ from those determined in accordance with U.S. GAAP. To the extent these differences are permanent, such amounts are reclassified within the capital accounts based on their federal tax basis treatment; temporary differences do not require such reclassification.
NOTE B
Advisory Fee and Other Transactions with Affiliates
Under the terms of the investment advisory agreement, the Fund pays the Adviser an advisory fee at an annual rate of .75% of the first $2.5 billion, .65% of the next $2.5 billion and .60% in excess of $5 billion, of the Fund’s average daily net assets. The fee is accrued daily and paid monthly. Effective May 16, 2005, the Adviser voluntarily agreed to waive its fees and bear certain expenses to the extent necessary to limit total operating expenses on an annual basis to 1.65%, 2.35%, 2.35%, 1.35%, 1.85%, 1.60% and 1.35% of the daily average net assets for the Class A, Class B, Class C, Advisor Class, Class R, Class K and Class I shares, respectively. For the months ended December 31, 2009, there were no fees waived by the Adviser.
For the six months ended December 31, 2009, the Adviser reimbursed the Fund $4,618 for trading losses incurred due to trade entry errors.
| ALLIANCEBERNSTEIN INTERNATIONAL GROWTH FUND • | 23 |
Notes to Financial Statements
Pursuant to the investment advisory agreement, the Fund may reimburse the Adviser for certain legal and accounting services provided to the Fund by the Adviser. For six months ended December 31, 2009, such fee amounted to $48,778.
The Fund compensates AllianceBernstein Investor Services, Inc. (“ABIS”), a wholly-owned subsidiary of the fund Adviser, under a Transfer Agency Agreement for providing personnel and facilities to perform transfer agency services for the Fund. ABIS may make payments to intermediaries that provide omnibus account services, sub-accounting services and/or networking services. The compensation retained by ABIS amounted to $725,919 for the six months ended December 31, 2009.
For the six months ended December 31, 2009, there was no reduction for the expenses of Class A, Class B, Class C and Advisor Class shares under an expense offset arrangement with ABIS.
AllianceBernstein Investments, Inc. (the “Distributor”), a wholly-owned subsidiary of the Adviser serves as the distributor of the Fund’s shares. The Distributor has advised the Fund that it has retained front-end sales charges of $8,540 from the sale of Class A shares and received $2,372, $34,519 and $4,390 in contingent deferred sales charges imposed upon redemptions by shareholders of Class A, Class B and Class C shares, respectively, for the six months ended December 31, 2009.
Brokerage commissions paid on investment transactions for the six months ended December 31, 2009, amounted to $2,419,891, of which none was paid to Sanford C. Bernstein Co., LLC and Sanford C. Bernstein Limited, affiliates of the Adviser.
NOTE C
Distribution Services Agreement
The Fund has adopted a Distribution Services Agreement (the “Agreement”) pursuant to Rule 12b-1 under the Investment Company Act of 1940. Under the Agreement, the Fund pays distribution and servicing fees to the Distributor at an annual rate of up to .30% of the Fund’s average daily net assets attributable to Class A shares, 1% of the Fund’s average daily net assets attributable to both Class B and Class C shares, .50% of the Fund’s average daily net assets attributable to Class R shares and .25% of the Fund’s average daily net assets attributable to Class K shares. There are no distribution and servicing fees on the Advisor Class and Class I shares. The fees are accrued daily and paid monthly. The Agreement provides that the Distributor will use such payments in their entirety for distribution assistance and promotional activities. Since the commencement of the Fund’s operations, the Distributor has incurred expenses in excess of the distribution costs reimbursed by the Fund in the amount of $6,210,070, $3,818,709, $435,945 and $101,296 for Class B, Class C, Class R and Class K
| 24 | • ALLIANCEBERNSTEIN INTERNATIONAL GROWTH FUND |
Notes to Financial Statements
shares, respectively. While such costs may be recovered from the Fund in future periods so long as the Agreement is in effect, the rate of the distribution and servicing fees payable under the Agreement may not be increased without a shareholder vote. In accordance with the Agreement, there is no provision for recovery of unreimbursed distribution costs incurred by the Distributor beyond the current fiscal year for Class A shares. The Agreement also provides that the Adviser may use its own resources to finance the distribution of the Fund’s shares.
NOTE D
Investment Transactions
Purchases and sales of investment securities (excluding short-term investments) for the six months ended December 31, 2009, were as follows:
| Purchases | Sales | |||||||
Investment securities (excluding U.S. government securities) | $ | 1,078,898,788 | $ | 1,244,417,343 | ||||
U.S. government securities | – 0 | – | – 0 | – | ||||
The cost of investments for federal income tax purposes was substantially the same as the cost for financial reporting purposes. Accordingly, gross unrealized appreciation and unrealized depreciation (excluding foreign currency transactions) are as follows:
Gross unrealized appreciation | $ | 409,748,424 | ||
Gross unrealized depreciation | (49,878,245 | ) | ||
Net unrealized appreciation | $ | 359,870,179 | ||
1. Derivative Financial Instruments
The Fund may use derivatives to earn income and enhance returns, to hedge or adjust the risk profile of its portfolio, to replace more traditional direct investments, or to obtain exposure to otherwise inaccessible markets. The Fund may also use derivatives for non-hedging purposes as a means of making direct investment in foreign currencies, as described below under “Currency Transactions”.
The principal type of derivatives utilized by the Fund, as well as the methods in which they may be used is:
| • | Forward Currency Exchange Contracts |
The Fund may enter into forward currency exchange contracts in order to hedge its exposure to changes in foreign currency exchange rates on its foreign portfolio holdings, to hedge certain firm purchase and sale commitments denominated in foreign currencies and for non-hedging purposes as a means of making direct investments in foreign currencies, as described below under “Currency Transactions”.
| ALLIANCEBERNSTEIN INTERNATIONAL GROWTH FUND • | 25 |
Notes to Financial Statements
A forward currency exchange contract is a commitment to purchase or sell a foreign currency at a future date at a negotiated forward rate. The gain or loss arising from the difference between the original contract and the closing of such contract would be included in net realized gain or loss on foreign currency transactions. Fluctuations in the value of open forward currency exchange contracts are recorded for financial reporting purposes as unrealized appreciation and/or depreciation by the Fund. Risks may arise from the potential inability of a counterparty to meet the terms of a contract and from unanticipated movements in the value of a foreign currency relative to the U.S. dollar. The face or contract amount, in U.S. dollars reflects the total exposure the Fund has in that particular currency contract.
For the six months ended December 31, 2009, the Fund had entered into the following derivatives (not designated as hedging instruments under “Accounting for Derivative Instruments and Hedging Activities”):
Asset Derivatives | Liability Derivatives | |||||||||
Derivatives Not | Statement of | Fair value | Statement of | Fair Value | ||||||
Foreign exchange contracts | Unrealized appreciation of forward currency exchange contracts | $ | 12,911,719 | Unrealized depreciation of forward currency exchange contracts | $ | 7,089,192 | ||||
The effect of derivative instruments on the statement of operations for the six months ended December 31, 2009:
Derivatives Not Accounted | Location of Gain or | Realized Gain or (Loss) on Derivatives | Change in Unrealized Appreciation or (Depreciation) | |||||
Foreign exchange contracts | Net realized gain (loss) on foreign currency transactions; change in unrealized appreciation/ depreciation of foreign currency denominated assets and liabilities | $ | 20,049,513 | $ | 16,947,278 | |||
For the six months ended December 31, 2009, the average monthly principal amount of forward currency exchange contracts was $1,255,316,232.
2. Currency Transactions
The Fund may invest in non-U.S. Dollar securities on a currency hedged or unhedged basis. The Fund may seek investment opportunities by taking long or
| 26 | • ALLIANCEBERNSTEIN INTERNATIONAL GROWTH FUND |
Notes to Financial Statements
short positions in currencies through the use of currency-related derivatives, including forward currency exchange contracts, futures and options on futures, swaps, and options. The Fund may enter into transactions for investment opportunities when it anticipates that a foreign currency will appreciate or depreciate in value but securities denominated in that currency are not held by the Fund and do not present attractive investment opportunities. Such transactions may also be used when the Adviser believes that it may be more efficient than a direct investment in a foreign currency-denominated security. The Fund may also conduct currency exchange contracts on a spot basis (i.e., for cash at the spot rate prevailing in the currency exchange market for buying or selling currencies).
NOTE E
Capital Stock
Each class consists of 3,000,000,000 authorized shares. Transactions in capital shares for each class were as follows:
| SHARES | AMOUNT | |||||||||||||||||
Six Months Ended (unaudited) | Year Ended June 30, 2009 | Six Months Ended (unaudited) | Year Ended June 30, 2009 | |||||||||||||||
| Class A | ||||||||||||||||||
Shares sold | 7,925,061 | 34,430,239 | $ | 105,638,912 | $ | 421,137,742 | ||||||||||||
Shares issued in reinvestment of dividends | 2,249,920 | 1,638,946 | 31,410,472 | 29,617,125 | ||||||||||||||
Shares converted from Class B | 275,029 | 1,318,081 | 3,679,444 | 16,297,573 | ||||||||||||||
Shares issued in connection with the acquisition of AllianceBernstein International Research Growth Fund | – 0 | – | 10,343,921 | – 0 | – | 168,019,089 | ||||||||||||
Shares redeemed | (16,875,982 | ) | (62,293,020 | ) | (225,519,656 | ) | (737,977,819 | ) | ||||||||||
Net decrease | (6,425,972 | ) | (14,561,833 | ) | $ | (84,790,828 | ) | $ | (102,906,290 | ) | ||||||||
| ALLIANCEBERNSTEIN INTERNATIONAL GROWTH FUND • | 27 |
Notes to Financial Statements
| SHARES | AMOUNT | |||||||||||||||||
Six Months Ended (unaudited) | Year Ended June 30, 2009 | Six Months Ended (unaudited) | Year Ended June 30, 2009 | |||||||||||||||
| Class B | ||||||||||||||||||
Shares sold | 139,682 | 462,843 | $ | 1,699,772 | $ | 6,303,813 | ||||||||||||
Shares issued in reinvestment of distributions | 94,465 | 140,267 | 1,201,734 | 1,257,609 | ||||||||||||||
Shares converted to Class A | (302,954 | ) | (1,445,330 | ) | (3,679,444 | ) | (16,297,573 | ) | ||||||||||
Shares issued in connection with the acquisition of AllianceBernstein International Research Growth Fund | – 0 | – | 2,048,151 | – 0 | – | 25,021,335 | ||||||||||||
Shares redeemed | (554,490 | ) | (2,386,097 | ) | (6,732,399 | ) | (24,957,859 | ) | ||||||||||
Net decrease | (623,297 | ) | (1,180,166 | ) | $ | (7,510,337 | ) | $ | (8,672,675 | ) | ||||||||
| Class C | ||||||||||||||||||
Shares sold | 786,146 | 2,920,151 | $ | 9,563,690 | $ | 41,031,947 | ||||||||||||
Shares issued in reinvestment of distributions | 382,427 | 869,120 | 4,876,328 | 5,930,506 | ||||||||||||||
Shares issued in connection with the acquisition of AllianceBernstein International Research Growth Fund | – 0 | – | 2,358,782 | – 0 | – | 37,479,155 | ||||||||||||
Shares redeemed | (3,596,582 | ) | (15,229,770 | ) | (43,638,315 | ) | (157,509,461 | ) | ||||||||||
Net decrease | (2,428,009 | ) | (9,081,717 | ) | $ | (29,198,297 | ) | $ | (73,067,853 | ) | ||||||||
| Advisor Class | ||||||||||||||||||
Shares sold | 2,752,268 | 17,651,688 | $ | 37,093,485 | $ | 222,430,274 | ||||||||||||
Shares issued in reinvestment of dividends | 623,504 | 796,035 | 8,797,646 | 7,366,377 | ||||||||||||||
Shares issued in connection with the acquisition of AllianceBernstein International Research Growth Fund | – 0 | – | 3,054,066 | – 0 | – | 55,388,940 | ||||||||||||
Shares redeemed | (5,123,938 | ) | (23,462,888 | ) | (69,256,391 | ) | (254,794,573 | ) | ||||||||||
Net increase (decrease) | (1,748,166 | ) | (1,961,099 | ) | $ | (23,365,260 | ) | $ | 30,391,018 | |||||||||
| 28 | • ALLIANCEBERNSTEIN INTERNATIONAL GROWTH FUND |
Notes to Financial Statements
| SHARES | AMOUNT | |||||||||||||||||
Six Months Ended (unaudited) | Year Ended June 30, 2009 | Six Months Ended (unaudited) | Year Ended June 30, 2009 | |||||||||||||||
| Class R | ||||||||||||||||||
Shares sold | 558,362 | 2,319,233 | $ | 7,380,183 | $ | 26,390,889 | ||||||||||||
Shares issued in reinvestment of dividends | 97,116 | 64,550 | 1,346,023 | 1,196,518 | ||||||||||||||
Shares issued in connection with the acquisition of AllianceBernstein International Research Growth Fund | – 0 | – | 1,141 | – 0 | – | 22,933 | ||||||||||||
Shares redeemed | (565,553 | ) | (2,172,421 | ) | (7,431,647 | ) | (22,715,451 | ) | ||||||||||
Net increase | 89,925 | 212,503 | $ | 1,294,559 | $ | 4,894,889 | ||||||||||||
| Class K | ||||||||||||||||||
Shares sold | 179,191 | 480,838 | $ | 2,365,904 | $ | 5,575,210 | ||||||||||||
Shares issued in reinvestment of dividends | 27,895 | 13,007 | 388,025 | 234,509 | ||||||||||||||
Shares issued in connection with the acquisition of AllianceBernstein International Research Growth Fund | – 0 | – | 36,980 | – 0 | – | 807,234 | ||||||||||||
Shares redeemed | (260,562 | ) | (317,114 | ) | (3,428,714 | ) | (3,624,967 | ) | ||||||||||
Net increase (decrease) | (53,476 | ) | 213,711 | $ | (674,785 | ) | $ | 2,991,986 | ||||||||||
| Class I | ||||||||||||||||||
Shares sold | 398,815 | 940,674 | $ | 5,106,037 | $ | 9,847,180 | ||||||||||||
Shares issued in reinvestment of dividends | 77,393 | 27,214 | 1,084,276 | 492,849 | ||||||||||||||
Shares issued in connection with the acquisition of AllianceBernstein International Research Growth Fund | – 0 | – | 159,915 | – 0 | – | 3,295,398 | ||||||||||||
Shares redeemed | (278,945 | ) | (331,350 | ) | (3,647,271 | ) | (3,520,738 | ) | ||||||||||
Net increase | 197,263 | 796,453 | $ | 2,543,042 | $ | 10,114,689 | ||||||||||||
| ALLIANCEBERNSTEIN INTERNATIONAL GROWTH FUND • | 29 |
Notes to Financial Statements
NOTE F
Risks Involved in Investing in the Fund
Foreign Securities Risk—Investing in securities of foreign companies or foreign governments involves special risks which include changes in foreign currency exchange rates and the possibility of future political and economic developments which could adversely affect the value of such securities. Moreover, securities of many foreign companies or foreign governments and their markets may be less liquid and their prices more volatile than those of comparable U.S. companies or of the U.S. government.
Currency Risk—This is the risk that changes in foreign currency exchange rates may negatively affect the value of the Fund’s investments or reduce the returns of the Fund. For example, the value of the Fund’s investments in foreign currency-denominated securities or currencies may decrease if the U.S. Dollar is strong (i.e., gaining value relative to other currencies) and other currencies are weak (i.e., losing value relative to the U.S. Dollar). Currency markets are generally not as regulated as securities markets. Independent of the Fund’s investments in securities denominated in foreign currencies, the Fund’s positions in various foreign currencies may cause the Fund to experience investment losses due to the changes in exchange rates and interest rates.
Derivatives Risk—The Fund may invest in derivatives such as forwards, options, futures and swaps. These investments may be illiquid, difficult to price, and leveraged so that small changes may produce disproportionate losses for the Fund, and subject to counterparty risk to a greater degree than more traditional investments.
Indemnification Risk—In the ordinary course of business, the Fund enters into contracts that contain a variety of indemnifications. The Fund’s maximum exposure under these arrangements is unknown. However, the Fund has not had prior claims or losses pursuant to these indemnification provisions and expects the risk of loss thereunder to be remote. As such, the Fund has not accrued any liability in connection with these indemnification provisions.
NOTE G
Joint Credit Facility
A number of open-end mutual funds managed by the Adviser, including the Fund, participate in a $140 million revolving credit facility (the “Facility”) intended to provide short-term financing if necessary, subject to certain restrictions in connection with abnormal redemption activity. Commitment fees related to the Facility are paid by the participating funds and are included in miscellaneous expenses in the statement of operations. The Fund did not utilize the facility during the six months ended December 31, 2009.
| 30 | • ALLIANCEBERNSTEIN INTERNATIONAL GROWTH FUND |
Notes to Financial Statements
NOTE H
Acquisition of AllianceBernstein International Research Growth Fund, Inc. by AllianceBernstein International Growth Fund, Inc. (the “Fund”)
On July 25, 2008, the Fund acquired all of the assets and all of the liabilities of AllianceBernstein International Research Growth Fund, Inc. (“IRG”), pursuant to a plan of reorganization approved on May 8, 2008, by the Boards of Directors of IRG and the Fund. On July 25, 2008, the acquisition was accomplished by a tax-free exchange of 18,002,956 shares of the Fund for 21,703,099 shares of IRG. The aggregate net assets of the Fund and IRG immediately before the acquisition were $3,193,887,109 and $310,313,691 (including $20,279,606 of net unrealized appreciation of investments and foreign currency denominated assets and liabilities), respectively. Immediately after the acquisition, the combined net assets of the Fund amounted to $3,504,200,800.
NOTE I
Distributions to Shareholders
The tax character of distributions paid for the year ending June 30, 2010 will be determined at the end of the current fiscal year. The tax character of distributions paid for the year ending June 30, 2009 and June 30, 2008 were as follows:
| June 30, 2009 | June 30, 2008 | |||||
Distributions paid from: | ||||||
Ordinary income | $ | 48,629,616 | $ | 94,519,187 | ||
Long-term capital gain | 3,691,678 | 109,193,732 | ||||
Total taxable distributions | 52,321,294 | 203,712,919 | ||||
Total distributions paid | $ | 52,321,294 | $ | 203,712,919 | ||
As of June 30, 2009, the components of accumulated earning/(deficit) on a tax basis were as follows:
Undistributed ordinary income | $ | 28,152,117 | ||
Accumulated capital and other losses | (1,198,671,538 | )(a) | ||
Unrealized appreciation/(depreciation) | (89,418,791 | )(b) | ||
Total accumulated earnings/(deficit) | $ | (1,259,938,212 | )(b) | |
| (a) | On June 30, 2009, the Fund had a net capital loss carryforward for federal income tax purposes of $459,206,856 (of which $17,439,216 are attributable to the purchase of net assets of AllianceBernstein International Research Growth Fund, Inc. on July 25, 2008) of which $7,970,694 expires in the year 2010, $7,476,210 expires in the year 2011, and $443,759,952 expires in the year 2017. During the fiscal year, the Fund had capital loss carryforwards expire of $1,229,569. To the extent future capital gains are offset by capital loss carryforwards, such gains will not be distributed. Net capital losses incurred after October 31, and within the taxable year are deemed to arise on the first business day of the Fund’s next taxable year. For the year ended June 30, 2009, the Fund deferred to July 1, 2009, post-October losses of $739,464,682. As a result of the reorganization with AllianceBernstein International Research Growth Fund, Inc., into the Fund, various limitations |
| ALLIANCEBERNSTEIN INTERNATIONAL GROWTH FUND • | 31 |
Notes to Financial Statements
and reductions regarding the future utilization of certain capital loss carryforwards were applied based on certain provisions in the Internal Revenue Code. |
| (b) | The differences between book-basis and tax-basis unrealized appreciation/(depreciation) are attributable primarily to the tax deferral of losses on wash sales, the tax treatment of Passive Foreign Investment Companies (“PFIC’s”) and the tax treatment of derivatives. |
NOTE J
Legal Proceedings
On October 2, 2003, a purported class action complaint entitled Hindo, et al. v. AllianceBernstein Growth & Income Fund, et al. (“Hindo Complaint”) was filed against the Adviser, Alliance Capital Management Holding L.P. (“Alliance Holding”), Alliance Capital Management Corporation, AXA Financial, Inc., the AllianceBernstein Funds, certain officers of the Adviser (“AllianceBernstein defendants”), and certain other unaffiliated defendants, as well as unnamed Doe defendants. The Hindo Complaint was filed in the United States District Court for the Southern District of New York by alleged shareholders of two of the AllianceBernstein Funds. The Hindo Complaint alleges that certain of the AllianceBernstein defendants failed to disclose that they improperly allowed certain hedge funds and other unidentified parties to engage in “late trading” and “market timing” of AllianceBernstein Fund securities, violating Sections 11 and 15 of the Securities Act, Sections 10(b) and 20(a) of the Exchange Act and Sections 206 and 215 of the Advisers Act. Plaintiffs seek an unspecified amount of compensatory damages and rescission of their contracts with the Adviser, including recovery of all fees paid to the Adviser pursuant to such contracts.
Following October 2, 2003, 43 additional lawsuits making factual allegations generally similar to those in the Hindo Complaint were filed in various federal and state courts against the Adviser and certain other defendants. On September 29, 2004, plaintiffs filed consolidated amended complaints with respect to four claim types: mutual fund shareholder claims; mutual fund derivative claims; derivative claims brought on behalf of Alliance Holding; and claims brought under ERISA by participants in the Profit Sharing Plan for Employees of the Adviser. All four complaints include substantially identical factual allegations, which appear to be based in large part on the Order of the SEC dated December 18, 2003 as amended and restated January 15, 2004 (“SEC Order”) and the New York State Attorney General Assurance of Discontinuance dated September 1, 2004 (“NYAG Order”).
On April 21, 2006, the Adviser and attorneys for the plaintiffs in the mutual fund shareholder claims, mutual fund derivative claims, and ERISA claims entered into a confidential memorandum of understanding containing their agreement to settle these claims. The agreement will be documented by a stipulation of settlement and will be submitted for court approval at a later date. The settlement amount ($30 million), which the Adviser previously accrued and disclosed, has been disbursed. The derivative claims brought on behalf of Alliance Holding, in which plaintiffs seek an unspecified amount of damages, remain pending.
| 32 | • ALLIANCEBERNSTEIN INTERNATIONAL GROWTH FUND |
Notes to Financial Statements
It is possible that these matters and/or other developments resulting from these matters could result in increased redemptions of the AllianceBernstein Mutual Funds’ shares or other adverse consequences to the AllianceBernstein Mutual Funds. This may require the AllianceBernstein Mutual Funds to sell investments held by those funds to provide for sufficient liquidity and could also have an adverse effect on the investment performance of the AllianceBernstein Mutual Funds. However, the Adviser believes that these matters are not likely to have a material adverse effect on its ability to perform advisory services relating to the AllianceBernstein Mutual Funds.
NOTE K
Subsequent Events
Management has evaluated subsequent events for possible recognition or disclosure in the financial statements through February 26, 2010, the date the financial statements are issued. Management has determined that there are no material events that would require disclosure in the Fund’s financial statements through this date.
| ALLIANCEBERNSTEIN INTERNATIONAL GROWTH FUND • | 33 |
Notes to Financial Statements
FINANCIAL HIGHLIGHTS
Selected Data For A Share of Capital Stock Outstanding Throughout Each Period
| Class A | ||||||||||||||||||
Six Months (unaudited) | Year Ended June 30, | |||||||||||||||||
| 2009 | 2008 | 2007 | 2006 | 2005 | ||||||||||||||
Net asset value, beginning of period | $ 11.48 | $ 19.18 | $ 20.85 | $ 16.93 | $ 13.72 | $ 11.15 | ||||||||||||
Income From Investment Operations | ||||||||||||||||||
Net investment income(a) | .02 | .19 | .27 | .23 | .20 | .15 | (b) | |||||||||||
Net realized and unrealized gain (loss) on investment and foreign currency transactions | 2.97 | (7.59 | ) | (.53 | ) | 4.56 | 3.22 | 2.46 | ||||||||||
Contributions from Adviser | – 0 | –(c) | – 0 | – | – 0 | –(c) | – 0 | –(c) | – 0 | – | – 0 | – | ||||||
Net increase (decrease) in net asset value from operations | 2.99 | (7.40 | ) | (.26 | ) | 4.79 | 3.42 | 2.61 | ||||||||||
Less: Dividends and Distributions | ||||||||||||||||||
Dividends from net investment income | (.39 | ) | (.28 | ) | (.17 | ) | (.15 | ) | (.09 | ) | (.04 | ) | ||||||
Distributions from net realized gain on investment and foreign currency transactions | – 0 | – | (.02 | ) | (1.24 | ) | (.72 | ) | (.12 | ) | – 0 | – | ||||||
Total dividends and distributions | (.39 | ) | (.30 | ) | (1.41 | ) | (.87 | ) | (.21 | ) | (.04 | ) | ||||||
Net asset value, end of period | $ 14.08 | $ 11.48 | $ 19.18 | $ 20.85 | $ 16.93 | $ 13.72 | ||||||||||||
Total Return | ||||||||||||||||||
Total investment return based on net asset value(d) | 26.06 | % | (39.15 | )% | (1.80 | )% | 29.16 | % | 25.11 | % | 23.44 | % | ||||||
Ratios/Supplemental Data | ||||||||||||||||||
Net assets, end of period (000’s omitted) | $1,266,769 | $1,106,113 | $2,128,533 | $1,630,491 | $952,036 | $310,073 | ||||||||||||
Ratio to average net assets of: | ||||||||||||||||||
Expenses, net of waivers/ reimbursements | 1.28 | (e) | 1.34 | % | 1.23 | % | 1.27 | % | 1.43 | %(f) | 1.57 | % | ||||||
Expenses, before waivers/ reimbursements | 1.28 | (e) | 1.34 | % | 1.23 | % | 1.27 | % | 1.43 | %(f) | 1.61 | % | ||||||
Net investment income | .23 | %(e) | 1.58 | % | 1.35 | % | 1.21 | % | 1.26 | %(f) | 1.17 | %(b) | ||||||
Portfolio turnover rate | 56 | % | 103 | % | 90 | % | 68 | % | 59 | % | 47 | % | ||||||
See footnote summary on page 41.
| 34 | • ALLIANCEBERNSTEIN INTERNATIONAL GROWTH FUND |
Financial Highlights
Selected Data For A Share of Capital Stock Outstanding Throughout Each Period
| Class B | ||||||||||||||||||
Six Months (unaudited) | Year Ended June 30, | |||||||||||||||||
| 2009 | 2008 | 2007 | 2006 | 2005 | ||||||||||||||
Net asset value, beginning of period | $ 10.42 | $ 17.50 | $ 19.15 | $ 15.65 | $ 12.72 | $ 10.38 | ||||||||||||
Income From | ||||||||||||||||||
Net investment | (.03 | ) | .08 | .09 | .06 | .05 | .04 | (b) | ||||||||||
Net realized and | 2.70 | (6.95 | ) | (.45 | ) | 4.22 | 3.01 | 2.30 | ||||||||||
Contributions from Adviser | – 0 | –(c) | – 0 | – | – 0 | –(c) | – 0 | –(c) | – 0 | – | – 0 | – | ||||||
Net increase (decrease) in net asset value from operations | 2.67 | (6.87 | ) | (.36 | ) | 4.28 | 3.06 | 2.34 | ||||||||||
Less: Dividends and Distributions | ||||||||||||||||||
Dividends from net investment income | (.27 | ) | (.19 | ) | (.05 | ) | (.06 | ) | (.01 | ) | – 0 | – | ||||||
Distributions from net realized gain on investment and foreign currency transactions | – 0 | – | (.02 | ) | (1.24 | ) | (.72 | ) | (.12 | ) | – 0 | – | ||||||
Total dividends and distributions | (.27 | ) | (.21 | ) | (1.29 | ) | (.78 | ) | (.13 | ) | – 0 | – | ||||||
Net asset value, end of period | $ 12.82 | $ 10.42 | $ 17.50 | $ 19.15 | $ 15.65 | $ 12.72 | ||||||||||||
Total Return | ||||||||||||||||||
Total investment return based on net asset value(d) | 25.66 | % | (39.70 | )% | (2.45 | )% | 28.18 | % | 24.18 | % | 22.54 | % | ||||||
Ratios/Supplemental Data | ||||||||||||||||||
Net assets, end of period (000’s omitted) | $60,681 | $55,832 | $114,406 | $136,704 | $109,706 | $66,613 | ||||||||||||
Ratio to average net | ||||||||||||||||||
Expenses, net of waivers/ reimbursements | 2.06 | %(e) | 2.12 | % | 1.97 | % | 2.00 | % | 2.18 | %(f) | 2.33 | % | ||||||
Expenses, before waivers/ reimbursements | 2.06 | %(e) | 2.12 | % | 1.97 | % | 2.01 | % | 2.18 | %(f) | 2.37 | % | ||||||
Net investment | (.55 | )%(e) | .74 | % | .48 | % | .37 | % | .33 | %(f) | .33 | %(b) | ||||||
Portfolio turnover rate | 56 | % | 103 | % | 90 | % | 68 | % | 59 | % | 47 | % | ||||||
See footnote summary on page 41.
| ALLIANCEBERNSTEIN INTERNATIONAL GROWTH FUND • | 35 |
Financial Highlights
Selected Data For A Share of Capital Stock Outstanding Throughout Each Period
| Class C | ||||||||||||||||||
Six Months (unaudited) | Year Ended June 30, | |||||||||||||||||
| 2009 | 2008 | 2007 | 2006 | 2005 | ||||||||||||||
Net asset value, beginning of period | $ 10.45 | $ 17.53 | $ 19.18 | $ 15.67 | $ 12.72 | $ 10.38 | ||||||||||||
Income From | ||||||||||||||||||
Net investment | (.03 | ) | .09 | .12 | .10 | .13 | .06 | (b) | ||||||||||
Net realized and | 2.70 | (6.96 | ) | (.48 | ) | 4.19 | 2.95 | 2.28 | ||||||||||
Contributions from Adviser | – 0 | –(c) | – 0 | – | – 0 | –(c) | – 0 | –(c) | – 0 | – | – 0 | – | ||||||
Net increase (decrease) in net asset value from operations | 2.67 | (6.87 | ) | (.36 | ) | 4.29 | 3.08 | 2.34 | ||||||||||
Less: Dividends and Distributions | ||||||||||||||||||
Dividends from net investment income | (.27 | ) | (.19 | ) | (.05 | ) | (.06 | ) | (.01 | ) | – 0 | – | ||||||
Distributions from net realized gain on investment and foreign currency transactions | – 0 | – | (.02 | ) | (1.24 | ) | (.72 | ) | (.12 | ) | – 0 | – | ||||||
Total dividends and distributions | (.27 | ) | (.21 | ) | (1.29 | ) | (.78 | ) | (.13 | ) | – 0 | – | ||||||
Net asset value, end of period | $ 12.85 | $ 10.45 | $ 17.53 | $ 19.18 | $ 15.67 | $ 12.72 | ||||||||||||
Total Return | ||||||||||||||||||
Total investment return based on net asset value(d) | 25.59 | % | (39.63 | )% | (2.45 | )% | 28.21 | % | 24.34 | % | 22.54 | % | ||||||
Ratios/Supplemental Data | ||||||||||||||||||
Net assets, end of period (000’s omitted) | $249,800 | $228,402 | $542,520 | $444,496 | $210,147 | $29,957 | ||||||||||||
Ratio to average net | ||||||||||||||||||
Expenses, net of waivers/ reimbursements | 2.00 | %(e) | 2.07 | % | 1.94 | % | 1.98 | % | 2.13 | %(f) | 2.29 | % | ||||||
Expenses, before waivers/ reimbursements | 2.00 | %(e) | 2.07 | % | 1.94 | % | 1.98 | % | 2.13 | %(f) | 2.33 | % | ||||||
Net investment | (49 | )%(e) | .77 | % | .62 | % | .55 | % | .85 | %(f) | .55 | %(b) | ||||||
Portfolio turnover rate | 56 | % | 103 | % | 90 | % | 68 | % | 59 | % | 47 | % | ||||||
See footnote summary on page 41.
| 36 | • ALLIANCEBERNSTEIN INTERNATIONAL GROWTH FUND |
Financial Highlights
Selected Data For A Share of Capital Stock Outstanding Throughout Each Period
| Advisor Class | ||||||||||||||||||
Six Months (unaudited) | Year Ended June 30, | |||||||||||||||||
| 2009 | 2008 | 2007 | 2006 | 2005 | ||||||||||||||
Net asset value, beginning of period | $ 11.61 | $ 19.39 | $ 21.05 | $ 17.08 | $ 13.82 | $ 11.22 | ||||||||||||
Income From | ||||||||||||||||||
Net investment | .04 | .23 | .35 | .31 | .29 | .22 | (b) | |||||||||||
Net realized and | 3.01 | (7.67 | ) | (.54 | ) | 4.57 | 3.21 | 2.45 | ||||||||||
Contributions from Adviser | – 0 | –(c) | – 0 | – | – 0 | –(c) | – 0 | –(c) | – 0 | – | – 0 | – | ||||||
Net increase (decrease) in net asset value from operations | 3.05 | (7.44 | ) | (.19 | ) | 4.88 | 3.50 | 2.67 | ||||||||||
Less: Dividends and Distributions | ||||||||||||||||||
Dividends from net investment income | (.43 | ) | (.32 | ) | (.23 | ) | (.19 | ) | (.12 | ) | (.07 | ) | ||||||
Distributions from net realized gain on investment and foreign currency transactions | – 0 | – | (.02 | ) | (1.24 | ) | (.72 | ) | (.12 | ) | – 0 | – | ||||||
Total dividends and distributions | (.43 | ) | (.34 | ) | (1.47 | ) | (.91 | ) | (.24 | ) | (.07 | ) | ||||||
Net asset value, end of period | $ 14.23 | $ 11.61 | $ 19.39 | $ 21.05 | $ 17.08 | $ 13.82 | ||||||||||||
Total Return | ||||||||||||||||||
Total investment return based on net asset value(d) | 26.30 | % | (39.02 | )% | (1.49 | )% | 29.51 | % | 25.57 | % | 23.86 | % | ||||||
Ratios/Supplemental Data | ||||||||||||||||||
Net assets, end of period (000’s omitted) | $346,556 | $302,956 | $544,154 | $319,322 | $108,237 | $8,404 | ||||||||||||
Ratio to average net | ||||||||||||||||||
Expenses, net of waivers/ reimbursements | .98 | %(e) | 1.05 | % | .93 | % | .97 | % | 1.13 | %(f) | 1.25 | % | ||||||
Expenses, before waivers/ reimbursements | .98 | %(e) | 1.05 | % | .93 | % | .97 | % | 1.13 | %(f) | 1.29 | % | ||||||
Net investment | .53 | %(e) | 1.88 | % | 1.74 | % | 1.62 | % | 1.81 | %(f) | 1.74 | %(b) | ||||||
Portfolio turnover rate | 56 | % | 103 | % | 90 | % | 68 | % | 59 | % | 47 | % | ||||||
See footnote summary on page 41.
| ALLIANCEBERNSTEIN INTERNATIONAL GROWTH FUND • | 37 |
Financial Highlights
Selected Data For A Share of Capital Stock Outstanding Throughout Each Period
| Class R | ||||||||||||||||||
Six Months 2009 (unaudited) | Year Ended June 30, | March 1, 2005 | ||||||||||||||||
| 2009 | 2008 | 2007 | 2006 | |||||||||||||||
Net asset value, beginning of period | $ 11.39 | �� | $ 19.06 | $ 20.75 | $ 16.90 | $ 13.72 | $ 14.08 | |||||||||||
Income From | ||||||||||||||||||
Net investment | (0) (c) | .17 | .25 | .20 | .29 | .12 | ||||||||||||
Net realized and | 2.95 | (7.57 | ) | (.55 | ) | 4.52 | 3.09 | (.48 | ) | |||||||||
Contributions from Adviser | – 0 | –(c) | – 0 | – | – 0 | –(c) | – 0 | –(c) | – 0 | – | – 0 | – | ||||||
Net increase (decrease) in net asset value from operations | 2.95 | (7.40 | ) | (.30 | ) | 4.72 | 3.38 | (.36 | ) | |||||||||
Less: Dividends and Distributions | ||||||||||||||||||
Dividends from net investment income | (.37 | ) | (.25 | ) | (.15 | ) | (.15 | ) | (.08 | ) | – 0 | – | ||||||
Distributions from net realized gain on investment and foreign currency transactions | – 0 | – | (.02 | ) | (1.24 | ) | (.72 | ) | (.12 | ) | – 0 | – | ||||||
Total dividends and distributions | (.37 | ) | (.27 | ) | (1.39 | ) | (.87 | ) | (.20 | ) | – 0 | – | ||||||
Net asset value, end of period | $ 13.97 | $ 11.39 | $ 19.06 | $ 20.75 | $ 16.90 | $ 13.72 | ||||||||||||
Total Return | ||||||||||||||||||
Total investment return based on net asset value(d) | 25.95 | % | (39.33 | )% | (2.03 | )% | 28.80 | % | 24.83 | % | (2.56 | )% | ||||||
Ratios/Supplemental Data | ||||||||||||||||||
Net assets, end of period (000’s omitted) | $51,860 | $41,265 | $64,985 | $29,638 | $6,969 | $10 | ||||||||||||
Ratio to average net assets of: | ||||||||||||||||||
Expenses, net of waivers/ reimbursements | 1.57 | %(e) | 1.56 | % | 1.49 | % | 1.56 | % | 1.67 | %(f) | 1.58 | %(e) | ||||||
Expenses, before waivers/ reimbursements | 1.57 | %(e) | 1.56 | % | 1.49 | % | 1.56 | % | 1.67 | %(f) | 1.58 | %(e) | ||||||
Net investment | (.07 | )%(e) | 1.44 | % | 1.24 | % | 1.02 | % | 1.76 | %(f) | 2.59 | %(e) | ||||||
Portfolio turnover rate | 56 | % | 103 | % | 90 | % | 68 | % | 59 | % | 47 | % | ||||||
See footnote summary on page 41.
| 38 | • ALLIANCEBERNSTEIN INTERNATIONAL GROWTH FUND |
Financial Highlights
Selected Data For A Share of Capital Stock Outstanding Throughout Each Period
| Class K | ||||||||||||||||||
Six Months 2009 (unaudited) | Year Ended June 30, | March 1, 2005 | ||||||||||||||||
| 2009 | 2008 | 2007 | 2006 | |||||||||||||||
Net asset value, beginning of period | $ 11.45 | $ 19.14 | $ 20.82 | $ 16.95 | $ 13.73 | $ 14.08 | ||||||||||||
Income From | ||||||||||||||||||
Net investment | .02 | .20 | .29 | .31 | .34 | .13 | ||||||||||||
Net realized and | 2.97 | (7.59 | ) | (.54 | ) | 4.47 | 3.09 | (.48 | ) | |||||||||
Contributions from Adviser | – 0 | –(c) | – 0 | – | – 0 | –(c) | – 0 | –(c) | – 0 | – | – 0 | – | ||||||
Net increase (decrease) in net asset value from operations | 2.99 | (7.39 | ) | (.25 | ) | 4.78 | 3.43 | (.35 | ) | |||||||||
Less: Dividends and Distributions | ||||||||||||||||||
Dividends from net investment income | (.41 | ) | (.28 | ) | (.19 | ) | (.19 | ) | (.09 | ) | – 0 | – | ||||||
Distributions from net realized gain on investment and foreign currency transactions | – 0 | – | (.02 | ) | (1.24 | ) | (.72 | ) | (.12 | ) | – 0 | – | ||||||
Total dividends and distributions | (.41 | ) | (.30 | ) | (1.43 | ) | (.91 | ) | (.21 | ) | – 0 | – | ||||||
Net asset value, end of period | $ 14.03 | $ 11.45 | $ 19.14 | $ 20.82 | $ 16.95 | $ 13.73 | ||||||||||||
Total Return | ||||||||||||||||||
Total investment return based on net asset value(d) | 26.15 | % | (39.19 | )% | (1.78 | )% | 29.13 | % | 25.18 | % | (2.49 | )% | ||||||
Ratios/Supplemental Data | ||||||||||||||||||
Net assets, end of period (000’s omitted) | $13,322 | $11,486 | $15,104 | $8,169 | $760 | $10 | ||||||||||||
Ratio to average net assets of: | ||||||||||||||||||
Expenses, net of waivers/ reimbursements | 1.26 | %(e) | 1.28 | % | 1.26 | % | 1.26 | % | 1.41 | %(f) | 1.32 | %(e) | ||||||
Expenses, before waivers/ reimbursements | 1.26 | %(e) | 1.28 | % | 1.26 | % | 1.26 | % | 1.41 | %(f) | 1.32 | %(e) | ||||||
Net investment | .24 | %(e) | 1.79 | % | 1.45 | % | 1.60 | % | 2.05 | %(f) | 2.85 | %(e) | ||||||
Portfolio turnover rate | 56 | % | 103 | % | 90 | % | 68 | % | 59 | % | 47 | % | ||||||
See footnote summary on page 41.
| ALLIANCEBERNSTEIN INTERNATIONAL GROWTH FUND • | 39 |
Financial Highlights
Selected Data For A Share of Capital Stock Outstanding Throughout Each Period
| Class I | ||||||||||||||||||
Six Months 2009 (unaudited) | Year Ended June 30, | March 1, 2005 | ||||||||||||||||
| 2009 | 2008 | 2007 | 2006 | |||||||||||||||
Net asset value, beginning of period | $ 11.55 | $ 19.27 | $ 20.92 | $ 16.98 | $ 13.74 | $ 14.08 | ||||||||||||
Income From | ||||||||||||||||||
Net investment | .04 | .27 | .35 | .32 | .48 | .14 | ||||||||||||
Net realized and | 3.01 | (7.64 | ) | (.52 | ) | 4.54 | 3.01 | (.48 | ) | |||||||||
Contributions from Adviser | – 0 | –(c) | – 0 | – | – 0 | –(c) | – 0 | –(c) | – 0 | – | – 0 | – | ||||||
Net increase (decrease) in net asset value from operations | 3.05 | (7.37 | ) | (.17 | ) | 4.86 | 3.49 | (.34 | ) | |||||||||
Less: Dividends and Distributions | ||||||||||||||||||
Dividends from net investment income | (.46 | ) | (.33 | ) | (.24 | ) | (.20 | ) | (.13 | ) | – 0 | – | ||||||
Distributions from net realized gain on investment and foreign currency transactions | – 0 | – | (.02 | ) | (1.24 | ) | (.72 | ) | (.12 | ) | – 0 | – | ||||||
Total dividends and distributions | (.46 | ) | (.35 | ) | (1.48 | ) | (.92 | ) | (.25 | ) | – 0 | – | ||||||
Net asset value, end of period | $ 14.14 | $ 11.55 | $ 19.27 | $ 20.92 | $ 16.98 | $ 13.74 | ||||||||||||
Total Return | ||||||||||||||||||
Total investment return based on net asset value(d) | 26.42 | % | (38.90 | )% | (1.39 | )% | 29.59 | % | 25.61 | % | (2.41 | )% | ||||||
Ratios/Supplemental Data | ||||||||||||||||||
Net assets, end of period (000’s omitted) | $34,192 | $25,659 | $27,460 | $19,421 | $2,497 | $10 | ||||||||||||
Ratio to average net assets of: | ||||||||||||||||||
Expenses, net of waivers/ reimbursements | .87 | %(e) | .86 | % | .84 | % | .90 | % | 1.09 | %(f) | 1.04 | %(e) | ||||||
Expenses, before waivers/ reimbursements | .87 | %(e) | .86 | % | .84 | % | .90 | % | 1.09 | %(f) | 1.04 | %(e) | ||||||
Net investment | .63 | %(e) | 2.37 | % | 1.70 | % | 1.70 | % | 2.81 | %(f) | 3.13 | %(e) | ||||||
Portfolio turnover rate | 56 | % | 103 | % | 90 | % | 68 | % | 59 | % | 47 | % | ||||||
See footnote summary on page 41.
| 40 | • ALLIANCEBERNSTEIN INTERNATIONAL GROWTH FUND |
Financial Highlights
| (a) | Based on average shares outstanding. |
| (b) | Net of expenses waived/reimbursed by the Adviser. |
| (c) | Amount is less than $0.005. |
| (d) | Total investment return is calculated assuming an initial investment made at the net asset value at the beginning of the period, reinvestment of all dividends and distributions at net asset value during the period, and redemption on the last day of the period. Initial sales charge or contingent deferred sales charge is not reflected in the calculation of total investment return. Total investment return does not reflect the deduction of taxes that a shareholder would pay on fund distributions or the redemption of fund shares. Total investment return for a period of less than one year is not annualized. |
| (e) | Annualized. |
| (f) | The ratio includes expenses attributable to costs of proxy solicitation. |
| (g) | Commencement of distributions. |
See notes to financial statements.
| ALLIANCEBERNSTEIN INTERNATIONAL GROWTH FUND • | 41 |
Financial Highlights
BOARD OF DIRECTORS
| William H. Foulk, Jr.,(1) Chairman | Nancy P. Jacklin(1) | |
| John H. Dobkin(1) | Garry L. Moody(1) | |
| Michael J. Downey(1) | Marshall C. Turner, Jr.(1) | |
| D. James Guzy(1) | Earl D. Weiner(1) |
OFFICERS
Robert M. Keith, President and Chief Executive Officer Philip L. Kirstein, Senior Vice President and Independent Hiromitsu Agata, Vice President Olalekan Akinyanmi, Vice President Isabel Buccellati, Vice President Gregory D. Eckersley(2), Vice President William A. Johnston, Vice President Ian Kirwan, Vice President Michele Patri, Vice President | Robert W. Scheetz(2), Vice President Lisa A. Shalett, Vice President Tassos Stassopoulos, Vice President Stephen Tong, Vice President Christopher M. Toub(2), Vice President Emilie D. Wrapp, Secretary Joseph J. Mantineo, Treasurer and Chief Financial Officer Phyllis J. Clarke, Controller |
Custodian and Accounting Agent Brown Brothers Harriman & Company 40 Water Street Boston, MA 02109-3661
Principal Underwriter AllianceBernstein Investments, Inc. 1345 Avenue of the Americas New York, NY 10105
Transfer Agent AllianceBernstein Investor Services, Inc. P.O. Box 786003 San Antonio, TX 78278-6003 Toll-Free (800) 221-5672 | Independent Registered Public Accounting Firm KPMG LLP 345 Park Avenue New York, NY 10154
Legal Counsel Seward & Kissel LLP One Battery Park Plaza New York, NY 10004 | |
| (1) | Member of the Audit Committee, the Governance and Nominating Committee and the Independent Directors Committee. Mr. Foulk is the sole member of the Fair Value Pricing Committee. |
| (2) | The day-to-day management of, and investment decisions for, the AllianceBernstein International Growth Fund’s portfolio are made by the Adviser’s International Growth Portfolio Oversight Group in consultation with the International Growth senior sector analysts. Messrs. Eckersley, Scheetz and Toub are the investment professionals with the most significant responsibility for the day-to-day management of the Fund’s portfolio. |
| 42 | • ALLIANCEBERNSTEIN INTERNATIONAL GROWTH FUND |
Board of Directors
THE FOLLOWING IS NOT PART OF THE SHAREHOLDER REPORT OR THE FINANCIAL STATEMENTS
SUMMARY OF SENIOR OFFICER’S EVALUATION OF INVESTMENT ADVISORY AGREEMENT1
The following is a summary of the evaluation of the Investment Advisory Agreement between AllianceBernstein L.P. (the “Adviser”) and AllianceBernstein International Growth Fund, Inc. (the “Fund”).2 The evaluation of the Investment Advisory Agreement was prepared by Philip L. Kirstein, the Senior Officer of the Fund, for the Directors of the Fund, as required by a September 2004 agreement between the Adviser and the New York State Attorney General (the “NYAG”). The Senior Officer’s evaluation of the Investment Advisory Agreement is not meant to diminish the responsibility or authority of the Board of Directors of the Fund to perform its duties pursuant to Section 15 of the Investment Company Act of 1940 (the “40 Act”) and applicable state law. The purpose of the summary is to provide shareholders with a synopsis of the independent evaluation of the reasonableness of the advisory fees proposed to be paid by the Fund which was provided to the Directors in connection with their review of the proposed approval of the continuance of the Investment Advisory Agreement. The Senior Officer’s evaluation considered the following factors:
| 1. | Advisory fees charged to institutional and other clients of the Adviser for like services; |
| 2. | Advisory fees charged by other mutual fund companies for like services; |
| 3. | Costs to the Adviser and its affiliates of supplying services pursuant to the advisory agreement, excluding any intra-corporate profit; |
| 4. | Profit margins of the Adviser and its affiliates from supplying such services; |
| 5. | Possible economies of scale as the Fund grows larger; and |
| 6. | Nature and quality of the Adviser’s services including the performance of the Fund. |
FUND ADVISORY FEES, NET ASSETS, EXPENSE CAPS & RATIOS
The Adviser proposed that the Fund pay the advisory fee set forth in the table below for receiving the services to be provided pursuant to the Investment Advisory Agreement. The fee schedule below, implemented in January 2004 in consideration of the Adviser’s settlement with the NYAG in December 2003, is
| 1 | It should be noted that the information in the fee summary was completed on April 23, 2009 and presented to the Board of Directors on May 5-7, 2009. |
| 2 | Future references to the Fund do not include “AllianceBernstein.” On July 25, 2008, the Fund acquired International Research Growth Fund, Inc. References in the fee summary pertaining to performance and expense ratio rankings refer to the Class A shares of the Fund. |
| ALLIANCEBERNSTEIN INTERNATIONAL GROWTH FUND • | 43 |
based on a master schedule that contemplates eight categories of funds with almost all funds in each category having the same advisory fee schedule.3
| Category | Advisory Fee Based on % of Average Daily Net Assets4 | Net Assets 02/28/09 ($MIL) | Fund | ||||
| International | 75 bp on 1st $2.5 billion 65 bp on next $2.5 billion 60 bp on the balance | $ | 1,429.1 | International Growth Fund, Inc. | |||
The Adviser is reimbursed as specified in the Investment Advisory Agreement for certain clerical, legal, accounting, administrative and other services provided to the Fund. During the Fund’s most recently completed fiscal year, the Adviser received $114,963 (0.004% of the Fund’s average daily net assets) for such services.
The Adviser has agreed to waive that portion of its management fees and/or reimburse the Fund for that portion of its total operating expenses to the degree necessary to limit the Fund’s expense ratios to the amounts set forth below for the Fund’s fiscal year. The waiver is terminable by the Adviser at the end of the Fund’s fiscal year upon at least 60 days written notice prior to the termination date of the undertaking. It should be noted that the Fund was operating below its expense caps during its most recent semi-annual period; accordingly, the expense limitation undertaking of the Fund was of no effect. In addition, set forth below are the gross expense ratios of the Fund for the most recent semi-annual period:5
| Fund | Expense Cap Pursuant to Expense Limitation Undertaking | Gross (12/31/08) | Fiscal Year End | ||||||
| International Growth Fund, Inc.7 | Advisor Class A Class B Class C Class R Class K Class I | 1.35% 1.65% 2.35% 2.35% 1.85% 1.60% 1.35% | 1.03 1.32 2.08 2.04 1.57 1.32 0.89 | % % % % % % % | June 30 | ||||
| I. | ADVISORY FEES CHARGED TO INSTITUTIONAL AND OTHER CLIENTS |
The advisory fees charged to investment companies which the Adviser manages and sponsors are normally higher than those charged to similar sized
| 3 | Most of the AllianceBernstein Mutual Funds, which the Adviser manages, were affected by the Adviser’s settlement with the NYAG. |
| 4 | The advisory fee is based on the percentage of the Fund’s daily net assets and is paid on a monthly basis. |
| 5 | Semi-annual total expense ratios are unaudited |
| 6 | Annualized. |
| 7 | The stated caps were made effective on May 16, 2005. |
| 44 | • ALLIANCEBERNSTEIN INTERNATIONAL GROWTH FUND |
institutional accounts, including pension plans and sub-advised investment companies. The fee differential reflects, among other things, different services provided to such clients, and different liabilities assumed. Services provided by the Adviser to the Fund that are not provided to non-investment company clients and sub-advised investment companies include providing office space and personnel to serve as Fund Officers, who among other responsibilities make the certifications required under the Sarbanes-Oxley Act of 2002, and coordinating with and monitoring the Fund’s third party service providers such as Fund counsel, auditors, custodians, transfer agents and pricing services. The accounting, administrative, legal and compliance requirements for the Fund are more costly than those for institutional assets due to the greater complexities and time required for investment companies, although as previously noted, a portion of these expenses are reimbursed by the Fund to the Adviser. Also, retail mutual funds managed by the Adviser are widely held. Servicing the Fund’s investors is more time consuming and labor intensive compared to institutional clients since the Adviser needs to communicate with a more extensive network of financial intermediaries and shareholders. The Adviser also believes that it incurs substantial entrepreneurial risk when offering a new mutual fund since establishing a new mutual fund requires a large upfront investment and it may take a long time for the fund to achieve profitability since the fund must be priced to scale from inception in order to be competitive and assets are acquired one account at a time. In addition, managing the cash flow of an investment company may be more difficult than managing that of a stable pool of assets, such as an institutional account with little cash movement in either direction, particularly, if a fund is in net redemption and the Adviser is frequently forced to sell securities to raise cash for redemptions. However, managing a fund with positive cash flow may be easier at times than managing a stable pool of assets. Finally, in recent years, investment advisers have been sued by institutional clients and have suffered reputational damage both by the attendant publicity and outcomes other than complete victories. Accordingly, the legal and reputational risks associated with institutional accounts are greater than previously thought, although still not equal to those related to the mutual fund industry.
Notwithstanding the Adviser’s view that managing an investment company is not comparable to managing other institutional accounts because the services provided are different and legal and reputational risks are greater, it is worth considering information regarding the advisory fees charged to institutional accounts with a similar investment style as the Fund.8 In addition to the AllianceBernstein Institutional fee schedule, set forth below is what would have
| 8 | The Adviser has indicated that with respect to institutional accounts with assets greater than $300 million, it will negotiate a fee schedule. Discounts that are negotiated vary based upon each client relationship. |
| ALLIANCEBERNSTEIN INTERNATIONAL GROWTH FUND • | 45 |
been the effective advisory fee of the Fund had the AllianceBernstein Institutional fee schedule been applicable to the Fund versus the Fund’s advisory fee based on February 28, 2009 net assets:
| Fund | Net Assets 02/28/09 ($MIL) | AllianceBernstein (“AB”) Fee Schedule | Effective AB Inst. Adv. Fee | Fund Advisory | ||||
| International Growth Fund, Inc.9 | $1,429.1 | International Large Cap Growth 80 bp on 1st $25 million 60 bp on next $25 million 50 bp on next $50 million 40 bp on the balance Minimum account size: $25m | 0.414% | 0.750% |
The adviser also manages the AllianceBernstein Variable Products Series Fund, Inc. (“AVPS”), which is available through variable annuity and variable life contracts offered by other financial institutions and offers policyholders the option to utilize certain AVPS portfolios as the investment option underlying their insurance contracts. Set forth below is the fee schedule of the AVPS portfolio that has a substantially similar investment style as the Fund.10 Also shown is what would have been the effective advisory fee of the Fund had the AVPS fee schedule been applicable to the Fund:
| Fund | AVPS Portfolio | Fee Schedule | Effective Adv. Fee | Fund Advisory Fee | ||||
| International Growth Fund, Inc. | International Growth Portfolio | 0.75% on first $2.5 billion 0.65% on next $2.5 billion 0.60% on the balance | 0.750% | 0.750% |
The Adviser represented that it does not sub-advise any registered investment company with a substantially similar investment style as the Fund.
| II. | MANAGEMENT FEES CHARGED BY OTHER MUTUAL FUND COMPANIES FOR LIKE SERVICES. |
Lipper, Inc. (“Lipper”), an analytical service that is not affiliated with the Adviser, compared the fees charged to the Fund with fees charged to other investment companies for similar services offered by other investment advisers. Lipper’s analysis included the Fund’s ranking with respect to the proposed
| 9 | Fees shown are for the International Large Cap Growth Strategy, which is similar but more concentrated than the Fund’s strategy. |
| 10 | It should be noted that the AVPS portfolio was also affected by the settlement between the Adviser and the NYAG. As a result, the Fund has the same breakpoints in its advisory fee schedule as the AVPS portfolio. |
| 46 | • ALLIANCEBERNSTEIN INTERNATIONAL GROWTH FUND |
management fee relative to the median of the Fund’s Lipper Expense Group (“EG”)11 at the approximate current asset level of the Fund.12
Lipper describes an EG as a representative sample of comparable funds. Lipper’s standard methodology for screening funds to be included in an EG entails the consideration of several fund criteria, including fund type, investment classification/objective, load type and similar 12b-1/non-12b-1 service fees, asset (size) comparability, expense components and attributes. An EG will typically consist of seven to twenty funds.
The Fund’s original EG had an insufficient number of peers in the view of the Senior Officer and the Adviser. Consequently, at the request of the Senior Officer and the Adviser, Lipper expanded the Fund’s EG to include peers that have similar but not the same Lipper investment classification/objective.
| Fund | Contractual Management Fee (%)13 | Lipper Exp. Group Median (%) | Rank | |||
| International Growth Fund, Inc.14 | 0.750 | 0.879 | 4/14 |
However, because Lipper had expanded the EG of the Fund, under Lipper’s standard guidelines, the Lipper Expense Universe (“EU”) was also expanded to include the universe of those peers that had a similar but not the same Lipper investment classification/objective.15 A “normal” EU will include funds that have the same investment classification/objective as the subject Fund.16 It
| 11 | It should be noted that Lipper does not consider average account size when constructing EGs. Funds with relatively small average account sizes tend to have higher transfer agent expense ratio than comparable sized funds that have relatively large average account sizes. Note that there are limitations on Lipper expense category data because different funds categorize expenses differently. |
| 12 | The contractual management fee is calculated by Lipper using the Fund’s contractual management fee rate at a hypothetical asset level. The hypothetical asset level is based on the combined net assets of all classes of the Fund, rounded up to the next $25 million. Lipper’s total expense ratio information is based on the most recent annual report except as otherwise noted. A ranking of “1” would mean that the Fund had the lowest effective fee rate in the Lipper peer group. |
| 13 | The contractual management fee does not reflect any expense reimbursements made by the Fund to the Adviser for certain clerical, legal, accounting, administrative and other services. In addition, the contractual management fee would not reflect any advisory fee waivers or expense reimbursements made by the Adviser to the Fund for expense caps that would effectively reduce the actual management fee. |
| 14 | The Fund’s EG includes the Fund, five other International Large-Cap Growth Funds (“ILCG”) and eight International Multi-Cap Growth Funds (“IMCG”). |
| 15 | It should be noted that the expansion of the Fund’s EU was not requested by the Senior Officer or the Adviser. They requested that only the EG be expanded. |
| 16 | Except for asset (size) comparability, Lipper uses the same criteria for selecting an EG peer when selecting an EU peer. Unlike the EG, the EU allows for the same adviser to be represented by more than just one fund. |
| ALLIANCEBERNSTEIN INTERNATIONAL GROWTH FUND • | 47 |
should be noted that Lipper uses expense ratio data from financial statements of the most current fiscal year in their database. This has several implications: the total expense ratio of each fund that Lipper uses in their report is based on each fund’s average net assets during its fiscal year. Since funds have different fiscal year ends, the total expense ratios of the funds may cover different twelve month periods, depending on the funds’ fiscal year ends. This is the process that Lipper utilizes but given market conditions during 2008, especially the last three months of 2008, the effects on the funds’ total expense ratio caused by the differences in fiscal year ends may be more pronounced in 2008 compared to other years under more normal market conditions.17
| Fund | Expense Ratio | Lipper Exp. Group Median (%) | Lipper Group Rank | Lipper Exp. Universe Median (%) | Lipper Rank | |||||
| International Growth Fund, Inc.19 | 1.228 | 1.424 | 2/14 | 1.474 | 5/48 |
Based on this analysis, the Fund has a more favorable ranking on a total expense ratio basis than it does on a management fee basis.
| III. | COSTS TO THE ADVISER AND ITS AFFILIATES OF SUPPLYING SERVICES PURSUANT TO THE ADVISORY FEE ARRANGEMENT, EXCLUDING ANY INTRA-CORPORATE PROFIT. |
The Adviser utilizes two profitability reporting systems, which operate independently but are aligned with each other, to estimate the Adviser’s profitability in connection with investment advisory services provided to the Fund. The Senior Officer has retained a consultant to provide independent advice regarding the alignment of the two profitability systems as well as the methodologies and allocations utilized by both profitability systems. See Section IV for additional discussion.
| IV. | PROFIT MARGINS OF THE ADVISER AND ITS AFFILIATES FOR SUPPLYING SUCH SERVICES. |
The Fund’s profitability information, prepared by the Adviser for the Board of Directors, was reviewed by the Senior Officer and the consultant. The Adviser’s profitability from providing investment advisory services to the Fund increased during calendar year 2008, relative to 2007.20
| 17 | To cite an example, the average net assets and total expense ratio of a fund with a fiscal year end of March 31, 2008 will not be reflective of the market declines that occurred in the second half of 2008, in contrast to a fund with a fiscal year end of December 31, 2008. |
| 18 | The total expense ratios shown are for the Fund’s most recent fiscal year end Class A shares. |
| 19 | The Fund’s EU includes the Fund, EG and all other IMCG and ILCG funds, excluding outliers. |
| 20 | The Adviser’s profitability increased in 2008 as the Fund’s average AUM increased from $2,555.6 million in 2007 to $2,924.5 million in 2008. |
| 48 | • ALLIANCEBERNSTEIN INTERNATIONAL GROWTH FUND |
In addition to the Adviser’s direct profits from managing the Fund, certain of the Adviser’s affiliates have business relationships with the Fund and may earn a profit from providing other services to the Fund. The courts have referred to this type of business opportunity as “fall-out benefits” to the Adviser and indicated that such benefits should be factored into the evaluation of the total relationship between the Fund and the Adviser. Neither case law nor common business practice precludes the Adviser’s affiliates from earning a reasonable profit on this type of relationship provided the affiliates’ charges and services are competitive and the relationship otherwise complies with the 40 Act restrictions. These affiliates provide transfer agent, distribution and brokerage related services to the Fund and receive transfer agent fees, Rule 12b-1 payments, front-end sales loads, contingent deferred sales charges (“CDSC”) and brokerage commissions. In addition, the Adviser benefits from soft dollar arrangements which offset expenses the Adviser would otherwise incur.
AllianceBernstein Investments, Inc. (“ABI”), an affiliate of the Adviser, is the Fund’s principal underwriter. ABI and the Adviser have disclosed in the Fund’s prospectus that they may make revenue sharing payments from their own resources, in addition to resources derived from sales loads and Rule 12b-1 fees, to firms that sell shares of the Fund. In 2008, ABI paid approximately 0.04% of the average monthly assets of the AllianceBernstein Mutual Funds or approximately $21 million for distribution services and educational support (revenue sharing payments). During the Fund’s most recently completed fiscal year, ABI received from the Fund $127,365, $12,662,895 and $270,797 in front-end sales charges, Rule 12b-1 and CDSC fees, respectively.21
Fees and reimbursements for out of pocket expenses charged by AllianceBernstein Investor Services, Inc. (“ABIS”), the affiliated transfer agent for the Fund, are charged on a per account basis, based on the level of service provided and the class of share held by the account. ABIS also receives a fee per shareholder sub-account for each account maintained by an intermediary on an omnibus basis. During the Fund’s most recently completed fiscal year, ABIS received $1,330,991 in fees from the Fund.22
The Portfolio may effect brokerage transactions through the Adviser’s affiliate, Sanford C. Bernstein & Co., LLC (“SCB & Co.”) and/or its U.K. affiliate, Sanford C. Bernstein Limited (“SCB Ltd.”), collectively “SCB,” and pay commissions for such transactions. During the Portfolio’s most recently completed
| 21 | The amounts shown are the front end sales charge, 12b-1 and CDSC fees prior to the Fund’s recent merger and do not include amounts of the acquired fund(s). |
| 22 | The fees disclosed are net of any expense offsets with ABIS. An expense offset is created by the interest earned on the positive cash balance that occurs within the transfer agent account as there is a one day lag with regards to money movement from the shareholder’s account to the transfer agent’s account and then the transfer agent’s account to the Fund’s account. During the Fund’s most recently completed fiscal year, the fees paid by the Fund to ABIS were reduced by $94,310 under the offset agreement between the Fund and ABIS. |
| ALLIANCEBERNSTEIN INTERNATIONAL GROWTH FUND • | 49 |
fiscal year, the Portfolio did not effect any brokerage transactions with and pay any commission to SCB. The Adviser represented that SCB’s profitability from any future business conducted with the Portfolio would be comparable to the profitability of SCB’s dealings with other similar third party clients. In the ordinary course of business, SCB receives and pays liquidity rebates from electronic communications networks (“ECNs”) derived from trading for its clients. These credits and charges are not being passed onto any SCB client. The Adviser also receives certain soft dollar benefits from brokers that execute agency trades for its clients. These soft dollar benefits reduce the Adviser’s cost of doing business and increase its profitability.
| V. | POSSIBLE ECONOMIES OF SCALE |
The Adviser has indicated that economies of scale are being shared with shareholders through fee structures,23 subsidies and enhancement to services. Based on some of the professional literature that has considered economies of scale in the mutual fund industry, it is thought that to the extent economies of scale exist, they may more often exist across a fund family as opposed to a specific fund. This is because the costs incurred by the Adviser, such as investment research or technology for trading or compliance systems can be spread across a greater asset base as the fund family increases in size. It is also possible that as the level of services required to operate a successful investment company has increased over time, and advisory firms make such investments in their business to provide services, there may be a sharing of economies of scale without a reduction in advisory fees.
An independent consultant, retained by the Senior Officer, provided the Board of Directors an update of the Deli24 study on advisory fees and various fund characteristics. The independent consultant first reiterated the results of his previous two dimensional comparison analysis (fund size and family size) with the Board of Directors.25 The independent consultant then discussed the results of the regression model that was utilized to study the effects of various factors on advisory fees. The regression model output indicated that the bulk of the variation in fees predicted were explained by various factors, but substantially by fund AUM, family AUM, index fund indicator and investment style. The independent consultant also compared the advisory fees of the AllianceBernstein Mutual
| 23 | Fee structures include fee reductions, pricing at scale and breakpoints in advisory fee schedules. |
| 24 | The Deli study was originally published in 2002 based on 1997 data. |
| 25 | The two dimensional analysis showed patterns of lower advisory fees for funds with larger asset sizes and funds from larger family sizes compared to funds with smaller asset sizes and funds from smaller family sizes, which according to the independent consultant is indicative of a sharing of economies of scale and scope. However, in less liquid and active markets, such is not the case, as the empirical analysis showed potential for diseconomies of scale in those markets. The empirical analysis also showed diminishing economies of scale and scope as funds surpassed a certain high level of assets. |
| 50 | • ALLIANCEBERNSTEIN INTERNATIONAL GROWTH FUND |
Funds to similar funds managed by 19 other large asset managers, regardless of the fund size and each Adviser’s proportion of mutual fund assets to non-mutual fund assets.
| VI. | NATURE AND QUALITY OF THE ADVISER’S SERVICES, INCLUDING THE PERFORMANCE OF THE FUND |
With assets under management of approximately $411 billion as of March 31, 2009, the Adviser has the investment experience to manage and provide non-investment services (described in Section I) to the Fund.
The information prepared by Lipper shows the 1, 3, 5, and 10 year performance rankings of the Fund26 relative to its Lipper Performance Group (“PG”) and Lipper Performance Universe (“PU”)27 for the periods ended January 31, 2009.28
| Fund Return (%) | PG Median (%) | PU Median (%) | PG Rank | PU Rank | ||||||
1 year | -49.60 | -43.66 | -44.37 | 6/6 | 18/19 | |||||
3 year | -14.72 | -12.10 | -12.23 | 6/6 | 16/18 | |||||
5 year | -0.58 | -0.40 | -1.28 | 4/5 | 5/17 | |||||
10 year | 2.68 | 0.77 | -0.90 | 1/4 | 1/12 |
| 26 | The performance rankings are for the Class A shares of the Fund. It should be noted that the performance returns of the Fund shown were provided by the Adviser. Lipper maintains its own database that includes the Fund’s performance returns. Rounding differences may cause the Adviser’s Fund returns to be one or two basis points different from Lipper’s own Fund returns. To maintain consistency, the performance returns of the Fund, as reported by the Adviser, are provided instead of Lipper. |
| 27 | The Fund’s PG and PU is not identical to the Fund’s respective EG and EU as the criteria for including or excluding a fund in a PG or PU are somewhat different from that of an EG or EU. |
| 28 | Note that the current Lipper investment classification/objective dictates the PG and PU throughout the life of the fund even if a fund had a different investment classification/objective at a different point in time. |
| ALLIANCEBERNSTEIN INTERNATIONAL GROWTH FUND • | 51 |
Set forth below are the 1, 3, 5, 10 year and since inception performance returns of the Fund (in bold)29 versus its benchmark.30 Fund and benchmark volatility and reward-to-variability ratio (“Sharpe Ratio”) information is also shown.31
| Periods Ending January 31, 2009 Annualized Performance | ||||||||||||||||
1 Year | 3 Year | 5 Year | 10 Year (%) | Since Inception (%) | Annualized | Risk Period (Year) | ||||||||||
| Volatility (%) | Sharpe (%) | |||||||||||||||
| International Growth Fund, Inc. | -49.60 | -14.72 | -0.58 | 2.68 | 5.01 | 20.12 | -0.08 | 5 | ||||||||
| MSCI All Country World ex US Index (Net)30 | -45.01 | -11.81 | 0.36 | N/A | N/A | 18.16 | -0.06 | 5 | ||||||||
| MSCI World ex US Index (Net)30 | -44.72 | -11.41 | 0.79 | 1.34 | 3.10 | N/A | N/A | N/A | ||||||||
| Inception Date: June 2, 1994 | ||||||||||||||||
CONCLUSION:
Based on the factors discussed above the Senior Officer’s conclusion is that the proposed advisory fee for the Fund is reasonable and within the range of what would have been negotiated at arm’s-length in light of all the surrounding circumstances. This conclusion in respect of the Fund is based on an evaluation of all of these factors and no single factor was dispositive.
Dated: May 29, 2009
| 29 | The performance returns and risk measures shown in the table are for the Class A shares of the Fund. |
| 30 | The Adviser provided Fund and benchmark performance return information for periods through January 31, 2009. It should be noted that the “since inception” performance returns of the Fund’s benchmark goes back only through the nearest month-end after inception date. In contrast, the Fund’s since inception return goes back to the Fund’s actual inception date. |
| 31 | Fund and benchmark volatility and Sharpe Ratio information was obtained through Lipper LANA, a database maintained by Lipper. Volatility is a statistical measure of the tendency of a market price or yield to vary over time. A Sharpe Ratio is a risk adjusted measure of return that divides a fund’s return in excess of the riskless return by the fund’s standard deviation. A fund with a greater volatility would be seen as more risky than a fund with equivalent performance but lower volatility; for that reason, a greater return would be demanded for the more risky fund. A fund with a higher Sharpe Ratio would be viewed as better performing than a fund with a lower Sharpe Ratio. |
| 52 | • ALLIANCEBERNSTEIN INTERNATIONAL GROWTH FUND |
THIS PAGE IS NOT PART OF THE SHAREHOLDER REPORT OR THE FINANCIAL STATEMENTS
ALLIANCEBERNSTEIN FAMILY OF FUNDS
Wealth Strategies Funds
Balanced Wealth Strategy
Wealth Appreciation Strategy
Conservative Wealth Strategy*
Tax-Managed Balanced Wealth Strategy
Tax-Managed Wealth Appreciation Strategy
Tax-Managed Conservative Wealth Strategy*
Blended Style Funds
U.S. Large Cap Portfolio
International Portfolio
Tax-Managed International Portfolio
Growth Funds
Domestic
Growth Fund
Large Cap Growth Fund
Small Cap Growth Portfolio
Small/Mid Cap Growth Fund
U.S. Strategic Research Portfolio*
Global & International
Global Growth Fund
Global Thematic Growth Fund
Greater China ‘97 Fund
International Growth Fund
Value Funds
Domestic
Balanced Shares
Focused Growth & Income Fund
Growth & Income Fund
Small/Mid Cap Value Fund
Utility Income Fund
Value Fund
Global & International
Global Real Estate Investment Fund
Global Value Fund
International Value Fund
Taxable Bond Funds
Diversified Yield Fund
Global Bond Fund
High Income Fund
Intermediate Bond Portfolio
Short Duration Portfolio
Municipal Bond Funds
National Arizona California Massachusetts Michigan Minnesota | New Jersey New York Ohio Pennsylvania Virginia |
Intermediate Municipal Bond Funds
Intermediate California
Intermediate Diversified
Intermediate New York
Closed-End Funds
AllianceBernstein Global High Income Fund
AllianceBernstein Income Fund
AllianceBernstein National Municipal Income Fund
Alliance California Municipal Income Fund
Alliance New York Municipal Income Fund
The Ibero-America Fund*
Retirement Strategies Funds
2000 Retirement Strategy | 2020 Retirement Strategy | 2040 Retirement Strategy | ||
2005 Retirement Strategy | 2025 Retirement Strategy | 2045 Retirement Strategy | ||
2010 Retirement Strategy | 2030 Retirement Strategy | 2050 Retirement Strategy | ||
2015 Retirement Strategy | 2035 Retirement Strategy | 2055 Retirement Strategy |
We also offer Exchange Reserves,** which serves as the money market fund exchange vehicle for the AllianceBernstein mutual funds.
You should consider the investment objectives, risks, charges and expenses of any AllianceBernstein fund/portfolio carefully before investing. For free copies of our prospectuses, which contain this and other information, visit us online at www.alliancebernstein.com or contact your financial advisor. Please read the prospectus carefully before investing.
| * | Prior to December 31, 2009, Conservative Wealth Strategy was named Wealth Preservation Strategy, and Tax-Managed Conservative Wealth Strategy was named Tax-Managed Wealth Preservation Strategy. U.S. Strategic Research Portfolio was incepted on December 23, 2009. Prior to January 20, 2010, The Ibero-America Fund was named The Spain Fund. |
| ** | An investment in the Fund is not a deposit in a bank and is not insured or guaranteed by the Federal Deposit Insurance Corporation or any other government agency. Although the Fund seeks to preserve the value of your investment at $1.00 per share, it is possible to lose money by investing in the Fund. |
| ALLIANCEBERNSTEIN INTERNATIONAL GROWTH FUND • | 53 |
AllianceBernstein Family of Funds
ALLIANCEBERNSTEIN INTERNATIONAL GROWTH FUND
1345 Avenue of the Americas
New York, NY 10105
800.221.5672
| IG-0152-1209 |  | |
| ITEM 2. | CODE OF ETHICS. |
Not applicable when filing a semi-annual report to shareholders.
| ITEM 3. | AUDIT COMMITTEE FINANCIAL EXPERT. |
Not applicable when filing a semi-annual report to shareholders.
| ITEM 4. | PRINCIPAL ACCOUNTANT FEES AND SERVICES. |
Not applicable when filing a semi-annual report to shareholders.
| ITEM 5. | AUDIT COMMITTEE OF LISTED REGISTRANTS. |
Not applicable to the registrant.
| ITEM 6. | SCHEDULE OF INVESTMENTS. |
Please see Schedule of Investments contained in the Report to Shareholders included under Item 1 of this Form N-CSR.
| ITEM 7. | DISCLOSURE OF PROXY VOTING POLICIES AND PROCEDURES FOR CLOSED-END MANAGEMENT INVESTMENT COMPANIES. |
Not applicable to the registrant.
| ITEM 8. | PORTFOLIO MANAGERS OF CLOSED-END MANAGEMENT INVESTMENT COMPANIES. |
Not applicable to the registrant.
| ITEM 9. | PURCHASES OF EQUITY SECURITIES BY CLOSED-END MANAGEMENT INVESTMENT COMPANY AND AFFILIATED PURCHASERS. |
Not applicable to the registrant.
| ITEM 10. | SUBMISSION OF MATTERS TO A VOTE OF SECURITY HOLDERS. |
There have been no material changes to the procedures by which shareholders may recommend nominees to the Fund’s Board of Directors since the Fund last provided disclosure in response to this item.
| ITEM 11. | CONTROLS AND PROCEDURES. |
(a) The registrant’s principal executive officer and principal financial officer have concluded that the registrant’s disclosure controls and procedures (as defined in Rule 30a-3(c) under the Investment Company Act of 1940, as amended) are effective at the reasonable assurance level based on their evaluation of these controls and procedures as of a date within 90 days of the filing date of this document.
(b) There were no changes in the registrant’s internal controls over financial reporting that occurred during the second fiscal quarter of the period that has materially affected, or is reasonably likely to materially affect, the registrant’s internal control over financial reporting.
| ITEM 12. | EXHIBITS. |
The following exhibits are attached to this Form N-CSR:
EXHIBIT NO. | DESCRIPTION OF EXHIBIT | |
| 12 (b) (1) | Certification of Principal Executive Officer Pursuant to Section 302 of the Sarbanes-Oxley Act of 2002 | |
| 12 (b) (2) | Certification of Principal Financial Officer Pursuant to Section 302 of the Sarbanes-Oxley Act of 2002 | |
| 12 (c) | Certification of Principal Executive Officer and Principal Financial Officer Pursuant to Section 906 of the Sarbanes-Oxley Act of 2002 | |
SIGNATURES
Pursuant to the requirements of the Securities Exchange Act of 1934 and the Investment Company Act of 1940, the registrant has duly caused this report to be signed on its behalf by the undersigned, thereunto duly authorized.
| (Registrant): AllianceBernstein International Growth Fund, Inc. | ||
| By: | /S/ ROBERT M. KEITH | |
| Robert M. Keith | ||
| President | ||
Date: February 26, 2010
Pursuant to the requirements of the Securities Exchange Act of 1934 and the Investment Company Act of 1940, this report has been signed below by the following persons on behalf of the registrant and in the capacities and on the dates indicated.
| By: | /S/ ROBERT M. KEITH | |
| Robert M. Keith | ||
| President | ||
Date: February 26, 2010
| By: | /S/ JOSEPH J. MANTINEO | |
| Joseph J. Mantineo | ||
| Treasurer and Chief Financial Officer | ||
Date: February 26, 2010