EDISON INTERNATIONAL® Leading the Way in Electricity SM October 28, 2014 1 Third Quarter 2014 Financial Results
EDISON INTERNATIONAL® Leading the Way in Electricity SM October 28, 2014 2 Statements contained in this presentation about future performance, including, without limitation, operating results, asset and rate base growth, capital expenditures, San Onofre Nuclear Generating Station (SONGS), and other statements that are not purely historical, are forward-looking statements. These forward-looking statements reflect our current expectations; however, such statements involve risks and uncertainties. Actual results could differ materially from current expectations. These forward-looking statements represent our expectations only as of the date of this presentation, and Edison International assumes no duty to update them to reflect new information, events or circumstances. Important factors that could cause different results are discussed under the headings “Risk Factors” and “Management’s Discussion and Analysis” in Edison International’s Form 10-K, most recent form 10-Q, and other reports filed with the Securities and Exchange Commission, which are available on our website: www.edisoninvestor.com. These filings also provide additional information on historical and other factual data contained in this presentation. Forward-Looking Statements
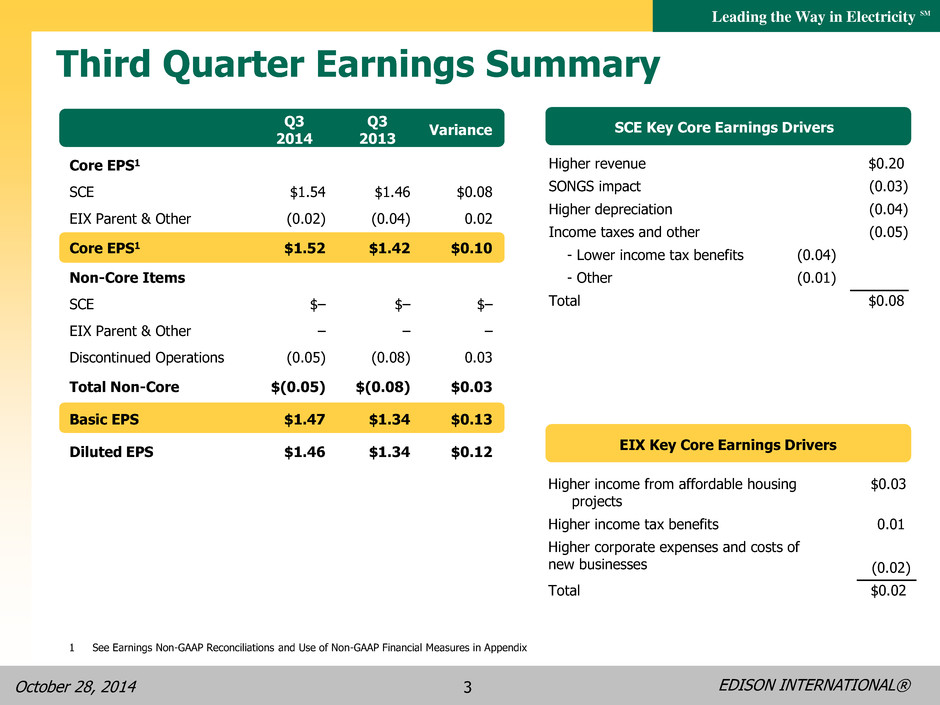
EDISON INTERNATIONAL® Leading the Way in Electricity SM October 28, 2014 3 Third Quarter Earnings Summary Q3 2014 Q3 2013 Variance Core EPS1 SCE $1.54 $1.46 $0.08 EIX Parent & Other (0.02) (0.04) 0.02 Core EPS1 $1.52 $1.42 $0.10 Non-Core Items SCE $– $– $– EIX Parent & Other – – – Discontinued Operations (0.05) (0.08) 0.03 Total Non-Core $(0.05) $(0.08) $0.03 Basic EPS $1.47 $1.34 $0.13 Diluted EPS $1.46 $1.34 $0.12 SCE Key Core Earnings Drivers Higher revenue $0.20 SONGS impact (0.03) Higher depreciation (0.04) Income taxes and other (0.05) - Lower income tax benefits (0.04) - Other (0.01) Total $0.08 EIX Key Core Earnings Drivers Higher income from affordable housing projects $0.03 Higher income tax benefits 0.01 Higher corporate expenses and costs of new businesses (0.02) Total $0.02 1 See Earnings Non-GAAP Reconciliations and Use of Non-GAAP Financial Measures in Appendix
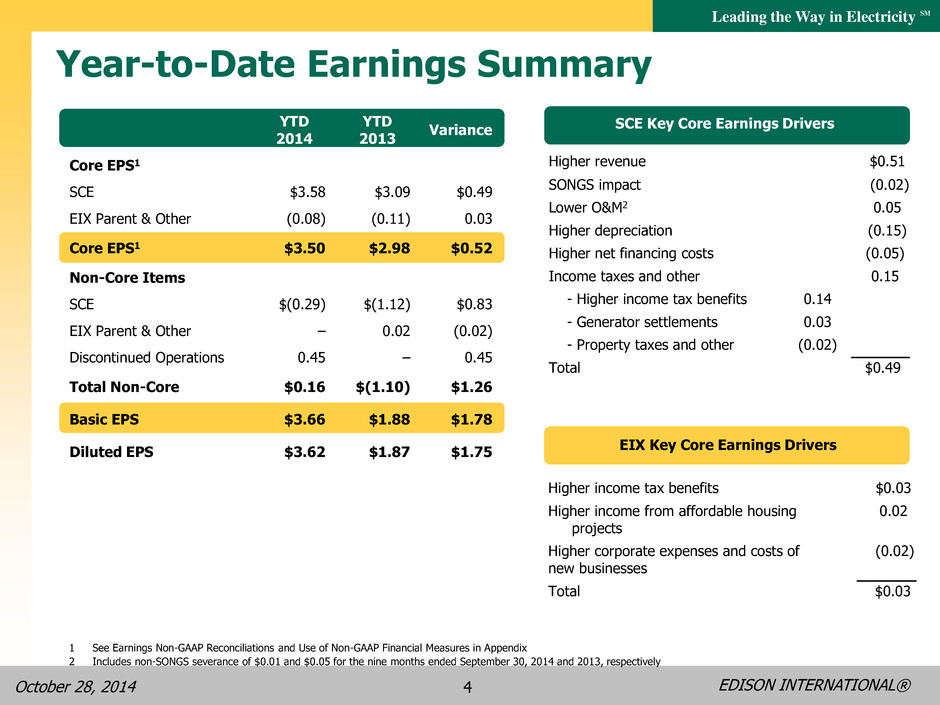
EDISON INTERNATIONAL® Leading the Way in Electricity SM October 28, 2014 4 Year-to-Date Earnings Summary YTD 2014 YTD 2013 Variance Core EPS1 SCE $3.58 $3.09 $0.49 EIX Parent & Other (0.08) (0.11) 0.03 Core EPS1 $3.50 $2.98 $0.52 Non-Core Items SCE $(0.29) $(1.12) $0.83 EIX Parent & Other – 0.02 (0.02) Discontinued Operations 0.45 – 0.45 Total Non-Core $0.16 $(1.10) $1.26 Basic EPS $3.66 $1.88 $1.78 Diluted EPS $3.62 $1.87 $1.75 EIX Key Core Earnings Drivers Higher income tax benefits $0.03 Higher income from affordable housing projects 0.02 Higher corporate expenses and costs of new businesses (0.02) Total $0.03 SCE Key Core Earnings Drivers Higher revenue $0.51 SONGS impact (0.02) Lower O&M2 0.05 Higher depreciation (0.15) Higher net financing costs (0.05) Income taxes and other 0.15 - Higher income tax benefits 0.14 - Generator settlements 0.03 - Property taxes and other (0.02) Total $0.49 1 See Earnings Non-GAAP Reconciliations and Use of Non-GAAP Financial Measures in Appendix 2 Includes non-SONGS severance of $0.01 and $0.05 for the nine months ended September 30, 2014 and 2013, respectively
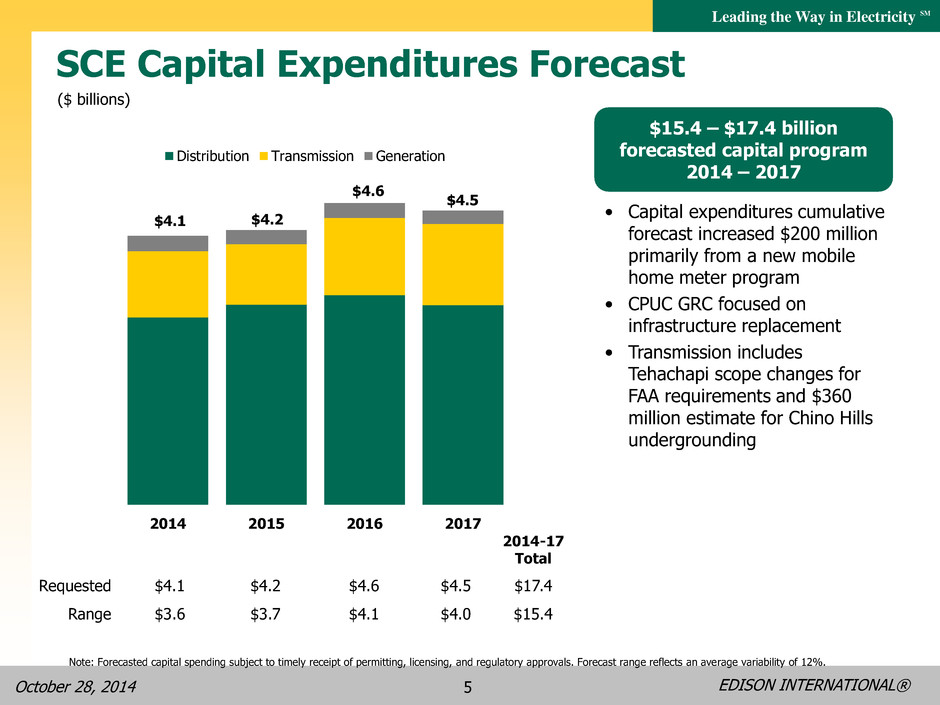
EDISON INTERNATIONAL® Leading the Way in Electricity SM October 28, 2014 5 SCE Capital Expenditures Forecast ($ billions) 2014-17 Total Requested $4.1 $4.2 $4.6 $4.5 $17.4 Range $3.6 $3.7 $4.1 $4.0 $15.4 • Capital expenditures cumulative forecast increased $200 million primarily from a new mobile home meter program • CPUC GRC focused on infrastructure replacement • Transmission includes Tehachapi scope changes for FAA requirements and $360 million estimate for Chino Hills undergrounding $15.4 – $17.4 billion forecasted capital program 2014 – 2017 $4.1 $4.2 $4.6 $4.5 2014 2015 2016 2017 Distribution Transmission Generation Note: Forecasted capital spending subject to timely receipt of permitting, licensing, and regulatory approvals. Forecast range reflects an average variability of 12%.
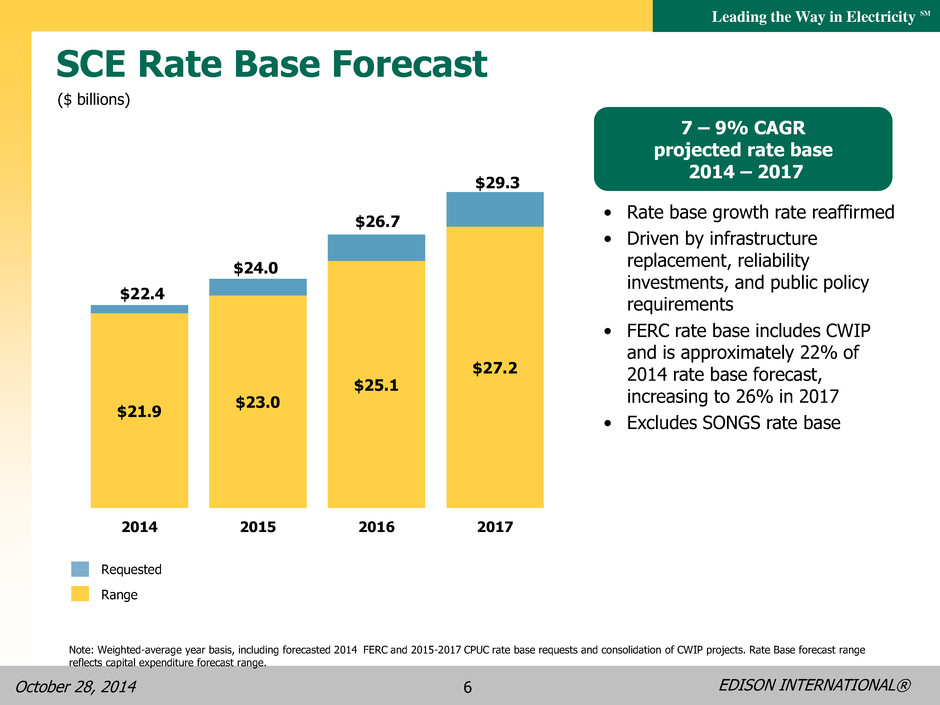
EDISON INTERNATIONAL® Leading the Way in Electricity SM October 28, 2014 6 ($ billions) SCE Rate Base Forecast • Rate base growth rate reaffirmed • Driven by infrastructure replacement, reliability investments, and public policy requirements • FERC rate base includes CWIP and is approximately 22% of 2014 rate base forecast, increasing to 26% in 2017 • Excludes SONGS rate base 7 – 9% CAGR projected rate base 2014 – 2017 Requested Range $21.9 $23.0 $25.1 $27.2 $22.4 $24.0 $26.7 $29.3 2014 2015 2016 2017 Note: Weighted-average year basis, including forecasted 2014 FERC and 2015-2017 CPUC rate base requests and consolidation of CWIP projects. Rate Base forecast range reflects capital expenditure forecast range.
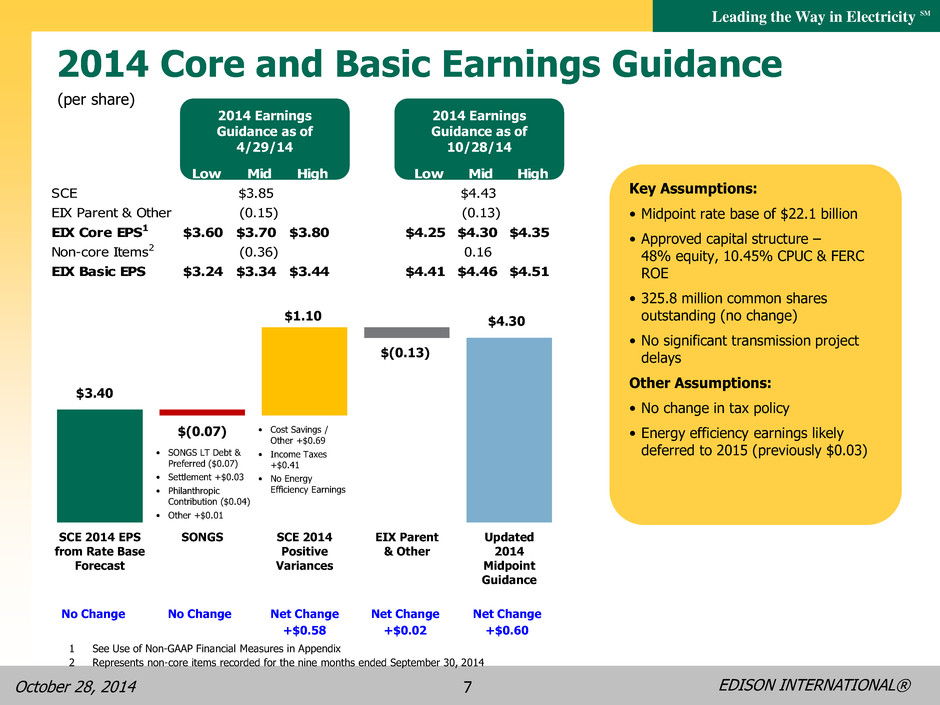
EDISON INTERNATIONAL® Leading the Way in Electricity SM October 28, 2014 7 2014 Core and Basic Earnings Guidance 2014 Earnings Guidance as of 10/28/14 2014 Earnings Guidance as of 4/29/14 Key Assumptions: • Midpoint rate base of $22.1 billion • Approved capital structure – 48% equity, 10.45% CPUC & FERC ROE • 325.8 million common shares outstanding (no change) • No significant transmission project delays Other Assumptions: • No change in tax policy • Energy efficiency earnings likely deferred to 2015 (previously $0.03) Low Mid High Low Mid High SCE $3.85 $4.43 EIX Parent & Other (0.15) (0.13) EIX Core EPS1 $3.60 $3.70 $3.80 $4.25 $4.30 $4.35 Non-core Items2 (0.36) 0.16 EIX Basic EPS $3.24 $3.34 $3.44 $4.41 $4.46 $4.51 1 See Use of Non-GAAP Financial Measures in Appendix 2 Represents non-core items recorded for the nine months ended September 30, 2014 $3.40 $(0.07) $1.10 $(0.13) $4.30 SCE 2014 EPS from Rate Base Forecast SONGS SCE 2014 Positive Variances EIX Parent & Other Updated 2014 Midpoint Guidance • Cost Savings / Other +$0.69 • Income Taxes +$0.41 • No Energy Efficiency Earnings • SONGS LT Debt & Preferred ($0.07) • Settlement +$0.03 • Philanthropic Contribution ($0.04) • Other +$0.01 No Change No Change Net Change +$0.58 Net Change +$0.02 Net Change +$0.60 (per share)
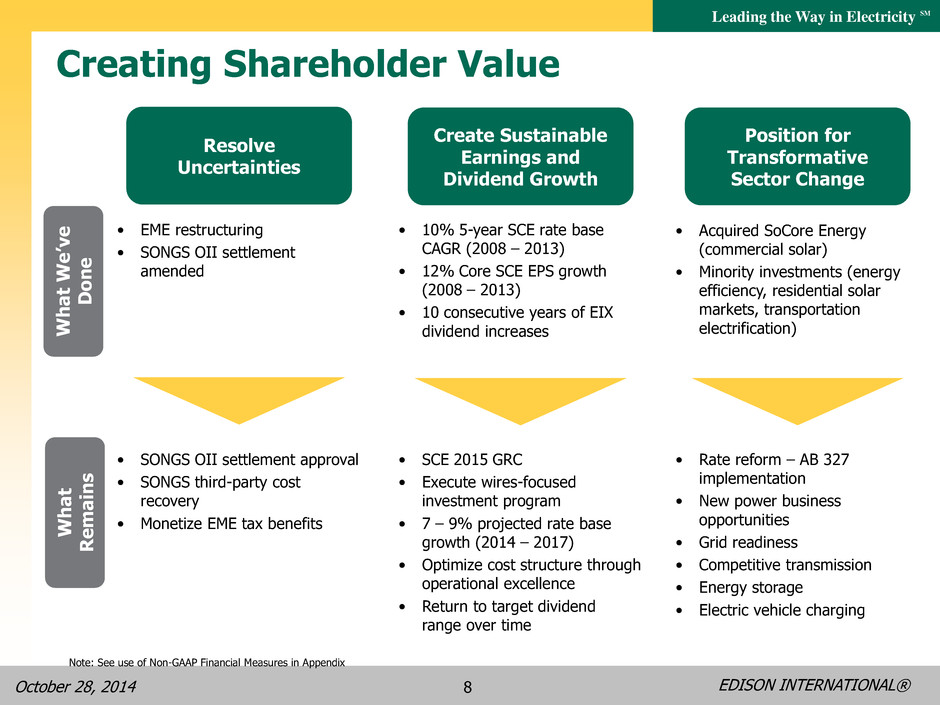
EDISON INTERNATIONAL® Leading the Way in Electricity SM October 28, 2014 8 Creating Shareholder Value Resolve Uncertainties Create Sustainable Earnings and Dividend Growth Position for Transformative Sector Change • EME restructuring • SONGS OII settlement amended • 10% 5-year SCE rate base CAGR (2008 – 2013) • 12% Core SCE EPS growth (2008 – 2013) • 10 consecutive years of EIX dividend increases • Acquired SoCore Energy (commercial solar) • Minority investments (energy efficiency, residential solar markets, transportation electrification) • SONGS OII settlement approval • SONGS third-party cost recovery • Monetize EME tax benefits • SCE 2015 GRC • Execute wires-focused investment program • 7 – 9% projected rate base growth (2014 – 2017) • Optimize cost structure through operational excellence • Return to target dividend range over time • Rate reform – AB 327 implementation • New power business opportunities • Grid readiness • Competitive transmission • Energy storage • Electric vehicle charging What W e ’ve D on e What R e m a in s Note: See use of Non-GAAP Financial Measures in Appendix
EDISON INTERNATIONAL® Leading the Way in Electricity SM October 28, 2014 9 Appendix
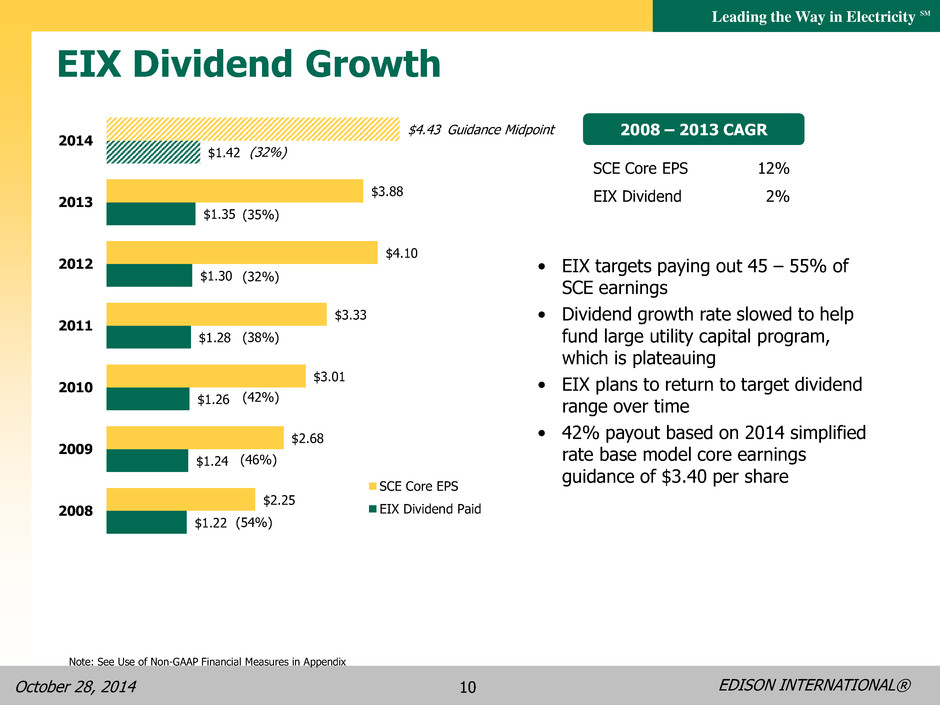
EDISON INTERNATIONAL® Leading the Way in Electricity SM October 28, 2014 10 $1.22 $1.24 $1.26 $1.28 $1.30 $1.35 $1.42 $2.25 $2.68 $3.01 $3.33 $4.10 $3.88 $4.43 2008 2009 2010 2011 2012 2013 2014 SCE Core EPS EIX Dividend Paid EIX Dividend Growth • EIX targets paying out 45 – 55% of SCE earnings • Dividend growth rate slowed to help fund large utility capital program, which is plateauing • EIX plans to return to target dividend range over time • 42% payout based on 2014 simplified rate base model core earnings guidance of $3.40 per share SCE Core EPS EIX Dividend 12% 2% 2008 – 2013 CAGR (32%) (38%) (42%) (46%) (54%) (35%) Guidance Midpoint Note: See Use of Non-GAAP Financial Measures in Appendix (32%)
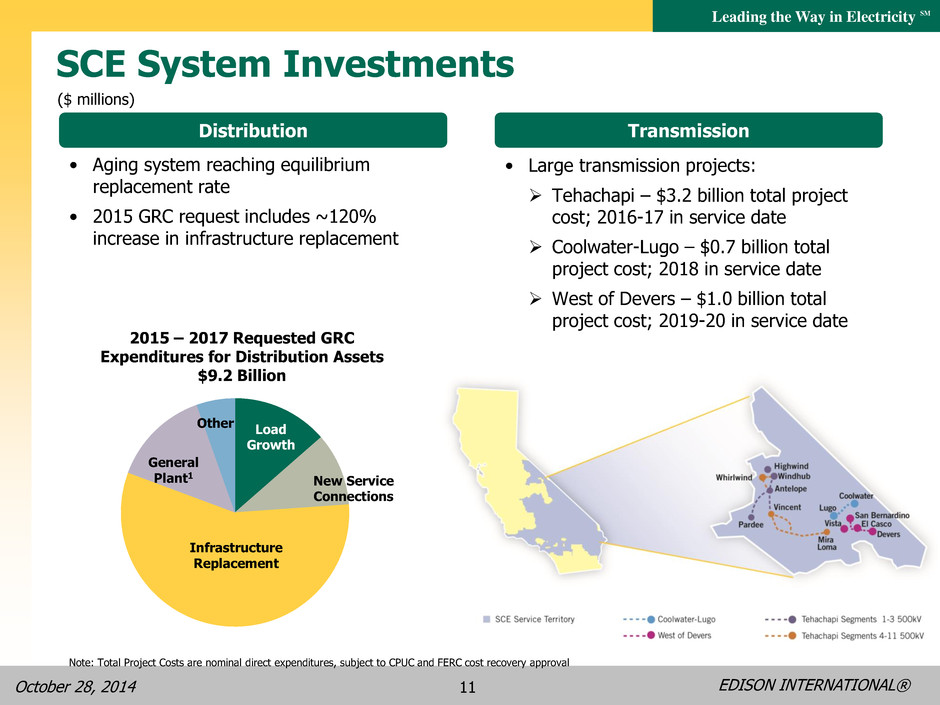
EDISON INTERNATIONAL® Leading the Way in Electricity SM October 28, 2014 11 Distribution ($ millions) SCE System Investments Transmission • Large transmission projects: Tehachapi – $3.2 billion total project cost; 2016-17 in service date Coolwater-Lugo – $0.7 billion total project cost; 2018 in service date West of Devers – $1.0 billion total project cost; 2019-20 in service date • Aging system reaching equilibrium replacement rate • 2015 GRC request includes ~120% increase in infrastructure replacement 2015 – 2017 Requested GRC Expenditures for Distribution Assets $9.2 Billion Load Growth New Service Connections Infrastructure Replacement General Plant1 Other Note: Total Project Costs are nominal direct expenditures, subject to CPUC and FERC cost recovery approval
EDISON INTERNATIONAL® Leading the Way in Electricity SM October 28, 2014 12 SCE Growth Drivers Beyond 2017 Infrastructure Reliability Investment • Sustained level of infrastructure investment required until equilibrium replacement rates are achieved - includes underground cable, poles, switches, and transformers1 Grid Readiness • Accelerate automation and control technology at optimal locations to manage two-way power flows with more dynamic voltage control • Distribution Resource Plan required under AB 327 to identify optimal locations, additional spending, and barriers to deploying distributed energy resources – due to CPUC Q3 2015 Transmission • California ISO 2013-2014 Transmission Plan2 - approved Mesa Loop-in Project (system reliability post-SONGS and renewables integration) with target in-service date of December 31, 2020 • Two existing projects incorporated from prior Transmission Plans in service beyond 2017 include Coolwater-Lugo (2018) and West of Devers (2019-2020) Energy Storage • 290 MW utility owned investment opportunity 2015-2024 Other California Public Policy Requirements and Enabling Projects • Electric vehicle charging infrastructure • Transportation electrification • Renewables mandates beyond 33% 1 Source: A.13-11-0032015 GRC – SCE-01 Policy testimony; equilibrium replacement rate defined as equipment population divided by mean time to failure for type of equipment 2 Approved by the California ISO Board of Governors March 20, 2014
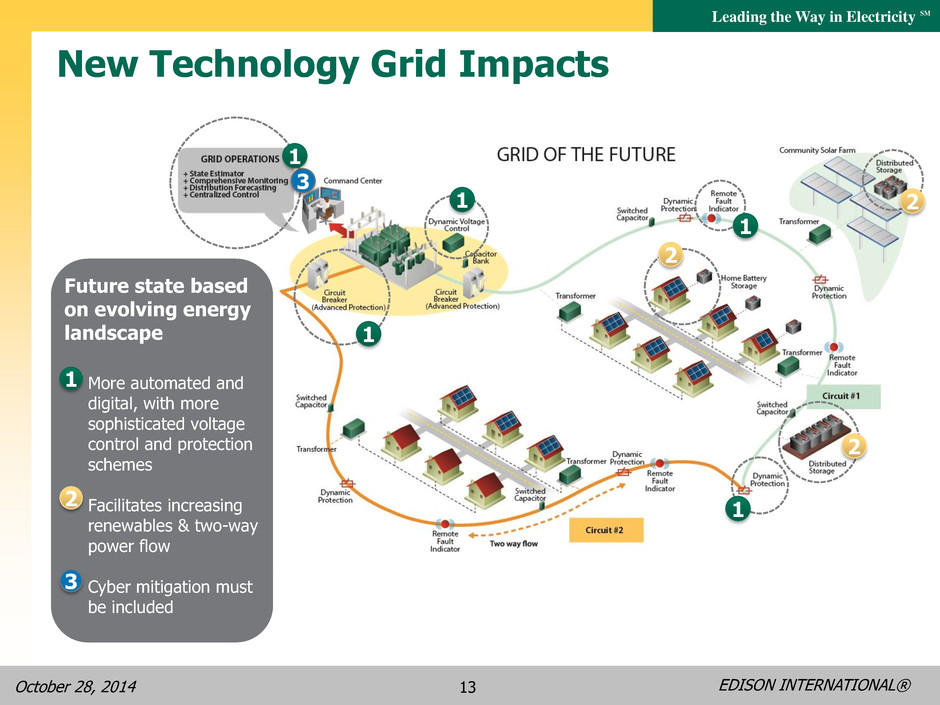
EDISON INTERNATIONAL® Leading the Way in Electricity SM October 28, 2014 13 2 1 3 1 1 1 2 2 New Technology Grid Impacts Future state based on evolving energy landscape More automated and digital, with more sophisticated voltage control and protection schemes Facilitates increasing renewables & two-way power flow Cyber mitigation must be included 1 2 3 1
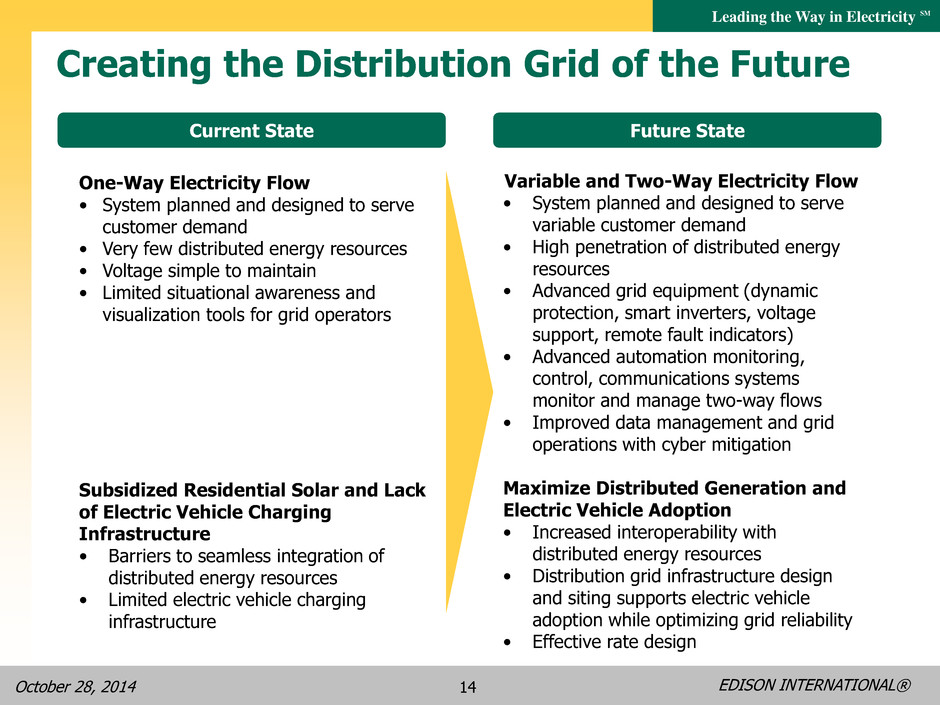
EDISON INTERNATIONAL® Leading the Way in Electricity SM October 28, 2014 14 Creating the Distribution Grid of the Future One-Way Electricity Flow • System planned and designed to serve customer demand • Very few distributed energy resources • Voltage simple to maintain • Limited situational awareness and visualization tools for grid operators Subsidized Residential Solar and Lack of Electric Vehicle Charging Infrastructure • Barriers to seamless integration of distributed energy resources • Limited electric vehicle charging infrastructure Current State Future State Variable and Two-Way Electricity Flow • System planned and designed to serve variable customer demand • High penetration of distributed energy resources • Advanced grid equipment (dynamic protection, smart inverters, voltage support, remote fault indicators) • Advanced automation monitoring, control, communications systems monitor and manage two-way flows • Improved data management and grid operations with cyber mitigation Maximize Distributed Generation and Electric Vehicle Adoption • Increased interoperability with distributed energy resources • Distribution grid infrastructure design and siting supports electric vehicle adoption while optimizing grid reliability • Effective rate design
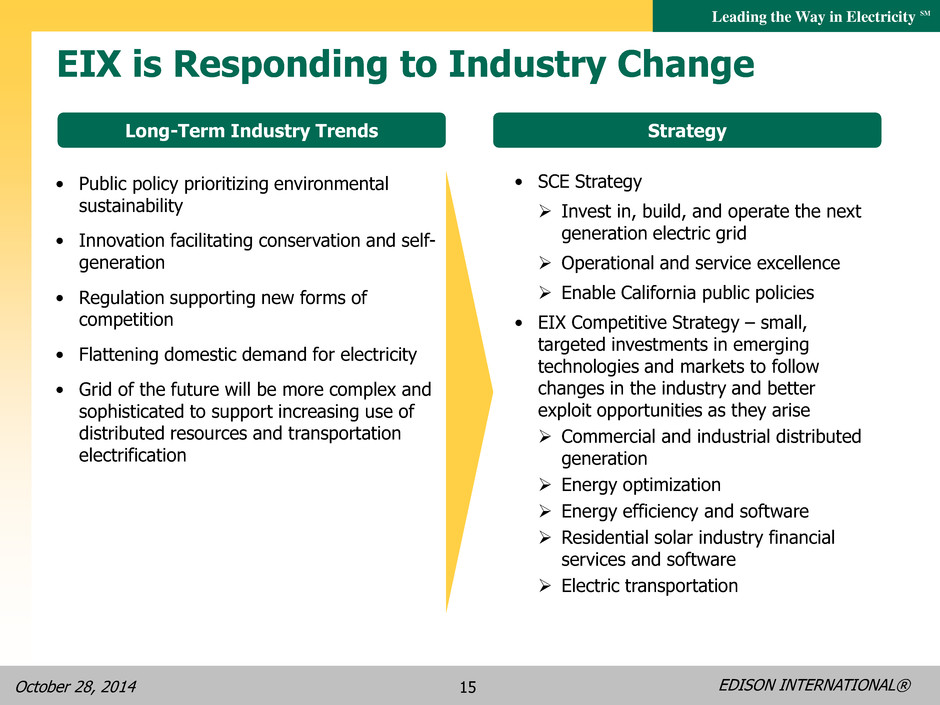
EDISON INTERNATIONAL® Leading the Way in Electricity SM October 28, 2014 15 EIX is Responding to Industry Change • Public policy prioritizing environmental sustainability • Innovation facilitating conservation and self- generation • Regulation supporting new forms of competition • Flattening domestic demand for electricity • Grid of the future will be more complex and sophisticated to support increasing use of distributed resources and transportation electrification • SCE Strategy Invest in, build, and operate the next generation electric grid Operational and service excellence Enable California public policies • EIX Competitive Strategy – small, targeted investments in emerging technologies and markets to follow changes in the industry and better exploit opportunities as they arise Commercial and industrial distributed generation Energy optimization Energy efficiency and software Residential solar industry financial services and software Electric transportation Long-Term Industry Trends Strategy
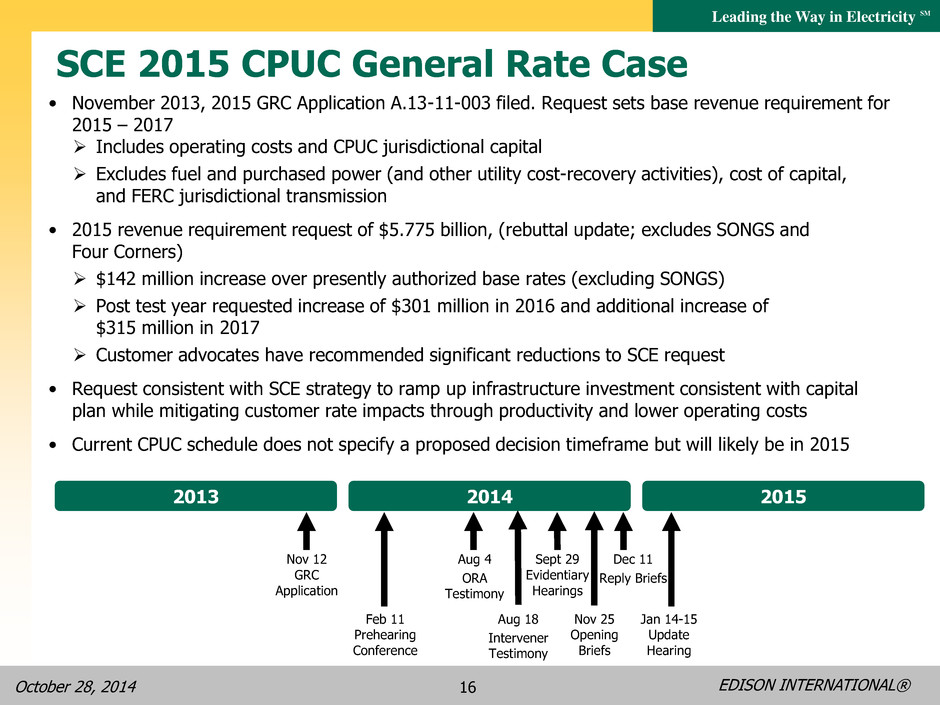
EDISON INTERNATIONAL® Leading the Way in Electricity SM October 28, 2014 16 SCE 2015 CPUC General Rate Case • November 2013, 2015 GRC Application A.13-11-003 filed. Request sets base revenue requirement for 2015 – 2017 Includes operating costs and CPUC jurisdictional capital Excludes fuel and purchased power (and other utility cost-recovery activities), cost of capital, and FERC jurisdictional transmission • 2015 revenue requirement request of $5.775 billion, (rebuttal update; excludes SONGS and Four Corners) $142 million increase over presently authorized base rates (excluding SONGS) Post test year requested increase of $301 million in 2016 and additional increase of $315 million in 2017 Customer advocates have recommended significant reductions to SCE request • Request consistent with SCE strategy to ramp up infrastructure investment consistent with capital plan while mitigating customer rate impacts through productivity and lower operating costs • Current CPUC schedule does not specify a proposed decision timeframe but will likely be in 2015 Nov 12 GRC Application Aug 18 Intervener Testimony Sept 29 Evidentiary Hearings 2013 2014 Feb 11 Prehearing Conference Jan 14-15 Update Hearing 2015 Aug 4 ORA Testimony Nov 25 Opening Briefs Dec 11 Reply Briefs
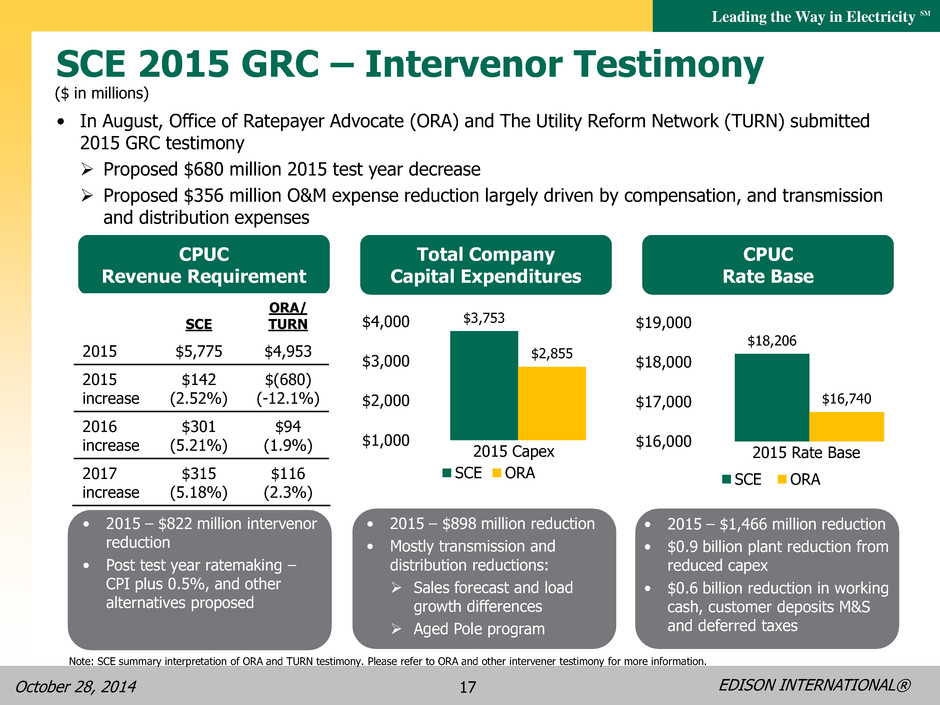
EDISON INTERNATIONAL® Leading the Way in Electricity SM October 28, 2014 17 SCE 2015 GRC – Intervenor Testimony • In August, Office of Ratepayer Advocate (ORA) and The Utility Reform Network (TURN) submitted 2015 GRC testimony Proposed $680 million 2015 test year decrease Proposed $356 million O&M expense reduction largely driven by compensation, and transmission and distribution expenses CPUC Revenue Requirement Total Company Capital Expenditures CPUC Rate Base Note: SCE summary interpretation of ORA and TURN testimony. Please refer to ORA and other intervener testimony for more information. SCE ORA/ TURN 2015 $5,775 $4,953 2015 increase $142 (2.52%) $(680) (-12.1%) 2016 increase $301 (5.21%) $94 (1.9%) 2017 increase $315 (5.18%) $116 (2.3%) • 2015 – $822 million intervenor reduction • Post test year ratemaking – CPI plus 0.5%, and other alternatives proposed $3,753 $2,855 $1,000 $2,000 $3,000 $4,000 2015 Capex SCE ORA ($ in millions) • 2015 – $898 million reduction • Mostly transmission and distribution reductions: Sales forecast and load growth differences Aged Pole program $18,206 $16,740 $16,000 $17,000 $18,000 $19,000 2015 Rate Base SCE ORA • 2015 – $1,466 million reduction • $0.9 billion plant reduction from reduced capex • $0.6 billion reduction in working cash, customer deposits M&S and deferred taxes
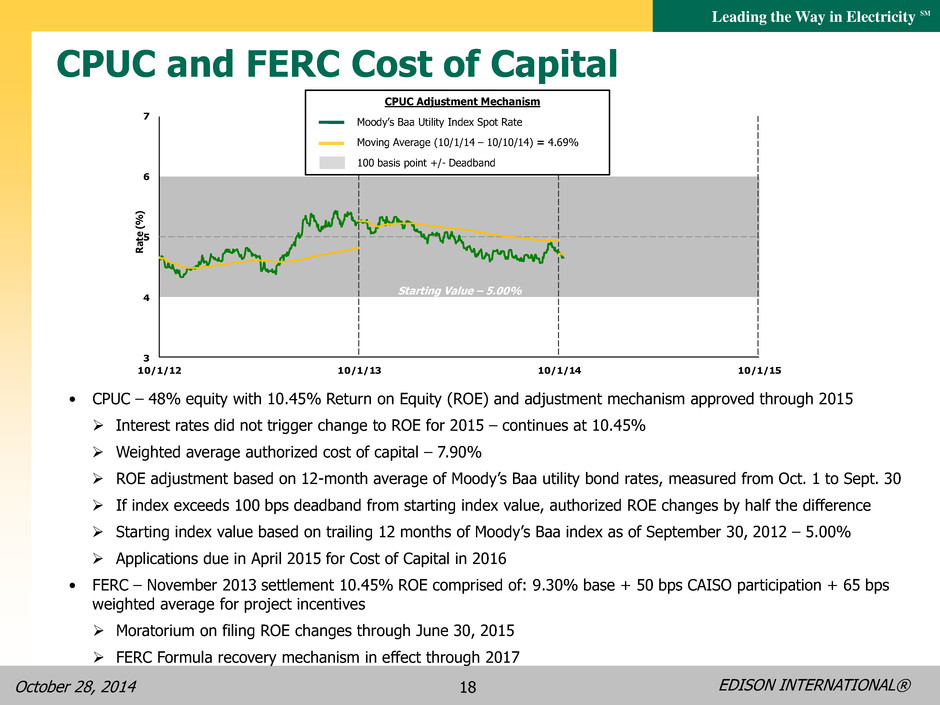
EDISON INTERNATIONAL® Leading the Way in Electricity SM October 28, 2014 18 CPUC and FERC Cost of Capital • CPUC – 48% equity with 10.45% Return on Equity (ROE) and adjustment mechanism approved through 2015 Interest rates did not trigger change to ROE for 2015 – continues at 10.45% Weighted average authorized cost of capital – 7.90% ROE adjustment based on 12-month average of Moody’s Baa utility bond rates, measured from Oct. 1 to Sept. 30 If index exceeds 100 bps deadband from starting index value, authorized ROE changes by half the difference Starting index value based on trailing 12 months of Moody’s Baa index as of September 30, 2012 – 5.00% Applications due in April 2015 for Cost of Capital in 2016 • FERC – November 2013 settlement 10.45% ROE comprised of: 9.30% base + 50 bps CAISO participation + 65 bps weighted average for project incentives Moratorium on filing ROE changes through June 30, 2015 FERC Formula recovery mechanism in effect through 2017 3 4 5 6 7 10/1/12 10/1/13 10/1/14 10/1/15 Ra te (% ) CPUC Adjustment Mechanism Moody’s Baa Utility Index Spot Rate Moving Average (10/1/14 – 10/10/14) = 4.69% 100 basis point +/- Deadband Starting Value – 5.00%
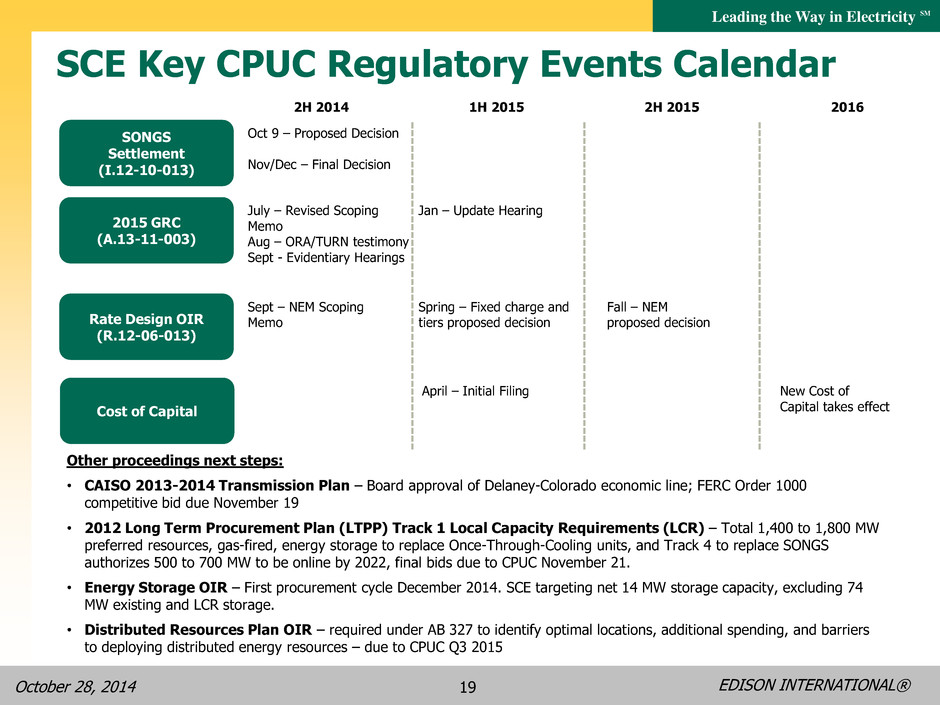
EDISON INTERNATIONAL® Leading the Way in Electricity SM October 28, 2014 19 SCE Key CPUC Regulatory Events Calendar Rate Design OIR (R.12-06-013) 2015 GRC (A.13-11-003) 2H 2014 1H 2015 2H 2015 2016 SONGS Settlement (I.12-10-013) Other proceedings next steps: • CAISO 2013-2014 Transmission Plan – Board approval of Delaney-Colorado economic line; FERC Order 1000 competitive bid due November 19 • 2012 Long Term Procurement Plan (LTPP) Track 1 Local Capacity Requirements (LCR) – Total 1,400 to 1,800 MW preferred resources, gas-fired, energy storage to replace Once-Through-Cooling units, and Track 4 to replace SONGS authorizes 500 to 700 MW to be online by 2022, final bids due to CPUC November 21. • Energy Storage OIR – First procurement cycle December 2014. SCE targeting net 14 MW storage capacity, excluding 74 MW existing and LCR storage. • Distributed Resources Plan OIR – required under AB 327 to identify optimal locations, additional spending, and barriers to deploying distributed energy resources – due to CPUC Q3 2015 July – Revised Scoping Memo Aug – ORA/TURN testimony Sept - Evidentiary Hearings Sept – NEM Scoping Memo Fall – NEM proposed decision Oct 9 – Proposed Decision Nov/Dec – Final Decision Cost of Capital April – Initial Filing New Cost of Capital takes effect Spring – Fixed charge and tiers proposed decision Jan – Update Hearing
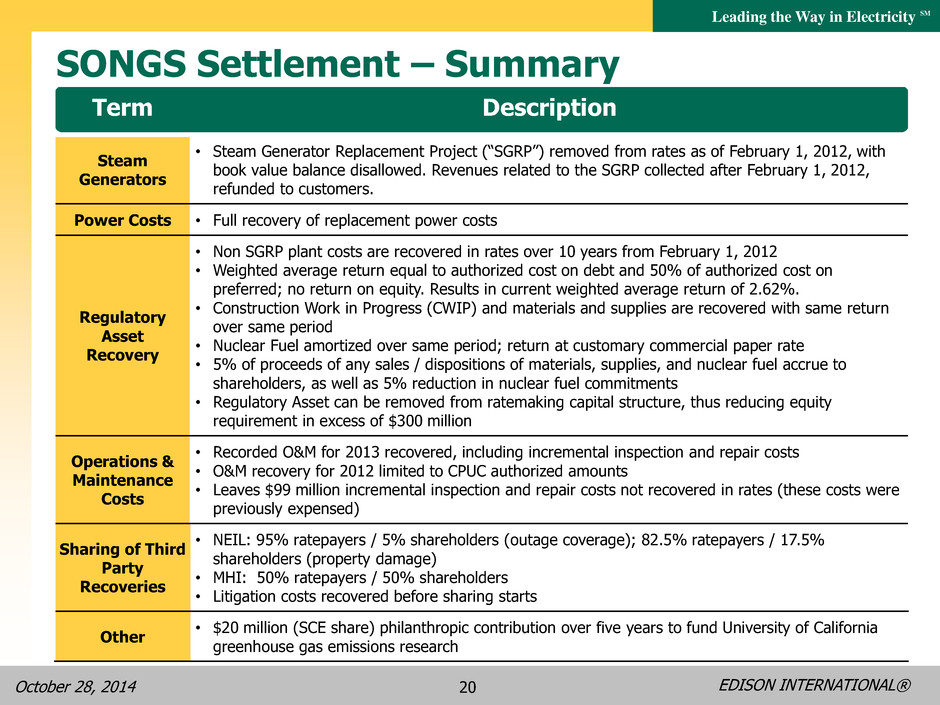
EDISON INTERNATIONAL® Leading the Way in Electricity SM October 28, 2014 20 SONGS Settlement – Summary Term Description Steam Generators • Steam Generator Replacement Project (“SGRP”) removed from rates as of February 1, 2012, with book value balance disallowed. Revenues related to the SGRP collected after February 1, 2012, refunded to customers. Power Costs • Full recovery of replacement power costs Regulatory Asset Recovery • Non SGRP plant costs are recovered in rates over 10 years from February 1, 2012 • Weighted average return equal to authorized cost on debt and 50% of authorized cost on preferred; no return on equity. Results in current weighted average return of 2.62%. • Construction Work in Progress (CWIP) and materials and supplies are recovered with same return over same period • Nuclear Fuel amortized over same period; return at customary commercial paper rate • 5% of proceeds of any sales / dispositions of materials, supplies, and nuclear fuel accrue to shareholders, as well as 5% reduction in nuclear fuel commitments • Regulatory Asset can be removed from ratemaking capital structure, thus reducing equity requirement in excess of $300 million Operations & Maintenance Costs • Recorded O&M for 2013 recovered, including incremental inspection and repair costs • O&M recovery for 2012 limited to CPUC authorized amounts • Leaves $99 million incremental inspection and repair costs not recovered in rates (these costs were previously expensed) Sharing of Third Party Recoveries • NEIL: 95% ratepayers / 5% shareholders (outage coverage); 82.5% ratepayers / 17.5% shareholders (property damage) • MHI: 50% ratepayers / 50% shareholders • Litigation costs recovered before sharing starts Other • $20 million (SCE share) philanthropic contribution over five years to fund University of California greenhouse gas emissions research
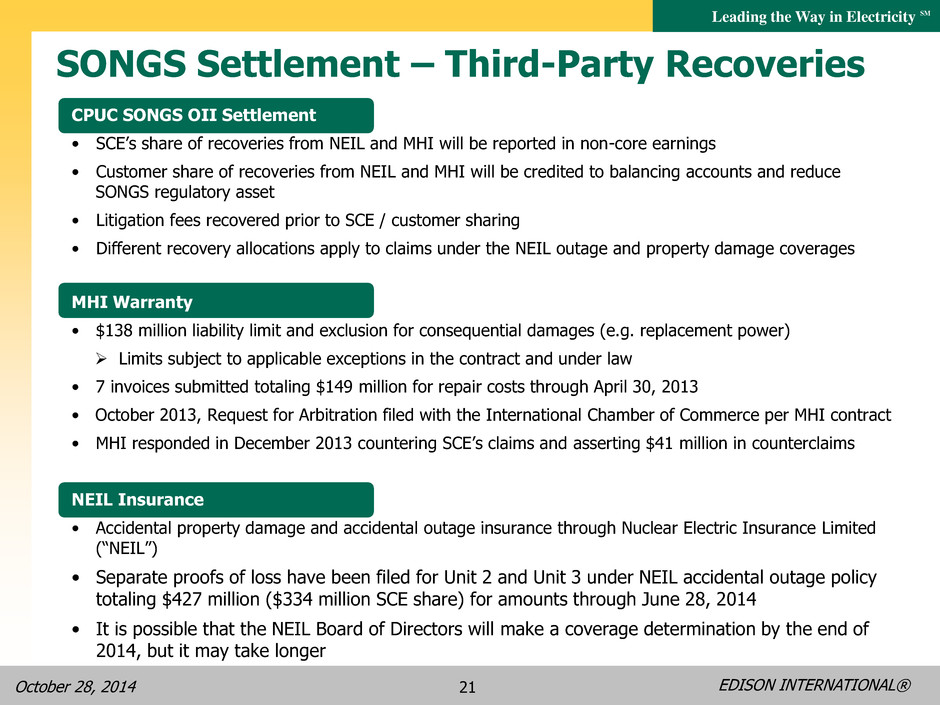
EDISON INTERNATIONAL® Leading the Way in Electricity SM October 28, 2014 21 SONGS Settlement – Third-Party Recoveries CPUC SONGS OII Settlement • SCE’s share of recoveries from NEIL and MHI will be reported in non-core earnings • Customer share of recoveries from NEIL and MHI will be credited to balancing accounts and reduce SONGS regulatory asset • Litigation fees recovered prior to SCE / customer sharing • Different recovery allocations apply to claims under the NEIL outage and property damage coverages MHI Warranty • $138 million liability limit and exclusion for consequential damages (e.g. replacement power) Limits subject to applicable exceptions in the contract and under law • 7 invoices submitted totaling $149 million for repair costs through April 30, 2013 • October 2013, Request for Arbitration filed with the International Chamber of Commerce per MHI contract • MHI responded in December 2013 countering SCE’s claims and asserting $41 million in counterclaims NEIL Insurance • Accidental property damage and accidental outage insurance through Nuclear Electric Insurance Limited (“NEIL”) • Separate proofs of loss have been filed for Unit 2 and Unit 3 under NEIL accidental outage policy totaling $427 million ($334 million SCE share) for amounts through June 28, 2014 • It is possible that the NEIL Board of Directors will make a coverage determination by the end of 2014, but it may take longer

EDISON INTERNATIONAL® Leading the Way in Electricity SM October 28, 2014 22 SONGS – Units 2 and 3 Decommissioning Decommissioning Trusts • Decommissioning Trust contributions recovered in rates approved by CPUC in triennial proceeding • Updated site-specific decommissioning cost study estimate (2014 dollars, all owners): $4.4 billion, or $106 million less than previous estimate SCE share of decommissioning costs is $3.3 billion (2014 dollars), or $2.9 billion (after cost escalation and discounting) SCE nuclear decommissioning trust funds total $3.1 billion after estimated taxes, or 104% funded • No additional nuclear decommissioning trust fund contributions are needed at this time Decommissioning Process • June 2013, Certification of Permanent Cessation of Power Operations submitted to NRC • All initial decommissioning activity phase plans and cost estimates will be provided by end of 2014 • Decommissioning involves three related activities: radiological decommissioning, non-radiological decommissioning and management of spent nuclear fuel • Access to the decommissioning trusts requires an order from the CPUC. SCE’s advice letter requesting interim access is pending before the commission.
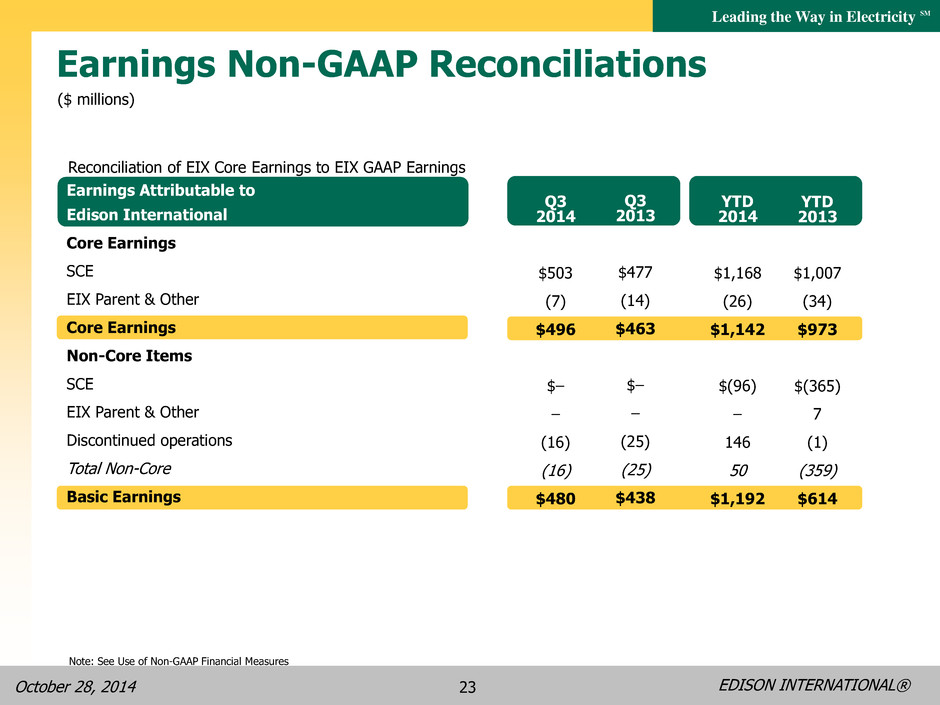
EDISON INTERNATIONAL® Leading the Way in Electricity SM October 28, 2014 23 Earnings Non-GAAP Reconciliations ($ millions) Reconciliation of EIX Core Earnings to EIX GAAP Earnings Earnings Attributable to Edison International Core Earnings SCE EIX Parent & Other Core Earnings Non-Core Items SCE EIX Parent & Other Discontinued operations Total Non-Core Basic Earnings Q3 2013 $477 (14) $463 $– – (25) (25) $438 Q3 2014 $503 (7) $496 $– – (16) (16) $480 YTD 2013 $1,007 (34) $973 $(365) 7 (1) (359) $614 YTD 2014 $1,168 (26) $1,142 $(96) – 146 50 $1,192 Note: See Use of Non-GAAP Financial Measures
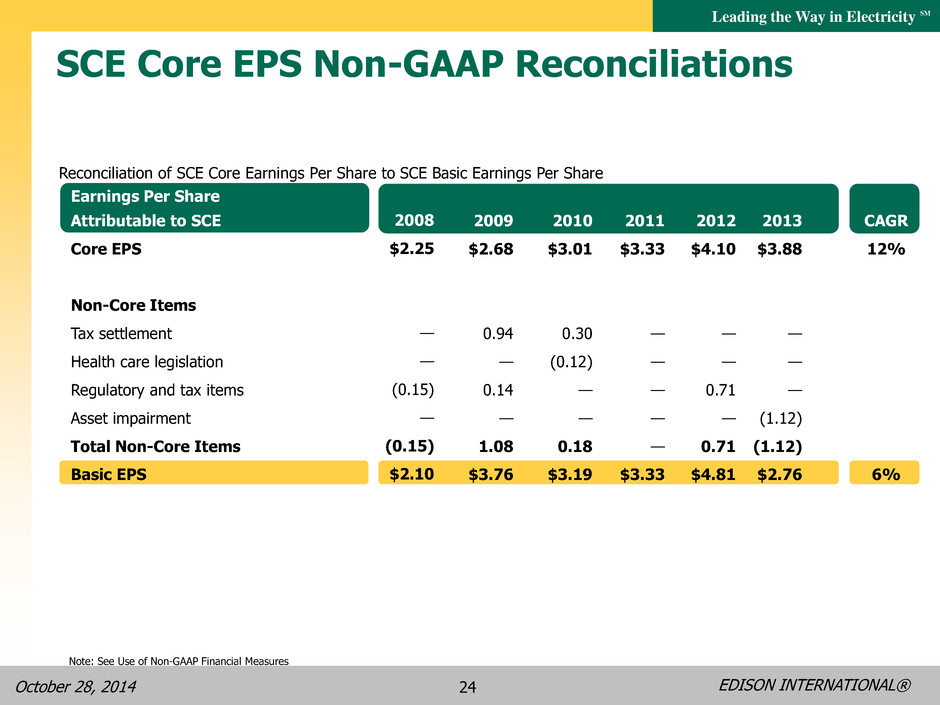
EDISON INTERNATIONAL® Leading the Way in Electricity SM October 28, 2014 24 Earnings Per Share Attributable to SCE Core EPS Non-Core Items Tax settlement Health care legislation Regulatory and tax items Asset impairment Total Non-Core Items Basic EPS SCE Core EPS Non-GAAP Reconciliations Reconciliation of SCE Core Earnings Per Share to SCE Basic Earnings Per Share 2008 $2.25 — — (0.15) — (0.15) $2.10 2009 $2.68 0.94 — 0.14 — 1.08 $3.76 2010 $3.01 0.30 (0.12) — — 0.18 $3.19 CAGR 12% 6% 2011 $3.33 — — — — — $3.33 2012 $4.10 — — 0.71 — 0.71 $4.81 2013 $3.88 — — — (1.12) (1.12) $2.76 Note: See Use of Non-GAAP Financial Measures
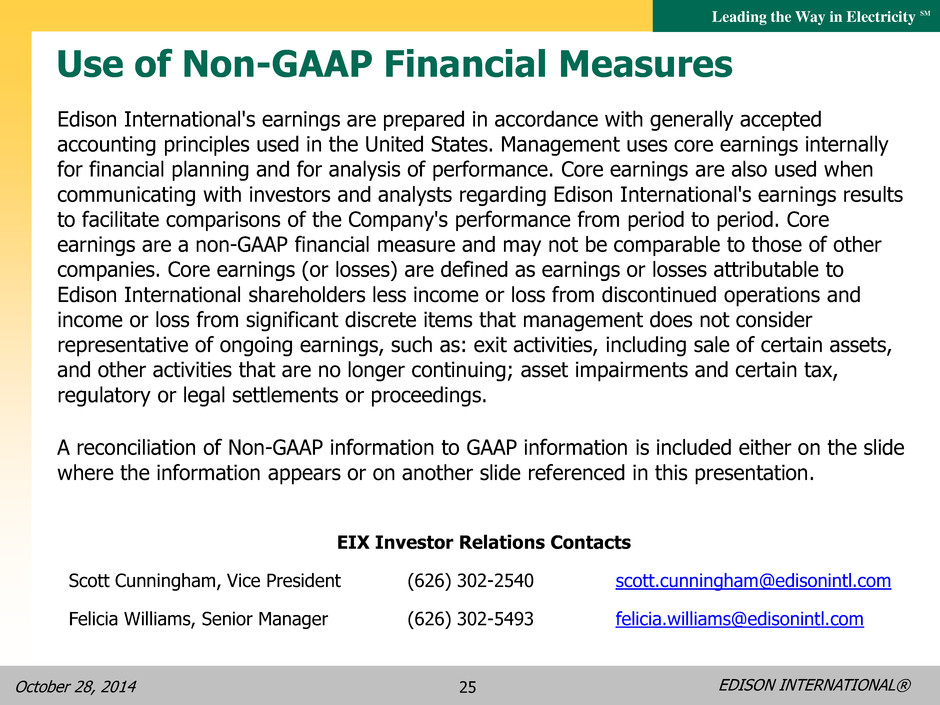
EDISON INTERNATIONAL® Leading the Way in Electricity SM October 28, 2014 25 Edison International's earnings are prepared in accordance with generally accepted accounting principles used in the United States. Management uses core earnings internally for financial planning and for analysis of performance. Core earnings are also used when communicating with investors and analysts regarding Edison International's earnings results to facilitate comparisons of the Company's performance from period to period. Core earnings are a non-GAAP financial measure and may not be comparable to those of other companies. Core earnings (or losses) are defined as earnings or losses attributable to Edison International shareholders less income or loss from discontinued operations and income or loss from significant discrete items that management does not consider representative of ongoing earnings, such as: exit activities, including sale of certain assets, and other activities that are no longer continuing; asset impairments and certain tax, regulatory or legal settlements or proceedings. A reconciliation of Non-GAAP information to GAAP information is included either on the slide where the information appears or on another slide referenced in this presentation. Use of Non-GAAP Financial Measures EIX Investor Relations Contacts Scott Cunningham, Vice President (626) 302-2540 scott.cunningham@edisonintl.com Felicia Williams, Senior Manager (626) 302-5493 felicia.williams@edisonintl.com