
February 23, 2016 Fourth Quarter and Full Year 2015 Financial Results Exhibit 99.3

February 23, 2016 1 Forward-Looking Statements Statements contained in this presentation about future performance, including, without limitation, operating results, capital expenditures, rate base growth, dividend policy, financial outlook, and other statements that are not purely historical, are forward-looking statements. These forward-looking statements reflect our current expectations; however, such statements involve risks and uncertainties. Actual results could differ materially from current expectations. These forward-looking statements represent our expectations only as of the date of this presentation, and Edison International assumes no duty to update them to reflect new information, events or circumstances. Important factors that could cause different results are discussed under the headings “Risk Factors” and “Management’s Discussion and Analysis” in Edison International’s Form 10- K, and other reports filed with the Securities and Exchange Commission, which are available on our website: www.edisoninvestor.com. These filings also provide additional information on historical and other factual data contained in this presentation. Exhibit 99.3

February 23, 2016 2 Q4 2015 Q4 2014 Variance Core Earnings Per Share (EPS)1 SCE $0.89 $1.09 $(0.20) EIX Parent & Other (0.01) (0.01) – Core EPS1 $0.88 $1.08 $(0.20) Non-Core Items2 SCE $(1.14) $0.08 $(1.22) EIX Parent & Other 0.04 0.01 0.03 Discontinued Operations (0.02) 0.12 (0.14) Total Non-Core $(1.12) $0.21 $(1.33) Basic EPS $(0.24) $1.29 $(1.53) Diluted EPS $(0.24) $1.27 $(1.51) Key SCE Core EPS Drivers Lower revenue3,4 $(0.15) - GRC return on rate base - pole loading 0.08 - Lower GRC revenue – other (0.26) - FERC revenue and other 0.03 Lower O&M5 0.07 Lower net financing costs 0.03 Income taxes4,6 (0.15) Total $(0.20) Fourth Quarter Earnings Summary Key EIX Core EPS Drivers EIX Parent - lower expenses and income taxes $0.02 Edison Energy Group (EEG) (0.02) Total $ 1. See Earnings Non-GAAP Reconciliations and Use of Non-GAAP Financial Measures in Appendix 2. See 2015 Non-Core Items in Appendix 3. Excludes San Onofre revenue of $(0.08), which was offset by amortization of regulatory assets of $0.01, interest expense of $(0.02), O&M of $0.06, income taxes of $0.02 and other of $0.01 4. Excludes income tax benefits for tax repair deductions and cost of removal of $(0.45) as a result of the 2015 GRC Decision 5. Includes ex-parte penalty of $(0.05) recorded in 2015 6. Includes $(0.15) of incremental benefits for tax repair deductions recorded in 2014 Exhibit 99.3

February 23, 2016 3 2015 2014 Variance Core Earnings Per Share (EPS)1 SCE $4.20 $4.68 $(0.48) EIX Parent & Other (0.10) (0.09) (0.01) Core EPS1 $4.10 $4.59 $(0.49) Non-Core Items2 SCE $(1.14) $(0.22) $(0.92) EIX Parent & Other 0.06 0.01 0.05 Discontinued Operations 0.11 0.57 (0.46) Total Non-Core $(0.97) $0.36 $(1.33) Basic EPS $3.13 $4.95 $(1.82) Diluted EPS $3.10 $4.89 $(1.79) 2015 Earnings Summary 1. See Earnings Non-GAAP Reconciliations and Use of Non-GAAP Financial Measures in Appendix 2. See 2015 Non-Core Items in Appendix 3. Excludes San Onofre revenue of $0.07, which was offset by amortization of regulatory assets of $(0.24), interest expense of $(0.04), O&M of $0.17, and income taxes of $0.04 4. Excludes income tax benefits for tax repair deductions and cost of removal of $(0.81) as a result of the 2015 GRC Decision 5. Includes ex-parte penalty of $(0.05) recorded in 2015 6. Includes $(0.41) of incremental benefits for tax repair deductions recorded in 2014 7. Includes San Onofre impact of $(0.01) primarily due to sales tax refund related to replacement steam generators for the year ended December 31, 2014 Key SCE Core EPS Drivers Lower revenue3,4 $(0.25) - GRC return on rate base - pole loading 0.08 - Lower GRC revenue – other (0.47) - FERC revenue and other 0.14 Lower O&M5 0.05 Higher depreciation (0.12) Lower net financing costs 0.11 Income taxes4 (0.23) - 2015 change in uncertain tax positions 0.31 - 2014 change in uncertain tax positions (0.09) - Lower tax benefits6 (0.45) Property taxes and other7 (0.04) Total $(0.48) Key EIX Core EPS Drivers EIX Parent – lower expenses and income taxes $0.05 (0.03) (0.03) EEG – operating results and expenses Edison Mission Group (EMG) – income taxes Total $(0.01) Exhibit 99.3

February 23, 2016 4 2015 Core Earnings vs. Guidance Reconciliation $0.08 $0.08 $0.01 $0.06 $0.05 $4.10 November 9, 2015 Guidance Midpoint Additional Rate Base Return Lower O&M Costs Financing Benefits Income Taxes & Other EIX Parent & Other Variances 2015 Core EPS • Pole Loading – Equity Portion - $0.05 • Pole Loading – Debt & Preferred Portion - $0.03 • Bonus Depreciation - None Note: See Earnings Non-GAAP Reconciliations and Use of Non-GAAP Financial Measures in Appendix Total $3.82 SCE $3.97 EIX Parent & Other $(0.15) Exhibit 99.3
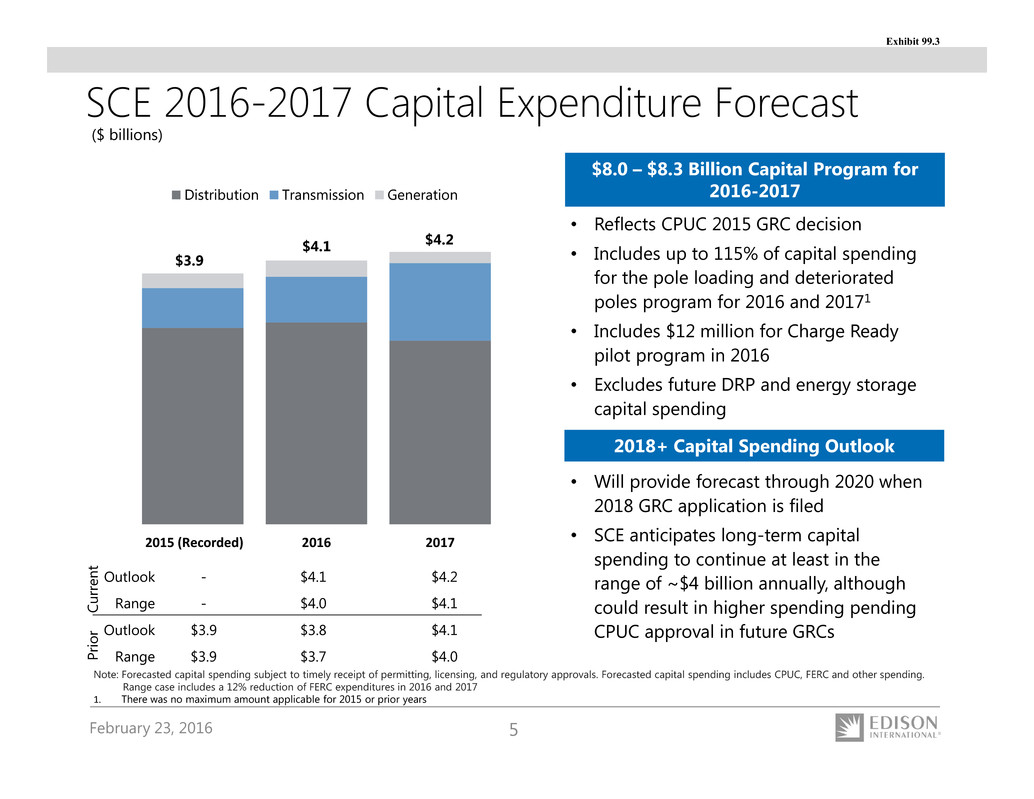
February 23, 2016 5 • Reflects CPUC 2015 GRC decision • Includes up to 115% of capital spending for the pole loading and deteriorated poles program for 2016 and 20171 • Includes $12 million for Charge Ready pilot program in 2016 • Excludes future DRP and energy storage capital spending SCE 2016-2017 Capital Expenditure Forecast Note: Forecasted capital spending subject to timely receipt of permitting, licensing, and regulatory approvals. Forecasted capital spending includes CPUC, FERC and other spending. Range case includes a 12% reduction of FERC expenditures in 2016 and 2017 1. There was no maximum amount applicable for 2015 or prior years ($ billions) Outlook - $4.1 $4.2 Range - $4.0 $4.1 Outlook $3.9 $3.8 $4.1 Range $3.9 $3.7 $4.0 $8.0 – $8.3 Billion Capital Program for 2016-2017 2018+ Capital Spending Outlook • Will provide forecast through 2020 when 2018 GRC application is filed • SCE anticipates long-term capital spending to continue at least in the range of ~$4 billion annually, although could result in higher spending pending CPUC approval in future GRCs C u r r e n t P r i o r $4.1 $4.2 2015 (Recorded) 2016 2017 Distribution Transmission Generation $3.9 Exhibit 99.3

February 23, 2016 6 SCE Large Transmission Projects Large Transmission Projects Tehachapi 4-11 • $2.5 billion total project cost; remaining investment $300 million • 2016-17 in service date West of Devers • $1.1 billion total project cost; remaining investment $1.0 billion • 2021 in service date; majority of capital spending post 2017 • CPUC final Environmental Impact Report proposed an alternative project • Expected regulatory approvals in mid-2016 (previously in early 2016) Mesa Substation • $600 million total project cost • 2020 in service date Note: Total Project Costs are nominal direct expenditures, subject to CPUC and FERC cost recovery approval FERC Cost of Capital Comparable to CPUC 10.45% ROE which includes: • Base ROE = 9.30% + CAISO participation + weighted average of individual project incentives • FERC Formula recovery mechanism in effect through December 31, 2017 Exhibit 99.3
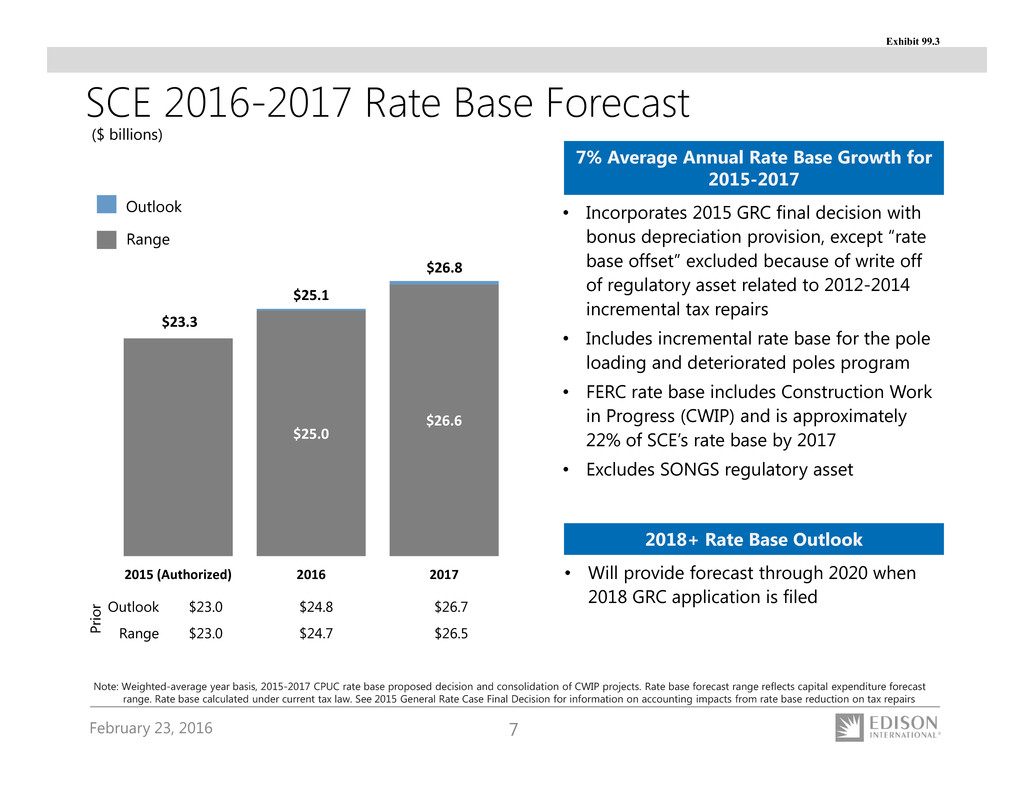
February 23, 2016 7 SCE 2016-2017 Rate Base Forecast • Incorporates 2015 GRC final decision with bonus depreciation provision, except “rate base offset” excluded because of write off of regulatory asset related to 2012-2014 incremental tax repairs • Includes incremental rate base for the pole loading and deteriorated poles program • FERC rate base includes Construction Work in Progress (CWIP) and is approximately 22% of SCE’s rate base by 2017 • Excludes SONGS regulatory asset ($ billions) Outlook Range Note: Weighted-average year basis, 2015-2017 CPUC rate base proposed decision and consolidation of CWIP projects. Rate base forecast range reflects capital expenditure forecast range. Rate base calculated under current tax law. See 2015 General Rate Case Final Decision for information on accounting impacts from rate base reduction on tax repairs 7% Average Annual Rate Base Growth for 2015-2017 2018+ Rate Base Outlook • Will provide forecast through 2020 when 2018 GRC application is filed $25.0 $26.6 $23.3 $25.1 $26.8 2015 (Authorized) 2016 2017 Outlook $23.0 $24.8 $26.7 Range $23.0 $24.7 $26.5 P r i o r Exhibit 99.3
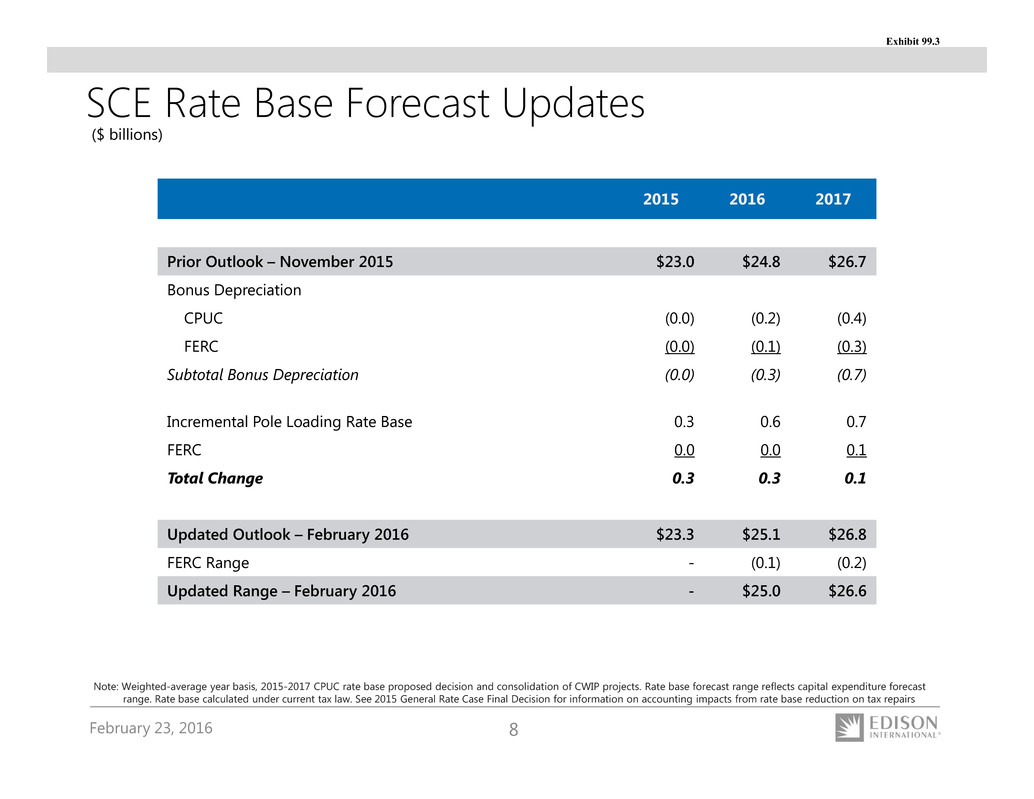
February 23, 2016 8 2015 2016 2017 Prior Outlook – November 2015 $23.0 $24.8 $26.7 Bonus Depreciation CPUC (0.0) (0.2) (0.4) FERC (0.0) (0.1) (0.3) Subtotal Bonus Depreciation (0.0) (0.3) (0.7) Incremental Pole Loading Rate Base 0.3 0.6 0.7 FERC 0.0 0.0 0.1 Total Change 0.3 0.3 0.1 Updated Outlook – February 2016 $23.3 $25.1 $26.8 FERC Range - (0.1) (0.2) Updated Range – February 2016 - $25.0 $26.6 SCE Rate Base Forecast Updates Note: Weighted-average year basis, 2015-2017 CPUC rate base proposed decision and consolidation of CWIP projects. Rate base forecast range reflects capital expenditure forecast range. Rate base calculated under current tax law. See 2015 General Rate Case Final Decision for information on accounting impacts from rate base reduction on tax repairs ($ billions) Exhibit 99.3

February 23, 2016 9 • Revenues based on GRC final decision • Weighted-average 2016 rate base of $25.1 billion (see Rate Base Forecast) • Energy efficiency earnings of $0.05 per share • Authorized CPUC capital structure – 48% equity; 10.45% ROE • FERC ROE comparable to CPUC ROE • No change in tax policy • 325.8 million common shares outstanding Key Assumptions (core) $3.87 $3.91 (0.18) 0.22 SCE 2016 EPS from Rate Base Forecast SCE Variances EIX Parent & Other 2016 Core EIX EPS Midpoint Guidance Low Mid High SCE $4.09 EIX Parent & Other (0.18) EIX Core EPS $3.81 $3.91 $4.01 Non-Core Items - - - EIX Basic EPS $3.81 $3.91 $4.01 • Productivity and financing benefits - $0.17 • Energy efficiency - $0.05 2016 Earnings Guidance as of February 23, 2016 Key Assumptions (non-core) • MHI arbitration decision not included 2016 Core and Basic Earnings Guidance Exhibit 99.3
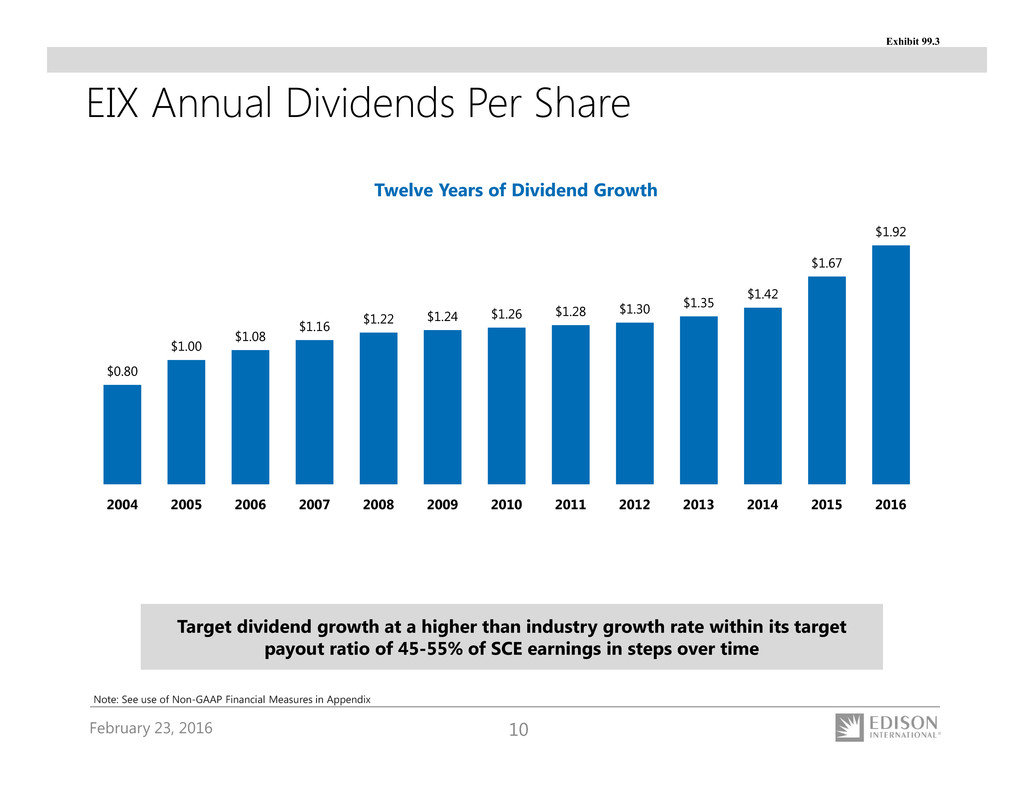
February 23, 2016 10 EIX Annual Dividends Per Share $0.80 $1.00 $1.08 $1.16 $1.22 $1.24 $1.26 $1.28 $1.30 $1.35 $1.42 $1.67 $1.92 2004 2005 2006 2007 2008 2009 2010 2011 2012 2013 2014 2015 2016 Note: See use of Non-GAAP Financial Measures in Appendix Twelve Years of Dividend Growth Target dividend growth at a higher than industry growth rate within its target payout ratio of 45-55% of SCE earnings in steps over time Exhibit 99.3

February 23, 2016 11 Appendix Exhibit 99.3

February 23, 2016 12 SCE Tax Memorandum Account • 2015 GRC decision established tax accounting memorandum account (TAMA), which tracks 2015 – 2017 tax benefits or costs associated with following events: - changes in tax accounting methods - changes in tax laws and regulations impacting depreciation or tax repair - changes in forecasted tax repairs deductions (actual vs. amounts authorized) - changes to depreciation or tax repair deductions as a result of an audit - any impact of a private letter ruling related to normalization • Once a year, the aggregate over or undercollection will be calculated and transferred back to or collected from customers • $212 million regulatory liability at December 31, 2015 Tax Repair Deductions Bonus Depreciation • No earnings impact associated with incremental tax repair deductions (positive or negative) • No rate base impact (positive or negative) • Flow through rate making applies • Earnings impacts occurs in the relevant year of the extension rather than next GRC cycle • Rate base impact from increase in deferred taxes offset by an increase in working cash mainly in 2015 • Normalization rate making applies Tax Policy Rate Base and Earnings Implications Exhibit 99.3

February 23, 2016 13 Other SCE Financial Topics Topic Update Comments December 31, 2015 June 30, 2015 December 31, 2014 Weighted-average equity percentage 49.9% 48.9% 48.4% Expect to remain above 48% regulatory minimum Maximum additional dividend payable to EIX $441 $215 $87 Liquidity - Short-term debt $49 $851 $667 - Credit facility availability $2.6 billion $1.8 billion $2.3 billion $2.75 billion facility SCE Employees 12,678 N/A 13,600 ($ millions, except where otherwise noted) Exhibit 99.3
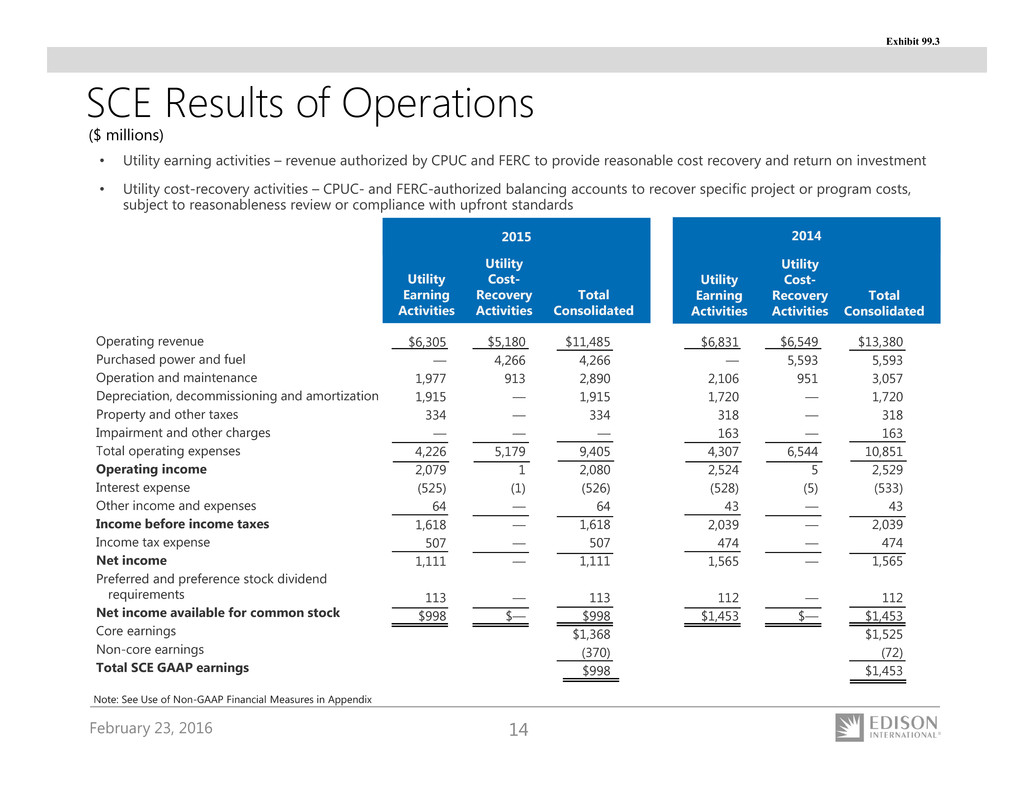
February 23, 2016 14 $6,305 — 1,977 1,915 334 — 4,226 2,079 (525) 64 1,618 507 1,111 113 $998 $5,180 4,266 913 — — — 5,179 1 (1) — — — — — $— $11,485 4,266 2,890 1,915 334 — 9,405 2,080 (526) 64 1,618 507 1,111 113 $998 $1,368 (370) $998 SCE Results of Operations • Utility earning activities – revenue authorized by CPUC and FERC to provide reasonable cost recovery and return on investment • Utility cost-recovery activities – CPUC- and FERC-authorized balancing accounts to recover specific project or program costs, subject to reasonableness review or compliance with upfront standards Utility Earning Activities Utility Cost- Recovery Activities Total Consolidated 2015 Utility Earning Activities Utility Cost- Recovery Activities Total Consolidated 2014 Operating revenue Purchased power and fuel Operation and maintenance Depreciation, decommissioning and amortization Property and other taxes Impairment and other charges Total operating expenses Operating income Interest expense Other income and expenses Income before income taxes Income tax expense Net income Preferred and preference stock dividend requirements Net income available for common stock Core earnings Non-core earnings Total SCE GAAP earnings Note: See Use of Non-GAAP Financial Measures in Appendix ($ millions) $6,831 — 2,106 1,720 318 163 4,307 2,524 (528) 43 2,039 474 1,565 112 $1,453 $6,549 5,593 951 — — — 6,544 5 (5) — — — — — $— $13,380 5,593 3,057 1,720 318 163 10,851 2,529 (533) 43 2,039 474 1,565 112 $1,453 $1,525 (72) $1,453 Exhibit 99.3

February 23, 2016 15 Q4 2015 Q4 2014 2015 2014 SCE Write down, impairment and other charges ) GRC Decision – write-down of regulatory assets $(1.18) $(1.18) SONGS settlement $0.08) $(0.22) NEIL insurance recoveries 0.04) 0.04) –) EIX Parent and Other Edison Capital sale of affordable housing projects 0.03) 0.03) –) Income from allocation of losses to tax equity investor 0.01) 0.01) 0.03) 0.01) Discontinued operations ) ) Income tax benefits from revised 2014 tax returns 0.08) Insurance recoveries 0.00.01) 0.06) Impact of EME settlement and other (0.03) 0.12) (0.(0.03) 0.57) Total Non-Core EPS $(1.12) $0.21) $(0.97) $0.36) 2015 Non-Core Items Note: See Earnings Non-GAAP Reconciliations and Use of Non-GAAP Financial Measures in Appendix Exhibit 99.3
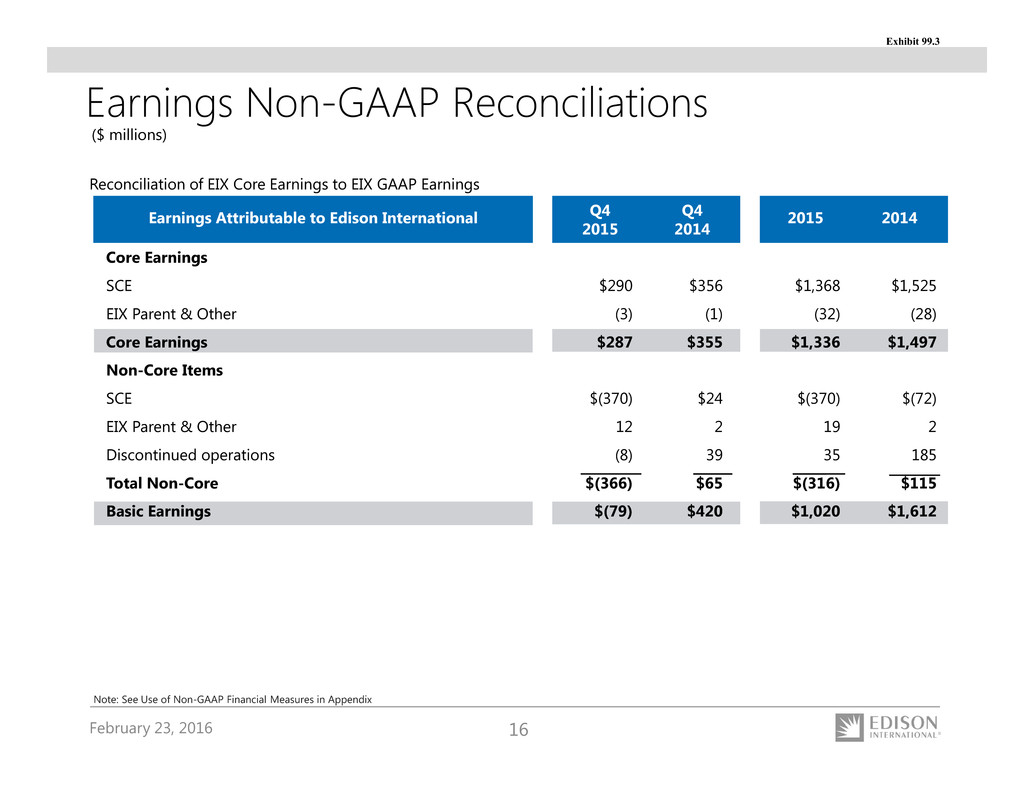
February 23, 2016 16 Earnings Non-GAAP Reconciliations Reconciliation of EIX Core Earnings to EIX GAAP Earnings Core Earnings SCE EIX Parent & Other Core Earnings Non-Core Items SCE EIX Parent & Other Discontinued operations Total Non-Core Basic Earnings $356 (1) $355 $24 2 39 $65 $420 $290 (3) $287 $(370) 12 (8) $(366) $(79) Note: See Use of Non-GAAP Financial Measures in Appendix $1,525 (28) $1,497 $(72) 2 185 $115 $1,612 $1,368 (32) $1,336 $(370) 19 35 $(316) $1,020 ($ millions) Q4 2014 Q4 2015 20142015Earnings Attributable to Edison International Exhibit 99.3
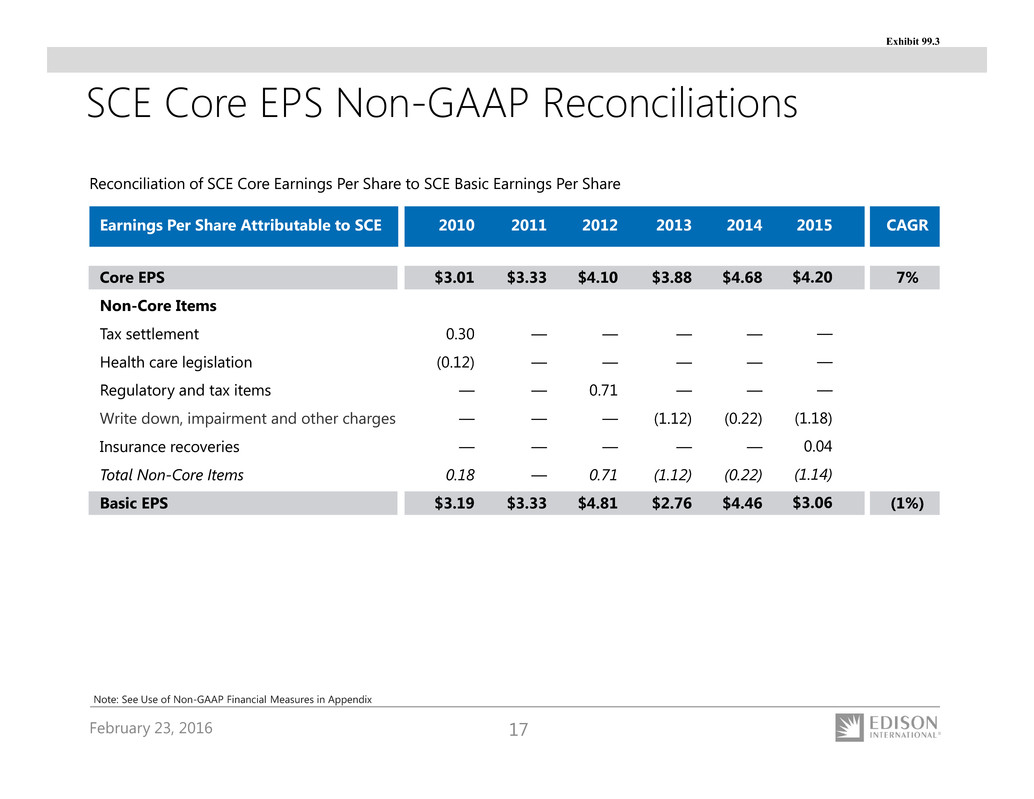
February 23, 2016 17 SCE Core EPS Non-GAAP Reconciliations Core EPS Non-Core Items Tax settlement Health care legislation Regulatory and tax items Write down, impairment and other charges Insurance recoveries Total Non-Core Items Basic EPS Reconciliation of SCE Core Earnings Per Share to SCE Basic Earnings Per Share $3.01 0.30 (0.12) — — — 0.18 $3.19 7% (1%) $3.33 — — — — — — $3.33 $4.10 — — 0.71 — — 0.71 $4.81 $3.88 — — — (1.12) — (1.12) $2.76 Note: See Use of Non-GAAP Financial Measures in Appendix $4.68 — — — (0.22) — (0.22) $4.46 $4.20 — — — (1.18) 0.04 (1.14) $3.06 Earnings Per Share Attributable to SCE 2010 CAGR2011 2012 2013 2014 2015 Exhibit 99.3
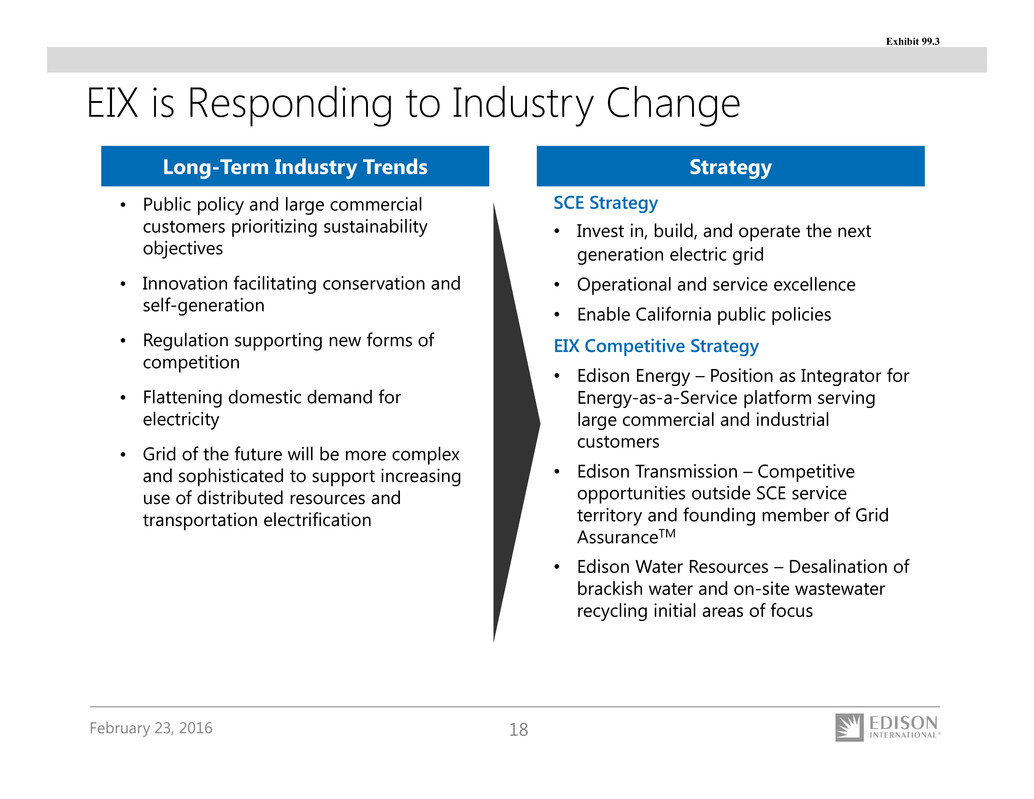
February 23, 2016 18 EIX is Responding to Industry Change • Public policy and large commercial customers prioritizing sustainability objectives • Innovation facilitating conservation and self-generation • Regulation supporting new forms of competition • Flattening domestic demand for electricity • Grid of the future will be more complex and sophisticated to support increasing use of distributed resources and transportation electrification SCE Strategy • Invest in, build, and operate the next generation electric grid • Operational and service excellence • Enable California public policies EIX Competitive Strategy • Edison Energy – Position as Integrator for Energy-as-a-Service platform serving large commercial and industrial customers • Edison Transmission – Competitive opportunities outside SCE service territory and founding member of Grid AssuranceTM • Edison Water Resources – Desalination of brackish water and on-site wastewater recycling initial areas of focus Long-Term Industry Trends Strategy Exhibit 99.3

February 23, 2016 19 • Create energy services that help simplify and optimize energy needs for large commercial & industrial customers: – Help customers better assess and capture the value of energy optimization, paving the way for greater third-party energy services – Help customers manage through technological / regulatory changes Evolving customer needs and uncertainty around changing technologies, regulation and business models create a business opportunity for a trusted advisor role Changing Customer Needs The Opportunity: Trusted Advisor and Solution Integrator Edison Energy Focus: Commercial & Industrial Exhibit 99.3

February 23, 2016 20 Edison Energy: Acquired Businesses Summary • Provides comprehensive renewable energy advisory and procurement services to leading Fortune 1000 companies, universities and municipalities • Created a proprietary market access platform where it typically procures energy for its clients by negotiating multiyear power purchase agreements that help control energy costs and improve the environmental performance of their operations • A leading provider of custom energy consulting services for large, multiple site, commercial and industrial energy users with a focus on enabling them to achieve significant energy cost savings and control • Collaborates with clients to help them make strategic decisions to achieve their overall business objectives, offering consulting services in energy procurement, supply and energy asset management, utility bill payment and invoice auditing, energy data management, energy price risk management, regulatory support, renewable energy integration and energy efficiency/demand response • A full-service energy consulting, engineering and project development firm specializing in the analysis, design, development and installation of energy efficiency projects, green initiatives for building systems, and power generation solutions for optimization and environmental control • Focused on building HVAC and controls, new energy technologies, renewable energy, power plant environmental systems, and energy awareness and education • Hundreds of solar solutions designed and installed across 16 states, SoCore offers multisite retailers, REITs and industrial companies portfolio-wide solar solutions that provide energy cost savings and carbon reduction opportunities Exhibit 99.3

February 23, 2016 21 Use of Non-GAAP Financial Measures Edison International's earnings are prepared in accordance with generally accepted accounting principles used in the United States. Management uses core earnings internally for financial planning and for analysis of performance. Core earnings are also used when communicating with investors and analysts regarding Edison International's earnings results to facilitate comparisons of the Company's performance from period to period. Core earnings are a non-GAAP financial measure and may not be comparable to those of other companies. Core earnings (or losses) are defined as earnings or losses attributable to Edison International shareholders less income or loss from discontinued operations and income or loss from significant discrete items that management does not consider representative of ongoing earnings, such as: exit activities, including sale of certain assets, and other activities that are no longer continuing; asset impairments and certain tax, regulatory or legal settlements or proceedings. A reconciliation of Non-GAAP information to GAAP information is included either on the slide where the information appears or on another slide referenced in this presentation. EIX Investor Relations Contact Scott Cunningham, Vice President (626) 302‐2540 scott.cunningham@edisonintl.com Allison Bahen, Senior Manager (626) 302‐5493 allison.bahen@edisonintl.com Exhibit 99.3


