Exhibit 99.3 Third Quarter and Year-to-Date 2019 Financial Results October 29, 2019

Forward-Looking Statements Statements contained in this presentation about future performance, including, without limitation, operating results, capital expenditures, rate base growth, dividend policy, financial outlook, and other statements that are not purely historical, are forward-looking statements. These forward-looking statements reflect our current expectations; however, such statements involve risks and uncertainties. Actual results could differ materially from current expectations. These forward-looking statements represent our expectations only as of the date of this presentation, and Edison International assumes no duty to update them to reflect new information, events or circumstances. Important factors that could cause different results include, but are not limited to the: • ability of SCE to recover its costs through regulated rates, including costs related to uninsured wildfire-related and mudslide-related liabilities and costs incurred to prevent future wildfires; • ability to obtain sufficient insurance at a reasonable cost, including insurance relating to SCE's nuclear facilities and wildfire-related claims, and to recover the costs of such insurance or, in the event liabilities exceed insured amounts, the ability to recover uninsured losses from customers or other parties; • risks associated with AB 1054 effectively mitigating the significant risk faced by California investor-owned utilities related to liability for damages arising from catastrophic wildfires where utility facilities are a substantial cause, including SCE's ability to maintain a valid safety certification, SCE's ability to recover uninsured wildfire-related costs from the Wildfire Insurance Fund, the longevity of the Wildfire Insurance Fund, and the CPUC's interpretation of and actions under AB 1054; • ability of SCE to implement its WMP, including effectively implementing Public Safety Power Shut-Offs when appropriate; • decisions and other actions by the CPUC, the FERC, the NRC and other regulatory and legislative authorities, including decisions and actions related to determinations of authorized rates of return or return on equity, the recoverability of wildfire-related and mudslide-related costs, wildfire mitigation efforts, and delays in regulatory and legislative actions; • ability of Edison International or SCE to borrow funds and access the bank and capital markets on reasonable terms; • actions by credit rating agencies to downgrade Edison International or SCE's credit ratings or to place those ratings on negative watch or outlook; • risks associated with the decommissioning of San Onofre, including those related to public opposition, permitting, governmental approvals, on-site storage of spent nuclear fuel, delays, contractual disputes, and cost overruns; • extreme weather-related incidents and other natural disasters (including earthquakes and events caused, or exacerbated, by climate change, such as wildfires), which could cause, among other things, public safety issues, property damage and operational issues; • risks associated with cost allocation resulting in higher rates for utility bundled service customers because of possible customer bypass or departure for other electricity providers such as CCAs and Electric Service Providers; • risks inherent in SCE's transmission and distribution infrastructure investment program, including those related to project site identification, public opposition, environmental mitigation, construction, permitting, power curtailment costs (payments due under power contracts in the event there is insufficient transmission to enable acceptance of power delivery), changes in the CAISO's transmission plans, and governmental approvals; and • risks associated with the operation of transmission and distribution assets and power generating facilities, including public and employee safety issues, the risk of utility assets causing or contributing to wildfires, failure, availability, efficiency, and output of equipment and facilities, and availability and cost of spare parts. Other important factors are discussed under the headings “Forward-Looking Statements”, “Risk Factors” and “Management’s Discussion and Analysis” in Edison International’s Form 10-K and other reports filed with the Securities and Exchange Commission, which are available on our website: www.edisoninvestor.com. These filings also provide additional information on historical and other factual data contained in this presentation. October 29, 2019 1
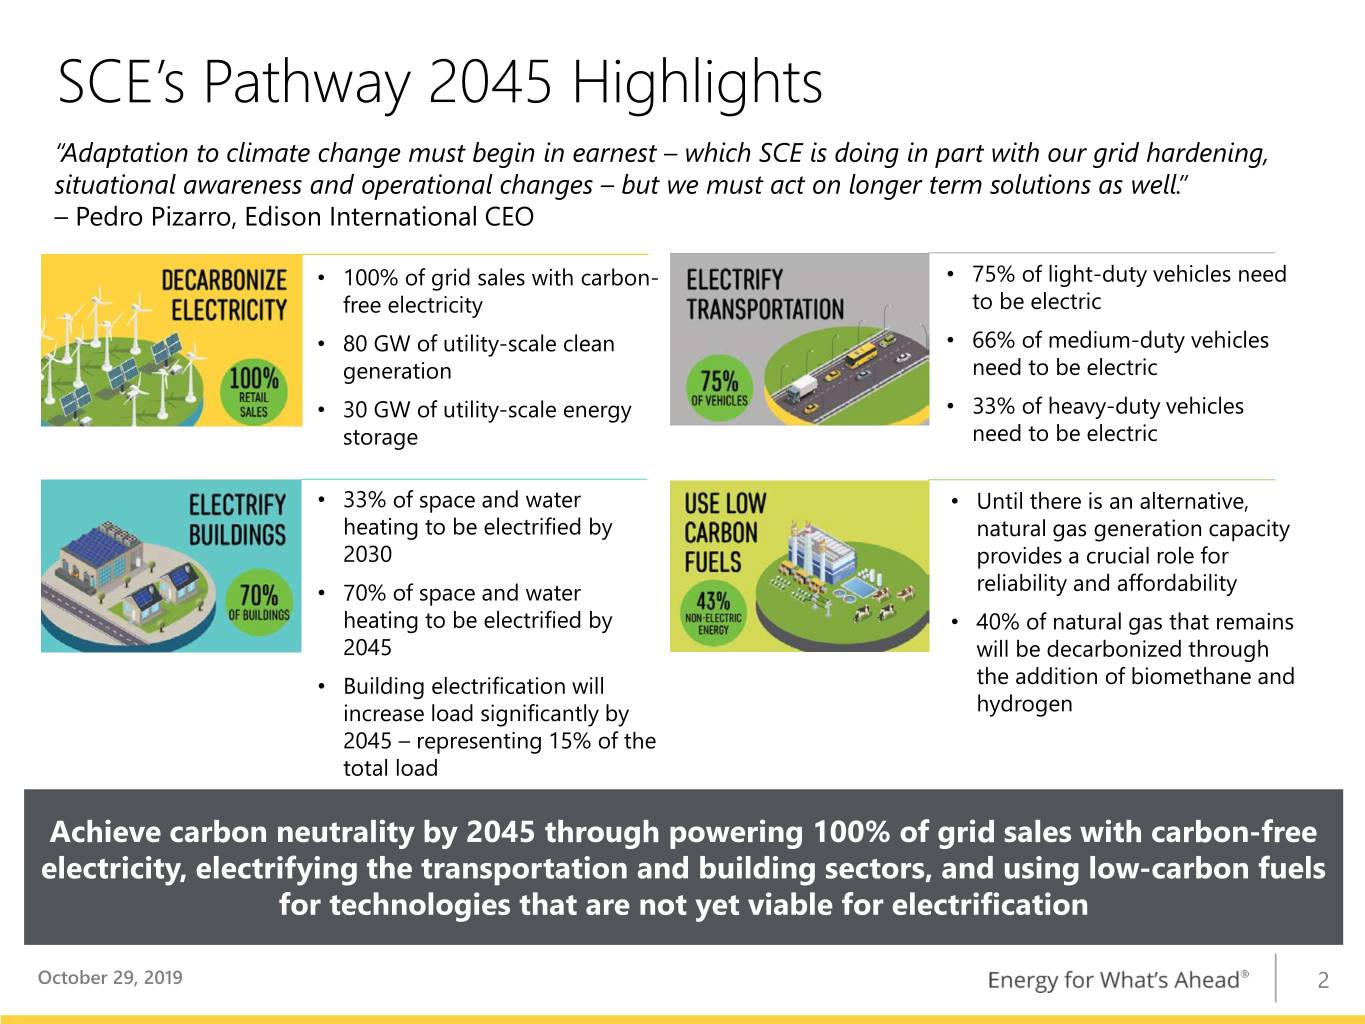
SCE’s Pathway 2045 Highlights “Adaptation to climate change must begin in earnest – which SCE is doing in part with our grid hardening, situational awareness and operational changes – but we must act on longer term solutions as well.” – Pedro Pizarro, Edison International CEO • 100% of grid sales with carbon- • 75% of light-duty vehicles need free electricity to be electric • 80 GW of utility-scale clean • 66% of medium-duty vehicles generation need to be electric • 30 GW of utility-scale energy • 33% of heavy-duty vehicles storage need to be electric • 33% of space and water • Until there is an alternative, heating to be electrified by natural gas generation capacity 2030 provides a crucial role for • 70% of space and water reliability and affordability heating to be electrified by • 40% of natural gas that remains 2045 will be decarbonized through • Building electrification will the addition of biomethane and increase load significantly by hydrogen 2045 – representing 15% of the total load Achieve carbon neutrality by 2045 through powering 100% of grid sales with carbon-free electricity, electrifying the transportation and building sectors, and using low-carbon fuels for technologies that are not yet viable for electrification October 29, 2019 2
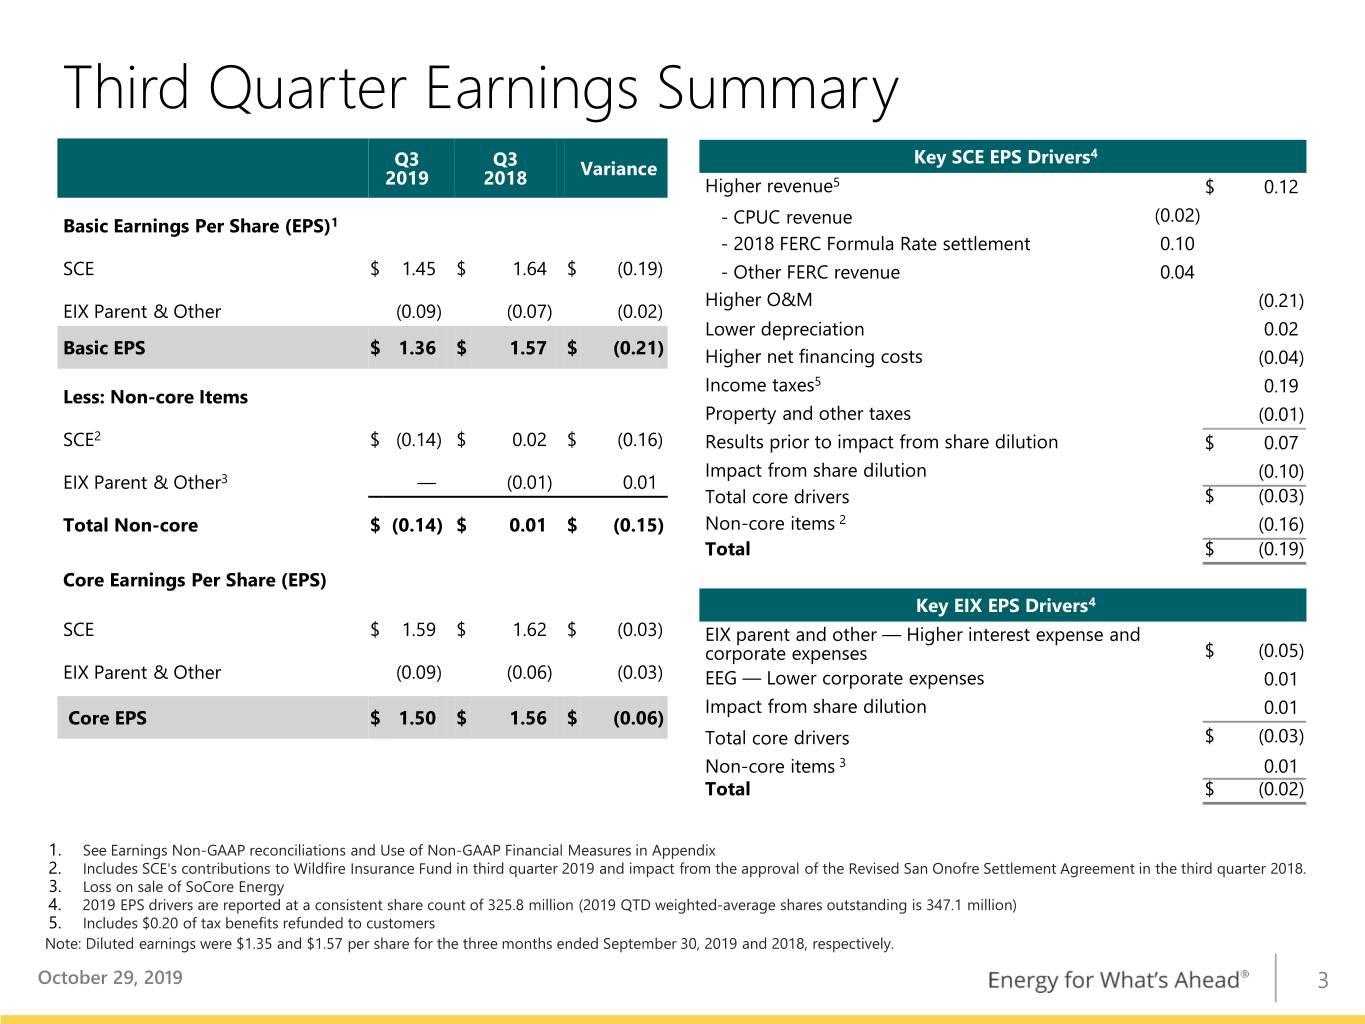
Third Quarter Earnings Summary Key SCE EPS Drivers4 Q3 Q3 Variance 2019 2018 Higher revenue5 $ 0.12 (0.02) Basic Earnings Per Share (EPS)1 - CPUC revenue - 2018 FERC Formula Rate settlement 0.10 SCE $ 1.45 $ 1.64 $ (0.19) - Other FERC revenue 0.04 Higher O&M (0.21) EIX Parent & Other (0.09) (0.07) (0.02) Lower depreciation 0.02 Basic EPS $ 1.36 $ 1.57 $ (0.21) Higher net financing costs (0.04) Income taxes5 0.19 Less: Non-core Items Property and other taxes (0.01) SCE2 $ (0.14) $ 0.02 $ (0.16) Results prior to impact from share dilution $ 0.07 Impact from share dilution (0.10) EIX Parent & Other3 — (0.01) 0.01 Total core drivers $ (0.03) Total Non-core $ (0.14) $ 0.01 $ (0.15) Non-core items 2 (0.16) Total $ (0.19) Core Earnings Per Share (EPS) Key EIX EPS Drivers4 SCE $ 1.59 $ 1.62 $ (0.03) EIX parent and other — Higher interest expense and corporate expenses $ (0.05) EIX Parent & Other (0.09) (0.06) (0.03) EEG — Lower corporate expenses 0.01 Impact from share dilution 0.01 Core EPS $ 1.50 $ 1.56 $ (0.06) Total core drivers $ (0.03) Non-core items 3 0.01 Total $ (0.02) 1. See Earnings Non-GAAP reconciliations and Use of Non-GAAP Financial Measures in Appendix 2. Includes SCE's contributions to Wildfire Insurance Fund in third quarter 2019 and impact from the approval of the Revised San Onofre Settlement Agreement in the third quarter 2018. 3. Loss on sale of SoCore Energy 4. 2019 EPS drivers are reported at a consistent share count of 325.8 million (2019 QTD weighted-average shares outstanding is 347.1 million) 5. Includes $0.20 of tax benefits refunded to customers Note: Diluted earnings were $1.35 and $1.57 per share for the three months ended September 30, 2019 and 2018, respectively. October 29, 2019 3
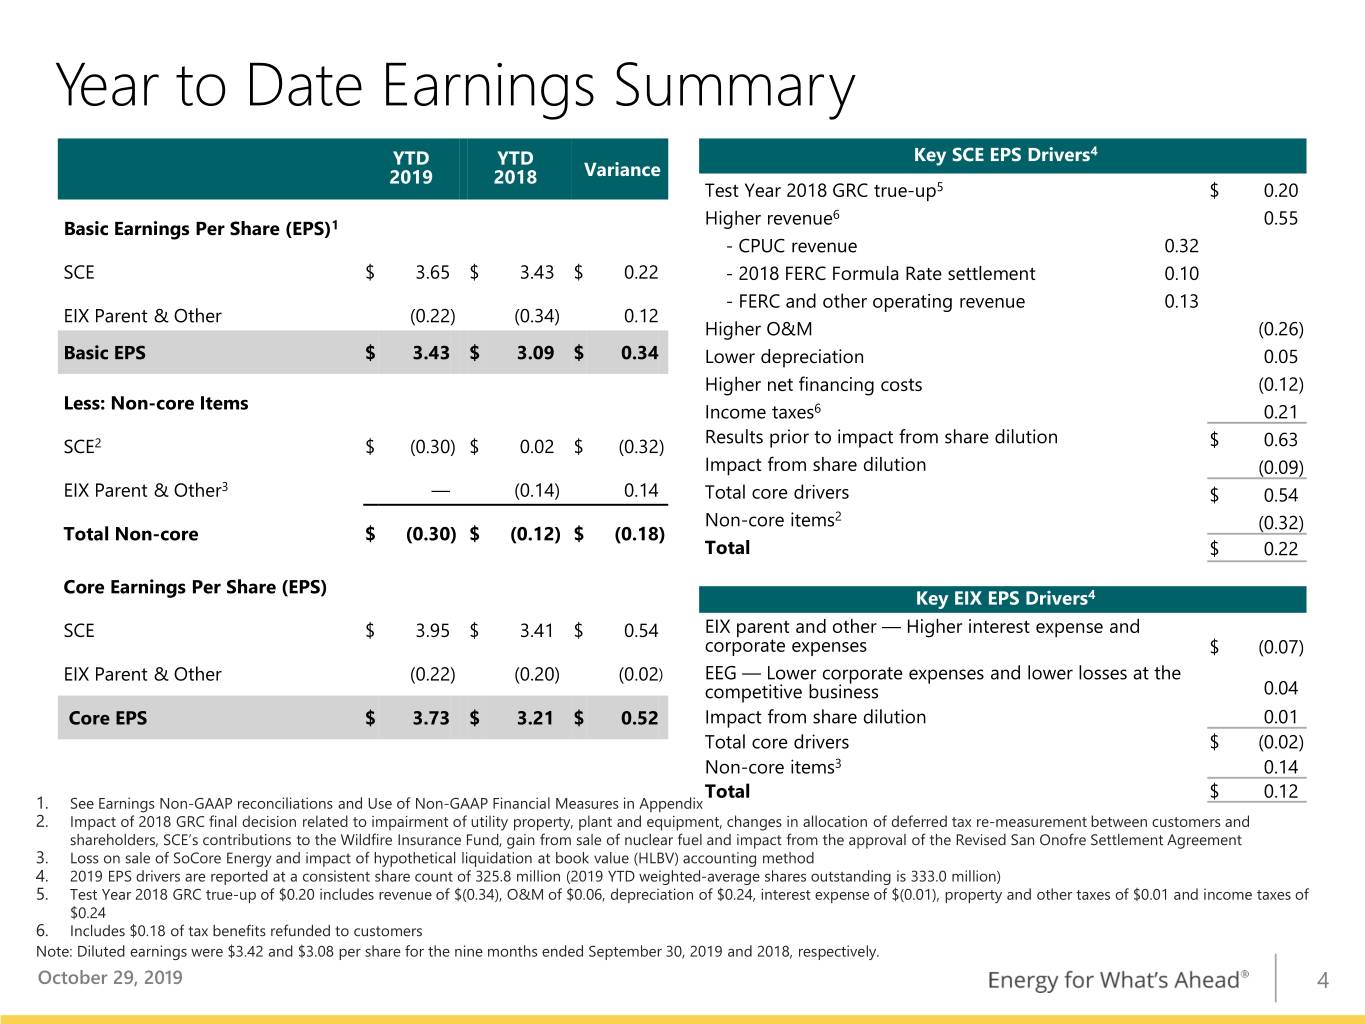
Year to Date Earnings Summary YTD YTD Key SCE EPS Drivers4 2019 2018 Variance Test Year 2018 GRC true-up5 $ 0.20 Higher revenue6 0.55 Basic Earnings Per Share (EPS)1 - CPUC revenue 0.32 SCE $ 3.65 $ 3.43 $ 0.22 - 2018 FERC Formula Rate settlement 0.10 - FERC and other operating revenue 0.13 EIX Parent & Other (0.22) (0.34) 0.12 Higher O&M (0.26) Basic EPS $ 3.43 $ 3.09 $ 0.34 Lower depreciation 0.05 Higher net financing costs (0.12) Less: Non-core Items Income taxes6 0.21 Results prior to impact from share dilution SCE2 $ (0.30) $ 0.02 $ (0.32) $ 0.63 Impact from share dilution (0.09) 3 EIX Parent & Other — (0.14) 0.14 Total core drivers $ 0.54 Non-core items2 (0.32) Total Non-core $ (0.30) $ (0.12) $ (0.18) Total $ 0.22 Core Earnings Per Share (EPS) Key EIX EPS Drivers4 SCE $ 3.95 $ 3.41 $ 0.54 EIX parent and other — Higher interest expense and corporate expenses $ (0.07) EIX Parent & Other (0.22) (0.20) (0.02) EEG — Lower corporate expenses and lower losses at the competitive business 0.04 Core EPS $ 3.73 $ 3.21 $ 0.52 Impact from share dilution 0.01 Total core drivers $ (0.02) Non-core items3 0.14 Total $ 0.12 1. See Earnings Non-GAAP reconciliations and Use of Non-GAAP Financial Measures in Appendix 2. Impact of 2018 GRC final decision related to impairment of utility property, plant and equipment, changes in allocation of deferred tax re-measurement between customers and shareholders, SCE’s contributions to the Wildfire Insurance Fund, gain from sale of nuclear fuel and impact from the approval of the Revised San Onofre Settlement Agreement 3. Loss on sale of SoCore Energy and impact of hypothetical liquidation at book value (HLBV) accounting method 4. 2019 EPS drivers are reported at a consistent share count of 325.8 million (2019 YTD weighted-average shares outstanding is 333.0 million) 5. Test Year 2018 GRC true-up of $0.20 includes revenue of $(0.34), O&M of $0.06, depreciation of $0.24, interest expense of $(0.01), property and other taxes of $0.01 and income taxes of $0.24 6. Includes $0.18 of tax benefits refunded to customers Note: Diluted earnings were $3.42 and $3.08 per share for the nine months ended September 30, 2019 and 2018, respectively. October 29, 2019 4

SCE 2021 General Rate Case Overview Filed August 30, 2019, SCE’s 2021 GRC request balances the need to advance California’s ambitious decarbonization policy goals and address emergent wildfire public safety risks, while continuing to provide safe, reliable, and affordable service to customers • 2021 GRC Application (A. 19-08-013) addresses major portion of CPUC-jurisdictional revenue requirement for 2021-2023 Includes operating costs and capital investment Excludes CPUC jurisdictional costs such as fuel and purchased power, cost of capital and other discrete SCE capital projects (such as Charge Ready 2 – SCE’s transportation electrification infrastructure program) Excludes FERC-jurisdictional transmission revenue requirement • Requests 2021 revenue requirement of $7.601 billion $1.155 billion increase over 2020 authorized revenue requirement, a 12.7% increase over total rates1 Requests increases of $400 million in 2022 and $531 million in 2023 • Multi-track schedule proposed to approve 2021-2023 revenue requirement and reasonableness of additional 2018-2020 recorded incremental amounts associated with the Fire Mitigation memorandum accounts (FMA)2 1. 12.7% includes the impact of lower anticipated 2021 kWh sales and recoveries of $87 million of non-wildfire memo accounts 2. Includes Wildfire Mitigation Plan Memo Account, Fire Hazard Prevention Memo Account, Grid Safety and Resiliency Program Memo Account and Fire Risk Mitigation Memo Account October 29, 2019 5

SCE Capital Expenditure Forecast ($ billions) $23.8 - $25.6 billion capital program Distribution for 2019-2023 Transmission • Generation This capital forecast includes: Wildire mitigation-related spend1 2018 GRC approved CPUC capital spend $5.3 $5.4 $5.3 for 2019-2020 $5.0 2021 GRC requested CPUC capital spend $4.6 $4.4 for 2021-2023 Non-GRC capital programs including Charge Ready Pilot, MD/HD Transportation Electrification and 2019- 2020 wildfire mitigation-related programs FERC forecasted capital spend • Long term growth drivers include: Infrastructure Replacement Wildfire Mitigation Transportation Electrification Transmission Infrastructure • Authorized/Actual may differ from forecast; 2018 2019 2020 2021 2022 2023 previously authorized amounts in the last (Actual) three GRC cycles were 89%, 92% and 92%2 of Range capital requested, respectively Case3 $4.6 $4.8 $4.8 $4.8 $4.8 1. In accordance with Assembly Bill 1054, ~$1.6 billion of wildfire mitigation-related spend shall not earn an equity return. See “SCE Wildfire Capital Forecast” slide for further information on wildfire-related capital spend 2. Approval percentage for the 2018 GRC excludes Grid Modernization and project approvals that were deferred to the next case for timing reasons 3. The low end of the range for 2021-2023 reflects a 10% reduction on the total capital forecast using management judgment based on historical experience of previously authorized amounts and potential for permitting delays and other operational considerations. The low end of the range for 2020 reflects a 10% reduction applied only to FERC capital spending and non-GRC programs October 29, 2019 6
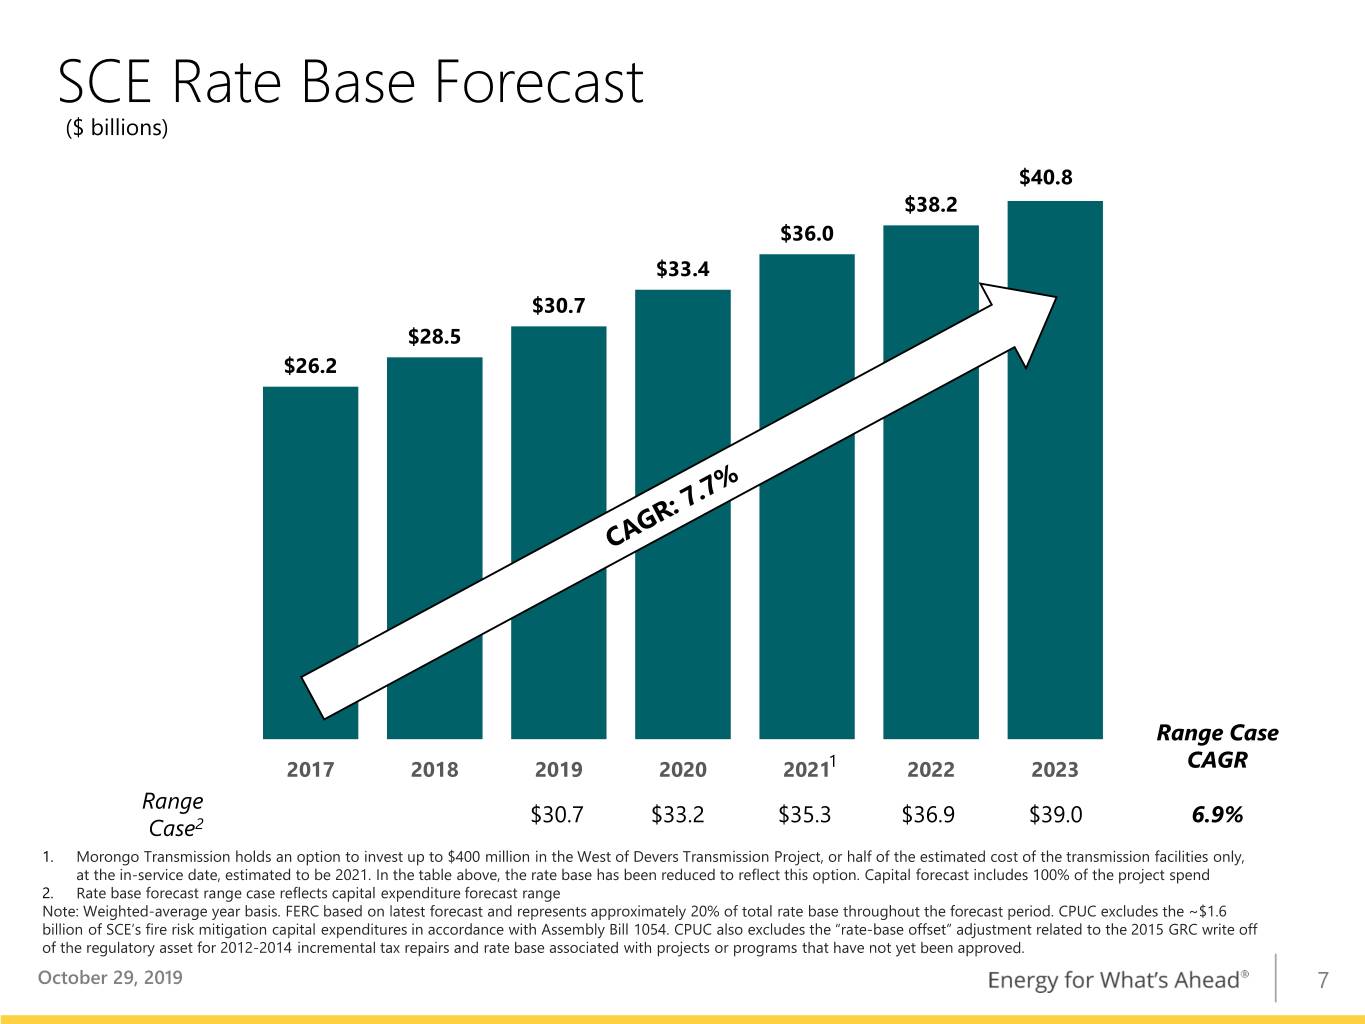
SCE Rate Base Forecast ($ billions) $40.8 $38.2 $36.0 $33.4 $30.7 $28.5 $26.2 Range Case 1 CAGR 2017 2018 2019 2020 2021 2022 2023 Range 6.9% Case2 $30.7 $33.2 $35.3 $36.9 $39.0 1. Morongo Transmission holds an option to invest up to $400 million in the West of Devers Transmission Project, or half of the estimated cost of the transmission facilities only, at the in-service date, estimated to be 2021. In the table above, the rate base has been reduced to reflect this option. Capital forecast includes 100% of the project spend 2. Rate base forecast range case reflects capital expenditure forecast range Note: Weighted-average year basis. FERC based on latest forecast and represents approximately 20% of total rate base throughout the forecast period. CPUC excludes the ~$1.6 billion of SCE’s fire risk mitigation capital expenditures in accordance with Assembly Bill 1054. CPUC also excludes the “rate-base offset” adjustment related to the 2015 GRC write off of the regulatory asset for 2012-2014 incremental tax repairs and rate base associated with projects or programs that have not yet been approved. October 29, 2019 7
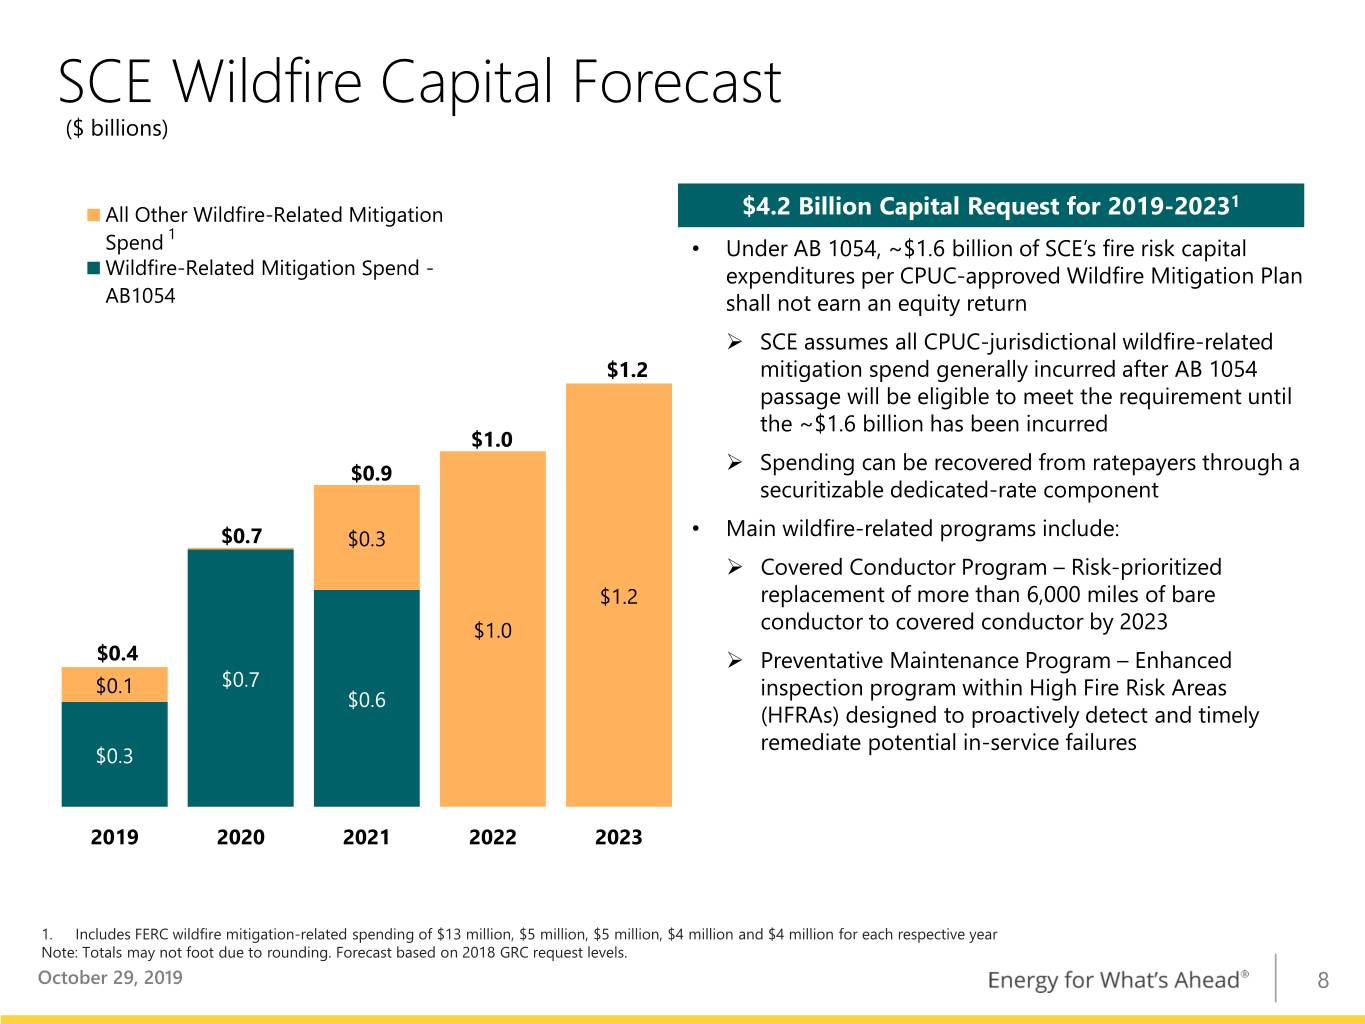
SCE Wildfire Capital Forecast ($ billions) 1 All Other Wildfire-Related Mitigation $4.2 Billion Capital Request for 2019-2023 1 Spend • Under AB 1054, ~$1.6 billion of SCE’s fire risk capital Wildfire-Related Mitigation Spend - expenditures per CPUC-approved Wildfire Mitigation Plan AB1054 shall not earn an equity return SCE assumes all CPUC-jurisdictional wildfire-related $1.2 mitigation spend generally incurred after AB 1054 passage will be eligible to meet the requirement until the ~$1.6 billion has been incurred $1.0 $0.9 Spending can be recovered from ratepayers through a securitizable dedicated-rate component • $0.7 $0.3 Main wildfire-related programs include: Covered Conductor Program – Risk-prioritized $1.2 replacement of more than 6,000 miles of bare $1.0 conductor to covered conductor by 2023 $0.4 Preventative Maintenance Program – Enhanced $0.1 $0.7 inspection program within High Fire Risk Areas $0.6 (HFRAs) designed to proactively detect and timely remediate potential in-service failures $0.3 2019 2020 2021 2022 2023 1. Includes FERC wildfire mitigation-related spending of $13 million, $5 million, $5 million, $4 million and $4 million for each respective year Note: Totals may not foot due to rounding. Forecast based on 2018 GRC request levels. October 29, 2019 8

2019 EIX Core Earnings Guidance 2019 Core Earnings Per Share Guidance – Key Assumptions Building from SCE Rate Base $0.29 ($0.33) Total Rate Base $30.7 billion $0.41 ($0.24) • FERC comprises ~20% of total $4.80 $4.68 • Test year • HoldCo CPUC 2018 GRC operating • Previously • Financing true-up: expenses: announced 10.3% and other: Return on Equity $0.20 (1) cent per financing $0.32 (ROE) • FERC ROE • FERC ROE share per plan (debt • Z-factor 2 settlement settlement month and equity): Capital Structure 48% equity advice letter update (prior year): • HoldCo debt ($0.18) approval: FERC (current $0.09 issued: $1 • Update to $0.04 year): billion in financing 3 +$0.06 • Energy 2019 ($400 plan based on ROE 11.2% with incentives efficiency: million of actual results: (previously 10.5% with incentives) $0.05 issuance ($0.06) remaining) • Remaining Capital Structure Recorded capital structure; 45% • EEG: target previously 2019 average estimated equity breakeven disclosed run rate by equity plan: Other Items year-end $0.5 billion 2019 Capital Market $4.9 billion of EIX/SCE debt and Activities equity issuances in addition to SCE’s normal course debt financing of rate base SCE 2019 EPS SCE 2018 True- EIX Parent Equity EIX 2019 Core from Rate Variances Ups & Other Program / EPS Midpoint Base Forecast WF Fund Guidance Financing EIX 2019 Core EPS guidance range of $4.70 - $4.90; midpoint $0.09 higher than prior Note: See Earnings Per Share Non-GAAP Reconciliations and Use of Non-GAAP Financial Measures in Appendix. All tax-affected information on this slide is based on our current combined statutory tax rate of approximately 28%. Totals may not foot due to rounding. 1. Reflects actual financing activity at SCE (August 1st debt offering) and EIX (July 30th equity offering) versus prior guidance based on assumption that financing would occur on September 10th 2. On February 28, 2019, SCE filed an application with the CPUC for a waiver of compliance with this equity ratio requirement, describing that while the wildfire-related charge accrued in the fourth quarter of 2018 caused its equity ratio to fall below 47% on a spot basis as of December 31, 2018, SCE remains in compliance with the 48% equity ratio over the applicable 37- month average basis. While the CPUC reviews the waiver application, SCE is considered in compliance with the capital structure rules 3. SCE’s April 11, 2019 TO2019A filing to revise its ROE is pending review with the FERC and not reflected in guidance assumptions 9

Appendix October 29, 2019 10

Earnings Per Share Non-GAAP Reconciliations Reconciliation of EIX Basic Earnings Per Share Guidance to EIX Core Earnings Per Share Guidance EPS Attributable to Edison International 2019 Low Midpoint High SCE $4.83 EIX Parent & Other (0.32) Basic EPS1 $4.41 $4.51 $4.61 Non-Core Items SCE2,3 (0.29) (0.29) (0.29) EIX Parent & Other — — — Total Non-Core1 (0.29) (0.29) (0.29) Core EPS SCE $5.12 EIX Parent & Other (0.32) Core EPS1 $4.70 $4.80 $4.90 1. EPS is calculated on the assumed weighted-average share count for 2019. Please see 2019 EIX Core Earnings Guidance slide for more information. 2. Includes impact of 2018 GRC final decision related to impairment of utility property, plant and equipment, changes in allocation of deferred tax re-measurement between customers and shareholders and SCE’s contributions to the Wildfire Insurance Fund 3. Includes $0.01 per share as a result of share count dilution October 29, 2019 11
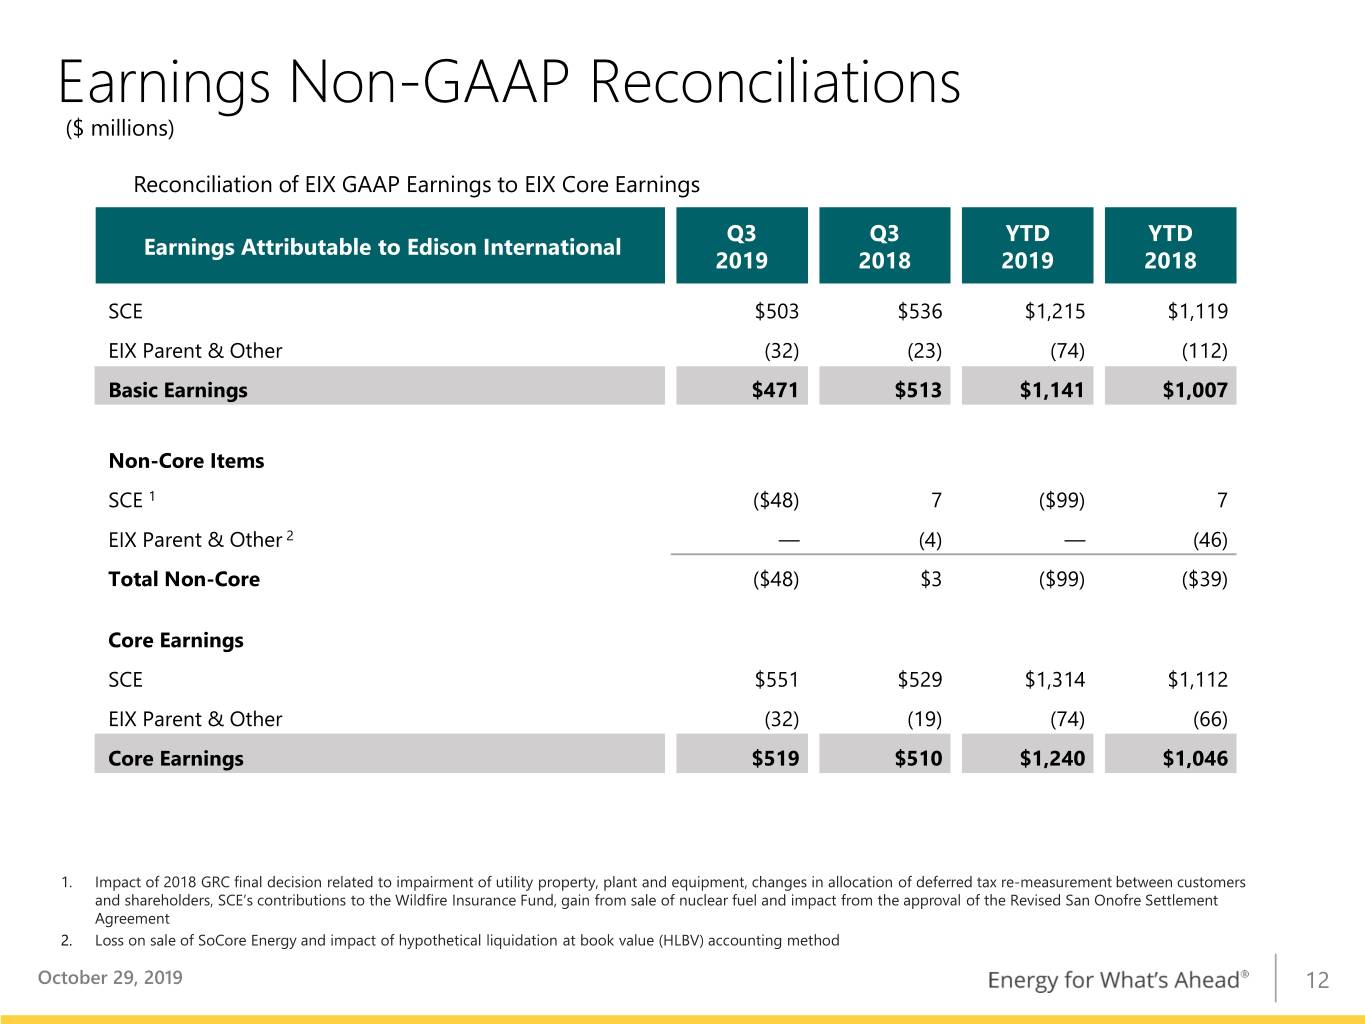
Earnings Non-GAAP Reconciliations ($ millions) Reconciliation of EIX GAAP Earnings to EIX Core Earnings Q3 Q3 YTD YTD Earnings Attributable to Edison International 2019 2018 2019 2018 SCE $503 $536 $1,215 $1,119 EIX Parent & Other (32) (23) (74) (112) Basic Earnings $471 $513 $1,141 $1,007 Non-Core Items SCE 1 ($48) 7 ($99) 7 EIX Parent & Other 2 — (4) — (46) Total Non-Core ($48) $3 ($99) ($39) Core Earnings SCE $551 $529 $1,314 $1,112 EIX Parent & Other (32) (19) (74) (66) Core Earnings $519 $510 $1,240 $1,046 1. Impact of 2018 GRC final decision related to impairment of utility property, plant and equipment, changes in allocation of deferred tax re-measurement between customers and shareholders, SCE’s contributions to the Wildfire Insurance Fund, gain from sale of nuclear fuel and impact from the approval of the Revised San Onofre Settlement Agreement 2. Loss on sale of SoCore Energy and impact of hypothetical liquidation at book value (HLBV) accounting method October 29, 2019 12
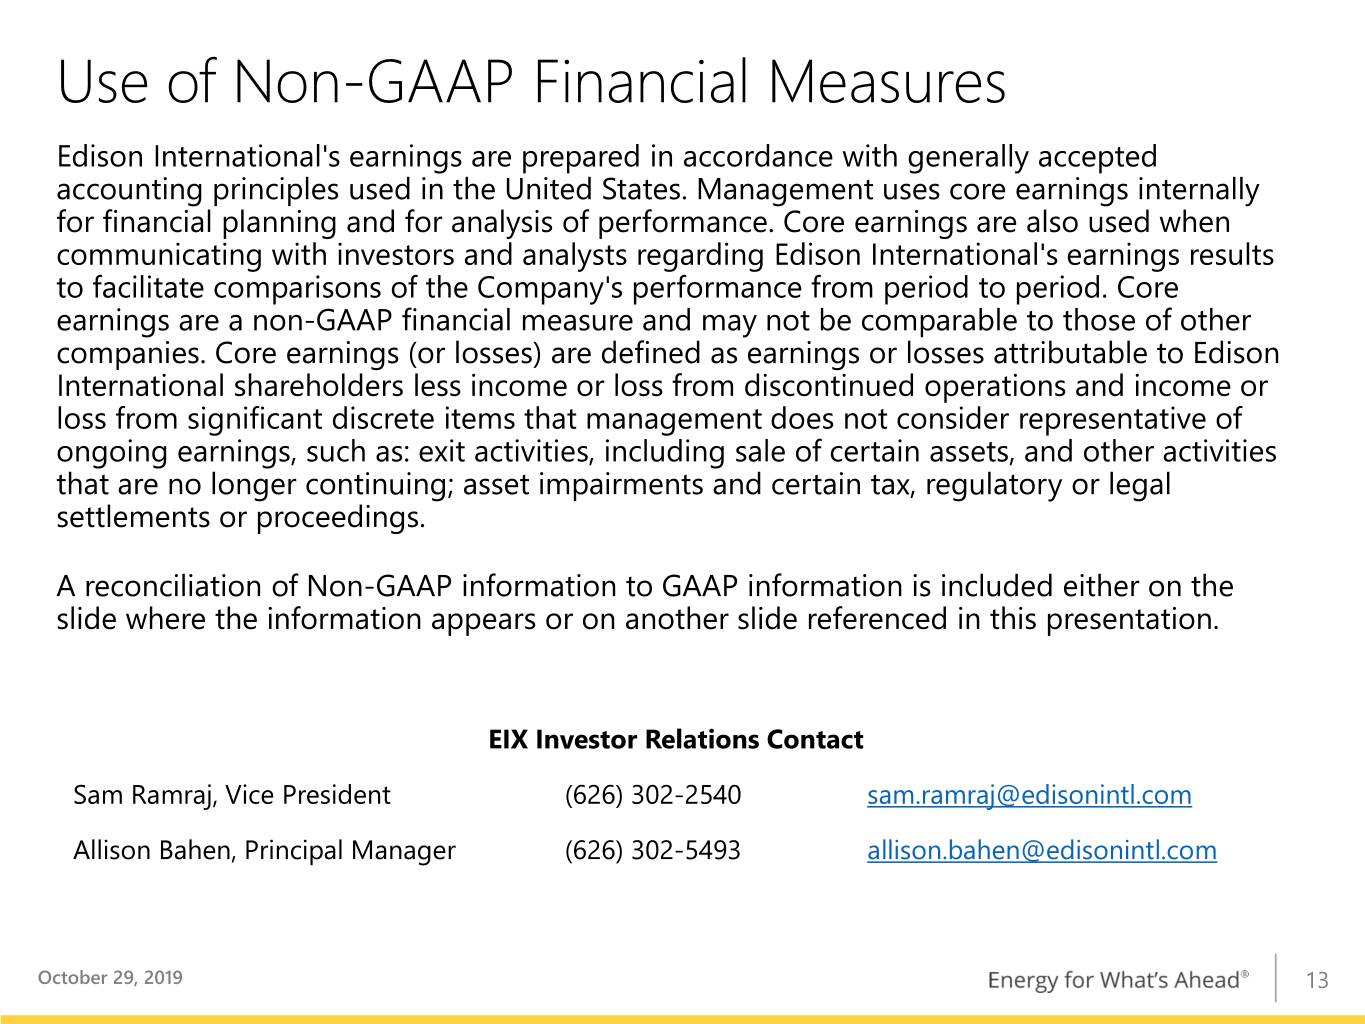
Use of Non-GAAP Financial Measures Edison International's earnings are prepared in accordance with generally accepted accounting principles used in the United States. Management uses core earnings internally for financial planning and for analysis of performance. Core earnings are also used when communicating with investors and analysts regarding Edison International's earnings results to facilitate comparisons of the Company's performance from period to period. Core earnings are a non-GAAP financial measure and may not be comparable to those of other companies. Core earnings (or losses) are defined as earnings or losses attributable to Edison International shareholders less income or loss from discontinued operations and income or loss from significant discrete items that management does not consider representative of ongoing earnings, such as: exit activities, including sale of certain assets, and other activities that are no longer continuing; asset impairments and certain tax, regulatory or legal settlements or proceedings. A reconciliation of Non-GAAP information to GAAP information is included either on the slide where the information appears or on another slide referenced in this presentation. EIX Investor Relations Contact Sam Ramraj, Vice President (626) 302-2540 sam.ramraj@edisonintl.com Allison Bahen, Principal Manager (626) 302-5493 allison.bahen@edisonintl.com October 29, 2019 13


